174NCJRS.pdf - Office of Justice Programs
125
, .. .. \ . . , i < If you have issues viewing or accessing this file contact us at NCJRS.gov.
-
Upload
khangminh22 -
Category
Documents
-
view
0 -
download
0
Transcript of 174NCJRS.pdf - Office of Justice Programs
, .. ~ ..
\ ;~~.' . .
, i <
If you have issues viewing or accessing this file contact us at NCJRS.gov.
. II : .. III
.. .. ... .. ... ;0. I .•
p ~ • • •• .... " t· I·
• I • ~~ .• . ..... - -; . "II
. II • I I t .... .. .:. : f , • I .
: I '.
• I •
. .~
TASK FORCE REPORT: SCIENCE AND TECHNOLOGY
.1\ Report to
THE PRESIDENT'S COMMISSION ON LAW ENFORCEMENT AND
ADMINISTRATION OF JUSTICE
Prepared by
THE INSTITUTE FOR DEFENSE ANALYSES
,
U.S. Government Printing Office, Washiu8ton : 1!l67. For sale by the Superintendent of DotUlnents, U.S. Government Printing Office, Washington, D.C. 20402. Pricc $1.25. Copies of the Commission's general repu:t, "The Challenge of Crime in a Free Society," can be purchased from the Superin-
tcndent of Documents for $2.25. Copies of other task force reports and other supporting materials can also be purchased.
II
FOREvVORD
In February of this year the President's Commission on Law Enforcement and Administration of Justice issued its General Report, The Challenge of Crime in a Free'Socict)J, As noted in the Foreword to that Report, the Commission's work was a joint undertaking, involving the collaboration of Federal, State, loeal, and private agencies and groups, hundreds of expert consultants and advisers, and the Commission's own stan'. Chapter 11 of that Rcport made findings and recommendations relating to the possible contributions 'tIf science and technology to the problems of criminal justice. ~ .
This volume, the Task Force Report on SCienee and Technology, embodies the research and analysis which underlie those findings and recommendations, and in many instances it elaborates on them. As noted in the Preface, the Institute for Defense Analyses (IDA) with funding from the Office of Law Enforcement Assistance of the Department of Justice, undertook the responsibility for organization of the Science and Technology Task Force for the Commission. Thus, this volume represenl~ the report of IDA to the Commission and reflects the work of IDA with advice and assistance from some members of the Commission and its staff.
The Commission is grateful to IDA for undertaking this important task and to those who worked on this volume including consultants, advisers and collaborating agencies whose efforts arc reflected in this volume.
III

Preface
This report of the Science and Technology Task Force of the President's Commission on Law Enforcement and Administration of Justic:e was prepared by the Institute for Defense Analyses (IDA). The material in it is intended to supplement and amplify the discussion of science and technology in the general report of the Commission to the President, "The Challenge of Crime in a Free Society," which contains the Commission's recommendations. The work was conducted under a grant from the Office of Law Enforcement Assistance of the Department of Justice to the Institute for Defense Analyses through the Department of Defense. The staff for the study were brought together from industry, universities, government, and IDA. The major portion of the work was conducted during the summer and fall of 1966.
Its preparation by an outside organization and the technical nature of its subject matter distinguish this report from the other works of the Commission. Some of the major thrusts and the general coverage of the Task Force's work were discussed by the Commission members, and the Commis~ion's staff advised and consulted with the Science and Technology Task Force staff during all of its work. But the substance of the report was the responsibility of IDA.
A special Science Advisory Committee was established by the Attorney General to help focus the Task Force's work on the important problems, to assist in many of the professional judgments, and to review the scientific validity of the work. The members of that Committee are:
IV
Hon. Charles D. Breitel, Associatc Judge, Court of Appeals of the State of New York and Member, President's Commisssion on Law Enforcement and Administration of Justice.
Dr. James Fletcher, President, University of Utah.
Dr. Eugene Fubini, Vice President, International Business Machi.nes, Inc.
Chief Thomas Reddin, Chief of Police, Los Angeles Police Department.
Dr. Robert Sproull, Vice President for Academie Affairs, Cornell University.
Professor James Q. Wilson, Department of Government, Harvard University.
Prof. Adam Yarmolinsky, Harvard Law School, Harvard University.
In addition, Dr. D:wid Robinson, of the Office of Science and Technology in the Executive Office of the President, participated regularly and served in effect as an eighth member.
At IDA, general supervlSlon of the Task Force was provided by Dr. Milton U. Clauser and Dr. Ali B. Cambel, the directors of IDA's Research and Engineering Support Division, and Mr. Alexander J. Tachmindji, Assistant Director.
The work of the Task Force was under the overall direction of Dr. Alfred Blumstein and was prepared as an integrated effort by the staff and a number of consultants. The regular members of the staff and the subjects they covered were:
Mr. Ronald Christensen, University of California, systems analysis and corrections operations.
Mr. Ronald Finkler, Institute for Defense Analyses, . f . • 111 ormatlOn systems.
Dr. Saul 1. Gass, International Business Machines, police operations.
Mrs. Sue Johnson, consultant, systems analysis.
Dr. Peter Kelly, Kelly Scientific Corp., communications and electronics.
Mr. Raymond Knickel, consultant, police electronics equipment.
Mr. Richard Larson, Massachusetts Institute of Technology, systems analysis.
Dr. Joseph Navarro, Institute for Defense Analyses, court operations.
Miss Jean Taylor, Institute for Defense Analyses, court operations.
i J
In addition to this basic staff a number of consultants undertook separate !itudies in close coordination with the staff :
Prof. Thomas Bartee, Harvard University, fingerprint recognition.
Prof. Mandell Bellmore, Johns Hopkins University, operations research.
Mr. Albert Bush-Brown, Rhode Island School of Design, city planning.
Mr. Joseph Coates, Institute for Defense Analyses, nonlethal weapons.
Mr. P. A. Don Vito, consultant, cost analysis.
Mr. Leonard Goodman, Bureau of Social Science Research, attitude survey.
Jvfr. Norbert Halloran, International Business Machines, court information systems.
Dr. William Herrn1ann, consultant, police operations.
Mr. Herbert Isaacs,consultant, survey of police field operations.
I\fr. Robert Jones, C-E-I-R, infonnation systems.
Dr. Vincent Keenan, consultant, laboratory instrumentation.
Prof. Peter Lejins, University of Maryland, cdminology.
Dr. William Offutt, International Business Machines, C0urt operations.
Mr. Lloyd Perper, consultant, alarms.
Prof. Thomas Schelling, Harvard University, economic analysis.
Mr. Peter Szanton, Bureau of the Budget, program budgeting.
Dr. Claude Walston, International Business Machines, information svstems.
Prof. Leslie Wilkins, University of California, criminology.
v
The work of the staff and of these consultants is reflect~d in the main body of this report. Ten of the speCific papers generated are presented as appendices A
, through J. Additional papers on apprehension by police nonlet.hal weapons, .the ove~aIl crimina!l justice system: delay 111 courts and 1I1formahon flow are more extensive and technical to be presented here. These reports arc now in preparation and w1\l be avail:able from the Clearinghouse for Federal Scientific and Technical Information of the National Bureau of Standards. Papers on computer operations in the courts, on economic analysis of organized crime, on the design of national criminal iustice statistical syst~ms, and on. t.he projection of popurati~ns under correctlOnal superviSion appear as appendices in the Task Force reports on Courts, Organized Crime As-sessment of Crime, and Corrections, respectively. '
Since the Task Force staff of scientists and engineers had little prior knowledge of criminal justice operations and problems, it relied heavily on the Crime Commission staff and numerous criminal justice officials for identification of the operational problems of the system.
The Federal Bureau of Investigation was extremely h~lpfu~ in this ~egard, especially in provid:ng data on cnme 111 the Umted States. Among State agencies, the California Bureau vf Criminal Statistics and the New York State Identification and Intelligence System also made valuable contributions.
The police departm~nts of Ba.ltimore, Boston, Chicago, New york, Los Angeles, San 'Francisco, St. Louis, and W"ashmgton, D.C., among others, were generous in their counsel and provided staff members with some operational exper!ence in patrol, communications, and other police functlOns. The International Association of Chiefs of Police was a valuable source of data and advice.
Experience and data on court operations were provided by the Court of Common Pleas of Allegheny County, Pa., the courts in the District of Columbia, and the Administrative Office of the U.S. Courts. Similar contributions in corrections came from the Federal Bureau of Prisons, the California Youth and Adult Authorities, the Draper Correctional Center, Lorton Reformatory, and the National Training School for Boys.
Scientists and engineers from industry, government, and universities contributed many suggestions and provided many of the needed technical details. In the Federal Government, the Federal Bureau of Investigation, the Federal Communications Commission, the Institute of Telecommunication Sciences and Aeronomy, and the Agency for International Development were among the agencies providing valuable advice and information. A number of companies in the electronics, data processing, telephone, and automobile industries were especially helpful.

r==-
VI
A number of individual consultants provided data or guidance, reviewed preliminary papers, and gem'!rally assisted in the work of the Task Force. Among others tOOt numerous to mention, this group included:
Miss Sylvia Bacon,. Assi.stant D!re~tor, Presiden.t'll Commission on CrIme In the DlstrIct of Columbla.
Mr. James E. Barr, Chief, Safety and .Spe.cial Radio Services Bureau, Federal CommUnlCatlOns Commission.
Mr. Ronald Beckman, Research and Design Institute.
Mr. Richard Braun, Criminal Division, Department of Justice.
Mr. Robert Brooking, Communications Engineer, City of Burbank, Calif.
Mr. Jerome Daunt, Chief, Uniform Cr!me Reporting Section, FBI, Department of J ustlce.
Dr. Robert Emrich, Offiee of Law Enforcement Assistance, Department of Justice.
Hon. Richard F. C. Hayd.en, Judge of the Superior Court of Los Angeles.
Dr. Jerry Kidd, National Science Foundation.
Mr. Richard McGee, Administrator, Youth and Adult Corrections Agency, Sacramento, Calif.
Mr. Robert Muzzy, Research Associate, Ohio State University.
Dr. Jesse Orlansky, Institute for'Defense Analyses.
Mr. S. Rothman, TRW Systems.
Mr. Arnold Sagalyn, Director, Office of Law Enforcement Coordination, Department of Treasury.
Mr. Daniel Skoler, Office of Law Enforcement Assistan1ce, Department of Justice.
Dr. Michael Watter, Institute for Defense Analyses.
Mr. Herbert Weiss, Litton Systems, Inc.
Prof. Marvin Wolfgang, Director, Center of Crim.inological Research, University of Pennsylvania.
Computer programming assistance was provided by Thomas Celi, Robert Cohen, Janice Heineken, Thomas Humphrey, Charll:s McBride, Franz Nauta, and Vera Wilson. Additional research assistance was provided by Mary Ellen Angell, Mara Auerbach, Lois Martin, Marsha Smith, and Ray Vickery.
Secretarial and general administrative operations were coordinated by Carolyn Tillman. She was assisted by many members of the IDA secretarial staff.
Editorial assistance was provided by Edgar Boling, Richard Brennan, Thomas Farrell, Joyce Harmon, Henry Parrish, and Marvin Walter. IIlustrat:ions were prepared under the direction of Richard A. Cheney and Walter J. Hamilton by Edward S. Gault and Vernon Townsend.
THE COMMISSION Nicholas deB. Katzenbach, Chairman
Genevieve Blatt Charles D. Breitel* Kingman Brewster Garrett H. Byrne Thomas J. Cahill Otis Chandler Leon Jaworski Thomas C. Lynch Ross L. Malone
*Science Advisory Committee panel memb('r.
James B. Parsons Lewis F. Powell, Jr. William P. Rogers Robert G. Storey Julia D. Stuart Robert F. vVagner Herbert Wechsler vVhitney M. Young, Jr. Luther W. Youngdahl
THE STAFF OF THE COMMISSION** Executive Director:
J ames V oren berg Deputy Director:
Henry S. Ruth. Jr.
Associate Directors:
Gene S. Muehleisen Elmer K. Nelson, Jr. Lloyd E. Ohlin Arthur Rosett
Assistant Directors:
David B. Burnham Bruce J. Terris Samuel G. Chapman (Police) Howard Ohm art (Corrections) Vincent O'Leary (Corrections) Charles H. Rogovin (Organized Crime) Floyd F. Feeney
Director of Science and Technology
Alfred Blumstein
William Caldwell Weston R. Campbell, Jr. Gerald M. Caplan Roland Chilton Joseph G. J. Connolly Virginia N. Crawford Elizabeth Bartholet DuBois Paul B. Duruz Robert L. Emrich Victor Gioscia Sheldon Krantz Anthony Lapham John L. McCausland Sheila Ann Mulvihill Albert W. Overby, Jr. Nick Pappas John F. Quinn Robert Rice Gordon D. Rowe Susan Freeman Schapiro Gerald Stern Keith Stubblefield Thelma C. Stevens Martin Timin G. Joseph Vining Richardson White, Jr.
* *StafT l11embc~, advisers, and consultants of the Science and Technology Task Force arc listed ill the Preface.
Vlt
SUPPORTING STAFF AND SERVICES OF THE COMMISSION
J ames A. Adkins Doris J. Dacon Mal'garet Beale Maty G. Bergbom Margaret R. Bickford Nancy B. Bradley Rita Louise Brooke Conchita A. Brown
Secretarial and Clerical
Scennie M. Brown Suzanne L. Carpenter Barbara A. Casassa Sally M. Chopko Willie Copeland Catherine Cyrus Mary Frances Factory Doris T. Farmer
Ann Felegy Mary Fox Carol A. Hambleton Rosalind M. Humphries Nancy Hunt Betty C. lrby Barbara J. Jones Patricia A. Lanham
Copy Editing
Katherine M. Hanna Lillian B. Kharasch
Joan E. Peterson Evelene Richards Lee E. Salerno Shelia M. Sheahan Nancy Strebe Margaret Triplett
SUPPORTING STAFF AND SERVICES AT THE INSTITUTE FOR DEFENSE ANALYSES
Gail F. Arnold Louise M. Beljan Frances T. Coffey Ruth L. Dawson Judith G. DeVries Carole A. Dowling Robert Frederick Susan Gently
\'llt
Dl'eama Haga Katherine E. Hartman Marie K. Henson Rita J. Kindel' Margaret M. McCormick Nancy Marshall Lowell I. Miller Cecelia A. Rankin
Norman L. Ross Mary K. Schumacher Sandra Shaw Phoebe R. Silver Carolyn Smith Marguerite Stavriotis JoAnn Stollard Rose S. Strong
Judith S" '. Charlotte Tapp Mamie L. Taylor Lorraine F. Villella J olm Watters Barbara A. West Catherine R. Wright
.J
CONTENTS
CHAPTER 1. SCIENCE AND TECHNOLOGY AND THE CRIMINAL JUSTICE SYSTEM . . . . . . . . . . . . . . . . . . . . . . . . . . .
Role of Science and Technology in Criminal Justice
Equipment ..... Information and Research Systems Analysis . . .
The Science and Technology Task Force Work of the Task Force . . Organization of Rej)ort. . . Results of Task Force Work.
CHAPTER 2. POLICE OPERATIONS-THE APPREHENSION PROCESS. . . . . . . . . . . . ............ .
Analysb of Field Data on Apprehension Clearance of Crime Cases . . . . . Response 'rime. . . . . . . . . Criteria for Emergency DisjJatching Further Studies. . . . . . . .
" Systems Analysis of Response Time in a Hypothetical City
Improving Apprehension Capabilities Detection of Crimes Police Vehicles . . Nonlethal Weapons Identification. . .
Allocating Patrol Forces by Effectiveness in Deterring Crime
Page
1
1 1 2 3
3 3 5 5
7
7 8 9
9
10
12 12 14 14· 16
18
IX
, ':
x
CHAPTER 3. POLICE OPERATIONS·-COMMUNICATIONS, COMMAND, AND CONTROL . . .. ......... .
Command and Control ...... . Pr~lsent Police Command and Control Operations . Potential Contributions ~f Science and Technology . Proposed Program. . . . .'. . . . . . . .
Communications to the Police . . . . . . . . . . . . . . . . . . . . . . . . .
Police Radio Communications Systems The Design of Police Radio Networks. The Radio SPectrum Congestion Problem The Relationship Between the Local Community and the FCC
Communications Equipment for the Patrolman IneJf:pensive Portable Two- 'Way RadioJ . Digital Communicatiolls. . . Potential for Standardization. . . . .
CHAPTER 4. ASPECTS OF CO'CRT MANAGEMENT, CORRECTIONS, AND CRIME PREVENTION. . . . . . . . . . . . . . . . . . . . .
Court Operations-Reducing Delay. . . . . . . . . . . The District of Columbia Court System for Processing Felonies . Time Delay in Processing Felonies . . . . . . Computer Simulation. of Processing of Felony Cases Other Possible Applications . . . . . . . . .
Corrections-Programed Learning and Statistical Aids to Decisions Proaramed Instmction to Aid Rehabilitation c
Statistical Techniques to Aid Decisions. . . . . . . . . . .
Reducing Opportunity for Crime-Auto Theft and Street Lighting Illcreasin/! the Difficulty oj Auto Theft Street L£ghting . . . . .
]Jagc
21
21
21
22
28
29
29 30
32 32
33
34
35 36
37
37
37
38 40 44
44
46 47
48 48 49
CHAPTER 5. ANALYSIS OF CRIME AND THE OVERALL CRIMINAL JUSTICE SYSTEM . . . . . . . . . : . . . . . . . . . . . . . . . . .
Need for Analysis of the Overall Criminal Justice System
Measuring the Effectiveness of the Criminal Justice System . Means of Crime Control by the Criminal Justice System Measuring Crime . . . . . . . . .
\ A Model of the Criminal Justice System
Form of a Model . Uses of the Model
........
••
Further Model Developments and Data Needs .............
CHAPTER 6. CRIMINAL JUSTICE INFORMATION SYSTEMS
The Need for Better Information Capabilities. . . . . . . . . . . . . .
General Configuration of an Integrated Criminal Justice Infol'mation System
Immediate Response Inquiry Systems National Inquiry System State Inquiry Systems Local Inquiry Systems .
Handling Personal Infcrmation. . . . . The Problems of Privacy . . . . . . . Organization of Personal Illformatton Files Fingerprint Entry to Personal Information.
Management Information . . . . . . .
Order of Implementing Information Handling Functions. Communications Base Order of Implementation . The Value of Information.
,
XI
Page
53
53
54 55 55
56 56 60
65
68
68
70
71 72 74 74
74 74 76 77
77
78 78 78 79
XII
CHAPTER 7. SOIENTIFIC RESEARCH AND DEVELOPMENT PROGRAM ................ .
Researcp, Development, Test, and Evaluation Program
Technical Support and Establishment of Equipment Standards
Op<'rations Research Groups within Criminal J ustire Agencies
Science and Technology Program in a Research Institute .
APPENDIX A. IJROGRAM FH:DGETING FOR CRI:MINAL .reSTIer: ~'Jt...rI'El\"'1;! ,,_J 1. "" ..11 !J.k.T ~ .. .. • .. .. .. • • .. .. .. .. .. .. .. .. .. .. ~ .. .. .. Q .. .. .. .. .. .. .. .. .. • ..
APPENDIX B. ;\ STUDY OF C011l\llJNICATIO:NS, CRLMES, AND
Page
80
81
81
82
82
ARRESTS IN :\ :METROPOLITAN POLICE DEP,:\RTNIENT . as
,\PPENDIX C. FINGERPRINT CL\SSIFIC;\TION ......... '," U)'7
APPENDIX D. POLICE :rv10BILE RADIO SYSTElVIS . . . . . . . . . . . . . . . . . . . .
COivlMUNICATIONS
,APPENDIX E. ELECTRONICS EQUIP11ENT ASSOCIATED WITH;
113
THE POLICE CAR . : . . . . . . . . . . . . . . . . . . . . . . . . . .. 137
APPENDIX F. SURVEY OF EXISTING CRIMINAL JUbTICE DATA PROCESSING FACILITIES. . . . . . . . . . . . . . . . . . . . .. 157
APPENDIX G. INFORMATION SYSTEM FLOW DIAGRAMS . . . .. 167
APPENDIX H. ANALYSIS OF THE COSTS OF A CENTRALIZED VERSUS DECENTRALIZED NATIONAL INOUIRY SYSTEM. 186 ........
'"' -(, 1
J
APPENDIX 1. DATA ANALYSES AND SIMULATION OF THE COURT SYSTEM IN THE DISTRICT OF COLUMBIA FOR THE PROCESSING OF FELONY DEFENDANTS . : . . . . . . . . . . . . . . . . . .
APPENDIX J. PROJECTED PERCENTAGE OF C.S. POPULATION
XIII
Page
199
\VITH CRIMINAL ARREST AND CONVICTION RECORDS. .. 216
------ -------,~---------, ----,
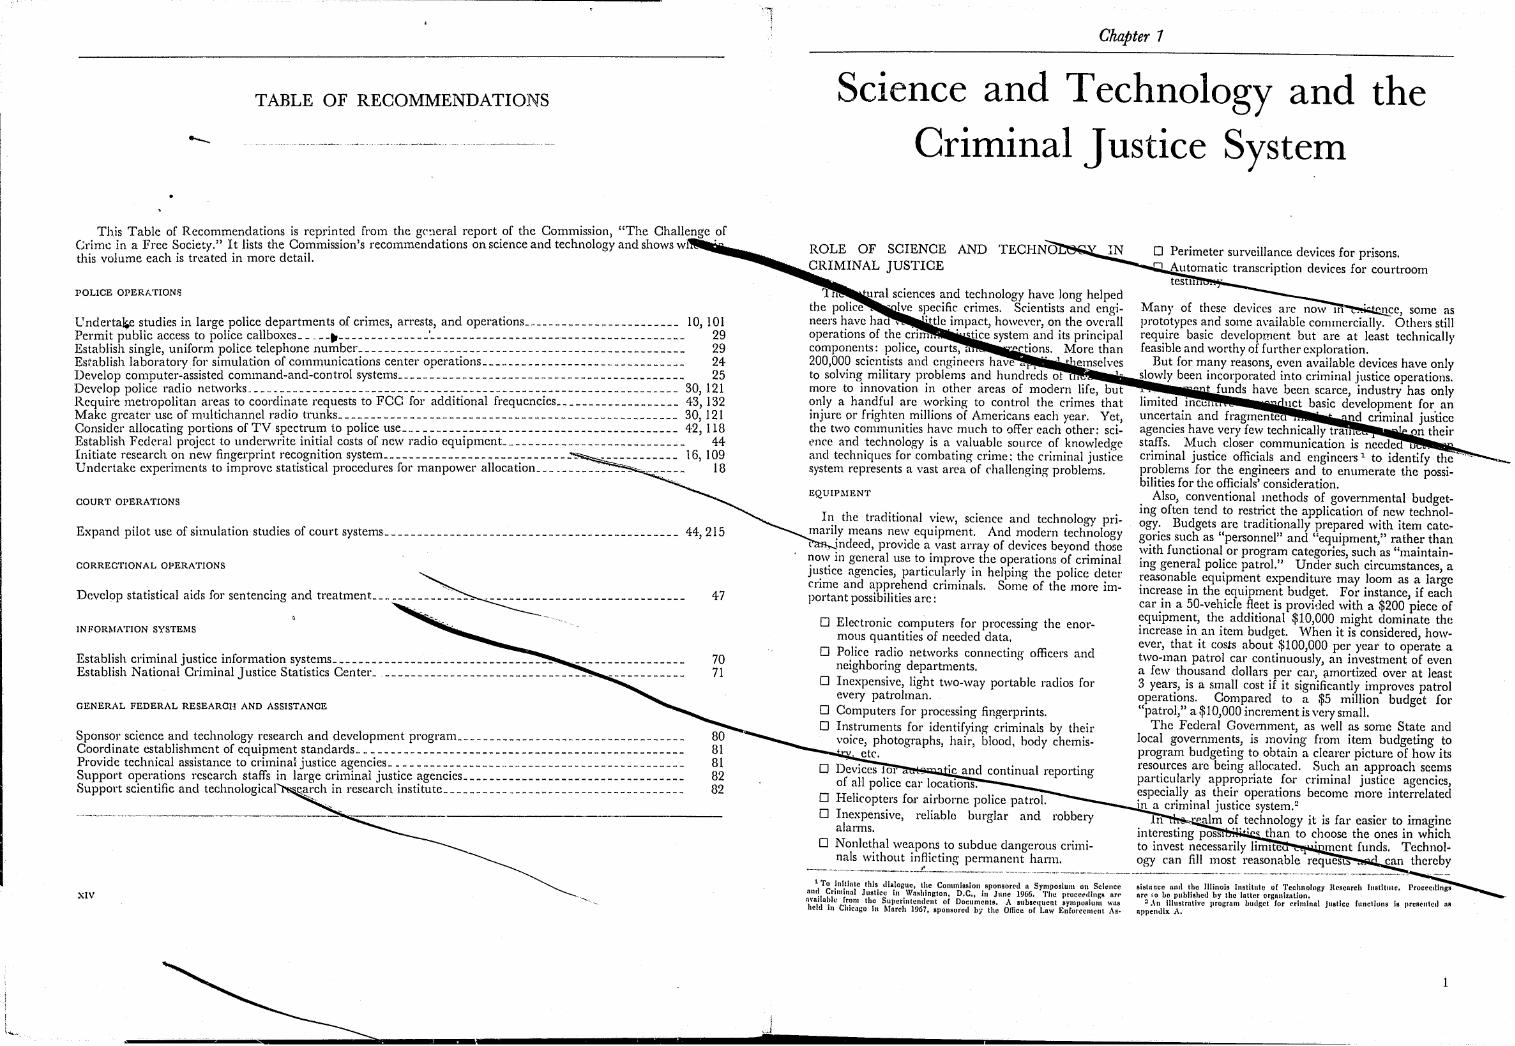
TABLE OF RECOMMENDATIONS
This Table of Recommendations is reprinted from the g(,!1eral report of the Commission, "The Challenge of Crime in a Free Society." It lists the Commission's recommendations on science and technology and shows WIl't'!III~·.· ....... -.. this volume each is tr,eated in more detail.
POLICE OPERA. TION!'l
Underta~e studies in large police departments of crimes, arrests, and operations_ .. ______________________ 10,101 Permit public access to police callboxes ____ _ • ______________ '_ _ _ _ _ _ _ _ _ _ _ _ _ _ _ _ _ _ _ __ _ _ _ _ _ _ _ _ _ _ _ _ _ _ _ _ _ _ 29 Establish single, uniform police telephone number. _ _ _ _ _ _ _ _ _ _ _ _ _ _ _ _ _ _ _ _ _ _ _ _ _ _ _ _ _ _ _ _ _ _ _ _ _ _ _ _ _ _ _ _ _ _ _ _ _ 29 ESI:ablish laboratory for simulation of communications center operations_ _ _ _ _ _ _ _ _ _ _ _ _ _ _ _ _ _ _ _ _ _ _ _ _ _ _ _ _ _ _ 24 Develop computer-assisted command-and-control systems ____ - ____ - ________ - - - - - - - - - - _ _ _ _ _ _ _ _ _ _ _ _ _ _ _ _ 25 Develop police radio networks_ _ _ _ _ _ _ _ _ _ _ _ _ _ _ _ _ _ _ _ _ _ _ _ _ _ _ _ _ _ _ _ _ _ _ _ _ _ _ _ _ _ _ _ _ _ _ _ _ _ _ _ _ _ _ _ _ _ _ _ _ _ _ _ _ _ 30, 121 Require metropolitan areas to coordina te requests to FCC for additional frequencies_ _ _ _ _ _ _ _ _ _ _ _ _ _ _ _ _ _ _ 43, 132 Make greater use of m1lltichannel radio trunks_ _ _ _ _ _ _ _ _ _ _ _ _ _ _ _ _ _ _ _ _ _ _ _ _ _ _ _ _ _ _ _ _ _ _ _ _ _ _ _ _ _ _ _ _ _ _ _ _ _ _ _ 30, 121 Consider allocating portions of TV spectrum 1.0 police usc _____ • ____________________________________ 42,118 Establish Fed~ral project to undenvrite initial costs of new radio equipment. _ _ _ _ _ _ _ _ _ _ _ _ _ _ _ _ _ _ _ _ __ _ _ _ _ _ 44 Initiate research on new fingerprint recognition system______________________________ _ ___________ 16,109 Undertake experiments to improve statistical procedures for manpower allocation ___ . _ _ _ _ _ _ _ _ _ _ _ 18
COUR'!' OPERATIONS
Expand pilot use of simulation studies of court systems _____________________________________________ 44,215
CORRECTIONAL OPERATIONS
Develop ,ta ti,tieal aid, foc sentencing and treatment. _ .. ___ ~ ~_ _ _ _ _ _ _ _ _ _ _ _ _ _ _ _ _ _ _ _ _ _ 47
a '~. --'. INFORMATION SYSTEMS
Establish criminal justice information systems. ________________________________ _ Establish National Criminal Justice Statistics Center.
GENERAL FEDERAL RESEARCH AND ASSISTANCE
Sponsor science and technology research and development program _________________ • ________________ _ Coordinate establishment of equipment standards_ .. _______________________________________________ _ Provide technical assistance to criminai justice agencies ____________________________________________ _ Support operations research staffs in large criminal justice agencies _________________________________ _ Support scientific and technological . ~arch in research institute ____________________________________ _
,.. .. "'.
XIV
70 71
J
Chapter 1
Science and Technology and the Criminal Justice System
ROLE OF SCIENCE CRIMINAL JUSTICE
1 til:; tural sciences and technology have long helped the police. "olve specific crimes. Scientists and engineers have hac!, . . .tIe impact, however, on the overall operations of the CriITh. '~tice system and its principal components: police, courts, a '. ~ ctions. More than 200,000 scientists and enginc('rs have "I', " lemsclves to solving military problems and hundreds ot u v
more to innovation in other areas of modern life, but only a handful are working to control the crimes that injure or frighten millions of Americans each year. Yet, the two communities havc much to offer each other: science and technology is a valuable source of knowledge ancl techniques for combating crime: the criminal justice system represents a vast area of challenging problems.
E(~UIPlIIENT
In the traditional view, science and technology primarily means new equipment. And modern technology (, !ndeed, provide a vast array of devices beyond those now m general use to improve the operations of criminal ju~tice agencies, particularly in helping the police deter cnme and apprehend criminals. Some of the more important possibilities arc:
o Electronic computers for processing the enormous quantities of needed data.
o Police radio networks connecting officers and neighboring departments.
o Inexpensive, light two-way portable radios for every patrolman.
o Computers for processing fingerprints. o Instruments fm identifying criminals by their
voice, photographs, hair, blood, body chern is--_-1:.". etc. Devices lor" _ ic and continual reporting of all police car locations.
o Helicopters for airborne police patro\. o Inexpensive, reliable burglar and
alarms. o Nonlethal weapons to subdue dangerous crimi
nals without inflicting pennanent han11. ""----------·----,...--~~ ___ ... ~_L. _____ _
1 To initiate this tlialogUC t the Commission sponsored J.l SYl1lr.osiulIl (ill Selcllce nnl! Criminal Justice in Washington. D.C .• in June 1966. The procct'dings nft' n ... ·nllable Crom the Superintendent oC Documents. A 8ubs('(ltlCnt syrnlwsiurn ""liS
held in Chicago in March 1967, sponsored b; the Office. or Law Enrorcement As~
Perimeter surveillance devices for prisons. Automatic transcription devices for courtroom testlIl.~ •. ~ __
Many of these devices are now Ill' "..nee, some as prototypes and some available commercially. Others still require basic development but are at least technically feasible and worthy of further exploration.
But for many reasons, even available devices have only slowly been incorporated into criminal justice operations.
funds have been scarce, industry has only limited incclH • \let basic development for an uncertain and fragmenteu • nd criminal jus'tice agencies have very few technically trawl; on their staffs. Much closer communication is needed IJI;
criminal justice officials and engineers 1 to identify the --... problems for the engineers and to enumerate the possibilities for the officials' consideration.
Also, conventional methods of governmental budgeting often tend to restrict the application of new technology. Budgets are traditionally prepared with item categories such as "personnel" and "equipment," rather than with functional or program categories, such as "maintaining general police patrol." Under such circumstances a rea~onable equipment expenditure may loom as a la~e increase in the equipment budget. For instance, if each car in a 50-vehicle fleet is provided with a $200 piece of equipment, the additional $10,000 might dominate the increase in.an item budget. When it is considered, however, that It costs about $100,000 per year to operate a two-man patrol car continuously, an investment of even a few thousand dollars per car, amortized over at least 3 years, is a small cost if it significantly improves patrol operations. Compared to a $5 million budget for "patrol," a $10,000 increment is very small.
The Federal Government, as well as some State and local governments, is moving from item budgeting to program budgeting to obtain a clearer picture of how its resources arc being allocated. Such an approach seems particularly appropriate fo.r criminal justice agencies, especially as their operations become more interrelated in a criminal justice system. 2
In _ ,p.alm of technology it is far easier to imagine interesting possi . ',' ~ than to choose the ones in which to invest necessarily limite " '. ment funds. Technology can fill most reasonable 1 can thereby
sistnnce nnd tho Illinois Institute of Technology Hcscarch Institute. Proceedings nrC' '0 lJo published by the latter t,rgllnizntion.
:l .. \n illustrative program budget for criminal JU8tlee functions is prescuted ItS appelldix A.
1
-

2
provide considerable help to law enforcement. But society must decide what devices it wants relative to the price it is willing to pay in dollars, invasion of privacy, and other intangible social costs. It is technically feasible, for example, t~ cut auto theft drastically by putting a radio transmitter in every car in America and tracking them all continuously. But this might cost a billion doll,us and could create an intolerable climate of surveillance. Science can provide the capability, but the public as a whole must participate in the value discussion of whethc..,· or not the capability is worth the costs.
This is often a difficult decision to make, since for most inventions, no one can now say what they will do about crime-very little heing known of what an),thing will do about crime. Inventions can cut costs or they can increase man's ability to sense and to act. They provide more options. They make possihle actions heretofore impractical. But their value in reducing crime is not known and will remain so until careful field evaluations are conducl'!d. There should be a coordinated national program' 0 identify the equipment requirements, to undertake thl' most promising developments, and then to conduct fie:d trials that measure intended as well as side effects 1)£ new equipment and procedures. The results of these research, development, test, and evaluation efforts must then be disseminated widely so that the entire system can share in the benefits.
INFORMATION AND RESEARCH
One essential for such a research program, as well as for immediate operational improvements, is better infonnation about crime and the criminal justice system. Criminologists, criminal justice officials, and others familiar with the problems of crime control have long emphasized that the lack of adequate, complete, and timely infonnation lies at the root of many of their problems. Information is needed about:
1 The extent and nature of crime and its causes, :0 help in fonnulating effective crime control programs.
o Current crimes, to aid in immediate apprehension of offenders.
o Past crimes, to help solve them. o Individual offendl~rs, to help prescribe treat
ment for them. o Criminal justice operations, to help officials
better allocate their mom'y and manpower. o Effects on crime of actions taken by the crimI
nal justice system, to help promote the evolution of a more humane and effective system.
Each year, judges in this country pass approximately 2 million sentences; unfortunately, no one knows the likely effect of the sentences on future criminal behavior. The Nation's policemen spend half of their time on "preventive" patrol, yet no police chief knows how much crime is thereby prevented. Corrections officials, responsible
a DRBed on datA (rom "Dasic Research, Applied Research, Dud De\'clopmcnt in American Intlu8try-1965"; Nntiollnl Science Foundation; November 1966.
for over 2 million offenders each year, are considering many new treatment programs; to choose among these, they must be able to estimate the amount by which each program can reduce recidivism.
Infonnation about the consequences of actions by the criminal ju~tice system is essential for improving those actions. In this sense the criminal justice system may be compared to a blind man far down the side of a mountain. If he wants to reach the top, he first must move. And it matters little whether his first move is up or down bec.'use any movement with subsequent evaluation will tell him which way is up. A step by step process of experimenting, evaluating, and modifying must be undertaken. Both innovation and the subsequent evaluation of its consequences are essential to climbing up. This process is inherently slow and expensive, and it must be C'Onducted with care to avoid misleading results.
Scientists can help by participating in the efficient design of experiments and the evaluation of their results. The fact-finding, analytical, and experimental methods of science can help develop the required information. Once the infonnation is developed, then the modern technology of data collection, retrieval, analysis, and transmission can help process and deliver it where and when it is needed.
Such carefully controlled testing offers some valuable opportunities for making the criminal justice system more efficient and effective. Correctional agencies have experimented with assigning at random a test group of offenders to each of several different treatment programs and evaluating their relative effectiveness in tenns of recidivism and social adjustment. The same experimental techniques are being used in the evaluation of drugs and other treatment by t~e medical sciences. Similarly, police departments can 'control the distribution of marked and unmarked cars patrolling various precincts to evaluate the effects upon crime rates in these and adjoining precincts. The design of such experiments must be carefully undertaken to avoid spurious experimental effects and to avoid taking otherwise undesirable or unethical actions merely for the sake of the experiment.
Crime control, being largely a ~ocial problem, may appear to be outside the realm of the scientists' skills. Indeed, many aspects of the problem do fall outside their scope. The experience of science in the military, however, suggests that a fruitful collaboration can be established between criminal justice officials on one hand and engineers, physicists, economists, and social and behavioral scientists on the other. In military research organizations these different professions, working with military o:fficers in interdisciplinary teams, have attacked defense problems in new ways and have provided insights that were new even to those with long military experience. Similar developments appeal' possible in criminal justice.
Research, emphasizing the social and behavioral sciences but including all the sciences, must be undertaken on an expanded and continuing basis. Manufacturing industry devotes at least 3 percent of its budget to research, development, test, and evaluation.3 The Defense Department spends about $7 billion a year on research
..
I \
, .,1
and development, about 13 percent of its regularJJudget. 4
In contrast, as recently as 1965, the Justice Department was the only Cabinet department with no share of the roughly $15 billion Federal research and development budget.5 The research and development budget in other criminal justice organizations is negligible. Even if only 1 percent of the criminal justice budget were earmarked for research and development, this would provide about $50 million, and several times that amount needs to be invested each year.
SYSTEMS ANALYSIS
Because of the enormous range of research and development possibilities, it is essential to begin not with the technology but with the problem. Technological efforts can then be concentrated in the areas most likely to be productive. Systems analysis is a valuable method for matching the technology to the need. It uses mathematical models of real-life systems to compare various ways of designing and using these systems to achieve specified objectives at minimum cost. This approach is particularly relevant in today's prolific technology, where the problem is less one of producing new devices than of choosing among the many potential opportunities.
These same techniques of systems analysis can often be helpful when applied to the design of some of the operations in police, courts, and corrections agencies, and to relating these parts to the overall criminal justice system. Such analyses provide a framework for study and for experimenting, as in a laboratory, with many possible alternatives prior to actual field implementation. Depending as they do on the development of appropriate data, these analyses stimulate careful collection and evaluation of infonnation, and can thereby help locate critical areas for research.
The use of systems analysis was a major theme of the work of the Task Force. The approach begins with a broad look at the system's objectives and the possible methods for achieving them. The next step is to estimate the costs and benefits of each method for reaching the goal. The overall goals, however, are often difficult to relate in quantifiable tenns to the nltematives under consideration. Thus, it is necessary to narrow the focus to those parts and aspect!! of the criminal justice system that are amenable to systems analysis, and then to present conclusions in appropriately qualified terms.
Despite these limitations, the systems analysis approach has the larger advantage of clarifying goals and making them explicit, drawing attention to ways of achieving them. Decision makers are thereby forced to make conscious choices among the values to be served. This proc.ess makes apparent what infonnation is relevant to these choices and stimulates the collection of the appropriate data.
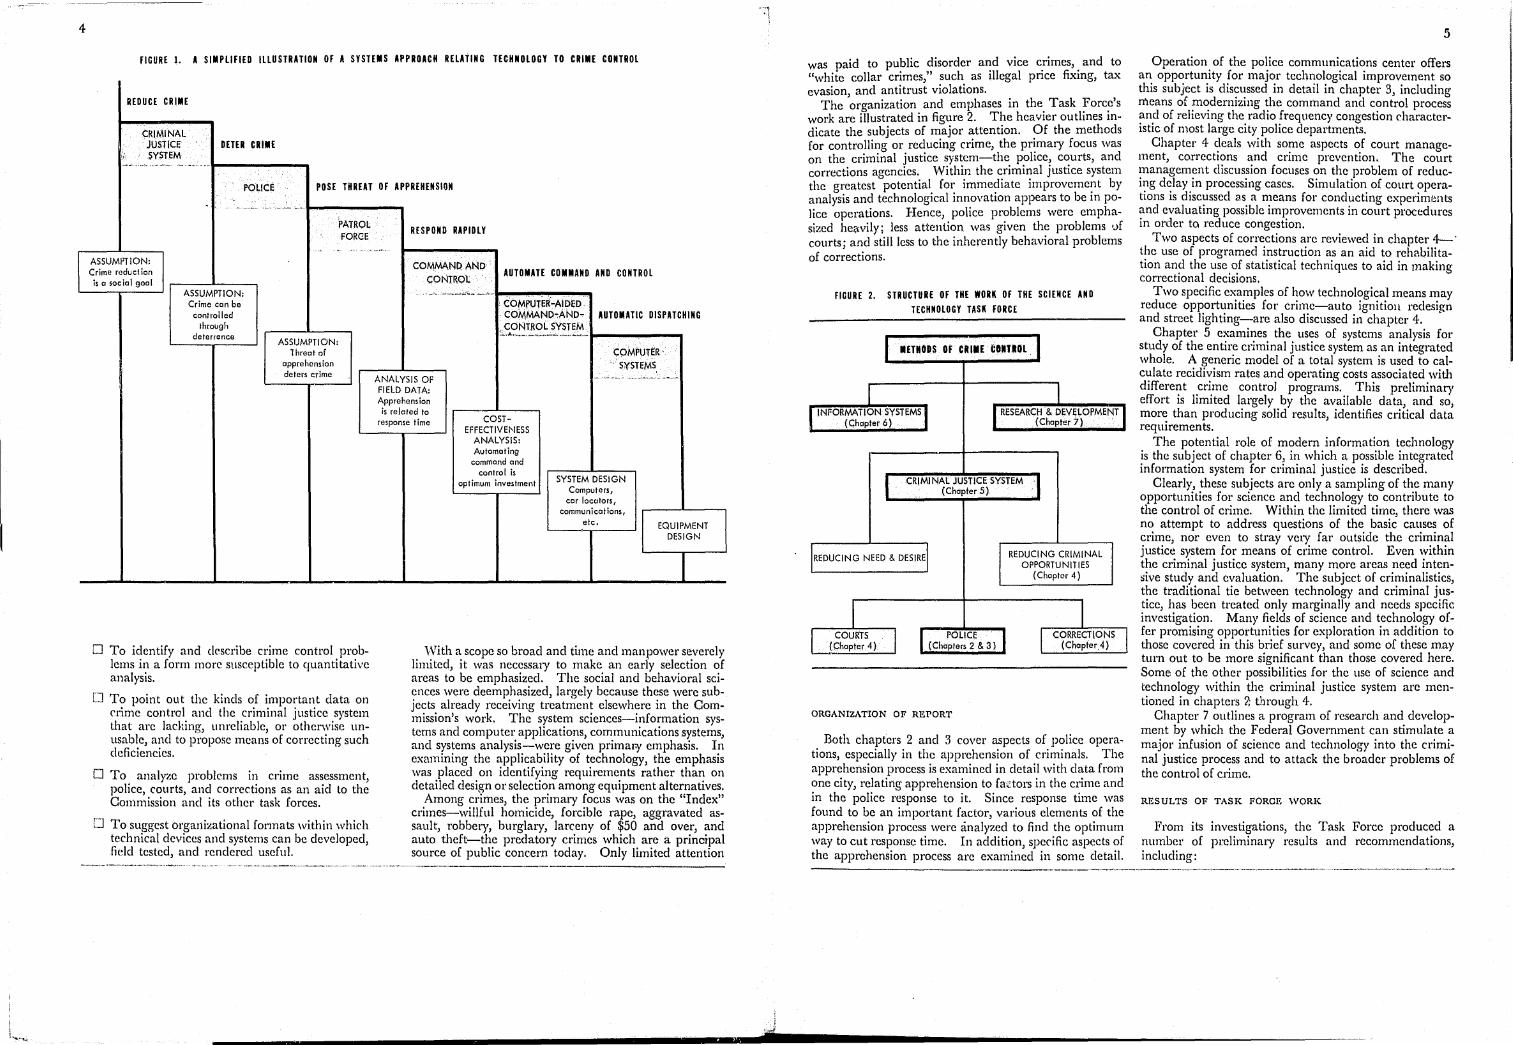
Figure 1 shows an example of the work of the Task Force along these lines-the use of systems analysis in finding how the police patrol force can better deter crime by shortening the time it takes to respond to a call for help. In the step diagram, the objectives are shown on
3
the risers and the means for achieving them on the treads. The support for each of the steps is shown beneath it. By a sequence of analytical and empirical irtvestigations, necessarily interlaced with assumptions and judgment, it was possible to proceed from a basic objective of the criminal justice system-reducing crime-to specific recommendations concerning new technology and operating procedures. There are, of course, other interests involved in the operations of the criminal justice system-protect\ng the innocent and safeguarding individual privacy, for example. But by narrowing the focus to the crime-reduction objective, it may be possible to suggest new strategies that can then be evaluated in the light of other and broader objectives.
Figure 1 starts with the principal objective of the criminal justice system, reducing crime. One means of doing this is by deterring people who might othcrwise commit criminal acts. The police deter primarily by using the patrol force to pose a threat of apprehension, thereby raising the chances of penalties. Field data were collected and analyzed to determine the important factors that lead to apprehension. Among these, response time appeared to be important. This led to a cost-effectiveness analysis which compared means for cutting response time. The results of the analysis suggested that the best allocation of resources would be in automating the communications center operations by such means as using computers to perform some of the dispatching functions, automatic car locaters to find the closest car, and other related technological possibilities. These components then can be brought together into a system design. Thus, it was possible to proceed systematically from the broad objectives down to the relevant technological details.
Of course, figure 1 is a highly simplified routing through the process. At each stage, the objectives are much more complex and the means far more numerous than the ones shown. . In addition, the support for each step in this example is based on very preliminary work and requires much further development before firm conclusions can be drawn. Furthennore, this work was based on both specific and hypothetical situations, and the conditions examined may not necessarily apply in any given local situation. They are intended more as an illustration of an approach than for the generality of their conclusions.
THE SCIENCE AND TECHNOLOGY TASK FORCE
WORK OF THE TASK FORCE
The Science and Technology Task Force was established to investigate in greater detail some of the applications of science and technology to the problems of crime, and especially to improving the criminal justice system. The Task Force sought:
o To identify the problems, immediate and longtenn, that science and technology is most likely to help solve, and to suggest the kinds of research and development ne(:ded.
... "The Budget of the United States Govj~rnmcnt"; Fi8cal year cnding June 30, Fiscal Years 196,l, 1965, and 1966"-vol. XIV; National Science Foundation: 1968; Government PrlntlnJ: Office; Washington, D,C. NSF65-1O; Government Printing Office, Woahiogto;u, D.C.
G "Federnl Funds for Research, DCTclopnlCnt, and Other Scientific AClivitJea-
..
4
i t."" .....
FIGURE 1. A SIMPLIFIED ILLUSTRATION OF ~ SYSTEMS APPROACH RELATING TECHNOLOGY TO CRIME CONTROL
REDUCE CRIME
CRIMINAL JUSTICE SYSTEM
DETER CRIME
POLICE POSE THREAT OF APPREHENSION
-.. ~- .. -.. --1-----_
ASSUMPTION: Crime rcduct ion is a social goal
ASSUMPTION: Crime can be
controlled through
deterrence ASSUMPTION:
Ihreot of apprehension deters crime
PATROL FORCE
o To identify and describe crime control problems in a form more susceptible to quantitative analysis.
o To point out the kinds of important data on ('rime control and the criminal justice system that are lacking, unreliable, 01' otherwise unusable, and to propose means of correcting such deficiencies.
o To analyze problems in crime assessment, police, courts, and corrections as an aid to the Commission and its othel' task forces.
o To suggest organizational formats within which technical devices and systems can be developed, field tested, and renderecl useful.
RESPOND RAPIDLY
COMMAND. AND CONTROl:
AUTOMATE COMMAND AND CONTROL
..... , .. _--"-,-- ,~~.Io-o!--_ ...... - ... • cOMPUTi:~~AIDED COMMAND~AND-
ANALYSIS OF FIELD DATA: Apprehens ion
is related to response time
AUTOMATIC DISPATCHING s.~2~1!~~':'V.:!:~_ .... ____ ...,
COST-EFFECTIVENESS
ANALYSIS: Automating
command and control is
optimum investment
COMPUTER " , SYSTEMS
SYSTEM DESIGN Computers,
car locators, communications,
etc. EQUIPMENT DESIGN
With a scope so broad and time and manpower severely limited, it was necessary to make an early selection of areas to be emphasized. The social and behavioral sciences were deemphasized, largely because these were subjects already receiving treatment elsewhere in the Commission's work. The system sciences-information systems and computer applications, communications systems, and systems analysis-were given primal?' emphasis. In examining the applicability of technology, the emphasis was placed on identifying requirements rather than on detailed design or selection among equipment alternatives.
Among crimes, the primary focus was on the "Index" crimes-willful homicide, forcible rape, aggravated assault, robbery, burglary, larceny of $50 and over, and auto theft-the predatory crimes which are a principal source of public concern today. Only limited attention
was paid to pu?liC ~isorder a~d vice crimes, and to "white collar CrImes, such as Illegal price fixing, tax evasion, and antitrust violations.
The organization and emphases in the. Task ~orc?'s work are illustrated in figure 2. The heavier outlines mdicate the subjects of major attention. Of the methods for controlling or reducing crime, the pr~mary focus was on the criminal justice system-the poilce, courts, and corrections agencies. Within the criminal justice system the greatest potential. fOl: imme?iate improveme~t by analysis and technological mnovatlOn appears to be m police operations. Hence, police problems were emphasized he;;wily; less atteni.ion was given the problems ,..>f courts; and stiilless to the inherently behavioral problems of corrections.
FIGURE 2. STRUCTURE OF THE WORK OF THE selnCE AND TECHNOLOGY TASK FORCE
METHODS OF CRIIE CDIlTlOl
CRIMINAL JUSTICE SYSTEM (Chapter 5)
REDUCING NEED & DESIRE
POLICE (Chapters 2 & 3)
ORGANIZATION OF REPORT
REDUCING CRIMINAL OPPORTUNITIES
(ChoptQr 4)
Both chapters 2 and 3 cover aspects of police operations, especially in the apprehension of criminals. The apprehension process is examined in detail with data from one city, relating apprehension to fa~tors in the crime and in the police response to it. Since response time was found to be an important factor, various elements of the apprehension process were analyzed to find the optimum way to cut response time. In addition, specific aspects of the apprehension process are examined in some detail.
5
Operation of the police communications center offers an opportunity for major technological improvement so this subject is discussed in detail in chapter 3, including means of modernizing the command and control process and of relieving the radio frequency congestion characteristic of most large city police departments.
Chapter 4 deals with some aspects of court management, corrections and crime prevention. The court management discussion focuses on the problem of reducing delay in processing cases. Simulation of court operations is discussed as a means for conducting experiments and evaluating possible improvements in court procedures in order to reduce congestion.
Two aspects of corrections are reviewed in chapter 4-' the use of programed instruction as an aid to rehabilitation and the use of statistical techniques to aid in making correctional decisions.
Two specific examples of how technological means may reduce opportunities for crime-auto ignition redesign and street lighting-are also discussed in chapter 4.
Chapter 5 examines the uses of systems analysis for study of the entire cl'iminal justice system as an integrated whole. A generic model of a total system is used to calculate recidivism rates and operating costs associated with different crime control programs. This preliminary effort is limited largely by the available data, and so, more than producing solid results, identifies critical data requirements.
The potential role of modern information technology is the subject of chapter 6, in which a possible integrated information system for criminal justice is described.
Clearly, these subjects are only a sampling of the many opportunities for science and technology to contribute to the control of crime. Within the limited time, there was no attempt to address questions of the basic causes of crime, nor even to stray very far outside the criminal justice system for means of crime control. Even within the criminal justice system, many more areas need intensive study and evaluation. The subject of criminalistics, the traditional tie between technology and criminal justice, has been treated only marginally and needs specific investigation. Many fields of science and technology offer promising opportunities for exploration in addition to those covered in this brief survey, and some of these may turn out to be more significant than those covered here. Some: of the other possibilities for the use of science and technology within the criminal justice system are mentioned in chapters 7; through 4.
Chapter 7 outlines a program of research and development by which the Federal Government can stimulate a major infusion of science and technology into the criminal justice process and to attack the broader problems of the control of crime.
RESULTS OF TASK FORCE WORK
From its investigations, the Task Force produced a number of preliminary results and recommendations, including:
----------------.-------------------- ... ---~---------.-

6
o A compilation of field data examining certain relationships between police field operations and the apprehension of criminals.
;-] Procedures for improving police responsivem"iS to calls at minimum cost.
[] .\n approach which could significantlv reduce polic!' radio frequency congestioll. '
[I ,\n o\1tline of a research and d('wlopm!'Ilt prot'ram for tll!' cil'v('lopnwnt of a ~('rniautoh1atie llTH.;p"'l)rint l'h'ognitioil sy~t(,IIl to replace the pn'~{:llt manual ~ystUll um1('r which a criminal 1';lT1Ilot ordinarily he tl'acC'd Ul'!t,~~ a full ~et of 1 f) print' is ;tv:1ilaLlt,.
CJ Studies l'x.lIlIining pn'~ibl{' terhnolo!!ical innovaticllls for jlolicC' oIlI'rations ill su~l; areas as aia,!'m systcms and nonlethal wt'apOllS.
U Statistical approachps rolln~rned \\ith the imi!WVt'fllt'llt of allocation of l,atrol officers in the lwld.
f"'J A prnc«'clllr{' for testing mf'ans of l'f'ducingunnt'('{'s~ary delays in moving c;~ses thrcm,gh tile courts.
o A? examination of programed learning techmq~~s a~ one means of contributing to the rehal)lhtatlOn of young offenders.
o Methods for making auto theft more difficult.
o J~n exploratory attempt to apply system analySIS to the overall criminal justice system.
[1 An. outli?c, but .not a detailed design, of a natwnalmformatlOn system for criminal justice agencies. .
o A proposal for a national rl'sctt!ch and development program.
. These spccific rcsults and recommendations are ill~ended only to illustrate the potrntial contributions of ; snencc and technology to crim!' control. They must be . developed ill dctail for each loeal situation and thc extent , of t?cir uti~ity must still bl' ascertained from better data. As IllustratIOns, howcver, they appcar to otTer sufficient promise' of the potential brnefits from science and tech
: llology to warrant major eflorts in these directions.
Chapter 2
Police Operations-the Apprehension Process
Of all criminal ju~tic(' ;l!~l'Jlril's, tilt' poli('(~ traditionally 11;\\,(' had tIl!' clpst'st tit·s to ~cit'n('(' and tl'dm()l():~v. Then' is rOH~iJI'rably !IIort' ~rllpt' for the ('lJ'liplIll'nt t";'lindl1\!y in polkinl! thall ill other pal ts (If thl' nin'ln,11 jH~tic(' Ill'()(·e,;s. Policl' (,('lIul1lUlications, trall'ii>O: btioll. \",('apoIllY. crimt· dl'l('ction, a1l(1 nillll' im'C'sti:>'ati('1\ all lh.tw on ~riPrH (' awl tl'('hn"lrl~\ to an ('"tPIlt that t'" 1'1'(1:;
th(' 1J1lt\'Htbl in cn\lrt~ and ('(;rrl'ctions. YI't P\,(,ll :ll'll·
:llall~' IJult'll .ial ('lil i trihu tions remain t:l't':\ pk.i 11'11. I J1
additit'll. l'ontribttti(ll1~ frolll It'search, iufol1llation prot'(!;';:Il!.!. and ~vst~'IlI~ anal\'si~ an' oIllv ill~t bt'!.(illning to bl' CIllt'IH'll. Fo'r theq· n',;~ons, tlw task Fon'!' focml'd a n:a jll!' part of its «:Irort, ClTl pulice operatiolls.
Tlv~ prevention or df'tl'ITt'llrt' of crime i,:, indirp('t\y proIll< 'ted by the polic .. throUl;h snch din'l'se nwans as emnItllillit\ rdations and public information programs. tlw sth'ctiOl\ and training of efl'('ctive personnel. contill,f:('\lCV I'bnninl.:' for disast('r~ or disordl'rs. and till' lllaintl'nann' (If .lll ellertiw int('Ilit\l'nn' S\'stPIll.
Sli"nce and tedmolot'\,' call ilJlPto\l' tllt' capahilitil's (,f till' police in tht'~(· an'as in lllany difTt,l't'nt ways, Tll(' t('chniques of illdustrial psycholo!!y call aid in s. 'll'cting' C'ffcctiw polin· OffiCl'l'S. Edu('atioual t('('hnulo,~v c.m aid ill trainim',: Prm!ralllt'd learning texts can h(' \lsf'd ror individual ~t\ldy whik an offict'r is \\'aitin~ for appearallre in court: closed-t'irl'uit tt'ip\ision can be used to pn'sent ~killed lectllJ'ers to a numbe!' of polke precincts or departrtwnts at tlll' same time: and himulated exereises can 1)(' USN! to train groups of police officers to work as an integrat{'d team in handling- unusual large-scale disturba11('(,8. The tt'chniqut's of operations research can be \lse~l to allocate resources and to develop equipment mamtenance and replacement schedules.
The Task Force's prime concern, however, was with what contributions science and technology could make to those police operations directly concerned with controlling crimc by apprelll'nding criminals or by deterring potential criminals with a convincing threat of apprehension. The Task Forcc focused on the operations of the patrol force in apprehension of individuals after they commit criminal acts, The oldest ties police field operations have to technology center around apprehension. Automobiles, radios, cdme laboratories, scientific investigation, and police weaponry are all essential technical aids to the operations of a modern police force.
'I'h!' ,tpprf'lll il'ii"iI pwre,s \ t1~ur(' :1) bl'7ins with thp dl,tpninn of a ,'r:lllt' lw til(' rrui~illg lJatwl fl,rn' 01' hv a r<'[J'Ht to tlll' i',}lin' h,: a:l abrm, a {vitn{'~s. Of' a victim. Onle tll(' inflll'lnatioll is "(l!lltllm,ic,\tpt! ttl the police, an :q,prnpri.tk rl'~[JorN' must hI' ~t'h·('tt'd, allti patrol oflkl'rs dbp;ttdwd ld tIlt' ~('{'Jl(" '1'11\'n f"lInw st'arch and inve5ti· )!atinn illt.'rrn:!;"tiull. dat., p:,ttherin,!.:'. suspect chl'ck(luts and tlH'll. perhap", arrest.
Tllt' chokl' of which t£'chnological p(}~sibiliti('s in thhi <In'a to pur!'.llf' is mild!' rnort~ difIicult by the laek of data on jt!>t what situatiolls confront the police, and by tht· l.ll'k (,f c,y~tt'lIlatic studies of polin' patrol and apprehen" ~i(ll1 npt'l'ations. Til try to till this gap, the Task l~orce ~tudil'd tilt' factors in tlw appreheIlsioll proCl'ss with original til'Id data and tt'l'hlliqlH'~ of ('ost-('ffectivenp,s all.lly~is. Within tlH' apprelwll'oioll jJl'{l('!·Ss. the fUllctions of cOIllmand-.lllel-colltrol <nul 1't1ll1lliunicatiollS wen' f(',und to he suHkielltly important to warrant ~('paratl' tl'(';ttllll'llt, anti an' ('(lvered ill chaptl'l':l.
The rf'llIaindt'r of this ehaptt'r p';amim's tht, other ~tat';('s ill tht' appn·hension pro('l'~s: llt·wctioll. polic(' mobilitv, nonlethal weapons, l'vidt'IlCI' g-adlt'ring hy finp:l'rprilib. and analysis hI' crime laboratmit'''. SOUle of the potential sdf'ntitk and technological contributions to {'.tch;w· idl'lltifi(·d. In addition. the problem of effective a~siglln)(,llt of patrolmen. which oVl'rlays the entire proc('S~;, is examiIll'd.
ANALYSIS OF FIELD DATA ON APPREHENSION
With the cooperation and extensive assistance of the Los Angell's Police Department (LAPD), a study was conducted to identifv and assess the influence of various factors ill the apprehension process on the solution of crimes. The study was an analysis of police records: Reports of caJl~ for service, patrol field activity, crimes, detective investigations, and arrests and other case clearances were systematically analyzed. Data were collected on time delays within the communications center and response time in the field.
The sample of cases represented the total activity in 2 of 15 field divisions for the month of January 1966. The sample included 4,70+ incidents, of which 1,905 actually involved reported crimes. Such police activities as arresting drunks and vagrants and handling traffic inci·
7

8
FIGURE 3. APPREHENSION PROCESS
-ALARMS l -WITNESSES • -VICTIMS J I"OTHER MEAN~
BY PATROL
dents were excluded. The data were collected from communication message tickets, officers' daily field reports, crime reports, detective followups, and arrest reports. The details of the study are given in appendix B.
CLEARANCE OF CRIME CASES
Of the 1,905 crimes examined in the study, 25 percent (482) resulted in arrests 01' other clearances. Of the solved 01' "cleared" cases 70 percent involved arrests, and 90 percent of these were made by the patrol force. More than half the arrests were made within 8 hours of the crime, and almost two-thirds were made within the first week.
The most significant factor found to affect clearance is the naming of the suspect in the crime report. 0 As shown in figure 4, if a suspect is neither known to the victim nor arrested at the scene of the crime, the chances of ever arresting him arc very slim. Of the 4-82 cleared cases, 63 percent involved "named susper:ts", about half being known by the victim and half through on-the-scene arrests (approximately 30 percent by police officers and 20 percent by store securi ty officers). The majority of the crime cases, a total of 1,556 (82 percent), involved suspects not named in the crime report. Of these, 1,375 (88 percent) were not cleared. Even in the cleared cases with unnamed suspects, most of these were cleared because of an on-the-scene arrest, though the suspect was not "named" in the crime report. These results indicate the narrow range of situations in which apprehension is likely. They suggest a search for better means of identifying the suspect at the crime scene. One means of accompiishing that is by enabling the patrol force to respond more rapidly so as to increase the chance of actually catching the suspect at the scene.
The naming of the suspect is also an important factor in detective followup. Detectives, not surprisingly, tend to put their limited resClurces into cases where there is something positive to investigate. Detectives made followup reports in 363 of the 482 cleared cases. Almost two-thirds of these followups were named-suspect cases. Of the remaining third, more than half involved ca~es .. '-6 Til~'-u~'~;Wtf~;u-;J;;ctH charnctcrh,tlc Is quhl~ rOlI,plcx, however, because or Rm. hlguhy ill the sourCQ dntll, For ~xnmJllc, the crime rcpOlt may inclullc a named luspect bccan9(.~ (a) the Buspect Is actunlly known tQ the ylctilll (or witnf!8s) ; or (b) thu IHlBpcct WBS unknown to the victim, but W38 arrested nnd Identlfied at the lIcenQ or the crime, dther by R Ilotrot officer or by n witncu Bueh as a retail
INFORMATION C0MMUNICATED
10 POLICE
APPROPRIATE POLICE
RESPONSE SELECTED
POLICE CARS DISPATCHED
TO CRIME SCENE
BY RADIO
in which on-scene arrests had been made but the suspect was not named in the crime report. Of 1,423 uncleared cases, only 84 (or 6 percent) followup reports were actually made by detectives, and the suspect was identified in only 18 of these. Some follow up investigation may have been made in the other cases though no reports were filed. Detectives understandably tend not to make followlIp reports when there is nothing to report and where there is no obvious evidence on which to base a followup investigation, no follow lip effort appears to be expended.
FIGURE 4. CLEARANCE OF CRIMES WIl'H NAMED AND UNNAMED SUSPECTS
NAMED SUSPECTS
UNCLEARED CASES ~ 46 RATE" 14%
CLEARED CASES" 30.1 RATE ;'86%
Ui'INAMED SUSPECTS
CASES'" 18i
UNCLEARED
CASES ., 1,375 RATE' 88%
CL~~REt\
TOTAL CASES = 1,905
TOTAL CLEARANCE RATE" 25%
RATE" 12.%
Methods by which detectives identified suspects heavily emphasized lise of stolen property and vehicle information, interrogation of arrestees, and identification by victims. Modus operandi techniques and weapon informa tion were used in only a very few cases . atore security officer. Because the crime repor'. wns made after tho nrrellt, the suspect's nallle appeared. However. thls practice varlcs with different officers nnd different ficld situations, Thus. it 18 evcn possiblc to have on·scene arresta of known 8U8pcchl who are not IIBfOCiI In the cl.'lmc report. Thc8c ambh;ulticl remain to be clarified in Bub-sequcnt analyscs.
9
POLICE CARS TRAVEL TO
HOT SEARCH WARM SEARCH COLD CHECK OUT
SUSPECTS CRiMEi IN CRIME j---,~~
VICINITY IN CRIME j---,~~ SEARCH BY i-r--VICINITY DETECTIVES
~/~/ ___ ~·~~~~LJ---------------------------------·------------~
The study suggests considering two possible approaches to improving police effectiveness against the unnamed suspect. First, more intensive preliminary investigation at the crime scene might produce more leads for fruitful followu.p by detectives. Perhaps specially trained civilian investigative specialists who need not meet the physical requirements of a patrol officer could handle this job. Evaluation would be necessary to establish whether these would produce enough additional information to warrant the effort. Second, considerable dl!tective resources are presently allocated to followup investigations in burglary cases. It is clear from the data, however, that the most effective weapon against the burglar is the on-scene arrest. The detective followup resources might be more effectively used in the field, such as in tactical detective squads or in stake-outs in heavy burglary areas. The relative effectiveness of these uses is also problematic, so such a reallocation should be carefully assessed in a controlled experiment.
RESPONSE TIME
The overall response time from call for service to arrival at the scene consists of two major components: Communications center response time (the time required in the communications center from receipt of a telephone call to transmission of a dispatching message) and field response time (the time between receipt of the dispatch message by the patrol unit and arrival at the scene).
'Within the LAPD communications center, dispatch messages are divided into two general categories: emergency and nonemergency. There is an intermediate category of "nonemergency but urgent" messages which sends a patrol officer to the scene as rapidly as possible, but not using his red J.ight and siren.
From table 1, for emergency calls, the overall police response time is seen to average 6.3 minutes for those cases involving crimes subsequently not cleared. The average is only 4.1 minutes for cases in which the police were able to make an arrest. A similar situation holds for the calls classified as non emergency. Thus, for this
city, and on the basis of this data, short response time correlates with ability to make an arrest.
Table 1.-Relation Between Response Time and Arrests
'----;-------------Type of call
Emergency: Crime uncleared •...•.•.....•. , ••... A rrest made........ __ ........... .
Nonemergency but urgent: Crime uncleared .................. . Arrest made ....................... _
All other nonemergency: Crime uncleared ................... . Arrest made_ ..................... ..
Average response lime In minutes
Communication Field response Total center (travel time)
1.9 1.1
3.8 2.6
7.3 5.6
4.4 3.0
14.0 2.7
112.9 4.6
6.3 4.1
7.8 5.3
220.2 10.2
I Very small sample. 2 ReOects high proportion of calls merely 10 take a report on completed crimes.
A similar picture is presented in figure 5, which shows the an-cst probability as a function of response time. When response time was 1 minute, 62 percent of the cases ended in arrest. When all cases with response time under 1'~ minutes were grouped together, only 44 percent led to arrest.
To this point, arrest. probability has only been shown to be correlated with response time. As in any correlation, the relationship may be one of calise and effect, or it may have developed through some uncontrolled third factor to which both arrest and response time are related. It is possible, for example, that the police force responded more rapidly to those incidents in which arrest was rec" ognized to be more probable. More carefully controlled tests than were possible in the time available are needed to establish a cause-and-effect relationship definitively.
CRITERIA FOR EMERGENCY DISPATCHING
Another factor which appears to affect patrol operations significantly is the method for deciding whether a

10
70
60
,..~ ., 50 .Z:
.£ " E " ~ 40 V! ....
V! w
'" '" « I- 30 Z w U
'" UJ 0..
20
10
FIGURE 5. PERCENT IlF ARRESTS IN RELATION TO OVERALL RES~ONSE TIME
, \
" r--. ....... 1"'--0 r-.; 1"'--0 ~- ....
1 ~ 100 Number of orrests
x Number of COles with response time 1(\5s than 1
0 I I I I I I I I I I I I I o 2 3 4 5 6 7 8 9 10 11 12 13 14 15
OVERALL RESPONSE TIME IN MINUTES (I)
call should be handled a.s nn emergency. Of the 724 emergency calls shown in t::\ble 2, 179 (or 25 pel'cent) proved to be crimes,7 and 63 of these (or 35 percent) were cleared. On the other hand, 3,378 nonemergency calls were handled with no indication of urgency. Of these, 1,368 (or 40 percent) involved crimes, of which only 230 (or 17 percent) were cleared; most of these calls were requests to make a report on a completed crime.
Of the 1,138 nonernergency uncleared crime calls, 112 (or 10 percent) actually involved "suspect on scene" or "possible crime" situations which later proved to be
Table 2.-Results of Radio Calls
I Emerfiency Nonemer· Nonemer· Total ca s genCr but gency cslls
urgen calls calls --
R adlo caUs ..................... " ..... 724 274 3,378 4.376 Percent of total calls ................. 17 6 77 100
R odlo calls with crimes reported ......... t79 67 1,368 1,614 Percont of radio calls ................. 25 24 40 37
Uncleared crimes ................... 116 38 1,138 t,292 Percent of crImes... " __ ..••••• 65 57 83 80
Arrests made ...................... 53 23 151 227 Porcent of crlmos ............. '" 30 34 II 14
Other cloarances ................. 10 6 79 95 Porcont of crImes ............... 5 9 6 6
1 Manr or tho emergency c.n. Were r.la. burglar .tarma.
crimes. These 112 cases equal almost two-thirds the number of emergency-call crimes, and nearly twice the number of emergency calls in which crimes were cleared. Among these 112 cases are a significant number of burglaries and robberies. Even one homicide was listed. At least 50 of these cases would have been handled as emergencies had the dispatcher known the actual situation at the scene.
This strongly suggests that some improvement in crime prevention and clearance could be expected from modifying the criteria for assigning priority to dispatch orders or from providing better information to the dispatcher. A specific research program should be undertaken to evaluate and design new procedures. This program would evaluate the present priority assignment criteria through a detailed examination of incoming calls for service and associated field response. An audit of the result~ of responses to calls could guide improvement of the criteria, and these could then be reevaluated through the same methods employed in the initial evaluation.
FURTHER STUDIES
This apprehension study is only one of many possibilities. The entire Los Angeles study was only preliminary and exploratory. Its results, however, suggest that significant improvements ean be made in the early stages of the apprehension process. Similar studies running over several years should be undertaken in large metropolitan police departments to explore the detailed characteristics of crimes, arrests, and field investigation practices.
Among the matters to be studied, as shown by the Los Angeles study, are:
Assessing in more detail the effects of response time on arrests.
Estimating the probability of clearing a crime as a function of type and quantity of detective resources assigned to it.
Establishing criteria for priority of dispatching of patrol cars.
Sampling incoming calls and following them through to activities in the field.
Using equipment such as portable recording devices to simplify data collection by the investigating officer.
This kind of factual study could also be extremely valuable in determining the effects on later stages in the criminal process of the questioning of suspects, warning them as to their rights, and introducing counsel into the situation.
SYSTEMS ANALYSIS OF RESPONSE TIME IN A HYPOTHETICAL CITY
On the basis of the correlation between response time and arre&ts, and because officials desire rapid response to
..J
create an impression of effective police preset;ce as wel! as to aid in apprehension, the Task Force exammed means of reducing response time. In particular, an analysis was conducted to determine how to get the greatest reduction in response time per dollar of cost.s This analysis was accomplished by making a mathematical model of the apprehension process in a hypothetical city. Although the numerical values used in this example are based on averao-es from several iarge cities, they typify a generalized majo;' city in the United States. Any specific police department would have to develop and use data developed for its own city.
The hypothetical city covers 100 square miles an? has a police force, telephone system, and other vanables shown in table 3. A city this si~~e would have a population of about 500,000 and be comparable in population density to Atlanta or Indianapolis.
In the analysis, time delays in the apprehension process were related to system resources (table 4) , ancl costs were associated with each resource. The analysis computes the time reduction and costs asS0ciated with various means of reducing response timt'. The improvements were measured in average number of seconds of delay saved per dollar of additional annual cost.
Table 3.-Description of Hypothetical City
Item -Geop,raphy ...................... '~-'--- ----Rale of call receIpt I. _ ....... _ ..•.
R~te of police mobile unit dispatch. -Total mobile force~ ..............
Speed of mobile force ............
Public t~lephone distrIbution ...... ----Call service time .................
Number of call complaint clerks ....
Details
The city is a 10· by 10·mile square. - .... ---
40 calls per hour or approximately 350,000 -ails year are handled by the police telephon£t'.!11pl clerks.
---~-
per aint
30 one·man mobile units are dispatched per hour
40 one·ma n p~ trol ca rs.
25 m.p.h. --1.000 distributed uniformly throughoul city. -30 minutes average
2 or 3. -
1 ThIs might be typical for a city of about 500,000 populaUon. 2 Considers only mobile units assigned to patrol fll~~tlons Independent 01 speci al detective
forces and supervisory vehicles.
11
Table 4.-Resources Associated With Time Delays in the Apprehension Process
Gomponenh of res ponS} time Resources
Time until detection.............. Police patrol unit sensors, alarms. public's response.
Time Irom detection until attempt i~ made to transmit message to police.
Incoming m~.sage queue waiti~g lime.
Police callboxes, police radIo network, common car· rler telephone, automatic alarm and aS10ciated communIcations.
Telephone operators.
Control cenler response lime...... Police control center internal operallons.
Field force response lime......... Patrol unit, car·location devices.
The results of the analysis are summarized in table 5. In the first column the delays caused by each aetivity arc identified. For example, the patrol mobility delay is the time from the termination of the dispatch order to arrival at the scene of the crime. The basic operating unit associated with this activity is a one-man patrol car (col. 2). There are 40 such units already in use (col. 3). The amount of this delay is 216 seconds (col. 4). If one additional unit were added the average response time '""ould decrease by 4 seconds (col. 5). The patrol units are expected to be used 264,000 times a year (col. 6). The cost of an additional unit is $50,000 per year (col. 7). Multiplying the delay saved per caI! per additional unit (co!. 5) by the frequency of use (col. 6) and dividing by the cost of the additional unit (co!. 7), one obtains 21.1 seconds saved per doI!ar (col. 8) .
Employing this technique, one can evaluate the changes in other compqnents such as the complaint clerk, public callbox, automatic car loeator, and computer and collateral equipment for the communications center. For this case, automating the command center is the most attractive alternative. If there are only two complaint clerks, adding a third is the next most desirable step. Even though the telephone queue waiting time with two 'clerks is only 7.2 seconds the value in assigning a third complaint clerk is comparatively large. The low CDst of the clerk and the high frequency with which he becomes involved in calls justifies such a move. As is shown in table 5, adding a fourth would not be desirable.
Table 5,-Cost-Effectiveness Analysis of Delay Reduction in Hypothetical City
Seconds of Seconds of Number of I Delay time delay saved Fre~uency of Cost per yea r delay saved
Elements of delay Basic unit umts currently (secondsl per call per use (calls/year) of additional per dollar allocated additional unit unit allctated
.1 installed
(I) (2) (3) (4) (5) (6) (7) (8) ..
Public access delay ..................... Public callbox ........................ 1,000 96 0.0475 10.000 $50 9.5 -- ------Telephone queue waIting time ............ Complaint clerks ...................... {. 2 7.2 7.158 350 400 35000 71.7
3 .042 .042 350: 400 35;000 .42
Delay due to lack of command and control Computor and related haldware for com· 0 120 90 264,000 200,000 119 function automation. mand and control centH. .- - •.
Delay due to lack of knowledge of exact Automatic car locator system ............ 0 20 18 264,000 100,000 47.5 poslllon of patrol unit.
Patrol mobility delay .................... I·man patrol car ...................... 40 216 4 264,000 50,000 21.1
/:I, The details of the annlysis urc in n separate puper, "Analyses o[ the Police thu ChHlringhou9c for Federal :~clentHic nnd Technical Jnroma,Zon or the Nil-Apprehension Procc8!," now In Ilfcpllration. The report will be Dvailnble {rom tlonnl Bureau of StamlnnJa.
12
The third most significant contribution lies in the installation of an automatic car-locator system. For the ,city described, an average of 18 seconds delay can be directly attributed to choosing an available car other than the one closest to the disturbance. Even though a small portion of the overall delay time is reduced, the marginal returns are relatively high.
Among the conclusions about the hypothetical city that may be drawn from detailed analysis of the sort illustrated are:
The polic!! command and control center appears to be the best place to invest dollars to decrease response time.
Automatic car-locator systems costing under $100,000 per year to operat'.! would decrease the system delay a.t least twice as much as a comparable investment in additional patrol units.
Since telephone waiting time is very sensitive to load, an additional complaint clerk would be warranted in many situations where the clerks are now busy. Police departments should periodically perform a telephone-traffic study of their incoming calls to determine the correct number of telephone complaint-clerks for assignment at any given time. •
Since the hypothetical city already has public call boxes, the incremental value of additional ones would be low. Cities with locked callboxes should open them and encourage the public to use them.
These results apply directly only to the hypothetical city described previously, The analyses discussed here suggest similar ones that can and should be conducted in specific cities. .
IMPROVING APPREHENSION CAPABILITIES
In this section, several specific components of the apprehension process-alarms, detection and surveillance devices, nonlethal weapons, vehicles, fingerprint identification and crime laboratories--are discussed.
DETECTION OF CRIMES
The apprehension process is initiated by the detection of a t.:rime by police on patrol, by a witness, by a victim, or else automatically by an alarm or surveillance device.
Patrol Detection
Police on "preventive patrol" cruise the streets to look for crimes in progress. Presumably, this activity prevents crime because it poses a threat of detection and immediate apprehension. However, there is little evidence on how much crime is thereby prevented or on how much would be prevented with alternative patrol t'lctics.
,
II Data from "St'tiltieal Digelt, 1965": LOl AD,elea Pollce Department; Los An,.I •• , Calli., 1966.
• One can calculate the probability of detecting a crime as a function of the relevant variables: duration and visibility of the crime, the frequency with which it occurs, the cruising speed of the patrol vehicle, the fraction of time it spends on patrol, and the size of the beat it must cover. Making certain assumptions about the duration of crime (2 minutes for a street robbery and 20 minutes for a burglary) and that crime and patrollocations are independent, one can calculate the detection chances. Using Los Angeles figures,9 in a week the entire force happens upon at most 100 opportunities to detect burglaries in progress and 2 opportunities to detect street robberies in progress. These are high estimates, yet they represent only 12 percent of the burglaries and only 2 percent of the robberies known to the police. An individual patrol officer can expl;."Ct an opportunity to detect a burglary no more often than once every 3 months and a robbery no m'ore often than tlnce every 14 years.
The same analysis applied to stolen cars indicates that the entire force experiences approximately 1,00 opportunities to detect stolen cars each day. There would, therefore, be considerable utility in mechanized automobile license check devices, either in the patrol car or along the highway, Digital data links could tie a patrol car directly into the stolen-car file in a computer; the computer response could be available seconds later, displayed on a strip printer in the car or as a voice message synthesized by the computer. The New York State Identification System has begun development of a device which could scan a car's license plate and automatically convert the image into a message to be sent to an on-line computer with a file of wanted cars. The computer could then respond directly by radio to a waiting patrol car. In a test of these concepts in Operation Corral in New York City in 1964, 183,950 cars were checked, and une out of every 62 cars scanned was wanted on an alarm fot' stolen cars or plates or on a warrant as a scofflaw.
There are many simple ways to increase the probability of detection of a crime. Liquor stores and service stations could provide an unobstructed view of the interior from the street. The visibility from the patrol car could be improved by full-view mirrors. Brighter and more prevalent street lights could extend the patrolman's vision, especially in large, normally dark areas such as schools and other targets of vandalism.
Reducing the conspicuousness of police officers could possibly increase the probability of detecting criminal action because the offender is not aware of the police presence. In some cities, special forces travel in work clothes in unmarked cars. The Long Beach, Calif., Police Department sends two plainclothesmen on bicycles into high crime areas. According to the "New York Times:" 10 "No screaming sirens or flashing lights announce them. They operate inconspicuously, silently, independently and with mobility up sidewalks, between buildings, or through parks." In 1 year, the two policemen made arrests in eight strong-arm robberies, five armed robberies, eight burglaries. Street crimes were reported to have been reduced markedly supporting the general assumption that increasing the apprehension
10 "A Bicycle Patro1 Cutl Crime," New York '1'imea, Oct. 25. 1966.
.. probability tends to deter crime, or at least to displaci' it. On the other hand, were such inconsp~cuous met. hods to be used alone, they might, after some tIme result m some loss of the deterrence and public confidence that are achieved by conspicuous patrol Again, this il\ustr~tes the need to examine the relationship between detectIOn, apprehension, and deterrence with carefully controlled experimentation.
Detection by Alarms and Surveillance Devices
There is a rich store of devices which can aid detection. Burglar alarms are designed to dete~t .intrusion automatica!ly. Robbery alarms enable a vIctim of a robbery or an attack to signal for help. Such devices can be I~cated in elevators, hallways, homes and apartments, bUSInesses and factories, and subways, as well as on the str~et in high-crime areas. Alarms could deter some potential criminals from attacking targets so protected. If alarms were prevalent and not visible, then they might serve to suppress crime generally, although ther~. has been no empirical evidence on this point. In addition, of course, the alanns can summon the police when they are needed.
All alarms must perform three functions: sensing or initiation of the signal, transmission of the signal, and annunciation of the alanl1. A burglar alarm needs a sensor to detect human presence or activity in an unoccupied enclosed ;trea like a building or a room, A robbery victim would i~itiat.e the alarm by closin;5 a foot. or wall switch, or by tnggermg a portable transmitter which would send the alarm signal to a remote receiver. The signal can sound locally as a loud noise to frighten away a criminal, or it can be sent silently by wire to a central point such as a police station or a private protection ag<:ncy. A centralized annunciator requires either private lines from each alarmed point, or the transmission of some information on the location of the signal.
There are many ways by which burglary sensors can detect human prese:1ce or activity. Certain environmental variables could be carefully stabilized so that any sudden change-breaking a beam like an "electric eye," moving metal objects in the vicinity of a magnetometer, making a sharp noise, cutting a wire, stepping on a treadle-could be attributed to intrusion. Any change in the physical or chemical environment due to characteristically human effects-carbon diox!de, ammonia, body odors, body heat-could be detected chemically, electrically, or by animals such as dogs. Other sensors such as closed-circuit TV (perhaps using circuitry for detecting moving targets) or microphones might survey an area, I'elying on an observer to analyze the signal for criminal activity, These would be more useful where there is normally some human traffic, and a more subtle discrimination between criminal and noncriminal traffic is needed.
A victim could activate a robbery alarm by closing an electrical circuit by a pull lever, a push button, a toggle switch, or a pull-cord like the ones used in buses. Since a robber can prevent access to suc;, a fixed switch, a potential victim could be given a portable transmitter which
-
13
he could unobtrusively trigger to send a magnetic, radio, or ultrasonic signal to a remote receiver nearby. The transmitter could be powered by a battery, by blowing, by squeezing, by a carbon-dioxide cartridge, by a spring, or by some other simple energy storage medium. Such a portable system would be particularly appropriate in places most susceptible to robbery like gas stations, banks, or liquor stores.
In choosing one alarn1 system over another, cost, local noise characteristics, detection probability, rate of false alarms by accident or intent, penetration of signals through walls, visibility to a potential criminal, accessibility to a victim, and many other factors specific to a local situation influence the choice. No one solution can meet the many diverse needs. Where such systems are installed their apprehension and deterrent effectiveness and their false-alarm rates should be assessed.
The possibility of installing along the streets microphones sensitive only to a designated call such as "Help" or "Mayday" is sometimes discussed. The complexity and cost of such a system, compounded by the problem of false alan11S, militate against its widespread use,
The installation costs of public street alarm systems might not be unreasonable. Suppose that fixed alanl1 points were located 40 to the mile (at the corners and midpoints of each city block) in a high-crime area. The maximum distance to the nearest alarm point would be about Y&oth of a mile. Walking this distance at 4 miles per hour would take 11 seconds. The time for a polic; car to reach the scene would probably be several minutes so that the walking delay would not consume a major 1)01'tion of the time, If each fixed alarm cost $250, covering a square mile of city would cost about $400,0Q,9 per square mile, plus approximately $800 pel' square mile per month for rental of wire lines. The cost could be re-duced by sharing the wire costs among alarms (aqd losing precision in locating the alarm), or by increasing the spacing between alarms. Doubling the distance (one at every intersection) would reduce the investment cost to about $100,000 per square mile. For those cities that have police call boxes a major cost of installation has already been incurred. .
A portable street alarm system, using a $1,200 receiver at each intersection, would cost about $480,000 per square mile, plus about $200 per square mile per month for wire rental connecting the receivers to a central station. The cost of the individual transmitters would be additional.
If the city had some form of distributed receivers, such as in the call box car-locator system discussed in the next chapter, then those receivers might be modified to respond also to pedestrians' transmitters or to transmitters installed in taxicab5 or automobiles. If ~le availability of such a system could induce a feeling of safety in high-crime areas, they might increase the pedestrian traffic there, which itself might be a deterrent. Just how 'much they would or could actually be used, how effective they are in apprehension, how much they would deter crime, how criminals might frustrate their use, and what false alarm probiems they might entail are all unknown, Since these
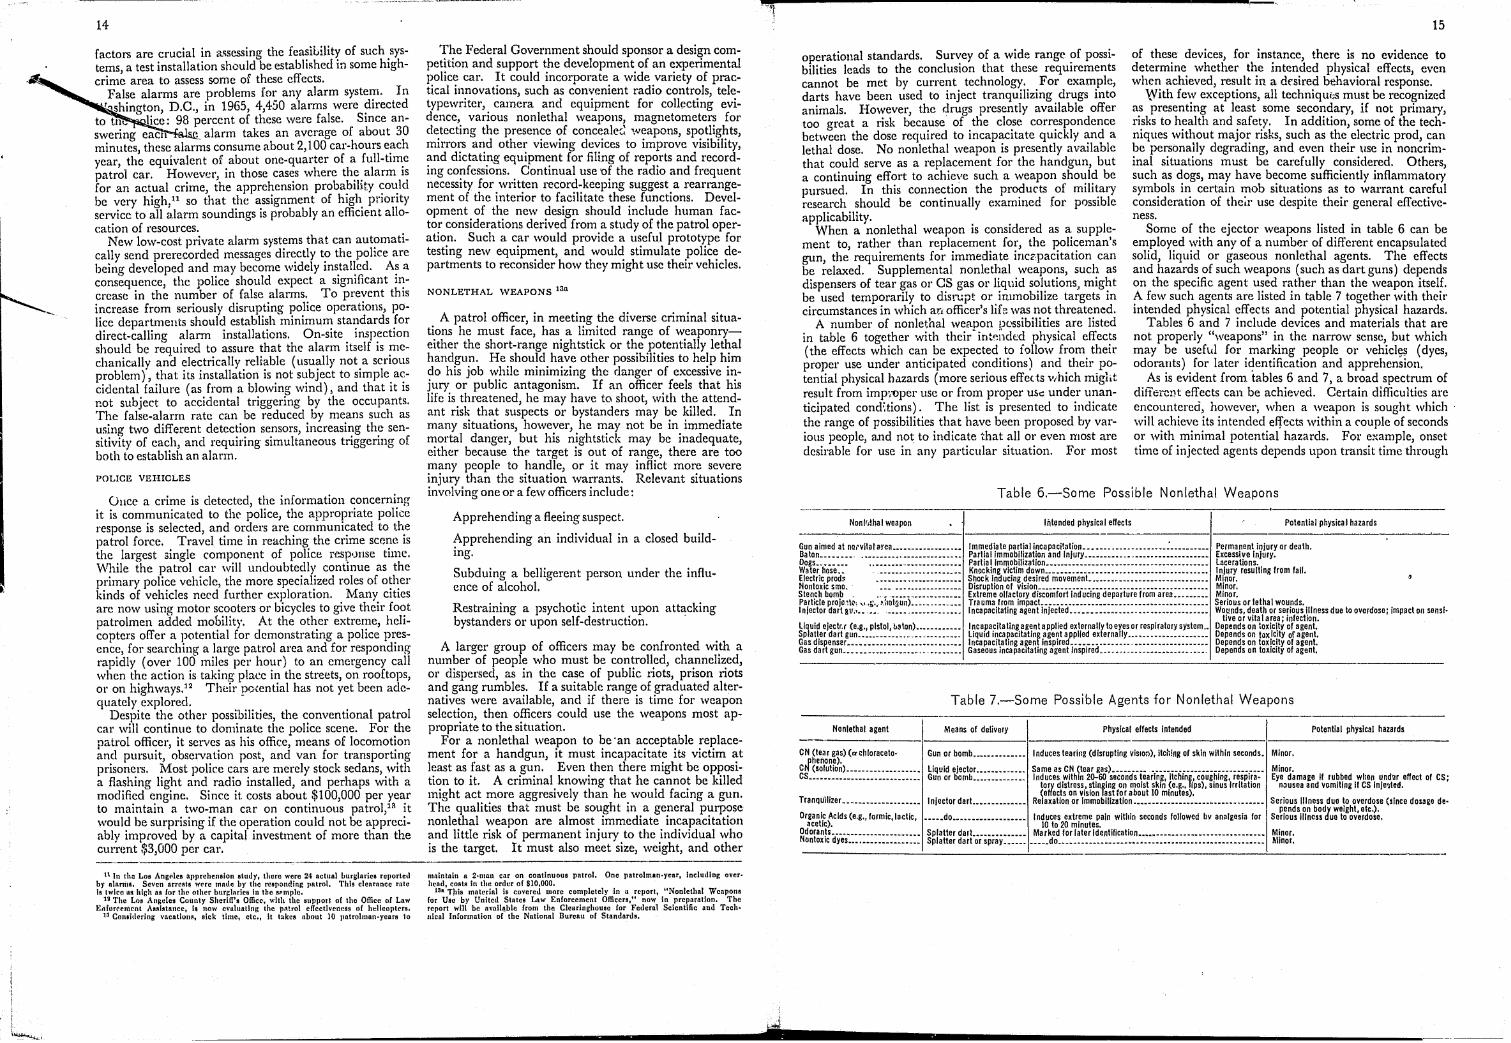
, i i '~~"'--\
14
factors are crucial in assessing the fea~iLilit¥ of such .systems a test installation should be established In some hlghcrim~ area to assess some of these effects.
False alarms are problems fo~ any alarm syster;l. In "T~shington, D.C., in 1965, 4,4~0 alarms were ~lrected to till.: ' lice: 98 percent of these were false. Smce answering eac . alarm takes an average of about 30 minutes these alarms consume about 2,100 car-hours each year, th~ equivalent of about one-quarter of a full-tim.e patrol car. However, in those cas~s where th~. alarm IS for an actual crime, the apprehensIOn prOba?lhty ~ot~ld be very high/ I so that the assignment of high. pnonty service to all alarm soundings is probably an effiCient aIlocation of resources.
New low-cost private alarm systems that can automatically send prerecorded messages dir~ctly t? the police arc being developed and may become WIdely ms.ta!~e~l. A~ a consequence, the police should expect a slgmficant n~crease in the number of false alarms. To prevent thIS increase from seriously disrupting police operations, police departments shoul~ establi~h minimuo: sta~dards .for direct-calling alarm mstallatlOns. On-sIte. msp;:ctIOn should be required to assure that the alarm Itself IS ;nechanicaIly and electrically reliable (usually not a senous problem), that its installation is .not sL~bject to simple. a~cidental failure (as from a blowmg wlOd), and that It IS not subject to accidental triggering by the occupants. The false-alarm rate can be reduced by means such as using two different detection sensors, increasing the sensitivity of each, and requiring simultaneous triggering of both to establish an alarm.
POLICE VEHICLES
(Juce a crime is detected, the information concerning it is communicated to the police, the appropriate police response is selected, and orders are communicated to the patrol force .. Travel time in reachin~ the crime sCf;~e is the largest slOgle component of pollee resp.jl1se tIlne. While the patrol car will undoubtedly continue as the primary police vehicle, the more specialized roles of other kinds of vehicles need further exploration. Many cities are now using motor scooters or bicycles to give their foot patrolmen added mobility. At the other extreme, helicopters offer a potential for demonstrating a police presence, for searching a large patrol area and for responding rapidly (over 100 miles pel' hour) to an emergency call when the action is taking plaee in the streets, on rooftops, or on highways,l2 Theil' pocential has not yet been adequately explored.
Despite the other possibilities, the conventional patrol cal' will continue to dominate the police scene. For the patrol officer, it serves as his office, means of locomotion and pursuit, observation post, and van for transporting prisoners. Most police cars are merely stock sedans, with a flashing light and radio installed, and perhaps with a modified engine. Since it costs about $100,000 per year to maintain a two-man car on continuous patrol,ta it would be surprising if the operation could not be appreciably improved by a capital investment of more than the curnmt $3,000 per car. ----_ .. _-_._--- .-~---~ ----
1\ In rhe Los Angr.lcs apprehension study, there were 24 actual burglaries reportetl b)' nlanns. Seven arrests were malin by the responding palrol. This clearance rate i8 twice 118 high na lor the other burglnrit's in the ermple.
]V Tho Los AnAeles County Sheriff', Office, with the support of tho Office of Law El1ror(':("u\cnt AlUIlstancc, is now e\'1I1untln~ the pAtrol cffecth'cncs8 of ht:llcoptcrs.
13 Co",illering "Bcations, sick timc, ctc., It Hakes Ilbout 10 patrolman-years to
The Federal Government should sponsor a design competition and support the development of an experimental police car. It could incorporate a wide variety of practical innovations, such as convenient radio controls, teletypewriter, camera and equipment for collecting evidence, various nonlethal weapons, magnetometers for detecting the presence of conceale::: weapons, spotlights, mirrors and other viewing devices to improve visibility, and dictating equipment for filing of reports and recording confessions. Continual use 'Of the radio and frequent necessity for written record-keeping suggest a rearrangement of the interior to facilitate these functions. Development of the new design should include human factor considerations derived from a study of the patrol operation. Such a car would provide a useful prototype for testing new equipment, and would stimulate police departments to reconsider how they might use their vehicles.
NONLETHAL WEAPONS I3n
A patrol officer, in meeting the diverse criminal situations he must face, has a limited range of weaponryeither the short-range nightstick or the potentially lethal handgun. He should have other possibilities to help him do his job while minimizing the danger of excessive injury or public antagonism. If an officer feels that his life is threatened, he may have to shoot, with the attendant risk that suspects or bystanders may be killed. In many situations, however, he may not be in immediate mortal danger, but his nightstick may be inadequate, either because the target is out of range, there are too many people to handle, or it may inflict more severe injury than the situation warrants. Relevant situations involving one or a few officers include:
Apprehending a fleeing suspect.
Apprehending an individual in a closed building.
Subduing a belligerent person under the influence of alcohol.
Restraining a psychotie intent upon attacking bystanders or upon self-destruction. .
A larger group of officers may be confronted with a number of people who must be controlled, channelized, or dispersed, as in the case of public riots, prison riots and gang rumbles. If a suitable range of graduated alternatives were available, and if there is time for weapon selection, then officers could use the weapons most appropriate to the situation.
For a nonlethal weapon to be 'an acceptable replacement for a handgun, it must incapacitate its victim at least as fast as a gun. Even then there might be opposition to it. A criminal knowing that he cannot be killed might act more aggresively than he would facing a gun. The qualities that must be sought in a general purpose nonlethal weapon are almost immediate incapacitation and little risk of permanent injury to the individual who is the target. It must also meet size, weight, and other
maintnin n 2·mnn cnr on continuous patrol. One patrolman.year, including over· head, costs in the order of S10.000.
1311. This material is covered Inore complete1y in u report, UNonlethal Weapons for Usc by United States Law Enforcement Officers," now in preparation. The report will be nval1~ble from the Clearinghouse lor Federal Scientific and Tech .. nical In{ormation of the National Bureau of Standards.
operational standards. Survey of a wide range of possibilities leads to the conclusion that these requirements cannot be met by current technology. For example, darts have been used to inject tranquilizing drugs into animals. However, the drugs presently available offer too great a risk because of the close correspondence between the dose required to incapacitate quickly and a lethal dose. No nonlethal weapon is presently available that could serve as a replacement for the handgun, but a continuing effort to achieve such a weapon sho~l~ be pursued. In this connection the products of mIlItary research should be continually examined for possible applicability.
When a nonlethal weapon is considered as a supplement to, rather than replacement for, the policeman's gun, the requirements for immediate incz,pacitation can be relaxed. Supplemental nonlethal weapons, such as dispensers of tear gas or CS gas or liquid solutions, might be used temporarily to disn.:pt or immobilize targets in circumstances in which an officer's lif!! was not threatened.
A number of nonlethal weapon pt\ssibilities are listed in table 6 together with their' intp.i1ded physical effects (the effects which can be expected to iollow from their proper use under anticipated conditions) and their potential physical hazards (more serious effe( ts which might result from impmper use or from proper usc: under unanticipated cond\tions). The list is presented to indicate the range of possibilities that have been proposed by various people, and not to indicate1:hat all or even most are desirable for use in any particular situation. For most
15
of these devices, for instance, there is no evidence to determine whether the intended physical effects, even when achieved, result in a drsired behavioral response.
With few exceptions, all techniqut;s must be recognized as presenting at least some secondary, if not primary, risks to health and safety. In addition, some of the techniques without major risks, such as the electric prod, can be personally degrading, and even their use in noncriminal situations must be carefully considered. Others, such as dogs, may have become sufficiently inflammatory symbols in certain mob situations as to warrant careful consideration of the;r use despite their general effectiveness.
Some of the ejector weapons listed in table 6 can be employed with any of a number of different encapsulated solid, liquid or gaseous nonlethal agents. The effects and hazards of such weapons (such as dart guns) depends on the specific agent used rather than the weapon itself. A few such agents are listed in table 7 together with their intended physical effects and potential physical hazards.
Tables 6 and 7 include devices and materials that are not properly "weapons" in the narrow sense, but which may be useful for marking people or vehicl~ (dyes, odorants) for later identification and apprehension.
As is evident from tables 6 and 7, a broad spectrum of difi'ercnt effects can be achieved. Certain difficulties are encountered, however, when a weapon is sought which will achieve its intended effects within a couple of seconds or with minimal potential hazards. For ey.ample, onset time of injected agents depends upon transit time through
Table 5.-Some Possible Nonlethal Weapons
Nonlr;!hal weapon Intended physical effects
Gun aimed at na,'vital area............... .•• Immediate partial incapacitation ..................... : ......... . Baton........ . ......................... Partial immobilization and Injury ............................... . Dogs..... ••• .. ....................... Partia I Immobilization ........................... """"'"'''' Water hose.. • .................... Knocking victim down ......................................... . Electric prod~ ...................... Shock inducing desired movemenL. ........................... .. Nontoxic sma. ... ................. Disruption 01 vision ........................................... . Stench bomb.. .. ................... Extreme olfactory discomlort Inducing departure Irom area ....... .. Particle proje*, ",~., ':lOt~un)............. Trauma from impacL. ........................................ . Injector dart &1'.'.. ......... .............. Incapacitating agent Injected .................................. _
Liquid electr., (e.g., pistol, balon)............ Incapacitating agent applied exlernally to eyes or respiratory system .• Splatter dart gun .............. __ ........... liquid incapacitating agent applied externally .................... . Gas dispenser............... .............. Incapacitating agent Inspired .................................. . Gas dart gun ............................. Gaseous incapacitating agent inspired ........................... .
Potential physica I hazards
Permanent injury or death. Excessive Injury. lacerations. Injury resulting from fall. Minor. Minor. Minor. Serious or lethal wounds. Wounds, death or serious illness due to overdose; impact on sensl·
tive or vital area; infection. Depends on toxicity of agent. Depends on t~x icity of agent. Depends on toxicity of agent. Depends on toxicity of agent.
Table 7.-Some Possible Agents for Nonlethal Weapons
Nonlethal agent Means of delivery I Physical effects intended Potential physical hazards
CN (tear gas) (achloraceto· Gun or bomb .............. Induces tearing (disrupting viSIOn), itching of skin within seconds. Minor. rfhenone).
Minor. C (solution) ................... liquid ejector ............. Same as eN <tear gas) ...................................... CS ............................. Gun or bomb .............. Induces within 20-60 seconds tearing, itchin~, coughing, respira· Eye damage If rubbed when und~r ellect of CS;
to~ distress, stinfing on moist skin (e.g .• ips), sinus irritation n~usea and vomiting II CS inJe~ted.
Tranquilizer .................... (e ects on vision ast for about 10 minutes).
Serious Illness due to overdose (since dosage de· Injector dar!.. ............ Relaxation or immobilization .................................. pends on bodl weight, etc.),
Organic Acids (e.g., formic, lactic, ••••• do ••••••• _ ........... Induces extreme pain within seconds followed by analgesia for Serious Illness uo to overdose • acetic). 10 to 20 minutes.
Odorants ....................... Splatter dar!.. ............ Marked for laterldentilication ................................. Miner. Nontoxic dyes ................... Splatter dart or spray ...... ••••• do ••••••••••••••••••••••••• , ........................... Minor.
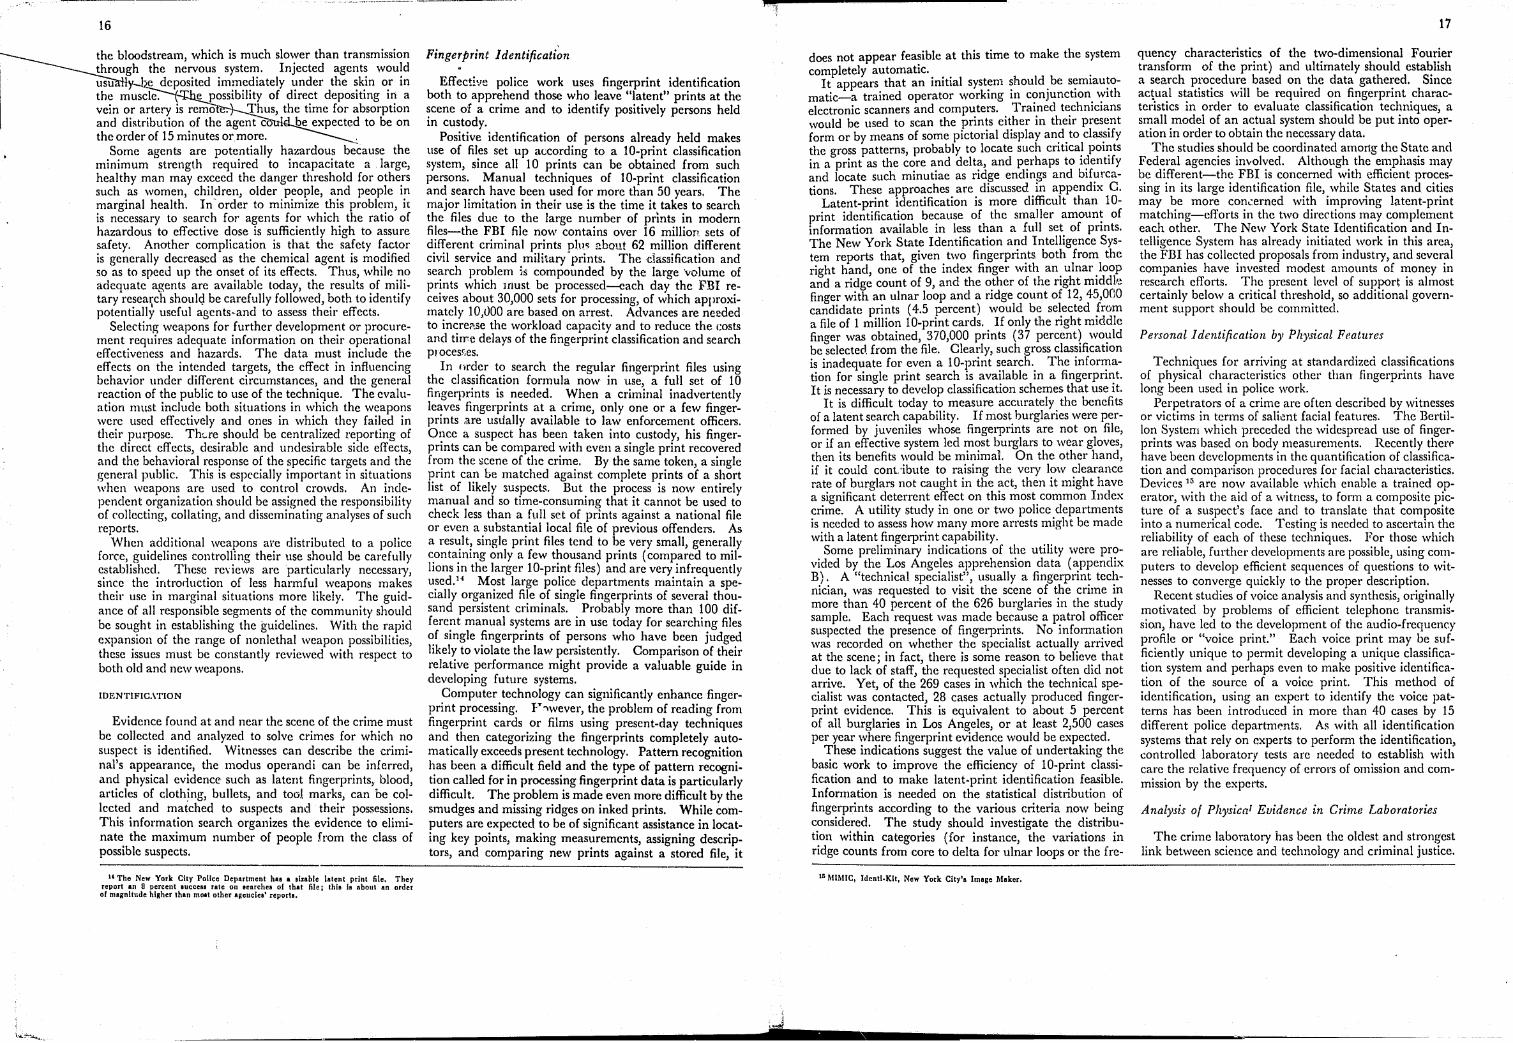
16
~he bloodstream, which is much slO\~er than transmission
I through the nervous system. Injected agents would I usu Le dcposited immediately under the skin or in
I the muscle. e possibility of direct depositing in a vein or artery is remo. Thus, the time for absorption and distribution of the agent c be expected to be on the order of 15 minutes or more. .
Some agents are potentially hazardous because the minimum strength required to incapacitate a large, healthy man may exceed the danger threshold for others such as women, children, older people, and people in marginal health. In' order to minimize this problem, it is necessary to search for agents for which the ratio of hazardous to effective dose is sufficiently high to assure safety. Another complication is that the safety factor is generally decreased as the chemical agent is modified so as to speed up the onset of its effects. Thus, while no adequate agents are available today, the results of military resea~ch shoulQ be carefully followed, both to identify potentially useful agcnts-and to assess their effects.
Selecting weapons for further development or procurement requires adequate information on their operational effectiveness and hazards. The data must include the effects on the intended targets, the effect in influencing behavior under different circumstances, and the general reaction of the public to use of the technique. The evaluation must include both situations in which the weapons were used effectively and ones in which they failed in their purpose. Tht.re should be centralized reporting of the direct effects, desirable and undesirable side effects, and the behavioral response of the specific targets and the general public. This is especially important in situations when weapons arc used to control crowds. An independent organization should be assigned the responsibility of collecting, collating, and disseminating analyses of such reports.
When additional weapons are distributed to a police force, guidelines controlling their use should be carefully established. These reviews are particularly necessary, since the introduction of less harmful weapons makes their use in marginal situations more likely. The guidance of all responsible segments of the community should be sought in establishing the guidelines. With the rapid expansion of the range of nonlethal weapon possibilities, these issues must be constantly reviewed with respect to both old and new weapons.
lDENTIFIC.\1'ION
Evidence found at and near the scene of the crime must be collected and analyzed to solve crimes for which no suspect is identified. Witnesses can describe the ·criminal's appearance, the modus operandi can be inferred, and physical evidence such as latent fingerprints, blood, articles of clothing, bullets, and too.l marks, can be collected and matched to suspects and their possessions. This information search organizes the evidence to eliminate the maximum number of people from the class of possible suspects.
U The New York City Pollee Deparlment h ... ,Izable latent print file. They report an 0 percent ,ucecsl fate on learchca of that file: Ihie h, about an order of magnitude higher than mOlt other agencies' report ••
Fingerprint 1 dentificati~n
Effective police work uses fingerprint identification both to apprehend those who leave "latent" prints at the ~cene of a crime and to identify positively persons held m custody.
Positive identification of persons already held makes use of files set up according to a lO-print classification system, since all 10 prints can be obtained from such persons. Manual techniques of lO-print classification and search have been used for more than 50 years. The major limitation in their use is the time it takes to search the files due to the large number of prints in modern files-the FBI file now contains over 16 million sets of different criminal prints phl~ about 62 million different civil service and military' prints. The classification and search problem is compounded by the large 'volume of pr!nts which Jrlust be processed-each day the FBI recel'.·es about 30,000 sets for processing, of which approximately lO,uOO are based on arrest. Advances are needed to incret'.se the workload capacity and to reduce the costs and titre delays of the fingerprint classification and search ploceSf,es.
In order to search the regular fingerprint files using the classification formula now in use, a full set of 10 fingerprints is needed. When a criminal inadvertently leaves fingerprints at a crime, only one or a few fingerprints ,are usually available to law enforcement officers. Once a suspect has been taken into custody, his fingerprints can be compared with even a single print recovered fr~m the l:lcene of the crime. By the same token, a single I?nnt ca!l be matched against complete prints of a short lIst of lIkely suspects. But the process is now entirely manual and so time-consuming that it cannot be used to check less than a full set of prints against a national file or even a substantial local file of previous offenders. As a res~lt! single print files tend to h.e very small, generally contammg only a few thousand pnnts (compared to millions in the larger lO-print files) and are very infrequently used. 14 Most large police departments maintain a specially organized file of single fingerprints of several thousand persistent criminals. Probably more than 100 different manual systems a.re in use today for searching files of single fingerprints of persons who have been judged likely to violate the law per3istently. Comparison of their relative performance might provide a valuable guide in developing future systems.
Computer technology can significantly enhance fingerprint processing. Y"wever, the problem of reading from fingerprint cards or films using present-day techniques and then categorizing the fingerprints completely automatically exceeds present technology. Pattern recognition has been a difficult field and the type of pattern recognition called for in processing fingerprint data is particularly difficult. The problem is made even more difficult by the smudges and missing ridges on inked prints. While computers are expected to be of significant assistance in locating key points, making measurements, assigning descriptors, and comparing new prints against a stored file, it
does not appear feasible at this time to make the system completely automatic.
It appears that an initial syst~m ~hould. be s~miau~omatic-a trained operator workmg 111 conjunctIOn With electronic scanners and computers. Trained technicians would be used to scan the prints either in their present form or by means of some pictorial display and to classify the gross patterns, probably to locate such critica! poi~ts in a print as the core and delta, and perhaps to Identify and locate such minutiae as ridge endings and bifurcations. These approaches are discussed in appendix C.
Latent-print identification is more difficult than 10-print identification because of the smaller amoun! of information available in less than a full set of prmts. The New York State Identification and Intelligence System reports that, given two fingerprints both from the right hand, one of the index finger with an ulnar loop and a ridge count of 9, and the other of the right middl,t finger with an ulnar loop and a ridge count of 12,45,000 candidate prints (4.5 percent) would be selected from a file of 1 million 10-print cards. If only the right middle finger was obtained, 370,000 prints (37 percent) would be selecteel. from the file. Clearly, such gross classification is inadequate for even a lO-print search. The information for single print search is available in a fingerprint. It is necessary to develop classification schemes that use it.
It is difficult today to measure accurately the benefits of a latent search capability. If most burglaries were performed by juveniles whose fingerprints are not on file, or if an effective system led most burglars to wear gloves, then its benefits would be minimal. On the other hand, if it could cont:ibute to raising the very low clearance rate of burglars not caught in the act, then it might have a significant deterrent effect on this most common Index crime. A utility study in one or two police departments is needed to assess how many more arrests might be made with a latent fingerprint capability.
Some preliminary indications of the utility were provided by the Los Angeles apprehension data (appendix B). A "technical specialist", usually a fingerprint technician, was requested to visit the scene of the crime in more than 40 percent of the 626 burglaries in the study sample. Each request was made because a patrol officer suspected the presence of fingerprints. No infonnation was recorded on whether the specialist actually arrived at the scene; in fact, there is some reason to believe that due to lack of staff, the requested specialist often did not arrive. Yet, of the 269 cases in which the technical specialist was contacted, 28 cases actually produced fingerprint evidence. This is equivalent to about 5 percent of all burglaries in Los Angeles, or at least 2,500 cases per year where fingerprint evidence would be expected.
These indications suggest the value of undertaking the basic work to improve the efficiency of 10-print classification and to make latent-print identification feasible. Information is needed on the statistical distribution of fingerprints according to the various criteria now being considered. The study should investigate the distribution within categories (for instance, the variations in ridge counts from core to delta for ulnar loops or the fre-
10 MIMIC, Idenli.Klt, New York City'. Image Maker.
17
quency characteristics of the two-dimensional Fourier transform of the print) and ultimately should establish a search procedure based on the data gathered. Since actual statistics will be required on fingerprint characteristics in order to evaluate classification techniques, a small model of an actual system should be put into operation in order to obtain the necessary data.
The studies should be coordinated among the State and Federal agencies involved. Although the emphasis may be different-the FBI is concerned with efficient processing in its large identification file, while States and cities may be more concerned with improving latent-print matching-efforts in the two directions may complement each other. The New York State Identification and Intelligence System has already initiated work in this area, the FBI has collected proposals from industry, and several companies have invested modest amounts of money in research efforts. The present level of support is almost certainly below a critical thres~old, so additional government support should be committed.
Personal 1 dentification b'y Physical Features
Techniques for arriving at standardized classifications of physical characteristics other than fingerprints have long been used in police work.
Perpetrators of a crime are often described by witnesses 01' victims in terms of salient facial features. The Bertillon System which preceded the widespread use of fingerprints was based on body measurements. Recently therr have been developments in the quantification of classification and comparison procedures for facial characteristics. Devices 15 are now available which enable a trained operator, with the aid of a witness, to form a composite picture of a suspect's face and to translate that composite into a numerical code. Testing is needed to ascertain the reliability of each of these techniques. For those which are reliable, further developments arc possible, using computers to develop efficient sequences of questions to witnesses to converge quickly to the proper description.
Recent studies of voice analysis and synthesis, originally motivated by problems of efficient telephone transmission, have led to the development of the audio-frequenc.y profile or "voice print." Each voice print may be sufficiently unique to permit developing a unique classification system and perhaps even to make positive identification of the source of a voice print. This method of identification, using an expert to identify the voice patterns has been introduced in more than 40 cases by 15 different police departmfc'nts. Af. with all identification systems that rely on experts to perform the identification, controlled laboratory tests are needed to establish with care the relative frequency of errors of omission and commission by the experts.
Analysis of Ph,'sica/ Evidence in Crime Laboratories
The crime laboratory has been the oldest and strongest link between science and technology and criminal justice.
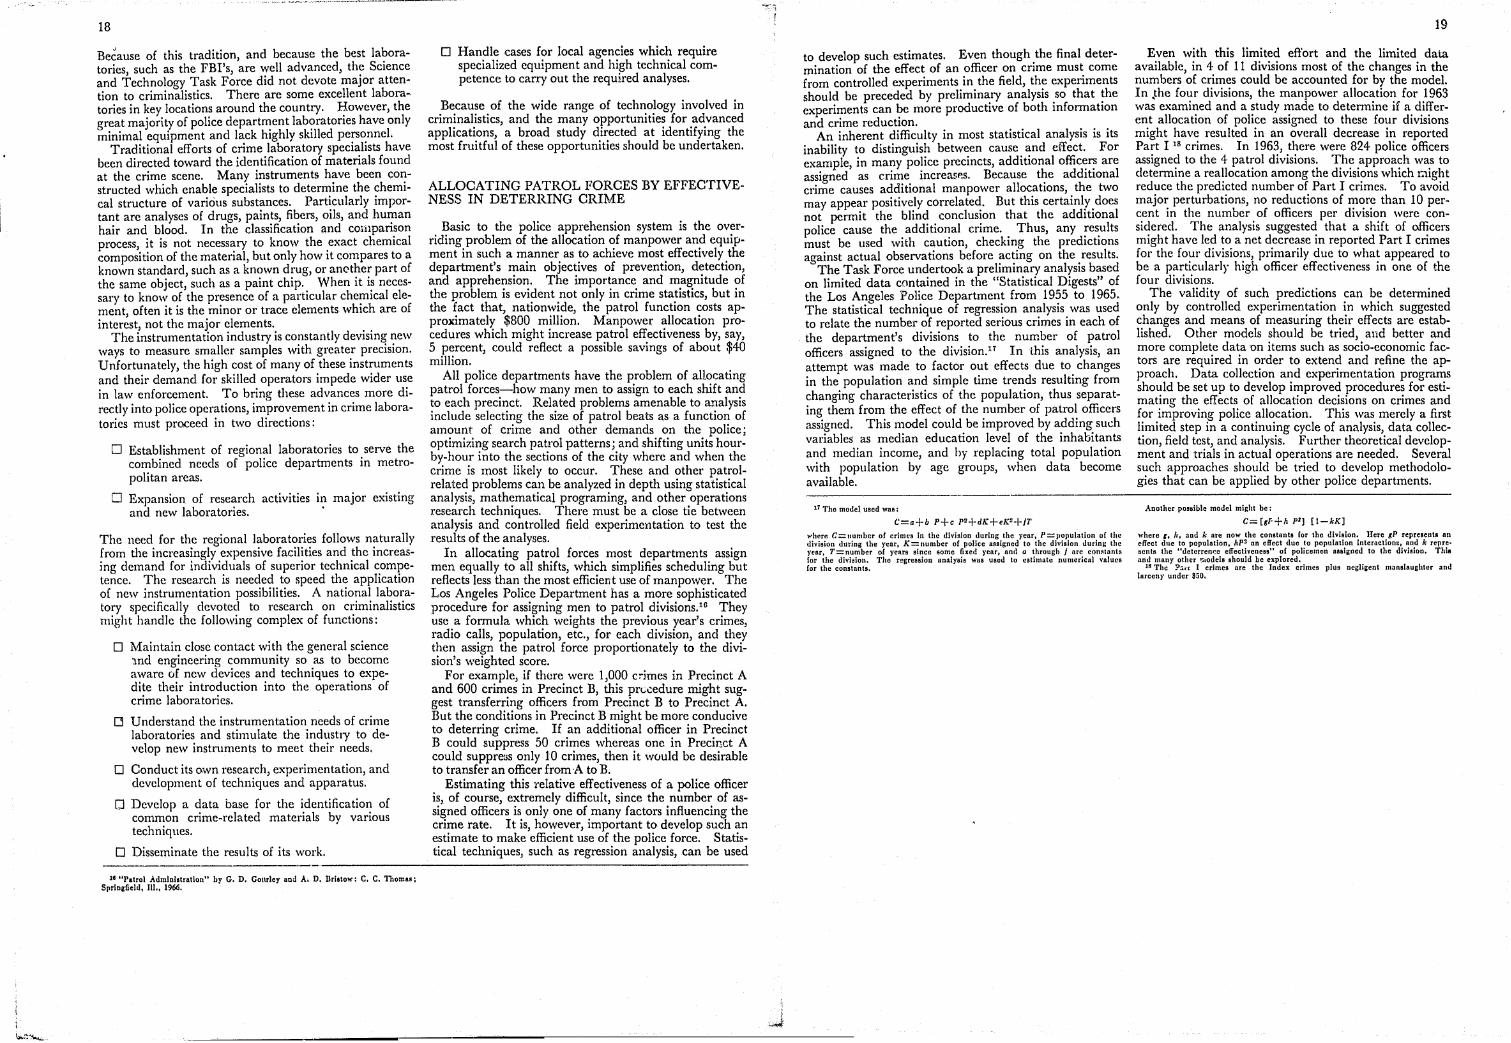
18
Be~ause of this tradition, and because the best laboratories such as the FBI's, are well advanced, the Science and Technology Task Force did not devote major attention to criminalistics. There are some excellent labora~ tories in key locations around the country. However, the great majority of police department lab?ratories have only minimal equipment and lack highly skilled perso.nnel.
Traditional efforts of crime laboratory specialIsts have been directed toward the identification of materials found at the crime scene. Many instruments have been constructed which enable specialists to determine the chemical structure of various substances. Particularly important are analyses of drugs, paints, fibers, oils, and human hair and blood. In the classification and comparison process, it is not necessary to know the exact chemical composition of the material, but only how it compares to a known standard, such as a known drug, or ancther part of the same object, such as a paint chip. When it is necessary to know of the presence of a particular chemical element, often it is the minor or trace clements which are of interest, not the major clements.
The instrumentation industry is constantly devising new ways to measure smaller samples with greater precision. Unfortunately, the high cost of many of these instruments and their demand for skilled operators impede wider use in law enforcement. To bring these advances more directly into police operations, improvement in crime laboratories must proceed in two directions:
o Establishment of regional laboratories to serve the combined needs of police departments in metropolitan areas.
o Expansion of research activities in major existing and new laboratories. .
The need for the regional laboratories follows naturally from the increasingly expensive facilities and the increasing demand for individuals of superior technical competence. The research is needed to speed the application of new instrumentation possibilities. A national laboratory specifically devoted to research on criminalistics might handle the following complex of functions:
D Maintain close contact with the general science :md engineering community so as to become aware vf new devices and techniques to expedite their introduction into the operations of crime laboratories.
Cl Understand the instrumentation needs of crime laboratories and stimulate the industIy to develop new instruments to meet their needs.
D Conduct its own research, experimentation, and development of techniques and apparatus.
[] Develop a data base for the identification of common crime-related materials by various techniques.
D Disseminate the results of its work.
1< "Patrol Administration" by G. D. GOllrley and A. D. Dristo,,': C. C. 'Thoma.; Springfield, Ill .. 1966.
D Handle cases for local agencies which require specialized equipment and high technical competence to carry out the requi.red analyses.
Because of the wide range of technology involved in criminalistics, and the many opportunities for advanced applications, a broad study directed at identifying the most fruitful of these opportunities should be undertaken.
ALLOCATING PATROL FORCES BY EFFECTIVENESS IN DETERRING CRIME
Basic to the police apprehension system is the overriding problem of the allocation of manpower and equipment in such a manner as to achieve most effectively the department's main objectives of prevention, detection, and apprehension. The importance and magnitude of the problem is evident not only in crime statistics, but in the fact that, nationwide, the patrol function costs approximately $800 million. Manpower allocation procedures which might increase patrol effectiveness by, say, 5 percent, could reflect a possible savings of about $40 million.
All police departments have the problem of allocating patrol forces-how many men to assign to each shift and to each precinct. Related problems amenable to analysis include selecting the size of patrol beats as a function of amount of crime and other demands on the police; optimizing search patrol patterns; and shifting units hourby-hour into the sections of the city where and when the crime is most likely to occur. These and other patrolrelated problems can be analyzed in depth using statistical analysis, mathematical programing, and other operations research techniques. There must be a close tie between analysis and controlled field experimentation to test the results of the analyses.
In allocating patrol forces most departments assign men equally to all shifts, which simplifies scheduling but reflects less than the most efficient use of manpower. The Los Angeles Police Department has a more sophisticated procedure for assigning men to patrol divisions.10 They use a formula which weights the previous year's crimes, radio calls, population, etc., for each division, and they then assign the patrol force proportionately to the division's weighted score.
For example, if there were 1,000 c:-imes in Precinct A and 600 crimes in Precinct B, this pn,;.::edure might suggest transferring officers from Precinct B to Precinct A. But the conditions in Precinct B might be more conducive to deterring crime. If an additional officer in Precinct B could suppress 50 crimes whereas one in Precinct A could suppress only 10 crimes, then it would be desirable to transfer an officer from A to B.
Estimating this relative effectiveness of a police officer is, of course, extremely difficult, since the number of assigned officers is only one of many factors influencing the crime rate. It is, however, important to develop such an estimate to make efficient use of the police force. Statistical techniques, such as regression analysis, can be used
... ". . .., . ,
to develop such estimates. Even though the final determination of the effect of an officer on crime must come from controlled experiments in the field, the experiments should be preceded by prelimina.ry analysis .so that ~he experiments can be more productIve of both mformatlOn and crime reduction.
An inherent difficulty in most statistical analysis is its inability to distinguish between cause and effect. For example, in many police precincts, additional offic«7r:' are assigned as crin;e. increasp.s. Because t~e addItional crime causes addItional manpower allocations, the two may appear positive.ly correlate~. But this certainly. does not permit the blInd conclUSIOn that the addItional police cause the additional crime. Thus, any results must be used with caution, checking the predictions against actual observations before acting on the results.
The Task Force undertook a preliminary analysis based on limited data contained in the "Statistical Digests" of the Los Angeles Police Department from 1955 to 1965, The statistical technique of regression analysis was used to relate the number of reported serious crimes in each of the department's divisions to the number of patrol officers assigned to the divisionY In this analysis, an attempt was made to factor out effects due to changes in the population and simple time trends resulting from changing characteristics of the population, thus separating them from the effect of the number of patrol officers assigned. This model could be improved by adding such variables as median education level of the inhabitants and median income, and by replacing total population with population by age groups, when data become available.
1.7 The model used was:
C=a+b P+c P'+dK+eK"+IT
~'hcrc C=lIumbcr of crimes In the division during the year, P=Jlopuiation of the division during the year, K= number of police assigned to the division during the )'cnr, T=number of years since some fixed year, nnrl a through I arc constants {or the divhlion. The regression analysis was uscd to estimate numerical valucs for the constants.
19
Even with this limited effort and the limited data available, in 4 of 11 divisions most of the changes in the numbers of crimes could be accounted for by the model. In ,the four divisions, the manpower allocation for 1963 was examined and a study made to determine if a different allocation of police assigned to these four divisions might have resulted in an overall decrease in reported Part I 18 crimes. In 1963, there were 824 police officers assigned to the 4 patrol divisions. The approach was to determine a reallocation among the divisions which r.1ight reduce the predicted number of Part I crimes. To avoid major perturbations, no reductions of more than 10 percent in the number of officers per division were considered. The analysis suggested that a shift of officers might have led to a net decrease in reported Part I crimes fot' the four divisions, primarily due to what appeared to be a particularly high officer effectiveness in one of the four divisions.
The validity of such predictions can be determined only by controlled experimentation in which suggested changes and means of measuring their effects are established. Other models should be tried, and better and more complete data 'on items such as socio-economic factors are required in order to extend and refine the approach. Data collection and experimentation programs should be set up to develop improved procedures for estimating the effects of allocation decisions on crimes and for improving police allocation. This was merely a first limited step in a continuing cycle of analysis, data collection, field test, and analysis. Further theoretical development and trials in actual operations are needed. Several such approaches should be tried to develop methodologies that can be applied by other police departments.
Another possible model might be:
C=[«f-+h P'] [1-kK]
where It Jr, ODd k are now the constants for the division. Here ,p represents an effect due to populntion, hP~ an effect due to popUlation internctioml, Rnd Ie repre. scnts the Hdeterrenl!c effectiveness" of policemen Rssigned to the divldon. Thill and many olher ~,odels should be explored.
18 The P.1rt I crimes are the Index crimes plua ncg1i(::ent manslaughter and larceny under $50.

!
Chapter 3
Police Operations-Communications, COlllm3Lnd and C()ntrol
Many af,pects of a police department's patrol operation may be .'likened to a living organism, with HCI1S0ry organs, nerve networks, a central brain, and motor extremities. Its sensory organs include the meam of detecting crime: patrolling officers, alarms, surveillance devices, witnesses, and victims. The primary :lnput network is the public telephone system, and the output network is the mobile police radio network. The I~Olll1terpart of the brain is the police communications center, which receives the public's calls and dispatches the patrol f )rce in response. The major extremities are the patrol officers who take field action.
With the accelerating trends in telephone ownership,lU motorization of the police force, and use of two-way radios for police communications, this network l.taS assumed increasing importance. The needs for improvement have expanded faster than its technological development. Fortunately, the potential for improvement is probably greater here than in any other aspect of police operations. The developments to meet the military needs for portable communications equipment ancl for command and control of military forces provide an exte\lsiw reservoir of untapped capability.
COMMAND AND CONTROL
"Command and control" is military terminology for the planning, direction, and control of operations. It involves the organization of personnel and facilities to perfonn the functions of planning, situation intelligence, force status monitoring, decision making, and execution. These concepts can also be applied to analogous police operations, leading to the possibility that command and control technology might also be applied. Before discussing these possibilities, present police command and control operations will be described.
PRESENT POLICE COMMAND AND CONTROL OPERATIONS
In most police depart.mp'lts, command and control is performed in the communications center, the focal point of almost all the public's calls to the police. Figure 6 depicts a typical communications center in a large city. Situated in an area of approximately 1,000 square feet are several telephone answering stations i a n:umber of
10 Tlwre nrc over 93 million telephones in the United Stales. ("Statisticnl ,\b.str~ct of the United State!', 1966;" D(1partmcnt or Commerce; Go\'ernment I "nllng Office, Wa.hlngton, D.C. 1966.)
radio dispatchers; a board designed to show the patrol beat assignments and the availability of each patrol c,a1'; and associated devices such as clocks and time stamps. Files of street locations, stolen automobiles, and wanted persons are usually present or readily available via telephone, teletype, or pneumatic tube stations.
fiGURE 6. TYPI,CAL COMMAND·AND·CONTROl CENTER
[ STATUS BOARD
TELETYPE] TELETYPE
I STATUS BOARD I CDISPATC~ I STATUS BOARDI CONTROL ~ CONTROL
I TWO-WAY RADIO J TO PATROL FORCE I i~~;~~YL ~I~ I
~
I WARRANTS AND STOLEN I ALARM BOARD AUTO FILE n 0
I ~
COMPLAINT I !( I COMPLAINT I CLERK m CLERK
'" CD m
I TELEPHONE I !:i I TELEPHONE I SWITCHBOARD SWITCHBOARD
A call for help first appears as a blinking light on a complaint clerk's telephone switchboard. If all the clerks are busy, the caller must wait until a clerk completes an earlier call. The waiting time depends on the rate of calls, which varies markedly with time of day, and on the number of complaint clerks. There is usually a sufficient number of trunk lines so that busy signals are rare.
21
I
------------------------------------.... ' .... --------------------------------------~~

22
Obviously, the urgency of a cal! cannot. be eyaluated until it is answered. It may concern a cnme In progress, a report on an old c~'ime, or a fami.ly dispute. Only af~er he answers a call, In order of arrival, can the complamt clerk determine tlw type of' call, its urgency, and the location of the incident. If he then decides that a car should be dispatched, he writes the information on a tlmestamped "complaint card" and sends it to a dispatcher by a conveyor belt, pneumatic. tube, or by ha~1d. For extreme emergency calls, he nllght alert the dispatcher to switch into the wlephone conversation: he at least indicates the emergency nature of the call on the complaint carel. The dispatcher, :\"hcn ch?o~ing the next card, takes the one with the highest prIOrity. Usually, his only information about the call is the information on the carel; he rarely participates in the telephone conversation.
The dispatcher must translate the address of the incident into a patrol district in order to find. the car. to assig·n. He may have to refer to a map or a city locatIOn file,' but he is usually sufficiently familiar with the city to do it by memory fIe then checks a status board to see if his selected car, the one he believes to be the closest, is available. At present, the actual location of a patrol car within its assigned beat (generally a radius of 1 to 4 miles) is unknown. Therefore, on an emergency eall such as a crime in progress, the call may be broadcast to all units; those within a suitable distance of the scene go to the annollnced address. This usually brings the closest car, but often results in diverting many unnecessarily. There are many instances, however, when the closl~st car does not respond at all, since a patrolman in an adjacent beat may not be aware that he is closest to the scene. On a lower priority call one specific car will be dispatched. Once the dispatch order is acknowledged, the dispa~cher time .. stamps the card, places it in an active tray, and updates the status board.
There obviously exist many variations to the dispatching function described abov~. In some centers,. the same person serves as the complamt clerk and the chspatcher. This arrangement normally requires the individual to be familial' with the addresses over the entire city. In larger cities, where this may be a problem, he may be made responsible for only a part of a city. Then, only those calls originating in his area should reach him; this can be accomplished automatically by making the assigned areas congruent with areas sharing common telephone switching centers. Some cities have current status boards and lights; other cities rely on out-of-date maps or no maps at all. Some cities have backup telephone positions to reduce the telephone waiting time, others have none.
The existing facilities for command and control are especially taxed during general emergency situations such as riots or natural disasters. The communications load increases enormously due to the deployment of many more officers in the field and the general alann of the public, resulting in telephone switchboards and radio channels becoming completely saturated. The problems are especially complicated by the requirement to main-
tain reasonable patrol service in areas not directly affected by the emergency.
Most police department~ maintain separate fixed and mobile command and communications facilities for use in such emergencies. Nevertheless, the command requirements of information gathering and coordination of large numbers of units (including other agencies such as fire depart •• '1ts, othel" police departments, and National Guard li:' 'Y) pose great problems to present police command and control systems.
The discussion of present operations suggests a number of critical command and control problems that seriously limit police depal.'tments' operational effectiveness:
o Although a great deal of information about cal' status and details of a call flows through the communications center, little of itcan be readily recalled by whomever may need it. The center gets very little feedback on the results of its actions.
o At best, the location of patrol cars is only crudely given by their beat assignment.
o The communications center del a)' is a significant part of the total response time. Studies in Los Angeles indicate that on the average it takes 1.5 minutes for a priority call and 5.9 minutes for a nonpriority call to be processed through the communications center. The patrol cars take an average of 3.8 and 6.8 minutes to reach the scene of the crime in cases of priority and nonpriority calls, respectively. Hence, the communications (;enter accounts for 30 to 50 percent of the total delay.
o Most large-city police departments are faced with a severe radio spectrum congestion problem resulting in radio communication queues of patrol officers trying to reach their dispatchers. This situation will grow worse in the future as more cars and radios are added.
o Staffing is a perennial problem for the police and, as the size ap-d complexity of an operation grows, merely adding more people is not the answer. The problems of information transfer and coordination increase severely as more people are added.
o A city seeking to improve its operations has no guidelines on how best to design and organize a communications center. The great variability in approach from city to city, coupled with the lack of experimental evaluation of different methods, prevent any consensus on technical or operational approaches.
o Contingency planning for command and control during emergency situations such as riots or disasters has been negkcted by many police depal'tments.
POTENTIAL CONTRIBUTIONS OF SCiENCI, AND TECHNOLOGY
There are three ways in which science and technology can help address these problems. The first is conceptual-analyzing the process and drawing on insights
'W4 \
gained in previous related analyses such as those conducted for military ~ommand anc~ con.trol systel?s: The second is in evaluation and modificatIOn of eXlstmg designs and procedures. The third draws oa modern computer technology.
Command and Control Concepts
Effective use of the radio-dispatched mobile patrol force requires knowing at all times where the units are and what they are doing, and matching them appropriately to the public's needs. Infonnation is the essential element in making such ass.ignment decisions: infonnation about criminal activity, the status of police resources,
23
and the environment and Jeneral circumstances in which operations must be conducted. The infol1uation must be gathered, organized) and displayed in a timely fashion so that it can be utilized for decisionmaking.
As noted earlier, these functions fit the generally accepted concept of command and control. Since the early 1950's the Department of Defense and the individual military services have been intensively developing command-and-control systems to support military commanders. Figure 7 illustrates the functions which are basic to the discharge of command responsi.bilities. The commander must know the environment and circumstances in which he must operate; this capability is provided by the situation monitoring ancl analysis function.
FIGURE 7. BASIC COMMAND-AND-CONTROL FUNCTIONS
DATA ON REQUIREMENTS
• Intelligence ---.~
• News~-------~
• Directives -----.~~I
• Requests -----l.~1
• Etc.-----... ~
DATA ON CAPABILITY
• Forces------•..• -~~
• Materie I ---... ~
• Support Forces--'
• PeBonnel ~
• Facil ities ~
• Etc. -----~
SITUATION MONITORING/I-------.
ANALYSIS
PLANNING
RESOURCE MONITORI NG/
ANALYSIS
EXECUTION OPERATIONS MONITORII'IG
,---------------------------------..... 1 ................ a. ................ __ .... ____ a~----------

24
He must have a steady flow of data on the factors concerning his capabilities; this is provided by the resource monitoring function. These data enable him to evaluate his plans and orders, and if necessary, to change them in response to the changing requirements. This is the command execution function. As events occur and plans and orders arc executed, the commander monitors the operations of his field forces and USC" this information to revise and update his estimate of ;ie current situation and his available resources. This is the operations moniloring function.
The command-and-control concepts have not been studied 01' adapted formally in the police context. It is not suggested that police departments adopt the concepts of military command-and-control systems in their entirety. Rather" they can use the general approach, drawing on the many years of research and development supported by the Department of Defense. They can ach.pt the concepts to theil' needs, and select those elements that arc pertinent. For example, one essential clement that should be incorporated into police command-and-control systems is the operations monitoring function. This facility provides "feedback" to the commander to assist him in evaluatine the effects of his decisions and to provide him with further information upon which to base his next decisions.
In both military and police work, rapid and complete information gathering, decision making, and dissemination, are of critical importance. As shown in the previous chapter, police response time can often be reduced most efficiently by speeding up the command-and-control function. Selecting the best vehicle to assign in response to a call requires knowledge at the dispatching point of the location and the status of all the Inobile units. This implies continual monitoring of the mobile force, and organization and display of the position and status information in a form convenient for decision.
In both police and military operations, decision aids and reliable communications can contribute substantially to improved performance. But the police operation in dispatching and controlling field forces, diagramed in figure 8, does exhibit important differences from military command and control. In the military operations, particularly during peacetime, considerably more emphasis is placed on planning and allocating resources for potential contingencies. In police work, planning and allocation of resources are also important, and will become more so with the application of scientific planning techniques. The heavier emphasis, however, is on the execution phase of command and control.
In a riot or other emergency situation, an emergency communications center must be established to transform a police department from a loose collection of independent units to a cohesive coordinated force. This emergency center, often separate from the regular communications center, must be closely tied to it. Means must be provided to collect and display, rapidly and continuously, all the varieties of tactical intelligenc(! relating to the location of event~ and the disposition of forces. The center and selected field units might be
FIC3IE 8. THE POLICE COIIAIIP·UP.CONTROt PROCESS
CRIMI NAL EVENT
r~~:~~f:-:-~~··.
f f; ;', , I~i'~ " 1!i~,I:.,·. ;. I: "t~t~',~,:" I ~.:r,~
!:~~f': ;. <~~: b~2.. ~ _ ~ ~(~=_c_
REPORTS
DISPATCH ORDERS
PATROL UNIT INVESTIGATION
OF EVENT
DECISION·MAXINC FUNCTION
REPORTS AND INSTRUCTIONS
MONITORING AND SUPERVISION
FIELD SUPERVISORS
equipped with a radio scrambler for greater security and with frequency-switching or other means of countering attempts to jam their communications. The emergency communications center staff must be headed by a commaneler who can assimilate this information and who has the authority to command the available forces. Contingency plans for situations that might arise and for coordination with adjacent jurisdictions must be developed and stored in a readily accessible form.
.Improvement of Existing Systems
Before considering introduction of major new technology some immediate steps can be taken to improve command-and-control operations. Improving such simple aspects of command and control as floor layouts, design of headsets and microphones, use of foot switches for radio transmitters, and clear and intelligible status displays can improve a center's operation under heavy load.
Communications center procedures and design, which can affect performance significantly under critical loads, appear to have evolved more from local tradition and physical restrictions than from careful planning. The performance of each of several different possible configurations can be experimentally measured, both in operating centers and under laboratory control in a
------,------------------------------------------
simulation laboratory. A command-and-control center operates almost entirely with telephone inputs and radio outputs. It has very little dircct physical contact with the outside world. Therefore, for experimental purposes it is easy to substitute simulated events for real ones, and to conduct tests on reasonable analogies of real situations. In this manner, standard and emergency plans and procedures can be tested, decision rules can be evaluated, and training and experience can be provided police officers under simulated extreme conditions.
Computer-Assisted Command and COll'-'-'Z
The most dramatic way technology can assist com .. mand-ancl-control operations is through the introduction of modern information processing and communication technology. To benefit fully from the technology, however, its intloduction should not be limited to simple mechanization of existing pro.::edures which were developed in the face of technological constraints that may no longer be relevant. Rather, the entire police command-and-control function, including many aspects of patrol operations, should be subjected to a basic reexamination, taking full account of the new capabiIities offered by computers and communications links. This review should consider questions of when, where, and how to use the police patrol forco. It should evaluate how police should respond to various types of routine and emergency situations. It should examine by study and by experiment the extent to which preventive patrol deters crime, how forces should be allocated by time and by geography, optimum patrol tactics, appropI1iate conditions for conspicuousness and for covertness, how to respond to riots, and many other germane questions. The patrol operations will then be able to benefit markedly from computer assistance-much more than by merely automating existing procedures.
It is possible to describe the general outli'nes of a computer-assisted command-and-control system for certain large cities.21 In such a system, depicted ill figure 9, telephone calls to the police are still answered by a complaint clerk, termed in the figure a "controller." He enters the type of incident, the address, and a priority code into a keyboard connected to a computer. The controller can specify what the situation requires: whether a one- or two-man car should be sent, whether two vehicles should respond, etc. After he decides that 'a car should be sent, the rest is then automatic.
The computer maintains records of street<address locations and the location and availability of each patrol car, ?·ndJinds the best car to respond to the call. It prepares a dIspatching order which is automatically sent to the selected car as a computer-generated voice message or by some digital data link such as teletype. If the patrol offic.er does not acknowledge the message by voice or by some srmple digital link within, say, 10 seconds, another car can be ~ent on the call.
The location file can also report the firehouse or hospital nearest the event, and physical or other characteristics of the assigned address (e.g., three-story building,
.t1110 New York City Police DeJlartment, with It. SPRINT oyolem, I • .trendy taking some 8ignificant steps in this dlrecUon.
25
location was robbed last month). This infonnation can be relayed to the field unit as it proceeds to the location. If the files of stolen automobiles ;md wanted persons are stored in the computer, the patrol officer might interrogate the computer directly via a direct data link without going through the dispatcher. This would decrease the processing time for 'such inquiries and the: amount of traffic on the voice-radio frequencies.
Burglar and othet· alanns could be linked directly to the computer. If an alann went off, the computer, knowing the alarm's location, could immediately dispatch the appropriate car without the controller's intervention.
The dispatch orders, the status of the patrol cars, events in progress, and other basic control information can be display 'Cd by the computer to command officers, who can always countermand the computer.originated orders. They can concentrate on the unusual while the computer automatically handles the routine.
The total delay time in the control center would be reduced to the time it takes for the controller to enter the information from the caller into the computer and to get the message onto the ail'. The current processing times of several minutes could be cut to 30-60 seconds. The computation time would be an insignificant part. The radio transmission time can be reduced by the use of patrol vehicle teleprinter discussed later in this chapter.
Since field response time depends strongly on the assigned car's distance from the call, automatic car-location devices could be tied directly to the command-and-control computer, so that it could find and dispatch the closest car. Cal' locater devices would permit assignment of the two or three cars closest to the scene, and if advisable, other cars could be strategically deployed along escape routes.
Fortunately, as is shown in appendix E, most of the advantages of haV'ing a car locator can be achieved with comparatively inaccurate devices, errors of about onequarter mile being acceptable.
There are four techniques that show promise of providing the necessary accuracy of an acceptable level of cost:
A system of police car emitters and callbox sensors. A modified radar transponder system. A me9ium f rcqut:pcy radio-direction-finder system. A carborne position computation and reporting sys-
tem.
These are discussed in appendix E. In the patrol car emitter-callbox sensor system each cal'
would carry some kind of a visual, acoustic, 01' electromagnetic identifying emitter that could be detected by receivers located in police and fire callboxes. Information gathered by the sensors could then be sent back to the communications center by land lines. The inverse of this technique could also be employed, with coded emitters installed along the street and sensors installed in patrol cars. A radio link would then be needed in the car to relay the car's identificatio'n and location to the communications center.
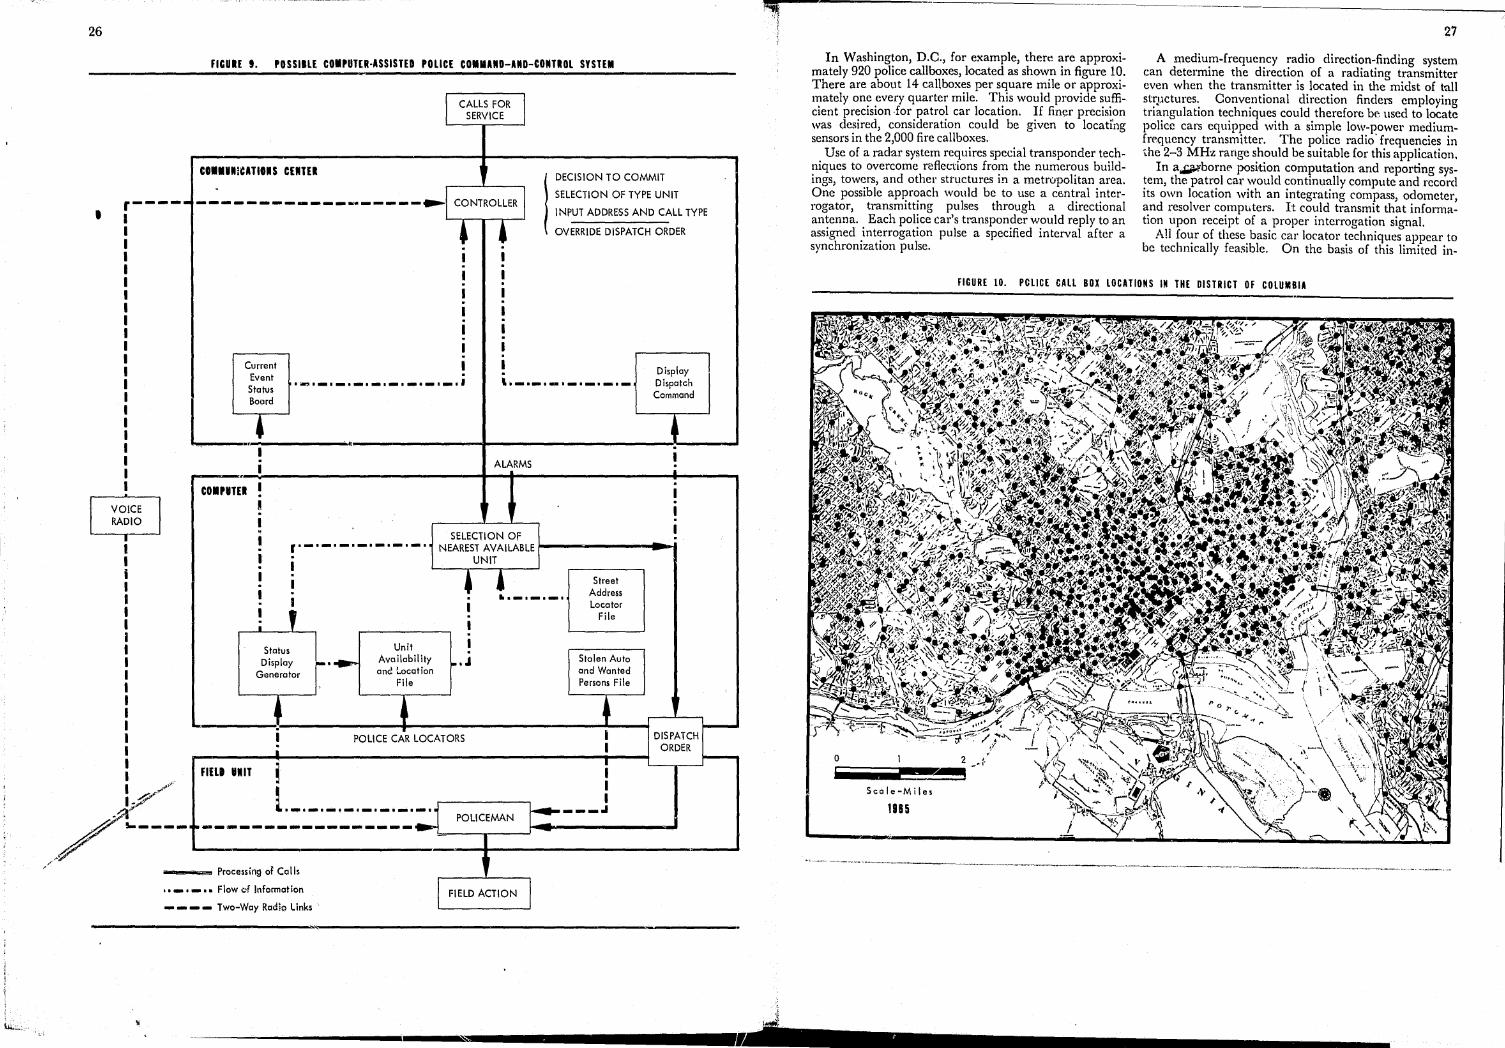
26
•
FICUIE t. POSSIBLE COIPUTn·ASSISTED POLICE COIMAND-AND-COIiTlOL SYSTEM
COIIUIIIUTlOIS cunl
I CALLS FOR I SERVICE
r----- -..:.----------.. ·-----~I CONTROLLER I t ,
DECISION TO COMMIT
SELECTION OF TYPE UNIT
J INPUT ADDRESS AND CALL TYPE
OVERRIDE DISPATCH ORDER
Current Event Status Board
I~._._I_._._._._I_. .-._._._._._.- Display Dispatch Command
'-_ .. ...;.,,-----.., .. ,._---+-------:-----' I · . ALARMS
I I
-----.,~~------------------------~--+-----------------~~-----, CDIPUTEI I
: ·
FlU. IIIIT
I
r'-'-'-'-'-'-'-' . I
• ,
Status Display ~.~
Generator
Unit Availability and :"ocation
File
I · I · SELECTION OF I · -NEAREST AVAILABLE I-------... ~
UNIT
~ t_._._ . I I I
I".J
Street Address Locator
File
Stolen Auto and Wanted Persons File
I i
POLICE CAR LOCATORS ~
DISPATCH ORDER
~ i / I
// L_._._._._._._._. POliCEMAN ~ ___ J ,/ ... ----.• ----------------- L_-.-_--.J ..... I---------
/ r __ """" process ins of Calls
• _ •• Flow of Information I FIELD ACTION I - - Two-Way Radio links .
...------------------------------~------------------------------------~----------
In Washington, D.C., for example, there are approximately 920 police callboxes, located as shown in figure 10. There are about 14 call boxes per square mile or approximately one every quarter mile. This would provide sufficient precision ,for patrol car location. If fincr precision was desired, consideration could be given to locati'ng sensors in the 2,000 fire callboxes.
Use of a radar system requires special transponder techniques to overcome reflections from the numerous buildings, towers, and other structures in a metwpolitan area. One possible approach would be to use a central interrogator, transmitting pulses through a directional antenna. Each police car's transponder would reply to an assigned interrogation pulse a specified interval after a synchronization pulse.
27
A medium-frequency radio direction-finding system can determine the direction of a radiating transmitter even when the transmitter is located in the midst of tall strpctures. Conventional direction finders employing triangulation techniques could therefore be used to locate police cars equipped with a simple low-power mediumfrequency transmitter. The police radio' frequencies in .he 2-3 MHz range should be suitable for this application.
In a~born{' position computation 'and reporting system, the patrol car would continually compute and record its own location with an integrating compass, odometer, and resolver computers. It could transmit that information upon receipt of a proper interrogation signal.
All four of these basic car locator techniques appear to be technically feasible. On the basis of this limited in-
FIGURE 10. POLICE CALL BOX LOCATIONS IN THE DISTRICT OF COLUMBIA
Scale-Miles
1185

28
vestigation the patrol car emitter-call box sensor system appears tC: offer the most promise where a network of call boxes or some equivalent exists. The modified radar transponder system if it proves to be feasible may be preferred elsewhere. Preliminary design studies of both of these systems should be undertaken to obtain an estimate of feasibility, costs, and performance.
The location of the incoming telephone call might also be determined automatically in order to reduce the time spent by the controller to insert information by the keyboard. The telephone company could record the number of each incoming telephone <:all, determine that telephone's address from a computer file of telephone addresses, and display that address to the controller, as he answers the call.22 By punching a button, he could enter the correct address directly into the computer. This would save time and reduce the chances for error. Since the calling telephone may not be at the location of the event however manual addressing capabilities would have to be retained. Furthermore, automatic recording of addresses might discourage callers who wish to remain anonymous from reporting incidents to the police. It is not clear whether the cost of such capability warrants its use, but it is a capability to be considered.
A computer-assisted command-and-control system offers many new possibilities for the deployment and control of a patrol force. As the crime pattern in a city chanO'es hour-by-hour, its patrol force could be redeploy.;'d to respond to it. As parts of the city are stripped of patrolmen by called-for services, other units could be assigned as backup. Under a riot or other emergency situation, contingency plans could be programed so that appropriate units would be deployed to .the emergency, and adequate backup maintained.
With all information on calls stored in the computer, c:omplete analysis of the operations of the patrol force could be conducted regularly to aid in assigning forces in response to changing crime patterns.
Under these computer-assisted command-and-control concept~ llignificant organizational changes would be needed. True command and c!0ntrol of the field units would be delegated to the center-the precinct watch commander would know what is going on in each beat and the status of each unit only if he was at the center in the role of a dispatch commander, or if he were given a remote display at the precinct station.
It is estimated that the total operating cost of such a system for a 100-car city would range from $500 to $2,000 per car for new equipment, $200,000 to $400,000 per year for computer rental, a similar amount for computer personnel, plus $500,000 to $2 million for control-center equipment and design.
Since the system must operate reliably 24 hours a day, fl. backup computer must be provided and is included in these cost estimates. In measuring the impact of the ('ost of these items on a police budget, it is relevant to not;'! that a two-man patrol beat costs about $100,000 per year. The command-and-control computer system could
"~A study prepared lor th6 tnsk lorce by American Telephono & Telegraph Co. suggeMs the lensiblllty 01 t11is nppronch.
also be used to perform the other statistical and reporting functions of the department during slack hours, and that function would bear some of the cost. A cost savings would be realized by the replacement of dispatcher personnel, since a city with 10 radio dispatchers could probably reduce the number to three or four dispatch commanders, but this would probably be canceled by the addition of computer personnel. The number of telephone controllers would stay about the same.
The proper design of such a system and the procedures for using it can only be developed in an evolutionary way. Furthermore, additional information is needed to delineate what size departments can benefit sufficiently to warrant the cost. It does appear, however, to offer sufficient potential for a major breakthrough in patrol operations to warrant pursuing it in depth. A great deal of analysis and experimentation should precede and accompany the implementation of such a computer-assisted commandand-control system. Many possible equipment combinations will have to be weighed and basic organizational and procedurai questions examined in dt:veloping the final system.
PROPOSED PROGRAM
The next step in improving police command and control would appear to involve significant research and development programs requiring Federal funds. An experimental program to develop a computer-assisted command-and-control system should be established with F ~.:leral support. The following sequence of developments should be undertaken to proceed with such a program:
D Two or three large cities should be funded by the Federal Government for a detailed stH~y of their patrol operations to determine how they would use a computer-aided command-and-control system.
D As part of the effort, an extensive reexamination of the communications system should be undertaken to assure the proper channel availability and to assess the utility of car locators, mobile teletype, and automatic address location from the telephone.
D Based on the results of the studies, one of the cities should be selected for installation of a prototype system.
D As the new system is developed, it should first be used in simulated operation in parallel with the manual system, then with a manual backup, and finally, be incorporated into the control operation.
The development process will have continual modification and testing and should be guided by an organization experienced in the development of large, computer-based systems.
Federal support should also be given to experimentation on communications c.enter design and procedures, both in operating communications centers and in a simulation laboratory created for that purpose.
COMMUNICATIONS TO THE POLICE
The primary input to the command and control system, and the most frequent initiator of the apprehension process, is a call from a citizen, usually a victim of a crime or a witness to one. In the case of street crimes, however, it is often difficult for the victim or a witness to call the police promptly. A number of things can be done to improve existing street communications equipment to make it easier to reach the police. '
The victim of a robber careful enough to steal his hst dime cannot now use the public telephone. Public 'telephones can be adapted so that the operator can be reached without using money, as was demonstrated in a recent test in Hartford, Conn., and as is now possible with equipment used by some small telephone systems. The :Bell Telephone System is now planning to extend this capability widely.
Most major cities have a network of police call boxes that are usually inconspicuous and locked, in many cases about as numerous as street telephones. Washington, D.C., has, as not(;d, 920 such boxes, or about 1 every quarter mile. These are not now available to the public. During World War II, however, they were painted red, white, and blue, and made available to the public in case of air raids and other emergencies. Adapting callboxes to permanent public use would, at little cost, double the number of available locations from which citizens could notify the police of observed street crimes or auto accidents.
The false-alarn1 rate for such callboxes would probably be less than from a mechanical alarm, since a potential prankster would have to reveal his voice. While experience with a police callbox may not turn out to be fully comparable, one metropolitan fire department estimates the false alarm rate for calls received over the telephone to be less than 3 percent, far less than the 50 pe'rcent false-alarm rate for an automatic or a mechanically actuated alarm.
Simply adapting a callbox system for public use is not sufficient to obtain maximum benefits. Each public callbox must be well marked and iighted; they must be easy to operate; and the availability of the system must be widely publicized. Apparently these necessary steps have not been taken by the majority of U.S. cities today.
A survey revealed that in five cities an average of only about two alarms were sent from each call box in a year. Informal surveys have indicated that less that! 10 percent of the population is aware of the presence and methods of use of the public alarm system. Merely providing such an additional communication link to the police without publicizing the benefits which an aware public can derive is leaving the task half completed.
Police call boxes should be designated "public emergency callboxes," should be better marked and lip.;hted, and should be left unlocked. Since the foot-pattol supervision function, for which most callboxes WNe originally intended, is rapidly becoming unnecessal"j through more widespread use of radios, the public alarm function
!.'3 ~ho nnalY8c~ oro in n report. :'Annlyscs. of the Polico Appnhcnsion Proccs9,H now 111 preparation. The report Will be nVQ11nbJc from the Clearinchouse for Federal Scientific amI Technical Information of the National Bureau of Standards.
29
is probably the major reason for maintaining such systems at all.
When trying to call the police from an ordinary telephone, a person is faced with a bewildering array of police juris'dictions and associated telephone numbers. In the Los Angeles area alone, there are 50 different telephone numbers that reach police departments within Los Angeles County. It should be possible to use a single telephone number, to reach the appropriate police department (or some other emergency center) directly. Great Britain has such a universal emergency number, "999."
,,'herever practical a single number should be established, at least within a metropolitan area and preferably over the entire United States, comparable to the telephone company's long-distance information number. This is difficult but feasible with existing telephone switching centers; it appears more practical with the new electronic switching systems being installed by the telephone companies, and should be incorporated. In the interim, the telephone companies should print on each telephone number disc the number of the police department serving that telephone's location.'
Once the caller reaches the police, he may be delayed because all the complaint clerks are busy.
The delay time can be reduced by adding complaint clerks, and an appropriate number can be calculated, as was illustrated in the example in chapter 2. On the basis of analyses 23 the following general conclusions can be drawn:
Large police departments should have at least two telephone numbers-one for emergency calls and the other for administrative calls-with the ability to transfer calls from one line to the other. Telephone traffic studies should be performed so that the rate of calls can be estimated as a function of the day of the week and the time of day. An appropriate number of telephone clerks can then be assigned at all times. Similar studies could be conducted to detennine the optimum number of dispatchers as a function of the call rate, the number of cars on patrol, and the radio conversation times.
POLICE RADIO COMMU:t\~ICATIONS SYSTEMS
Information flov's from the communications center to the mohile patrol fOl 'e almost exclusively by voice radio. As discussed in appendix D, police departments throughout the country are now faced with many complex problems and serious limitations on their plans and activities due to congestion of the radio spectrum. Some characteristics of the difficul ties are:
Congestion is most severe in major population centers. In most areas, police radio is organized into small independent networks, resulting in inefficient use of available frequencies.
,,i;~
----------------------------...................... E ............ ~--

30
With a few notable exceptions, radio communication is based on the same operational concepts as in the 1930's. Congestion will intensify as more mobile 'radios are used and as addinonal communication devices such as portable radios and radioteletypes are introduced. Little effort has gone into planning or accumulating the data nece~sary to estimat.e either present or future radio spectrum reqUirements as a function of time; location, and frequency; nor have these requirements been presented in clearcut terms for consideration by the FCC.
Although dat<l; detaiJin!? the nationa~ r<l;di~ ~pectrum shortage arc partlcularl), difficult to obtam, mdlvldual ex·, amples from many areas are s~fficiently dramatic ,to make a compelling case for the reaht)'. of the shortag~ In man)' metropolitan areas. In the Chicago metropolitan area, for example, 38 separate suburban cities with 350 patrol cars must share 1 freqnency. This cong~stion results .in excessive delays and underuse of the police force while patrol officers wait to gain the air. No police officer who needs help should hav~ to wait for a clear frequency.
An emergenc), message from a police dispatcher alw~)'s has top priorit)' and, even in extremely congested pohce radio networks, that message gets through. Howevl!r, the radio spectrum rongestion evidences itself in less obvious ways. For example, some police departrr-ents have limited the number of police cars on the streets because of lack of radio capabilities. Others have delayed purchasing such new equipment as small, portable radios for patrolmen on foot for similar reasons. Thus, the spectrum shortage generally manifests itself gradual.ly. by limiting the use of modern technology, rather than 111 llU
mediate dramatic ways. The breakdown in police radio communications net
works becomes dramatically evident in major disorders and in similar situations demanding the coordinated action of a number of police agencies. At such times, both the congestion and the lack of flexibility or the police networks become glaring weaknesses. Thus, In the Watts riots of 1965, both the police agencies directly involved and the police brought in from other parts of Los Angeles attempted to usc hopelessly congested channels or could not communicate at all because of frequency incompatibility. Some police commanders were unable to talk with men assigned to their command; it is extremely difficult to try to control a civil disturbance in an area of 40 square Illiles without effective communicatiom1. In Illinois, when State, county, and municipal police have monitored disturbances, their coordination has sim.ilarly been hampered by lack of radio contact.
TI-m DE:SIGN OF POLICE RADIO NETWORKS
An efficient police mobile radio network should make <Treater use of trunk groups of channels rather than single ~hanncls, and it sh~uld have a number of "switchable" C'hanncls which can be reassigned from one group of users to another as current demands change.
In radio communications, a receiver can be designed so that it is turned on upon receipt of a subaudiofrequency code. Thus, by the use of the subaudiofrequency code, it is possible to communicate with a chosen car or a group of cars equipped to respond to the code; Other cars tuned to the same frequency but respondmg to a different cede can be addressed separately at different times. This coding permits greater flexibility in the use of each frequency. The same channel may ~e used at different times for detective work, for addressmg supervisory vehicles alone, or for citywide purposes b), variation of the code. Although some switching capability can be achieved without the use of selective coding, obviously much greater flexibility is available through its use. Hence, police departments should make greater use of selective coding for addressing in their rauio networks ~o enable them to switch their radio channels to meet their changing demands.
Police radio networks should also make greater use of multiple frequency trunking. The trunking con.cept is illustrated in fiO'ure 11. The top of figure 11 depicts the method currently used to provide radio coverage for a police mobile fleet. The city is divided into a number of major geographical sectors, each one patrolled by usually no more than 50 vehicles.. The number ~f sectors is the same as the number of radIO channels usec.., four m this example. The vehicles assigned to a sector are all linked to a dispatcher in police headquarters ?)' the same single radio channel. The channel may be Simplex (the cars and the dispatcher all use the same frequency) or duplex (one frequency is used by the dispatcher and another is shared by the cars) .
The middle of figure 11 shows the simplest version of multiple frequency trunking. The sectors are paired and two channels are assigned to each pair to use in common. Patrol vehicles still communicate only with their own dispatcher, since addressing is accomplished by selective freq~ency codin.g ~a~~,er than ?)' simple fr7que!1cy a?dressmg. The mdlVldual user 111 the top SituatIOn WIll sometimes find the channel busy when another car in the same sector is using it. In the middle case, both channels must be busy simultaneously for the user to experience delay in placing his call.
Even though the demand on the two channels is twice that on one, delay is less likely to occur when the channels are shared, since each car can use either of its assigned channels. For instance, if each of two sectors uses its private channel 50 percent of the time, then each one finds it busy half the time. When sectors are paired, a user would find both channels busy only 35 percent of the time. Thus, both have better service with the shared . arrangement. In the bottom figure, all four channels are shared by all the sectors in a trunking arrangement, and delay is still less likely, occurring 20 percent of the time in the above example. In this case all four channels must be busy simultaneously for a call to be delayed. These principles arc utilized in conventional telephone networks, in the AT&T mobile radio service, and in electric-power networks.
..----.--.... ~---
FIGURE 11. ILLUSTRATlOII OF MULTIPLE CHAIIIIEl TIIUIIKIIIG
C-I
~RTHEAST ~THEAST
C-4
CONVENTIONAL NETWORK
'L--C-I
MINIMUM TRUNKING
C-2~-\\ C-I~
C-I?1! C-2
C'3 C-4
~C-IN
.... C-3 C-4
~C-I C-2
C-3 C-4
COMPLETE TRUNKING
CITY DIVIDED INTO FOUR SEPARATE SECTORS. EACH WITH ITS OWN RADIO CHANNEL AND DISPATCHER.
SECTORS PAIRED TO SHARE TWO RADIO CHANNELS. SELECTIVE ADDRESS CODING PERMITS EACH SECTOR'S CARS AND THEIR DISPATCHER TO TALK ONLY WITH EACH OTHER.
ALL SECTORS SHARE ALL CHANNELS. SELECTIVE ADDRESS CODING PERMITS EACH SECTOR'S CARS AND THEIR DISPATCHER TO TALK ONLY WITH EACH OTHER.
Geographical and topographica:l features limit the manner in which sectors could be combined. In Los ApE?'eles, for e~ample, two major sections of the city are dtvlded by a Imc of mountains, so that only sectors on the same side of the mountains could share channels.
A nun;ber of problems more directly related to police Commumcations further limit the simple application of these concepts. The dispatcher, for example, is often the limiting bottleneck in mobile radio communications. It may well be decided in a particular situation, therefore, that mUltiple frequency trunking should not be applied to the dispatcher'S messages, and that he should have his own exclusive channel to eliminate the possibility of de-
31
laying him. This could be done with a duplex system in which the dispatcher's frequency is private and the incoming calls trunked.
The growth of police mobile radio networks has led to an increased control of the police mobile forces by the dispatchers, and a corresponding diminution of the effective authority of the sergeants and lieutenants in the field. Some police departments insist that all cars in an area be able to monitor all calls, partly for improved coordination, partly to permit the field supervisors to exercise their functions. This requirement tends to favor the use of a simplex system where both dispatcher and cars talk on the same frequenc),. Simplex operation also permits car-to-car conversation, which aids the field supervisor and facilitates field coordination. Radio discipline is required to insure that the channels are nat dominated by lengthy conversations between cars in thc field during those busy hours when the dispatcher must have ready access to the network.
Simplex operation with selective coded addressing would appear in general to offer the best combination of characteristics for general police radio use. By selective addressing, the sergeant could address directl), the units under his control without going through the dispatcher. By the same means, all the cars under the direction of that sergeant could monitor the conversation between the sergeant and any car in his tactical unit. Further, in case of a large-scale disturbance, the car-to-car communications capabilit)' should make it possible for the group of cars to be separated from dispatcher control and to operate as an integrated field force under the direction of their own supervisor. These features can be obtained in a duplex system but arc generally less expensively realized with simplex. Hybrid s),stems for operating in different modes at different times are, of course, possible.
Trunking makes possible the more even loading of multiple radio channels. This advantage cannot be realized in the small networks of many independent municipalities. Furthermore, these independent networks hamper the ability of neighboring police departments to carry out coordinated actions in major emergencies. These are strong reasons for discouraging their further development. This does not imply that an independent municipality should not have its own independent police force. The conclusion is onl}, that such police forces mllst coordinate their communications needs with those of other forces in the same area if police communications problems are to be solved in an orderly wa),.
Channel switching implies that there exist radio channels available to be switched. Such channels do exist in the public safety bands. Highway maintenance and school bus frequencies generally are used only during the normal working day. Busy hours for the police, when these switchable channels are needed, are evenings and weekends. Thus, greater use of trunking and switching urges that the total radio resources of the city be considered in designing a public-safety radio network. The unused frequencies of other public safety users should be made available by appropriate FCC rules to relieve police radio traffic congestion at their peak periods.
----~----_.I--------............. ------------------------

32
Police mobile radio networks using these concepts will admittedly be more costly than they have been in the past. Very preliminary estimates made on the basis of telephone company experience with its mobile telephone service are that costs can be expected to increase by 50 to 200 percent over those of present systems. Where communications are congested and additional frequencies are not readily available, the benefits derived in terms of increased police operational capability would be sufficient justification for the additional investment.
In using these concepts, police agencies will be forced to direct more attention to their network design requirements. Police radio networks are now largely built around the available equipment rather than designed in response to police needs. Police agencies should translate their needs into a system design and then decide what equipment they need.
THE RADIO SPECTRUM CONGESTION PROBLEM
Design of effective radio networks is aggravated by the severe spectrum congestion in the police radio bands, particularly in large· metropolitan areas, a congestion extending across all the radio bands allocated to land mobil!:' operations. Limited field tests undertaken by the FCC in Los Angeles and New York, the preoccupation with the subject in the APCO Bulletin,24 a study made by the Land Mobile Section of the Electronic Industries Association,25 and evidence gathered and presented in connection with various dockets that the FCC has opened in recent years/a 27 all indicate serious congestion and a growing demand for more frequencies on the part of radio communications users. FCC Commissioner Cox, in a recent article addressed to the engineering profession,2s pointed out the rapid growth in the land mobile services (from 10,999 licensed transmitters in 1948 to over 220,000 in 1965) and the reasons for creation of the Advisory Committee for Land Mobile Radio Services. The need for action in this area has also been pointed out in Congress.20
The lack of a clear measure of the spectrum available and of a firm estimate of what is needed hampers a clear exposition of' the situation. Consider first the needs. Actual channel loading, measured as the percentage of time a radio channel is in use, would be extremely heavy if the channel were in use over 50 percent of the time. Informal surveys made by members of the Task Force show a wide variation in police radio channel loading within the same area. One major police department had a heavy load on several of its channels, but one of its channels was very lightly loaded. However, because of the inflexible network design, the department could not easily switch channels from one set of us,\rs to another. In many other cases, small municipalities adjacent to central cities with badly overloaded facilities were found to have lightly loaded channels used only 5 percent of the time. Thus, radio channel loading averaged over a metropolitan area is not a clear-cut indicator of the spectrum congestion.
" Dullelin of Ibo As.oclaled Public SafelY Communi.alion. Officer. (APCO). 2.'i Land Mobile Section or the Electronic Industries A88ociation, "Study of the
Federal Communications Commission Frequency Cards:' 196.l. :.'6 "In the Matter of nn Inquiry into Ute Prescnt and Future RequiremEnts of
the Public Sa£cty Radio Services for the Allocation of Uadio Frequencies," FCC Docket 11997.
21 "In the Matter of an Inquiry into the Optimum Frequency Spacinj; Between Auignnble Frequencies in thl:\ Laud Mobile Service nnd lhe Feasibility uf Fre. quency Sharing by Television nud the Land Mobilc Scn-ices," tee Docket 15398.
!!8 Kenneth A. Cox, uThe Land Mobilo Radio Services, It IEEE Spectrum, vol. 2, No. 10, Oelober 1955. PI" 42-43.
.. John D. Dingell (I61h Dlslricl, Michigan), "The Need (or Addllional Radio Frequencies," Congressional Hecord; Sept. 28, 1966, pp. 23207-23216.
The radio channel requirements might he keyed to population. Sample statistics indicate that on the average, over a 24-hour day, a police patrol vehicle handles about one call per hour.ao A population of about 25,000 generates an average of 1 call per hour for police service.a1
Thus, subject to a more detailed evaluation, an average of 1 patrol car is needed on constant duty for each 25,000 of population if demand peaks are ignored. But a communication system must be designed for peak rather than average traffic. The peak demand is typically about five times the average demand; thus 1 patrol car would be needed for each 5,000 population to meet a 5: 1 peak.
Studies by the RAND Corp.a2 indicate that a police conversation lasts 25 to 60 seconds on the average. This is consistent with the FCC rule of thumb that 50 to 60 mobile units make a mayimum load for a single radio channel. Assuming 30 cars per radio channel as an acceptable working level, this indicates an assignment of 1 radio channel for every 150,000 population. However, the validity of this guideline requires further verification. The need for special channels for supervisory vehicles, detective channels and other special requirements of the individual department represent an additional demand for channels. Furthermore, since municipal, county, and State police operate communications networks over areas where political boundaries have no relationship to the range of a radio transmitter, it would be unwise to apply rigidly a single guideline for determinin~ the actual police radio needs.
The most feasible sources for additional radio spectrum space are the television bands. There are two major sources for additional radio spectrum within these. The first is in the VHF spectrum used for channels 2 through 13. In cities where a particular VHF channel is not utilized, those channels could be made available for police mobile radio systems. Available VHF-TV spectrum can provide on the order of 300 additional channels in most metropolitan areas. The second source of TV frequencies is the underloaded UHF spectrum. The FCC should make space from these sources available for police mobile radio use. If this allocation were to the land mobile services generally, instead of for exclusive police use, the police should receive a major share.
THE RELATIONSHIP BETWEEN THE LOCAL COMMUNITY AND THE FCC aa
Matters of frequency assignment presently come to the FCC on a piecemeal basis. Alt.hough the FCC has urged users to consider and present the broader implications of their requests, the actual workings of the frequency assignment system have led to keen competition for ever-scarcer frequencies on a highly individual basis. Frequency assignments made on this basis have led to wide variations in traffic loading on the police frequencies in all areas. The resulting inefficient use of the radio spectrum has intensified what, in many areas, would be a serious spectrum congestion problem even with efficient
30 FCC Docket 11997, op. cit., ·'Preliminary Statement," p. 19. 31 Data derived [rom City of Chicago. 3!! PenDnal communication with A. Hiebert. 33 The material in this scction hall been reviewed by appropriate individuals
in the Federal Government and in pollee work. Organization! from whom such assistance has he en received include the Federal Communications Commisvion, the President's Office of Science and Technology, the President's Office or Telecommunications Management, Association of Public Safety Communications Offi· cers, International ASllociation or Chiefs of Police, the Police Departments of Wahlnglon, D.C., Lo. Anceles, Calif., and Burbank. Calif .. and Ihe Publle SafelY Coordinating Committee. Acknowledgement of this aid is not meant to imply endorsement or the mnterial.
use of frequencies. Another result has been that the FCC does not get the kind of overall picture of spectrum usage which would enable it to establish the coherent national policy so necessary to the interests of all concerned.
Steps should be taken to encourage pooling of radio frequency resources into efficient communications networks on the part of Public Safety Radio Service users j 3·J
to reduce the number of applicants who deal directly with the FCC; and to require municipal governments to take a greater responsibility for the efficient use of the radio spectrum resources under their control.
As one means for achieving this coordination, the FCC should limit in terms of population and/or land area the size of municipalities located in congested metropolitan areas with which it will deal directly in regard to frequency assignments in the Public Safety Radio Service. To qualify for frequency assignments, such smaller municipalities should be required to participate in an area network plan or coordinate with the cen tral city. Such a policy would encourage cooperation without dictating how this should be accomplished on a local level. Some cases will undoubtedly exist where it is impossible for a small community to enter into such a network. The FCC rule could certainly allow for such exceptions. It is also possible that there will be cases in which a small community is unable to reach satisfactory agreement with a large one. If this should occur, a plan could be presented, along with the dissenting position of either or both groups, for FCC decision.
There are many examples of small communities with lightly loaded channels in metropolitan areas with heavy radio congestion. The FCC should notify these small municipalities that, unless they show justifiable cause for an exception, they must release within 5 years, any public safety frequencies which have been ru;signed to them. Since FCC licenses are issued for periods no longer than 5 years, this involves a decision not to renew licenses rather than to revoke existing ones.
This action would bring into coordinated networks those municipalities whose motivation to do so is now only limited-their frequency situation is satisfactory although they may be surrounded by others with severe congestion. There appear to be a sufficient number of suc~ communities and sufficient radio spectrum resources are mvolved to make this an important consideration.
As ~00!1 as prac~icable, the FCC should establish a policy of asslgmng PublIc Safety Radio Service frequencies only to the local government and not assigning them directly to the .users such as police or fire departments. Frequency adVISOry matters should be handled by one committee in each geographical area instead of by separate committees for p~lice, fire, highway maintenance, and forestry cons~r~atlon. T~ese committees should receive formal recogmtlOn by theIr State governments or on an interstate basis.
Police communicators often do not use frequency resources available to their municipalities primarily because these frequencies are not licensed for police use. The FCC has recognized the need for multiple use of radio
3,' The users in the Public Safcty Radio Service include police fire highway maintenance, (orelt conservation, and local &;overnmcnt. ,j
33
freq'lencies by establishing within the Public Safety Radio SerVIce ,11 band of local government frequencies which ~an be used for any legitimate local activity. The majorIty of ,the frequencies in the public safety bands are, ho\vever, speCIfied for type of user and forbidden to users not in the speci~ed category. As a result, although a city may have suffiCIent total radio spectrum resources to create a h~ghly efficient network including all departments, the ~olIc~ m~y be ?esperately short of frequencies. This SItuatIOn IS not hkely to change in the absence of outside pressure for an overall network plan.
The primary re~pon~ibility for allocating frequency re~ources an;ong polIce and fire protection and other municIpal functIOns. properly rests with the local government ~ather than WIth the FCC. The present policy of assign~ng frequencies below the municipal government level IS, to some extent, inadvertently injecting the FCC into local government affairs, increasing the difficulty of its ?wn task, and placing artificial restraints upon the municIpal government. This, of course was not a problem before radio spectrum became c;ngested. Under the broader characterization of the frequencies involved the FCC retains its responsibility to see that there are 'adequate spectrum resources for municipal functions. Where appropriate, individual requests could still be considered.
This. policy would :nake the municipal government responSIble for the effiCient use of its total radio spectrum resources. :rhen, with designs based on larger networks, gr~ater effiCIency becomes possible. The municipality re~ams the freedom to develop a coordinated police network m cooperation with neighboring cities, or its own coordinated public safety network, or any combination of the t~vo. From the FCC viewpoint, the primary consideratIon should be efficient use of the limited radio frequency spectrum.
Finally, in order to develop coordinated plans for the future, th~ FCC should inform .the States and local gov~rnments m the large metropolItan areas that they will, 1Il ~he f~ture, be expected to proviue justification for !heIr radIO. frequency n.eeds in the form of overall proJected publIc safety reqUirements for the following decade.
COMMUNICATIONS EQUIPMENT FOR THE PATROLMAN
I~ police communications equipment, the most-im!lledmte need, for small departments as well as large ones) IS the ~eve!opment of inexpensive, portable voice radios t~at wIll lmk every patrollnan to his department contmuously, regardless of whether or not he is in a car. Some of the possibilities are discussed in this section. There are many possible refinements that might be useful in specialized situations. Scramblers could be used to maintain security of sensitive voice transmissions and ~ariOt~s antijam features could protect against intentional Jammmg of the police radio network. Digital communicaticlls, such as teletype, could be lIsed both to conserve radio bandwidth and to provide a pclmanent record of the transmissions. Recording equipment could be carried

------~------~----------------------~;~", ... ~.,~~~;.. .... -----34
to record confessions and witness testimony, and to provide evidence that apprehended suspects had been properly infonned of their constitutional rights.
INEXPENSlVE PORTABLE TWO-WAY RADIOS
Police officials have been unanimous in their desire for small, lightweight, inexpensive, portable two-way radios fot, both foot and mobile patrolmen to carry at all times, With a radio, a patrolman can always call for help and he can always be reached by his commander. The radio must work inside most buildings) on the street between taU buildings, and must not be so cumbersome as to impede his regular police actions. Furthermore, it must be inexpensive enough for a police department to assign one to every man on duty.
Experience has shown that in typical situations, handheld two-way radios must have a power output of about 1 to 5 watts for reliable operation over limited but useful rangps (Y4 mile to 2 miles). The range of the units is limited primarily by such things as obstructing walls or buildings, electrical noise from industrial equipment, low antenna heights, and the inefficient antennas of handheld units. In order to extend the range by increasing the power of the units it would be necessary to increase greatly the size, weight, and cost of the units before even a marginal improvement in range could be detected. On the other hand, reducing the power much below the 1 to 5 watt range re~ults in unreliable perfonnance under many conditions.
Because of the limited range of the hand-held twoway radios, repeater stations are needed to pick up, amplify, and relay the signal from the portable radio. The two-way car radio of the patrol car could be used as a repeater for the cruiser patrolman since he would ordinarily be found close to his car. Alternatively, repeaters could be placed at fixed locations around the city, such as on top of precinct houses.
Portable two-way radios available today are far from satisfactory: they need to be lighterJ less bulkYJ easier to operatel and less expensive. Even though existing transistorized units weigh only 2 01' 3 pounds, this is too much weight, when added to the officer's gun, flash~ light, night stick, and other equipment he must carry.
Furthermore, existing units are awkward to operate in emergency situations primarily because the officer must pull out the antenna and hold the radio so that the antenna is away from his body. Shirt sleeve, trouser leg, and earphone cord antennas have been developed, but they are very inefficient because of the loss resulting from shadowing by the officer's body. Furthermore, current radios often experience difficulties in communicating from the inside of buildings,
Existing radios for foot patrolmen are still too expensive, The average unit with attachments generally costs about $500 to $750. Most police departments, especially the smaller ones, cannot pay this high a price even if they are willing to tolerate the size and weight.
.., C. J. Schullz, "Is 960 Me Suitable ror Mobile Operallon?"; Moloroln Inlernal puper; undated.
"" W. lIae Young, Jr., "Camparioa" 01 Mobil. RadIo Traoomlsslan al 150, 450.
::' , Existing technology appears able to provide a major '))
contribution 111 portable radios for foot patrolmen, The 'I technology of microelectronics employing integrated cir.·cuits can greatly reduce the size and cost of units al,td provide increased reliability. Leading manufacturers in the microelectronics industry were contacted by the Task Force. There was a consensus of opinion that microminiaturized versions of current police radios would weigh about 12 ounces and could be manufactured at a cost of between $100 and $150 in lots of 20,000 or more. This would represent a four-fifths reduction in cost and a two-thirds reduction in weight. Estimated she, weight, and power characteristics of a microminiaturized version of current portable radios are as follows:
Radio frequency power output.. •••••• " ••••••••• _ ••••••••• _ 2 walts. Audio power output. •••••••••••••••••••••••••••••••••••••• 75 mllliwalts. Transmitter efficiency of power consumption ••••••••••••••••• 50 percent. Battery weighL •••• _ ••••••••••• _ ••• _ ••• _ •••• _ •••• _. ___ • __ ~~ pound. Total welght. •• _ ...................... _ ••••••••••••••••• _. H pound. Cost per unit (In quantity) •• _ ....... _ .................. _ ••• $100-$150.
Although microminiaturization of present equipment designs can significantly improve equipment and reduce costs, optimized design of the total communication chain between the officer on foot and the dispatcher may well bring about even greater improvements with possibly further reductions in equipment cost and weight.
One of the first steps in optimizing the design of portable radio systems woule! be to compare equipment performance at the different police frequencies, including possible new allocations. It is possible that penetration of buildings and effectiveness of antennas worn on the body might make higher frequencies superior to presently used frequencies, In addition, natural and man-made noise is lower at the higher frequencies. However, foliage loss tends to increase with frequency. There may well be other factors that would dominate the choice of frequency. Table 8 summarizes the relationship between some of the perfonnance factors and frequency.
There is very little test data available on frequency propagation characteristics in a city environment which can be used for system design. In some tests, Motorola 35
found that transmissions at about 900 MHz penetrated into tunnels better than lower frequencies now in usc. These indications tend to be supported by work carried out at Bell Telephone Laboratories. 30 To clarify these issues, a test program should be conducted to perform a comparative evaluation of frequencies in the range from 150 to 3000 MHz for police communications.
If the potential of the higher frequencies were realized, it would be possible to design equipment t!hat would be much less awkward to operate in emergency situations and that might provide much more reliable communications, particularly from the inside of buildings. This may lead to important reductions in the size and the cost of the battery, which would be important because battery weight and cost represent a large portion (perhaps as much as 40 percent) of the weight and cost of the entire microminiaturized unit.
900. and 3,700 M.... Doll Syalom Teehnl •• ! Journal, November 1952, pp. 1068-lOBS.
35
Table B.-Performance Factors VS, Frequency of Portable Police Radio Equipment
Body worn ant~nna
ftequency Gain wlth re$pecl to a hall·wave
dipole Body shadow 10$5
150 MHz .......... -810 -15 db ••••••••••.••••• -8 to -9 db (trouser fen or ear· 50 MHz •• _ ....... -2 to -3 db_ ••••••••••••••••
phone cord). -8 to -9 db (trouser leg or ear.
60 MHz •••••••••• -{) 10 +1 db ••••••••••••••••• phone cord).
-{) db (head or shOUlder antenna). 000 MHz ••••••••• -{) to +3 db ............... _. -{) db (head or shoufdetanlenna).
The motorized police officer can take advantage of his powerful and reliable car radio when he is on foot away from his car by such means as:
Making the car radio detachable so that he can carry it with him. Making the car receiver detachable and giving the officer a separate short-range transmitter whose ~ignal would be rebroadcast by the car transmitter, Developing a simplified transceiver to communicate with a matched unit in the car connected to the two-way car radio for rebroad~ casting. H~ving a car radio capable of being switched to a SImple repeater mode and providing the officer with a transceiver operating on base-station frequencies. . ~eveloping a simple short-range signaling devIce that could SIgnal the car and trigger an automatic call for help.
Each of 0e above tech!liques, discussed in appendix E, wo.uld proVide the motonz;d patrolman with a relatively r~hable. mC:l,IS of commuQlcation when he is away from hIS vehicle. Each of the techniques is feasible and each has ;~vantages ~nd limi~ations discussed in appendix E.
'VI hlle the deSIred radIOS both for the foot patrolman and th.e patl'Olman away from his car appear to be prodUCible, a mass market is needed. No single police agency, not eyen the largest ones, represents sufficient market potet;tlal to suppo~t a microminiature component productIon lme at the pnce level indicated. . ~h~ .Fe.deral Government shOUld assume the leadership m ~11ltlatmg the ?evelopment of thelie portable police radIOS. The pOSSible approaches include disseminating ~he results o~ a market survey to potential suppliers, paymg. for a major part of. t~~ development costs, or guaranteemg the, sale of an InitIal production run of perhaps 20,000 Ul1lts.
The Governmen~ ~~ould assign to an existing operating agency the responslbIhty to manage this program. That age.ncy should call on the advice of both large and small pohce departments, and should conduct tests and studies to estabhsh the specifications for a family of radios. Th:y should work with industry to solicit bids on the radiOS and monitor its development.
,
Imiustriatand manmade nolsij Foliage loss Building penotration ability
~
Appreciable ••••••••••••••••••• Uncertain ............. Uncettain. Less than at 150 MHz •••••••••• More than at 150 MHz •• Kno"'n to be beUer than 150 Less than at 450 MHz •• _ ••••• __ More than at 450 MHz ••
MHz. 1 ndlcalion, 01 being belter
Probably lesslhan 8t960 MHz •• Mote than a1960 MHz_. than at 450 MHz.
Uncertain.
DIGITAL COMMUNICATIONS
~lthough voice is ~n in~ispensable mode of communi-cations for patrol vehIcles, It has a number of iimitations:
It is very wasteful of the already overcrowded radio frequency spectrum. !t provid.es no protection against unauthorized mterception of official police communications unless expensive scramblers are employed. It does not create a written record, It is subject to phonetic errors. It ca~not be received by an unattended patrol car WIthout special recording equipment,
The~e prob.1ems could all be alleviated by augmenting 0e VOIce .radlo by ~ome form of digital communications h~k. ThIS would Improve the bandwidth efficiency in u?Ing the network and would also pennit direct commu. n~catio?s b~tween a police officer and a computer-for direct mqUlry regardmg a stolen auto, for instance, A n~mber of. manufact,-!rers have recently developed telepnn~ers SUItable for Installation in patrol cars. These proVIde security of transmission and a written copy of the message even if (he car is unattended. On the other hand, any messag{', that must be read imposes on the officer's most busy sense-vision-cspecially when he operates as a one-man patrol. ~he teleprin.ter signal can be narrow-band, thereby of
fermg a potentIal for much more efficient use of the available spectrum. Operational tests w.ill show how much of that a~v~ntage is reduced by the need for redundancy of transmISSion to compensate for errors which result from the many node,s. in received signal power that exist in u~ban commumt!es. Although some transmission errors WIll occur while the vehicle is in motion, there are various ways to reduce the error rate. Study is needed on the best me~ns .for integrating teleprinters into the police commUl1lcations system both operationally and technically. ~Iso, studies are needed to identify the most approprIate error-reducing techniques to usc. A receiveonly teleprinter could receive the routine broadcast messages, su~~ as s~olen.car reports. .In order to provide a two-way dlgltalltnk, an encoder Ul1lt would have to be added to the teleprin~er. ~ith this .capability, a. patrol officer could commul1lcate directly WIth an on-line computer. Receive-only teleprinters cost about $1,000 to
36
$2,000 each and two-way teleprinters units would cost about $3,000 to $6,000 per car.. . ' .
Simple coded sigr;al transmlttmg ~evlccs for field umts arc technically feasible. These umts could be u~ed to forward such information a~ availability (e.g., aVailable, out-of-service, occupied but available) for priority assignment, using the "lO-series" of code~.37 If the nu.mber of possible coded messages is small, a Simple set of sWitches on the control head of the car radio could code the message. The officer could flip the ~p~ropriat~ swi!ch and an al,ltomatic signal on the vehicle s IdentI?Ca~lOn and availability would be sent to the commun~catlOns center. An indicator light could stay on to remmd the officer of his last report.
POTENTIAL FOR STANDARDIZATION
Standardization of police mobile equipment should contribute substantially to field effi~iency. A polic~ officer is not always in the same car With the same eqUipment, and he must often operate the radio equipment while his attention is elsewhere. Standardization of the controls will avoid fumbling, distraction, and errors. Standardization of such basic details as cable connections and mounting brackets will make a police depa;tment less dependent on its previous supplier in purcl:~smg spare parts or r~placement equipment. The abilIty to accept comp~tltive bids should increase the chances of a lower pnce. Equipment standardization shoul~ be n~tionw~de in scope since there a~e only a f?w ~aJ~r m~blle rad.1O ~';Ippliers and there is lIttle practical JUStificatIOn for hmltmg standardization to a local area.
Standardization could overcome disadvantages in present police radio equipment such as the following:
Patrol cars fitted with cabling and racks for one make of equipment cannot accept equipment of another make without substantial modification. Few parts are common .am?ng differe,nt makes of equipment, compiIcatmg the I11ventory problem. Test equipment that is designed for usc with one manufacturer's equipment frequently cannot be used with similar equipment made by another.
Dissimilarity of circuitry places additional training requirements upon maintenance personnel. Dissimilarity in the way operating controls are positioned and variations in their function complicate the operational problem. Equipment of one m~nLlfac~urer is not .always electronically compatible With the eqUipment of another. For example, the selective signaling system of one manufacturer's equipm~nt generally wiIi not operate another selective signaling device.
Standardization limited to items such as cable connec, tors, mounting hardware, <l:nd control ~eads could be implemented withm a relatively short time an~ should provide very positive benefits in terms of operations and maintenance.
Thus, a program of nationwide standardizati?n of police mobile radio equipment should ~e. establIshed. The standardization program should be lImited to con, siderations of basic equipment compatibility such as the following:
Sockets and plugs. Terminal strips and the utilization of the 111-
dividual terminals. Housing dimensions. Mountitlg racks and baseplates. Control heads. Selective signaling techniques. Crystals and crystal holders.
The Associated Public Safety Communications Officers (APCO) has taken the position 38 that the standardiza, tion of control heads is of fundamental importance. With APCO's encouragement, Mr. David Niblack 30 of the Colorado Highway Patrol has designed a standard radio control head. This program is described in more detail in appendix E.
Because of the complexities in extending the scope of standardization, the further possibilities should be ex, plored and developed on the basis of experie~ce in this limited standardization program to assure that ItS benefits can be obtained without having a negative effect upon manufacturers' efforts to improve their products.
31 AS'3ocintcu Public Safety Communications Officers, Inc.j "APea Public SnCety :10 Niblack, D. L. t "New Concepts in Mobile Conlrol Console Desisn," APeD Communicntlons Proccuure Mnnnu!." .... Bulletin, vol. 32, No.9, Sept. 1966.
3!t Personal CommunicatIon with Mr. Leslie M. 'Walker, ehlurman, APea Engi-neering nnll Research Committee.
Chapter 4 ---------------------------------------'--
Aspects of Court ,Management) Corrections, and CriIlle Prevention
Although the major emphasis of the Task Force's \\'ork focused on police apprehension operations, a significant effort was directed at the problem of reducing delay in processing defendants through the courts. In addition, some work was done on two aspects of corrections-the use of programed learning techniques to aid rehabilitation and the use of statistical techniques to aid both sentencing and correctional decisions-and technological aspects of crime prevention through reducing opportunities for crime-redesign of automobile components to make auto theft more difficult and street lighting. These studies are discussed in this chapter. In addition, a number of other possible applications of science and technology, which have not been studied in detail, are mentioned.
<,
COURT OPEEATIONS-REDUCING DELAY
It is a basic precept of our society that justice should not be administered with one eye on the clock and the other on the checkbook. It is often the fact, however, that justice in the United States is rationed because of the limited resources at its disposal and the inefficient way in which they are used. At the same time justice may be effectively denied because of inordinate delays between arrest and final disposition. The techniques of modern management technology can help to achieve the most efficient use of the available resources, within the limits of procedures designed to ensure the due administration of justice.
The Task Force has focused its attention on the processing of defendants through u court, with special emphasis on the reduction of delay. Various solutions to the problem of delay have been suggested by judges, lawyers, and court administrators. Whether or not any of thes~ solutions would indeed reduce delay can only be determmed after they have been put into cfTect. In order to make preliminary tests of some alternatives without disrupting the operating courts, the Task Force examined the feasibility of using computer simulation techniqu'es ~or experimenting with various modifications in the crim~nal court processing system. The judicial decision makmg process was not a s,ubject of this study . . Because court systems in the Nation differ in organiza
tIOn and procedure, no single model will serve to repre-
sent them all. The approach taken wa5 to test the feasibility of simulating one of these systems, namely the system for processing felony defendants in the District of Columbia. The steps followed were:
( 1) Describing in detail the organization and structure of the court system for processing felony defendants;
(2) Analyzing the available data on felony defendants in the U.S. District Court for the District of Columbia to determine the distribution of total time to disposition, time intervals between major events in the system, potential arcas of delay and possible causes;
(3) Developing a computer simulation of the processing of felony defendants in the District of Columbia trial court system which:
a. Operated like that observed in the data (i.e., to produce the average time intervals between steps in the process similar to those observed in the data) ;
b. Could be manipulated to investigate possible organizational or procedural changes in the system and to measure their impact on delay and on resource requirements.
THE DISTRICT OF COLUMBIA COURT SYSTEM FOR PROC
ESSING FELONIES
The various steps and the associated resources for processing felony defendants in the District of Columbia court system are shown in simplified form in figure 12. The fin,t step is presentment, which occurs before a judge of the Court of General Sessions (the general jut'isdiction court of first instance of the District of Columbia) 01' the U.S. Commissioner. Both are available for presentment and preliminary hearing in felony cases. Presentment is often preceded by a review or screening of the case by an Assistant U.S. Attorney, Court of General Sessions Division. He detennines whether to reduce the felony charge to a misdemeanor, to terminate the case ("no papering") , 01' to proceed with prosecution.
37

38
FIGURE 12. SYSTEM FOR PRGCESSI~G fElONY DEFENDaNTS
COURT OF GENERAL SESSIONS U.S. COMMISSIONER
ASSISTANT U.S. U.S. BRANCH (1 COMMISSIONER)1
ATTORNEYS (7-10) (1 JUDGE)
-[ SCREENING PRESENT- PRELIMINARY 1
r-:El MENT HEARING I
\ r PRESENT- PRELIMINARY ~ f-
I MENT HEARING
---------------------- f- ---- - - ------,---
No parefed by Assistanl U.S. Attorney. Referred as misdemeanor to CO\ITt of Genera I Sess ions.
Felony charge reduced to MEANS OF EXIT misdemeanor.
Removed.
FROM SYSTEM No probable cause.
Dismissed by Assistant U.S. Attorney.
10ne Assistant U.S. Attorney, Grand JUlY Division, spends 2-4 houfs on Tuesdays ond Thursdays at U.S. Commissioner's office for preliminary hearings and disposition of cases.
The case is next processed in the office of the U.S. Attorney, Grand Jury Unit. It is screened again and calendared for presentation to the grand jury. The grand jury votes an indictment if there is concurrence of 12 or more of the jurors. Thereafter, the indictment is signed by the foreman and by the U.S. Attorney and returned (generally on Monday) in open court.
Arraignment is the next step. It is generally a perfunctory proceeding in which the accused appears, is advised of the formal charge and enters a plea-usually not guilty. At about this time the case is assigned to an Assistant U.S. Attorney who will probably handle it until final disposition, and a defense counsel is appointed by the court for a defendant who cannot afford counsel.
Following arraignment, trial preparation proceeds, motions are filed and heard, the case is placed on a calendar and) finally, progresses to trial. Only about 30 percent of the 1965 dispositions resulted in a trial; approximately 55 percent pleaded guilty to the offense charged or to a lesser offense prior to or during trial. The remaining 15 percent of the defendants were dismissed.
TIME DELAY IN PROCESSING FELONIES
The time delay problem was approached by analyzing ill detail the data on 1,550 felony defendants whose cases
•• A more delalled descrlpllon and analy.ls of Ih. Dlslrlct of Columbia fclony "ala Is prc •• nted In appendix J.
commenced by filing of indictment or information in the U.S. District Court for the District of Columbia in 1965,40 The time periods that these defendants were in the court system were compared with the timetable developed by the Commission's Administration of Justice Task Force. That timetable proposes that the period from arrest to trial of felony cases be not more than 4 months, with a maximum of 14 days from initial appearance to formal charge. The circled numbers in figure 13 show a further breakdown of maximum time periods between the various steps in the processing of felony cases as recommencicd by the Commission. Also included in this figure are the 50th percentile (median), 80th percPTitUe, and 10Qth percentile (maximum) times observed in the 1965 District of Columbia data. Measured against the recommended timetable and evaluated in terms of best estimates of actual court and attorney time spent on consideration of a case, it can be seen that appreciable delays do exist. For example, 50 percent of the defendants who waived preliminary hearing had an elapsed time between presentment and return of indictment of greater than 42 days, whereas 20 percent had an elapsed time greater than 72 days. The maximum observed time was 269 days. From arraignment to guilty plea the elapsed time for 50 percent of the defendants exceeded 64 days, whereas 20 percent had elapsed tinie greater than 124 days, with a -----_ .......
39
GRAND JURY U.S. DISTRICT COURT
ASSISTANT U.S. I (1 GRAND JURY) ASSISTANT lJ.S. I CRIMINAL COURT (4-5 JUDGES)2 ATTORNEYS (3) ATTORNEYS (13) ..
J. +-1 SCREEN & GRAND JURY ~ PREPARE & ~lINDICTMENT I ~I ARRAIGN- T",~NTENCING 1 PREPARE CONSIDERS REVIEW I- RETURNED MENT MOTIONS
INDICTMENT
GUILTY l I PLEA I -L
----------------------- ------------------------------------Certified as misdemeanors to Court of General Sessions.
Ignoramus.
Dismissed by Assistant U.S. Attorney.
2 The number of judges assigned to Criminal Court increased to 7 in 1966.
ma."imum observed time of 463 days. The timetable recom~nends a ma."imum of 63 days between arraignment and tna\.
!n summary, ?ne.-haif of the defendants who pleaded glllity or were dismissed were in the court system longer than 4 months, 20 percent longer than 7 months. The defendants who went to trial took a median time of over 5 ~onths from initial appearance to conviction or acqUltt~l, 70 ?ercen~ ~onger .than 9 months: Contrary to genelall) held behers, motions were not the main cause of delays.. Only one-half of the defendants filed one or more motIOns; however, one-half of these were filed more than 40 days :!iter arraignment.
Experienced lawyers have pointed out that most of the steps I~ the actual processing of felony defendants require very httle actual court time. The initial hearing for a ?efendant takes only a few minutes; a preliminary hear~ng usually takes between 15 and 30 minutes' a grand Jury can hear, deliberate, and vote on the av~rage case 111 l~ss than 3q minutes; arraignment takes a few minutes, ~os~ ~otlOns can be hear~ in 10 minutes. A guilty plea lequues as much court time as it takes a defendant to answer a dozen questions. The court time spent on a defendant who pleads guilty (approximately one~a~f of the felony d~fendants) probably totals less than
our, yet m the DIstrict of Columbia the median time - ---.-
Dismissed.
Acquitted.
Transferred.
from .initial appearance to disposition is 4, months. The ?ata mdicated that one-third of the time was spent waitm~ for return of the grand jury indictment. After aI'raJ:!5nment on th.e indictment, additional time is required for .the preparatIOn of the necessary papers. But for the typical case, the actual time devoted to this process is a few days at the most, not weeks or months.
COMPUTER SIlIIULATlON OF PROCESSING FELONY CASES
. To study th~ impact of alternative methods of alleviatmg the delay 111 the processing of felony cases the Task Fo:ce dev~l?ped a computer s,imulatio,: of the ~ourt proce~smg .activity. The slmu.latlOn permItted experimentat~on With the court operatmg procedures with no disruption to .th~ act~al cour~ operation. To make best use of the limited time avaliable, an established simulation I,:nguage was selected, IBM's General Purpose Systems SImu!ator (GP~S). The language, designed primarily fo~ slmulatmg mdustrial production processes, proved qUlte adequate to handle the court process.
The resulting model, called COUR TSIM is described more fully in appendix 1. Figure 14 is a flow diagram of the process as it e=:,isted in the District of Columbia Court system. The Circles represent processing units or "milestones" in the processing of a.felon. For example,

40 flGlI~E 13. NUlUER Of DAVS BETWEEN STEPS IN PROCF.SSING OF FElONY DEFENDANTS· 1965
8 50% " 0 _--~~\ ~ 80% = 22 INFORMATION
100% = 92 500'" = 0 -80% = 28 '--------' 100% = 42
8
(0 50% = 0---..... 80% " 0
100% ; 38
o ! ARREST t- 50% ~ 0 DAYS 80% ~ 1 DAY
0) 50% :; 1 80% " 14
100% =< 186
PRELIMINARY HEARING
RETURN OF 500/. =< 33 _ GRAND JURY 80% = 54 INDICTMENT
100% = 178 100% " 218 DAYS
L-________ 50% = 42 BOO,. = 72
100% " 269
o " Maximum number of days recommended by the Administration of Justice Task Force.
50% 50th percentile. 50% of the defendants had rimes which exceeded the value shown.
80% " 80th percentile. 20% of the defendants had times which exceeded the value shown.
100% =< The maximum ti~e observed.
the circle labeled PRS represents tht Court of General Sessions, U.S. Branch, where the defendant makes his first appearance before the courts. The circle labeled USC represents the U.S. Commissioner, where defendants can also be presented. The arrows from one circle to another indicate the possible paths that the processing of a defendant may take; for example, from ARK (arrested) he may be presented to the U.S. Cummissioncl· or his case may be discussed with the DAA (an Assistant U.S. Attorney, General Sessions) for possible presentment at PRS. Finally, the squares represent possible locations in the process where a defendant may exit from the system due to a dismissal, reduction of the charge to a misdemeanor, "no paper," etc.
The numbers on the arrows represent the percentage of defendants from each processing unit which take the indicated path. These percentages were estimated from
the data and by staff members of the President's Commission on Crime in the District of Columbia.
COURTSIM was used to simulate the flow of the 1965 felony defendants through the District of Columbia court system. As the model is presently designed it does not handle the small percentage of cases tha\ requircexcep· tionally long times between events in the system; these could be incorporated into a later version.
The results of several of the simulation runs are pre· sented in table 9 with a summary of a few of the more important time intelvals starting from presentment of the defendant. The first row presents the median times from the 1965 District of Columbia data. The last roW presents tht'! recommended timetable of the Administra· tion of Justice Task Force. The other rowS contain the times generated by computer simulation runs.
The second row is a time summary of the simulation using the conditions in 1965. In 1965, one grand jury
(0 50% " 92 DAYS -80% = 154 DAYS
100% = 316 DAYS
CONVICTION (JURY TRIAL)
o
41
50% = 106 ----.I 80% = 180
CONVICTION V (NONJURY TRIAL) 1--+-50% 38 _~I_S_EN_T_E_N_C_I_N_G---1
80% ~ 53 ' 100% " 232 100% ~ 418
50% " 64 ------I~I 80% 124
100% " 463
50% = 120 -----II~~I 80% 215
100% "' 424
50% " 106 ___ -.1 ACQUITTAL 80% " 200 (NONJURY TRIAL)
100% = 315
50% = 78 ------i.~1 DISMISSAL 80% "' 155 ,
100% " 372
was sitting and an average of five distric . were assig~~d to the crimina.! part of the ~o~~~rt bd~es these conditions, the simulaticm reflected the actu'al c~u~~
operation. I.n both the~e :v.as an average time of a roxiI~ately ~:veeks between Initial presentment and th!;'cturn o an 111 Ictment, and an average of at least 13 weeks from
1965 1965 1965 1965 1965 1965 1965 Adm
Table g.-Representative Felony Processing Times In D ays
Presentment to
cou RTS I M run RetUrn of indictment Arraignment Guilty plea Dismissal
End of motions 1
data (medIan days) basic I....... . .......................•............... 40 53 107
~asic with graiiCi)uiY·Queiiii·eHm1iiiieJ······················· 47 54 116 134 143
aslc wtth ra '. • ••••••••••••.••••••• 16 122 152
basiC with ~It ~:se~r~r~~:~s~dll~lnat~V~d tero tra~sit times.:: 24 90 102
6 8 48 ..P" ___ .. ______
baSIC with rule 87; guilty pleas a\O~ e·· ommlssloner •.•••••• 61 64 131 14 -_ ........ _-_ .. __ .. '"
.b~sic I'!!th rule 87; eliminated queue ~t rc~n~ii················· 38 40 68 140 ............. -............
!n1stratton of Justice Task Force model t1 g t bll~ry ••.•••••••.••• 7 9 37 58 70
me a e maxtmum days). 14 17 80 27 39
.......... -.......... --- 255
) ~ases with at least one motion. 2 First motion decided. I To trial date. lThe mean number of days Is used in rows 2-7.
Ready for trial
'167 160 127
56 164 88 57 80
Time i at gra
n queue 11~ jury ntt u
-
~- .. -......
7 36 8
<1 45 31
<1

42
ARR CPH DAA DAB GJI GJO INF PHR PRS RET usc WCP WPH
neUE 14. FLOW OIACUI OF COUll SIIULATlOIi
ARREST PRELIMINARY HEARING AT u.S. COMMISSIONER ASSISTANT u.S. ATTORNEY, COURT OF GENERAL SESSIONS ASSISTANT u.S. ATTORNEY, GRAND JURY DIVISION GRAND JURY INDICTMENT GRAND JURY ORIGINALS INFORMATION PRELIMINARY HEARING AT U.S. BRANCH, COURT OF GENERAL SESSIONS PRESENTMENT AT u.S. BRANCH, COURT OF GENERAL SESSIONS RETURN OF GRAND JURY INDICTMENT OR FILING OF INFORMATION PRESENTMENT AT U.S. COMMISSIONER WAIVED PRELIMINARY HEARING AT U.S. COMMISSIONER WAIVED PRELIMINARY HEARING AT U.S. BRANCH, COURT OF GENERAL SESSIONS
100
arraignment to beginning of trial. The close correspondence between the actual and the simulated times suggests that the model is a valid representation of actual opera-
tions. '
from 5 weeks to less than 1 week, resulting in a time of approximately 2 weeks from initial presentment to return of the indictment. This is shown in line 3 of table 9. Thus, it appears that for a cost of probably less than $50,000 per year for the additional grand jury and associated support resources, the delay from presentment to return of indictment could be reduced by 70 percent. The total time until the defendant is ready for trial would be reduced from 160 days to 127 days.
The simulation indicated that most of the time prior to arraignment was spent in the Grand Jury Unit awaiting return of indictment (5 out of 7 weeks). By simulating the system with a second grand jury sitting part of the time, the time spent in the Grand Jury Unit was reduced
• -:j)IIIIIII...
EXIi FROM SYSTEM
ACQ ARG CAL CNV CON DCC DCJ MFD MOE MOF PLD SEN
31
ACQUITTAL ARRAIGNMENT CALENDAR CONVICTION CONTINUANCE NONJURY TRIAL JURY TRIAL MOTION FILING MOTIONS ENDED MOTION HEARD GUILTY PLEA SENTENCING
The fourth row givts a I b d times if, in additio 11 ow.er. oun on the average i e as so n, a transit hmes were eliminated . ., on as one I)roce . fi ., ' ant, he proceed' d~smg stage mshes With a defend-
if the next )rocs Imm.e lately.to the next and waits only or he is busl, Ifessor IS unav~l.'able because of weekends trict of Colt}' b' such a c.ondltlOn had existed in the Dis-
IITI la courts m 1965 d' d an average of ap roxim I ,a eten. ant would take to be ready for Fr' I ~te y 2 t;I0nths alter presentment
la, omparmg these times with that
43
100
of the last dro\dv (th~ Administration of Justice Task Force recommen e max') , table appears t'o be I~~:~~bfene can see that the time-
An o~ga.nizational change w~s next examined the prehmmalY processing of all defend t 'dnamely the USC ". an s was one by , .. ommlSSloner (mstead of by both th C '
sloner and the USB h C e ommls-
~~~~ ~~s~~t~ ~f th·is.'r~~a(~o~v 5)ui~cYfc~~nte;:~ ~~s~~~:.{~ ommlSSlOner was not excessive and that the
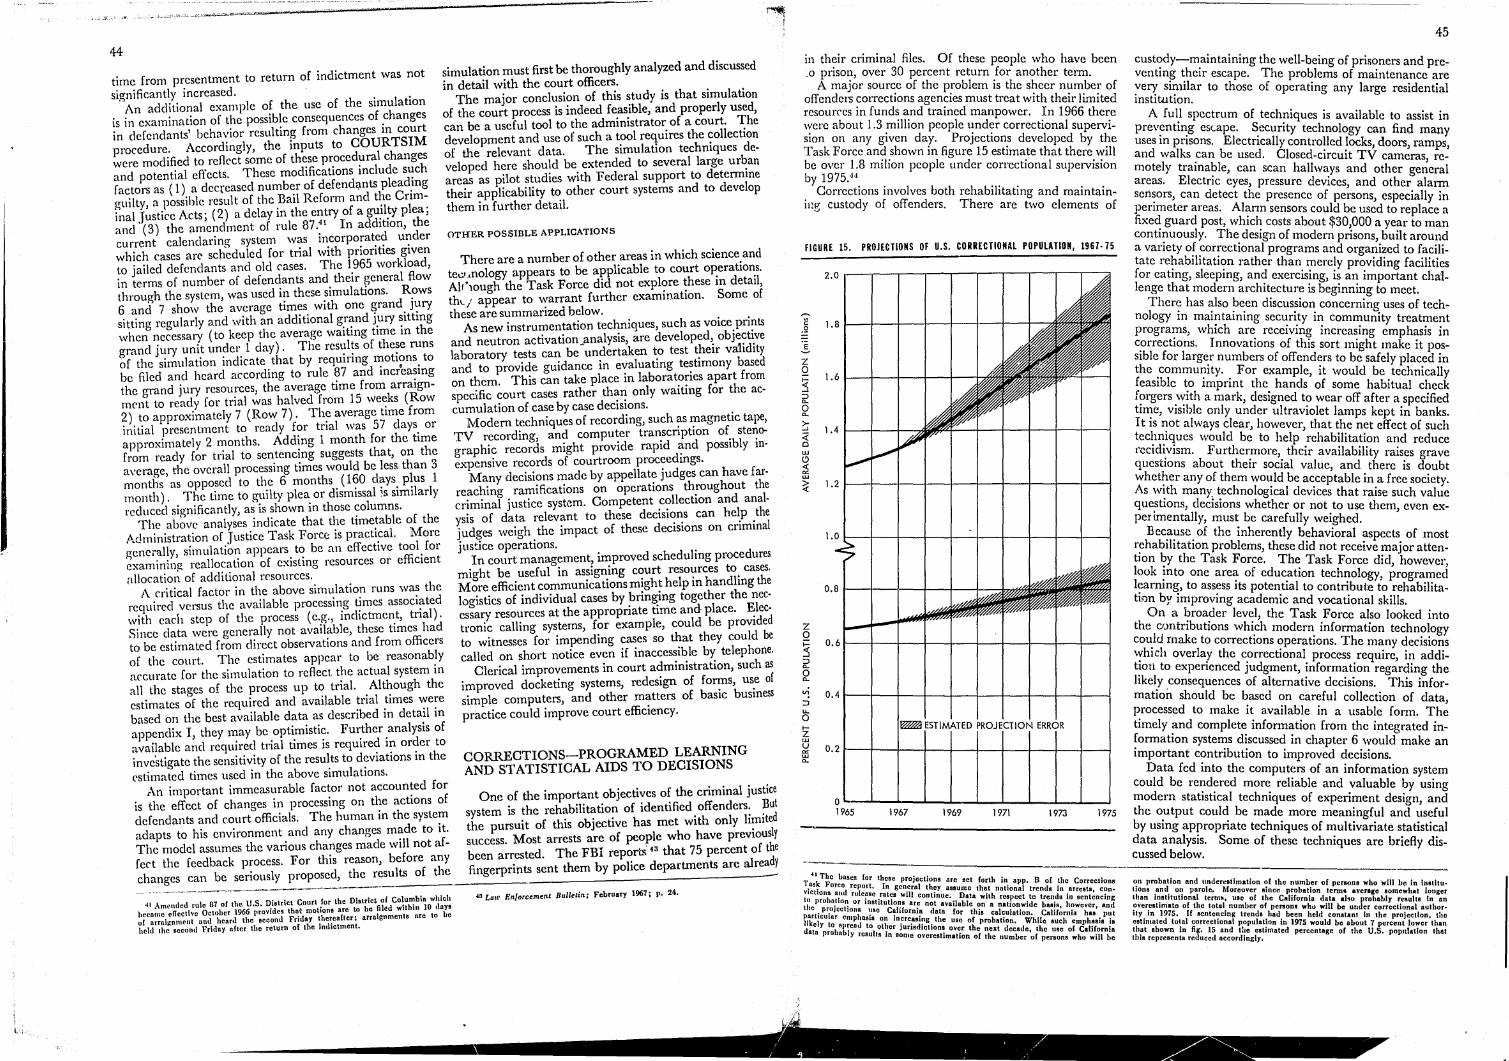
I.,
44
time from presentment to return of indictment was not significantly increased. . .
simulation must first be thoroughly analyzed and discussed in detail with the court officers.
The major conclusion of this study is that simulation of the court process is indeed feasible, and properly used, can be a useful tool to the administrator of a court. The development and use of such a tool requires the collection of the relevant data. The simulation techniques developed here should be extended to several large urban areas as pilot studies with Federal support to determine their applicability to other court systems and to develop them in further detail.
An additional example of the use of the slmulahon is in examination of the possible consequences of changes in defendants' behavior resulting from changes in court procedure. Accordingly, the inputs to COURTSIM were modified to reflect some of these procedural changes and potential effects. These modifications include such factors as (1) a deC(eased number of defend~nts plead.ing guilty, a possible result of the Bail Reform and t1;e CnminalJustice Acts; (2) a delay in the entry of a gu.11~y plea; and (3) the amendment of rule 87:11 In add1tlOn, the current calendaring system was incorporated under which cases are sch'eduled for trial with priorities given to jailed defendants and old cases. The 1.965 workload, in terms of number of defendants and the1r general flow through the system, was used in these simulations. Rows 6 and 7 show the average times with one grand jury sitting regularly and with an additional g.r~nd j.ury ~itting when necessary (to keep the average wa1tmg hme m the grand jury unit under 1 day). The results of these runs of the simulation indieate that by requiring motions to be filed and heard according to rule 87 and incr'easing the grand jury resources, the average time from arraignment to ready for trial was halved from 15 weeks (Row 2) to approximately 7 (Row 7). The average time from initial presentment to ready for trial was 57 days or approximately 2 months. Adding 1 month for the time from ready for trial to sentencing suggests that, on the average, the overall processing times would be less, than 3 months as opposed to the 6 months (160 days plus 1 month) . The time to guilty plea or dismissal 1S, similarly reduced significantly, as is shown in those columns.
The above analyses indicate that the timetable of the Administration of Justice Task Force is practical. More gener'llly, simulation appears to be an effective tool for examining reallocation of existing resources or efficient allocation of additional resources.
OTHER POSSIBLE APPLICATIONS
There are a number of other areas in which science and te.::.t.nology appears to be applicable to court operations. Alt'10ugh the Task Force did not explore these in detail, thLj appear to warrant further examination. Some of these are summarized below.
As new instrumentation techniques, such as voice prints and neutron activation_analysis, are developed, objective laboratory tests can be undertaken to test their validity and to provide guidance in evaluating testimony based on them. This can take place in laboratories apart from specific court cases rather than only waiting for the accumulation of case by case decisions.
Modern techniques of recording, such as magnetic tape, TV recording, and computer transcription of stenographic records might provide rapid and possibly inexpensive records of courtroom proceedings.
Many decisions made by appellate judges can have farreaching ramifications on operations throughout the criminal justice system. Competent collection and analysis of data relevant to these decisions can help the judges weigh the impact of these decisions on criminal justice operations.
In eourt management, improved scheduling procedures might be useful in assigning court resources to cases. More efficient communications might help in handling the logistics of individual cases by bringing together the necessary resources at the appropriate time and place. ~lectronic calling systems, for example, could be prov1ded to witnesses for impending cases so that they could be called on short notice even if inaccessible by telephone.
Clerical improvements in court administration, such as improved docketing systems, redesign of forms, use of simple computers, and other matters of basic business practice could improve court efficiency.
CORRECTIONS-PROGRAMED LEARNING AND STATISTICAL AIDS TO DECISIONS
A critical factor in the above simulation runs was the required versus the available processing times associated with each step of the process (e.g., indictment, trial). Since data were generally not available, these times had to be estimated from direct observations and from officers of the court. The estimates appear to be reasonably accurate for the simulation to reflect. the actual system in all the stages of the process up to trial. Although the estimates of the required and available trial times were based on the best available data as described in detail in appendix I, they may be optimistic. Further analysis of available and required trial times is required in order to inve'stigate the sensitivity of the results to deviations in the estimated times used in the above simulations.
An important immeasurable factor not accounted for is the effect of changes in processing on the actions of defendants and court officials. The human in the system adapts to his environment and any changes made to it. The model assumes the various changes made will not affect the feedback process. For this reason, before any changes can be seriously proposed, the results of the
One of the important objectives of the criminal justice system is the rehabilitation of identified offenders. But the pursuit of this objective has met with only limited success. Most arrests are of people who have previously been arrested. The FBI rep0r't:s043 that 75 percent of the fingerprints sent them by police departments are alre~
oil Arnl'11Ilcti rule 87 of the U.S. District Courl for the District ot Columbia which ht~cRmc effective October 1966 provides thn~ motions are to be filed within 10 dnYB of arrnignment uml l1cnrd the second Friday thereafter; nrrnicnmentB nrc to be IH~hl the second Friday after the return of the indictment.
"'1 Law Enforcement Bulletin; February 1967; p. 24.
in th~ir criminal files. Of these people who have been .0 pnson, over 30 percent return for another term
A major source of the problem is the sheer number of offenders corrections agencies must treat with their limited resources in funds and trained manpower. In 1966 there \~ere about 1.3 million people under correctional supervisIOn on any given day. Projections developed by the Task Force and shown in figure 15 estimate that there will be over 1.8 milion people under correctional supervision by 1975:j.J . Corrections involves both rehabilitating and maintainn:g custody of offenders. There are two clements of
FIGURE 15. PROJECTIONS OF U.S. CORRECTIONAL POPULATION, 1967· 75
c: oS! =
z o ~ ::J 0..
o 0..
vi ::i u. o Z w u "" W 0..
0.8 r--I--t--+-+-+--
0.6 t--t-+-+--+-+-~-J.--I--I--l
0.4 r-t-+-t--+-+-I--+--I--1---l
0.2 1 -t-+-+--+-+-I--+--l--1I---l
~9:6~5--~~1~9~67--~--1~96-9--L--l~97LI--l---l197-3--L--1J975
, oil The bases (or these projections ! h' 1.as~ Forco reJlort. In general the are eet .ort an, app. n or the Correcaions V1Cl1ons and rulcoso ratcs w'U . y assume that natIonal trends in arrests, COn .. to probation or institutions I a conl~nue, 'I ~ita with resJlect te trends in sentencing the. projcclions usc CalUor~ia ndat~vaf a C I <!n a nation.wide ball!s, h?wever, and p.artu:ular emphasis on increasin the u or t( liS cal~ulatlOn •• Cah(OrlllD has put hkely to spread to other jurisd'~' 8e 0 h probatIOn. While such emphasis is data probably results In so Ie lon~ ov~r t e next decade, the ulle of California
me overcshmahon of the number of penons who will be
45
cust~dy-m.aintaining the well-being of prisoners and preventm~ ~helr escape. The problems of maintenance are :,eqr sl~lIlar to those of operating any large residential lllstltatlOn.
A ful.l spectrum of techniques is available to assist in prev?ntlIl;g escape. Security technology can find man uses m pnsOl1's. Electrically controlled locks, doors ramp; and walks .can be used. Closed-circuit TV cam~ras, re~ motely trama?le, can scan hallways and other general areas. Electnc eyes, pressure devices, and other alalTIl sen~ors, can detect the presence of persons, especially in penmeter areas. Alarm sensors could be used to replace a fixe~ guard post, whic~ costs about $30,000 a year to ma~ cont~~uously. The. des1gn of modern prisons, built around a vallety o[ .cor:echonal programs and organized to facilitate re~abllltatl?n rather than. I?ere!y pr~viding facilities for eatmg, sleepmg, an~ exerclsmg, 1S an Important cha'!lenge that modern arch1tecture is beginning to meet. Ther~ has ~Iso ?~en discus:io~ concerning lIses of tech
nology m mal~talllmg secunty m community treatment progra~s, which ar~ receivinl? increasing emphasis in c.orrectJons. InnovatlOns of dllS sort might make it posSible for larg~r numbers of offenders to be safely placed in the .commm:uty .. For example, it would be technically ~easlble t.e Impnnt the_ hands of some habitual check ,?rgers .'~Ith a mark, des1gned to wear off after a specified tJ~e, VISible only under ultraviolet lamps kept in banks. It IS ~ot always clear, however, that the net effect of such tec~l~lques would be to help rehabilitation and reduce l'CC1dl.vlsm. Furthermore, their availability raises grave questlons about their social value, and there is doubt whe:~er any of them wo~ld be acceptable in a free society. As \\ ~th many, ~echnolog1cal devices that raise such value que,stlOns, dec1slOns whether or not to use them, even exper Imentally, mus~ be carefully weighed.
Bec~~se. of the mherently behavioral aspects of most r~hablhtatlon problems, these did not receive major attentIOn ~y the Task Force. The Task Force did, however, look ~nto one are~ of educ.ation technology, programed l~arrun&, to ass~ss Its potential to contribute to rehabilitatlnn by 1mpl'OVlllg academic and vocational skills.
:;>n a ~roa?er lev~l, the Task Force also looked into th~ clJntnbutlOns wh1ch modern information technology cou,Id make to corrections operations. The many decisions ~luch overlay the correctional process require, in addit~on to expenenced judgment, information regarding the hkel'y consequences of alternative decisions. This informatlOn should be based on careful collection of data ~rocessed to make it a.vailable in a usable fonn. Th~ timely ~nd complete information from the integrated in~ormatlon systems discussed in chapter 6 woulc!" make an 1mportant c?ntribution to improved decisions.
Data fed mto the computers of an information system could be re~d~red mor~ reliable and valuable by using modern statlshcal techmques of experiment design, and the o.utput could be made more meaningful and useful by usmg appropriate techniques of multivariate statistical data analysis. Some of these techniques are briefly discussed below.

46
PROGRAMED INSTRUCTION TO AID REHABILITATION
The great bulk of crime and delinquency in the United States is committed by males in an age group extending from the middle teens to the early twenties. In 1965, the group from 15 through 21 accounted for over one-quarter of the arrests reported in the FBI's "Uniform Crime Reports", and over one-third of the arrests for offenses other than drunkenness. . Most of these individuals begin their criminal or delinquency careers while still juveniles.
Many delinquent careers are associated with failure in school. It is a short route [rom academic failure to dropping out of school, to idleness and unemployment, and then entry into a spiraling criminal career. Some dropouts fail because they cannot adapt to a classroom social situation. Were there some alternative way of educating them, they might find a f!"';;mling place in the community and refrain from crime.
The populations treatC',l in correctional programs are usually composed of individuals in their late teens or early twenties. Although they arc generally not particularly deficient in basic irltelligence, most of them are at an educational level wmewhere in grade school:l" Many arc ripe for rapid advancement through the next few grade levels if the proper means could be found.
Few of those leaving correctional institutions, including those leaving juvenile reformatories, return to school. One of their principal needs is for the steady income of a secure job. Fnlm society's point of view, there is no better way for them to obtain their livelihood. The opportunity to upgrade these people may exist only while they are in the correction.-ll system, an average time of less than 2 years. Thus, if they are to be significantly helped, they must make up lost years of education in a matter of months.
Programecllearning seems to offer one way to help do this. It is currently being conducted with published booklets in at least two correctional institutions and experimentally with computers at several research centers. The basic technique of programed instruction is that of breaking the learning process down into a number of specific steps to be completed by the student, with immediate reinforcement contingent upon successful completion. The steps may be large or small, depending upon how much the student can reasonably negotiate.40
The student works through the educational material on his own, testing his understanding at frequent inter· vals. Whenever his responses exhibit lack of comprehension, he is diverted back to correct his d('ficiency. He works at his own pace, he checks his own performance, and he can do most of this alone. The methods of programed instruction are geared toward having the particular student achieve a desired level of competence in a given section of knowledge at a rate compatible with his individual capacity to learn. A learning program is completed only when the individual student is brought up to the desirecllevel of competence.
Experiments with high school students suggest that such teaching techniques may be particularly effective in
is ThD juvenile first·offender populntion contains the (ull range from the CcchIc· minded to the genius, with mcnn t.Q. in the lower pnrt o[ the normal fnOlte. For oxnnw1e, tho R\'Crngo I,Q. of 100 boys nnd 100 girls in tmining schools in Iowa in 1955 was 9Ij,'l for the delinquent boys and 9'l.1 (or the delinquent girls. Dcllnquont boys nrc usually 2 tu ·l yenrs or 11\ore retarded in school level. Sec W. A. Lunden. Stali.tics 011 Delinquents nod Uclinquency, Thomoll Publishing. Springfield, 111., (1964, pp. 81. 88).
•• Gilbert, Thoma. F •• Mathellcs, tho Technology 01 EdueaUon. "Journal 01 Mathotlc .... 1-25. (January 1962).
improving the learning of students whose motivation to learn in ordinary classroom situations has been destroyed by years of failure. This expectation has been borne out by the experience with programed instruction at Job Corps centers throughout the Nation. Since the population of correctional institutions is largely composed of individuals with such a history of failure experience, it would appear that programed instruction i" particularly appropriate for them.
Several correctional institutions have begun pilot projects which involve academic programed instruction. At the CASE experiment at the National Training School for Boys in Washington, D.C., programed instruction was part of an experimental attempt to establish reasonable behl1.vior patterns by rewarding good behavior by subjects under continuous supervisionY During the program's 2 years, it showed considerable success. Over 90 percent of the boys involved achieved an academic upgrading exceeding 4 school years during the first 6 months of 1966.
For the past 4 years, the Rehabilitation Research Foundation at the Draper Correctional Institute,48 in Elmore, Ala., has been conducting an academic educational project using programed materials almost exclusively, with an occasional lecture by a guest speaker. The academic instruct'::m at Draper covers more than 350 courses, ranging from literacy training to college preparatory work,49 Students spend 35 hours a week on their academic courses and have found that only 1 percent of the students fell below the 85-percent requirement on final mastery tests,
In addition, for the past ,2 years vocational training programs have been conducted at Draper using programed learning aids. The programs have been integrated into vocational courses covering barbering, bricklaying, welding, electrical appliance repair, radio-television repair, automobile servicing, and technical writing, These courses were set up to correspond to job placement potentialities in the vicinity of Elmore. The learning programs used in these vocational courses were developed and written by the Rehabilitation Research Foundation at Draper. As of early 1966, over 25 vocational booklets were either published or in preparation. The entire vocational training program at Draper costs slightly less than $1 per student hour. This includes the cost of voca· tiollal instruction, counseling services, and the cost of developing, wri ting, and publishing the programs.
The introduction of computer assistance in programed instruction courses has potential for handling many more students with more complex programs. Their present costs are somewhat greater than the manual techniques. The IBM Instructional 1500 series rental costs are in the order of $1.50 to $2 per student hour, The cost of constructing a computer instructional program is pres· ently estimated to run from $2,000 to $6,000 per instruc· tional hour. It can cost as much as $10,000 per hour of instruction to write, test, and revise a good computel instructional program, and may take as long as 3 or 4 years to do a good job. Some of these costs are likely to decline in future years.
-1.1 Cohen, Il. C., Filipczak, V. A., nnd Dis, V. S., "Contingencies A}lplicable I; Special Education 01 Delinquent" Eetablishlng 24·hour Control In an Expe,lm,nl; Cottage," Institute (or Behavioral Research. Silver Spring, Md" 1966.
-'8 Draper is onc of three mo.ximum security institutions in Alobamn. •• Egeilon. John. Where They Try to Make Wintle .. Out 01 Men Who 111"
Always Loat, '·Southern Eduf;atiOl1 Report, I, May-June 1966.
47
STATISTICAL TECHNIQUES TO AID DECISIONS
The.ce are many decisions which must be made in th operAuon of a t' 1 e " ~orr~~ IOna system for which statistical estimatIOns of an mdlvldual's probable future b h . n I d . . e aVlOrare ec~ssary. n. eCldmg ?n probation or parole, infor-
mation concermng the hkelihood of the' l"d I t · " me IVI ua re-urmng to cnme IS essential In " . I 'fi " . . asslgmng a secuntv c assllCatlon, 111formatlOn concerning tIl I' b'l' I t· t ·th· f '" e re la I I ty or IUS WOl l11ess 0 the 111chvldual is neecled 1 I . _ . I . n se ectm<T a COlrectlOna program for an individual an estimate i~ n~eded of the exp~c~e~ effects of each of the variou; )1'0-
glalms o~ t~e. reCIdIVIsm and general rehabilitatio{l of suc 1 an mdlvldual.
b J~t as impo.rtant as the .evaluation of the individuals e170 t.reated 111 a correctIOnal system is the objective
eva uatlOn of the treatments themselves The managers must decid.e what kinds of trea~ment ~~o~~: ~~oy.ld be ~ade av~lIable and to whom they shotfId be I pled. \ et, ~esplte both the pressina need and tI
rea3Y dopportul11ty, the application of ~ound scientiJ~ ?1e
10 ~ 111 the field of corrections has been very slmv In commg.03
Most of . the information presently available bearin upon questIOns slIch as these is in either of two form; Fl.rst, . there are many "rules of thumb" h' h h e' l' If' w IC ave . \ ~ \ ee out 0 expenence and arc justified or rationalized I~ arge part on the basis of anecdotal histories of 0 eratlOns. . Sec?nd, ~here are mnny .statistical tabulatio~s of operatIOns m whIch there was neIther a control group nor an adequate characterization of the experimental group
In r~cent years, though, controlled correctional experi~ mentatIOn has .become somewhat more widely employed One. example IS the California Youth Authority's com~ mUl11ty treatJ:nent project,o.1 in which an experimental group was gIVen community treatment and a control g~O\lP was treated in an institution. Here an attempt \\ a~ made to relate the parole revocation probability to ty~e .of tre~tm:nt and to individual personality characterIstics. Slgl11ficant differences were found between the two treatme~ts, and the difference varied stronglv with the personahty typ 55 TI . I f e. 1e expenmental group was ou~d to have only 60 percent as many parole revocations
as t. e control group. Two of the six social types GO how'hel d~~'ed better under the institutional program' though tel - er.ence :vas not significant. Alth~ugh' the results of thIS partIcular project are highly tentative 't I represent .the. b:ginning of a much needed effort t~ Ic~r~~~ late both 1l1tilvldual :h~racteristics and type of treatment t? subsequent cOI;1mlsslOn of crimes, rearrests, reconvictrons and reCOml1l1tments.
. Sta~istic~1 analyses of large numbers of criminal-careel' ~lls.ton('s WIll .be, requi.recl to provide these needed correatlOn.s. StatistIcal mds for helping in sentencing and
s.elec;tlOll of prop?!' treatment of in~lividllals unde'!, ~orlectlon~l supervIsIon should be developed.
f~ wIele ra~ge of te,chniques of statistical analysis are avallable, whIch one IS relevant being dependent upon
r .. 1 Gloser, DanIel, Scientific Evidence I Pt. tho NinetY·Flrst Annual Congress oC Co~ec!llC f, SAil r~cntlnll "Pro('cedll1J;S of 196,1, pp. 134-l9. ons, 111. orr. Assoc" New York,
• Calilornla Youth Authority (11 G S k Project: Research Hepart No 6 1965 • tnr, Director), Community Treatment
r.r. Tho personality lypes "wc~c· ABo' 1 ' • (armlet'cultural, neurotlc.ncting Ol~t CID ;tggrcjshc, conformu1l.intntnture, con .
ro Neurotic.anxious nnd mnnipulnt~r.ncuro e·nnx oue, nnd manIpulator,
48
'd . 57 the nature of the specific problem under conSI eratIOn. Various forms of multivariate statistical analysis 58 ~an
be used. Multiple discriminant analysis,5!1 en;ploymg regression estimation techn!ques,OO c.an l?e used m ca,~es where the events to be predicted are 111 discrete categolles (e.g., types of crimes), rather than along some naturally ordered continuum (e.g., arrest rate).. . .
In addition to assisting in treatment selectIOn'. statistical techniques of experiment design must play a~ Important role in correctional program developn~ent. testmg, evaluation, and planning. Of all the behaVIOral area;;, offender rehabilitation offers perhaps the best opportumty ~or reasonably careful experimental control to determme the effects of actions taken. There should be an expanded use of careful, controlled evaluation in the development of correctional programs. Program deve!opment s~ould be preceded by careful studies of the speCific correctlOnal objectives, and testing should be conducted ?y pers.o~nel qualified in thc bchavioral sciences and 111 statistical analysis.
REDUCING OPPORTUNITY FOR CRIME-AUTO THEFT AND STREET LIGHTING
The problem of crime prev~ntion is. an e~tremely .co~plex issue that ultimately reqUIreS .dealmg with th,e dlve.Ise causes of crime. The most basIc means of p[ev~ntmg crime is by reducing the .ne~d or d~si.re of po!entIal offenders to engage in cnmma~ a~t~vlty, Tlus can be accomplished by helping them mdlvldu?-lly through providing fuller employment, better educatIOn, and personal counseling and therapy when needed. Even more fun~amentally,Cit can be addressed by reducing the ma~y SOCIOeconomic causes of crime through programs which have objectives much broader than crime control alone. Those basic problems were outside the scope of the work of the Task Force. There are, however, a number of m?re immediate ways in which technology can address specific problems in crime prevention. .
counts for about one-third of the part I crimes in ~he United States: Auto theft, larceny of auto acccssones, and larceny from autos each repr~sent about .11 perc~nt of part I crimes. Design changes In aut.omobtles makl?g accesories such as hub caps, seats, radIOS and ~attenes less easily removed, ('ould reduce the illegal traffic m these items. .
In addition to hardening the t.arget, th~ ~nvlronment can be made less conducive to crtn;~. C11mll1al~ c.an be inhibited by increasing the probab1h~y that their Illegal activity will be detected. Many kl~ds of se~sors and alarms, discussed in chapter 2, ar~ available to ~Isc~uragc intrusion into unattended premises. Clos~d-clrcUlt TV could be used to maintain continuous survellla~ce of traf. ficked areas. Bogus check passers can be discouraged by a camera that photographs all check .cashers. People subject to a high risk of robbery, such as lIquor merchants, gas station attendan.ts, and ban~ clerks, \,;ould ca;ry concealed radio transmitters by which they could trtgger an alarm.
Clearly there are many means by which te.chnology can be applied to reduc~ crimin~l opportunities. Two of these automobile deSIgn modlficatJOn as an example of targ~t hardening, and street lighting as an example of an inhibitor, are discussed below.
INCREASING THE DIFFICULTY OF AUTO THEFT
Auto theft is prevalent and. C?stly. In 1965, 486,000 autos valued at over $500 mlllton were stolen. About 28 percent of the inhabitants of Federal prisons are there as a result of conviction of interstate auto theft under the Dyer Act. In California alon~, .auto thefts cost the criminal justice system over $60 mlll.lOn yearly.
The criminal iustice system itself prevents cnme by pos-ing a threat of- appl:ehension ~nd a r~sk .of con?equent punishment; by temporarily lllcapacitatlllg ~rlmmals, especially potential repeaters, generally through mcarcer~don; and by rehabilitating past offe~d~rs. .Th~ focus In
this section is on means outside the cnmmal Justice system
The great majority of auto theft 1S for temporary use rather than resale, as evidenced by the fact that 88 percent of autos stolen in 1965 were recovered. In Los Angeles, 64 percent of stolen autos that were rec?v~red were found , .... ithin 2 days and about 80 percent wlthm a week,Gl Chicago reports G~ that 71 percent of tl:e reo covered autos were found within 4 miles of the }J01~t of theft. Data from Berkeley 63 showed that 82 p<;rcent.of the recovered autos were found in Berkeley ?r m pohce jurisdictions contiguous to it. The FBI estimates tl~a( 8 percent of stolen cars are taken for the purpose of strJp' ping them for parts, 12 percent for resale, and 5 percent
for crime prevention, . ., Technology is directly appli.cable t~ reducI?g ,~nmmal
opportunities through protectmg or hardenmg targets of crime by making them less vulnerable to theft and by inhibiting criminal activity. Homes and va~u~bles can be protected by better safes and locks; magnetIc lllks can be used to curtail the use of bogus checks; photographs on credit cards would reduce improper use; eventually, store owners will be able to establish immediate identity and sufficiency of credit with the aid of electronic data
for use in another crime.o.j
Auto thefts are primarily juvenile ac~s. Althou!Sh only 21 percent 05 of all arrests for nontrafflc offenses 111 1965 were of individuals under 18 years of age, 63 percent of auto theft arrests were of persons under 18. ~uto thef~ represents the start of many criminal careers; IU an FBd sample of juvenile auto theft ",ffenders, 41 percent ha
no prior arrest record. The theft may come about simply because a boy see~ a~
unlocked automobile readily avaIlable. Berkeley, Cahf., reports that 49 percent of the. au.t~s stolen in 19.65 had a key left in the ignition or t.he IgmtlOn open. Milwau~
processing. . , The automobile is ;1 common target of theft whIch IS
particularly susceptible to devices of hardening. It_~:_ " .. ~--.- '--~-~'-'--~'---' -.. ~-~-~-.-,~----...-..-..----'"'" . t\0Wnrncr Stonley L.
t Multivariate Regression of Dumt~Y_ Y8r:~t~~ ~~~
n111\ mathematical ternlS, u typical prb~blilem i[s onil?f. C81h1~\1:~ ~C~i~~l It:~~t!~~~; Normolity AS8umptions, "Journal I 01 AAml~ic~\ n~:cM:d~oc:::lm~afY htgttl' tino n=f(T.J') wherc R \8 the pfoba 1 ly.o rcc (IVlsm, •. f' 63 1963~ Cox, D. R., Two Furt ler pp 51J- 0 Q
ntlrihutcll and I' is ,n set ul persona) nUtlhUtl'8 of Jhc JmhVluuat. The !mc:~on sio'n UBiomctrics:" 45 562-5. 195B~ I is cencr'l\lly R88llmed to he linear, Rnll lhe 8talll8tiCOh PJib1cI3 is tnct n(c~:UT'n tl~n~ 01 'uLoR Angeles' p()1i~c ~tort Digest,'; 196.~ 1.9~5. 1 Recovery done by the Chi· ilB coeffidculS Irom the nynilnhtc, data, ,l1nd t len III nl; 16 reo In O~ Study on Distanr .. ...-holn Point 01 The 1 to am 0 ",Iuhnl.c. RIot eneh hllllVlllunl wllh nttrlbutes P. S I' I A I ... J Wille), c.~o Poll:e D~:~ lor July 15 to July 21. 1.?,?6.
MAnderson, 'l'- W., ''In\rollu£:tion \0 Multivariate tnt shea na )'SIII, • I.l3 Df": .. ~~iii::'Po1icc Annual Rcport, 19\)0). /:. Sons, New York, 1958. . ., A I I A~ ~iorm Crime Reports, 1965, p, 18.
riD Mlllcr Hobert G., Stntistical Prediction by Dlsc'tlm.mant no ~~~' DV-- fIG U~ilorm Crime Reports. 1965. M<t.rologl~nl Society, vol. ", No. 25, Oetob"r 1962;R Ritllg:, ~3' ~~~[%I- 00 Berkeley Caur., Pollee Anual Report, 1965. eriminant Anl\lysis: An Illustrntion, HAm. Socio(ogical evew.;;,. ..... J
i
Wis.,61 reports that 37 percent of the autos stolen had the ignition open or a key in the ignition. The FBI reports that, nationwide, 42 percent of the autos stolen had the key in the ignition or the ignition unlocked. Even of those taken when the keys were out, at least 20 percent are stolen by merely shorting the ignition with tools as simple as jumper wires, paper clips, tinfoil, and coins.
The effects of changing the ignition system to make theft 1110re difficult were studied on the basis of St. Louis experience. Figure 16 shows by make and model year the number of Cai'S reported stolen in St. Louis in the first 8 months of 1966. The Chevrolet was the most frequently stolen car, well out of propOrtion to its registration for models p·rior to 1965. Figure 16 also shows the ratio of these numbers of stolen cars to Missouri registration totals, i.e., the probability, by make and model, of a car registered in Missouri having been stolen in 1966. The sharp drop in theft probabilities of the 1965 amI 1966 models indicates that the change in the Chevrolet lock (eliminating the unlocked "off" position) in 1965, resultE'd in about 50 percent fewer 1965 Chevrolets stolen than the previous year's models. A similar effect occurred for Buick theft probabilities, due to a similar ignition change. The increase in thefts of the othr;r makes was overshadowed by the decrease in ChcvlOlet and Buick thefts. Thus, the 1965 Chevrolet and Buick owners in 1965 and after had more protection than the owners of previous )'ears' models,
These findings suggest that the easy opportunity to t.ake a cal' may contribute significantly to auto theft and that thefts by the relatively casual o~ marginal offender would be reduced by making thE'ft more difficult than merely starting the car. Educati,onal camp2,igns advising drivers to remove their ignition keys and 1.0 lock their cars arc important, but their effects arc difficult to sustain.oa Some cities have ordinances imposing penalties on drivers who leave keys in unattended vehicles.oD
Lock design has been aimed at increasing the number of difl'crent key combinations in order to reduce the thefts due to "try-out" or ('master" keys.
A more fundamental change in the ignition system and other automobile components is needed. Many possib il.i ties exist. Spring ejection locks can prevent the ?rIver from leaving the key in the ignition i sturdier housmgs can enclose the ignition terminals; heavier metal cable can surround the ignition wires; steering-wheel or transmissiOJ:-locking devices can be used, as is done on severa! foreIgn cars. In 1960, the Federal Republic of Germany made the following a part of the Highway Code: "Passenger cars, station-wagons and motorcycles sho~ld be equipped with an adequate safety device agamst unauthorized use of vehicles. The locking of the doors and removal of the ignition key are not regarded as safety measures within the meaning of the preceding ~entence." The "adequate safety device" includes steerlI1g colu~n locks, gearbox locks, gear-lever locks, devices rnechal11cally preventing starting of the engine, and spoke locks. These devices must also satisfy the requirements for traffic safety, e.g., an unintended blocking of the ~~-'~ .. ~= ... --------~--,-'---~. --~ 1~~lilw.ukC<, Wis., Second Quarter 1966, Statistics on Auto TheIl, July 14,
"" TI'e 1/0"81an polie II ( d I I ttil,IUt -,I t 1 C C I e reportc t lB.l 0. 965 edUCAtional compa{gn \!on .. of )%6 I n 3'llcrccnt reduction in auto thehs during 1965. The firs~ 10 month" tile sal~c l~:ri~~{, ;h~~~l n(.~1·p~rccnt Inc.l;~,a8c jn auto thelts )11 Houston oyer Burcau; Jnnuary-.?ebruary· 19(7) ~hon l\eporl 01 the National Automobile Theft
49
steering mechanism while the ve·hiclc is in motion must be impossible. .
Since the installation of such devices, the rate of auto thefts in West Germany has decreased from 1,244 thefts per 100,000 cars in 1961 to 829 chefts per 100,000 cars in 1964. The West Gennan Federal Criminal Police feel thqt "the statistics definitely indicate that the additional protective devices have been effective in reducing motor vehicle thefts. They recogni~e that very probably a large percentage of this reduction has been in the category of what might be described as 'joyriding' thefts as distinguished from thefts committed by more skilled and determined thieves." 70
This problem has been discussed by Task Force and Department of Justice representatives with the four major automobile manufacturers. The manufacturers have agreed to develop and install devices to increase the se?ur!ty of their products, These will include making the 19mtIOn system connector cable much more difficult to remove from the ignition lock, increasing the ignition key combinations, and locating the ignition system in less accessible places. These basic improvements will be ~ade in t~e 1968 models. One manufacturer plans to lllstall on ItS 1968 models a buzzer which will signal the driv~r ,,:,~en he opens the door that he has left his key in the IgmtlOn. Hopefully, other manufacturers will also address this problem. . Although the above steps will contribute to the reduc
tion of auto thefts, the following additional improvements should be cal'efully considered:
A steering column and/or transmission lock which immobilizes the car when the gear-shift lever is put into the proper position and the key removed. With this type of lock, starting an engine by shorting the ignition docs not permit the car to be driven away.
An ignition system which causes the drivel' to remove the key from the ignition. This can be done by a spring-loaded look or key which pushes the key OlUt; 01' by requiring the key to be not only turned, but also pulled out of the ignition in order to sitop the engine; or by attaching a buzzer which goes off if the key is left in the ignition when cl1e engine is turned off.
Although the automDbile manufacturers arc best able to integrate such devices into the design of their vehicles, it is desirable that some Federal agency work with them to establish minimum requirements on the actual implementation. This responsibility could well be assigned to the National Highway Safety Bureau as part of its program to establish safety standards for automobiles.
STREET LIGHTING
Improved street lighting is frequently advocated by police and highway departments as an important tool for combatting crime. Its proponents believe that adequate.
. 01' It hoa been reported that in on,~ country in South America policQ officers al;'O
.nstructed to denale IIreo 0/ vehlcl." In which key •• re lell, thcreby o.tcn.lbly protecllng Iho owner'. yehlcle from But a theft. Another po"lbllhy Which 10 lometimcs dilcuuetl is removIng the keys to the nearellt "o1lce slation fOT ,afe.kee"lng~
TO Memorl\nlluJI\, American Embau:." Bonn, Germany, July 20, 1966.
----------------- ----------.---~--

50
UJ J: .... Z
nUll 1&. AUTO TMEFTS AS A FU.mOM OF IAIIE AU 10m YUI
0.007 ~-----r-----r----"'---,i---I
1964 WAS LAST MODEL BEFORE
IGNITION CHANGE ON CHEVROLET AND BUICK
oL-____ -J ______ ~ ______ ~ ______ ~ ____ ~
••••••• CHEVROLET • _____ OLDSMOBILE
.. 'II .............. BUlCK -",.."..,"'.." .. FORD ____ PLYMOUTH ___ PONTIAC
400~----~~~~~-r-------.--------~------1
,. " ,. " .,' " .' . 300L-------+-------4..~----4_--~ •• ,---t------~ ,. ,. ,. " " ". ,.
,. ----~ 200~--~a'!~----_r----t_----_r~~ ~" ,
" '. , , 100~------~-------~-----_r----~~
1962 1963 \964 \965 1966
MODEL YEAR
street lighting will ( 1) deter certain types of street crimes by increasing the risk of detection of the offender i and (2) enhance the probability of apprehending the offender. These assumptions are fortified by the general sense of security which is induced in the individual by the presence of adequate street lighting. Police and citizens alike frequently remark that they have no proof that improved street lighting reduces crime, but they do know that they feel safer. And if lighting encourages greater use of. p,;!blic stre;ts and parks, thi.s in itself may discourage criminals. Smce much of crime occurs at night, there is considerable intuitive support for the feeling that street lighting will suppress crime incidence. According to data compiled by the Los Angeles Police Department during the year of 1965, there were 164,000 reported offenses and attempts. Of these, 49,000 were committed during the day, 75,000 at night, and 40,000 at unknown times. Likewise, certain crimes such as highway robbery, aggravated assault, purse snatching, and rape have a higher probability of being perpetrated at night.
Unfortunately, existing studies do not present definitive conclusions as to the effects of lighting on crime.
In 1956, the central business district of Flint, Mich., was relighted. Six-thousand-Iumen incandescent lights were replaced with 20,OOO-lumen multiple f10urescent bracket-type lights. A study over a 6-month period indicated that there was a 60 percent reduction in the number of felonies and misdemeanors, and 80 percent reduction of larcenies. However, there was, at the same time, an increase in police surveillance in the area. Since the experiment was not controlled, the effects of patrol and relighting are combined, so that any conclusions on the effects of street lighting must be considered only tentative.
In New York City, four police precincts designated as high .crime areas were converted from incandescent lighting to mercury vapor lighting. The rate of nighttime crimes dropped by 49 percent after the installation of the lights. In 1964, after 80 percent of the city street lighting had been converted over a 4-year period at a cost of $58 million, the total felonies in the city increased by approximately 43 percent. It is impossible to determine what the felony rate would have been if the lights had not been installed .
In St. Louis, t,here seems to exist evidence of a favorable impact by street lighting on certain types of crime. A program of improved street lighting' was first begun in 1964 in a principal business district in the downtown area. In a comparison of recorded criminal acts in 1963 with those of 1965, it was found that crimes against the
51
person decreased by 40.8 ptrcent, auto theft by 28.6 percent, and business burglaries by 12.8 percent. In another' study involving a high crime district known as Central W"st End, an increase in crimes was recorded, but the rate of increase was not as high as in the surrounding areas. In addition, the overall increase of crime was lower than anticipated in these two areas.
The studies do not present definite conclusions as to the effects of lighting on crime. Methodologically, there are many problems which need to be overcome before definitive statements can be made. For example, very few experiments can be labeled as controlled. As noted in the Flint study, improved street lighting may be accompanied by other changes such as increased police surveillance. Likewise, subtle changes in the size and character of the population may accompany the lighting change and markedly affect the crime ratt:.
In addition to thesf problems, the task of conducting unbiased and controlled experiments is difficult and may involve considerable expense. One would want to discover which crimes were affected and under what conditions, i.e., what kinds of lighting are effective in what kinds of situations. This would require a statistical breakdown of crimes by block before and after relighting, not only in the relighted area, but in adjoining areas. It would require information as to the past, present, and projected crime rates and it would involve correlating these rates to the kind and intensity of the light. At present, these data are not available. The only results it is possible to reach now are:
There is no conclusive evidence that improved lighting will have lasting or significant impact on crime rates, although there are strong intuitive reasons to believe it will be helpful.
Improved street lighting may reduce Gome types of crimes in some areas, i.e., given a light and dark street to commit a crime, a criminal will·probably choose the dark street.
Improved street lighting accompanied by increased police patrol can reduce crime rates in an area.
When new lighting programs are instituted, police departments should be encouraged to maintain records of crimes in the relighted and adjoining areas. With information on past, present and projected crime rates, it may be possible to assess better the impact of lighting on crime.

Chapter 5
Analysis of Crime and the Overall Criminal Justice System
NEED FOR ANALYSIS OF THE OVERALL CRIMINAL JUSTICE SYSTEM
Previous chapters have examined some of the ways in which systems analysis can be used to help improve the operations of the police and court components of the criminal justice system. There are distinct limitations, however, in looking only at the parts. What is also needed is a means of relating the parts to each other. The criminal justice system must be viewed as an integrated whole, especially in formulating budgets and in developing programs at State and local levels.
Police, court, and corrections officials all share the objective of reducing crime. But each uses different, sometimes conflicting, methods and so focuses frequently on inconsistent subobjectives. The police role for example · f " IS ocused on deterrence. Most modern correctional thinking, on the other hand, focuses on rehabilitation and argues th~t placing the. offender back into society under a superVised commumty treatment program provides the best chancc for his rehabilitation as a law-abiding cItizen. But community treatment may involve some loss of deten'?nt effect, ~n~ the ready arrest of marginal offend~rs! mtended to nClghten deterrence, may by affixing a cnmll1al label complicate rehabilitation. The latent c?nflict? betw~en the parts may not be apparent from the VleWpOll1t of either subsystem, but therc is an obvious need to balance and rationalize them so as to achieve optimum overall effectiveness. · Thi~ process of ~:>al~ncin~ and rationalizing potentially lI1COnslstent subobJectlVes IS done at present, when it is done at all, on a largelly subjective basis rather than ~hrough mea?urecl assessment of the consequences of varIOUS alternatives. -r:he allocation of necessarily limited bu~gets and the chOIce of methods with which to handle vanous offenses anq of1"enders could be done more accurately if such overall system assessment could be made. · Systems. an~lysis provides one framework for attemptlI1g an objective asse~smc~t of. the ~riminal justice system as 'l; \~hole. The dlsct"~lon 111 thIS chapter takes some prelllnmary steps in these directions, using a simulation model of the criminal justice svstem. The model was devel~ped and computations p~rformed with the limited aV~llable data, supplemented by hypothetical data, more to .Illustrate what might be done than to arrive at defimti~e conclusions. As such, the work raises some basic questIOns and provides a foundation upon which further
(r~~';l~i; 7,,;_,gol be er;onel0ltaly inlerred Irom lh. lacl lhal a high proporlion -, percent 0 those arrested have a prior uresl record.
____________ ........ I ______ ~-------------
research can be built. It also identifies data which must be collected to be able to evaluate alternative actions in the total system context.
One of several possible examples can illustrate how lit~le of the basic data is now available. Although it is faIrly well documented that there are over 6 million arrests made each year in the United States for nontraffie offenses~ it has not been known what percentage of the populatIon ever gets arrested. The incompleteness of most arrest records makes it difficult to estimate the proportion of arrests in any year that are of persons never before arrested, a figure necessary for determining what percentage of the population ever gets arrested. A mathematical analysis presented in appendix J used the lowest estimate-one new offender in eight arrests-on the basis of which it was calculated that if present trends continue at least 40 percent of the male children living in the United States today will..be arrested for a non traffic offense sometime in their lives. For boys living in cities t~~ fig.ure. i~ in. t~e odeI' of 60 percent; for Negro boy~ hvmg 111 CItIes, It IS about 90 percent. These projections arc based on current arrest rates, which have been increasing in recen~ years, so in some respects they ij1ight even be conservatlve. On the other hand, the inherent incompleteness in arrest records leaves open the possibility that even. the one-eighth estimate ~t the first-arrest rate may b~ high. Of cou:se, changes 111 arrest practices, such as WIdespread adoptIOn of the Commission's recommendation not to treat drunkenness as a criminal. offense, could reverse the trend.
The fa~t that these projections are so surprising to most obselvers lllustrates how little is known in fact about basic questions in the criminal area and how important it is to try to find more answers. For if sustained by additional data, these estin;ates must raise many basic questions about the operatIOn of the criminal justice system and about the nature of police intervention. They would refute the common notion that most people never encounter the criminal justice system and only a small class of ':criminals" do.7~ Although these statistics, and many hke them, are VItal to understandinrr how the criminal justice system operates and to raising critical questions there are now no estimates, however tentative, of many such numbers.
Even more important for policy guidance is the need for information on the likely consequences of actions that change the system. One way to collect data about such
53
1 1 ./,.
54
relationships would be to make changes in th~ operations and observe the effects directly. Wherever practical, this kind of controlled experimentation is clearly to be preferred. But it is often impractical and even undesirable. Not only are the costs often prohibitive, but normal operations are frequently too sensitive to be disrupted. Instead, it may be possible to formulate a mathematical description or "model" of the system which, with data collected from the current system, could be used to explore the relationships among the various parts. The construction and manipulation of such mathematical models to find out how better to organize and operate the real-life systems they represent is a basic part of systems analysis.
Such models of the criminal justice system arc desirable for several reasons:
They develop an explicit description of the criminal. justice system and its operating modes so that the system's underlying assumptions are revealed.
They provide a vehicle for simulated experimentation in those instances where "live" experimentation is impractical or undesirable.
They identify what data must be obtained if ess"ntial calculations are to be made of the conSl'quences of proposed changes.
Thcse advantages must be considered in light of a sober appreciation of wha; cannot be done by constructing and using models. The cause-and-effect relationships in the real world of criminal justice are so complex and so intricately interwoven that any mathematical description of them is bound to be a gross simplification. At the present time, even the most basic relationships are poorly understood, and the available data contribute little to further understanding. lvforeover, in so dvnamic a system the causal relationships themselves change constantly. They will change further as increased, understanding changes peorle's behavior. Clearly, a system of this magnitude and complexity cannot be studied in detail even descriptively, much less analytically, in a few months by a few people.
However, sufficient benefits have accrued from similar analyses cc;mducted on equally complex systems, such as ail' traffic systems or national economies, to warrant probes in this direction for the criminal justice system. The State of California has already supported a pioneering study of this sort by the Space-General Corp. The Task Force further developed these approaches in order to lay a foundat~"'n on which additional analytical development of the criminal justice system could be based and also to identify some of the primary data needs.
One benefit of this approach, if it is developed, is the ability to conduct cost-effectiveness analyses. These analyses, applied with partic.ular success in the Department of Defense, provide a means for determining which of several alternative courses of action would yield maximum crime-control effectiveness for a given cost, or minimum cost for a given effectiveness.
Such analysis can be brought to bear only on those aspects of crime and criminal justice that ~e amenable to quantification. These measurable values must always be considered in relation to what are frequently more important, often unquantifiable values, in making any decisions about modification of police, court, or corrections operations. The cost-effectiveness apprQach does not force a quantification of unmeasurable human values. Rather, it sets out those implications that are quantifiable, and thereby permits a sharper focus on the critical value questions of social policy by the legislator and the administrator.
MEASURING THE EFFECTIVENESS OF THE CRIMINAL JUSTICE SY&TEM
Systems analysis begins with an examination of the objectives of the system of interest. These objectives are then translated as far as possible into quantitative measures of effectiveness of the system. Various alternative means of improving the system can be compared numerically with a mathematical model which calculates the measures of effectiveness associated with each alternative. At the current state of development, with only very poor data and gross uncertainty about the consequences of any actions taken, any attempt to accomplish this for the criminal justice system must be regarded as preliminary.
The criminal justice system is generally regarded as having the basic objective of reducing crime. However, one must aJso consider its larger objective of minimizing a total net social disutility associated with crime as well as crime control. BC'th of these components are complex and difficult to measure completely. The social costs associated with crime come from both the long- and short-term physical damage, psychological harm, and property losses to victims as a result of crimes committed. Crime also creates serious indirect effects. It can induce a feeling of insecurity that is only partially reflected in business losses and economic disruption due to anxiety about venturing into high crime rate areas.
Balanced against these costs associated with crime must be the consequences of actions taken to reduce them. Money spent on developing, maintaining, and operating criminal justice agencies is only one part of this. It also includes the indirect costs of the crime control system, such as welfare payments to prisoners' families,' lost income of offenders who are denied good jobs, legal fees, and lost wages of witnesses. In addition, there are penalties associated with suspects erroneously arrested or sentenced, the imposition on personal liberty resulting from police surveillance, and the limitations on privacy in maintaining criminal records.
This balance between reducing the costs of crime and of crime control is reflected in the fact that the criminal justice system exercises only a limited amount of crime control (e.g., policemen are not posted on every street corner) and under stvict constraints (e.g., limitations on search) . Thus, there is an "optimum" level of crime control effort reflecting this balance of costs, and any
e.ffort at ~mprovinp crime control must weigh the additional SOCial costs Imposed thereby, This optimum level reflects how society weighs the factors in the balance at any particular time.
Systems analysis, being limited to working with what can be measured, cannot deal with all these factors, Hence? the maj~r emphasis in this chapter is on the direct ~peratll1g t;osts 1I1curred by the system, which are relatively easy to measure, am.I the amount of crime which is co~sid~rably more complex but still appro~chable quantitatively.
MEANS OF CRIME CONTROL BY THE CRIMINAL JUSTICE SYSTEM
The criminal justice system works to reduce crime in three basic ways:
o Deterrence-posing a threat of apprehension and consequent penalties;
o Incapacitatio~L-removing individuals from places ~vhere they might c~T?mit further crimes or subject-1I1g them to supervISIon that makes it difficult for them to do so;
o Rehabilitation-treatment by correctional agencies.
55
past-a:c less. det~rred than those without such records. A~o~hel q.ues~lOn IS the extent to which the actions of the cl'!mmal Justice system deters people from committin cnme' as compared to i:he extent to which the g ~cterred by ,things li~e general public opinion, the yre~~ :lOns of fa~l11ly and fl'lends, religion and morality and the . e~r of los1l1g a )ob. Within the criminal justic~ system It IS not know~ 111 what measure deterrence is effected b' th~ fear of be1l1g caught by the police by the threat of y pl'lson sentenc:e, or br the stigma of a I?ecord, As difficul~ a; t~ese qu~stlOn.s ar.e they lie at the heart of the operation ? t e cI:nmnal Justice srstem, and so must be addressed 111 ~ major. research program involving analysis and exbel'lm
d ent~tlO~,. Until we begin, howev~r, decisions will be
ase on 1I1tultlon rather than on observed fact.
MEASURING CRIME
.There are different wars ot mcasurlncr tne amount of ~!'1I:1eb' a~d t?ey <;10 not n~cc-ssaril}' implro the same thing. . \\ 0 aSlC chrectlOns can be taken. The first det . " mg the de' f bl" , eImll1-r' f glee o. pu IC safety, IS to measure the probabi-Ity 0 a persOIl 111 a certain category being a victim of a ~l'lm~. .The seco~d, d~termining the extent of criminal. Ity :V~~I~ the society, IS to measure the probability that
Each of these methods is obviously extremely complex :nc~bn~~;~ual with specified characteristics will comn;it a~d om knowle?~e ,about them is very inadequate at F I present. RehabilItatiOn, .for instance, appears in many b . \om t lC viewpoin~ of ev~luating public safety, the cases to have been relatIVely ineffectual; limited data a, S? u,te ~umber of cnmes fal:S to reflect accurately the su~gest t~at roughly one person in three released from v.ICtImizatlOn pl:oba~ility. If ( _.Jes increase in pro )01'
prISon \,1IIl retu;n and that over three-quarters of those tiOn to pop~la~iO~ I1~Cl'case, then there is no chan ~ in ~l1ce. arrested wJ!1 be subsequently arrested. Rehabilita- the gr?ss vlct.mllZatlOl1 probability. Crime rate g the hon IS at~ extrem,ely complex task in which methods that n~n:b~r ~f cnmes per 100,000 population, mc~sures sll"ceed f vlctl1TI,lzahon more accurately,
~ . m one Instance ail in another. Furthermore T gams 111 treatment I:oay be ?asily offset by factors entirel;' . ~IS ~ame c~ime rate is often usee! as a measure of un.r?late? to the crnrunal Justice system, such as the in- cnmma!lty. Different population groups differ in their abilIty 01 a released offender to get a job or the acquaint- p~'oJ~enslty to commit crimes,H however. Crime rates ances he ma~es whe~ he returns to the community. bI,e tflue.ncecl by the a~e c!istribution of the population, h IncarceratiOn has mherent limitations as a method for }h t,'e e:::tet;t o~ urban:zatlOn of the popUlation, by tLc
t e general control of crime. Of all the Index crimes ~~h m.c :rIlX In chn:erent geographical regions, and many
brepol'ted to the police, only about 25 percent ar~ cleared . ~I emographlc factors. Thus, crime rates could . y arrest. About 10-20 percent of the individuals _ lJ1Cleas.e as a result of demographic chancres (e g a de I""tnd a,'n "ente d t "1 ar cre~se 111 the. median, ago e of. the IJOIJulatl'on") even' ,'v'l'tll"ll-t ~." " "'. nee 0 jal or prison. The jail terms h ,. ale lessdthan a year, and the average prison time is about an Cn~rease In t e crJll1lnahty of any population subrrroup
tOl1telan 'l:bhlalf y~ars. So only a small percentag~ of the ,l'llTIJ. ;ates always measure the number of c~rtai~ ~ a POSSI e Cl'l~leS th~t could be committed on an ~~Ime~ IVI~ed by a measure of exposure. It is imp~rtant g~~~7 day are .a;'olded by 1l11prisonment.72 Probation anJ f ~t ~~.e ;x~osur~ be clefin?d in relation to the plll'pose p ~. SuperVISIOn may also serve to some extent to in- .01 \\ IC t e cl'lme rate IS to be used. For example capacltdate, but how much they do is dearly hard to meas- I~ ,~e want to ,know ho\~ safe our 1964, Chevrolet is [run; ure an no data on their restraining effects exist at ~ e t, we are mterested 111 the number of autos or even present. . et~er, the number of 1964 Chevrolets stolen id ou~· area
dl'ffiThe
l effects of deterrence are much more subtle and eacn year per 100 autos. If we want to know how safe
cu t t we are from robbery . . o measure even than those of rehabilitative 'I In ~ c~rtaIn area, we are interested
~rograms. . One basic question is the degree to which 111 t le I~umber of robbcnes In the area per year per 100 eterre~ce IS uniform over the population or whether the ~~~~l:nm that .~~ea. If ;ve want to know the chance of
dPI?spt,ulattllOnd'ffcan be divided into identifiable classes with' commi tmg a Cl'lme this year, we arc interested
InC y I erent r d 111, the p.ercentage of boys his age in the arra 'vho COmITII't .- th 'th esponses to eterrence. In particular to~i::~the question of whether people with criminal his- c~u~es In a year. .The mono finely the data can be _____ ,_~_~~e who were not deterred at lea.~t once in the dlv~ded, the more directly relevant it is to the question
of II1terest. -Most interpretations of crime statistics fail h:~i~:lit~ hIC"I"S, neglecting the deterrent effed f :-'~-------~ ~- __ ~r ,. ----.-.~---~----,..~---~._ •• _~~~ .. _ _'"'"~. _'~ __ '.
I I n IVo el t'cts of associated corr t' I 8 ,., IInpfJ80llmcnt. Rnd the fO- TI I I tIe relno 1 IT eo lona programs l' to C I8r11CtCriSt Cf! of th050 who com' J b va e cets of incnrccrntio tI t h I ant concentrallng only on The necessary approximation 1",'010.'08 11 I nut cr mCB cannot be learned directly. )~30TIIY 8 small pcrcentn!;:c if there n~cr 18 t, C amou~t of crime would increase hltmduccs the possible bins tl,nt '0111. t8 ng the chn~ncteri8tJc8 of arrestee!. Thia
leso problems hnve b e no Jncarccrallon At oil. I ype8 or crimlnnlB ( tl disclIRBcd In detail In their re·p·onrt.treated by the Asscssment Task Forc. an' arc 110 puorcr oncs, and the le88 Intelligent 0 j b c.g., Ie younKer oncs, u thun others. ncs may e more likcly to he nrretltcd
J

56
to identify the exposure rate associated with the intended interpretation. . . . . . d'
Pervading all measures ~f CrIme IS the mabll~ty to IStinguish between changes m the amount of c.rm~e committed and the amount of crime reported. TIllS dlfficul~y is aggravated whe~ the two arc ~orrelated, as ~hey are m public reports of CrIme to the pohce. A,s the pohc.e became more effective in solving crimes and m recovermg property, the reported, rate might increase even th~u~h. the actual rate might decline. This difficulty can ~e ~111n1l111zed by using several different approac~es \ e.g., vlctlm surveys as well as police reports) to estllnatl11g :he ~olume of crime. Even when there is a true change m C1'llnes committed, it is extremely difficult to separate t~e results of actions by the criminal justic~ sys~em fro~ .111d:pendent social changes, such as reduc:lOn ~n dl~crImmahOn, economic improvement, or modificatIOns Ir: s~hool sys~ems.
Gross rates of victimization or commission of cnmes, even if they could be obtained accurately an~l completely, would still fail to present an adequate picture. of the magnitude of the crime problem. Each typ~ of. CrI~1e has a different degree of seriousness .. The. dlstnbutlon of crimes among the different types IS an Important fact. In the District of Columbia, for example, the number of part 1 75 crimes rose by 2,712 (8 percent) from 32,053 to 34· 765 between 1965 and 1966. However, petty larceny, th~ least serious of the part I offenses, rose 2,729. There was a slight net decrease in both the numb~~ and the ~a~e of the other more serious, part I offenses. Thus, It IS difficult to s~y whether the crime problem.s grew more. or less serious in Washington without measunng the relatlVe seriousness of the different offenses.
FBI estimates of the index of crime are dc:rived frOl?an unweighted sum of the reported Index cnmes. !hls Index is dominated by the far more prevalent crIm:s against property and is relatiVely insensitive to changes m the serious crimes against the perso~. Thus, murders could increase by 1,000 percent, but If auto theft fell by 10 percent, the Index would deeline:
All crimes an.' not equally undeSirable. Most peopl~ would be willing to tolerate a considera~le. am~unt ot private gambling, or perhaps even shophftmg, If they could know that doing so would reduce. the amount of titreet robberies. The trade-offs among different types of crime is an important consideration in allocating cnfor~ement resources. Decisions, for example, on transfernng detectives from the vice squad to the robbery squad should take into account the relative amounts of crime clisutility they could reduce on each squad. .
Crime derives its seriousness from many dIfferent effects. It is extremely difficult to assess these in order to determine their relative importance. One w~y of r.esolving these difficult issues is to measure public attItudes toward being a victim of different crimes, using a representative sample of individuals and applying scaling t:chniques. Some preliminary results have been obtamed by Sellin & Wolfgang.77 They asked a. sample of people to weigh the seriousness of various crimes.78 The concepts
'iii Part I crimes arc tIle Index crimes plUB negligent manslaughter Bnd larreny
under SSO. . • I D" r C I I' 7t1 RepoH of the President's Commission on Crnne In t 10 lstnet 0 0 um nu,
l~:r~'~ it~nsurc'l1cnt or Delinquency, Sellin & WoHglmG, l. Wiley & Sous, 196·1. '7'1 The crimes werc defined 80 8S to ft".SUlt in the amount or injury, proJlerty
10Kt, prOIll'rly unrecovered, property tlnmngc8, elc., typical of Blich crimes Rctually committed by jU'r·cnilt·s.
111 'rhe Sellin-Wolfgang indexes lor lareeny crimes were translated into n utility scnlo Imsed on the monetary 10s8 in the larceny. (For B tlefinition o[ the utility !'cole anll n t1isclluion of its \lSC in ,lccisionmnking, scc the classic work o[ John Von Neuman Rnd Oacar Morg~n8tern, Theory of Games and Economic Dellt"Vior,
of utility theory can then be applied 70 to these values, reo sulting in estimated disutilities .of eac~ part ~ crime roughly as shown in table 10. ThiS ran~mg of se~lOusness differs somewhat from the UCR rankmg of senousness, which is also shown in table 10.
Table 1O.-Disutilities of Part I Crimes
Type of crime ranked by UCR seriousness
I. Criminal h~,nicide ••..••.•.• _ •.•.••• _ •••.•• _ ..••••••..•••.•••• 2. Forcible rape ••••...•..•.••• _ •.•..•.•••••••••.•.••••••••••••.•. 3. Robbery •••••••.•.•.••.••••.•••••.•.••••••••••••••••••••••••••
~: ~~~~~:r~t.e.~.~~~.~I~::::::::: :::::::: :::: ::: :=:::::::: :::: :::::: 6. larceny ($50 and over}. •••••••••.•••••••••••••••••••••••••••••• 7. Aulo theIL •••••..•.•••••••.•.•••••••..••••••.•••••••••.••••• 8. larceny (under $50) ••.•.•••••••••.•.•••••.•••••.••..•••••••.••
Estimated average dlsutility
, 400,000,000 110,000,001)
10,000 20,000
200 100 900
91)
I The disutilities for criminal homicide and forci~"l rape ar~ very crude estim~tes based on an extrapolation extending far beyond the regloll for which dala we~e. ava,lable m. cerning the functional form of the relationship between scale value and ulIhty.
Thus if a "rational person" strives to minimize his averag: disutility then these numbers suggest that he is equally concerned ab?';lt 1/200 probability of a bur~lary and 1/20,000 probability of an aggravated assaul~.
These approaches combined with. those of Sellm and Wolfgang, could be' used to develop an inde;-: of crime which more accurately reflects the tot<l;l senousness. of crime than merely adding the offenses Without attachmg any weights to them. .. . .
In assessing the performance of the cnmmal Justlce ~ys· tern the incidence of crimes must be balanced agamst the ~osts of crime control, including both the ~ollar costs, direct and indirect and the social costs. One mstrument , . . . for relating these cost and effectiveness measures IS In a model of the criminal justice system.
A MODEL OF THE CRIMINAL JUSTICE SYSTEM
FORM OF A MODEL
The first step in developing a rr.lOd~1 of a .generalized criminal justice system 81 is to clescnbe m detail the events that occur as offenders are processed th~o~gh, the syste~. One such description, [rom the CommISSion ~ report,. IS illustrated in the next figure. Even tl1lS d~scnp. tion is simplified, and differs from t~e real ~ystem I~l ~n)' particular jurisdiction. Tran~formmg thiS descnptlOu into a model involves the followmg steps:
(1) Aggregate a number of related. processinr starres consistent with the form of the aVailable data, Fo~ example, the booking and initial appearance stages might be combined into a single one.
(2) Describe the probability tl;at an arrested person is routed along the alternattve pa~s out of each branching point in the diagram. TI1lS would include the proportion of individuals following e~
Princeton UP t 1948.) The other crimcs were then interpolated onto this lull bused on tl1cir Sellin· Wolfgang scalc values. , h att
so or course, there am infinitely many IJOssible sca~es of weights whl~ bir4 monotonic in seriousness. Since they are all nonotonlcnlly relnted, maXim 'fbi uvnl ue" as measured on 8ny onc of the scales mn:imizes it on all of ~lhl'1I1. ,,~ unique feature of utilitlcs a8 distinguished rrom other me~8ures of vl1lue~ ~ that roughl)' speakinG ~bc marginal \ltmt)' o[ an outcome is 1I1\'crscly proporU~I~cI to tile Ilrobability risk' of ns occurrence one is willing to takc. This mnkes ~t \~ pnrticularly useful in anal)'sc8 of dccisions on actions directed at affectmg probabilities. , J' 5 " no'
8L The technical 'details arc in "A Model of the Cnmim11 uslice ),stem, d 1
in preparation. The report will be available rr?m the Clearinghouse ror Fe trJ Scicntifl': and Technical Information or the Ns.honal Bureau o[ Standards.
57 route as a function of the type of crime, characteristics of the individual such as age and prior criminal record, and characteristics of the processing stage.
reasonable to aII~cate 25 percent of patrol costs and 100 percent of detectIVe costs to Index crimes.
Court costs were based on estimates in the District of Columbia .of the time. spent by the prosecutor and his staff, the Judge and hiS staff, and witnesses and jurors on eac~ type of crime as a function of the type of trial. ?or~ectlons co.;;ts were based on estimates by the Corlecb~l1:s Task I<orce of the cost per offender-yeaI' in prison and Jail.
(3) Attribute to each individual the costs of processing him at each stage.
( 4) Determine the resources required to process the flow of individuals through each stage.
The. costs for processing juveniles through courts and ('o~rectlOns are based on California costs and are under~stlln.ated since the only available cost data did not distlI~gUlsh between the costs of processing juvenile Indc.x crune offenders and other minor violaters.
(5) For eaeh possible route out of the system, describe the probability that an individual wiII again commit a crime as a function of his prior crime, his personal characteristics such as age, and the treatment provided.
. The cost calculations use an estimate of the processing time per c~se or offender .. Hence, resource requirements can be eastly calculated wI~h data on the processing rale of each relevant resource:. Judges, prosecutors, probation officers, parole officers, pnson guards, prison cells, etc.
(6) Translate these descriptions into computer language so that numerical results can be calculated.
(7) Collect data to estimate each of the model parameters in the above descriptions. Th~ mode! can al~o be used to calculate the system's
effectiveness m reducmg crime by persons after they have: been processed. At. an,Y stage in .processing, offenders can b~ released, dismissed, acqUitted, discharged, or ot?erwlSc returned to the general population. When ~hls happens, there. is .a ch~nc? of rearrest and reprocessmg through ~he cnmll1al. Justtce system. This feedback feature permits the tracll1g of lifetime criminal ca reer patterns-number of arrests, crimes arrested for mean length of criminal careers--of individuals as they arc recycled through the criminal justice system.
(8) Change the variables characterizing the system, and calculate the consequences of these changes on costs and on crimes.
A simplified version of the model which was developed by the Task Force following this process is shown in figure 17. It can be used to calculate what happens to arre~ted offenders as they flow through Court and correctIons subsystems. The analysis was restricted to the seven Index crimes and to offenders processed for committing them through either felony court or juvenile court.
Each of the seven Index crimes was treated separately. The results for all the Index crimes were then totaled to obtain the costs incurred at each stage, and the number of people traveling each route shown in the figure. In ordel: to make these calculations, data were gathered to descnbe operating procedures and costs. Often best estimates, approximations, or extrapolations to the whole country of data characteristic of specific jurisdictions had to suffice. Because of the gaps in the data, the numerical results m~st be viewed as tentative, but they are present~d t? 1llustrate the potential uses of the analysis and ~o give Impetus to the collection of proper data for use m more definitive studies.
Data on crimes and arrests were based on data from the F~! "Uniform Crime .Reports." 82 The probabilities ?escn~mg the routing of offenders through each branchmg pomt were based on data from a sampling of State cou;t ~e~o~~s for c~urt and probation processing and onO CaltfOl ~Ia practlces for correctional and juvenile processmg.
As in all accounting, allocation of costs to crimes and .to o~en.del~ often requires arbitrary judgments, especially tn chs~l'Ibutll1g fixed costs. Police costs were developed f~om tnformation provided by the International Association of Chiefs of Police. They estimate that it would be
8.3 Federal Dureau of I 't". U 'Crime RCllorts ror the U .~vdsSlsaho~~ .5. Department or Justice, "Uniform
8.1 The rcports fro 111 e . tntcs, ,1965, Washington, D.C. or llroccssing in th~n ~nl,lrorlll.1l l!rovJdcd the best published data on details Criminal Statistics Di~~I!I1mal rJUc,st!c,: 8)'stem. Thc reports inclUde: Burcau o[
, IIHon 0 flDunal Law and En[orcement, Dt.'partmcnt or
Calculating these ~~iminal c,:,r~e~ patterns requires t'stim~tes of the probablhty of reCidiVism or recommission of cnme for each type of offender leaving each procesning stal?e. In the model, recidivism is related to offender vanables, such as age and previous criminal histcry. It should also be related to variables characterizing the treatment (a person rele~sed by the police without beil!1S charge~ may have a dln:ere~t propensity to commit a new. cnme than one who IS discharged from prison after se~mg a term) but such data are not now generally avallable.
Th~re are many ways to measure recidivism. It would be demable to know the probability of reversion to crime fo~ each type of offender as a function of the point of eXit f:om the .system. Unfortunately, direct data on revers~on to Cl?me would be impossible to develop be~a~se mf?rmatlOn on who committed an unsolved crime IS ImpOSSible to.o?t.ain. Because of this difficulty, other mea~ures of reCidiVism ~l\St be used. Some researchers, partl?ularly . t~~se f?cusmg on the corrections process, descnbe reCidiVism m terms of the probability that an offendel' released from corrections will be returned to corrections. This provides an underestimate of recidivism by those individuals because of the many opportunities for someo~e who committed a crime to drop out of the srstem, as Illustrat?d by the funneling effect of figure 18. F~r example, studies have shown that approximately onethlr~ of t~e offenders released from prison will return. TYPically, m the United States as a whole; 20 percent of
J.ustil.;,,": ~tate or Cn1irornia~ ."Crime in California, 1964-." Administrntive Statis,' ~~Cs ,'1cct
!Orti) ~lcscarch D6 iVlslOn .. Dcpartment of Corrections Stllte or CnlH9rnia n.1 ?fJua . r. 8~ners 19 1, ~962, 1963, tt Sacramento, CallI. Uureau or Crlminlll
Statistics, ~IV1S!On to o[ ,Crinunal Law aud Enforcement, Dc arlment of Just' State of CahrorOla, Dchnflucnc), and Probnlton in California, 1~&1." ICC,

58
A general view of The Criminal Justice System This chart seeks to present a simple yet comprehensive view of the movement of cases through thd criminal justice system, Procedures in individual jurisdictions may vary from the pattern shown here, The differing weights of line indicate the relative volumes of cases disposed of at various points in the system, but this is only suggestive since no nationwide
data of this sort exists,
Police Prosecution Courts s
Information
Charges Dropped Charges Dropped or Dismissed Oisml~:ed
6
Grand Jury
Unreported CrimM
May continue until trial,
2 Administrative record of arrest, First step at which temporary release on bail may be
available,
Non.Police Referrals
3 Before magistrate, commissioner, or justlce of peace, Formal notice of charge, advice of rights, Bail set, Summary trials for petty offenses usually conducted here without
further processing.
4 Preliminary testing of evidence against defendant. Charge may be reduced. No separate preliminary hearing for misdemeanors
In some systems.
Release or Statton Adjustmont
Relusa\ to Indict
MI,dlmeanor,
~t!!yOHen .. '
11
Intake Hearing
Release(l
Juvenile OHenm
Charge tiled by prosecutor on basis of Information submitted by police or citizens. Alternative to grand lury Indictment; otten used In felonies, almost always In misdemeanors.
6 Reviews whether Government evidence sufficient tClluslify trial. Some States have no grand lury system; others seldom use it.
59
Corrections ChlHoe Dismissed ACQuitted' Probation
1
Arraignment Trial Sentencing
8 Reduction 01 Charoe
ACQl.utl'ed
_________ AdJudlcatoryHurlng
12
NonadJudlCltory Disposition
r
Appearance for plea; defendant elects trial by ludge or jury (It available); counsel for indigent usually appointed here In felonies. otten not at ali In other cases.
8 Charge may be reduced at any time prior \0 trial In return for Dlea of guilty or for other reasons.
.................. ~~ .... ~ .. ~ .. Appeal
Probation
Released
9 Challenge on constitutional grounds to legality 11 of detention. May be sought at any point in
9
Habeas Corpus
>------.. ~ ..
Probation officer decides desirability 01 further court action.
process. 10 pol,ice otten hold informal hearings, dismiss' or 12 Welfare agency, social services, counselling
d t
medical care, etc., [or cases where '
a JUS many cases without further processing. adjudicatory handling not needed.
I

•
60
individuals arrested for Index crimes are sentenced and only about 30 percent of these are <,entenced to prison.
In the model, recidivism was measured at the point of rearrest. This brings into the sample a number of people arrested for crimes they did not commit, but reduces the error in ignoring people (reed for legal or technical reasons even though they did commit the crime.
In this model, the probability that a person is rearrested was made to depend on his age, his previous crime, and on his exit point from the criminal justice system.S
.1 These
probabilities of rearrest were defined for each type of I ndex crime as decreasing constantly with age. S5 The decrease is more rapid for some types of crime than for others.
The distributions of time lags between arrests were based on data from the FBI criminal careers study and on data from several jurisdictions. These data indicated that rearrest, if it happens, occurs within 5 years after release in about 99 percent of the cases and within 2 years in over 60 percent of the cases.
Another factor that must be included in a model to describe recidivism is the type of crime which a recidivist tends to commit. An individual's subsequent crimes are related to his previous crimes. The estimated array of these conditional probabilities for each of the seven Index crimes is shown in table 11. The table displays
the. chance of switching from each crime type to each other when rearrest occurs.
USES OF THE MODEL
Criminal Justice System Direct OjJerating Costs for Index Crimes
The direct costs of processing offenders at each stage were calculated for each Index crime on the basis of processing time and unit time costs. In figure 19, the system costs for each kind of Index crime are distributed among the major cost components. Corrections costs account for a large portion of the total cost in murder and nonnegIigent manslaughter (81 percent), forcible rape (42 percent), and robbery (42 percent). In all these crimes, police clearance rates tend to be high. For the property crimes, which have lower clearance rates, police costs are a much larger proportion, about 70 percent of the total costs. For all the Index crimes, the court costs are a very small portion of the total: 8 percent for mur· der, 4- to 5 percent for the other personal crimes, and 1 percent for the property crimes. Figure 20 shows how these costs are attributable to each of the 1965 Index crimes in the 'United States in 1965. It can be seen thai the property crimes of burglary, larceny of $50 and over,
FIGURE 17. CiilMIliAl JUSTICE SYSTEM MODEl WITH ESTIMATES OF FLOW OF OFFEJlDER!i AND
DIRECT OPERATlilG COSTS FOR IIiDEX CRIMES IN THE UJiITED STATES IN 1965
\
Numbers in boldface indicate estimated flaw af persans arrested far index crimes.
Numbers in regu lar type indicate estimated cost0ricurred at processing stoges.
NO COMPLAINT
FILED OR CHARGE REDUCED
I NDEX CRIMES 727,000 f---.I COMMITTED
2,780,140
ARREST BY POLICE
$1,4lJO,OOO,000
FORMAL ACCUSATION 117,000
AND r-----~------r---~~ DETENTION $7,000,000
REFERRED BY OTHER SOURCES
200,000
8' Data from Glnser (1'ho Effectiveness of n Prison and Parolo System; Dobbs Merrill: 191H) WM uscll for the fe.H'fesl probabilities for those leaving corrections. Tho tIBta (or th.e other rearrest 11roito.bilities used in the model to derive crhninnl career pnttcrn?l Were estimated 80 that the calculations would yield careers which approll:imntl!ll ,1lOse in IJata collected by the Federal Durenu of Investigation and
- -~-~-------~-
260,"0
JUVENILE PP.OCESSING $240,000,000
also Give the closcst opproxfmation to arrest· age dtstributions given in the 1963 "Unifo'tm Crime Report,,"
S'i For juveniles t)fOCC8Scd 08 such, the probabilities were assume,1 couslnl
whh alte until they were Ilfocesscd as adults at ngc 18.
•
a~d auto theft, which account for 87 percent of the Index cnmes, also account for \.he bulk (81 percent) of the system costs for Index crimes. The figure also shows how these s~stem costs for Index crimes are distributed among the major system components. Polic.e costs are the largest (67 percent), followed by correctlOnal programs (including probation) which account for 20 percent.
I~ ta.bl.e 12 th~ system costs are presented as the cost per mdlVldual cnme. Each reported Index crime costs the criminal justice system directly about ~~750. The cost per offender arrested, however, is about $3,000 since th~re are only about one-fourth as many arrests as Index cnmes reported.
Another costing approach would omit the large amounts of police costs charged to the offenders and charge them instead as fixed costs of the syste~. If offe.nders are not charged with any of the costs of police patrol, then the cost per offender arrested is reduced to about $1,000.
Criminal Careers
The criminal justi~e system P<:'}'I' a price for permitting a perso~, t~ e?ter a lIfe of c~·ime. The cost is measured by the cnmmal-career co~t," or the total cost to the
FIGURE 18. FilNNELING EFFECT fROM REPORTED CRIMES THROUGH PRISON SENTENCE
177,000 FORMAL FELONY COMPLAI NTS
160,000 SENHNCES
61
------------------------
39,000
GUILTY PLEAS $15, 000 , 000 r---;.___....J 35,000
35,000
'>AQUITTED 3,000
-II *-1.1
-=-=-.--.-----1--____ -1

62
V'l
~ -' -' 0 Cl u-0 V'l Z 0 ::; -' ~ Z
t;; 0 u
,,-,....,...., .• ~~"'~"" ~.-, .. "-,< ~.-<-.-."'" "'. ..
fiGURE 19. ESTIMATED CRIMIIiAl JUSTICE snUM DIRECT OPERATIIiG COSTS fOR U.S. III DEl CRIMES, 1965
Tohl Costs • $2,097,000,000
800
600
500
300
CRIME
Number of
Percent
Dollors (millions)
Total Index Crimes· 2,780,000
lurglary
1,173,200
39
820
larn.y $5Q & our
762,400
24
500
•
486,000
18
370
206,700
9
190
20
118,920
7
140
t I I
EXPANDED SCALE
I I I I I I I I ~
Murder lid
lIonegligent Manslaughter
9,850 22,470
2 \
48 29
~..,;,~ .. -
63
FIGURE 20. ESTIMATED DISTRIBUTION OF CiHMINU JUSTICE SYSTEM DIRECT OPERATING COSTS AMONG MAJOR SUBSYSTEMS AND TYPES OF INDEX CRIMES, 1965
MURDER-AND NON NEGLIGENT COURT COST = 2% MANSLAUGHTER = 2% FORCIBLE RAPE'" 1%
Table 11.-Rearrest Crime-Switch Matrix 1
If arrested again for an Index crime, the probability it will be for-
Last Index arrest for
~~~~~\i:~~t I For~ible rape I Robbery Agf~;:~I\ed I Burglary ($5~~r;I_II~ver) '_Auto_theft manslaughter I I
--------------------------------------) ----·-----:---------i---------Murder and non negligent manslaughter , ________________________ __
~~bC~~~~!~ ~~_ ~ -:_::::: ::::: :::::: ::::::: ::::::: ::::::::: :::::::: Aggravated assault , ________________________________ .. _________ • Burgla ry ___ • ________________________ • ________________________ __ Larceny ($50 and over) ________________________________________ __ Auto thefL _________ . ________________________________________ _
0.025 .020 .015 .025 .010 .010 .010
0.025 .150 .010 .040 .020 .020 .027
0.150 .110 .350 .150 .135 .140 . Q45
0.400 .260 .060 .300 .063 .025 .028
0.100 .140 .115 .200 .282 .275 .222
0.100 .120 .100 .200 .031 .130 .278
0.200 .200 .350 .085 .459 .400 .390 i
-----------------'-----'-----'-----'----'--~.----'.---.~-~--.-.-.-.
1 Based on data from Crime Revisited: Minnesota Board of Corrections' 1965 "Uniform Crime Reports," pp. 29-31; and Federal Bureau of Prisons, statistical tables, fiscal year 1965.
'Best estimates based on inadequate data.
Table 12.-TotaI1965 U,S. Criminal Justice System C05ts for Index Crimes 1
Total system Crime type costs (millions
of dollars)
rib~~:~~~~~:e::::::::::::::::::::::::::::::::::::::::::::::::::: 48 29
140 ~ggrfvated assault. _____________ • _________________________________ 190 L urg ary -- - ---------------- _____________ • __________________ -_____ 820 Aartceny ff $50 and over _______________________________________ • ____ 500 u 0 the t ______________________________________________________ ..
370 All Index crimes ... __________________________________________ 2,097
1 100 percent of detective force costs and 25 percent of patrol force costs and court and corrections costs were allocatea to Index crlll1es.
, Based on Index crimes with the 1st Index crime arrest occurring at age 16 for the indi--.---.-.--~----
Number of System costs Number of System costs Cnracr cosh' crimes per crime arrests per IIrrest (dollars)
(dollars) (dollnrs) -----
9,850 4,900 9 400 5,100 12,600 22,470 1,300 14: 300 2,000 9,600
118,920 1,200 54,3QO 2,600 13,500 206,700 920 108,000 1,800 9,400
1,173,200 700 266,000 3,100 14,000 762.400 660 144,000 3,500 11 900 1;86.600 760 131,000 ?,800 11: 000
2,780,140 750 727,000 2.900 3 12,200
cated crime. 3 Based on distribution of 1st arrests matched to distribution of arrests of individuals
under 18 given in the 1~65 "Uniform Crime Reports."
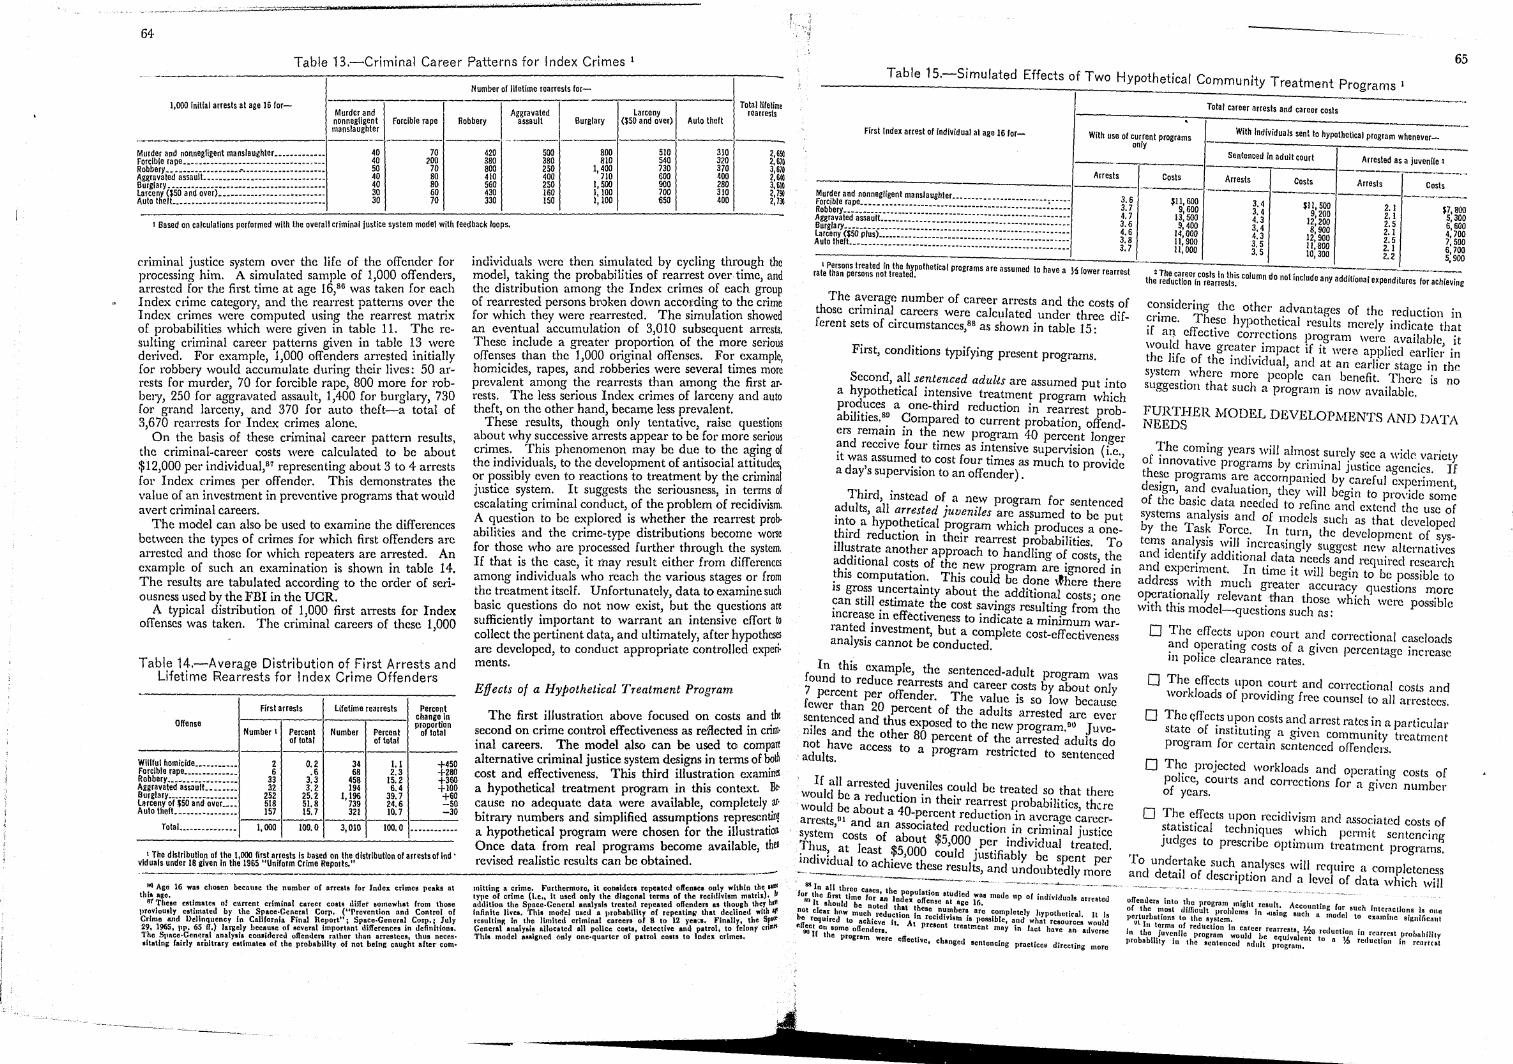
64
T bl 13 a e Criminal Career Patterns for Index Crimes 1
~~ -
1,000 initfal arrests at age 16 for-
--_ ........ urder and nonnegligent manslaughter •••••••••••••
orclble rape ••••••••••••••••••••••••••••••••.•.• obbery .........................................
M F R A B L A
ggravated assault ••••••••••••••••••••••••••••••. urglary •••••••••••••••••••••••••••••••.•••••••• arceny ($50 and over} ••••••••••••••••••••••••••. uta thelt .......................................
Murder and non negligent manslaughter
forcible rape
40 70 40 200 SO 70 40 80 40 80 30 60 30 70
Number of lifetime rearrests for
Robbery
I Aggravated
assault Burglary
.. 420 500 800 380 380 810
250 1, ~~~ 800 400 410
I 500 560 250 I: 100 430 160 330 150 1,100
e I Based on calculations performed With the overall cnmlOal Justice syst m model with feedback loops.
criminal justice system over the life of the offefi.ded for )rocessing him. A simulated sample of 1,000 0 en ers, ~rrested for the first time at age 16,SO was taken for eafh Index crime category, and the rearrest patterns over t;e Index crimes were computed. usin)5 the rearrest matnx of probabilities which were glven m table 11. The resulting criminal career patterns given in table 1;3. \yefIe derived. For example, 1,000 offe~ders a~res.ted lmtIa y for robbery would accumulate dunng theu' lives: 50 a~rests for murder, 70 for forcible rape, 800 more for ro . bery 250 for aggravated assault, 1,400 for burglary, 73~ for grand larceny, and 37q for auto theft-a total 0
3670 rearrests for Index cnmes alone. , On the basis of these criminal career pattern results,
the criminal-career costs were calculated to be about $12,000 per individual,s7 representing about 3 to 4 arrests for Index crimes per offender. This demonstrates the value of an investment in preventive programs that would aVert criminal careers. "
The model can also be used to exam me the differences between the types of crimes for which first offenders are arrested and those for which repeaters are a~rested. An example of such an examination is shown 111 table 1~. The results are tabulated according to the order of senousness used by the FBI in the UCR.
A typical distribution of 1,000 first arrests for Index offenses was taken. The criminal careers of these 1,000
Table 14.-Average Distribution of. First Arrests and Lifetime Rearrests for Index Crime Offenders
I First arrests litetime rearrests Percent change in
Offense PlOfortion Number I Percent Number Percent a lola I
of total of total ------
Willrur homicide ••••••••••• 2 0.2 34 1.1 +450 6 .6 68 2.3 +280 Forcible rape ••••••••••••••
33 3.3 458 15.2 +360 Robbery ••• _ •••••••••••••• 32 3,2 194 6.4 +100 Aggravated assault. ..... "
252 2S.2 I,m 39.7 +60 Burglary ............ _ ••••• 24.6 -50 larceny of J50 and over. __ • SI8 51.8
-30 Auto thetL •••••••••••••• 157 15.7 321 10.7 ---------Total ............... 1,000 100.0 3,010 100.0 .. _------ .. _--
I The distribution of Ihe 1,000 fir,~1 a~rests Is based on th~,distributlon ot arrests ot ind • vlduals under 18 given in the 1965 Umform Crime Reports.
larceny ($50 and over)
510 540 730 600 9Il0 700 650
Auto thelt
310 320 370 400 280 310 400
-Totalliletime
rearrests
-2,650) 2,670 3,67 o
o o
90 3G
2,64 3,61 2,7 2,7
65
Table 15.-Simulated Effects of Two Hypothetical Community Treatment Programs 1
Total career arrests and career costs 1----------:-"7"" _________________ ._
First Index arrest at individual at age 16 tor- With use at current programs only
With Individuals sent to hypotheiical program whenever-.
---------------~-----------Sentenced in adult court Arrested as a juvenile ~1 ------,------.1-------.------1--------,,--_.-Arrests Costs Arrests ------------------{._---{_._--- -----------.-----.. -~--Costs Arrests Costs
Murder and non negligent manslaughler ........................ , ... .. Forcible rape .................................................... . 3.6
3.7 4.7 3.6 4.6 3.8 3.7
$11,600 9,600
13, SOO 9,400
14,000 11,900 II, 000
~~~:~e~~~~~i~:::~:::~::~:~:=:::::::::::::::::::::::::::::::::/ Larceny ($50 plus) ................................................ . Auto thetl. ••••••••••••••••.••••••••••••••••••••••••••••••••••••••
3.4 $11,500 2.1 $7,800 3.4 9,200 2.1 5,300 4.3 12,200 2.S 6,600 3.4 8,900 2.1 4,700 4.3 12,900 2.5 7,500 3.5 11,800 2.1 6,700 3, S 10,300 2.2 I Persons treated in the hypothetical programs are assumed to have a ~i lower rearrest rate than persons not trealed.
5,900
'The career cosls in this column do not Include any additional expenditures for achieving the reduction in rearrests.
The average number of career arrests and the costs of those criminal careers were calculated under three different sets of circumstances,s8 as shown in table 15:
considering the other advantages of the reduction in crime. These hypothetical results merely indicate that if af!. effective corrections program were available, it would have greater impact if it weril applied earlier in the life of the individual, and at an earlier stage in the system where more people can benefit. There is no suggestion that such a program is now available,
First, conditions typifying present programs.
Second, all sentenced adults are assumed put into a hypothetical intensive treatment program which produces a one-third reduction in rearrest probabilities. sD Compared to current probation, offenders remain in the new program 40 percent longer and receive four times as intensive supervision (i.e., it was assumed to cost four times as much to provide a day's supervision to an offender).
Third, instead of a new program for sentenced adults, all arrested juveniles are assumed to be put into a hypothetical program which produces a onethird reduction in their rearrest probabilities. To illustrate another approach to handling of costs, the additional costs of the new program are ignored in this computation. This could be done ~here there is gross uncertainty about the additional costs; one can still estimate the cost savings resulting from the increase in effectiveness to indicate a minimum warranted investment, but a complete cost.effectiveness analysis cannot be conducted.
In this example, the sentenced·adult program was found to reduce rearrests and career costs by about only 7 percent per offender. The value is so low because fewer than 20 percent of the adults arrested are ever s~ntenced and thus exposed to the new program. DU Juvemles and the other 80 percent of the arrested adults do not have access to a program restricted to sentenced adults.
If all arrested juveniles could be treated so that there would be a reduction in their rearrest probabilities, thue would be about a 40-percent reduction in average careerarrests,UI and an associated reduction in criminal justice system costs of about $5,000 per individual treated. :fh~s? at least $5,000 could justifiably be spent per IndIVIdual to achieve these results, and undoubtedly more -" ~ .--~-.------- -- ~--.~-~--" "._~_~ n_ ... ~._ .. " 'I 8.'1
1,n all three cuscs, tbe Population !tudied was made up of individuals arrested o~) t lC first time lor an Index offense at age 16. '~ shouJd be noted that thesc numbers nrc completely hypolhetiral. It Is
bot c ea~ h(\w much reduction In recidivism is possible and what resourCes would flo rcqutrcLl to achicve it. At preaent treatment rnny in fact hove an adverse II eta Db Borno offenders
00 If the program we~c efl.clive, ch.nged Benlenclng pracUee. dirccUng more
FURTHER MODEL DEVELOPMENTS AND DATA NEEDS
The coming years will almost surely see a wide variety of innovative programs by criminal justice agencies. If these programs are accompanied by careful experiment, design, and evaluation, thcy will begin to provide some of the basic data needed to refine and extend the use of systems analysi~ and of models such as that developed by the Task Force. In turn, the development of systems analysis will increa~ingly suggest new alternatives and identify additional data needs ancI required research and mq)criment. In time it will begin to be possible to address with much greater accuracy questions more operationally relevant than those which were possible with this model-·questions such as: .
o The effects upon Court and correctional caseloads and operating costs of a given percentage increase in police clearance rates.
o The effects upon court and correctional costs and workloads of providing frce counsel to all arrestees.
o The Gffects Upon costs and arrest rates in a particular state of instituting a given community treatment program for certain sentenced offenders.
o The projected workloads and operating eosts of police, courts and corrections for a given number of years.
o The effects upon recidivism and associated costs of statistical techniques which permit sentencing judges to prescribe optimum treatment programs.
To undertake such anal),ses will require a completeness and detail of description and a level of data which will
offenders into the progrum might reBult. Accounting lor tnll~h interactions 18 one of the most difficuJt problema In .using 811Ch n model to cxominc signllicollt perturbations to the ayslcm.
Ot In terms of reduction in Cafeer renrrests, ·1/.zo reduction in rcnrrt~at tlrolmhiJity in tho juvenile program would he equivalent to n ¥.t reductton in renrrcst ,,,obabUlly 'n Ihe Benlenced "dull progra",.

t:,
66
take many years of research to develop and which will always have elements of uncertainty.
It is therefore important that further work on total system models be undertaken in conjunction with specific State and local agencies. The work should incIud~ .f~rther methodological development such as sensitivIty analysis to determine the sensitivity of the results to values of the various input parameters,. mt<l;mination .of diffe~ent cost allocation procedures, exammatlOn of the mteractl~ns among system componel'!-ts (e.g.! ~ffect of improyed pollce effectiveness on sentencmg declSlons), and vahdatlon of the model by comparison with actual program experience. The work on the model should be supported by a comprehensive program to collect data on other relevant costs in addition to direct operating costs, and on arrest rates as a function of factors like age, economic level, and previous treatment by the criminal justice .syst~m.
Some specific present data needs have been hIghltghted by the work wi~h this. system. model. Much C?f the published data are mconSlStent, mcomplete, and maccurate. For example, different criminal j~stice agenc~es report their operations in inconsistent UliltS: the polIce report "arrests," the courts report "('ases," and corrections agencies report "offenders." These are adequate. fo~ managing the individual agencies, but preclude relatmg mformation across the system. The numbers of people processed at each stage by each agency are needed.
A major limitation of available data is that they. are collected with reference to a legal taxonomy of Crime, which is not necessarily relevant to many important questions concerning crime control. There are serious problems in using the availa~le statistics for the s~udy of polic.e and corrections operattons. The maraudmg assault IS indistinguishable from the argument that got out of hand, the professional auto theft i~distinguishable fro.m th~ joyride. This data problem IS severe and unttl umform standards in greatel' detail. prescri?: the type of inform~tion reported and the baSIC defilllttons used, all analysIs of the criminal justice system will be hobbled.
There are many important variables describing the crime the situation, the victim, and the perpetrator, etc., that ;rc not available but are required to characterize a crime more usefully for research, operational planning, and assessment of the crime problem. Included among these are the following: '
Location of crime (e.g.) home of victim, private building, public place).
Time of crime.
Nature of the victim (e.g., stranger, acquaintance, relation, organization, society genC!'ally, consenting party, provoker, accomplice; in addition, age, sex, and other personal qualities) .
Loss suffered by victim (death, hospitalization, minor injury, psychological trauma, permanence of injury, value of property loss or damage, whether or not property recovered).
Nature of the offender (e.g., conspiracy, individual; in addition, age, sex, residence, economic status, and other personal qualities) .
Apparent purpose of the crime (e.g'., harm, gratification, economic gain, temporary use of property) .
Nature of force involved (e.g., weapon, physical force against person, forced entry into premises, threat) .
There are many instances in which no data at all is available. Merely improving the quality of information reported today is not going to be sufficient for analyzing the problem of crime. We know much too little about how various actions of the criminal justice system affect the number and types of crimes committed by different classes of offenders. The quantitative effect upon crime rates of administrative changes in the criminal law, in police operations, in prosecutorial policies, in court practices, and in correctional methods is largely unknown.
To remedy this situation, data are needed on recidivism (e.g., rearrest rate, reconviction rate) by type of crime and treatment accorded individuals by the criminal justice system. It is Important to know how recidivism varies with how far a person travels through the criminal process (released after arrest, prosecution dropped, dismissed or acquitted at various stages in court proceed· ings, put on probation, paroled, discharged from a cor· rectional institution). Rearrest rates are needed at each such point, as a function of age and other relevant demo· graphic variables, and also related data on how persons who exit from the system after an arrest for one kind of crime switch to other kinds of crime.
Ideally, this information would be obtained by prospec· tive studies of the criminal histories of samples of children born today. But the crime problem will not wait for that information. Retrospective studies are needed in the meantime. These would usc samples of arrested persons matched by criminal career attributes, such as number of arrests for crimes of given types, number of convictions, numbers of times probation has been granted, number of incarcerations, and such personal attributes as age, race, sex, and economic status. Although a number of small studies have been undertaken to develop data for various hypotheses, much larger scale and moore exhaus· tive efforts are needed.
In interpreting these data, care must be exercised to avoid interpreting spurious correlations as causes. For example, if data showed that rearrest rates do increase as offenders arc processed further into the system, it might be concluded that processing through the later stagel causes this increase. It may be that rearrest rates in· crease because offenders who arc processed farther into the system are more criminal. The assignment of cauSt requires carefully controlled experimentation. This dif· ficulty of interpreting results from retrospective studies is an important reason for using samples of matched offenders.
About the only data now available from controlled ex-peri.l~en~s relates to the effects ?f s~me experimental rehabIlltattrm programs upon reCIdiVIsm. Even these are limited by "Hawthorne effects"-the changes in behavior c;eated ~erely by the awareness of participating in a speCIal eXl?ertmen~al program. Furthermore, treatment personnel m expertmental programs tend to be far more competent and more motivated than the average.' It is Important to .be able t? estimate what will happen when the program IS placcd 111 the hands of the ordinary staffs.
One way to develop the needed data would be to keep detailed recor~s on a large sample-perhaps 20,000-of those arrested 11l a particular jurisdiction, following them as t~ey are pr~cessed through the police, courts, and cor~'ectlOns agencws. Data would be recorded on the costs mc~rred, the delays experienced, and the proportion folIowmg ea~h route th~ough the process as a function of the t~pe of :rtme .committed and characteristics of the indiVIdual, mcludmg age, previous record, economic status, type of counsel, etc: These data should then be related to th~ future c:i~~nal activity of this cohort of arrestees to estimate recldlVlsm probability as a function of treatment by the criminal justice system.
~n s~mmary, five basic requirements for improved data collectIOn have been identified:
Accurate and complete data on all system-related ev~nts from arres~ through release are needed to des.cnbe the operatIOns of the various agencies of pohce, courts, and corrections.
67
E~ch event in police, court, and corrections 0 _
erah?n~ should be related to the number and cha~actenstlcs of the offenders involved in it. Data shQuld be collected on thc number of arrests and c~arges processed by the police and the number of o enders arrested and charged. Similar data should ?c collected on .the number of eases at each sta e ~n court proceedmgs and the numbers of defendan~s In these cas,~s. .
The. rearrest rates at each system exit point should be estimated. as a function of age, sex, and other personal att:lbutc~. The probabilities that released of!enders WIll SWItch among the various t es of cn~e on rearrest should be obtained for eI~ exit pmnt. .
Retrospective studies of criminal careers of samples of mat~hed offenders shoulq be undertaken as soon as pOSSIble to tap availa:ble sources of data.
Prospective studies o~ cohorts of juveniles and offenders released a~ ,:arI?us stages should be started now so that the IImltatlOns of retrospective studies 'can be overcome in the future.
, W~i1e collecting. and processing such a large amount of ~1~~8; 15 clearly a ,chfficult task, it is well within the caoaD.~lt~esb of today s technology and will be considera'bly ~Ife y. the development of a national criminal justice In ormatIOn system.
---------------~
f r
, .1:.
Chapter 6 2. Coml?onent of the criminal justice system:
Criminal Justice Information Systems
Pollce. Courts. Corrections.
3. Government level: Federal. State. I:0cal, including county, city and met -
pohtan area. .' ro
THE NEED FOR CAPABILITIES
BETTER INFORMATION
The impor:ance of having complete and timely information about crimes and offenders available at the right place and the right time has been demonstrated throughout this report and, indeed, throughout the Commissi.)n's work. With timely information, a police officer could know that he should hold an arrested shoplifter for having committed armed robbery elsewhere. With a more detailed background on how certain kinds of offenders respond to correctional treatment, a judge could sentence persons more intelligently. With better projections of next year's workload, 'it State budget office would 'know whether and wh(;;fe to budget for additional parole
officers. Modern information technology now permits an [:~:;ault on these problems at a. level never before conceivable. Computers have been used to solve rel<\-ted problems in such diverse fields as continental air defense, production ~rheduling, airline reservations, and corporate management. Modern computer and communications technology permits many users, each sitting in his own office, to have immediate remote access to large computer-based, central data banks. Each user can add information to a central,file to be shared by the others. Access can be restricted so that only specified user5 can get certain
information. Criminal justice could benefit dramatically from com-
puter-based information systems, and development of a network designed specifically for its operations could start immediately. Such systems can aid in the following
functions: police patrol.-Enabling a police officer to check
rapidly the identification of people and proper,,), against a central "wanted" file.
Crime investigation.-Providing a police officer or detective with supporting information files such as crime patterns, modus operandi, criminal associates, and perhaps in the future, the ability to match latent fingerprints from a crime scene against a cen-tral fingerprint file.
police cleployment.-Altering police deployment
Sentencing and correctional decisions.-Providing more complete history of an offender and his reo actions to prior correctional actions; statistical esti· mates of the effects of different kinds of treatment on different kinds of offenders.
Development of correctional programs.-Analyz. ing complete criminal case histories to evaluate the effectiveness of different programs.
Protection of individual rights.-Assuring that arrest records include court disposition, thereby presenting a fairer picture to the police and to judges; restricting access to certain criminal record! after a specified period of good conduct.
Budgeting.-Collecting uniform statistics on agency operations and workloads, providing a basil for estimating personnel needs and for optimum
~ll combin<l;tions of ~hese items must be considered in an mtegrated mformatlOn !,,,,,tem At each 1 1 d' 11 . ' governmental eve, an m ~ f systen: components, good statistical and
mtnagement m ormatIOn are needed. Some of the t~t' . ca needs have been discussed in th .s h .. 1St!· I . . f ., e prevlOUS c apter nqUlry m ormatIOn IS needed primaril b h .'
especially at State and local levels. PersonY
1 • Y ft. e p?llc~, needed for arrest sentencin d a. m ormation IS at all levels. ' g, an correctlOnal decisions
. A m.ajor difficulty in obtaining needed . . sonal mformation toda arises f mquuy or perfrequently recorded in r 'ur' d' ~om the fact that it is in which it is needed. Th~ m~bt~ilOn tt~er Jhan the one row police jurisdictions require sh~ri~g e~~rs an~ I~armatton banks. A stolen car or a mon m or\l,erse many jurisdictions in a few w:~~~~ te;SO? Ctn
ftracave an area where they are 11 k . nmma s 0 ten
offenders and stolen proper~e. n~wdn. The mobility of lowing: y IS eVI enced by the fol-
o In 1965, 18.7 percent of t I outside the pelice jurisdi~tfo~0~~~~:f;9;re recovered
allocation of men anu dollars. Research.-Providing a collection of anonymoUi
criminal histories to find out how best to interru~ .::. a developing criminal career and to achieve a bette understanding of how to control crime.
Public education.-Portraying the true magnitud! of the problem of crime in the United States.
o Over twenty thousand t 1 . under the Interstate Tr~n~ en au.tos werc recovered mobiles Act (the Dyer Actn:!~~~.o~f Stolen Auto·
D In 1965, 8,884 fugitives sou ht b S law enforcement a encies g . y .tate and local prints submitted tog the FB~e~e Identl~ed by fingerthe agency wanting the person:03agenCles other than
The information problem has three principal ciime& . sions:
1. Type of information: Inquiry information.-Facts about want-
ed persons or property needed on immedi· ate recall ("on-line" in "real-time")' by the
police. Personal informatiol1.-Containing rele·
vant background facts about people with whom the system must deal.
Ma.aagement information.-Needed by a criminal justice official on the operation of hi!; agency to help him manage it
better. Statistical information.-On crime, on
D Almost 50 pe t f had been reen. 0 recent offenders in FBI files arrested m two or more States.o·j
These data pro . d . . . of information tr:~s~~~~or:an~ mdlcations of the utility Much more stud is ' u t ey are only preliminary within a metrop~rt needed o~ t~e extent of mobility'
. I an area wlthm St ., reglOn, and nationally F ih a ate, wlthm a ous kinds of fil . . ur ermore, the value of vari terring crime ~~s~nst~frP~:h~nding. offende,rs and in de~ a strong and con tin . etermmed. 1 here must be of information syst Ulng. a5se~sment of the effectiveness
ems m cnm' l' . now no good meas f h ma Justice. There are tems, and the u~es 0 t e value of information sys· estimates are :etratmg sta!istics on which to base such These data are ne ~o; bemg systematically gathered 'decide what functie e t~O design future systems and t~ can the cost of im Ions ~y should perfonTI. Only then against their utilii
y ~mentmg various functions be weighed the nature of criminal careers, and on the
operations of criminal justice agencies. in response to changing patterns of crime on an hourly, daily, seasonal or emergency basis. ----~--------------------------------------------------~ -, ,.02 "UnifOi C'
o.ften be Md' nme Reports," 1965 Th' . ... ."" 1967 ~':!i alaeent .!uri.dietion. • • pohee lumd,ction o[ recovery would pproprl aliona hearings.
68
= en,
69
f Eve~ mO.re fundamental is the question of the 1 ~ val'lOUS mformation items th 1 ' . va ue tlOn system should sim It' emse \es. No mfornla-~s now being collected.P Yl~h~~t~t~~~~auter that. which
~~~,::.~;t~~n [uIr~nJly recorded,' consider o~~~~xft~~~e ;~~ to ascertai~e\:h;tUin~:~!ti~~a!ysis, ~r:d c....-:periment, try a prototype installation is 0 e~~os Importat;t. On~e performance will help highli:ht th~g, .~:valt~ttfon of .ltS that should be ke t and d . cn ICa m ormatlOn ational value I' dP. ma e avatlablc and the oper-
. n omg so. Despite the difficulty of t'. .
specifying their optimum info~~~tmg their ,:alue or tion systems should be d 1 a Ion con~ent, mforma-~pplications has shown ~~:t~~d. Exp~'lenc~ i? other Impo;tant to implement systems i~ ~:o eld It IS mO~'e practical. experience and understandi des! way to g~m thfefl11
l'lusl!1g these initial installations to ~fd i~ t~~e~a~ng
o ? owmg systems. eSlgn
estf:n~~I:J~y i~~ uS~~~::!~~d\~eir precise v~lue cannot be social systems such as th. U g and analYSIS of other large after .good ~perating s~ati~ti' eC~lOmy, devel?ped oniy analYSIS. cs ecame aVailable fo1'
The assessment of the V 1 f . f . should begin immediately \¥e 0 m ormatIOn .systems number of systems are n~w WI 1 o~es now .operatmg. A each governmental level °FPeratmg °lr bemg planned at . or examp e:
h T~e Na~ional Crime Information Center (NCIC) as een Implemented by the FBI .
mediate' access to stolen-auto s to prOVide im-
lV5ant~1~~~~~ntn~ti~~[;atio; d,\\:~~~~iro~~r!~~~~e~ tended to all States add :an;{arg:v~i~i~~allY be ex-
Th . t' ~ New Y( ~J'rk State Intelligence and !dentifica Ion ystem NYSIIS) and th C J'f' •
gence and Identification Sea I orma Inte,Ili-st~tewide services such as !r~:~aFlh~t~~ prOVIde prmt and name identification files t ~ fingerfiles, gun registration modus 0 ' ~an e -persons co tics registration, add statistic~f~~~~~~l~tio~l~d nar-
The California Aut St t' d State Poli . . 0- a IS an the New York ce mqUlry systems provide im d'
cess to stolen automobile files. . me late ae-
Th P r Al
ed CO Ice Information System (PINS' f arne a ounty Calif . I ) 0
persons fil f " ., provlc es access to wanted·
es or county and local I f agencies all' aw en orcement f . A s we as , .. '11 automatic tie-in to the C r orma uto-Statis System for wanted vehicles. a 1-
St. Louis Chica N Y h ,go, ew' ork and oth .. ave computer systems that pr . d . fer. cIties
stolen autDs stolen ro crt OVI e m ormation on arrests oth~r p p y, wanted persons, crimes police ~esource ~f~:a~f:~nt statistics, and help i~
Some of these systems du l' fil ernmental levels--auto fil~ I~ate. es kept at higher gov-addresses its own specific and' or mds.tance. Each agency Imme late needs. To mini·
. 11, "Unifonn CrIme Repolte n 1965 In the FBI "Careers in eri I" .' baaed on a surveyor about 135 000 IT since it is biBsed jn favor ~; r!der.,es
1, nrrot ad representative aanlpie or'aH oOrre·nnl
der, ... ra 0 en era. ( en,

'i,
10 mize this duplication and potential conflict, it would be desirable to establish some overall system structure and program of implementation. Active development to meet immediate local needs could then proceed in a more integrated way. This chapter attempts to outline such
an overall program. In developing such a program, the problems and needs
flexibility in tailoring their own system to their unique requirements. Infonriation to be exchanged with other jurisdictions must, however, meet minimum standards of content and format. Furthermore, reporting juris. dictions must be responsible for updating their portion of a common information pool. Only that way can the files be kept current and complete and the system not saturated with useless information.
Table 16C.-:-U~ers of ~iles in an I ntegrated Nat' I nmlnal Justice I nformation System lona
Type of file ._-----~ .. ----Personal information
Inquiry --------. --Directory I Registry'
for information were discussed with knowledgeable operational personnel in police, courts, and corrections agencies, and many of the organizations which have implemented some [onn of information system were visited. Most of the recent system studies conducted for specific
agencies were reviewed. Based on this work and with the active assistance of
personnel experienced in creating information systems for this and other applications detailed information flow diagrams were developed for:
(1) The operational information flow in a large municipal police department;
(2) The information interchange required between police and investigating agencies on the local, State, and Federal levels i
(3) Municipal courts and courts of general jurisdic-
tion; ( 4) Information needed within and between correc
tional agencies, both juvenile and adult, a.t the county, State, and Federal levels;
The possible system configurations range from a highly ~~~-~~-se ~=- ~~in-ut-es= -H-ou-r-s.-•• -•• -.-•• -o-ay·-s.-•• -.-•• -•• -.-•• 'I-w-ee-k-s.--·_-
National. ....... Police... ••• ··A~~II-c-ri-m-in-a'I-I'-----:----------,----
justice No file kept..... Criminal justice agencies. agencies, reseucr, projects, Govern·
......... 0 ....... Courts and cor· State .............. do... d I Local. ............. do ••.••.•••... do .......... ~~~~~~~ .~~~~.
!lIent public Information offices.
Do.
Do.
I I ndex of record information as t f k 'ctobllection of related background °m~[~r~I~(np~a~St)'lith.criminal justi~e agencies. ep y some States. 0 a Ion reports, educational records, etc.)
centralized Federal system, containing an the Nation'! ctiminal justice information with a communication link reaching every criminal justice agency, to a completely decentralized system with independent computers located at every police, court, and correctional agency. The approach recommended here relegates to the local 01 State levels the bulk of the information system while placing at the national level the information thought to be of significant value to a number of States and to Fed· erall
aw enforcement. One version of this concept woule
entail several regional centers, each covering several ad· jacent States. A limited national system has the advan· tages of being easier and quicker to implement, and Ie!! costly. In addition, it could provide service to Stat6 placed in a more secure fil 'b which do not noW have sufficient need for their 0\\" tion of the most serious cri e, access 1 Ie only for investiga-"A meso
system, and so will not implement their own for at least ccess to the national dire t '11 rev,ml l~a". moan, oC a ret of flng" ,i t' 0'1 "" . noonally be by C,ntmli,ing too many of the fundion, und" Fedm manual te,hniqu" 0' fuf n" "'mg "the, the p,,""t
eontrol h., th' ,tmng dang" of ,"xc",i" Federal,,,,,, might be developed In t,::"e t~tom"tcd techniqu" that oC State openting r"pomibiliti". Henco, th, ""i~ add latent flng,,!,r;nt' and e u u'" .'t may be po"ible to ment oC F,docalfun,tion"nU't be done with oon,id,rnb\ ",co"ibl, by othoc inv"ti .";i~:Pdu"ve offend" ,"bflle
d
'd f d . personal appearance and g d ata s~ch as a name o.ution, ped,.p, un "the go> anco 0 an a v'"o')' rom F· ,mo u, opocand, ' mittee "n,itive to the'" problem' and to th' nero'; mally, a National Crimi 1 J . . 100.1 law ",Core,m,nt. ,hould be "tabli,h,d in th B
a "'"" Stati,tki Cent" (5) The gathering of operational statistics as an anal
ysis, evaluation, and development tool.
Examples of ~ross flow diagrams are presented in appendix G.\)~ These can serve as starting points for many criminal justice agencies designing their own systems to meet their own needs. The flow charts are available in computer-readable form and can be used for future system function and flow analyses.
These discussions and information flow diagrams have identified a number of system fLlctions on the basis of which the Task Force has outlined a possible system structure directed at the needs of the various levels of the criminal justice system (i.e., the lccal, metropolitan, and State needs), and a possible supporting national structure.
Looal and State pa,-(i,ipation in the national ,rimi. cont" ,hould b, ,",po",·W ;rae::"'nt of ~u,ti". The . . . £. b' 1 Tl h and dissemination of t 1k·ed or ft e co11ectlOn, analysis ju,h,,,n onnatron "I,tom nMt e opuona . ,"" " wo m ,0 data: ' do choose to participate, however, will have to meet min:. 0 mum standards of data format and content to permittht . Those characterizing cr' . 1 accurate transfer and interpretation of ,"oo,d. "TIl "reCully drnwn .ampl,mrnt ""een<, de,ived [,om For specific studies m es 0 a~lOnymous offenders.
total effectiveness of this system, of course, is based 0: of individuals could beorde
detalfled data on samples having a large segment of the criminal justice communit 0 rawn rom the States. participating. Those on crime and th '
The geneml fo'm of a p""ibl, national inConn'" "'P0"oo by the eriminat ,y:tem, ""pon" to it, ., ,y,tem i, ,hown in table 16. At th' national level, tho jU' .eo agen"e,.t all level,.
GENERAL CONFIGURATION OF AN INTEGRATED CRIMINAL JUSTICE INFORMATION
SYSTEM
Since the administration of criminal justice is primarily a local and State function, a national criminal justice infurmation system must be geared to their requirements. Fundamentally, the information system must be directly accessible to them and they m:tst specify the information they need from other jurisdictions. This leads to a concept of a hierarchy of information interchange and information files. This approach leaves with the local implementing agencies the greatest amount of design
~ Dntancd ,\iagram. for generic operating agencies are in "Flow Diagram' for Criminal Justice Information Systems:' n report noW in prcpnrntion. The report wilt be ayanablc from the Clearinghouse [or Federal Scientific and Technical Information of the Nationn\ Durcnu of Standards.
could be a central inquiry system. It would respo~ ·1he Science and Technology Task F .
within ,",ond, or minut" to poli" qu,,," from any,,1< . ~rt, th, T.,k F ocee on A"""ment of (rOO ,?lI'dbomted in the Nation. It "ould include 61" oC ,tolon au' ~~n~ pr"lt!:m fo, a National Criminal J~t\m S,ev,I~p. liocn''', gun" wd ",ialired 0' oth"""" identifi~ oC th~~ e propo,.l i, detailed in full ,; ~h ~t'"t'f~ valuable prope"y. In addition, it would li,t the n'" At th~'~:',;,eft T"k F OIT~ volume. ap er and identification of persons wanted for extraditable n , file would b~ e e:,cl, !in mqUlry file similar to the nat1'0 '[
f S h
. b . d triI· mamtamed Th St fi na enses. uc a system IS now emg operate on a : extensive, however I' e. ate Ie would be more
ba,;is by the FBI. . i ~ files-motor vehicl~ t. wou.ld mclude other kinds of Perronal inConnation about adult' wi crimin~' f?r mmpk ..... nd "r;tmtron, and gun regi,ttatiom
ord, would be induded in a dim'o' which li," j nou'n"'-pen;on, ;;ou, d have a !owee th,,,hold of ,,: Corm~l matte" of ,,,,,,ro of ,ontaot with eri,,:,inal j~~" .valuabl, ,tol,n prop:' ,e e;~' nomndi'table offen,,",, I",
agen,,"'. Dat" and plac", of acr"t fo' ",",ou, or"~ Il A State would al,o ~' . . ,ouet di'p",ition, "ntenoc, oorreotional ""ignm,nl ~ \wn" 'ontac," of reoo d av, : d,recto,), re,o,ding a por·· bation and pawl
e would be ,",",ded. More debil:",e,roi". Heee too :h ""~ the Stat,', ,riminal ju,tioe
inConnation would be available from the lo,al age,.. .'ndud, offen",; not e.t ,,,hold would be lowered to Reooro, of perron, with no recent ac,"''''' ,o,ldl . <1 ireeto,),. "nou, enougb fo, tbe national
00 Deci.lon. mll.t be made on the minimum dural ion .ince the 1a.t conlatl' criminal jllBtlce ageneie' that wnrrants tran.ferring records to the "curt i Thi. lime woutd de~end on the type. of crime. and the extent of the reeord.
71
In addition, to support court and . making some States could t br h correctlOnal dedsion-o~ persons in their directorie~ 1;'hI?-10re ~etailed r ... ;cords tam such background info 'f IS regutrr COUld conment, military service an;na ~on. as education, employcould also be used to' )ro ·Iro a~lOn reports. Such files effectiveness of the Sta\e'sV~iff baSIC data f?r assessing the Because of the sensitivity of eren~ corect1?nal programs. the registry, its use should b muc .0 the mfonnation in correctional agencies. e restncted only to court or
Much smaller and sim 1 . f . be established for count foer
111 onnatlOl1 systems could ment records, to kee t!ack ~rt~ t? process c~u.rt managehandle the probatio% office's f ~nsone:s awaIting trial, to access to State files for 'd.n onnatlOn, and to provide reports. This system a! hm pr~paring presentencing police, county sheriff :~~ t I be mtegrated with local functions. ,ot ler county management
. In large cities and metro r . .. ;,10n systems would be est~~i~hal~ aleas, pO!lce mforma-.,tate and national in' e to prOVIde access to Ci.rrest reports .. and for ~~:J ;rtems~ to record crime ancl allocation, a~d other 1 1 Y s of cnme patterns, resource metropolitan area th oca ~anagement functions. In a joint authority s~~in e arr~~m cou!d be operated by a by. the cO.re city policegdepart~assoc1~te? com~unities or ne1ghbormg police depart ent 0 ermg servIces to the ments on a fee basis. '
IM~EDIATE RESPONSE INQUIRY SYSTEMS
A police officer frequent! ne d . . matter of minutes, whethc! ind~ 'd to know, \~lthl11 a other property are want d . 1\? uals or vehIcles or elsewhere. This infonna/ w1thm his jurisdiction or within 1 to 5 minutes __ t;O~t:ius~ be avail.able rapidly!ind the inconvenience t h. m1z~ the time he spends mformation which ma 0 t e detamed person. Other similarly be ~ade avail~b~~~7be ;~t;d~d fO quickly, could firearm registrations cri' IS mc udes vehicle and reports. ,me reports, and missing person
. An inquiry system could also s .. tlOns. One of a small upport cnme mvestiga-could be identified l' g:oup of frequent serious offenders
1. n 1esponse to . .
a lases, personal a an mqUlry of name ~ion, ?r other kno~~e~~~nce, ~O?uS operandi informa~ mvestlgation The d . ractenshcs revealed in a crime carefuHv co~sidered tes1gn and use of such a file must be . d' . I 0 assure that th . m 1v1duals' descriptors ale quenes anri the (lnly a small number f re comp ete enough to produce
Table 17 l' t . 0 responses to an inquiry .. IS S vanous files th t . h . mqUlry systems. As indi t d a mIg t be maintained in formation woule: be retai~:de on the table, different inThe required time to res on~t each &,ove~mental level. be different for each kind of fil~~ an mqUlry would also
Separate statewide in ui mediate information q rylsystems could provide im-. . on sto en prop t d
:van ted w1thm the State An ~r y an persons ~ts proper license plates ~ould bau~m~b11e re~overed with m whIch it is registered Fee che ed agamst the State . or ot er property and for

72
Table 17,-Possible Inquiry Files
file contents or function Criteria for entry into file at each governmental level
Required response
s tolen auto t ......................................... Unrecovered slolen vehicles. Unrecovered identifiable stolen auto paris. Stolen auto license plates .• Vehicles wanted in connection witli felonies
tolen identifiable property I ........................... Individually seria numbered Items. Multifle serial numbered items. Seria numbered items related to "serious"crimes or
s
Indication of interstate movement. mlen/lost guns t •••••••••••••••••••••••••••••••••••••
Serial numbered weapons. s
W Weapons recovered in connection with unsolved crime.
anted persons I ..................................... Warrants and wanted·persons notices. "Temporary felony want" (prompt action required
prior to warrant (good for 48 hours only». Aliases.
w S
R
arrant file administration (felony, misdemeanors, traffic, civil, record of "attempts to serve").
tolen auto and wanted· persons "hot sheets" ••••••••••••
epetitive offenders_ ••••••• _ ................... _ ...... Name index. Personal nppearance. "Modus operandi"
(tentative identification on basis of name, aliase~ personal appearance, characteristics 01 crime, an other characteristics or descriptors).
" F
Criminal associates~istof known criminal associates). ceess to State motor ve iele registration (Identification of owners by vehicle identifiers).
Irearm registry ...... "_ •• " ._ •••• ",. ".'."" •••• _ •• F raudulent document~ "trademar~,s" of fraudulent docu·
ments (checks, bon s, stocks, etc.), ames used on fraudulent documents (tentative Identifica' N
M
S
tion of persons responsible). issin~ persons (assist in identifieation and loc~lion of mlssmg persons/.'
ex and narcotics directo~ 01 sex and narcotics offenders) Crime reports(atl pertinen information as source document
for system files and statistics). Arrest reports (aft Rertinent information as source docu·
reent for system lies and stati.;tlcs). Ballistics (characteristics and "trademarks" of firearms
and bullets on file). Correlation of wanted persons, crime, arrest, and field inter·
view reports (as an investigative tool for retrieving and correlatmg all information on presence of suspects near scene Qf crime, crime patterns, possible suspects, "modus operandi," checks, etc).
., .-National
After 24 hours ••••••••••••••••
Immediately,
·vaiue·ireaiiirihaiiii;Ooo.······ Value !lreater than $5,000. Discretion of reporting agency.
All reporte~.~ •••
federal warrant outstandh& .... Reportin~ agency willing \<J
extradite.
~-- ....... -...... -- ....... -.. -- .. -.. -----.... _- .......... _ ........ _-- .. -........... -_ ...... Associated with some serious,
repetitive, mobile offenders in the national directory,
...... -...... "' .... -.... -................... _ .. -----
:::::::::::::::::::::::7-
.. --_ .. -- .... ----- .... -..... -.--.... --_ ....
.. -.......... ., .. -------_ ... --_ ..... -------_ .. ---_ ...... _--_ .. -.... --- .. -.... -.. --
........ -.. ., .... -_ .... --- ....... -_ ...... --- _ ..
.. -......... -........... _-- .. -..... --_ ................
........ --_ .. -.... _-_ ...... _---_ .. _--- .... -
Stale Local, county, metropolitan time to inquiry
Immediately •••••••••••••.•••• I mmediately (maintained If there is no State system).
Less than 5 minUles.
Ail si~nificant items not in L~w valued or "special inter· Do. national system. est" items.
--_ .. -- _ .... -- ---- ... -.................. ---- ---- ....... _--------------- .... -.. -.... Do.
Reportine agency not willing to Do. --- .. _- -.... -- .... -.......... -_'O .... _____ . e~tradlte (does not include traffic warrants).
--- .... -...... -.. -.... _ .............. __ ...... _-- All warrants. ___ ........ _ ••• _ •• Less than 15 minutes.
for state police or highway for local patrol officers and Once per shilt. patrol. detectives.
Associated with serious, repet· -_ .... _-_ ...... _-_ ............ -_ .......... _ .... - Less than 15 itive offenders in State minutes. directory.
. .
All r,egisttations ............... ----_ .. -...... -........ -- .......... _ .... _ ... _- Less than 5 minutes. -~ All registered firearms ••• _ •••• .... _ .......... ------ .. --_ ........................ Less than 15 minules. All reported documents ... __ ... -- .. -.......... -_ .. -............ -........ --_ ...... Do.
All reported persons._ ••••.•••• .. _ ...................... "'. ___ •• w_w __ ._ ...... Do.
All persistent offenders •••••••• less than 2 hours. • Aii recent" reports.::::::::::::: .. -----. _ .. --- .. _ .. -- ..... -_ .......... ----- Do.
-_ ... --- ..... -- -- ............ -.......... --- .. - All recent arrests •••••••••••••• Do.
All recorded characteristics ••••• .. -........ -.. -... ~ ...... -_ .. ----- .. --.. "' .... Do.
.. ---_ .. --~ ~ .. -~-~ .. ~ ~ ...... ~~ ..... -.. -- .. All recent uimes and field Do . interviews reported,
I These systems presently being implemented at national level by the fBt as NCIC with a nationwide teletype network.
persons, such an inquiry would theoretically have to be addressed to every State, requiring each State to implement its own system and calling for complex communications to every other State. A second alternative would be to establish a limited number of regional systems centralizing information within each region, The regions could be interconnected into a national system or could be kep2 separate, accepting the penalty of losing track of people or property that cross the regional boundaries, A third alternative is to establish a single national reposi. tory to which any State may address inquiries, and into which every State places information,
NATIONAL INQUIRY SYSTEM
In operating a national inquiry system, reports of stolen automobiles) license plates, and identifiable automobile parts wouid be entered immediately into a State file, and then transferred to a national file 24 hours later, After transfer, the State could either clear the record from its
file or retain it. - Automobiles wanted in conjunction with a felony would be entered in the national file immediately. Similar high thresholds would be placed on the wanted property and people recorded in the national file.
Such a national inquiry file (the National Crime In· formation Center-NCIC) was established on an ini, tially limited basis by the FBI at the beginning of 1961, This file will contain records of all cars reported stolen for more than 24 hours, all pe~sons wanted for extl'i!' ditable offenses, stolen guns, and all stolen identifiabk property valued at over $1,000, It is maintained onl computer, with terminals initially connected to 15 polia agencies, and with plans to include all States eventuall) Any agency with a terminal can enter a record into WI file or inquire whether a person or property in custed! is listed in the file. It will receive an answer second! later,
The utility of a fully interconnected national inqu~ file depends on the need for interstate and interregio~ communications &nd on the need to provide an inquU~
--------------------------------------------------------------------------------------------------~
capability for those States that do not estabJ' h h ' files, If such a need should be establish d IS t elr ow,n (appendix H) indicates that a single ee~t~~ cost analys!s more economical than interconne~ti ., compu~er IS
computers. This result follows fro~~he~aratehreglonaI puter processing and storage costs ar e act t at comcommunications costs It" ' e much greater than
, ,IS Important that th S ' assessIng their own needs and d l' . e tates, In
73 3, A completely dccentr r d' ,
in each State) in which eaa h2~ mquIry, system (one
~lete national file. c tate retams the com.
For each of these configurations cred: , two cases Were consid.
puter facilities and the FBI' eve op,mg theIr own com-d . ' In operatmg the NCIC k to evelop mformation that "II 'd ' see' 1. Each State transfers its st I '
d . , WI ProVI e a b ' f soun deCISIOn on the noed f d aSlS .01' a '" ~ s or an the fo f natIOnal mquiry system. rm 0 a
to ~he national system aft~r 2~ h:~uto mfonnation natlon.al system to service II' " rs and ,uses the
The cost analysis detailed in a d' , providing national stolen auto ppen IX H IS based on wanted-persons files The t' ~olen property, and are based on analys~s bein cos a.n d workload estimates The data rate is based on g 9ame out for the FBI,DB from the "Unifonn Crime R~;m~ ~ndI arre,st projections mated as a function of crl' or dS' nqulry rate is esti-
, me an arrest rat b d operatIng experience with s' 'I " es ase on fomia and St. Louis Th llm ~r In;rulry systems in Cali.
bordl entry, and int~rroga~g~o~~~~~ i:oln9t7holy crime
h, ree·
e ow: are sown
W~~~-~da-~~-~~-oit-s-a-n.-lji-;:;;==I''' .. :~::I Enfry5:~::61Infe;~02t:5:4tion ......... - 287,256 240 160 ,764
Total .......................... ~78s'5-' 431,000 - , 298,036 685, 764
Thes.e monthly average en" d ' , lUultiplied by a factor f f'ry an mterrogatIOn rates were to handle loads at pea~ _o~rdto assure sufficient capacity
I ' perlO s, , n operatmg the system 't Jurisdictions send all tl ' ' 1 ,was assumed that local
St leI!' entnes and 'nt ' a ate computer wh' h ' 1 errogatlons to
, a Its mterrogatIOn, 2, hach State maintains it- own
and only interrogates the n t: I stolen auto file State automobiles. a lOna system on out-of.
The results of the analysis are show ' most eco'1omical system f th r: ~n table IB, The the single central system :- wh~ ~o~dltlOns c~nsi?ered is own records of stolen autom b,Ie tates main-tam their ported to the national file ;,;les Fe~en after they are re-
, system Would he about $50 oo~e e eral cost for such a location system would cost b' per month. The twoThese resull~ follow from t: ~utt ~O,OOO more per month, costs are far more dom' e ahc at computer operating Th mant t an com . .
ey also depend on muntcatlon costs , an assumptio th ' tralrzed file is updated b J n at any noncen· '. y eac 1 entry to . , qUIrer to mterrogate th t' permit any Jl1-" e en Ire natio I fil .
overhead costs in maintain' ,lla e, The SIzable tions would be additional, mg mUltIple computer installa-
Because communications costs a 1 of ~he centralized system is 1 t' ~e ~o ow; ~hc total cost cation of the comput T~e a I~e y InSensItlve to the 10. Springfield III but she~f' t' . e optImum location Would be
, ,., I lllglttoWashi t D raIse the national costs by 1 b ng on, ,C., would less than 2 percent. on ya out $1,000 per month-
fil F IC communIcates 'til' 1 e. or noncentraj'. l' " WIlt lC nabonal IZCC mqlllry system I . computer was assumed to ' h s, cae 1 natlOnal
Computcr operation' upoatcdt c others continuously .. and computer stora e IS assumc!': to cost $50 per hour 0;
characters. Commu~jc~~,(cost $2,1 pCI' m~nth per million , charges based on T I ;.:J~ costs are derIved from GSA putcr is assumcd to c pa ~ land D tariffs,lOIl The com-
Table lB,-Estimated Monthly Op t' NatIOnal Inquiry Syste~~altng Costs of
0" reqUire second t I an Intcrrogation C '. 0 process an entry sume:l to take 20 s~co~I~ml!n:cation ~f an entry is asrogatlOn (transmissior1 ~~~I :~pJ!t )t~c tIme for an inter-seconds, Y IS assumed to be 30
. An information' . contiguolls States Pldoc,eVssll1~ center for each oJ the 48 I d . . an . ashlllgton D C ocate In the State ea 't I ,. I" was assumed
Threc . pI a . S'd d separate computer fi
1 ere : con 19urations were con-
1. A single ccntralized national
1 2" A national inquil)' inquiry system,
system divided into two <'catIons.
Cost component
: j
, j
lj
!j /j
j
tl fj
II j
Ij
j
,j
j
j

74
The cost of converting manual records into a computer form would be small for an inquiry file. These are active files with relatively short. lifetimes, so that over a 'period of 6 months to a vear the files could be created even without a specific dat~ conversion program.
There are several modifications to the postulated configurations that could give rise to noncentralize.d systems with operating costs'comparable to that of the smgle centralized system:
o Each user could update his closest file (in his State or region) with the other files updated in the slack period~, late at night. This would reduce the peak demand on each of the computers, and so reduce their required operating capacity and computer costs. In this case, the cost of storage of about $3,200 per month would be duplicated at each installation.
o Each regional system would handle entries and inquiries only from its own region. This introduces the undetermined penalty of losing track of people and property that cross regional boundaries.
In cither case, the economic penalties resulting from morC', smaller installations and the additional fixed costs of operating the multiple installations would tend to favor the singlc centl'dl system.
STATE INQUIRY SYSTEMS
Since each State has it,!> own interlml structure, legal codes, registration and reporting requirements, and crime problems, each will fashion its inquiry system to its particular needs. Many States do not have the volume of criminal information to justify an inquiry system more complex than manual records and the telephone. In some States, the primary requirement comes from one or two metwpolitan areas rather than from the State at large. In some areas, several States will join together into an interstate region and create a single common inquiry system.
The accuracy of the information in the national files is the responsibility of the States since the national system is a service to the States and no means are provided for verifying the information on a national level. In general, the State systems should not duplicate information available from the national file, except perhaps for automobile information. Only items above some threshold of importance should be kept nationally. States could keep the infotmation below that threshold, e.g., stolen property worth less than $1,000, wanted persons they would not extradite, and intrastate repeated minor offenders.
In addition, States could provide access to the motor vehicle registration files. Also, some States require gun registration, sex and narcotics offender registries, fraudulent documents registries, and missing persons files. Which of these should be made available on-line requires further examination of their utility and cost.
The States would have the further responsibility of distributing within the State access to and responses from the national inquiry system.
101 HTho Computer nnd In\'o$lo" (If Prh'ncy.u Hearings before 0. Subcommittee o( tho Committee on Government Opero.tions (Special Subcommitten on InvBsiQn
LOCAL INQUIRY SYSTEMS
Whether cities, counties, or metropolitan areas establish their own inquiry systems depends on what the State implements. If the State system is complete, then access to the State and national system would normally be m(· fiGient. , Where there is no State system, major melro. politan areas would probably want to establish their own,
Even where there is a State system, certain routine functions might be implemented locally. These might include a local stolen property file, pawn-ticket records, a warrant file including "attempts to serve," and prepara· tion of stolen-auto and wanted-person "hot sheets" for distribution to patrol officers and detecti.vez.
HANDLING PERSONAL INFORMATION
THE PROBLEMS OF PRIVACY
The most delicate part of any criminal justice informa· tion system is the record of previously arrested people and accompanying information about them. Such in· formation is valuable in making prosecution, sentencing) and correctional decisions. But whenever government records contain derogatory personal information, they crea te serious public policy problems:
The record may contain incomplete or incor· rect information.
The information may fall into the wrong hands and be used to intimidate or embarrass.
The information may be reta.ined long after it has lost its usefulness and serves only to harass ex·offenders, or its mere existence may diminish an offender's belief in the possibility of redemption.
Heretofore, the inherent inefficiencies of manual lites containing millions of names have provided a built-in protection. Accessibility will be greatly enhanced by put· ting the files in a computer, so that the protection afforded by inefficiency wilt diminish, and special attention musl be directed at protecting privacy. However the new technology can create both more useful information and greater individual protection.
Some of these problems were reviewed in recent con· gressional hearings 1Q1 on a Federal data bank. The hear· ings went into the problems of law enforcement informa· tion systems and the general problem of the protection of personal information files. The report stated:
It seems evident that if the proposal to create I national data bank is adopted, we will have to re~ only on the hope that benevolent people with b~ nevolent purposes will operate the system. Histo~' however, has already taught a terrible Jesson illuy trating exactly what can happen when large stor!! of information become available to nonbencvolerJ powerseekers.
of Privacy), Hnuse of Represonl.tives, B9th Congre .. , July 26.27, and 28, 1%6, US Government Printing Office. W.shlnglon (1966).
The risk involved now in entrusting th 1'1 . 75 of the American people to the me f e 1 ?ertles future, -the names of whom we d n 0 power in the and whose benevolence we cannot 0 not even know
. Some protection of personal til meal security methods h" h es. can come from tech-of penetrating a system. w I~ es~~ u~rease th,: diffic~1ty cost anCi complexity, these include: ate order of mcreasmg t . presume to guar an ee, IS too great for us to take.102 -
However, when dealing . th 1 the rights o~ society must al:~e :;:;'~~forcement da~, warned aga'lllst dangers to individP 1 . h d. hAlthough It Civil Liberties Union has also re:;a r:g JS' ~ e American crime information center Joh °15
J1ze pte value of a
the ACLU Executive Sec;eta :a e. emberton, Jr., servations regarding the FBl'?N t' de IthCe .following obtion Center: a lana rIme Infonna_
Certain valid law enforce . served by the creation of h me~t purposes WIll be work and crime detecti;~c a ata center. Police pursued if information Con can. be more efficiently
d 'l cernmg maJor~' . re~ I y and quickly available t I cdmes IS ficlals. In addition s h 0 aw enforcement of· source of vital statist'I'caUjcr a center can serve as a 1'· esearch on cr' d Ice practices in the United States.103 Ime an po-
However, Mr. Pemberton . d hCl'cnt in incomplete arrest i:r~Inte f out the. dangers 1nnot relevant to crime cont rma lOn and mformation regard to political expressi~~~ ~~~p~se.s, particularly with recommend a tions he ehefs. Among other guards: 104 • , proposes several important safe-
o Assigning an identification code User ~nd each terminal and h k' nU~ber t? . each
each mquiry. Codes Would bC
et mg t e V~lr~lty of '. e clanged penodlcalIy.
o F~a~smJtting the information b . If It IS not required immediately. y mall or messenger
o Keeping terminal equi me . prevent access by unautPh . ntdm secure locations to
orlze users. o Protecting the t d fil
th h Sore es themselves by "lock' " em w enever unauthori d I mg
the system such as durin ze persons lav~ access to Dummy files could be u; JOfPute~ malllienance. program checking. e or mallltenance and
o Scrambling or encoding tr . d' minimize the danger fro atnsm~tte lllfol11lation to
m applllg of the lines.
No technical means ho formation will not be i~ wevy, can guarantee that insteps which can be take~roper y used. There are many purchased has a possible ,but every level of protection information and comm co~nt~nneasure. Even if all the some person or device ~~~~~lOns \V.ere fully enCoded, or device might become 'bel code It, and that person
T acceSSI e RestrictinD' the' f . he dangers can be minim' d I b
of record. " III OnnatlOn content to m<l,tters the controlling organization' IZ~. b~n y y insuring that mation recorded in thi~ s ste~ ~e Ih e ~n? that the infor ..
Restrict' th d' Research is needed to idlnff s t e .mll1lmum necessary. tice agenci~~~ e Issemination to criminal jus- in making correctional a . I Y '~hat. lllformation is useful
infonnation collected an~l~ves~lgattve decisions, and the Penalizing improper disclosure. to that material The 0 et~lll~d should be restricted Providing individuals . a.nd control the file must h~~~Iz~tlOn selected to manage
and means for Corre t' acchess to theIr records CleS contributing information t T confidence ~f all agen-c mg t em. work closely with reportin '. he group Will have to
The New York Civil Lib' . uniform, and complete i~tgel1cl~s to. assure that correct, dation 105 and (10 • ertJes UnIOn, the Vera Foun will be. responsible [or restri~t~a~~on. I} repo~ted. They o.f t.he'City of Nemwmylottreke~oaof the Association of th~ Ba; a~thol'1zed to receive it. In a~d' ~ In ormatlOn to those 1 • also d WIll be needed to handle tl . 1~lon, some mechanism ImJtations of information SUpporte the use with for access to the file f le IneVitable flow of requests purposes. systems for law cnforcement is first established. or pUrposl!s not anticipated whcn it J The New York Stat I I . As h k Sy tIe ( entlfication d I 1 a c ec' on the users and .' s em las addressed th . bl an nte ligence quiries should be kept' manager of the file, all in-lflformation in a Stat 7 PfIO e~s of handling personal d d' m a pennanent record d th
e tn ormatIOn system: or au lted regularly to vcrif th ]'. an at rec-?f the incjlliries. Unauthol'I'zeYd dCI'svla IdIty and handling
The system will not t·· c osure sho ld b I. the detailed inform t' attempt to duplicate all of Jec to sel'10US penalty. u e suo-'d I a Ion c1lrrently sto d' I The audit should be by a d'ff
VI ua case jacket d f 'ld re 111 tIe indi- operating the system Th' I erent agency than the one agenci~2. Such I'nfoal~m ? er-files of participating . IS group could I . . atlOn c b b ~omputer programs to insure tll~t th a so monitor the It IS needed, directly fl'om t an e 0 't.ained, when d '" ere are I fi/ he Ize modes of access Th '. no unaut 101'-1 es. However tl appropnate agency's . ey could also t b .
f ' le system 'Il' I means to penetrate the sy'ste . ry y vanous re erences to th WI mc ude adequate' 111 as a runn h k , b' OSe sources such . d" . secunty. These provisions '. tng c ec on its
a su Jcct is currentl 0' • as 111 IcatlOns that protect military inform t' are SImIlar to those used to r confined in a particuYI n
f p:I~batJon or parole or is Th' a lOn.
:-:---_ ar aCI Ity.lor IS problem stl'll ne d h -- . d e smuc more stud . ;:gP'Clt"PP.3I~2_~3I;3-------:"""---_____ ......:Ju gment. Congressman CalI I h ~,analysls, and 10, aP' c!t., \>. 182. • --. ag leI', c aIrman of the
-~~~- -0p. Cit., p. 159. lin (lp. ri,t •• pp. IBO-I61. --"'--Op. Cil. p. 163 troln a NYSllS b
Challenge .in Crimln~l Justice!' rochurc, "InformaUon Sh4'Tjng, the HIdden
76
Special Subcommittee on Invasion of Privacy, in calling
for such efforts, stated:
, t ' plement the national ' The data converSlOn C?st 1
01m In a study done for
directory on a comruter IS ti~~~he State criminal idenNYSIlS, the cost 0 conv;SO er record (approximately tification files averaged $, l) Preliminary estimates h 'entific community,
"We must call upon t e SCI I ment of this h ' h is responsible for the deve op 1 'b'l-
w IC I to bear the equa responsl I Lcomp~ter) techn
l ~ ogyci to guarantee adequate pro-
ity for Its contro , mol' er ,,, lOB
tection of the freedoms we noW enJoy,
ORGANIZATION OF PERSONAL INFORMATION FILES
~2,~50,000 fo~ 5?37~0~h~e~~i;n~1 identification files "Yill mdlcate that m t 125 million persons which contain the recordci of ~~?SU wouid involve, at the :present should be converte, f $56 million, Even wIth the state-of-t~e-art, d a" cost ~eets" and improvements in opmare eaSIly rea drap s th' cost could easily amount to tical character rea ers, IS
, , 'f on it was possible On the basis of the lImited exa;~~a ~ersonal criminal-
$10-$20 million, d 'th ff d' t be performed to etermme e ,
Trade-o stu les muS Th low update rate ~six up-to undertake, it now appears 'd as follows: record information shoula be orgamze
ational law enforcement direc-o There should be an, d' idual's arrest for felonies tory that recor,dd an m IV the disposition of each and serious mlS emeanot'mal contacts with crimicase, an,d all subs~que~t t 0; to those arrests, Access nal justIce agenCIes re a ~ " ' . should be limited to crimmal Justice agencle,s, .
S 1 nforcement dlrectones o There should be . tate I d':w etory but including less
optimum storate {eans, ac~ive case) and the relatively dates in 3 m<?nt S or 3l vJry akes acceptable response times slow access tIme rThlre fm ated storage requirement is an of over 2 hours, e e~ 1m r record or a total of 10 average of 800 charac ers t ~~e relativ~ly low cost of on, billion chara~ters'd Even lr ($720 per million characters line storage m ': ata ce , voive a cost of $72,000 per per month), tht WOUt~ mmeans should be considered, month, T~ere ore, 0 erd ounting or optical charac' such as offlme storage an m ter storage in aperdt,ure cards, ld be similar to a current similar to the natlOna Irec ,
serious offenses. . . h 'd 'inal justice registnes t at o States should conSl er cn:u factual information
The national lrectory wou I' department sends FBI service, Today~ when a :0 ~~: checked against a
~reg~r~i~t:n~Y~o~,~~~~~;~r~tsth~l P~~~~O~~y a~~~~~~ th~~ could recor1 some anc~o aZent records, probation (e.g" ed)uc~t~o~,a~gu~Plisied in their State direcreports 0, m, lVl , must be protected even tories, TIns mformatyon'nformation in the direcmore carefully thabn 1e.l 'ble only to court or cortories, and would e acceSSI
fingerorinted mdlvl~uals: Thf tPh 'ndivldual and his , " 'dentlficatlOn 0 e 1 d
gets posltlVe I " h t" The process is conducte
rections officers.
Id be simil~r to an index The national, directory ~o~ould contain ba;;ic iden
or telephone dlre~tory. me identificatIOn numtification informatl?n, such aIs ~~dition it would specify, b ' ge and descnptlOn. n " 'd" the cr, a , d d the date and Juns lctlOn, for each arrest feC?r e,', d the assignments to cor-charge, the cour~ ~Ispos~onfu~~her background informarectional supervlSlon
1· 0 tt rs of record should be
tion other than t l~se m,: e An more detailed maintained in the natl.onal dlrl~t~~~e to ~ome from the background info:matlOn d \~OUthe directory record. This individual agenCIeS note m dded inconvenience in colrequirement may ~ose ~ome ~ 'n conducting research on lccting complete hlstones an t~j' otential dangers inhercriminal care~rs. Howlev1er" ~~tweigh these disadvanent in a maSSIve centra (OSsler
tages. " . I' f agencies directly, I ddition to aidll1g cnmma JUS Ice 1 bl n a . h . rved represents a va ua e
criminal record or rap s ee , k through the mail and ta,kes about 2 w~eal~' arrests that lead
The rap sheet contams a re,cord 0 h FBI It is also " f fi gerpnnts to t e '
to the submISSIOn ,0 n rt dis osition following each supposed to contam the cou ,P , 35 percent
h ' 'f "tion falls to appear m arrest, but t IS m or'" d tment has no strong incen· of the cases. A'po Iced' ep~tr, s after positive iden· , f reportmg lSPOSI Ion "
tlve or bl' h d Some system of mcentl\'eI tification has been edta IS e , that the court dispositiolll should be develope d~? ,assur~ individual should be abl! are recorded, In a ltt~.' a cord and have access to a to learn the contents 0
1 I~ r~istaken arrests, as in case!
procedure to expunge c eal y of mistaken id~ntity or unfou~de~'~~:~~=~ns of an ind~
The FBI mamtams a recor ur: 1 I assed ana vidual's death, or until his ?5th blrt~~fJu~al0P years, 1'. he has not been arrested m th~ P~~se of the diffi(;ul~ may be retained even longer l~c ur ing-either d~ of cleaning out the files, , E~~ ~~r aPsec~re file to whie! stroying the reco,rd or :puttmg ~I~ warrant access-W()u\( only the most senous c~lmes ~o t (uld reduce the stignu not only increase effiCIency u W)
f I t 100 "I. o a sta e arres , '1 h 'ngs daimed that \1'
A witness at congresslOna can " incoIll
Christian notion of the possibility of redemptJlondl,s forlnl " Computer-store III
prehensible to the computer, r f early purgii1g~
the directory, WltTlnardesv~~:I):nel1t of criminal careers research tool. 1e e the effect of accould be stud~ed? pa~tic~larl~ to ass~ore detailed backtions by the crllmnal Justice S) ~tem. 1 S 0.£ offenders could ground informatio~ on selec~e '~~~~~d on their records. be collected, fr?m \ e ag~r~t:s ~y which names should be
In establIshmg t 1~ cn .~ ld of seriousness of crime entered, some ~~yel, t7~::hs~rious than that threshold,
~~~~~ a~el~t~~r ~~~Te~1e~0~s~ __ SI~0~~1~_I~0-=-~e_~~~~ecl. __ _
tion is easily cleaned out.. By a J?<> lCh 0 otion of rede!ll~ the files, computers permlt restonng ten
tion to th: existing ma~ual ~les'directory would contin~ The pnmary entry mto t le _~ _____ _ ------~-~---------- nt o( the p~f
. • 1 . f e system. Thus, only 1 perce release (rom the crllnl!,O JUS lC[ 5 years without an arrcst . cro rcarrcstctl nCter haVing gone or
. -~."'----~-- -.------lOS Oil. cit., p. 315. nn t o[ renrrests occnr within 5 yrRTs niter 1(10 Some data indicate thot 7;7 percen
to be by means of fingerprints, using the present manual techniques until future automated techniques are developed, Th~ fin&erprint file would produce ,the individual's identIficatlOn number or socml secunty number 110 for entry to the directory, In order to permit identification and access to the secure directory in exceptional circumstances, the fingerprint file should not be destroyed when the directory record is purged, In the future' it may be possible to add latent fingerprints and repeating offender "profile" entries capable of being searched by name, personal appearance, or modus operandi.
A majority of States today maintain State identification bureaus similar to the FBI service, These States would presumably continue to maintain their bureaus until there was a more rapidly responding national directory, A number would choose to continue this service in a form modeled after the proposed national directory, particularly in order to maintain criminal records below the threshold of seriousness of the national directory,
To support decisions by courts anct correctional agencies, as well as to evaluate the effectiveness of correctional programs, some States may choose to establish a more complete registry containing supplementary information such as probation reports, probation-institutional-parole history, as well as references to medical or psychiatric opinions, schooling, or employment records, This information would aid in preparing probation reports and in selecting correctional treatment. However, because of the dangers of such a file developing into a large central dossier system, there should be no national registry, If it is to be maintained at all, it. should be on a State level and accessible only to court or corrections officers,
As with directories, the criteria for the entry of new records, the purging of the file, and the retirement of records from the file, are criticaUy important questions to be addressed in the development of State registries to protect the individuals listed therein,
FINGERPRINT ENTRY TO PERSONAL INFORMATION
,Since the primary entry to personal information files Will be with a set of fingerprints, the speed of response will be limited by the time to transmit a set of fingerprints, The present manual system takes about 2 weeks to respond
.. ~o the transmittal of a set of fingerprints, including time In the mail. The information is often needed within a ~ew, hours. Only then can it be positively determined I~ tIme whether the man is wanted in another jurisdictIon, and his previous history made available to the requesting police agencies.
.! The turnaround time of urgently needed requests can ~e reduced to several hours or less by facsimile transmissIOn of the fingerprint card to the central fingerprint file, NYSIIS has tested such transmission and found resolution and clarity adequate for full classification 85-90 perCent of the time,111 Since the transmission time is now about 10 minutes, 112 sending all 10,000 criminal prints ~he FBI receives each day by facsimile would require about 70 terminals operating full time, Since only a por-
1tlll0t~hc military services are changing to the usc or social security numbers ns ." ~rl J numbers. System:YAVb"' DCNcloprncnt Plan," Nnw York State Identification nntl Intelligence .,.11:1 Shorto/ny• .~.;.196G.; p. 104. the copy. transmission lime can be obtained at the c~pensc of resolution on
~a~i: As ~n initial step toward the definition,. anah'sis. and specification of in for· . n 8,sto015 to serVe these (unctions, detailed information flow charts were
77
tion of the submitted prints require rapid respopse, a smaller number would probably be satisfactory, There should .. therefore, be some such link between the national fingerprint file and at least one tenninal in each State and major metropolitan area, Similarly, State files should be connected to each major police jurisdiction within the State. New York State is installing such a statewide network, Even a large city could connect its precincts to the central identification file, as has been done in Chicago,
After identification has been made with the fingerprint, the directory record can be sent to the requesting jurisdiction, via the inquiry system communication network.
MANAGEMENT INFORMATION
The basic criminal justice operations occur at the local level, and computers can help managers in their day-today decisions, Sinl.!e these functions vary so widely, it is difficult to describe in complete detail specific systems that would be applicable to more than a few localities. However, it is in just this area that major direction, advice, and support should be provided to agencies desiring to implement information systems,l13
A survey was made of about 40 agencies which now have operating information systems in order to identify the uses, costs, and other sy:;tem characteristics,lH Based on this survey, the range of costs of offline (noninterrogatable) police information systems was found to be $1,400 to $4,300 per month for punched card systems and $1,880 to $13,000 per month for computer systems, For online (interrogatable) computer systems, the costs were found to range from $10,000 to $30,000 per month,
A separate study was undertaken on the potential for modernizing court information systems,115 For scheduling, case mOt:}itoring, and management statistics, the estimated total monthly costs, including personnel, for each of the 100 counties with populations of 300,000 to 1,500,000 would vary from $6,250 to $16,700, For each of the 10 counties with populations in excess of 1,500,000, the minimum cost is $18,750 per month. For smaller counties (100,000 to 300,000 population), punched card systems are appropriate with costs between $1,670 and $4,170 per month, For counties with less than 100,000 population, improved manual procedures should suffice,
Some of the uses which police departments and courts make of computer-based files are indicated below:
Pol ice Management \ nformation Systems Management statistics
Personnel Patrol beat workload Patrol performance Crime occurrence by beat, precincl, etc. Demands for service and responses Crimes cleared and arrests Inventory and maintenance Personnel files Budget
Crime pattern analysis Correlation of crimes by type, time, location Prediction, short and long range
Resource allocation Patrol patterns Beat allocation
tle\'clopcd in a computer.readable form. Thesc arc in "Criminal Justice Informa. tlon System Flow Charts," now in preparation. The rcport wlll be aVdllable from the Clearinghouse for Federal Scientific and Tcchnicnl Information of National Bureau of Standards.
114 The resuhs of this surv<,y nrc reported in appendix F. 113 This stcudy Is contaIned as an appendix to the Administration or Justice Task
Force 'kcport.
.,
"
heWW ",". t P'
78
police Management I nformation Systems-Con. . S stem This organization, which was estab-
trs~~~tyn~pe ecral St~te legislation, has over th~dla~t 4f
years
lail population and scheduling population Time In custodY Disposition or release
. d d feasibility of a statewl e m orma-s!udlCd the need sdeavneloped plans leading to the eventual hon system an . A o' mately
nt of the operatmg system. ppr Xl procureme . ' h' t through $6 '\lion will have been mvested 111 t lS sys emf .
Arrestee scheduling and control Booking ,
. ml . f the first maj'or computer \lnchollS, lmplementatlOn 0 . ., • • indicating the magnitude of the cost of lmtlatmg a major Release or jail
Length of time In custody Bond •
Emergency action support files infonnation system.110
Gas, electric, water distribution Hospitals and ambulances police emergenty squads
ORDER OF IMPLEMENTATION
Emergency situation command and control Contl~gen,cy pI~tnhsother emergency services and police jurisdictions coordmatlon WI . Emergency action support file
Court Management I nformation Systems
. . su gested order of implementing a sp;cifi~r~~~:~::i:n ha~dling function, three criteria are
appropnate:
Scheduling ~~~~gtu~~~\~f J~e~f~~n~~ ~~~:lri~~~~etrial conl:renm, and trials Monitoring ~I .ttomey(, wO
I r~,'oadsband aStC~~~~leserving another sentence)
Status 01 defendants m ai, on a , ' Ca •• monitoring and history (maintenance 01 docket)
Status and changes in charges Pleadings
D Its expected usefulness. . D The extent to which other functions depend on It.
D The relative ease of implementing it.
1m lementation of police inquiry systems s~ould ordi· Oates ot hearings or trials Case dispositions Status of detendants Defense attorneys t ~~~~~~~~~II~r~~~ri:~m~~rW~~r~t:d, c,ounse') Notilication 01 counsel 01 heanngs Of tr a Notification ollur.ors
. p . 'tl files that are relatively easlly entered n~nly .begtn :cil It'fiers such as wanted persons, autos, wlth SlIDP e 1 en 1 ith serial or registration numbers.
~;~t ~~~lf~r~~%eWregistries such as. those Lof fire~rrns, Warrant preparation and control General document preparation
Management statistics unschedUled idle courtroom time), Court workload (num\er an~ \e~~\~ ~f ~ass~~ unscheduled idle time)
1 f criminals and assoclates. ater s ag~ ~:at~~d ~~~l~d::o~e complex ~les such as modus operandi,
fraudulent documents, and crll~ef repo;i~~ file three im. ludge w(ot!kloatd (mnuwmheenrca:uns~' ready for h~aring or trial) Delays Ime ro Case dispositions Pfobation officer workload
ORDER OF IMPLEMENTING INFORMATION HANDLING FUNCTIONS
COMMUNICATIONS BASE
One major infonnation pr~blem in ~he cri.m~nal justi~~ system is the disl~~~~i~n ~~e~ni~~r:~~~:Ce\~~t ag~~ci~~are_ means of co:nm
f um t' g Thus the first step in establish-
q tiring the 111 orma lOn., .' . 1 • l • fonnation ~ystem to serVICe cnm1l1~ 1I1g a remote-access 111' f th basic commum-
t~~\~~ ~~~:~~~si~~~ic~e~~l~~;~:r °the ~ari~US t,;!sers man aCyl , . . f t' The commumca 10ns
repositones of 111 0r:na lOnd·· d" t 1 data links written take the fonn of VOlce ra 10, 19l a , reports, and the .mail. " . f ndation is the need
Central to thls commumca(lon ou d d fi . . d oding and fonnat stan ar s.
for common de mtlOns an c , d 1 d' to This requirement is frequently overlooke ~ e~ 1I1
g ' th fragmented systems incapable of commul1lcatmg Wl
ea~n~~~~is foundation has been laid, it is then p~sib~~? incorporate specific furl~tions as they are need~bi 11S almost always requires a single agency reSpO?Sl e J7 y for the gathering and distribution o.f in~ormatlon a~ o~ the establishment of the commul1lCatlOns networ ~n the infonnation standards. Such an approa~h w~s ta en by New York State in establishing its Identlficatlon and
_. ." N CDnc. t In Crimina' Juat: •• In[orm.,!on· "0 For a delcrlpllon, a •• , AIS 'Irw nil 1~'.l\Ig.nee Sya'em," Allred E. Smith
SharinG: New YOtk. Stote It ent, CCi. on a S'Blo Offieo Building. Alb.ny, N.Y. 12225.
With respect to a persona m orma , . . . d' t fng when to automate are. portant conslderatlOns lC a 1
o The choice of an efficient and ec~nomical means or storing the large amount. of mformation (about 10 billion alphanumenc characters in the national directory) .
The cost of data conversion (a mit;imum ;stiD mate of $10-20 million for the natlOnal dlrec-
tory) . o The protection of the file from unauthorized
access .
d'ffi l' . ce the proble:!:" Technically, there are fe\~ 1 ICU tles, s~n . cl' 'lS simply one of conventlOnal file retnevda! wl,th acc
lI1:
., . 'fi . ( h as a lrectory nu , based on posltlve ldentl ca~!On suc S· directo~ bel' derived from a fingerpnnt search): l~ce a. ~ contains the least sensitive in~onnatlOn, l~ ~eq~lreFora least protection and could be lmplem;nte r~. houle registry, however, the decision of w~at mf?rmatlO; ~he flIt be stored requires much more conslderatlOn, an t
must be better protected.. . t ent~ The first stage in implementmg ~he fin~erpnn . n d
to the personal information system IS the mst~ll~~~ati( a facsimile transmission network.. O;ce i sedla~robab~ fingerprint recognition system IS eve. ope , riul within a:bout 5 years, then these transmltted fingerp would provide the inputs to that syste~. f . leme~
The selection of management functlons ~~
tation depends ?n .I0ca~ ne~ds. Ho\.vever! the survey (appendix F) of cnmmal jushce agenCIes u.smg data proc~ssing equipment revealed that most have Implemented Slmilar functions. For police, these include personnel management and evaluation, crime and arrest statistics, patrol beat workload data, crime pattern analysis, and resource allocation. For courts, case scheduling, case monitorinfT and general workload statistics predominate. In co~~ections, the emphasis is on personnel records and keeping track of offenders.
In the future, the infonnation system will be used for more sophisticated processing. For example, as analysis and experimentation develop improved techniques for allocating patrol officers to precincts, developing court schedules, and predicting the consequences of correctional treatments, these can' be incorporated as programs in the infonnation system. Ultimately, it might be possible for the computer to analyze the characteristics of a particular crime to suggest possible suspects.
THE VALUE OF INFORMATION
Justification for including functions in an information system are usually based either on the costs saved by replacing clerical labor, by the time saved in receiving the desired information, or by the increased quantity or quality of information provided, In the latter cases, it is very difficult to estimate the dollar "value" of more complete or faster information. For example, it is rarely possible to detennine how much better a decision based on the improved information is than one made without it.
The problem is no easier when trying to estimate the value in terms such as reduced crime rate, increased clearance rate, or increased stolen property recovery rate.
79
For example, many actions may influence the rate of auto theft and recovery: "lock your car" publicity programs,_ theft-proof features of new automobiles, and the ratio of joyriding to organized car theft. Over a 2-4 year period, one jurisdiction may experience variations of 40-50 percent in the unrecovered fraction of stolen autos. Over the 15 jurisdictions presently tied into NCIC, there is probably an overall variation in the order of at least 10 percent. This statistical fluctuation may well swamp any reduction in the unrecovered fraction which would be brought about by use of an infonnation system. The problem is still more complicated when trying to assess the effects of correctional programs on offenders.
Despite these difficulties, it is important to assess as well as possible the contributions of new information functions. This will aid in their evaluation and will provide guidance to other agJncies considering similar programs. Such an assessment requires baseline data on perfomlance before the implementation of the new function, models accounting for other factors affecting perfonnance, and estimates of the performance after implementation.
For example, although many officials feel that a stolenauto inquiry file is justified, the limited operational cxperience with present systems is insufficient to confirm this view. Nevertheless, despite the sizeable effort being devotcd to implementing such files at the city, county, State, and national levels, there appear to be no current efforts directed at a careful estimation of their value. In one or more such installations, the numbers, times, and locations of theft and recoveries should be studied both before and after an inquiry system is installed. The means of recovery must be differentiated to identify the contribution of the inquiry system.
, ,,~~
Chapter 7
Scientific Research and Development Program
The material in the preceding chapters is only a sampling of what may be the potential contributions of science and technology to control of crime and to the operation of the criminal justice system. While many subjects have been mentioned, only a few could be treated in depth, and even those are still only preliminary. Certain studies with raw data, such as those of court delay in Washington and criminal apprehensions in Los Angeles, must be repeated elsewhere to assess the degree to which their conclusions are generally applicable. Other studies, such as the costeffectiveness optimization of response time reduction and the total system evaluation of alternative treatment programs, had to be conducted with hypothetical data, and real data must obviously be used. Many technological possibilities have been mentioned, but their potential contributions need further consideration, and their selection for specific applications requires prototype development, testing, and evaluation.
Many areas other than those discussed in this report arc proper subjects for scientific research and technological development, and some may well have potential for equal or greater contributions to better understanding of the nature of crime and its control and to improving the effectiveness of the criminal justice system. In particular, the social and behavioral sciences, which were outside the scope of this Task Force, have major contributions to make in clarifying the relationships between crime and education, employment, residence, and other environmental variables, and 'in developing programs for diverting individuals from criminal activity and for rehabilitating them if prevention fails. The biological sciences may also offer important treatment opportunities. All the natural sciences might contribute to improving criminalistics techniques in various ways, and these possibilities have only been touched on here. All of these subjects should be considered as part of a major research and development program into the problems of crime and its control.
Federal initiative and support will be needed in establishing and pursuing such a research and development program. Whether it be basic research, equipment development, field experimentation, data collection, or analytical studies, the limited budgets of individual State and local criminal justice agencies canx'!ot alone provide the necessaryinvestment. The personnei and agencies capable of undertaking the necessary work are in short supply,
80
..
.f
a.nd so unnecessary duplication should be avoided. Furthermore, any useful results will be of nationwide benefit. These conditions all make Federal involvement both appropriate and necessary.
A program to introduce science and technology to criminal justice must adopt a number of complementary approaches. The Federal Government should sponsor research, development, test, and evaluation (R.D.T. & E.) projects at the local and State levels, especially supporting those widely useful projects that no single agency could support alone. The Government should help criminal justice agencies get the technical support they need to incorporate the results of these projects into their operations. To infuse science and technology directly into day-to-day activities) operations research groups should be established in the larger criminal justice agencies. The program should include gw.clllate fellow- I
ships to attract and train competent new professionals, It should provide means for more effective dissemination of results to operating agencies. Finally, to provide a base for broad research advances, a major science and technology program should be established in a research institute of the highest quality. The President's Science Advisory Committee has reviewed and supports these recommendations.
Within a period of 3-5 years, the lott\)~del'ai research and development program in criminal justice might I
profitably reach a level of about $60 million. Such a level is in fact perhaps an underestimate of the need and· potential, and would be limited primarily by the availability of competent personnel. In funding this program, the Government should support development by industry, research by scientists, tests and evaluation by cri'minal justice agencies in conjunction with scientific consultants, and innovation in the operation of criminal justice agencies through demonstration projects. The operational. portion of the costs of demonstration projects should be· borne by the agency directly. The Federal funding. should include the incremental cost associated with the: innovative features-costs for development, high risk,· and extra planning. In addition, all demonstratiGn projects should be accompanied by careful and independ-. ent evaluation which asses~s the utility of the project to provide guidance for further development of that projectJ. and for other 3\gencies considering similar ones. ,]
1
R! E:
t~
cc ec
rr SJ 0
{ 0
if
I:
I
~-----"""'--~-'-

\ \:
~, ~,
~" "\"., !", ~
r· ." '.
II,:
II';. .
o
.-/..\
~,.
»
,>
t'·
RESEARCH, DEVELOPMENT, TEST, AND EVALUATION PROGRAM
The Federal Government should sponsor a science and technology R.D.T. & E. program with three primary compone~ts: systems analysis, field experimentation, and equipment-system development.
The systems analysis studies should include development of mathematical models of the criminal justice system and appropriate component parts, and collection of the data needed to apply these models to improving operations. The projects to be undertaken should include:
o Model of a State crimina! justice system.
o Apprehension studies in a police department.
o Computer simulation of court processing of cases.
These studies would be extensions of the initial efforts undertaken by the Science and Technology Task Force. As the program develops, new problem areas in which systems analysis can be usefully applied will appear, and some of them may well turn out to be more productive than the ones already identified.
Field experimentation should be conducted by operating criminal justice agencies in conjunction with individuals or groups competent in experimental research. Many operating innovations are possible, and these should be evaluated in actual use both to test their value and to assess their possible side effects. The experimental projects to be undertaken should include:
o Controlled experiments examining various police patrol concepts, such as statistical techniques for allocation of patrol forces, various random patrol patterns, saturation patrolling, etc.
o Laboratory simulation of vario.us police command and control systems "l::d iJr"cedures.
o Statistical analysis relating recidivism to offender characteristics and to correctional treatment possibilities.
These areas, again, are only suggestive. Many more may ?e discovered by the criminal justice agencies themselves III their process of self-examinatio.n and innovation.
A number of basic kinds of equipment should be developed for general use by criminai justice agencies. Some of the promising possibilities include:
o Computer-assisted police command and control system.
o Fingerprint recognition system.
o Inexpensive portable radio. for foot patrolmen and for. patrolmen operating away from their car radIOS.
o Automatic patrol car locator.
81
The R.D.T. & E. program would have to be developed in detail by the office administering it. The program would have to be housed in an agency that was sympathetic to research and development, and could attract the high-caliber scientific staff needed to manage the program.
The program would inevitably requirp. technical guidance of a breadth and quality exceeding that which could be expected of any internal technical staff. Advisory committees comprising scientists and criminal justice officials would be needed to review proposals in specific subject areas. In many cases, another government office will be t.~e best choice to manage a specific project; the Army Materiel Command might direct the development of a portable radio, for example. Nonprofit or profitmaking contractors, as used by the Department of Defense, might furnish broad technical guidance.
The research grant part of the program should rely heavily on proposals submitted by scientific investigators, primarily at universities, but also at nonprofit corporations, in industry, government, and criminal justice agencies. The in-house staff should stimulate important proposals by competent researchers. Proposals should be selected for support by a series process of screening by the in-house sta,ff, review by advisory groups combining criminal justice officials with competent researchers, and final determination by the in-house staff.
The development part of the program will have to focus its efforts more carefully. Equipment development can be very expensive, and for the next few years only a few major projects will be possible. The projects selected should not depend on the chance that appropriate proposals will be submitted. Rather, requirement studies and cost-effectiveness analyses should be undertaken, and those developments that appear to contribute most to controlling crime and to improving the operations of criminal justice agencies should be funded.
The results of the R.D.T. & E. program should be disseminated both throughout the interested research community and to all persons in the various crir.linal justice agencies who might benefit from the work. Journals directed at each of these audiences should be supported or new ones established if existing ones are found inadequate.
TECHNICAL SUPPORT AND ESTABLISHMENT OF EQUIPMENT STANDARDS
As the Federal Government plays a more important role in aiding criminal justice agencies to share in the products of modern technology, it will become necessary to help them use it effectively. To this end, there will be a need for centralized establishment of technical stan.dards (for radios, computer codes, etc.) and for provision of technical assistance and guidance.
A Federal agency should be assigned to coordinate the establishment of standards for equipment to be used by criminal justice agencies, and to provide those agencies with technical assistance. This organization should be an adjunct to an existing Federal agency already technically
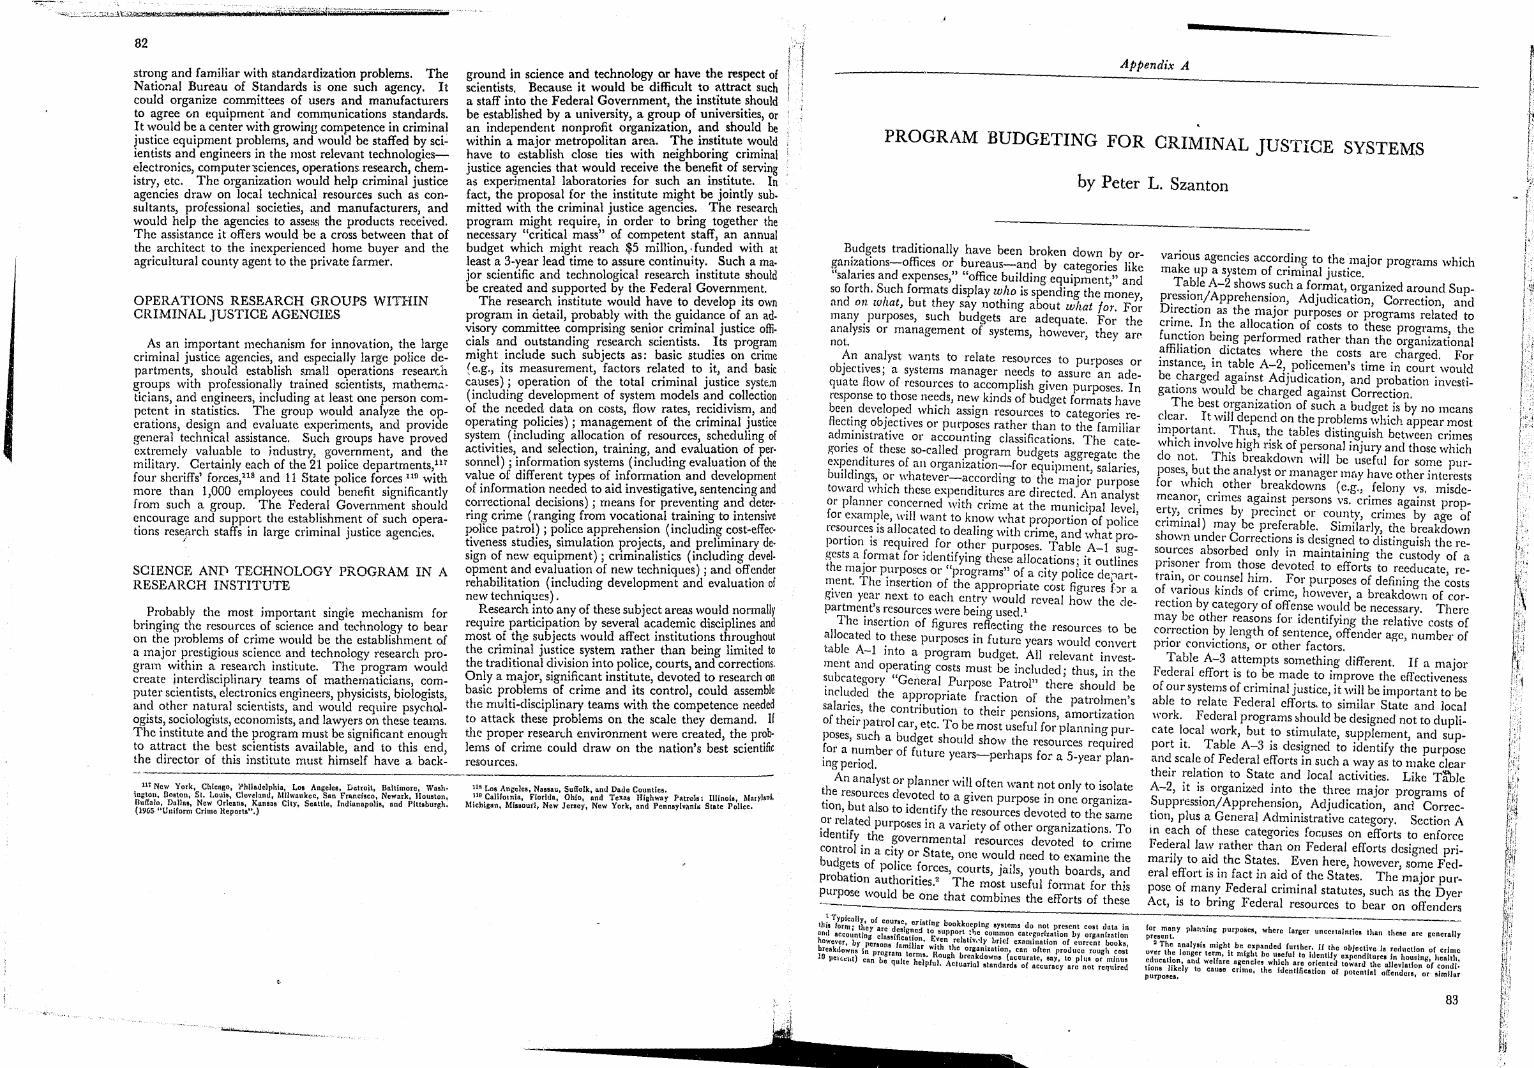
82
strong and familiar with standar?ization problems. The National Bureau of Standards IS one such agency. It could organize ~ommittees of users ~nd .manufacturers to agree on eqUIpment 'and commumcations .stan.dards. It would be a center with growing competence 11l cnmm~l justice equipment problems, and woule! be staffed br SCIientists and engineers in the most relevant technologleselectronics, computenciences, operations re~ea.rch, ~he~is try, etc. The organization ~ould help cnmmal JustIce agencies draw on local techmca.l resources such as consultants, professional societies, all1d manufacturers,. and would help the agencies to asseliS the products recelVed. The assistance it offers would be a cross between that of the architect to the inexperienced home buyer and the agricultural county agent to the private farmer.
OPERATIONS RESEARCH GROUPS WITHIN CRIMINAL JUSTICE AGENCIES
As an important mechanism for i.nnovation, th~ large criminal justice agencies, and espeCIally large polIce d~partments, should establish s~Jall oJ,Jera.tions research groups with pr?fessio~aIly t:amed SCientIsts, mathem~· ticians, and engmeers, mcludmg at least one person competent in statistics. The group wo~ld analyze the ~perations, design and evaluate expcnments, and provide general technical assista~ce. Such groups have proved extremely valuable to mdustry, government, and the military. Certainly each of the 21 police departments,1l7 four sheriffs' forces 118 and 11 State police forces 119 with more than 1,000 ~mployees could benefit significantly from such a group. The Federal Government should encourage and supp~rt the est~bl~shm:nt ?f such operations research staffs III large crImmal JustIce agencIes.
I
SCIENCE ANI' TECHNOLOGY PROGRAM IN A RESEARCH INSTITUTE
Probably the most important singl.e mechanism for bringing the resources of science and technol~gy to bear on the problems of crime would be the establIshment of a major prestigious science and technology research program within a research institute. The pro~~am would create interdisciplinary. teams. of mathe~l~tlClax:s, c<;mputer scientists, electromcs engmeers, phySICISt~, bIOlogists, and other natural scientists, and would reqUlre psycho,logists, sociologbts, economists, and lawye.rs ~n these teams. The institute and the program must be slgmficant ~nough to attract the best scientists available, and to thIS end, the director of this institute must himself have a back-
11i New York, ChiclIgo, 'thUo.dc1phin, Lo! Angeles, Dct~oit, Baltimore, Wash. ington. Doaton, SI. I.ouis, Cleveland, Milwaukee, San Fr~rH!ISCOI Newark, ,Hollston, RulbJo, DaUas, New Orlenns, KansBs City, Seattle, Indianapolis, and Pittsburgh. (1965 "Unilorm Crime Report .... )
ground in science and technology or have the respect of scientists. Because it would be difficult .to ~.ttract such a staff into the Federal Government, the mst!tute.s.hould be established by a university, a group of UnIVerSities, or an independent nonpro~t organization, ~md. should be within a major metropo,htan a,:ea. ~he Ills.titute ~quld have to establish close ties wI~h nelghbonng cnml~al justice agencies that woul~ receIVe the ben~fit ?f servmg as experimental laboratones for SUC? an In:tl.tute. In fact, the proposal ~o~ the .ins!itute mI&ht be Jomtly sub. mitted with the cnmmal Justice agenCIes. The research program might require, in order to bring together the necessary "critical mass" of competent staff, an annual budget which might reach $5 milli~n, .,funded with at least a 3-year lead time to a:sure contmUl~y .. Such a rna. jor scientific and technological research mstltute should be created and supported by the Federal Govem~ent.
The research institute would have to develop ItS own program in detail, prob<l:b.ly With. the &lli?anc~ of. an ad· visory committee c~mpnsmg semo~ cz:mmal JustIce offi· cials and outstandmg research sCIe~bsts. ;lts prog~am might include such subjects as: baSIC stud.res on cn~e (e.g., its measurement, factors rel~te.d to. It, .and baSIC causes) i operation of the total cnmmal JustIce syst~.1l (induding development of system models a~d. c.ollectlOn of the needed data on costs, flow rates, reCidIVIsm, and operating policies) i management of the criminal ~ustice system (including allocatio~ ?f resources, sc~eduhng of activities and selection, trammg, and evaluatIon of per· sonnel) i'information systeIl?s (inclu~ing evaluation of the value of different types of mformatlOn and devel?pment of infonnation needed to aid investigative, sentencmg and correctional decisions) . means for preventing and deter· ring crime (l'angin~ fr~m vocati?nal ~raini~g to intensive police patrol) i pollce a~prehen~lOn (mcludm~ c?st-effec. tiveness studies, simulation projects, and prelumnary de· sign of new equipm~nt) i criminalist~cs (including devel· opment and evaluation of new techmques) i and o~ender rehabilitation (including development and evaluatIOn 01 new techniques) .
Research into a~y of these subject area:> w~ul.d t;ormallY require participatIon by severa:l ac.ade.ml~ dlsclplmes and most of th.e subjects would affect mStltutlO~s th.r01;ghout the criminal justice system rather than bemg hmlte~ to the traditional division into police, courts, and correctIOns. Only a major, significant institute, devoted to research on basic problems of crime and its control, could assemble the multi-disciplinary teams with the competence needed to attack these problems on the scale they demand. If the proper research environment were. cr;ated, th: pr?b. lems of crime could draw on the natIon s best SCIentIfic resources.
118 Los An~elc8, Nassau, Suffolk, and Dade Counties. d 119 CalHotnia, Florida, Ohio, and Texas Highway Patro~8: Illinois,. Mo.rylan I
Michigan, Missour'lt New Jersey, New York, and Pennsy(v(\Dlri State Pollee.
Appendix A
PROGRAM BUDGETING FOR CRIMINAL JUSTIOE SYSTEMS
by Peter L. Szanton
Budgets traditionally have been broken down by organizations-offices or bureaus-and by categories like "salaries and expenses," "office building equipment," and so forth. Such formats display who is spending the money, and on what, but they say nothing about what for. For many purposes, such budgets are adequate. For the analysis or management of systems, however, they an~ not.
An analyst wants to relate resources to purposes or objectives i a systems manager needs to assure an adequate flow of resources to accomplish given purposes. In response to those needs, new kinds of budget formats have been developed which assign resources to categories reflecting objectives or purposes rather than to the familiar administrative or accounting classifications. The categories of these so-called program budgets aggregate the expenditures of an organization-for equipment, salaries, buildings, Ol" whatever-according to the major purpose toward which these expenditures are directed. An analyst or planner concerned with crime at the municipal level, for example, will want to know what proportion of police resources is allocated to dealing with crime, and what proportion is required for other purposes. Table A-I sugg-ests a ~ormat for identifying these allocations; it outlines the major purposes or "programs" of a dty police de:.art~ent. The insertion of the appropriate cost figures }.)r a gtven year next to each entry would reveal how the department's resources were being used.1
The insertion of figures reflecting the resources to be allocated to these purposes in future years would convert table A-I into a program budget. All relevant investment and operating costs must be included; thus, in the subcategory "General Purpose Patrol" there should be included the appropriate fraction of the patrolmen's salaries, the contribution to their pensions, amortization of their patrol car, etc. To be most useful for planning purposes, such a budget should show the resources required for a n~mber of future years-perhaps for a 5-year planmgpenod.
An analyst or planner will often want not only to isolate t~e resources devoted to a given purpose in one organization, but also to identify the resources devoted to the same ?r re~ated purposes in a variety of other organizations. To IdentIfy the governmental resources devoted to crime control in a city or State, one would need to examine the budgets of police forces, courts, jails, youth boards, and probation authorities.2 The most useful fonnat for this purpose would be one that combines the efforts of these
tl ~ "~ypicnIlY, of course, eristing bookkeeping systems do not prescnt cost dalo in iii arm; t~le)' arc designed to SUpport :lle common cntl'gorizalion by organization hOt or-counting classification. Even relativ,~ly Lrlef eXAmination of current books, b owkdr, by persons familiar with the organization, cnn oCten prouuce rough cost l~ca OWns in program terms. Rough brenkdowns (accurate, 8a)" to plu! or minus .. Ilel(,l:ht) cun be quite helpful. Actuarial slandards of accuracy are not required
various agencies according to the major programs which make up a system of criminal justice.
Table A-2 shows such a format, organized around Suppression/Apprehension, Adjudication, Correction, and Direction as the major purposes or programs related to crime. In the allocation of costs to these programs, the function being performed rather than the organizational affiliation dictates where the costs are charged. For instance, in table A-2, policemen's time in court would be charged against Adjudication, and probation investigations would be charged against Correction.
The best organization of such a budget is by no means clear. It will depend on the problems which appear most important. Thus, the tables distinguish between crimes which involve high risk of personal injury and those which do not. This breakdown will be useful for some purposes, but the analyst or manager m[,y have other interests for which other breakdowns (e.g., felony vs. misdemeanor, crimes against persons vs. crimes against property, crimes by precinct or county, crimes by age of criminal) may be preferable. Similarly, the breakdown shown uncleI' Corrections is designed to distinguish the resources absorbed only in maintaining the custody of a prisoner from those devoted to efforts to reeducate, retrain, or counsel him. For purposes of defining the costs of various kinds of crime, however, a breakdown of correction by category of offense would be necessary. There may be other reasons for identifying the relative costs of correction by length of sentence, offender age, number of prior convictions, or other factors.
Table A-3 attempts something different. If a major Federal effort is to be made to improve the effectiveness of our systems of criminal justice, it will be important to be able to relate Federal efforts, to similar State and local work. Federal programs 1;hould be designed not to duplicate local work, but to stimulate, supplement, and support it. Table A-3 is designed to identify the purpose and scale of Federal efforts in such a way as to make clear their relation to State and local activities. Like T~le A-2, it is organiz.ed into the three major programs of Suppression/Apprehension, Adjudication, and Correction, plus a General Administrative category. Section A in each of these categories focuses on efforts to enforce Federal law rather than 011 Federal efforts designed primarily to aid thc States. Even here, however, some .Federal effort is in fact in aid of the States. The major purpose of many Federal criminal statutes, such as the Dyer Act, is to bring Federal resources to bear on offenders
for many plan~inc purpose!!, where larger uncertainties thun these ar«: generally present.
:J The analysis might be e:tpanded further. Il the objective ls reduction of crime oYer the longer term, it might be useful to identify expenditures In haunlng, health, education. anu welfare agencJe!! which nrc odonted toward the nJlevlatiun 01 coneli. tions Jikr.Jy to cause crime, the identification of potential offenders, or similar purposes.
83

84
whose crime is essentially local, but who put themselves beyond the reach of local officials.
Section B in each of the categories outlines the various services the Federal Government might perform more directly in support of State or local police, court, and corrections systems. Not all such services need be performed expressly for the States; a Federal research program on police communications equipment, or a parole experiment conducted in the District of Columbia, for example, might be of principal benefit to States or localities even though th"':j' were also intended to serve Federal purposes.
Section C in each program category outlines the uses to which direct Federal grants to States and localities might be pULObviously, grants may not become available for all of these purposes: indeed, they may not all be desirable. The categories used-as is true for all the
tables--are designed only to be suggestive. They should be developed on the basis of local and Federal management needs.
It should be clear, furthermore, that categorizations such as these are of only limited value taken by themselves; they can simply identify in different ways the resources currently being applied to the various major objectives of criminal justice. Their greater usefulness arises when the responsible officials subject these efforts to review and analysis. The breakdown of costs into these categories then provides both a conceptual framework and a factual base for the analysis of how resources ought to be allocated-for considering the relative importance of the various objectives being served, the appropriateness of the current pattern of expenditures, and the benefits that might be expected from shifts in emphasis.
TABLE A-l,-A Program Budget for a City Police Force
L CONTROL AND REDUCTION OF CRIME PROGRAM A. Prevention/Suppression
I. General Purpose Patrol 2. Special Purpose Patrol (by type of offense) 3. Intelligence 4. Community Relations
B. Investigation/Apprehension I. Crimes Involving Major Risk of Personal Injury
a. Murder b. Assault c. Rape d. Armed Robbery e. Burglary-Homes f. Arson g. Etc.
2. Crimes Not Involving Major Risk of Personal Injury a. Theft b. Unarmed Robbery c. Auto Theft d. Burglary-Commercial e. Fraud f. Forgery g. Etc.
3. Vice a. Narcoties b. Prostitution c. Gambling d. Etc.
C. Prosecution I. Interrogation 2. Preparation for Trial 3. Trial
D. Recovery of Property t. Autos 2. Other Personal Property 3. Commercial Property
E. General Support J. Communications 2. Records and Datu Processing 3. Technical Services
a. FingerPrint b. Ballistics c. Polygraph J.. :r .aboratory Analysis
II. MOVEMENT AND CONTROL OF TRAFFIC PRO· GRAM A. Traffic Movement
I. Direction of Traffic 2. Enforcement of Traffic-oriented Parking Rules 3. Emergency Road Services 4. Weather Emergency Procedures 5. Identification and Reporting of Congestion Points
B. Traffic Safety I. Enforcement of Regulations
a. Patrol/Apprehension of Moving Violations b. Enforcement of Safety-oriented Parking Rules
2. Driver Training 3. Educational Programs 4. Vehicle Inspections
C. Accident Investigation
III. MAINTENANCE OF PUBLIC ORDER PROGRAM A. Public Events
1. Sporting Events 2. Public Ceremonies
a. Pru-ades and Receptions b. Public Meetings c. Cornerstones, ~tc
B. Minor Disturbances I. Private Quarrels 2. Parties 3. Drunkenness 4. Derelicts 5. Miscellaneous Nuisances
C. Civil Disorder I. Prevention 2. Suppression
IV. PROVISION OF PUBLIC SERVICES PROGRAM A. Emergency Services
I. Fire 2. Medical 3. Power Failure 4. Flood 5. Civil Defense 6. Miscellaneous
B. Missing Persons C. Lost Property D. Miscellaneous
TABLE A-1.-A Program Budget for a City Police Force-Continued
85
V. ADMINISTRATION AND SUPPORT PROGRAM A. Direction and Control
I. Direction 2. Planning and Development 3. Internal Inspection and Review
B. Training and Personnel 1. Recruitment 2. Training
a. Basic b. Advanced
v. ADMI~rSTRATION AND SUPPORT PROGRAMContmucd
B: Training and Personnel-Continued 3. Testing, Evaluation, Promotion
C. Public Relations D. Supporting Services
21. RCccords (no~crime) and Data Processing . ommuUlcatlOns
3. Budget 4. Propl~rty
TABLE A-2.--Programs in the Reduction and Control 1. SUPPRESSION/APPREHENSION PROGRAM
of Crime A. Suppression
1. General Purpose Patrol 2. Sp~cial. Purpose Patrol (by type of crime)
B. InvestigatIOn! Apprehension
I. Crime Involving Major Risk of P::rsonal Injury a. Murder b. Assault c. Rape d. Armed Robbery e. BurglarY-Homes f. Arson g. Etc.
2. Crimes Not Involving Major Risk of Personal InJ'ury a. Theft b. Unarmed Robbery c. Auto Theft d. Burglary-Commercial e. Fraud f. Forgery g. Etc.
3. Vice a. Narcotics b. Prostitution c. Gambling d. Etc.
C. General Support I. Communications 2. Rccords and Data Processing 3. Technical Services
a. Fingerprin t b. Ballistics c. Polygraph d. Laboratory Analysis
D. Administrative Services 1. Personnel
a. Recruitment b. Training
(I) Basic (2) Advanced
c. Testing and Evaluation 2. Budget 3. Property
E. Planning and Direction I. Planning and Review
a. Data Collection b. Analvsis
2. Dil'ectio~
II. ADJUDICATION PROGRAM A. Prea:raignment (by type of crime as in LB.) B. Arrrugnment/lndictment (by type of crime) C. Pr~paration .fQr Trial (by type of crime) D. Tnal-Court Proceedings
1. ~i::;~)ement of Verdict or Disposition (by type of
2. Determination of Sentence (by type of crime) E. Appel!ate Proceedings
I. Int<;rmediate Appeal (by type of crime) 2. Ultimate Appeal (by type of crime)
III. CORRECTION PROGRAM A. Institutional Correction
1. Custody 2. Correction
a. Education ( J) Academic (2) Vocational
b. Counselling and Psychiatric c. Medical and Dental
B. Noninstitutional I. Probation 2. Parole 3. Work-Release 4. Etc.
C. Direction and General I. Planning and Kevicw
a. Data Systems b. Analysis
2. Administrative Services
IV. GENERAL ADMINISTRATION PROGRAM A. Executive Direction B. Statistics
I. Victim Data 2. Crime Costs 3. Criminal Justice System Costs 4. Crime Rates 5. Comparative Statistics, Other Jurisdictions
C. Analysis I. Crime Prevention 2. Allocation of Resources 3. Crimin?lJ u~t~ce ~ystem (tradeofTs among components)
D. Programs m MItigatIOn of Victim Losses E. Administrative Services
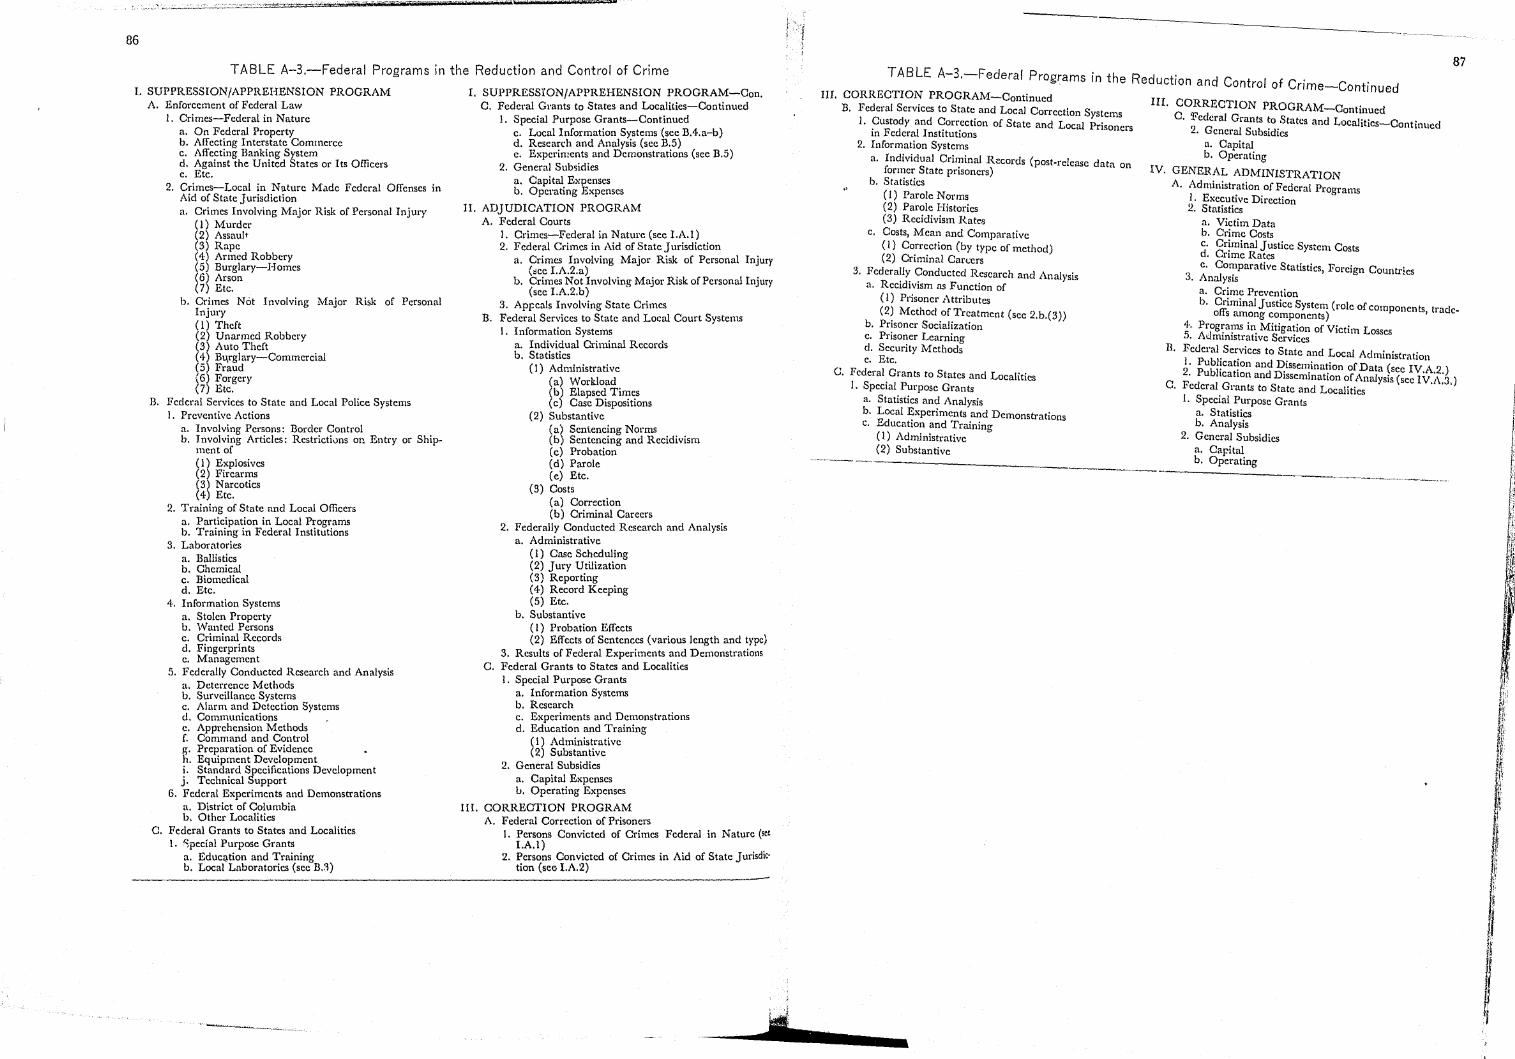
'"-.'- ~.~-"~.- .. ,~ --~ '-"""~""-'-""'->'~'¥'''''''-''''--''~'''''-
_~.,:>';""-.,.::..., .... __ "':" ____ '_'-_::':":":~:':'':::''",,",,,,'i\..,n ... ,.-=z:~~ "L:::iiiil-:!- ~~--.,...... --$"75 M ~,:( !
86
TABLE A-3,-Federal Programs in the Reduction and Control of Crime
1. SUPPRESSION/APPREHENSION PROGRAM I. SUPPRESSYON/APPREHENSION PROGRAM-Con, A. Enforcement of Federal Law
I. Crimes-Federal in Nature a. On Federal Property b. Affecting Interstate Commerce c. Affecting Banking System d. Against the United States or Its Officers e. Etc.
2. Crimes-Local in Nature Made Federal Offenses in Aid of State Jurisdiction a, Crimes Involving Major Risk of Personal Injury
(I) Murder (2) Assault (3) Rape ( 4) Armed Robbery (5) Burglary-Homes (6) Arson (7) Etc.
b. Crimes Not Involving Major Risk of Personal Injury (1) Theft (2) Unarmed Robbery (3) Auto Theft (4) Bt\rglary-Commercial (5) Fraud (6) Forgery (7) Etc.
B. Federal Services to Statc and Local Police Systems I. Preventive Actions
a. Involving Persons: Border Control . b. Involving Articles: Restrictions on Entry or ShIp
ment of (I) Explosivcs (2) Firearms (3) Narcotics (4) Etc.
2. Training of State and Local Officers a. Participation in Local Programs b. Training in Federal Institutions
3, Laboratories a. Ballistics b. Chemical c. Biomedical d. Etc.
4. Information Systems a. Stolen Property b. ''''anted Persons c. Criminal Records d. Fingerprints c. Management
5. Federally Conducted Research and Analysis a. Deterrence Methods b, Surveillance Systems c. Alarm and Detection Systems d, Communications e. Apprehension Methods f. Command and Control g. Preparation of Evidence h. Equipment Development i. Standard Specifications Development j. Technical Support
6. Federal Experiments and Demonstrations a, District of Columbia b, Other Localities
C. Federal Grants to States and Localities !, ~pecial Purpose Grants
a. Educ<),tion and Training b. Local Laboratories (see B,::!)
C. Federal GI'ants to States and Localities-Continued !. Special Purpose Grants-Continued
c. Local Information Systems (see B.4.a-b) d. Research and Analysis (see B,5) e. Experiments and Demonstrations (see D.5)
2. General Subsidies a, Capital Expenses b. Opcrating Expenses
II. ADJUDICATION PROGRAM A. Federal Courts
I. Crimes-Federal in Nature (see LA. 1 ) 2. Federal Crimes in Aid of State Jurisdiction
a. Crimes Involving Major Risk of Personal Injury (;lee I.A.2.a)
b, Crimes Not Involving Major Risk of Personal Injury (see I.A.2.b)
3. ApFeals Involving State Crimes D. Federal Services to State and Local Court Systems
I. Information Systems a. Individual Criminal Records b. Statistics
(J) Administrative (a) Workload (b) Elapsed Times (c) Case Dispositions
(2) Substantive (a) Sentencing Norms (b) Sentencing and Recidivism (c) Probation (d) Parole (e) Etc.
(3) Costs (a) Correction (b) Criminal Carecrs
2. Federally Conducted Research and Analysis a. Administrative
(J) Case Scheduling (2) Jury Utilization (3) Reporting (4) Record }(eeping (5) Etc.
b. Substantive (1) Probation Effects (2) Effects of Sentences (various length and type)
3. Results of Federal Experiments and Demonstrations C. Federal Grants to States and Localities
I. Special Purpose Grants a. Information Systems b, Research c. Experiments and Demonstrations d. Education and Training
(J) Administrative (2) Substantive
2. General Subsidies a, Capital Expenses lJ, Operating Expenses
m. CORRECTION PROGRAM A. Federal Correction of Prisoners
I. Persons Convicted of Crimes Federal in Nature (see I.A.I) ..
2. Persons Convicted of Crimes in Aid of State Jumdlc' tion (se~ I.A.2)
87 TABLE A-3,-Federal Programs in the Reduction and Control of Crime-Continued
III. CORRECTION PROGRAM-Continued D. Federal Services to State and Local Correction Systems
I. Custody and Correction of State and Local Prisoners in Fcderal Institutions
2. Information Systems
a. Individual Criminal Records (post-release data on former State prisoners)
b. Statistics (I) Parole Norms (2) Parole Histories (3) Recidivism Raks
c. Costs, Mean and Comparative (I) Correction (by type of method) (2) Criminal Cart.'ers
3. Federally Conducted Research and Analysis a. Recidivism as Function of
(I) Prisoner Attributes (2) Method of Treatment (see 2.b.(3»
b. Prisoner Socialization c. Prisoner Learning d. Security Methods e. Etc.
C. Federal Grants to States and Localities I. Special Purpose Grants
a. Statistics and Analysis b. Local Experiments and Demonstrations c. Education and Training
(I) Administrative (2) Substantive
III. CORRECTION PROGRAM-Continued C. 'Federal Grants to States and LocalitieS-Continued
2. General Subsidies a. Capital b, Operating
IV. GENERAL ADMINISTRATION A, Administration of Federal Programs
I. Executive Direction 2. Statistics
a, Victim Data b. Crime Costs c. Criminal Justice System Costs d. Crime Rates e. Comparative Statistics, Foreign Countries
3. Analysis a. Crime Prevention b. Criminal Justice System (role of componel1 ts, trade
offs among components) +. Programs in Mitigation of Victim Losses 5. Administrative Services
n. Federal Services to State and Local Administration 1. Publ!eat!on and ~issemination of Data (see IV.A.2.) 2. PublicatIOn and Dissemination of Analysis (see IV.t\,3.)
C. Federal Grants to State and Localities I. Special Purpose Grant.s
a. Statistics b. Analysis
2. General Subsidies a, Capital b. Operating
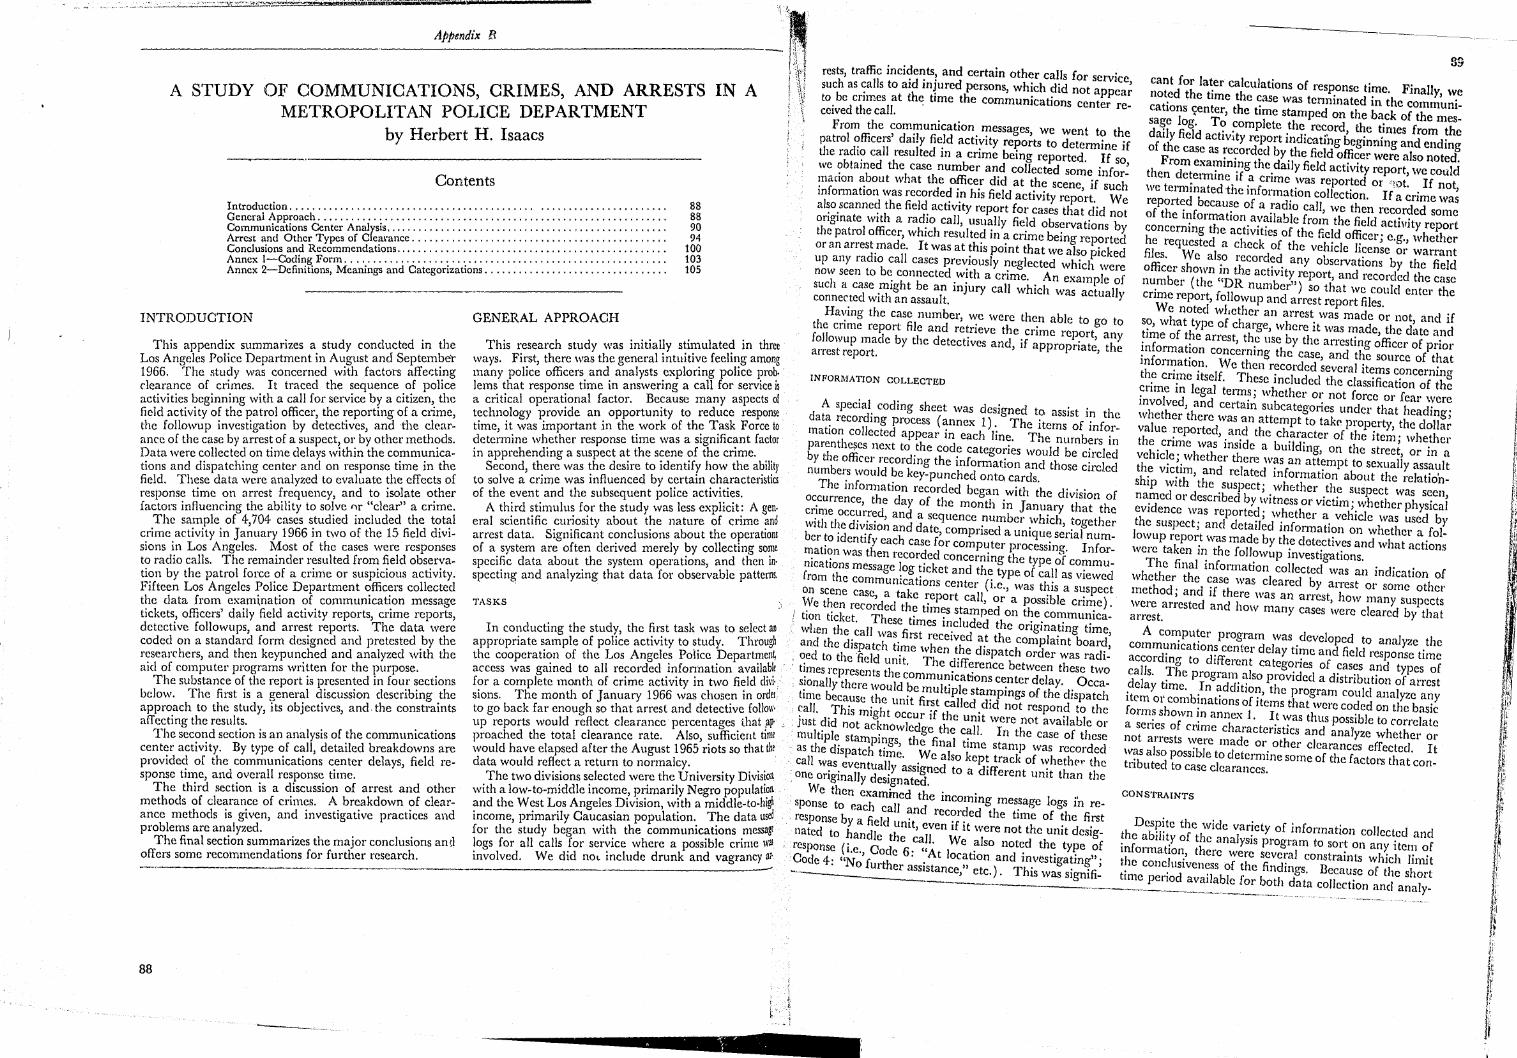
A STUDY OF COMMUNICATIONS, CRIMES, AND ARRESTS IN A , METROPOLITAN POLICE DEPARTMENT
by Herbert H. Isaacs
Contents
Introduction ..................... , . , . . . . . . . . . . . . . . . . . . .. . ... ::::::::::::::::::: Gencral Approach ........... : ........................ : : : : : : : : .. , .... , .......•...
88 88 90 94
Communications Centcr Analysis...... . . . . . . . . .. . . . . .. . . . .................... . Arrcst and Othcr Types of Cle~!"ance ................. : . : : : : . : .................... . Conclusions and Recommendations.... . . . . . • . . . . . . . . .. . . . .............. .
C 1· F ...... " .. .. .. .. .. . . .. .. .. ... . Annex 21-DOCfill~gt' .0srmM·e·a·~i~gs·· '~~d Categorizations ................................ .
100 103 105 Anncx - e m lon,
INTRODUCTION
This appendix summarizes a. study condclc~ed in ~l~ Los Angeles Police Department m A~gust an.. epte~. e 1966, The study was concerned WIth factors affe ,tl,ng clearance of crimes. It traced the ~equence .of polIce activities beginning with a call for serVIce by a CItIzen,. the field activity of the patrol officer, the ~eportU1~ o~ a clIme, the followup investigation by detechves, an t le c earance of the case by arrest of a suspect~ 01: by other meth~ds. Data were collected on time delays wlthm the cO?1m,:mc~dons and dispatching center and on response tune m t e field These data were analyzed to evaluate !he effectshof
• . . . . t f . and to lsolate ot er response time on arIes .r?quency, " " . factors influencing the abllIty to so~ve <;r clear ~ cnme
i The sample of 4,704 cases studied mcluded fit l~ ~~t~ crime activity in January 1966 in two of the 15 e IVlsions in Los Angeles. Most of the cases were responses to radio calls. The remainder resulted fron~ ~eld obs~ryation b the patrol force of a crime or SUSPIClOUS actIvIty. Fiftee~ Los Angeles Police Department ~ffic~rs collected the data from exam\nation ~f. commumcat~on n::ssage t' ckets officers' daily field actIVity reports, cllme I eports, detective follow ups, and arres.t reports. ~he databwe~e coded on a standard form deSigned and plCtested. y t e researchers, and then kcypun~hed and analyzed WIth the aiel of computer programs wntten for the purpose. .
The substance of the report is presen!ed 111 [OU!' ~ectJOns b I ' The first is a f!eneral diSCUSSIOn descnbmg .the a~I~I~~~ch to the study, its objectives, and the constramts affecting the results. . . .
The second section is an analYSIS of ~he commumcatIOns center activity. By type of call, detatled breakdowIls a.re provided of the communications c.enter delays, field lesponse lime and overall response tune.
The third section is a discussion of arrest and other methods of clearance of crimes. A br~akdown ?f clear .. ance methods is given, and investigatIve practIces and problems are analyzed. . I
The final section summarizes the major concluslOns an, offers some recommendations for further research.
-~-~-
88
GENERAL APPROACH
This research study was initially s~~ulate~ in three wa's First, there was the general intllltl\.'e feellI~g among ma~~ police officers and analysts .explormg polIce ~ro~. lems that response time in answermg a call for service I; a critical operational factor. Be~ause many aspects 0
technolo y provide an opportumty to reduce response time it !as important in the work of th~ rr:ask Force to dete;'mine whether response time was a slgmfic~nt factor in a rehending a suspect at the s~ene ?f the cnme. .,
S~!ond, there was the desire to tdentlfy how the a~II~ty I ,,' e was influenced by certam characteristics to so ve a Cllm . . ..
of the event and the subsequent pohce actlVI~t~S. A third stimulus for the study was less explICIt.: A gen
d eral scientific curiosity about the nature of cnme ~n arrest data. Significant conclusions about the operatIOns of a system are often derived merely ?y collectmg so:ne s ecific data about the system operatIOns, and then In.
s~ecting and analyzing that data for observable patterns.
TASKS
In conducting the study, the first task was to select an appropriate sample of police activity to ?~udy .. Throug~ the cooperation of the Los Angelc~ Pollce pepartle~,' access was gained to all re~orded .1I~fOl:natlOn fia~~1 J. 'i~ for a complete month of cnme activity In two ~ d: sions. The month of January 1966 was chose,n 111 or ~l to 0 back far enough so that arrest and detecbv~ follo\l' up greports would reflect clearance percentages. that ;a~ , proached the total clearance rate. Also, ?UffiClert tl~/ would have elapsed after the August 1965 nots so t lat t data would reflect a return to normalcy.. . ... n
The two divisions selected were the Ul11verslty DlV1S!O. with a low-to-middle income.' I?~imaril'y Negr<;> popula~?l and the West Los Angeles DIVISIOn, WIth a mlddle-to- I~ income, primarily Caucasian population.. T.he data us for the study began with the commumc~tlOns .mess~.; logs for all calls for service where a pOSSIble cnme \ ". involved. We did nOL include drunk and vagrancy ~
rests traffic incidents, and certain other calls for service, such' as calls to aid injured persons, which did not appear to be crimes at the time the communications center re-ceived the call. .
From the communication messages, we went to the patrol officers' daily field activity reports to determine if the radio call resulted in a crime being reported. If so, we obtained the case number and collected some informacion about what the officer did at the scene, if such infonnation was recorded in his field activity report. We also scanned the field activity report for cases that did not originate with a radio call, usually field observations by the patrol officer, which resulted in a crime being reported or an arrest made. It was at this point that we also picked up any radio call cases previously neglected which were now seen to be connected with a crime. An example of slIch a case might be an injury call which Was actually connerted with an assault.
Having the case number, we were then able to go to the crime report file and retrieve the crime report, any followup made by the detectives and, if appropriate, the arrest report.
INFORMATION COLLECTED
A special coding sheet was designed to assist in the data recording process (annex 1). The items of information collected appear in each line. The numbers in parenthe~es next to the code categories would be circled by the officer recording the information and those circled numbers would be key-punched onto cards.
----->--~-------
cant for later calculations of response time. F.inally, we noted the time the case was tenninated in the communications <;enter, the time stamped on the back of the message log. To complete the record, the times from the daily field activity report indicati'ng beginning and ending of the case as recorded by the field officer were also noted.
From examining the daily field activity report, we could then detelmine if a crime was reported or 'lOt. If not, we terminated the information collection. If a crime was reported because of a radio call, we then recorded some of the information available from the field activity report concerning the activities of the field officer; e.g., whether he requested a check of the vehicle license 01' warrant files. We also recorded any observations by the field officer shown in the activity report, and recorded the case number (the "DR number") so that we could enter the crime report, followup and arrest report files.
The infOlmation recorded began with the division of occllrrence, the day of the month in January that the crime occurred, and a sequence number which, together with the division and date, comprised a unique serial number ~o identify each case for computer processing. Information was then recorded concerning the type of communications message log ticket and the type of call as viewed from the communications center (Le., was this a suspect on scene case, a take report call, or a possible crime). We then recorded the times stamped on the communica_ tion ticket. These times included the originating time, wIlen the call was first received at the complaint board, and the dispatch time when the dispatch order was radi-
We noted whether an arrest was made or not, and if so, what type of charge, where it was made, the date and time of the arrest, the use by the arresting officer of prior information concerning the case, and the source of that information. We then recorded several items concerning the crime itself. These included the classification of the crime in legal telms; whether or not force or fear were involved, and certain subcategories under that heading; whether there was an attempt to takl' property, the dollar value reported, and the character of the item; whether the crime was inside a building, on the street, or in a vehicle; whether there was an attempt to sexually assault the victim, and related information about the relationship with the suspect; whether the suspect was seen, named or described by witness or victim; whether physical evidence was reported; whether a vehicle was used by the suspect; and detailed infonnatioll on whether a followup report was made by the detectives and what actions were taken in the followup investigations.
The final information collected was an indication of whether the case was cleared by arrest or some othel' method; and if there was an arrest, how many suspects were arrested and how many cases were cleared by that arrest.
. oed to the 'field unit. The difference between these two
. t~mes represents the communications center delay. Occas!onally there would be multiple stampings of the dispatch time because the unit first called did not respond to the call. This might occur if the unit were not available or just ?id not ac~nowledge the call. In the case of these l11ultIpl~ stampl~gs, the final time stamp was recorded as the dIspatch tIme. We also kept track of whetlw
r the
call was eventually assigned to a different unit than the . one originally designated.
We then examined the incoming message logs in response to r.ach call and recorded the time of the first response by a field unit, even if it were not the unit designated to ~andle the call. We also noted the type of response (I.e., Ooele 6: "At location and investigating'" Code 4: "No further assistance," etc.). This was signifi~
A computer program was developed to analyze the communications center delay time and field response time according to different categories of cases and types of calls. The program also provided a distribution of arrest delay time. In addition, the program could analyze any item 01' combinations of items that were coded on the basic forms shown in annex 1. It was thus possible to correlate a series of crime characteristics and anafyze whether 01'
not arrests were made or other clearances effected. It was also possible to determine some of the factors that contributed to case clearances.
co N S1'RAINTS
Despite the wide variety of information collected and the ability of the analysis program to sort on any item of information, there were several constraints which limit the conclusiveness of the findings. Because of the short time period available [or both data collection and analy-
,. 1; Ie I.!.:. /.,
If I·· f I
JI
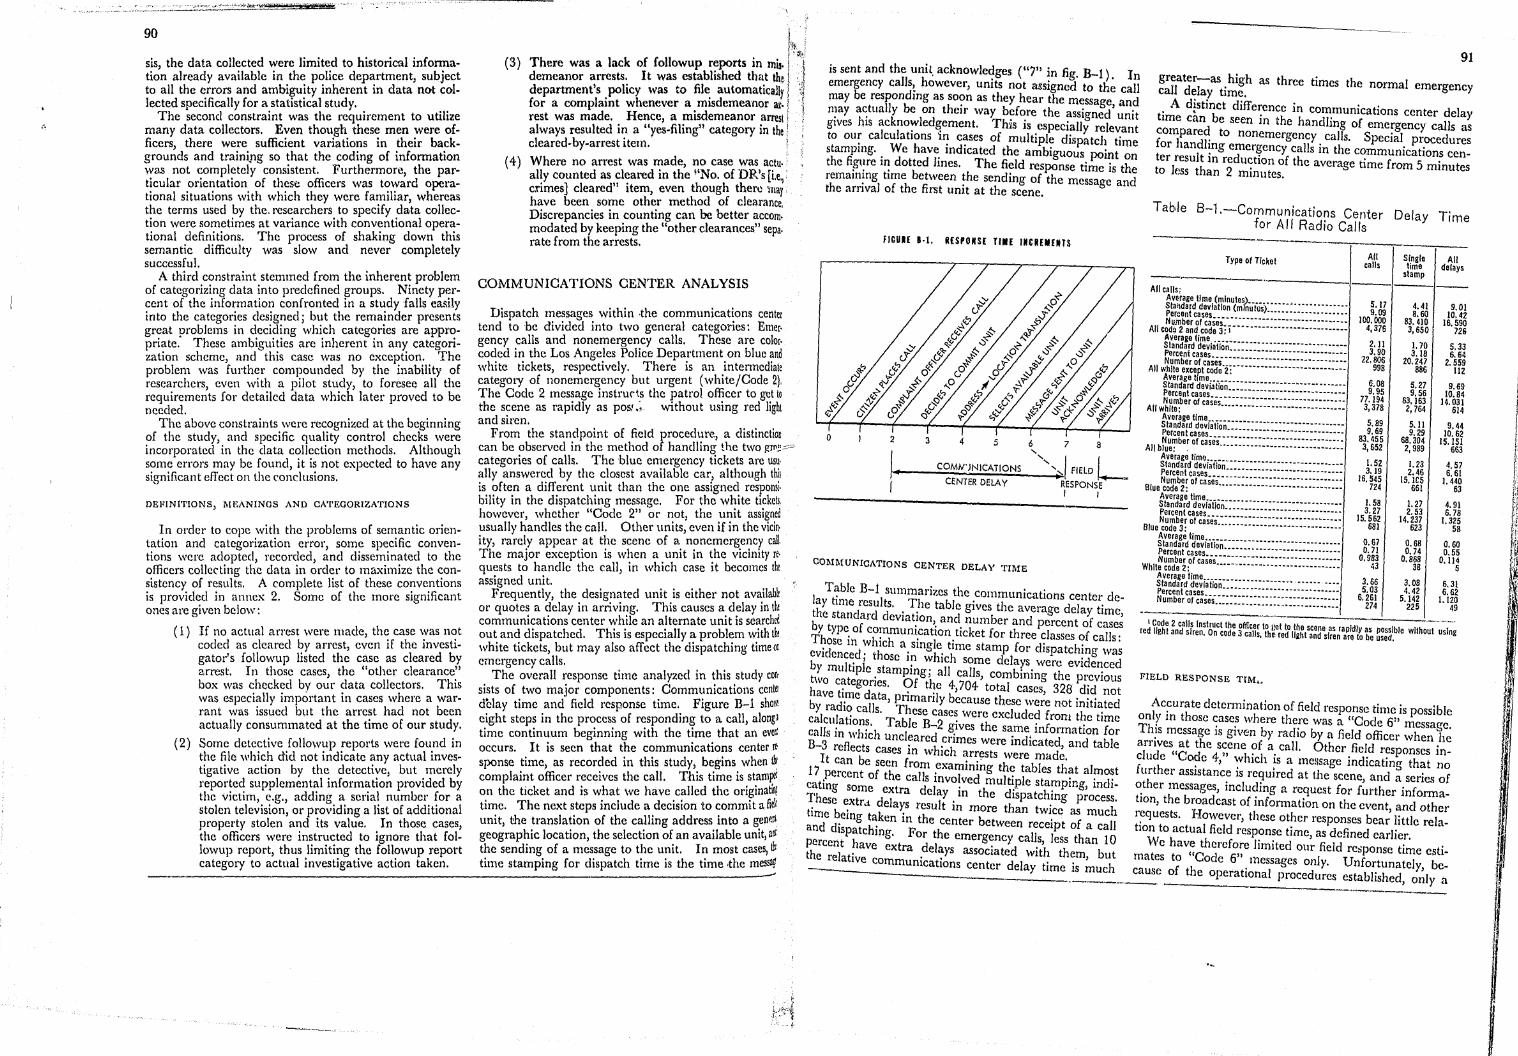
90
sis, the data collected were limited to historical infonnation already available in the police department, subject to all the errors and ambiguity inherent in data not collected specifically for a statistical study.
The second constraint was the requirement to utilize many data collectors. Even though these men were officers, there were sufficient variations in their backgrounds and traini,ng so that the coding of infonnation was not completely consistent. Furthermore, the particular orientation of these officers was toward operational situations with which they were familiar, whereas the terms used by the. researchers to specify data colIection were sometimes at variance with conventional operational definitions. The process of shaking down this semantic difficulty was slow and never completely successful.
A third constraint stemmed from the inherent problem of categorizing data into predcfined groups. Ninety percent of the information confronted in a study -falls ea~i1y into the categories designed j but the remainder presents great problems in deciding which categories are appropriate. These ambiguities are inherent in any categorization scheme, and this case was no exception. The problem was further compounded by the inability of researchers, even with a pilot study, to foresee all the requirements for detailed data which later proved to be needed.
The above constraints were recognized at the beginning of the study, and specific quality control checks were incorporated in the data collection methods. Although some errors may be found, it is not expected to have any significant effect on the conclusions.
DEFINITIONS, MEANINGS AND CATEGORIZATIONS
In order to cope with the problems of semantic orientation and categorization errol', some specific conventions were adopted, recorded, and disseminated to the officers collecting the data in order to maximize the consistency of results. A complete list of these conventions is provided in annex 2. Some of the more significant ones are given below:
( 1) If no actual arrest were made, the case was not coded as cleared by arrest, even if the investigator's followup listed the case as cleared by arrest. In those cases, the "other clearance" box was checked by our data collectors. This was especially important in cases where a warrant was issued but the arrest had not been actually consummated at the time of our study.
(2) Some detective followup reports werc found in the file which did not indicate any actual investigative action by the detective, but merely reported supplemental information provided by the victim, e.g., adding a serial number for a stolen television, or providing a list of additional property stolen and its value. In those cases, the officers were instructed to ignore that followup report, thus limiting the followup report category to actual investigative action taken.
(3)
(4 )
There was a lack of followup reports in mi!. demeanor arrests. It was established that the department's policy was to file automatically for a complaint whenever a misdemeanor ar. rest was made. Hence, a misdemeanor arrest always resulted in a "yes-filing" category in the c1eared-by-arrest item.
Where no arrest was made, no case was actu. ' ally counted as cleared in the "No. of DR's [i.e, : crimes] cleared" item, even though therll "iliay have been some other method of c1ea.rance, Discrepancies in counting can be better aCCom. modated by keeping the "other clearances" sepa. rate from the arrests.
COMMUNICATIONS CENTER ANALYSIS
Dispatch messages within the communications center tend to be divided into two general categories: Emer· gency calls and nonemergency calls. These are color· coded in the Los Angeles Police Department on blue and white tickets, respectively. There is an intenncdiate category of nonemergency but urgent (white/Code 2), The Code 2 message instrurts the patrol officer to get to the scene as rapidly as pOSI.~ without using red light and siren.
From the standpoint of field procedure, a distinction can be obscrved in the method of handling the two !!,JYI~~O:= categories of calls. The blue emergency tickets are usu· ally answered by the closest available car, although thi! is often a different unit than the one assigned responsi, bility in the dispatching message. For the white tickets, however, whether "Coele 2" or not, the unit assignee usually handles the call. Other units, even if in the vicino ity, rarely appear at the scene of a nonemergency call. The majol' exception is when a unit in the vicinity reo quests to handle the call, in which case it becomes the assigned unit.
Frequently, the designated unit is either not available 01' quotes a delay in arriving. This causes a delay in the communications center while an alternate unit is searchel out and dispatched. This is especially a problem with tm white tickets, but may also affect thc dispatching timeD! emergency calls.
The overall response time analyzed in this study cor, sists of two major components: Communications ccnle dClay time and field response time. Figure B-1 5ho\11 eight steps in the process of responding to a call, along I time continuum beginning with the time that an eve~ occurs. It is seen that the communications center Itsponse time, as recorded in this study, begins when tli complaint officer receives the call. This time is stamp« on the ticket and is what we have called the originatlni time. The next steps include a decision to commit a fie~ unit, the translation of the calling address into a gen~rI geographic location, the selection of an available unit, a~ the sending of a message to the unit. In most cases, til time stamping for dispatch time is the time ,the meSS$!'
--~--------------------------------------------------------.-------------------------~
is sent and the unit. acknowle~ges ("7" in fig. B-1). In emergency callst however, Ul11ts not assigned to the call may be respondmg as soon as they hear the message d may actually be on their way before the ass' d' an. . h' k Igne Ul11t gives IS ac no~led&ement. This is especially relevant to ou; calculations ~~ c~ses of mUltiple dispatch time stamping .. We have. mdlcated the ambiguous point on the figure m dotted lmes. The field response tl' • h .. . b me IS t e remaIning time etween the sending of the d h . I f h' message an
t e arnva 0 t e first umt at the scene.
FICURE 8·1. RESPONSE TIME INtREMEns
4 5 6 7 8
lr-. __ ....;C:;.;O:::M:::N:: •• ~JN~I.:;;CA:.T!.!.IO~N~S _,,_,_,~ .. I FIELD L I CENTER DELAY RESPONSE
I I
COMMUNICATIONS CENTER DELAY TIME
la ~~ble B-11 summarizes the communications center de-
y Il11e resu ts. The table gives the avera c dela f
91
greater-as high as th t' h all d 1 • ree Imes t e normal emergency c e ay time.
tim~ ~isti~ct difl'e~ence in communications center delay an e seen m the handling of emergency calls as
f~;1fa~d1 to nonemergency. calls. Special procedures t I ~ng e;erE?ency calls In the communications cent~r 1~.~sSUtht alnn r
2e u~hon of the average time from 5 minutes
, mmutes.
Table B-1.-Cornrnunications Center Delay Time for All Radio Calls -------
Type 01 Ticket All calls
Single All time delays _ _ __ . stamp - ------.1 ___ _
All calls; AVErage time (minutes) StaMard devlat/on (mlniitiis·) .. •• ................ . Per~ent cases .................... . Number 01 cases'" ............................ .
All cod(l2 and code 3:i· .. ·· .... · .... ····-.. ·· .... ·· Average lime Standard devlatioii·_···· .... • ........ • .. •• .... .. Perceni cases ............................ .. Number of cases··· .. • .. •• .... • .. • ...... • .... ..
All while except code·F···· .... ••• .... • ........ • .. • Average time Standard deviation·· ........ • ...... • .... • ..... .. Percent cases ............................ .. Number of cases .... • .. • .. •• .............. ••• .. • All while: ............................... .
~t~~3:~d t:ra~jatjon ............................. .
All b~~f1~~ c~fs~:ses. ::::::::::::::::::::::::::::::: ~t~~~:~i~~~iafion""··""·"··"""··""·"·
Blue ~g~e1~t~ ~afs~:se;.::::::::::::::::::::::::::::::: :t~~3::d t~~~iatjoii"""""""" ............. . Percent cases ............................ .. Number of cases .... • .... • .. • .. ••• .. • .. • .. • .. • ..
Blue code 3: ............................... .
~t~~3::d I~~~fa·tjoii::::::: :::::: ............... .. Percent cases ................ . Number of cases .... • ......................... ..
While code 2: ............................... .
tt~eri3::dt~~~iaiioii .. •• .. • ........ • ............. . Percent cases ............................. . Number 0' cases'.:::::::::::::::::::::::::::::::
5.17 9.09
100.000 4,376
2.11 3.90
22.806 998
6.08 9.95
77.194 3,378
5.89 9.69
83.455 3,652
1.52 3.19
16.545 724
1,58 3.27
15.562 681
0.67 0.71
0.983 43
3.66 5.03
6,261 274
I
4.41 8.60
83,410 3,650
1.70 3.18
20,247 886
5.27 9.56
63.163 2,764
5.11 9.29
68,304 2,989
1.23 2.46
15.1es 661
I. 27 2.53
14,237 623
0.68 0.74
0.868 38
3.08 4.42
5.142 225
9.01 10.42
16.590 726
5.33 6.64
2.559 I12
9.69 10.84
14.031 614
9.44 10.62
15.151 663
4,57 6.61
I. 440 63
4.91 6.78
1.325 58
0.60 0.55
0.114 5
6.31 6.62
1.120 49
I Code 2 calfs Instruct the offi e t ,t t th . ~-' red lIeht and siren. On code 3 c~JJ~ rh~eredOtfnhetSaCnedne ,as rapiditY as possible without usIng
• A S ren are 0 be used.
~he standard deviat.ion,. and number and pe~cent It ~::::~ ~~~~~f\~l!~mul1J;catlOn. ticket for three classes of calls: evidenced' :~~s a. smgle. time stamp for dispatching was by l11ultipic sta~ l~ ,,;hlch some delays. were evidenced two categories bfgt'h al~ 7~is, combmmg the previous FIELD RESPONSE TrM,. have time d . . ;e, total cases, 328 did not by radio calf
ta, ¥~maflly because these were not initiated Ac~urate determination of field response time is possible
calculations s. Tabl eSn c2se~ were excluded from the time only In those cases whc"e there was a "C d 6" calls in whi~h uncle
e d g;lves the s,:me. information for Tl~!s message is given b~ radio by a field ~fficer ~~~~1~ B-3 reflects cases i~re'h ~rhmes were mdlcated, and table arllves" at the s~,ene ?f a. call. Other field responses in-
It can be seen fro~vl: ~r~~sts here made. elude Co?e 4, which IS a message indicating that no 17 percent of th J1 .exa1unmg t e tables that almost further assIstance is required at the scene and . f eating some ex~r~a ~telmvo.ved mul~ple sta~ping, indi- ~ther messages, inclu~ing a request for f~;therai~~~:~_ These extr.! delays ? . m the dlspatchmg process. t.lOn, the br,oadcast of mformation on the event, "'nd other time bein tak . resu t m more than twice as much I eq t H .. and dispa~ h' en mFthe center between receipt of a call . ues s. owever, these other responses bear little rela-percent haC mg. or the emergency calls, less than 10 bon to actual field response time, as defined earlier the relativeve extra .del~ys associated with them, but We have therefore limited our field re~ponse ti~lC esti _ commul11catlons center delay time is much mates to "Code 6". messages only. Unfortunately, be:
._. __ ~e. of the operational procedures established, only a , j
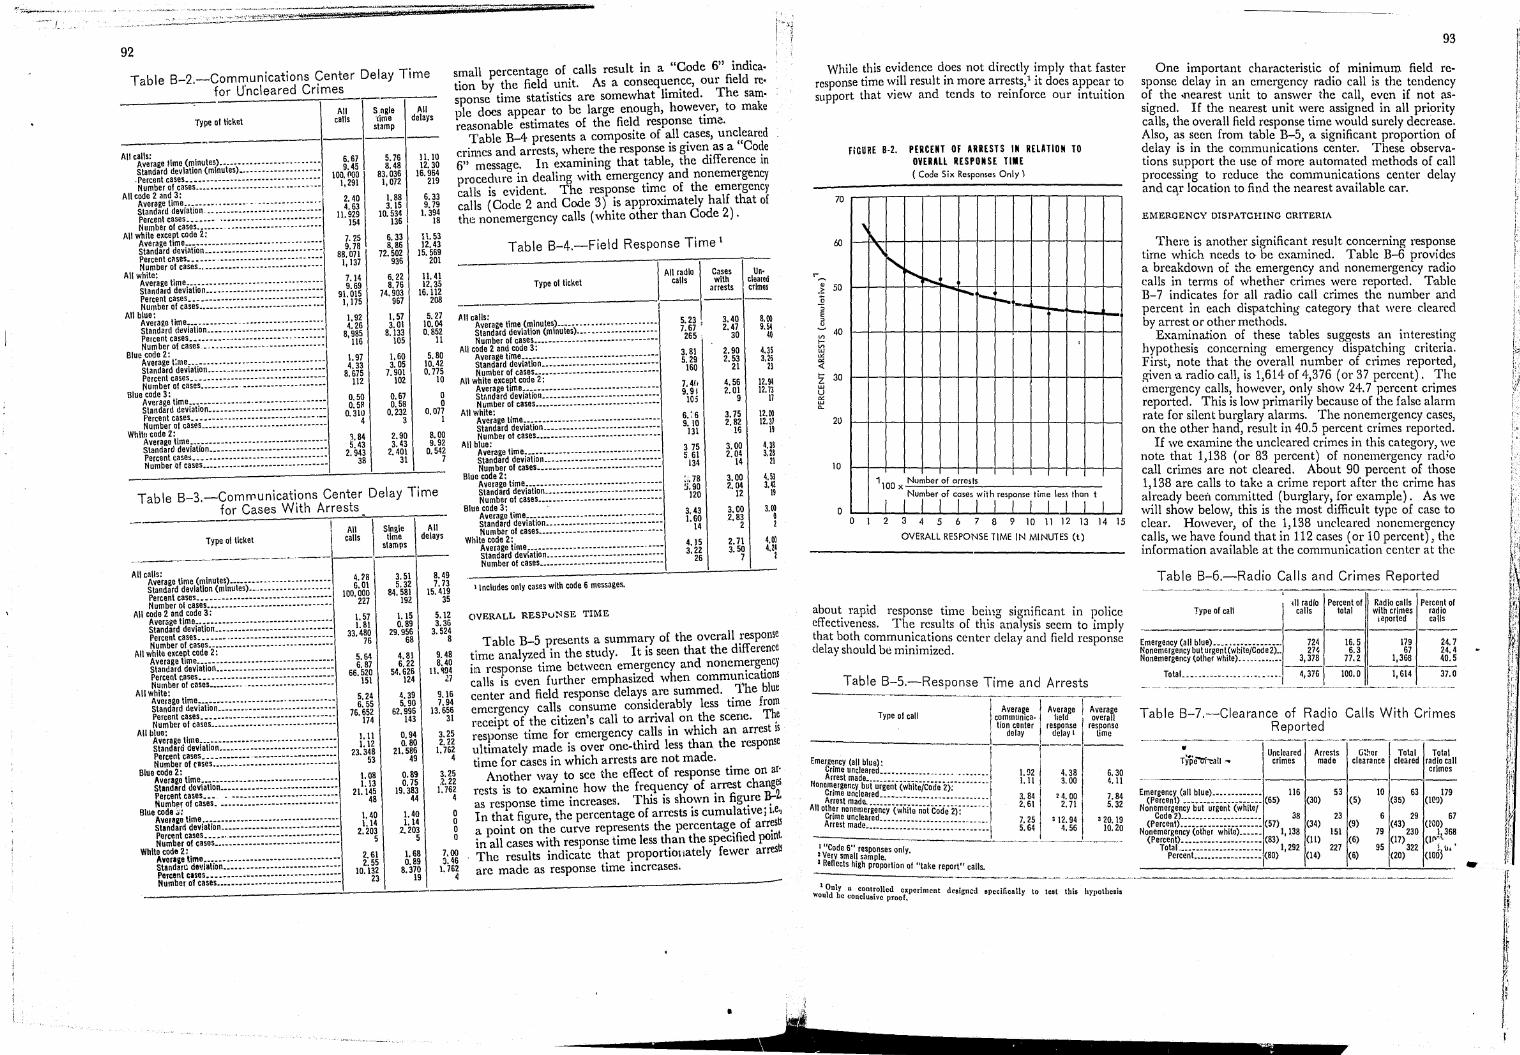
• j" TV'
92
Table B-2.-Communications ~enter Delay Time for U'ncleared Crimes
Type of ticket All
calls Sngle All ·time delays stamp
small percentage of calls result in a "Code 6" indication by the field unit. As a conseq~en.ce, our field response time statistics are somewhat limited. The sample does appear to be large enough, howe,:er, to make reasonable estimates of the field response time.
Table B-4 presents a composite of all cases, unclear<!d crinncs and arrests, where the response is given. as a "Co(~e 6" message. In examining that table, the difference m procedure in dealing with emergency and nonemergency calls is evident. The response time of the emergency calls (Code 2 and Code 3) is approximately half that of the nonemergency calls (white other than Code 2) .
____ ,---------1---------All calls: Average time (mlnutes). ____ .................... .
Standard deviation (minutes) ................ ••••• .Percent cases._ •••• _ ••• _ .. • .... _ .... _·········· Number of cases .............................. ..
All code 2 and 3: Average tlme ... _ ........... •·• ......... -•.• - .. Standard deviation ............................. . Percent cases ..... __ ... -- .................... . Number of cases .•••••••••••• _···· .. ··_·····_··
All white except code 2: Average time_ ...... _ ••••• ···---·········-· .... • Standard deviation .......... ·-.. •••· .... •••·•• .. Percent cases .......................... --..... . Number of cases •••••••••••.•• ••••••• .... ·····-·
All whitc: Average lime •• _._ ........ _.······_······ .. __ ··_ Standard deviatlon •••••••• ·.······--············ Percent cases ................................ -. Number of cases .......... · •• •••••••••••••·•• .. •
6.67 9.45
100. POO 1.291
2.40 4.63
I\. 929 154
7.25 9.78
88.071 1.137
7.14 9.69
91. 015 1,175
5.76 11.10 8.48 12.30
83.036 16.964 1,072 219
1.88 6.33 3.15 9.79
10.534 1.394 136 18
6.33 n.53 8.86 12.43
72.502 15.569 936 201
6.22 11.41 8.76 12.35
74.903 16. \12 967 208
Table B-4.-Field Response Time 1
Type of ticket I All radio Cases \ un.'
calls with cleared arrests crimes
·_----------1------All blue:
AveraRe time •••..•••• , ••• --.................. .. 1.92 4.26
1.57 5.27 10.04
All calls: Average time (mlnutes) .. __ ••••.•••• , ••••••••• '" n~; 3.40 8.00
Standard dijviation ............................ .. Percent cases._ ................. "'--"'" •.•• , Number of cases .• -" .-.- •• -••• -.- .......... -•••
Blue code 2: Average t:me ................. •• .. _···· .. ·••• .. • Standard deviation .......... •• .. •• .. • .... ······-Percent cases •. _ ............ -··· .. ······-······ Number of cases .......... -........ -.••.•• -.-••
B1uc code 3: Average time ......... _ ••••• ··_ .. ··_·'''·''_'''' Standard deviation .......... • .. • .... -··---... -.-Percent cases ___ ....... -... -.. --.......... -----Number of cases .• __ .......... ••••• __ •• .. ····_ ..
Whltn code 2: Average tlme ............. • .... •••• .. •• ...... ·-· Standard deviation. __ .............. -- ••• -..... " Percent r:ases .. _ •••••••• ••••• .. ·• .. •••• .... •••• Number of cases ... _ ............. • .. •• .. •••• .. ·•
8'm 1. 97 4.33
8.675 112
0.50 0.5R
0.3\0 4
3.84 5.43
2.943 38
3.01 8.133 0.852
105 11
1.60 5.80 3.05 10.42
7.901 0.775 102 10
0.67 0 0.58 0
0.232 0.077 3 1
2.90 8.00 3.43 9.92
2.401 0.542 31 7
Table B-3.-Comrnunications Center Delay Time for Cases With Arrests ..
-------- All I Single \ All Type 01 ticket calls time delays
slamps
~--...------.---------- -...~-- ------------All calls: . Average time (mmutes)._ ... __ ••....•••••••.•••••
Standard deviation (mlnutes)_ •.•••.••.•••••• -- ••• Percent cases. _. __ ._ •• _. ____ •• _ •••• -••• -•••• --. Number 01 cases ••••••• _ ... _·· _______ •••• __ ·• __ •
All code 2 and code 3: Aver.ge time •. _._. ___ • -•• - •• -... -•• --.-- ••• --.-Standard deviation .. ___ ._. ___ ._ .--.... --., ... -•• Percent cases •••••• , .- •• --.. --•• -...... -•• -----Number of cases •. __ ....... • __ •••·••••·• __ ••• __ •
All white e~cept code 2: Average time._ •• _ .--.--•••• --.--- ••••••• --.----Standard deviation ..... __ ••• , -.- -- •• , ., ••• -.--.. Percent r.ases __ ••• -••••• -••••• --' -••••••• -.---. Number of cases_ ••• __ .... -•• -............... -..
All white: Average tlme. ___ •• _ ..... __ ••••• _ ...... -••••• -•• Standard deviation._- ____ .. - •• --- ••• -- .... -••••• -Percent cases. _" ••• -.--.-. -•• -.-- .-••••• -- -- •• Number of cases ••• _ ... __ .... ·._·· __ ·_···· ___ ·_·
All blue: Average tlme_ •••• ____ •••• ___ ·_·· __ • •••• - .•• ,.--Standard deviation ••••••• _ -••• ---- --.......... -. Percent cases •••••• -•• --- •• --.--.-•• -.-.-•• -•• Number of cases ......... __ .... ····_······_·· __ •
Blue code 2: Average time ........ ,_ •• , .... -•••• -- --- •• -•• --. Standard devlatlon._ ••• -., ••• -.-.. ---•••••• , .... Percent cases... • .--. -.---••• "-'''-' -•••••• Numbp.1 of cases ...... -....... -••••• -.--••• -•••
Blue code J: Average tlme. __ ._._ •• "-'" -••••••••• -- ••• ---.. Slandard devlation. ___ •• -•• -.-- ••••• -•••••• ----Percent cases._ •• " •• --------.-----.----.... -.-Number of cases_ •••• __ • __ .... ____ •• .. •• __ • __ ··_
White code 2: Average lime .. _ .•••• _. -.-- .-•••• -•• ---.-. '-'-'" StandarG de~18tlon. __ ........ -.------.-.-- •• --.-Percent cases_. _. ___ ._ •• ---•• ------.- •• -.-- •• ,-Number 01 cases ••• _ •• _._ ... _.····· _____ ··_· __ ·_
U8 6.01
100.000 227
1. 57 1.81
33.480 76
5.64 6.87
66.520 151
5.24 6.55
76.652 \74
1.11 1.12
23.348 53
1.08 1.13
21.145 48
1.40 1.14
2.203 5
2.61 2.55
10.132 23
3.51 8.49 5.32 7.73
84.581 15.419 192 35
1.15 5.12 0.89 3.36
29.956 3.524 68 8
4.81 9.48 6.22 8.40
54.626 11. ~94 124 27
4.39 9.16 5.90 7.94
62.996 13.656 143 31
0.94 3.25 0.80 2.22
21.586 1.762 49 4
0.89 3.25 0.75 .~. 22
19.383 1.762 44 4
1.40 0 1.14 0
2.203 0 5 0
1.68 7.00 0.89 3.46
8.370 1. 762 19 4
Standard deviation (minutes) ................. •••• Number of cases._ •••.• _ ... ·.·_ .. •• .. • .. ··_·_ .. _
All code 2 and code 3: AVerage time __ •• __ ...... _._ .. _······ .... •• .. _ .. Standard deviation ................. _·· .. • .. • .. .. Number of cases .......... -------.... ·- .. • .... --
All white except code 2: Average time _______________ •• .. --.-. - .-- -- -.---Str,ndard deviation ___ .. ___ .------- --.-- ... -- ----Number of cases __ ._ ..... _ ... ••••• .. • .. ·····---·
All white: Average time .. __ ... ----- •••• -- •.• --- ••• -••• ----Standard deviation •• __ ---••.• ---.- •• , -- •• --.--•• Number 01 cases_. ___ .• __ •• ___ • ___ ··_······ __ • __
All blue: Average time. __ ••••• _ •••• ----.- •• -.- •••• --- •• --Standard deviatlon._ ••••• ,. --- •• --... --.-.- .-••• Number of cases. _____ ••••• ___ • ____ • __ • __ • ____ ..
Bloe code 2: Average time •• __ •••• -- ••••••••••• -- ••• ,. -- •• -.-Standard deviation. __ ••• _ ••• , ••• -•••• -. -. ----.-Number of cases ••• __ •••••••• _. __ ·_·· __ • __ ••••••
Blue code 3: Average time .•.• _. __ -.• -......... --........ --., Standard deviation .. --" --- -., -•• -.- .• --- ... ---. Number of cases .... _. __ ... ·_·· ____ ··_··· __ ·· __ ••
White code 2: Average time •• _ ••• ___ ..... -- •• -•• ,. --- .. '-' --•• Standard deviation •• ____ •• __ •• -•••• -- ••• -- •••• --Number of cases •••• ________ .. • __ ·_··_······ __ ••
1 I ncludes only case3 with code 6 messages.
OVERALL RESpu::-<SE TIME
265
3.81 5.29
160
7.4(, 9.91
105
6. :6 9. to
131
375 5 61
134
:i.78 !i. 90
120
3.43 1. 60
14
4.15 3.22
26
2.47 9.51 30 40
2.90 US 2.53 3.26
21 23
4.56 12.91 2.01 12.13
9 11
3.75 12.00 2.82 12.31
16 19
3.00 4.38 2.04 3.28
14 21
3.00 4.53 2.04 3.42
12 19
3.00 3.00 2.83 0
2 2
2.71 4.00 3.50 4.2:
7
Table B-5 pre~ents a summary of the overall .response
time analyzed in the study. It is seen that the dlfferenc~ in response time between em~rgency and nonem~rg~ncl calls is even further emphaslZed when commur.!lcatl1ns center and field response delays are summed. 1 he b ue emergency calls consume considerably less time from receipt of the citizen's call to arrival on the scene. T~e r.esponse time for emergency calls in which an arrest IS
ultimately made is over one-third less than the response time for cases in which arrests are not made.
Another way to see the effect of response time on ar· rests is to examine how the fre9u.ency of ~rrest chang~ as response time increases. ThiS IS sh~wn m fig~re ~ , In that figure, the percentage of arrests IS cumulatIVe, I·~U a point on the curve represents the percentag~ of ar~ in all cases with response time less than the speCified point. The results indicate that proportiollately fewer arrest! are made as response time increases.
•
While this evidence does not directly imply that faster response time will result in more arrests/ it does appear to support that view and tends to reinforce our intuition
70
YJ
fiGURE 8·2. PERCENT OF ARRESTS IN RELATION TO OVERALL RESPONSE TIME ( Code Six Responses Only \
, \ f'.
r-~ ~ r--.. " 50 .?: .E
:>
r--. r-t-- -- .... E :> ~
40 V> t-V> \OJ
'" '" <{ t- 30 z w U
'" \OJ a.
20
10
0
,
i I I
1100 x Number of arrests
I I NUTber(f eres jityes7nse, timj les, tho, t I
o 2 3 4 5 6 7 8 9 10 11 12 13 14 15
OVERALL RESPONSE TIME IN MINUTES (t)
about. rapid response time beillg significant in police effectiveness. The results of this analysis seem to imply that both communications center delay and field response delay should be minimized.
Table B-S.-Response Time and Arrests ----- -~
I Average Average I Average cornmunica· held overall tion center response respons" __ ' I delay delay 1 lime
Type 01 call
I-~--
Emerg~ncy (all blue)' I I XrimetUnC~eared: __ •••••• -......... •••••••. 1.92 4.38 6.30
HoneJ.~~~e~~ biii'rirgini'(v.iiJiiiiCode2):"'-"·'· 1.11 3.00 4.11 Clime uncleared Arrest made. .... --... --••.• -•••••.•
All oth~r nonemer'giiricy"(wiiit;;iiiiiC'0'de2):' "'" ~ X~~~~ u"c~eared •••••••••••• ---- .••• -•.• -- •..
ma e •••• __ ._ ..... __ ._ .... _. -.. --- "'1 1 "Code 6" responses only. 2 Very small sample. 3 Reflecls high proportion of "take report" calls.
3.84 2.61
7.25 5.64
24.00 2.71
312.94 4.56
7.84 5.32
320.19 10.20
10nly a controlled experiment designed specifically to test this hypothesis would be conclusive proof .
93
One important characteristic of mmlmum field response delay in an emergency radio call is the tendency of the -nearest unit to answer the call, even if not as· signed. If the nearest unit were assigned in all priority calls, the overall field response time would surely decrease. Also, as seen from table B-5, a significant proportion of delay is in the communications center. These observations support the use of more automated methods of call processing to reduce the communications center delay and c,\r location to find the nearest available car.
EMERGENCY DISPATCHING CRITERIA
There is another significant result concerning response time which needs to be examined. Table B-6 provides a. breakdown of the emergency and nonemergency radio calls in terms of whether crimes were reported. Table B-7 indicates for all radio call crimes the number and percent in each dispatching category that were cleared by arrest or other methods.
Examination of these tables suggests an interesting hypothesis concerning emergency dispatching criteria. First, note that the overall number of crimes reported, given a radio call, is 1,614 of 4,376 (or 37 percent). The emergency calls, however, only show 24.7 percent crimes reported. This is low primarily because of the false alarm rate for silent burglary alarms. The nonemergency cases, on the other hand, result in 40.5 percent crimes reported.
If we examine the uncleared crimes in this category, we note that 1,138 (or 83 percent) of nonemergency rad;o call crimes are not cleared. About 90 percent of those 1,138 are calls to tak<! a crime report after the crime has already been committed (burglary, for ex-ample). As we will show below, this is the most difficult type of case to clear. However, of the 1,138 uncleared nonemergency calls, we have found that in 112 cases (or 10 percent), the information available at the communication center at the
Table B-6.-Radio Calls and Crimes Reported
111 radio Percent of Radio calls Percent of Type of call calls total with crimes radio
leported calls ----------
Emergency (all blue) .......... _ .... __ . 724 16.5 179 24.7 Nonemergency but urgent(white/Code2) •. 2H 6.3 67 24.4 Nonemergency (other white) .... _ "" __ ' 3,378 77.2 1,368 ~O. 5
TolaL .. ~ •. __ .~._ •. __ "" _.,. 4,376 100.0 1,614 37.0
Table B-7.-Clearance of Radio Calls With Crimes Reported
" Uncleared Mresls G:~er Total Total crimes made clearance cleared radio call
crimes -----.. ~--~.------------------
Emergency (all blue)._._ ••• __ • __ • 116 53 (Percent) • ___ •• ____ •• _ •• ____ • (65) (30) (5)
Nonemergency but urgent (whitel Code 2) •• _._ ••• __ • ___ .. ___ •• 38 23
(Percent) .•••• __ ••• _ •••• _ ••• _. (57) (34) (9) Nonemergency (other white) ••• _ •• 1,138 151
(Percent) •• _ •• ___ ••• _. ____ •• __ (83) (II) (6) Total_ ••• ____ • __ ••••• _ ••• " 1,292 227
Percen!.. ••••• _._ ._._ •• __ (80) (14) (6)
10 63 179 (35) (\CD)
6 29 67 (43) (100)
79 230 1.368 (17) (11'"'
95 322 'l u. ' (20) (100) -
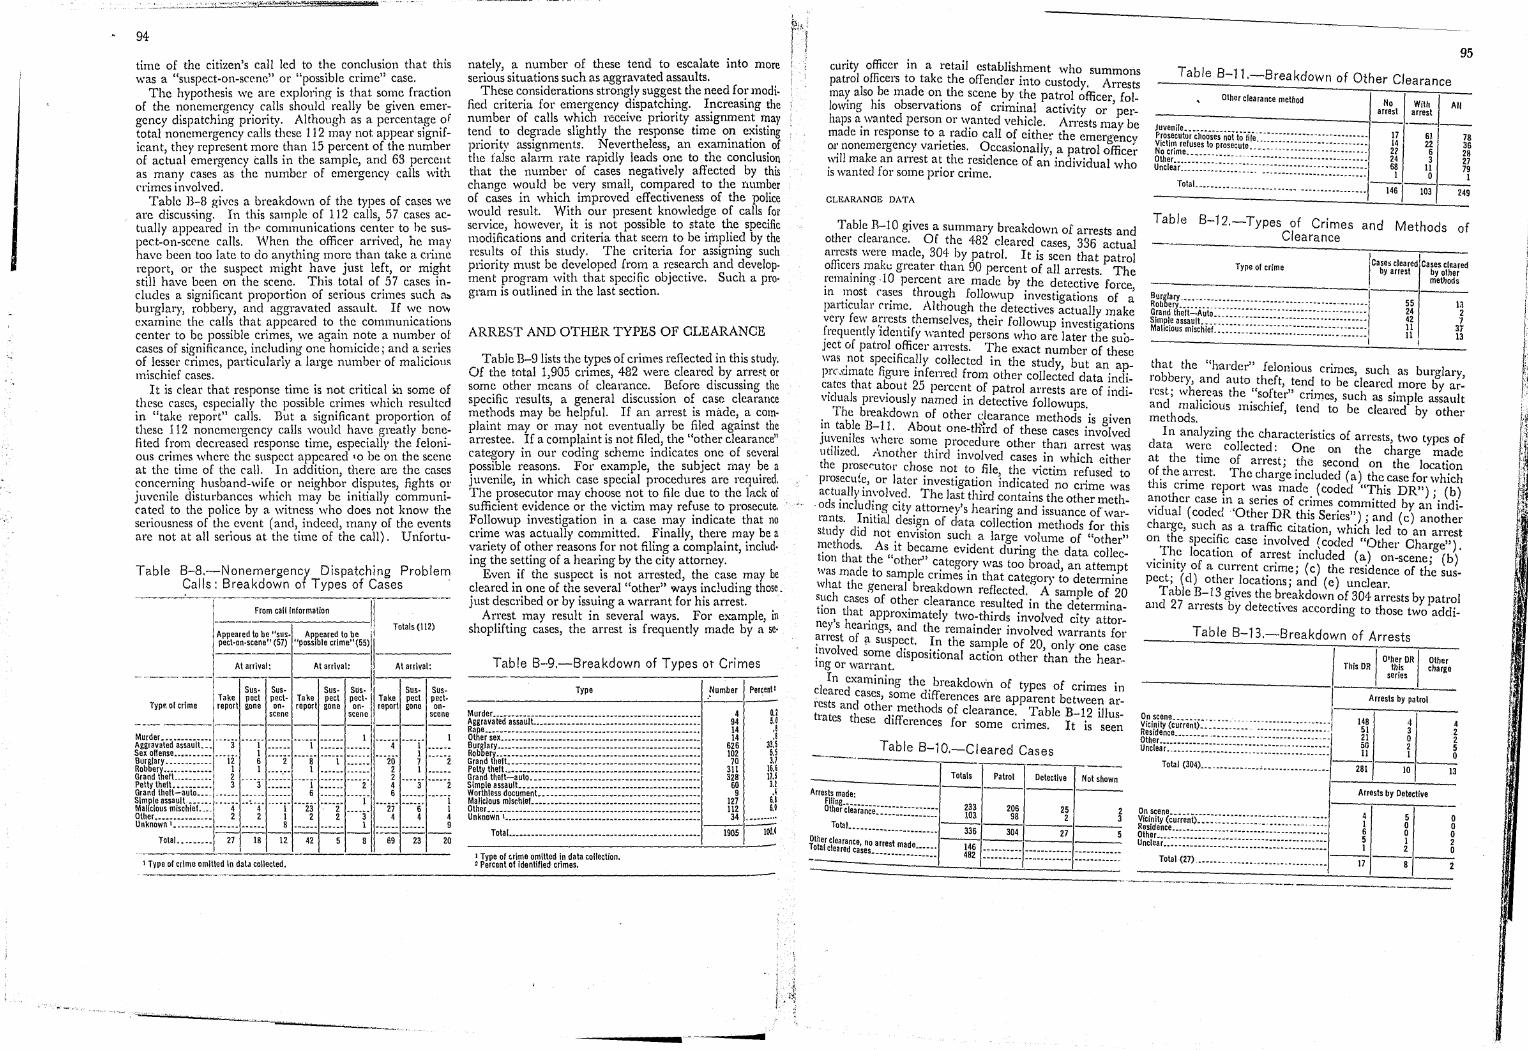
--.~, -"~""~------~."""~"'-""'-"''''''''':'''-'P''' _____ ~ ___ .... _ ..... _ z ~ "
• , .. l-~ , ••• )" •• ~.".-".',,;:, .... 4l'~#: ?:'.>Ii"i4i'ry-"n ".,. ~ ... r' -
94
time of the citizen's call led to the conclusion that this " " 'bl .' e" case was a "suspect-on-scene or pO~SI .e cum . . .
The hypothesis we are explormg- IS that so~e fractIOn of the nonemergeney calls should really be glVen emergency dispatching priority. Although as a percent,,:ge ?f total nonemergeney calls these 112 may not appear slgmficant, they represent more than 15 percent of the numbe~ of actual emergency calls in the sample, and 63 perc~llc as many cases as the number of emergency calls With crimes involved.
Table B-8 gives a breakdown of the types of cases we are discus~ing. In this sample ?f 1.12 calls, 57 cases actually appeared in thp commU!11catIons ce~ter to be sus~ peet-on-sccne calls. When t~e officer arnve(~ he ~:1a} have been too late to do anythmg more than take a cI.nne report, or the suspect might ha:-e just left, or mlqht still have been on the scene. ThIs total of 57 cases 111-
eludes a significant proportion of serious crimes such &,
burglary, robbery, and aggravated assault. If \~e ~O\" examine the calls that appeared to the commumcatlom center to be possible crimes, we again ?~te a number ,of cases of significance, including one homicide; and a .s~nes of lesser crimes, particulariy a large number of malIcIOUS mischief cases.
It is clear that response tim~ is no~ critical. in some of these cases, especially the posslbl? c;'nnes wluch re.sulted in "take report" calls. But a 5lgmficant proportion of these 112 nonemergeney calls would have greatly ben~fited from decreased response time, especially the felomous crimes where the suspect appeared 10 be on the scene at the time of the call. In addition, there arc the cases concerning husband-wife. or neighbor. d~s'putes, fights ~r juvenile disturbances which may be 111lhally commU11lcated to the police by a witness who does not know the seriousness of the event (and, indeed, many of the events are not at all serious at the time of the call). Unfortu-
Table B-8.-Nonemergency Dispatching Problem Calls: Breakdown of Types of Cases
I From call1nformaUon II 1_-_- . Totals (112) Appeared to be "sus. ApReared to be II pect·on·scene" (57) "pOSSible crlme"(55) 1-------
_ ~ ____ ~ At arrival: At arrival: II At arrival:
! SUS, SUS· SUS· SUS· SUS· SUS·
I, Take pect pect- Take pect pect'l Take pect pect. Typr. 01 crime report gone on- report gone on· report gono on·
, scene scene scene ----I ----------- ------
~:~a~a-teras;aiiIC: "'"3" ---T :_=:::: ~~::~~ :::::: ::::~: ::::~: ---T :::::2: Sex offense _______ . __ ..• --. 20 7 Burglary ••• ________ • 12 6 2 8 I --'-'- I
~~~~m;,yc:::::::: ~ .. -.~. ::::.:: .---~. :::::: ::::~: ~4 ----j- :::::i Petty thelt __ •• __ •••• 3 3 __ .___ I _____ • • Grand thelt-auto. __ .. ----. ---'" ------ 6 .---.- '--T 6 ------ -----j SlmpleassauIL._._ .. -.• -- ._c ••••• --- .-.- •. '--'-- ---if ----6' I Malicious mlschlef.... 4 4 1 2~ ~ ---'3" 4 4 4 8~ke~owiii:::::::::: ____ ~ _____ ~_ ~ ______ ._____ 1 ______ ______ 9
Total._ • _____ _ -27-1-8 124"2--5 --8 "692320
I Type of crlnle omitted In datJ collected. . -----~ .. ------
··-tH t
r nately, a number of these tend to escalate into more : serious situations such as aggravated assaults. .
These considerations strongly suggest the need fo: modi, fied criteria for emenrency dispatching. Increasmg the number of calls which receive priority ~signment. ~ay tend to degrade slightly the response tIme O? e;nstmg priority assignments. ~evertheless, an exammatlOn. of the false alann rate rapidly leads one to the concluslO? that the number of cases negatively affected by thIS change would be very small, com1?ared to the num~er of cases in which improved effectlVeness of the pohce would result. With our present knowledge of calls [or service, however, it is not possible to sta~e t~e specIfic modifications and criteria that seem to be lnlphed by the results of this study. The criteria for assigning such priority must be developed fr~m a r~se~rch and development program with that specl~c obJective. Such a program is outlined in the last sectIOn.
ARREST AND OTHER TYPES OF CLEARANCE
Tabie B-9lists the types of crimes reflected in this study. Of the total 1,905 crimes, 482 were cleared. by a:re5t or some other means of clearance. Before dlscussmg the specific results, a general discussion o~ case clearance methods may be helpful. If an arrest IS made,. a com· plaint mayor may not eventually be filed agamst the arrestee. If a complaint is not filed, the "other clearance" category in our coding scheme indicates .one of several possible reasons. For exan;ple, the subject rhay ?e a juvenile, in which case speCial procedures are reqUIred: The prosecutor may choose not to file due to the lack oj
sufficient evidence or the victim may refuse to prosecute. Followup investigation i~ a case .may indicate that no crime was actually committed. ~mally, ther~ m~y ~e a variety of other reasons for not filmg a complamt, mClUding the setting of a hearing by the city attorney.
Even if the suspect is not arrested, the case may be cleared in one of the several "other" ways including those. just described or by issuing a warrant for his arrest. .
Arrest may result in several ways. For example, m shoplifting cases, the arrest is frequently made by a se·
Table B-·9.-Breakdown of Types ot Crimes
Type .~umber Percent I
Murder .-.-------.-.- -' ------------- ------------ ------ --- --- 4 N Aggravated assaull.. _______________ .. ________________________ ~1 ;8
~~~:rs;'x::::: =:::: ::: :::::: ::::: =:::::: :::::::::: ::::: ::::: 14 .8
~g~t:g::.'.':::::::::::::::::::::::::::::::::::::::::::::::: ~~~ 3~:! Gr~nd t~hnt. ---------- --- .------- -- ------------ .--------- --- 31~ I!:! h~a~d t~efi.::auiO::::::::::::::::.'::::::.'::::::::::::::::::: 328 17.1 Simple assault. ____ -- ______________________________ • _______ • 6~ 3;1 ~~rl~~~e~: ~y~~~:f~~:::::::::::::::::::::::::::::::::=::::::: m ~! 8~hke~Dwii -j_: :::::: ::: :::::: :::::::: :::::::: ::::: :::: ::: ::::: 34 :.:.:::::::
Total _________________________________________ • _______ ~ lod.~
I Type of crime omitted In data collection. , Percent of identified crimes.
• «
curity officer in a retail establishment who summons patrol officers to take the offender into custody. Arrests may also be made on the scene by the patrol officer following his observations of criminal activity or' perhaps a wanted person or wanted vehicle. Arrests may be made in response to a radio call of either the emerg'ency 01' nonemergency varieties. Occasionally, a patrol officer will make an arrest at the residence of an individual who is wanted for some prior crime.
CLEARANCE DATA
Table R-lO gives a summary breakdown of arrests and other clearance. Of the 482 cleared cases, 336 actual arrests were macle, 304 by patrol. It is seen that patrol officers mab..: greater than 90 percent of all arrests. The remaining.lO percent are made by the detective force, in most cases through followup investigations of a particular crime. Although the detectives actually make vcry few a~rests. themselves, their followup investigations frequently ldentlfy wanted persons who are iater the suoject (If patrol officer arrests. The exact number of these was not specifically collected in the study, but an apprc~mate figure inferred from other collected data indicates that about 25 percent of patrol arrests are of individuals previously named in detective followups. . The breakdown of other ~~earance methods is given 111 table B-ll. About one-tnlrd of these cases involved juveniles where some procedure other than arrest was utilized. Another third involved cases in which either the prose~utor chose not to file the victim refused to . , prosecute, or later investigation indicated no crime was actually involved. The last third contains the other meth-
. ods including city attorney's hearing and issuance of warrants. Initial design of data collection methods for this study did not envision such a large volume of "other" ,"?ethods. As it became evident during the, data collection that the "other" category was too broad, an attempt was made to sample crimes in that category to determine what the general breakdown reflected.' A sample of 20 s~lch cases of other clearance resulted in t.he determinatIon that approximately two-thirds involved city attorney's hearings. and the remainder involved warrants for ~rrest of ~ suspe~t. !r; the sample of 20, only one case !nvolved some dispOSItIonal action other than the hear .. Ing or warrant.
95
Table B-11.-Breakdown of Other Clearance
Other clearance method
Table B-12.-Types of Crimes and Methods of Clearance
Type of crime Icases cleared Cases cl~ared by arrest by olher
met~ods
55 24 42 11 11
I
13 2 7 3,
13
that the "harder" felonious crimes, such as burglary, robbery, and auto theft, tend to be cleared more by arrest; wherc'ls the "softer" crimes, such as simple assault ancl malicious mischief, tend to be cleared by other methods.
In analyzing the characteristics of arrests, two types of clata we~'e collectecl : O,ne on the charge made at the tane of arrest; the second on the location of. the ~lTest. The charge included (a) the case for which tl11S cnme report was made (coded "This DR"); (b) another case 111 a series of crimes committed by an individual (coded 'Other DR this Series") ; ancl (c) another charge, such as a traffic citation, which led to an arrest on the specific ease involved (coded "Other Charge").
. ,!,~e location of ar~est included (a) on-scene; (b) Vlcullty of a current cnme; (c) the residence of the suspect; (d) other locations; ancl (c) unclear.
Table 13-13 gives the breakdown of 304 arrests by patrol and 27 arrests by detectives according to those two addi-
Table B-B.-Breakdown of Arrests
This DR I o'~~rs OJ! I ~~~;:e series
Arrests by patrol
In examining the. breakdow'n of types of crimes in cleared cases, some differences are apparent between arrests ancl other methods of clearance. Table B-12 iIlush'ates these differences for some crimes. It is seen On scene ________ ._ ......... _ ..• __ . ___ ._ ..... _ • 148 ,I 4
Vicinity (current> _______ ...... __ ... ___ ._. ___ •• :~ 51 3 2
3~~11~;;;==:::::::::::::::::~::::::::::::::::::::1 ~~ ~ ~ Table B-lO.-Cleared Cases
Totals Patrol Detective Not shown -----Total (304) .. _~ .• _____ .• __ , ______ • __ ._._ .. __ 281 10 13
On scene. _____ • _. _____ •• ___ . _. _. ____ • _ ••. _. ~. __ Vicinity (current) .. __ .. _._ .... __ .• _ ........... =_. ~rfi~~~~~::.' = :::::::::::::::::::::::::::::::::: ::: Unclear ____ . __ • ___________ '. _. _. ___________ • ____ _
Arrests by Detective
4 1 6 5 1
5 o o 1 2
o o o 2 o -------Total (27). ____ .. _ .••• __ ...... ___ . _____ .... _ 17 8 2
._-----_ ... ~--~-~- .•.. - ..• - .
, ., ;r
I
I

...... i ,
96
tional characteristics. It should be emphasized that the on-scene arrest does not imply that the pat;ol officer caught the suspect in the act. It merely ll1dlcates t?at when the arrest was made the s~spect was at the locatIOn at which the crime was committed.
Relative to this last point, an analysis was made of onscene and vicinity arrests-a total of 223 out of ~e 336 arrests made. Of these, 91 casesJr;volvcd ?~servatlOns by the patrol officer of some SUSpICIOUS activity. The. 91 cases included 25 observations of crimes, 58 observatlOns of individuals under suspicious circumstances, and 8 ob-servations of suspicious vehicles. .
Figure B-3 gives the delay in am:sts from the time the crime is committed. Over one-third of all arrests are made in the first one-half hour. By the time 2 hours have passed, almost hal~ th~ arrests have be.ex; .made. These are of course primarily on-scene or vlcmlty arrests by patrol. Th~ cu;n~lativ~ p~rcenta!Se of arres.ts then retards in slope until 111veStlgative action results 111 additional arrests being made. By the end of the first week, almost two-thirds of all arrests have been'made; 94 percent by 1 month and 98.5 percent by 1 year.
In cases where arrests are made, there are frequently multiple suspects and/or multiple cases involved. Table B-14 gives the figures on number of suspects arrested per case and number of cases cleared per set of arrests, for a sample of 262 arrests. The results indicate an ?ver:ge
Table B-14.-Average Number of Suspects Arrested and Crimes Cleared
-- ........ ~
Number Cases in Average Standard counted sample per case deviation
-------Suspects of! ested ______________________ 396 262 1.51 I O. Crimp.s cleared (DR·s) _____________ .. ____ 722 260 2.77 7.---
of 1.5 suspects arrested per case and 2.8 cases cleared per arrest.
UNNAMED SUSPECTS
One of the most significant characteristics of a casc, affecting its chances of being cleared, is wh~th.e,.. the su~. peet was named in the crime report by th~ Vlctlm. ~o~. ever before we examine the data on thiS characterIStic, som~ explanation of the ambiguities invo!ved is required.
There are really three general categones of cases can. cerning named or unnaI?ed suspects. The .first . c~tc. crory is where the suspect IS actually known to the victim. The second category is where the suspect was not knou;n to the victim, but was arrested in. the pr?Cess .of committing the crime and, therefore, directly Id~nttfied at t~c time the crime report was made. The th~rd. category IS
where the suspect was not known to the VIctim and was
FlnlE '·3. ARREST IELAY TIlE
100
80
VI 70 IVI w ~ 60 ~
o 50
I-
~ 40 u ~ w a.. 30
20
0
r .,
~~ ~
/ ~
/ /
V ,-30 MINUTE.S 2 HOURS 8 HOURS 1 DAY
TIME FOLLOWING CRIME
-----.'.----------~-,~-.-
.", ~
L /
~ ~
-------
'.~"
I WEEK 1 MONTH
,
not apprehended at the scene and, therefore, the crime report did not reflect the suspect's name.
When this research study was first designed, the distinction between the first two categories was not clear. Therefore. instead of collecting information on whether the suspect was known to the victim, we recorded only whether or not the suspect was named in the crime report. In 1,905 cases in which crimes were involved, 349 were coded as "suspect named." About midway through the study, this problem was detected and a special sample was run to evaluate the relative ratio of cases in the first two categories. That special sample included 69 cases. Of these, 33 or almost half were known I to the victim or witness prior to the crime being committed. Of the remaining 36 (about 50 percent), 14 (or 20 percent) were not known to the victim, but were arrested by a retail store security officer or other citizen. The remaining 22 (or 30 percent) were not known to the victim but were arrested at the scene by the patrol officer. These data help to qualify the results given below.
The "suspect named" category, as coded, includes two basic variants-one in which the name was confirmed, and one in which the name was unconfirmed at the time the report was made. The uncoI'firmed name, for example, might be entered if the victim suspects someone but has no evidence. In the "suspect not named" category, there are also two variants. Either the suspect was completely unknown, or some paltial name or nickname was available which was not sufficient to identify him.
Table B-15 summarizes the total number of crimes, both cleared and uncleared, with named and unnamed suspects. Examination of this table shows that over 60 percent of the cleared cases are those in which the 'suspect was named in the crirne report. As we have indicated from our special sample, about half of these were arrests on-scene of unknown suspects.
~ In the uncleared cases we note the high correlation with the unnamed suspect characteristic. Out of a total i,423 uncleared cases, 1,3 75 concerl1f~cl unnamed suspects. In considering the 48 uncleared cases with named suspects, these divide into 23 cases with unconfirmed names, and 25. cases with confirmed names. Of the 23 uncon-
':"~' , firn1cd .nalTIC cases, follo\vuP investigations vverc made in 13 of these. In onlv six cases was the unconfinued name confirmed by the fo"ilowup investigation. In the 25 uncleared cases co~ed as "confirmcd name," only 6 follow-
Table B-15.-Comparison of Clearance in Cases " With Named and Unnamed Suspects
--.-.~, .. ----~~------ --;---,----..---Uncleared I All
cases clearance (1,423) (482)
Cleared by arrest
(336) '-------1---- -____ _ SUspect named:
~~~~~Wr~e(C~::::::::::::::::::::::::::::::: ~~ 29§ :::::::::: Total (349) _____ . ___ • ____ • _______ • ____ ~. ____ --"'48 --30-1 --2-03
Suspect not named: . t===_ ~~~Falle~~Ir,I~~~~~~n---- .. -----.-----------.-- 1,366 168 _________ _
--- ..... ---.----.-------•• -- 9 13 _______ . __ Total(J, 556). __ •• ____________________ . _____ ~ --181--1-33
'0 . .. nt11ltght expect thnt those 29 cases would ha\'c been clcnrcd The discrepancy ~r l}Oss ) y attrihutable to errOrs In coding during (latn collectt~n For example, ~'c1~:::ri~!~ were issued for the 29 SU'pccts, the cn,cs ,hould hnv~ been coded .. ,
97
ups were made, and only 4 of these confirmed the originally named suspect. This means tlUlt of a total of 48 uncleared cases coded as possibly having named suspects, only 29 actually were confirmed:
The impact of the named suspect characteristic can be seen more specifically by examining some particular types of crimes. For example, assault cases tend to be cleared at a much higher rate than most other crimes. This is primarily because a large proportion of assaults involve named suspects. Out of a total of 154 aggravated and simple assaults, 116 (or 75 percent) \~ere named suspect cases. Of the 154 assaults, 123 (or 80 percent) were cleared.
A similar result is seen in rape cases. Out of 14 total cases in this category, 10 were cleared. Nine of the 14 cases involved named suspects. Burglaries, on the other hand, generally involve unnamed suspects. Of the 626 burglaries, only 31 (or 5 percent) had named suspects. This significantly affects the clearance rate. While burglaries represent 34 percent of the total number of cases, they comprise only 15 percent of the total number of cleared cases.
The impact of the named suspect characteristic on clearance of crimes raises a question concerning the response time and arrest data presented previously. In attempting to insure that the named suspect problem did not bias the conclusion about the relationship between response time and arrest, the results were checked. We eliminated the named suspect cases and made calculations similar to those displayed in figure B-2. Although the sample of cases was reduced considerably, the results reinforced the previous conclusions on response time. Of the 34 total cases, 8 arrests were made, 7 of these in cases with 2-minute response time or less.
INVESTIGATIVE PRACTICE AND PRonLj:MS
Table B-16 summarizes the information collected on investigative followup practice. Two intuitive obsClvations about detective activity are supported by the information in this table.
The first observation is that detectives tend to put their energies in cases where th~re is something positive to investigate. Almost two-thirds of their followups in cleared cases were associated with suspects named in the crime report. Furthermore, the followups in the unnamed suspect cases, although an appreciable one-third of the total, include only. a relatively small number of cases that were solved primarily by detective followup investigation. On-scene patrol arrests accounted for the clearance of more than 70 of the 136 unnamed suspect cases.s The followup reports made in those 70 represent only the investigation needed to request filing of a complaint against the suspect in custod>,. This leaves less than 66 out of 363 followups, or less than 20 percent, in which the detective effort was not initiated by knowledge of a specific suspect, either named or in custody.
Of the 1,423 uncleared cases, only 84 followup3 were actually made by detectives,. and the suspect was named in
3 All noted carlier. dUe to dlfTu(,l1ccs in reportinG practice, man)' on'lIr.ana arresh do not result in n nuspec:t beln.: named in the crtmc report.
"

'btmm
", "
,~,,~-, ......... -~'"
98
rable B-16.-1 nvestigative Followup Practice Table B-19.-Followup Methods and Types of Crimes
Cleared Uncleared Seltic\ed types 01 crimes
482 1423 363 84
200 12
i-~~l ~a:~ter-of'ioiiowi;jiiiportsma(fe:::::::::::::::::::: Suspect named In follow up r'lport:
Melhod A&Ilravated Burglary Robbery Peur Grand assault thef thelt-
aulo --------Suspect named In crimi report.----.-••• --. --••• ---.-- 136 6 -
336 18 Unnamed suspect...····_·_·:·_· ___ • __ ··_·_· __ ······_' ____ I.----
Photo: Unique method ... -.. --- 0 0 3 0 0 Tota 1 ••• __ •• _ -••• --. -•••• -.---•• ----•• -••• ----•• -. In comblnatlon ... __ ..... I 2 4 0 I
Modus operandi: Unique metho~ .... -_ .. __ 0 I 0 0 Q
only 18 of these. This does ~ot i~ply necessarily that the detectives work only on cases whlch can be cleared. But it does imply that detectives do not make f?llowup reports when there is nothing to report. To put 1~ another wa">:, the bulk of the 1,423 uncleared cases had httle or:lO ev~dence on which detectives could base a followup mvestl-. gation. . ff
Detectives also appear to allocate thClr e orts according to the value of the case. Table B-17 sho.ws the difference in average property value for cleared and uncleared cases in which property was taken. !t c.an .be seen that the average value in cleared cases IS slgmficantly higher than in .the uncle~red. ones. ~urthermore, the cleared cases havmg detectlve followupo tend to be even higher.4
Tables B-18 and B-19 examine some of the rneth~ds by which suspects are linked with cases in the detective followup reports. As we noted, many such linkings are initiated by on-scene arrests made by patrol officers, rather than as a result of followup investigation
Table B-18 summarizes the total number of unnamed suspect cases in which particular methods were used. These methods include identification of suspects from photos, modus operandi techniques, stolen property,
Table B-17.-Clearance and Property Value
Cleared Uncleared cases cases
--~---'-" ... ------~------I----I----482 1,~~~ 150
$83.944 $328.662 $555 $388
1,954 1.324
Total cases __ •••••••• _ •••• · .. ••·•·•·•·· .. • .... ••· .. • .. • .. Cases with property stolen .................. • ....... • .. ••• Tolal value._ •••••••••• -- "" ............... -- ......... . Average value ........ __ .......... ···•·••••· .. ·•••• .. ·• .. Slandard deviation .............. -- ...... --••••• --- ..... ..
115 61 $75,521 $20.7!8
$651 $338 2,147 705
~~\I~I~/Ultu~~~:::::::::::::::::: :'~:: :::::: :::::::::::::::\ Average value ........ -...... , •• -- .................. -.--. Slandard deviatlon._ .................. · .... •• .. •• .... -···1
.. - -----.-~ ~---. ----'---_..:.--.-
Table B-18.-Methods for Linking Unnamed Sus-pects to Crimes "'"
Mothod used: I Number 01 cases Pholo Idcnlifica!lon. ___ .......... __ •• _ .. _·.· .... • .. •••• ___ .. ·" .. _ .. _ .. • I~
~~~t;e~;!.~~~ ~~ ~~~ ~~ ~ ~ ~ ~~ ~ ~ ~ ~ ~ ~ ~ ~ ~ ~ ~ ~ ~ ~ ~ ~~~ ~ ~~ ~~ ~ ~ ~ ~ ~~~ ~~ ~~ ~~ ~~ ~~~ ~~~~ it Inlerrogation of arreslee .... _._ .................. • .... __ .. ••• .. ··........ 41 Olher I .......... _ •.• _ ................... , ......... --... --........ - .... ---
Tolal cases of suspecl nol named In crime reporl but named In detecllve 34 followup report. •• __ ... , ... _ .... ___ •• _._ ... ___ • __ •• ____ ... ____ • ____ •. _1_
,-.------~.--------
I May use more than one In each case. . . 2 Large prop~rtlon of "olher" are personal Identification by vlcllm or wllness.
'Thai result RIust, however, Un Interpreted e.re[ully; sORln Los Angel •• pol\ei Department detective, divisions rcquirt: B lollawup report in .U cale. w t 1
u es
In comblnation •. __ ... ___ 0 3 0 0 <
Propert~; r.l 5 0 0 2 Un que melhod ... ". ___ • 0 7 7 3 9 In comblnatlon ••• ___ ... _
Weapon: t 0 0 0 0 0 Unique method .,. -.... "
In combinatlon ...... _._. 0 0 0 0 0 Vehicle:
0 I 0 0 I Unique method .... ---.. In comblnation .. -------- 0 6 3 2 13
I nlerrogatlon: 1 8 2 0 3 Unique melhod .... --.-. In combinatlon ... _______ I I 11 6 5 5
Olher: 1 0 Unique melhod ... -.-.... q 3 5 In comblnatlon ... ___ •• __ 6 5 2 3
I Sample size precludes firm conclusions concerning use of weapon Information.
weapons vehicles interrogation of arrestees, and identifi· cation by victims' (incorporated in the "o~her" ca~egory.5 Modus operandi techniques and weapon mfonnatlOn are used in only a few cases.
Table B-19 provides some informatio.n on the use 01 these methods to identify suspects in dlfferent types 01 crimes. The types of crimes selected include aggravated assault, burglary, robbery, petty theft, ar;d. auto t!1eft. These categories demonstrated the most dlstl1;ct correla· tions with followup methods used. The data 111 the table indicate the number of cases in which the method was used uniquely, or in combination w~th others. .
Some conclusions we might tentatlVely draw from .t~IS table are as follows: First, then'. is a tendency to u~lhze combined methods, particularly where property, vehlcl~s, or interrogation are inv.olved. Care must be taken m interpreting these results, however, ?ecause of data col· lection ambiguities. For example, l\l the cases of auto theft many of the "combinations" involved property and vehi~le, but the "property" was actually the vehicle .. Tl~e suspect was arrested because he had the stolen vehicle iU
his possession. . A second tentative conclusion concerns modus operandi
data. These are most often used in combination with other methods, rather than uniquely. Because of the small sample, we should be careful not to con~lude that the technique is confined to ~uq~lary .. Ro~benes, o? the other hand tend to emphaslze Identification and mtero rogation m~thods because the robbery suspect has usually been seen by a victim or witness.
One problem in police work, which is obv~o';ls from the information on the unnamed suspect cases, IS m the area of burglaries and thefts. Of 1,031 cases in this cate~1')'1 937 were unnamed suspect cases. Of the 1,031,626 were burglaries, 70 grand thefts, 311 petty t?efts and 24 were multiple crimes where thefts were also mvolv~d. Arres~ were made in 120 of these cases, 56 of whIch were 0
prollcrly value over a dellignoted amount. $ Sec annex 2, hem 12.
.-
named suspects. As we indicated earlier, half of the named suspect arrests were of individuals unknown to the victims or witnesses. The inevitable conclusion is that the major effective tool against t.he burgla~-theft type of crime is the on-~c~ne arrest, eIther fol!owl11g from a radio call or some fidd observatim't. Followup investigation appears to be ver), ineffective against this type of crime.
In looking for a ray of hope, we did uncover a situation with respect to fingerprints which merits further examination. Of the 626 burglaries, 307 have indications of evidence at the scene of the crime, in 269 of which a technical specialist was actually contacted to come out and view the evidence. When we speak of a technical specialist here we mean primarily, a fingerprint specialist.o
Unfortunately, the existing information in the files does not indicate how often the technical specialist actually visited the scene of the crime. We do know from police officers' comments that the shortage of technical specialist staff limits the number of cases in which they actually visit the scene. Of those 269 cases in which the technical specialist was contacted, 28 cases actually had fingerprint evidence booked. This represents almost 5 percent of all burglaries, or almost 10 percent of those in which evidence seemed to be available at the scene. This is a lower bound because, as indicated above, there are many cases .in which the technical specialist does not actually visit the scene. It can be assumed that some percentage of those have fingerprints that could be used as evidence. Extrapolating this over the total number of burglaries in the city of Los Angeles, a minimum of 2,500 to 3,000 cases per year with fingerprint evidence can be anticipated.
One significant factor in solvinO' crimes is vehicle information. Table B-20 summarizc~ the data on clearance of. cases with good \'ehicle information. Of the 1,905 Crimes, 231 had vehicle descriptions, 94 of which had license data. About 60 percent of these were unnamed suspect cases. Of the 94 total cases, 65 were cleared, 54 by arrests.
This s~ction on investigative practices and problems h~s descnbed some of the existing methods of clearing
,cr~rr,tes. It has also exposed how little we know, in ex:~ pliCit terms, of the effectiveness of present methods. For , example, for the purposes of optimum allocation of de. tective res0';lrc~s, it w.ould be extremely valuable to have som~ quantltatlve estimates of the chances of clearing a particular type of case, given a followup investigation of
Table B-20.-Use of Vehicle Information Total ,cri01es_ .. ~ .. ~.. .. -"~·--~-------,,",-.,....u-1--90-5· V~hlcle Information present'-------··· ........... ------.-- .... -...... ""- ----- , liCente Information present: .. ·--· .. · .... ••• ...... ••• .... --· .. ··---· .. ····.... 231
p~~~~~;:~~:~~~~~~~~~~:~:::~~::~:~~~ ::~::'::::::::::: ~::::::~::::::.::: !~ For cases with Iicen$e Information:
Named suspect cases Unnamed suspect cases':.:::::::: ::::::: :::::::::: :::: :.~::::: :::::::::::
Tolal arresls made ,other clearance ... : :::::::::::::: ::: ::::::::::::: :::: :::::::::::::::::::::::
38 56
54 11
99
a certain level of effort. This study did not attempt to explore that question; however, future research i'n the area shoul~ consider the design of an appropriate statistical expenment to develop information to assist police department commanders in allocating their investigative efforts.
ON-SCENE PATROL ARRESTS
An analysis of patml arrests attests to the importance of the patrol function in dealing with crimes with unknown suspects. Of the 482 cleared cases, 127 were cleared due to an action initiated by some means other than radio call. As shown in table B-21, these 127 clearances included 116 arrests, 86 of which involved actual observations by an officer in the field. Only 5 of these were arrests at the suspect's residence.
Table B-22 lists the type of cases in the 116 nomadio call arrests. One of the most significant aspects of this table is the "other crime" category. This category includes a large number of narcotics offenses for which a specific category was not originally designated in data collection. Referring to table B-9, of the 112 cases in the "other" category, 76 were cleared. Thirty-nine of these resulted from 110nradio call arrests. These represented almost 34 percent of all such arrests. Yet, the "other crime" category represents only 6 percent of all crimes . This result is primarily attributable to the high incidence of ~arcotics violations detected by field officers stopping velucles for traffic violations or other suspicious activity.
The officer dealing with these field observation situations tends to rely considerably on the vehicle and warrant check. Table B-23 indicates the use of this information in those cases in which the officer is making a field observation. He is especially concerned with information about what suspects and vehicles are wanted.
Alarm data, although representing a small percentage of the cases, result in a reasonable probability of arrest by patrol officers. Twenty-eight crime cases in this sample had alarms involved, 19 of which were activated by the suspect, and 5 activated by the victim and 4 unidentified.7 Of the 24 identified alanns, 7 arrests were made, all by patrol. However, where the suspect activated the alarm, only 4· out of 19 arrests were made; whereas where the victim activated the alarm,3 out of 5 arrests were made.
Table B-21.-Breakdown of Direct Observation Arrests
Tolal. __ .... ___ ................ _ ...................... _ ..... ..
127 116 93 7
86 83 3
42 18 5
16 5
86 ~.
'[n Ihe olher 38 CB'e, 'hl Id' ~-~-- .. -------"'-.~- ---... --.--... -..... -~-----.~ ---' ... -'''-'-" .... -present indicating .th d '" f 1 cv cnco at the scenc, evidence rnny hllvQ been 1'These werc real alarms conulIunlcnU"tl to the dispatching center, Fnlse ntarans annc,; 1. m." 0 0 entry, stolcn proJlerty, Rnd other hems listed in were not collccted here.

100
Table 8-22.-Types of Crimes in Nonradio Call Arrests
. b th field officer after he h ... s detem1ined that a CrIme y e . . " ; no operational danger IS mvolved.. \ ' ,
The second operational re.commendatlOn concerns the '. resent allocation of detective r.esou~ces. In most ~e.
~artments the detective is used prIma~lly as a .fo.llow';lp In. Number Percent
--------------- I 0.9
~~l~·2i[(\\\\ll\\:\\\\\\\\:~\\\t\\\\\\\\\\\\\\\\ 1 :1\
t' tor and for many classes of CrImes this IS qUlte.an ves Iga . 't t of actl'vl'ties It is clear from our studlcs, appropna e se .... h h h that in the type of cnmes m WhlC t e .suspect . owekver, n such as burglaries and thefts, the major suc· IS un now , ." h ne arrest I cess in dealing with these cnmes IS m t e on~sce .. , Followup investigation is rarely successful m burglanes!
Grand Iheft-Aulo ......... • ... •••••• ••••••.•••••• 20 k 7 Simple assault.. •••••••••••••• , ••••••••• , ••••••• Worlhless documen!.. ......... ······························: 2 1. 7 MalicioUS mlschlef.. •••••• -••••••••••••••• :::::::::::::::::. 39 ~ Olher ........... •·••••••••••• ......... --.. -ill 100.0
Tolal ••.••••• _.·· •••••.•••••••.••••••••.•• - •••• ·······1
Table 8_23.-Supplementary Information Used in Field Arrests ------:----
1\ Used Query resu s Prior 1-----,.----1 Information
Negative 7 \~osltlveI9 . __ •• __ •• ___
Vehicle license chec~ .... ---.··-·-----"--··· 42 14 ·--··----iS4 Wanl/warranl check .. _ •. _____ ••• _______ ·_·__ •• __ •• ____ _ Wanled suspecl'. ---.---. --••• ---.--.--••••• -.---.--••••
, Includes Ihe 14 pOSitivI< warranl checks.
DISCUSSION OF RESULTS
The results of the foregoing anal~sis im~het\~~s;~~ . 'ficant operational recommendatlOns: W
slgm r' investigation at the cnme scene. e rar~s p\e ~~~~~ery little followup is undert.aken by the d~~;cti~ee force when there is little informatlOn about a
iven crime. Thus the theft and the b~rglafY. te?d to be f no red by the detective unless there IS somethi.ng trr. s~ecific for him to investigate. On~ pro~~em tl~~ :rl~~ cases concerns the patlol officer w~o~ 111 m~ ·mg. t' at
~~~o~~i:e e:!c~~~ed ~~1:~~~:a8~~\~I:~~:aIJlr~e~~;~ I~heck of the neighborhood to ascertai~ if any s~s.p~cts °U~~~= miliar vehicles were observed 111 the vlclmty.
d thefts· yet because of the volume of these cases, de· : ~;ctive res~urc~s are heavily allocated to such ~ollowup . t' t' n Detective forces should thus conSider em· mves Iga 10 • • • I t- t t f ploying more field resources for dealmg Wit 1 tlla ype 0
ca~his tactical detective force must not. be saddled with, the time-consuming, routine ta.sks reqUlred by follow.up . t' t'lon such as processmg pnsoners, answenng 1I1ves Iga , ." ts We hone calls and making field mvestlgatlon repor . ~re not recommending here thaI: we add I?ore resources . to the patrol force which would be responsive t? calls for ; service' rather we are stressing the use of a ta.cocal squad with the speCific respomibility of apprehe.ndmg bu~glad and thieves in the vicinity of the cnme bem~ com~mtt~ '.
Onc final recommendation in the area of mvestlgatmg. crime: We have seen that in a significant number o~ burglaries, latcnt prints ar:e left at th~ scene. In the p~es ent state of the fingerprmt processmg art! latent pnn~ arc more apt to be used in linking a speCific su:p;c~.a .. readv known to the police, than as a J.?eans 0 . n .I~g,
oss(ble suspects for the crime. Certal~ly the mablht) ~o search the entire fingerprint file on a sl.ngle-fing~r bas~ definitel impedes the use of the finger.pnnt as an mvestl'
ative d~vice. The present clearance IS less tha~ 1~ per· ~ent in these unknown suspect cases. Our study mdlcates that at the present time tl;e exi~ter:ce of a l~tent fingh· print search capability might slgmficantly Improv~':'t: clearance rate in burglaries and thefts. Such a capa II. should be developed.
CONCLUSIONS AND RECOMMENDATIONS tun~tc1y due to lack of manpower a~d other _ pre~su.~esi prc1imi~ary investigation at the. scene IS extremely I1ml ec
under presel;t ope:ation~l practtcts: . . ased preliminary In discussll1g thiS reqUlremdent ffO! Ifncrel· e departments
. . t' with comman sta 0 po IC .' ' mVe$tlga Ion l' th t this investigatIve
This section reiterates some of the conclusions rcsl~tin! from analysis of the Los Angc1es Police Depal:tment . a\~ and expands on two particular recommendations fOl fu
it is not unusual to get t 1e reactIOn a ffi . rocedure is already in effect; in fact, th~ 0 ~ers .ale
irained to engage in such preliminary 111VeS~I&atlOn. Nevertheless, the lack of Ipatrolldl?t~np~\;(J tr~SI~~~~~~ use of a field officer for t lat ac 1 Ion . re uir:d at the scene of a crime, over a~d a?ove the time s )~nt in making the crime report. It IS dlfficl~lt to recJmmend additi~nal patrol o~cers because there IS already 1 problem in recruiting quahfied patrol staff. 1 "1 ' One possible soluti~n to this shorta~e is ~o ~mp 0l' CI':1 -ian personnc1 who are especially tramed m lI:vesygat~ve t~chniques but who do not require the operatIOn a trm~. and )hysical capability of the field officer. Tins ~~~ilian in1vestigative force could be called to the scene of
ther research effort.
CONCLUSIONS
Res/lOnsc Time . . d' tchin!
The dC'.ta collected on the response time I~ Ispa aste field units appears to support the hypotheSIS that f, ." response time leads to more arrests. The pres~nt ~11an~~ method of dispatching for emer~en~.y calls StlIl1~a~ 3l 1 to 2 minutes in the commumcatlOns center: \ e fieli additional 3 to 5 minutes field response. . rh I n: response time is minimized __ i! the closest avmlab e u
responds. More automated command and control systems can reduce the overall response time. .
Criteria for Priority Call Assignments
The study of cleared and uncleared crimes related to radio calls indicates a possible area for improvements in crime prevention and case clearance. This would involve higher priority assignment for a selected number of suspect-on-scene or possible cri~e calls not pr~sently given emergency status. A speCific recommendatlOn for research in this area is provided in the next section.
Improving Clearance of Cases with Unnamed Suspects
The data indicate that the clearance rate of cases with unnamed suspects is very low. Of 1,556 crimes in that category, only 181 were cleared. It was noted that few followups were made by detectives in these cases, primarily because of lack of information to initiate any investigation. Furthermore, most of the 181 clearances resulted from on-scene arrests stimulated by radio call or field officer observations.'
Two conclusions about improving clearance of unnamed suspect cases follow. First, more preliminary investigation at the scene is required. Because patrol resources are scarce, a civilian pr~iminary investigative squad is recommended to serve this function.
Second, the reallocation of some followup investigators to a tactical force operating specifically against burglaries and thefts would'" seem to be desirable.
Latent Fingerprint Search Capability
.In an estimated 2,500 burglaries per year in the city of Los Angeles, fingerprints are left at the scene. The prints are not now very useful for finding suspects, although iliey do serve a corroborative function where the suspect is known. A latent fingerprint search capability would provide solutions to some indeterminate proportion of these cases, depending on the availability of an adequately complete base of fingerprint records and the extent to which burglars take countermeasures, such as wearing gloves. If one were to attribute a value to solution of only $400, the average value of property taken, at;td if the police could solve half of these cases by fingerprint search, the benefits of solution would total $.5001000 per year in the city of Los Angeles alone. Considermg all the other metropolitan areas, adequate benefit: should be derived to justify development of a latent prmt system.
RECOMMENDATIONS FOR FURTHER RESEARCH
Methods for Improving Police Effectiveness
~he work described in this appendix could only be~ll1 to explore the characteristics of calls for service, c~nm~s and ~rrests, and the patrol and investigative prac· tlces In deahng with these problems. The research was
101
hampered by the fact that much of the needed information was not available in any accessible form. This is understandable, of course, since the information available in the police department is collected for current operational reasons, rather than to satisfy research objectives. Yet, such research on police cperations is sorely needed.
Police practitioners generally operate on several operational hypotheses about what makes for effective policework. The researchers involved in this study have also developed some h}'pothese~ based on a different orientation to policework. But few of these hypotheses can really be validated with the existing level of infonnation available. Furthermore, many of the crucial operation,11 issues are decided on intuitive grounds which mayor may not reflect the actual situation.
What is needed, therefore, is a fundamental research and analysis program over a several year time period in one or more large metropolitan police departments. This program would attempt to explore in more detail the characteristics of crime, arrests, and field and investigative practices that were just explored in a preliminary manner in this study. Special data collection methods would have to be developed in order to obtain infonuation on field practices without unduly influencing the practices by the fact that observations were being conducted. New methods of recording information specifically for the research studies would have to be employed and there would be some additional collectiqn required on the part of a sample of patrol and detective officers.
This study would have to be of an iterative nature. It would begin with a series of hypotheses based on the results of this study, and for which data would be specifically collected. As analysis is undertaken, new hypotheses would be developed and would also have to be tested and special data collected for those purposes. I t is clear that studies of this kind in various departments are essential if the police are to gain their factually supported understanding of ways to improve effectiveness.
Criteria for Emergency Dispatching
One specific area of research uncovered by this present study is the need to reexamine criteria for priority dispatching. A specific program is recommended with two basic objectives: (a) To evaluate the present priority call assignments and criteria used in making them; and (b) to develop new criteria and test them under operational conditions.
The concept upon which this research is based is shown in figure B-4. All calls for service are represented by the overall square. Within that square is an ovalshaped area representing all crimes. Another smaller oval-shaped area represents events. in progress at the time the call for service is made. This area overlaps with the crune area so that some of the crime calls are events in progress, but the majority of them are "take report" calls for crimes which have already occurred.
The present priority assignment for emergency calls is represented by the circle. Some lloncrime events in progress are included, as well as some calls which are neither
._-----
, .
I
I I' I' I
,.

102 FIGURE 8.4, PRIORIn DISPUCrAlNG CRITERIA
EMERGENCY CALLS
ALL CALLS
ALL CRIMES
ALL EVENTS IN PROGRESS
DESIRED PRIORITY?
C\:.{3 Crimes in Progress ~ Present Emergency Calls Criteria
~ Crimes in Progress ~ Present Nanemergency Call Criteria
crimes nor events in progress. The "emergency calls" also include some crimes which have actually been completed at the time the call is received in the commllllirations
center. Some events in progress arc not actually considered potential crimes requiring rapid response at the time the call is received. This occurs for two reasons. In some cases, between the time the call is received and the officer's arrival at the scene, the situation ha~ escalated to the point where a crime has occurred. In other cases, the infonnation received by telephone is just not sufficient to make an accurate judgment. Obviously, if the communications center knew which calls fit into which categories in advance, it could make perfect priority assignment. The problem, of course, is that from the standpoint of the communications center, the situation in the field is not always clear.
'!t t:>~ [ .t
(2) Determine how many cases are actually events \ !
in progress; : (3) Evaluate what proportion of these escalat~ I
into crimes which would be preventable by rapid I response; I
( 4) Evaluate what proportion are presently con· sider cd priority calls; and
(5) Determine the distinguishing characteristicl !
of these escalatable events as seen from the com· ; munications center.
Having completed these steps, it would then be possible to develop and test new sets of criteria and see if they improve performance. A necessary requirement to ac· complish this type of evaluation and testing is an audit of the present results of dispatching. This audit requires an evaluation of response time from receipt of a call to arrival at the scene, and a careful evaluation of the results of the field activity: ''''hether it involved preven· tive action, arrest or other clearance methods. Once the, data collection techniques for such an audit are designed, they should be used to compare the present criteria and any new criteria that may be developed.
Specific tasks required for this research program in· clude the following. It will first be necessary to monitor calls for service, preferably through recordings, to develop, .a taxonomy of characteristics which can be used for meso sage content analysis. Patrol responses to calls would also be studied in a balanced sample in order to construel a similar taxonomy for those activities.
The next task would be to sample a new set of incom· ing calls and follow them through to activities in the field. For this, it would be necessary [or the patrol officel to make careful recording of his receipt of call and arrival times. This could be simplified by the use of dictation
equipment. After this information is collected \I:e would then be in
a position to collate the communications characteristiCl with the field situations. The present priority call assign· ment criteria could then be analyzed and evaluated anI
At the present time there is a series of criteria which are used to assign priority to a call. The present study indicates that this priority may possibly be improved. To do this, we must evaluate the existing criteria in terms of actual cases. The steps required are:
(1) Determine the distinguishing characteristics of events in progress, as viewed from the communi-
the results of field activity evaluated as well. We \\'ouln then be in a position to design a new set of dispatchin! criteda and test these criteria under operational condi· tions with the same methods used to test the present s)'\'
tem. This would lead to an evaluation of the neweri
, teria. At this point we would probably want to itera\( on our design concepts and test once more before makin! the final recommendations.
cations center;
---------,--------------------------------------
ANNEX 1: CODING FORM FOR LOS ANGELES
COMMUNICATIONS AND DAILY FIELD ACTIVITY REPORT DATA
DIVISION: ..
TYl'E OF TICKET
TY?E OF CALL
I DAY OF MONTH (i-31) ..
(Oi Blue/code 2
~l Blue/code 3 2 White 3 White/code 3
(0) Suspect on scene (1) Suspect justlert (2) Take report (3) Possible crime
I SEQUENCE ••
TIMES: ORIGINATED ...... : ..... \ DISPATCHED •• - •• ' : ......
UNIT ASSIGNMENTS (0) Single time stamp (I) Multiple stamping (2) Gode 1 (3) Quotes delay
Column
l-6
9-13 14-l8
19
::;:::::::::::=--::::-:--_____ (4) Not available DIFFERENT UNIT ASSIGNED -:~;;;:O):-:I:;-'IO-----' ----,--- .
I) ,(es-by communication 2) Yes-unit request to handle
20
TII~ES : FIRST R:~!,.~~SE ...... : r CLE,~RED ...... : ...... TY?E OF RESPONSE
CRIME REPORTED
(0) Code 4 (I) Code 6 (2) Request further information
~3) Broadcast Information 4) other request 5) Clear
(0) No (I) Yes-radio call
:;;;;;-;;:-;-::7.':':-:-____ ~(::2)1 Yes-othel-TIMING OF ARRIVAL ----(O~ Suspect on scene ----
DRI .:-:-:-------
RES,?ONSE TO CITIZEN
OBSERVED BY UN IT
WIlAT OBSERVED
LICEIISE CHECK
WARRANT/WANT CHECK
WANTED SUSPECT
WANTED VEHICLE
TIME!) FROM DAILY FiElD ACliVITY REPORT'
BEGIN .' ........................
(1 Suspect GOII (2 Take report.only
~O) No o~ Not shown (2 Victim (;3 Witness
2) From vehicle !~~ ~~t shown
3) Out of vehicle 4) On foot
~O~ Crime 1 Suspect 2 Vehide
~~~ ~~t shown (2) Yes-Negative (3) Yes Positive
(0) No (I) Not shown (2) Yes-Negative (3) Yes-Posltivo
~Ol No 1 Not shown 2 Current crime 3 Previous crime
10I No 1 Not shown 2 Yes-license 3 Yes-Identifiers 4) Yes-both
END ............ .
21-25 26-30
31
,-3i 33
34
35
36
'--3-7
38
39
40
41-45 46-50
.~_D __ _
103
POLICE DEPARTMENT APPREHENSION STUDY
CRI M'E, FOLLOW-UP REPORT, ARREST DATA DATE AND TIME OF PRIOR CRIfl'E:
ARREST MADE
CHARGE
WHERE
DATE OF ARREST
TIME OF ARREST
PRIOR INFORMATION
SOURCE OF INFORMATION
TYPE OF CRIME
Column
~O~ No 1 I By patrol I 2 By detactive I'
SI
(3) Not shown I
(0) This DR _~~11 ____ _ (I) Other DR this series 52 (2) Other cha rgo I ~~~) ~rci~W;(CUrrenl) .~~---- -"--53 (2 Residence (3 Other (4 Unclear
(0) No (I) Not shown
«32) Specific premises ) Goneral area
(0) Not shown
«(1) Department briefings
(23» Clommunications
nfOlmer
~oI'~;Urijer' ......
~21 Aggravated assault
Rape 3 Other sex oHense 4) Burglary
(5) Robbery (6) \lrand theft
8) GTA ~7) Pelly theft
9) Simple assault (10) Worthless document
54-59
67-72
«(11) Malicious mischief
1lF~n;~~~~~ ____ ~12~)~0~th~er~ FORCE OF FEAR INVOLVED (0) No --------1 (I) Yes 1---73
(1 Yes-uninjured -:---74 VICTIM ASSAULTED PHYSICALLY (01 No i
(2 Injured (3 Fatal 1
SUSPECT WEAPON INVOLVED (0) No (I) Yes-unseen (2) Yes seen
1---'-75
- ______ 1_-TYPE OF WEAPON (0) Hand gun !
4 Bluntlnstrument II) Other gun 2) Knife 3~ Other sharp Instrument
~~~~~~~~ ____ ~5~Ot~h~er PHYSICAL FORCE INVOLVED (0) No
(I) Yes
SPECIFIC THREAT INVOLVED
~(~~ ~~s-ViCtim- - -----~-- -
2) Vicllm's family 3) Other
--------------- ------~
76
77
78 II)
i

104
ATTEMPT TO TAKE PROPERTY
Keypunch Ident Number +9
~O) No I) Successful 2) Unsuccessful
------EPO-RTED (6 figures 10 nearest dollar) DOLLAR VALUE R ____ , __
- (0) On per.cn TRANSPORTABLr. (1) Carry
CHARACTER OF ITEM
(2) Supporl need~d
~o~ Negotiable I fenceable
Column -~1-~7
9· 14
15
16 2 Possible po.rsonel use
(0) No -----17 CRIME INSIDE BUILDING
TYPE Of BUILDING
- TYPE OF RESIDENCE
(I) Yes
(0) Residence (I) Nonresidence
2 Hotel·molel
IB
19
f
Ol Single family I Apartment
3 Ga rage or shed -------::~-i::;------- --20 ----- DE~CE (0) Market
TYPE OF NONRESI " !I) LIquor ~toro
ACCESS TO CRIME SCENE
ENTRY METHOD IF ILLEGAL
OCCUPIED AT TIME OF CRIME
PREMISES ALARMED
- HOW ACTIVATED
- HOW SERVICED
CRIME IN STREET
CRIME IN VEHICLE
TYPE OF VEHICLE
2) Other retail 3) Servlr.e station , 4) Financlallnstitu!lon
~5 Nonretail commercial 7 Hotel·motel 8 Bar·cafo
5! Bus!ness office •
(9 Othler ______ _
lO) Bull'dlne secure I 2! I~ Open access area 2 Open building, secure room 3 Open access to room C __
(°1 Force I _22 {I Uninvited 2 Subterfuge 3 Key
(0) No . (I) Ves-aware of clime (2) Yes-unaware
(0) No (I) Nol shown (2) Audible (3) Silent
(O~ By o~cupant
~I By suspect 2 Deactivated by suspect 3 Not actlva ted
fo~ By compa ny I By police 2 By victim
!Ol No I Public street Z Alloy 3 Private grounds 4 Publicly accessible area 5 Other
I Commercial , to~ Suspect's
2 Common carner 3 Victim-persona I
23
24
25
26
27
2B
29
ATTEMPt TO SEXUALLY ASSAULT~ (YI ~~s-unsuccessful VICTIM 2 Successful
3 Possible Intent
30
~P~R~t~~~:/_E_LA~T~IO~~=S~H~IP~W~I~TH~SU~S~-~~~~~~i.~~ __ -------------11 :: - INITIAL CONTACT WITH VICTIM'S (~) ~~s
CONSENT ( ) __ I ACT WITH VICTIM'S CONSENT ~~~ ~~e under 14 I
(2) Age 14 to 18
33
--------_.
Column
VICTIM CAPABLE OF CONSENT (O~ No-unconscious 34 (I No-but conscious I ~~) ::s ----35 (I) Ves
(0) No ------1--36
ABERRANT SEX ACT
OTHER SEXUAL OFfENSE
2) 288A " 3) 311 !1).2BB I
4) 647 I ___ -=~-------~5~)~D;th~er-------------I----31
(0) No •• SUSPECT SEEN (I) By victim (2) By witness ,
____ ~~-------~(~3)~B~ot~h------------I----38
(0) No . SUSPf.CT NAMED (1) Yes-unconfirmed (2) Yes-confirmed I
__ ~(3::)...:.P:.:ar.:.:tia:.:l..::or:...:n:...:ic:...:kn_a_m_e _______ _
SUSPECT DESCRIBED (0) No I 39 (I) Yes _________ . __ _
------------~~~- ~ m ~~s SEX
'RACE
AGE
HEIGHT
WEIGHT
HAIR
(0) No (1) Ves
(0) No (I) Yes
41
!1
--'~1-41
-----r-4l (0) No I (I) Ves ---41 ---(O-)-N:-o-(I) Yes
------(O:-)N:-o-- 1---46 (1) Yes 1 ___ _
FYES
--------------;(;;:O)-~N;;:-o-- I U C OMPLEXlllN ) V I
(l es ---I 41 --C-LO-T-H-IN-r.-----------~~~~N~:~------
~--·-:_:::_:::7---~~~--------1 (! MANNER Of SPEECH m ~~ ____ I __ ij '-M-AR-K-SI-SC:-A~RS~--------;,(O")NN~o-- I
(I) Ves ___ _ ·----~:-:-------;;;(O~) No I II OTHER IDENTIFIERS Y
_____ :--:7=-:::::-:::;;;:;-_-;,(I;;-)-;;;;-es ------ -r-----si . PHYSICAL EVIDENCE REPORTED ~~~ ~~s-none booked I
2) Yes-booked , __
TECHN ICAl SPECIALIST CONTACTED--
PRINTS AT SCENE
EVIDENCE OF ENTRY
EVIDENCE OF WEAPONS
(0) No (I) Yes
(0) No (I) Yes
(0) No (I) Yes
--I II
-------~
------~
~~~ ~~s-baillstics i 2 Yes-no ballistics 1--
-----:::::~::::-::;;;;;;-~;-;;;(O~~ N;';o--- ------, S' . EVIDENCE OF STOLEN PROPERTV
----:::~:::---·---fr(li\NYi;;es-- _______ -I_~ OTHER EVIDENCE (0) No :
______ ~(:::I):-Y-;:e:-s_- ______ !_~
~O~ No " VEHICLE USED BY SUSPECT I Yes (not sQlely OTA) 2 Vlcllm'~ vehicle ______ ,_--;;
------------~~-VEHIC~E SEEN m ~~s, ____ , _____
-~~---
•
Column
LICENSE $N Q~s M Partial
61
-------------------(0) No (I) Yes
MAKE 52
----;,;-oon----·,-(O) No
(I) Yes 63
STOLEN ,PROPERTY
---------------WEAPON
VEHICLE
(0) No (I) Yes
(0) No (1) Yes
105
--~--I;;;
-------1-----71
----~~---- --..... 72 -------__ ~'r_~ _. __ ~-.-...
------~-----------------~ YEAR m ~~s
(0) No (1) Yes
INTERROGATION OF ARRESTEE (0) No (I) Yes
73
--.. ---- ---74' COLOR ----------------ss m ~~s OTHER (0) No
(I) Yes --.--~~--..-.-.-- ---------
75 ._------------_. SPECIAL IDENTIFIERS (0) No
(I) Yes 66 CLEARED BY ARRlST~--- ~f? ~~s-~--·----~- -----:;6
67 FOi:i:OWuP REPORT'-M-AD-E----(O) No
(I) Yes -------:-~-:-:::::::------,-----------SUSPECT NAMED IN FOLLOWUp (0) No 6B
INVESTIGATiON (1) Yes • (2) Yes--method not shown (3) YeS-different from C.R. ---------------(0) No (I) Yes
BY PHOTO IDENTIFICATION 69
-----------,--70
MODUS OPERANDI (0) No ____ \(I:!.)...:.Y.::es'--_________ ~.~
(2) Yes-other OTHER CLEARAN~-----~-OJ-;-------- -'---77
I Ju~enile 2 Prosecutor chooses not tv tile
~3 Victim refuses 4) No crime 5) Other
-N-UM-B-E-R-O-F-S-US-P-EC--T-S-A-R-RE-S-TE-D---------- ---78 NUMBER Of DR'S CLEARED ---~--.-.-- ---79:80
ANNEX 2: DEFINITIONS, MEANINGS, AND CATEGORIZATIONS
1. If no actual arrest was made, the case was not coded as cleared by arrest, even if the investiguto\"S followup listed the case as cleared by arrest. In those cases, the "other clearance" ba.\: was checked by our data collectors. This was especially important in cases where a warrant was issued but the arrest had not been actually consummated at the time of our study.
2. Some followups were found in the file which did not ~ indicate any actual investigative action by the detective, but merely reported supplemental information provided by the victimj e.g., adding a serial number for a stolen television, Or providing a list of additional property stolen and its value. In those cases the officers were instructed to ignore that followup report, thus limiting the folJowup report category to actual investigative action taken.
3. It was established that the department's policy was automatical.ly to file. for a complaint whenever a misclemeal10r arrest was made. Hence, a misdemeanor arrest always resulted in a "yes-filing" category in the clearedby-arrest item.
commodated by keeping the "other clearances" separate from the arrests,
5. In theft from automobile the clollal' value of the property was often missing in the crime report, We established the policy that the coding officer would estimate that value.
6. Grand theft-Auto was not coded as a crime in vehicle nor a crime in the street. It was coded as an attempt to take property j however, the dollar value was omitted. Burglary Or theft [rom an automobile was coded as crime in vehicle.
7. Even in cases where no crime was reported, the officers attempted to fill in the category "timing of arrival," indicating whether, when the field officer arrived, the suspect was on the scene, etc.
8. Worthless document or fz'aud were not coded as attempts to take property. Howcver, some errors in coding this category are expected.
'L Where 110 arrest was made, no case was actually COunted as cleared in the "No, of DR's cleared" item, even though there may have been some other method of clearance. Discrepancies in counting can be better ac-
9. It was noted that grand theft in California is usually of property with value greatcr than $200. Some cases, however, may involve less than that amount, pal,ticularly if guns, citrus fruit, or certain animals are stolen.
,'i

I;
1\1 ; !
~ \\
II Ij
106
10 In considering the source of pri?r informa!ion, t~~ .' '" f rmer" was used to desIgnate a \\ltness
category In?fi . former for the police department. well as a spec! lC In
If a sus ect was named in the c:im~ rel?ort but was 11. d . Pth followup the implIcatIOn IS that there not name In e, l'
'd nce to connect thaI: suspect to t 1e cnme. was no eVl e.
12. In examining the method. ~f naming the suspect i~ the followup investigati?n, pro\'lslon w~ made fO:d~~ti~_ '1 I fi adon as a spectfic category. owever, 1 d 1 ~a~~;~ ilirough obsP.lvation by victim or witn~s~ wa:t~~o~ as ':other" because of th::. Jack of an appfoprm e c .'
ACKNOWLEDGMENT
. kid e the support of the Los The author WIshes to ae. now e .g his stud' possible The
An~c1es Pollcchl?fPT~ment Redd~I~~dt Deput/Chief~ Edward aSSIstance 0 Qle omasd Roger Murdoch was crucIal to the Davis, Noel Me ~own, an. o· eet Lt Richard Long and his successful comp!etlOn. of tthlS ~~d civilia~s spent many hours colsta~ of offi~erfs, IDvtc.sttga o;~, whieh these analyses are based; their lectmg the Jll orma Ion up . d assistan;,;e is gratef~~I~. ack~~\~1~~~biectives, research methods,
Signific~nt contrl u IOns William W. Herrmann. Dr. Alfred and ana!ysls weSC mt~e by ~;d other members of the Task force BlUP1stCII), Dr. au. ass, fi th approach. Tom Celt and staff helped to cIlaDrJAfy and.dred nc~mpCllter programing assistance Vera Wilson of prOVl e in the analysis.
Apper:dix C
FINGERPRINT OLASSIFIOATION by Thomas C. Bartee
------.-~-----------.-~--~-
Contents
The Problems . . . , . . . . . . . . Recommendations. . . . , . . , . . . Discussion of Recommendations . . , . . . The Fingerprint Classification Techniques Study
107 109 109 111
THE PROBLEMS tem has been subsequently modified to meet particular demands but remains the? fundamental technique for fin-
The uniqueness of fingerprints as a method of identi- gerprint classification. fication has led to their widespread use and to large coHec- The Henry system is that primarily used by the FBI. tions of fingerprints being stored at city, State, and na- New York State, for instance, uses what is called' the tional levels. This considerable use of fingerprints for American system 1 which differs only in detail from the identification has led to several problems in maintaining Henry system. In any fingerprint system, whether manand searching the large files. Also, the pres(mt systems ual, semiautomatic, or'automatic, the classification system have a b(lsic limitation of not being able tl) locate a is of primary importance, for it is the classification syssuspect on the basis of fingerprints left at a (:rime from tem which determines the extent and the efficiency of the any but a small subset of the total prints now on recOlrd. search process.
As an example of the magnitude of the present problem, The most significant aspect of the present search pro-let us consider the largest single collection of fingerprints c('dures lies in the farl that one must have 10 ordered now in existence, which is maintained by the FBI in fingerprints in order to use the present classification sysWashington, D.C. The FBI files now contain about 16 tem. This is to say that in order to enter the files, using million sets of different criminal prints plus about 62 mil- the classification formula now in use, one must have a lion different Civil Service and Armed Forces prints. full set of 10 fingers. An immediate drawback to this Many persons have seveml sets of fingerprints in these system can be readily seen. When fingerprints are infiles so that the total number of fingerprint cards now in .advertently left by a criminal at a crime, only one or perthe files exce~ds 179 million. Each day the FBI receives haps several prints may be available to law enforcement about 30,000 sets of fingerprints to be processed, of which officers. Using the present system, there is, therefore, no approximately 10,000 sets are based on arrest. Most means of directly entt't:ing the files to ,earch for prints of the remaining prints [elate to national security, being of this type. In order to get around this problem, some tlsrd for identification of Government employees and for city, State, and Federal agencies have, in addition to their c,heckin~ ~o sec if persons who will be employed in secu~ large files, small file~ called "latent files" classifed so that I'lty posltlOns have a.rrest recofcls. The FBI employs it is possible to search them on a finger-by-finger basis. about 1,100 personncl to process these daily demands for The mechanics of this search arc of course different from id?ntification, add new prints to the file and delete old that of the lO-fingel' search and the actual categorization prmts. of latent prints depends a great deal upon the ability of
qivcn a set of fingerprints which are to be searched certain fingerprint experts both to work \dth and extrapag~mst the criminal file to see if the person owning the olate data from the latent prints (which are liable to prmts has a prior criminal record, some system is needed be quite poor) and to manipulate the latent print files. \\:hcre~y the total number of cards to be examined by As a result, latent print files tend to be very small, genYlsual tnspection can be limited to relatively few. This erally containing only a few thousand prints. For both IS t!lC problem of fingerprint classification. The system Federal and State agencies, the latent print files will conwhlc? has been and is most used was basically set down tain only the fingerprints of criminals who are particuby SIr Edward Richard Henry in about 1903. This SYS- larly likely to be involved. in certain kinds of crimes} and
------------------ '\----r' ~Anterlcnn Syatem of Fingerprint Clas.lficatlon." New York State Dcpartmcnl o orrectlon, Dlvlelon of Identlficatlon, Albany, N.Y" 1963.
107
\>. , I
108
prints are added to these files as a result of experience on the part of the law enforcement officers involved.
for both State and Federal agencies. Several of these
It should be noted that very little statistical data of substance concerning the usc of latent prints ap-pears to be presently available.2 As a result, latent prints are not widely used in attempting to identify criminals and are more widely used to confilID identification or to eliminate suspects. In each of these c~ses, the compari-son can be made directly from the prints of suspects rather than by searching a file.
Probably the most significant contribution which could be made in the fingerp~inting s-.:ience would be that of giving to law enforcement agencies the ability to search fingerprint files for latent prints. It is difficult to estimate the magnitude of this contribution for we have no statistics on what the yield would be in ternlS of total number of crimes solved each year nor in terms of the amount of effort on the part of law enforcement agencies which would be saved due to use of fingerprint information for identification rather than other techniques. One difficulty in making such an estimate is the fact that law enforcement agclncies are aware of the deficiencies of the present system, and as a result rarely attempt to make iden.tification by means of latent prints. As an estimate of complexity 'Of this problem, let us note that the latent print files only range from about 1,000 to 30,000 individuals for the Jarger identification agencies while their main fingerprint files generally number in the millions.
Secondary advantages primarily would involve more efficient processing of fingerprint cards in terms of, (!COnomics and total number of people involved. Also, if fingerpr;nt files were automated in an adequate manner, it might be possible to expand the size of the files which
are:
are maintained and searched. Some explanation of the 'latter statement is perhaps in
order. Let us again use the FBI files as' an. example. When a defense agency or a government contractor sends a fingerprint card to the FBI for security clearance, the prints on this card are searched against the arrest file. If the person involved has not committed a criminal offense, this is recorded and the fingerprint card is returned to the submitting agency. Fingerprint cards from defense contractors are not maintained in the FBI file, but are simply processed and returned to the contributing agency. This is done in order to keep the files
to a reasonable size. It is clear that in order to handle latent prints, a dif-
ferent classification system must be used for entering the files. However, because of the magnitude of the search procedure, regardless of the classification technique used, it appears that some degree of automatic search would be necessary. This means that to handle latent fingerprints with large files, it will be necessary to use digital data processing equipment at least to aid in the search. The question then arises as to the degree of automaticity which sh0uld be implemented.
(1) Completely Automatic Systems.-These are systems which would scan fingerprint cards automatically, classify them using a general purpose digital computer, search a file of prints, locating and finally correlating a card in the file being searched with the incoming fingerprints. Such a system would automatically process cards without human inter-
vention. (2) Semiautomatic System.-The process of pat-
tern recognition and classification using electronic scanners could be supplemented by human intervention, that is, by using trained technicians to scan the prints either in their present form or by means' of some pictorial display, classify the gross patterns, locate such critical points as the core and delta of a print, and identify such minutiae as islands, short ridges, bifurcations, and other fiingerprint details which are useful in classifying particular prints. The system might be automatic from that point or might ask for further participation by an operator in case the computer located a number of cards and was not able uniquely to select the proper match from among these cards. Trained technicians could then scan the cards selected by the computer.
(3) ComjJuter-Aided Search.-This type of system is the only one which has been used to date. Humans perform the entire classification process and also enter any pertinent facts, such as age or sex, on the cards. The computer is used to fa.cilitate the search of the files for cards of specified classification and to deliver candidate cards to the operator for manual search. The primary function of the computer is bookkeeping, which it accomplishes by making records neater and simpler, by sh:ortening and making more efficient the process of searching the files. Fingerprint experts are needed for both the classification and final comparisons.
t
I : I a f i'"
The relative success of ariy of these systems is contin- I. ' gent upon the efficacy of the classification system. In I order to automate a system satisfactorily, one must not \ only know the general details of what must be done, but I· the algorithms which are used for searching and classi- I'
fying must be well defined before the system can be satis- . [actorily put into operation. It is therefore necessary to \ investigate further the present classification system both t with a viewpoint toward implementation for the 10- \ finger system and with a viewpoint toward extending I the ability to recover latent prints. i
Since several books have been written describing the \ present classification system and details have been pub- i lished in several reports, it will be our purpose here only 1 to comment briefly upon the use of the Henry system with: its modifications in locating prints in the 10-finger file and on the use of a system of this type in attempting to . locate latent prints in a large file.
In short, the present day systems u£e information con· There are severai levels, at which computer systems
might be used in automating the present fingerprint files cerning left or right hand, fing~r positions, basic finger- ,
•• New York City h •• heen doing some Inlere.ting work on fi~ng.rprlnt9 in~l~~j. ~. "Yicl" on workahle prlnlo: which .ccm. remarltRbly high compared 10 othcr7cp.;il.
ln~ th!' U!le or n 8ubstnntlo.l latent llrint file. Their data indicate nn 8 percent
7
109
print patterns such as loop whorl a d h "d h ' ,n arc and finally l~ECOMM 1"1 ge count or w or! tracing The class'fi t" f ,'- . ENDATIONS
h. 'h . d I . I ca Ion ormllia
W I... IS use to ocate fingerprints fallin' '. category is derived from codification of gth
lP ~ PfartIcu,Iar . t 1 h . f IS m ormatIOn 111 dO a p ahnumenc orm. _ In order to facilitate the filinO' an searc process, the tormula is se ented in P mar)" secondary, subsecondary final angmd -t . to PrI-b t th b
· "ex enSlOn parts .u ~se are suo servient to the principal formula Add.'
tlOnal mformatIon such a!; sex and a' . . I-t
. h "ge IS sometimes used o nanow t e search. Despitp the k th 1 d th 1 " wor at las been one, e arge number of prints on file causes thO
tem to locate not specific cards but rath I IS syscards in the file. ,er arge sets of
As an example of the problems which on fi d a specific classification system is used t .e ? s when search, about 65 percent of all fingerprint~ ~~PI~:ent ~ a~out!O Pfiercent o~ all fingerprints are ulnar'loops ;~ :h~~t W len e. rst step m the Henry procedure is follo~ved ' find that III the single classification of 10 1 ' we both h~nds, approximately 800,000 of theUl~ar !~?pS on rest prmts now on file fall i t ml IOn ar-. 5 n 0 one category and this ~0111~flSes percent of the total file. This sho Id . It eVIdent that knowledge of the t t' t' u m~ke patt~rns is necessary in addition to ;e~~~;ft of ~n~erpnnt cermng the patterns in order for a fir now e ge concient and t I' d' Il1g system to be cffi. ..' I s rOl;g y I.n !cates that statistical studies of Implovec claSSificatIOn system t b I any a system co:rld be safely implem~:~~d. e mac e before such
Concernmg laten" prints th bl ?own the search bec·ome:; fdr m~rf~ffieml off nall'rowin
g I . d .1 ICU t, or ess data J p~esent~ to the system user and a great deal of re.u~ ant ata must be contained in the file in order to !~~:~h ~:ent~:arch hsufficil~ntly for sets of latent prints
m per aps one or two fj')O'ers A of the severity of tl . bl - '" . s an example fication .lIS pro em, a New York State Identi-. ' and Intelh?ence System Report 3 indicat h
~~~~~h ~~v~r:~g~~~~~: .b~th on tdhe. right hand, e~n: ~t; a rid e co _ x nger an IS an ulnar loop with fing ~ . ~nt of nme, and the other from the right middle 1 ~;I:Vlt an ulnar loop with a ridge count of 12 a list of
1111 Ion cards would produc 45000 d"
be ~I~~n:~~~r il~~~o~:~~~a~i?~I:~tr~~i~ ~!~:rch i;ho~ld ~~Ul.pI?~nt dto. proces~ fingerprint data. A stu~;~~~~~~ Thi~n~~~~e Immediately .on class.ification techniques. distributi!n sht~ld ~at~er 1l1fOnn~tlOn on the statistical
t:ria now. b~ng ~~~~rd~~~/cc~~~nS~U~y t~~o~ft~~~e~~t-gat? ~~le dl~tnb.utlOns within categories (for instance th~ r;na IOns It; ndge counts from core to delta for l:lnar r ':f1'b Uldtimately, a search procedure should be estab-IS ease on the data gathered C I' nique~.for searchinfS the files should 'also ~:~~~~ti ~~~~~ or~~~iculad' expenmc.ntal work .should support th~ theb . stu les. For mst-ance, smce actual statistics will
e treq~ur~~ on. fingerpri~1t characteristics in order to evalua c c ass I cation techl11ques, a small model of an actual system should be put in operation in order to obtain th nec~ss.ary d~ta. These data would also provide 0 era tin e statistiCS which would aid ill the desl'gn f th P g W' I 0 e system. . It 1. th.e cooperation of law enforcement a en
Cles, the gams to be accrued from an abilit to effici!ntl s~ar~h large files of fingerprintl: should be a!sessed F y } e ata collected, estimates should be developed' of ro~ b"lctors ashthe nu~ber of additional criminals that ~i~h~
e .appre ended If latent prints were used savin s . poh~e effort which would result, benefits 'Or' a n g m matic lO-finger system, etc. onauto-• Th~ studies. should be coordinated with State and F~d~I~1 ahg~nCles. Several State agencies have initiated \~or 111 t IS area, tl~e FBI has collected some ro osals and sev~ral compames have invested modest ~o!nts of mo~~y In. researc~ efforts. The present level of SUD~Olt IS almost certamly below a critical threshold so adcli~I~nal Government support should be committ~d The plOblem of State and Federal support and the ~ole of local and Federal agencies also needs to be reconciled.
DISCUSSION OF RECOMMENDATIONS based on thO . f . e, can Idate prints middle fi ,IS m ormatlOn ~Ione. Further, if only the right nger were obtamed 370000 - t Id t ~url major recom~endation indicates that computer selected from a file of 1 million~ , pnn s wou be s~lnc no ogybl can alleViate the present fingerprint process-
In order, therefor t' I . g pro em There are a f h . . p,"oodure 0, 0 ,~p omont a latont p,int ,oa«h , d· . ow 0 _moton,t", of tho which' ,we must have mformation in addition to that f opose system which bear examination at this p . t
IS commonly s d' h H ~h~ppeabrsl that an ini.tial system must be semiautom~lt~c: nately, such informa~ e . m t.e enry system. Fortu- . pro em of readmg from fingerprint cards or films of what are called th lOt; IS ~vallable in prints, consistin~ usmg p~esent day techniques and then categorizin the ridge endi d' e mmutme: The bifurcations, island~ ~~gerpnb~I' com
f pletely automatically probably ex~eeds
tions of ngs, h 1V~1ences, and the positions and orienta~ . e. capa I Ity 0 our present technology Pattern oth". Su:~o a o~ go feature, in relation to eaoh ~'t>On ..,.. boen _ diffio~lt fiold and th~ typo of p=~
t bl' h' tegonzatlOn would depend tl lecogmtlOn called for m processl'n fi . d . es a IS ment of' ' upon Ie particularly difficult Wh'l h g ngerprmt ata IS
upon the' a coordmate system probably based "fi ' . let e computer may be of . core and del>a of each fi . l' slgm cant assistance in locating I'oints maki
sibility of impleme t' .. ngerpnnt. ,he pos- ments or f' Tt t' h . J , ng measureseems quite ho f n
l
mg a .Ia:ge file using data of this sort 't d' aCl I a mg t . e aSSigning of descriptors to prints in this area b pe u
d
and It IS recommended that studies I oef no It appear f~aslble at this time to make the syste~ , e un ertak th" comp ete y automatic.
4
sections g' en at IS time. The followinO' A' . 1ve a more detailed plan of attack. '" sermautomatIc system has a great many advanta ,.' ""'''''' ,." , D - ~There am no immodiato probl,m, in impl,m,nting ,~::;; I~~crprlnt Cla"ifi'~ali~11 ~n~!cfJlIl~\fi C •• E. Robin.on, D. D. Rudie. "NYSlIS
"Tho U '. en 1 cation System," Status Report. October
nttcd Kmgdom now uses 11 •• comvuter to facdltntc their fingerprint flUng
operations, but their delcggtc at an Inter 01 Co r possible at prescnt to ol.crllte without Pt' n ere nee ItAted it did not appear J,:atcs agreed that the major roblcm n~per8 or intervention. Abo, the other dele· whether onc considered 10 fin~crB or lotcnir8~8:r~~I~:.Y in tho coding or clani6catlon,
i'", 1: :. ~
, .~"I
'\
110
. 1 k computer onCe the core and delta have been i"dicatl!d ,:<f.1! a system and it is clear that such a system wiI wor at b an opt~ator. This leaves the ope~ator !ree to ma~e the ,\ least as well as present systems. . nrore difficult decisions such as identtficatto~ of parttcular .'.!
Our belief is that the system should not only be set?l- h I I h t and associated left and j I presented with pattems (w or, oOP'. arc , e c., t automatic in that operators at conso es a.re I h right slant charactenstlcs) , , !
wise indicating that the search of the files has resulted in no satisfactory match.
The system should be so designed that it can handle both lO-print or latent-print information. Thus the coding will not be in the customary Henry alphanumeric system, but rat?er on.a finger-by-finger basis using individual plus collectIVe pl'lnts to refine the file system in cases where all 10 prints are available.
111
FOllriel~series, or by considering fingerprint data as vector fields associated with Laplace equations, parameters can be mathematically generated which may make it possible to classify the fingerprint data in a system, In contrast to this, the present system, after using the fundamental Henry characteristics, relies on the minutiae of islands, ridge endings and bifurcations. The location of these is used by fingerprint experts in court proceedings as well as for locating prints in the ille. It is our opinion that locating these minutiae will enable the classification procedure to advance beyond the initial stages. It appeal'S in most reports, however, that it is not the general contour in a print which makes the print identifiable, but the existence of irregularities in the flow Jines Or ridges, For this reason, it is recommended that the proposed systems using minutiae to characterize and categorize fingerprint data be studied in sorne detail using actual prints for data. In addition to 10f'ating the minutiae in the print, which is straightforward for an operator and not too difficult for a computer, it is ntccessary either to establish a coordinate system in order to r<'fer the location of these minutiae to other prints, or to use relative information which associates one ridge ending 01' biful'cation with another. In addition, dicT'e is angular information associated with each of these singular points which may also be used as de. scriptive data but this appears to lack the variance ne.::es-
fingerprint data which they then clasSify, but a so dt }~t The above details outline the gene~al form of ~ system. !
there be some interaction between the comp.u.ter f. /.e We have an operator at a cQnsole usmg the ?~~C, I:Ienryl o erator so the computer can caB for addltlona m or- characteristic data on individual fingers for mlt~al In!or- i nfation \~'hen it is needed to facilitate. t~e sea:ch proc~ss. mation to the computer (that is, ~he operator Identifies The reason for this is that the addltio?al mforma~lOn vhetl)er or not each of the fingers IS a loop or whorl, has which is called for in order to locate the given ~e~ of prmts ~ lef; or right slant, etc.). Following this th: computer in the file varics according to the chara~te.~stlcs of ~he makes several simple measurements correspondmg to t~ose )l'int or prints being pxamined. If the 1~'lltIa1 d~ta 10- now made in ridge counting and enters ~hese dat,a In!?
artl'tl'on the data bank into a very small set o~ cards~ then t leI' ted into the informal retrieval system IS suffiCient to the file. Now, if the crunputer needs mformabon, It /'
P d' . I' f t VIII be requests it of the opera or. . . d b h little and simple ad Ibona m orma lOn \. Following the supplying of the addItIOnal ata y t e ~;;i<ed to make a unique identification of a se! of p"n~. 0 "ator, the computer then locat" a earo or ret of ",~d" I. If however, the initial data presented results m a part~- ,Yhich are displayed to the operator ~or further processIng. I ti~n of the file such that the number of car~s ~o be ex- (The computer would not be restricted to only one re- ! amined is quite large,.not o?ly will ?lor~ spec.Ific l1;forma- uest. Several passes might be made when ~eces~ary be- i tion need to be .inserted to.glVe a !ll1l9ue
Identification, b~t ~re cards are actually delivered for final vertficatiOn) !, also the type of infonnabon WhICh IS needed may.be d:t How far the search process should t~ke .the syste~ IS a I ' ferent from that in the preceding case. By allowmg t hiS point which must be considered at ~hls time: I.tc IS o~r I interaction between operator and computer bot~ t. e , that in most Cases when finger mformatlOri I~ aVailefficiency and the effic.ac), of the system sbo,~\ld be slgmf. v~~~v the system should deliver a particular card to the icantly improved. . ~ erator of the system as the result of a searc~. In some i
The semiautomatic system would b~ particularly ap- cfses it would certainly be acceptable to dehve~ several 1 propriate for the processing of latent pn?~s ?ecause of the cards to the operator, though the occurrence of thIS ,s~ould I need for an operator to extract meanmgful data from be kept to a minimum, and per~aps 10 cards on rale oc, i :
smudged or incomplete prints, casions seems a reasonable uppet bound,. . I .
With regard to the computer itsel!, there have been The maximum number of cards that mIght be dehv- I" various estimates as to the computa~lOnal po~er neces- ered to an operator is obviously related to the amount of , sary. However) if the system is semiautomatic ~~d the information (number ?f descriptors) delegated to eac~ 1. computer is not called upon to do patte-Tn rec:~gmtion of print by the classificatIOn system, the numb~r of sea:c ) the prints, the computing load appears to ~e qu:te m?~est asses, etc. The economics of the system deSl!?n requ~res ! from a speed viewpoint, and an mtermedlate SIze dIgital ~ balancing of more thorough computer searchmg agamst 1 computer can be used without difficulty. Ox; the other the cost of operator intervention, f?r exa~ple. ! hand a large number of external storage deVices are ~e- There are several mor~ subtle pomts. SI~ce no syste~ I quired to store the actual data. Fort';laately; the pnce including the present, Will be perfect, partl~ularly w~ i of external storage is low and b~commg lower, almost latent prints are considered, we must consl?er the 1m· I daily and such bulk storage deVIces as, magl;ebc tape, plications of missed identifications versus ?ehvery of t: I .' SCRAM, data cell" and many other d.'",e ... wdl p",,,,de many ''''& 0' eITOnOO"' caro,. A ,"mpa~.,n .w,th P' .; I adequate storage at a quite modest pnce. . entmanual systems would be us~f~l at thIS pomt, an~ 1 [,
In addition to this, there is the problem o~ stormg the might be profitable t~ study eXIsting systems to dt:rIVe I ~i actual prints and records of the system, and this seeh-s ~e~t statistics of this operatlOn. Several such tests have been I accomplI'shed by means of photographic film, w IC IS 'd' N Y k St t !
. t d t initiate m ew or a e, I
an efficient way to store high informatlo? conten a a, For latent prints the situation is of course more co~'1 Again, the price is qtlite modest and by usmg film re?ords plicated and the number of cards del!vered must 0 • ! of this sort the total volume of the stored data Will. be viously ~ary considerably with the 9uah~y of the .lat
W: i
significantly reduced. For example the FBI file, which rints offered to the system. It IS qUlte concelva j now requires a multistory building, c0t1:ld be reduced to ihat individual cards might be delivered ,by the ~ompuhte; ! perhaps two rooms for the data processmg cQffiple~. as a result of a single latent print, but it IS also hkely tal
Display devices do uot appear to be any par.t1cular a hundred cards might be th~ result of a search. In sdo~~ i, problem at the present. We ask on!y that the prm~s be cases where prints are partIcularly bad, a thousan j
displayed for an operatol' who then mtroduces clas~lfica- more cards could be delivered. We ,-"ould hope, hO\avefiv:;I! don data into the system by identifying points usmg a that these cases would be comparatively rare. If . I light pen, a keyboard, or some other manual means. choice is to be made as the result of the comp?ter ha~:J: Entering of data can be supplemented by .the computer delivered several cards, the operator makes thiS bYdffi cds i and console working together, For mst~nce, the of his display, examining t~e prints,fro.m the.offere c
her.L
.,,~ distance from core to delta or the number of ndges from and finally selecting a particular prmt If pOSSible, or O~ll ~ ~co~r~e~t~o~d:e~lt:a~c~a~n~b~e~e:a:si~ly:....::c:a:lc:u:la=t::::ed:...:b::.:y~a_c::.:o..:.ll_so.:..l_e...:p:..l_u_s _____________ ,.... !
I ! 1 i I " J ~ F':.I !~j )~i."it' '~f:~'"
The first step in the proposed research program consists of determining a classification system by means of which individual prints can be located in a master file containing perhaps over a hundred million total individual fingerprints. The study should concern itst:if not only with the location of sets of prints using 10·print data as input, but also the latent print problem, thereby intro. ducing a need for additional storage hecause of the addi. tional information needed to locate individual prints. Also, since latent prints are quite often of bad quality and many of the minutiae may not be present, it would be necessaJY to add l'eclunda:nt information even beyond that needed to locate clean and complete single prints.
After the classific'ltion system has been dedded upon, the total volume c,{ storage \\fill be know~ r!le size of the data bank call be calculat<:d, and equipment costs can be determinod by inquiries directed to a number of manufacturers. At that time, decisions concerning ac-
, c~ss time ver~u(' price and the ,Partitioning of the filing pieces can be made. At that tune also, one will be able to determine the class of computers which are capable of handling the present processing load the numbers of calculations wHch the machine mllSt ~ake during both average and p'Jak periods, and the amount of peripheral equipment which will be required.
With rega,'~d to the console, the classification system: will doubtless r "hdice the selection of consoles althowrh
I . 1 't> severa cor ~;;laI y available consoles appear reasonable ~t this tim, lmfJ work might also be done on develop-Ing better ~, .. ~,,1,' for taking fingerprints and better or perhaps ewl'! l1lUl'~ exotic future techniques for extracting tbe finge~pri~t information. The means for storing the actual Pr~nts In the s),sten;t on photographic film can also
sary to make this information really llseful for further relining ~he partitions of the file.
Unfortunately, it is difficult to say at this time exactly which of the proposed schemes will work best in the sorting of fingerprint data. In order to make an effective system, it is therefore necessary to study a set of actual cards using a simulated semiautomatic system and to attempt identification of both lO-print cards and latent prints using such a system. The proposed study would use a simulated classification system which would resemble in actual operating practice the proposed systems, utilizing several consoles with operators and a number of fingerprint cards from one of the present files, By reo peatedly attempting to locate cards in the file using fingerprint data and by a systematic study of the characteristics of the prints which are on file, it will be possible to determine which of the proposed classification systems will work best.
be estabhs~ed by presenting the system requirements to manufactu;'ers .of pho~ographic information retrieval. systems. ThiS wtII speCify the system and the anticipated cost of d~veloping, purchaSing, and operating such a system. It IS felt that tl;ese \~'iIl be quite modest with respect ~o the ,Present operatIng costs for large systems. Followmg .thls phase of the study, the decision can be made to begll) construction of an automatic fingerprint processing system.
THE FINGERPRINT CLASSIFICATION TECHNIQUES STUDY .
Classification is the step in the automatic retrieval process which contains major unknowns at the present. ~here is certainly no problem in the information retrieval part of the system, given an adequate classification system, nor is there a problem in sorting the necessary volume of data nor in providing the computer speeds necessary to retrieve cards efficiently given adequate input data.
. Let lIS return once more to the problem of classification 111 a large file of fingerprints. Quite a number of different l~l'~p?sals have been madc as to possible techniques fOI: subdl~ldmg the fingerprints in a file. For instance, recent llldustry proposals suggest that by means of a
---------------------.----------------------
It seems clear that a study of the classification problem will prove useful only if it deals with actual fingel'print cards and fingerprints in existing files. Theoretical studies would be restricted to work with statistical distributions and these arc not presently available, The cost of such a study would be pel'haps $500,000 to $1 million, Several consoles which are commercially available can be
". 'T C'Z'
,i
... 112
purchased in the immediate future. Stu~y contracts can be let and, given the cooperati.on of ~ ~~Jor law enforcewent agency, it wouid be poss~ble to Imtmte such a stu~y in the very near future. This seems the. necessary fi~st step to any implementation of a con:l~utenz.ed fingerpr~nt retrieval system. It wO'.lld, in addition, glVe .us considerable information on the subject of locatmg latent prints in files which are now in existence, and s~ould .be helpful to all law enforcement agencies .in copmg with their problems associated with latent prmts. It would
also supply statistical information concerning the antici-~ated consequences of enlarging the present files. 1
Further steps would, of course, be based on the resu ~s of the first study. There appears, however, ~o be ~ basiC reason why a classification system c~nnot be Implem~nted. The problem is simply that suffiCient knowled&e IS not
'1 bl The study would of course, proVide more now aval a e. . '., f I k . ledge than this for slmulatmg certam parts 0 t le now , . f . proposed system will give accurate m ormation on ?pera-tional speeds and efficiency which will be useful In any future system.
Appendix D
POLICE MOBILE RADIO COMMUNICATIONS SYSTEMS by Peter M. Kelly
Contents !ntroduction. . . . . . . . . . . . . . . . . . . . . . . . . . . . . . . . . . . . . . . . . . . . . . . . . . . . . . . . . . . . . . . . . . . 113
Potential for Additional Radio Spectrum Allocations for Police Use. . . . . . . . . . . . . . . . . . . . 115
The Efficient Design of Municipal Mobile Radio Networks. . . . . . . . . . . . . . . . . . . . . . . . . . . 121
The Relationship Between the Police and the FCC. . . . . . . . . . . . . . . . . . . . . . . . . . . . . . . . . . 132
INTRODUCTION
POLICE RADIO OPERATIONS
Large police mobile radio networks are characteristically organized in a centralized geometry with the twoway communications channels radiating outward from the dispatchi'ng center to the mobile units in the field as the spokes of a wheel radiate out from the hub. This network geometry is convcuient for the normal mode of police operations, but less well adapted to the emergency mode.
The normal mode of operation of a police mobile radio network is built around the individual mobile police vehicle and its occupants as the fundamental guardians of law and order. The mobile units patrol well defined "beats," receiving assignments from the dispatching center, and monitor the activities of mobile units on adjacent beats, moving to be in a position to render aid in pursuit if needed ..
The emergency mode of operation of the police mobile radio network must provide for the organization of police mobile units into ro.ctical operation units for dealing with large scale riots, disasters, or demonstrations. The network topography is no longer a simple wheelspoke since control of the tactical force may be given to a command vehicle on location in the emergency area. This latter mode of operation is one for which police departments generally have not been prepared in the past. In recent years, however, the forward looking departments have been making substantial changes both in organizational procedures and in design of their communications networks to be able to shift into this mode of operation as required.
In a number of the larger, single-agency, police net~orks, the geometry just described can be recognized par-
ticularly if future plans as wdl as present status are taken into account. Over major population areas, however, because of the multiplicity of municipal, county, and State agencies involved, a large number of individual networks are found to exist, all overlapping each other in their radio coverage. In taking areawide overviews, it is difficult to identify any discernible pattern. In addition; the existing police radio networks arc plagued with a number of severe shortcomings. The most serious of these shortcomings is the severe crowding of the police radio bands.
The overall shortcomings of present police radio communications have a number of clearly defined characteristics:
The congestion of the police radio channels is most severe in the areas around the major population centers. In these areas, there are too many police radio users and too few radio channels allocated for police use.
In these major population areas, as in all areas of the country, police radio is characteristically organized into a large number of small, independent networks which are ineffective in terms of interagency communications and coordination and inefficient in use of the limited available radio spectrum. Each little municipality will often have its own small, independent police network.
Even in those areas where large police networks exist as in major cities or count}"vide systems, there is virtually no use made of the methods of modern communications technology to even the channel loading or relieve the congestion at times of heavy traffic.
New devices required for improved police operation such as automatic car incators, small personal radios for u.se away from the car, and teletype in the car can be expected to create requirements for additional radio spectrum space for police use.
113
i·
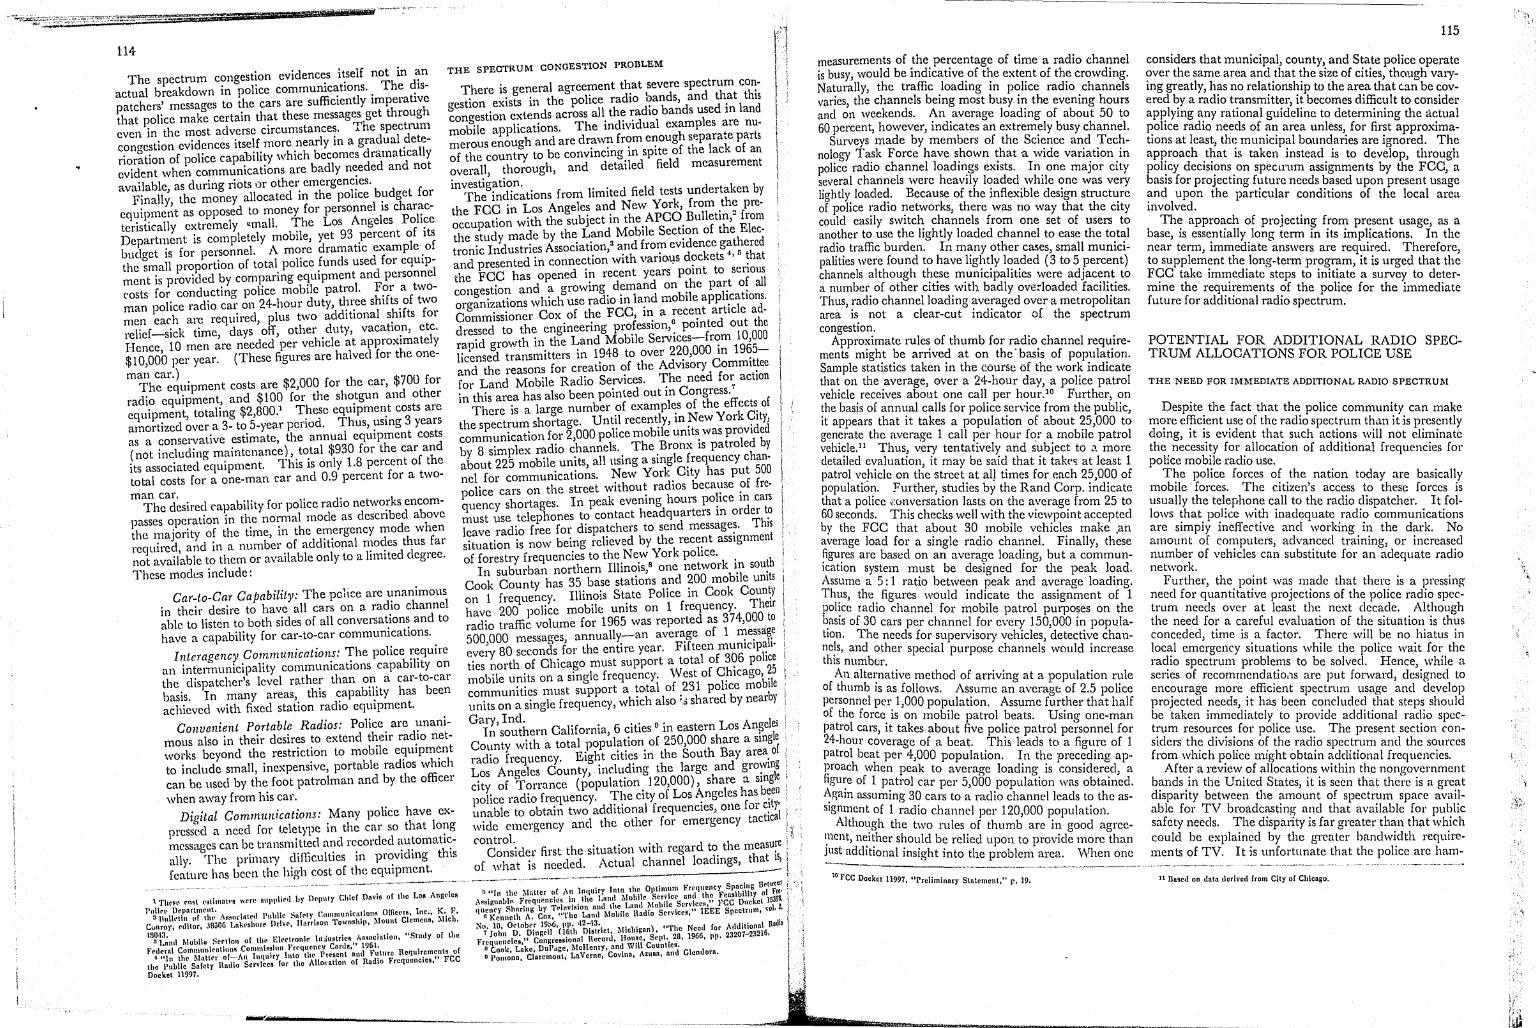
TV Tm, rmtttrfW . ~TtWfitW ,~" .. ~.~." \"'""" -
114
The spectrum congestion evidenc~s i~se1f not in ~n actual breakdown in police commumc~tlOns.. The ~lSpatchers' messages to the cars are suffiCiently Imperat1ve that police make certain that these messages get through even in the most adverse circumstance~. The spectrum congestion evidences itself more nearly 111 a gradual ~eterioration of police capability which becomes dramatically evident when communications are badly n~eded and not available, as during riots or other emergenc~es.
Finally, the money allocated in the pohce b;ldget for equipment as opposed to money for personnells char~cteristically extremely <mall. The Los Anro-eles Poh~e Department is completely mobile, yet 93 ,Percent of Its budget is for personnel. A mO.re dramatic example. of the small proportion of total pollce !unds used for eqUlpment is provided by corilparing eqUlpment and personnel ('osts [or conducting police moblle patrol. F?r a twoman police radio car on 24-hour duty, t1:11:ee shlfts. of two men each are required, plus two additional s?lfts for relief-sick time, days off, other duty, vacaho.n, etc. Hence 10 men are needed per vehicle at approximately $10,000 per year. (These figures are halved for the one-man car.)
The equipment costs are $2,000 for the car, $700 for radio equipment, and $100 for the sho.tgun and other equipment, totaling $2,800,1 T?ese eqUlpmer:t costs are amCirtized over a 3- to 5-year penod. Thus, ;tsmg 3 years as a conservative estimate, the annual equipment costs (not including maintenance), y:~tal $930 for the car and its associated equipment. 1 hlS 1S only 1.8 percent of the total costs [or a one-man {'ar and 0.9 percent for a two-
man car. . k The desired capability for police radIO netwo: ·s encom-
passes operation in the normal mode as descnbed above the majority of the time, in the e~.ergency m~dc when required, and in a number .of additIOnal n:o~e~ thus ,far not available to them or aVailable only to a lllUlted deglee. These modes include:
THE SPECTRUM CONGESTION PROBLEM
There is general agreement that severe spectrum co~estion exists in the police radio ~ands, and th.at thlS
~ongestion extends across all the radIO bands used m land mobile applications. The individual examples are numerous enough and are drawn from enough separate parts
f the country to be convincing in spite of the lack of an ~verall, thorough, and detailed field measurement
investigation. d k b The indications from limited field tests un erta en y
the FCC in Los Angeles and New York, from .th~ pre-t· 'lth the subJ'ect in the APCO Bulletm,- from
occupa IOn w . ' f h EI
rq I: ,
the study made by the Land Moblle Sect!on 0 t e ee-tronic Industries Associati.on,a ~nd froI? eVldence g~:~ered and presented in connectIOn wlth vano~s d?ckets !hat the FCC has opened in recent years pomt to senous • congestion and a growing demand on !he par.t o~ all organizations which use radio in land moblle apph.catlOnds. Commissioner Cox of the FCC, in a rece?t article a -d d to the engineering profession,a pOInted out the r;~~~ growth in the Land Mobile Services-fr~m 10,000 lic~nsed transmitters in 1948 to over 22~,OOO m 19~5-and the reasons for creation of the Adv1sory Comm1t~ee for Land Mobile Radio Se~ices. rr:he need fo~ actIOn in this area has also been pomted out m Congress.
There is a large number of exampl~s of the effect~ of the s ectrum shortage. Until recently, m New York ~My, comg1Unication for 2,000 police mobile units. was provlded by 8 simplex radio channels. The .Bronx IS patroled by about 225 mobile units, an using a smgle ~requency chan-nel for communications. ~ew York. C1ty has put 500 police cars on the street w1thout radIOs beca~se ?f frequency shortages. In peak evening hours pO!lce m cars must use telephones to contact headquarters m order t? leave radio free for dispatchers to send message~. ThIS situation is now being relieved by the rece?t asslgnment of forestry frequencies to the New York pollce. .
In suburban northern Illinois,S one network 1.n sou~ Cook County has 35 base stations ~nd ?OO mob1le U111t~
Car-to-Car Capability: The po11ce are ,:nanimous on 1 frequency. Illinois State PolIce m Cook Coun~l in their desire to have all cars on a rad.1O channel have 200 police mobile units on 1 frequency. TheIr able to listen to both sides of all conversat.lon~ and to radio traffic volume for 1965 was reported as 374,000 to have a capability for car-to-car commumcatlons. 500 000 messages, annually-an average of 1 n;e~sag.e
Interagency Communication.s: ~he police !'~quire eve;y 80 seconds for the entire year. Fifteen mUJ1lC1p~h. an intenTIunicipality commUJ1lCatlOns capab1hty on ties north of Chicago must support a total of 396 pohce the dispatcher's level rather than on a car-to-car mobile units on a single frequency. West of C?lCag\~t basis. In many areas, this capabil.ity has been communities must support a ~otal of .231 pollce mo 1C achieved with fixed station radio eqUlpment. units on a single frequency, whlch also 'd shared by nearby
COl'venient Portable Radios: Police. are u. nani- Gary, Ind. . ' ., L A geles : , d In southern Califorma, 6 cltles 0 111 eastern os n. I mous also in their desires to extend t1;elr ra .10 net- County with a total 'popul~!ion. of 250,000 share a smg
o!'
works beyond the restriction to mobile e~Ulpm~nt radio frequency. Elght cltles 10 the South Bay area. i to include small, inexpensive, portable radIOS whIch Los Angele5 County, including the large and gro~vmlg : can be used by the foot patrolman and by the officer city of Torrance (population. 120,000), share a s~~~ r
when away from his car. police radio frequency. The Clty of Los ~ngeles has ~ Digital Communications: .Many police have ex- unable to obtain two additional frequencles, one for c;tYi i
pressed a need for teletype 10 the car so that 10~lg wide emergency and the other for emergency tactlca . it ' messages can be transmi lted and recorded a.ut. omatl~- control. . d tl easure-1 th Consider first the situation With regar to le m . ally. The primaly difficulties in pr~Vl( mg IS of what is needed. Actual channel loadings, that IS, feature has been the high cost of the eqtupment. -
~.~---~-'~ -,.-.,.----'~- ----~ ...... -.--~.-.-------~--. o· F cncy Spacing Betweerf • f I I \ I • "In Ihe ~!nl\cr of ,\n Inquiry Inlo Ih~ PI1I1~~'JI1 ret'he FenslbililY 01 rr<'
t 1'h(,1It' rn'Sl t'StillHHf'5 were .I'IllPl'lit'11 hy Dl'lHtty Chid Dnvlt' 0 t Ie. .. os J nne Cl! Al'lsi~nnbln Frequrncics in lhe Lnntl Mobile:" Ser,nce- 11n< t" ~C" Docket 15398. PoliN' Ilopurlmcnt. ., I' om 1 c K F ;I;,.n,·y Shnring by Trlc.,·I.lon n~"~ltl~e'ILUI'\"ld~!OIS"I~I~~~v,l.cl·EEi' S~celru",. vol. 2,
!l Hullt.tin uf tht. AS:lol'il\ll'tl Puhlk !'InrC'tr (,ulIlmun C[\!IOIIR \Cl'ci- 11., ~ll l' d Kf'llnClh A. Cox, "The Lanu u Oul C n 10 (Of t
(!unfO)", N.lltor, JOSOn 1.l1kcshorf' Drivt', lJufrtson Townslull, Mount emens,. C 1. :{ 10 0 l h l c:-\(j liP 42-13 1 Radio 180.13. • I' ' , • I' "Sludy 01 Ihe ' ~'Jol;n ~.O O[.,g:il '(16th 1)]'I;icl, MIcI,lgnn), "T2hsc N19c6
ei lor ~;~~~~~~;16, 31..Rnd MQhi1tJ St'r,lon or th!' Eh'l"~OO1{, I\:iUstrll'S JtI\S~O~Hl lOn, ~ Frequencies," Congressional llecord, Hou~e, Sept,. t , flP·
Fril('rnl CnmmulIiC'ntiol1!{ COh1nt1~~t()nlfr{'(lul·nep" Curd I" 119~~;turc Requirements of 8 Cook, Lake, DUPdge, McHenry, and Will Counties . .. Illn the Mnttl'f of--An InquJrY nta t l(\ res en nU( ~ . H FCC 0 Pomono, Claremont, LnVcrnc, Covino, AZUSR, Bnd Glendora.
Ihe Public Salely Rudlo Services lor Iho AlIo,:ulion 01 Rndlo F requenc,cs, Doekel 11997.
-----
measurements of the percentage of time a radio channel is busy, would be indicative of the extent of the crowding. Naturally, the traffic loading in police radio channels varies, the channels being most busy in the evening hours and on weekends. An average loading of about 50 to 60 percent, however, indicates an extremely busy channel.
Surveys made by members of the Science and Technology Task Force have shown that a wide variation in police radio channel loadings exists. In one major city several channels were heavily loaded while one was very lightly loaded. Because of the inflexible design structure of police radio networks, there was no way that the city could easily switch channels from one set of users to another to use the lightly loaded channel to ease the total radio traffic burden. In many other cases, small municipalities were found to have lightly loaded (3 to 5 percent) channels although these municipalities were adjacent to a number of other cities with badly ove:-loaded facilities, Thus, radio channel loading averaged over a metropolitan area is not a clear-cut indicator of the spectrum congestion.
Approximate rules of thumb for radio channel requirements might be arrived at on the' basis of population. Sample statistics taken in the course of the work indicate that on the average, over a 24-hour day, a police patrol vehicle receives about one call per hour.lo Further, on the basis of annual calls for police service from the public, it appears that it takes a population of about 25,000 to generate the average 1 call per hour for a mobile patrol vehicle.l1 Thus, very tentatively and subject to a more detailed evaluation, it may be said that it take,> at least 1 patrol veJ1icle on the street at alJ times for each 25,000 of population. Further, studies by the Rand Corp. indicate that a police wnversation lasts on the average from 25 to 60 seconds. This checks well with the viewpoint accepted by the FCC that about 30 mobile vehicles make .an average load for a single radio channel. Finally, these ~gu:es are based on an average loading, but a communIcation system must be designed for the peak load. Assume a 5: 1 ratio between peak and average loading. Thus, the figw-es would indicate the assignment of 1 pol~ce radio channel [or mobile patrol purposes on the ~asls of 30 cars per channel for every 150,000 in population. The needs for supervisory vehicles, detective channe!s, and other special purpose channels would increase tim number.
An alternative method of arriving at a population rule of thumb is as follows. Assume an average of 2.5 police personnel per 1,000 population. Assume further that half of the force is on mobile patrol beats. Using one-man patrol cars, it takes about five police patrol personnel for 24-hour coverage of a beat. This leads to a figure of 1 patrol beat per 4,000 population. In the preceding approach when peak to average loading is considered, a figu:e of 1 patrol car per 5,000 population was obtained. ~gam assuming 30 cars to a radio channel leads to the asslgmnent of 1 radio channel per 120,000 population.
Althol~gh the two rules of thumb are in good agree-1.1lent, n~l~hel' should be relied upon to provide more than ~st additional insight into the problem area. When one
10 Fec Dockel 11997. "Preliminnry Slnlement," p, 19.
115
conside.rs that municipal, county, and State police operate over the same area and that the size of cities, thc\Ugh varying greatly, has no relationship to the area that can be covered by a radio transmitter, it becomes difficult to consider applying any rational guideline to detennining the actual police radio needs of an area unless, for first approximations at least, the municipal boundaries are ignored. The approach that is taken instead is to develop, through policy decisions on spectrum assignments by the FCC, a basis for projecting future needs based upon present usage and upon the particular conditions of the local area involved.
The approach of projecting from present usage, as a base, is essentially long tenn in its implications. In the near term, immediate answers are required. Therefore, to supplement the long-term program, it i5\ urged that the FCC take immediate steps to initiate a survey to determine the requirements of the police for the immediate future for additional radio spectrum.
POTENTIAL FOR ADDITIONAL RADIO SPECTRUM ALLOCATIONS FOR POLICE USE
THE NEED FOR IMMEDIATE ADDITIONAL RADIO SPECTRUM
Despite the fact that the police community can make more efficient use of the radio spectrum than it is presently doing, it is evident that such actions will not eliminate the necessity for allocation of additional frequencies for police mobile radio use.
The police forces of the nation today are basically mobile forces. The citizen's access to these forces is usually the telephone call to the radio dispatcher. It follows that police with inadequate radio communications are simply ineffective and working in the dark. No amount of computers, advanced training, or increased number of vehicles can substitute for an adequate radio network.
Further, the point was made that there is a prcssing need for quantitative projections of the police radio spectrum needs over at least the next decade, Although the need for a careful evaluation of the situation is thus conceded, time is a factor. There will be no hiatus in local emergency situations while the police wait for the radio spectrum problems to be solved. Hence, while a series of recommendatio,ls are put forward, designed to encourage more efficient spectrum usage and develop projected needs, it has been concluded that steps should be taken immediately to provide additional radio spectrum resources for police use. The present section considers the divisions of the radio spectrum and the sources from which police might obtain additional frequencies.
After a review of allocations within the nongovernment b~nds,in the United States, it is seen that there is a great dlspanty between the amount of spectrum space available for TV broadcasting and that available [or public safety needs. The disparity is far greater than that which could be explained by the greater bandwidth requirements of TV, It is unfortunate that the police are ham-
11 Dn.ed on duln derived from Cily 01 Chlcugo.
.\,;
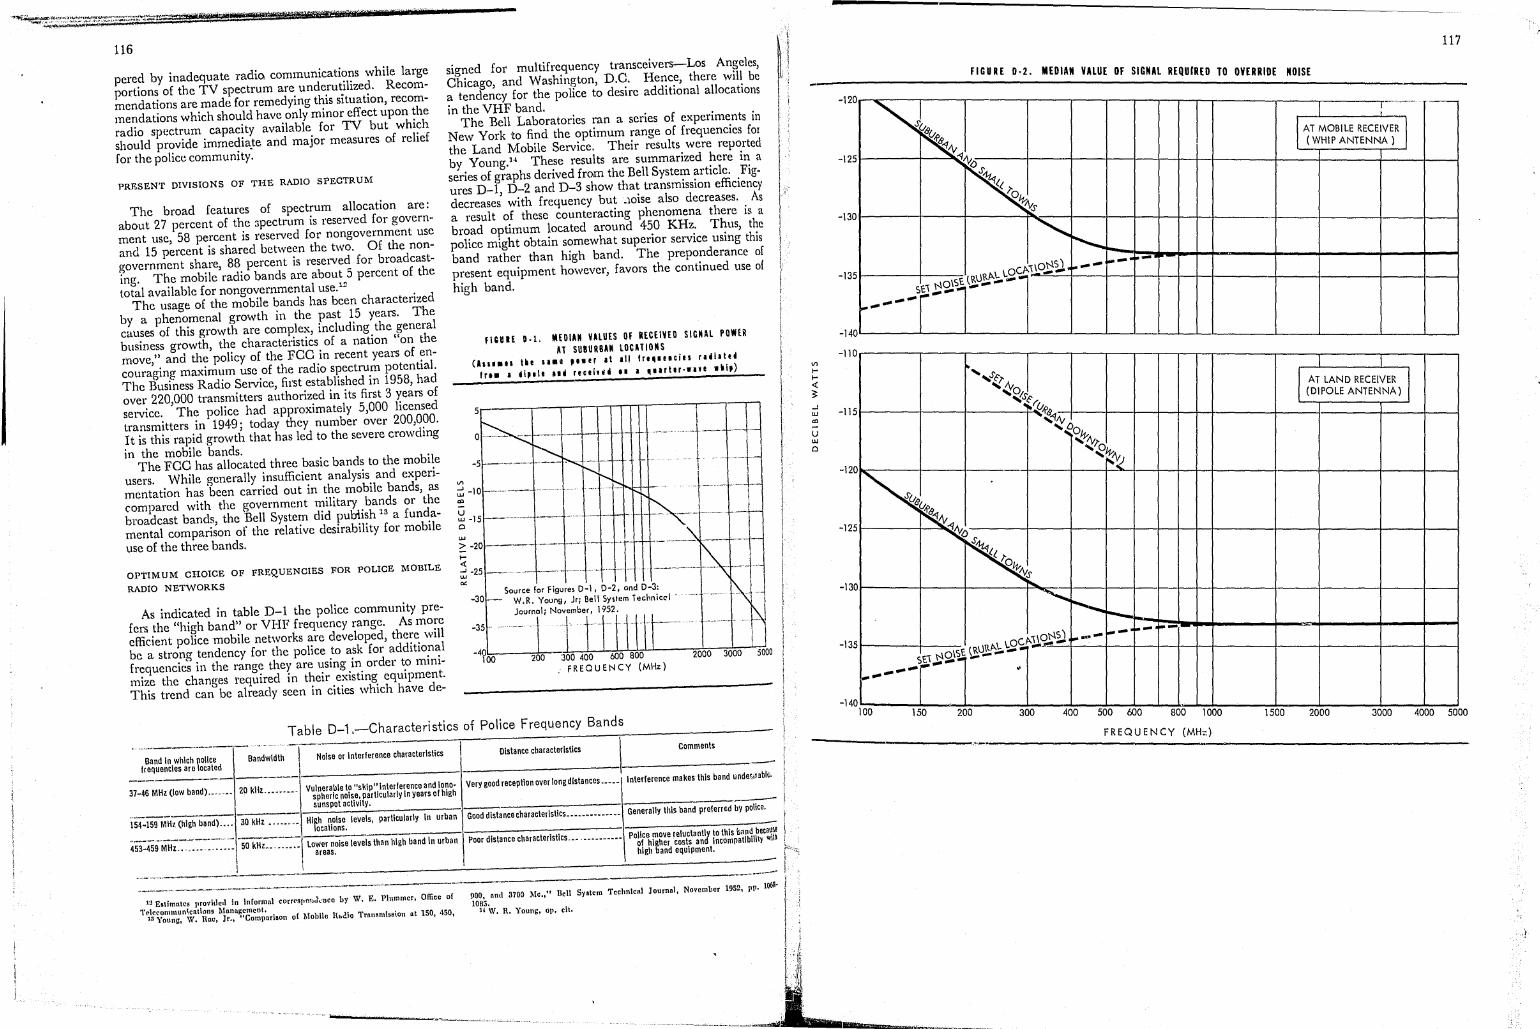
116
pered by inadequate radio communications while large portions of the TV spectrum are underutilized. Recommendations are made for remedying this situation, recommendations which should have only minor effect upon the radio spectrum capacity available for TV but which should provide immedia.te and major measures of relief for the police community.
PRESENT DIVISIONS OF THE RADIO SPECTF.UM
The broad features of spectrum allocation are: about 27 percent of the 3pectrum is reserved for government usc, 58 percent is reserved for nongovernment use and 15 percent is shared between the two. Of the nongovernment share, 88 percent is reserved for broadcasting. The mobile radio bands are about 5 percent of the total available for nongovernmental useY
The usage of the mobile bands has been characterized by a phenomenal growth in the past 15 years. The causes of this growth are complex, including the general business growth, the characteristics of a nation "on the move," and the policy of the FCC in recent years of encouraging maximum use of the radio spectrum potential. The Business Radio Service, first established in 1958, had over 220,000 transmitters authorized in its first 3 years of service. The police had approximately 5,000 licensed transmitters in 194·9; today they number over 200,000. It is this rapid growth that has led to the severe crowding in the mobile bands.
The FCC has allocated three basic bands to the mobile users. While generally insufficient analysis and experimentation has been carried out in the mobile bands, as compared with the government military bands or the broadcast bands, the Bell System did pul::rlish 13 a fundamental comparison of the relative desirability for mobile usc of the three bands.
OPTIMUM CHOICE OF FREQUENCIES FOR POLlCE MOBILE
RADIO NETWORKS
As indicated in table D-1 the police community prefers the "high band" or VHF frequency range. As more efficient police mobile networks arc developed, there will be a strong tendency for the police to ask for additional frequencies in the range they are using in order to minimize the changes required in their existing equipment. This trend can be already seen in cities which have de-
signed for multifrequency transceivers-Los Angeles, Chicago, and Washington, D.C. Hence, there will be a tendency for the police to desire additional allocations in the VHF band.
The Bell Laboratories ran a series of experiments in New York to find the optimum range of frequencies fOI
the Land Mobile Service. Their results were reported by Young.H These results are summarized here in a series of graphs derived from the Bell System article. Figures D-l, D-2 and D-3 show that transmission efficiency decreases with frequency but _loise also decreases. As a result of these counteracting phenomena there is a broad optimum located around 450 KHz. Thus, the police might obtain somewhat superior service using this band rather than high band. The preponderance of present equipment however, favors the continued use of
high band.
fl'UIE 0.1. MEDIAN VHUES Of RECEIVED SIGNAL POWE~ AT SUBURBAN lOCAlIONS
(lIlI." Ike sa., ,ner II III 'r'~"lCies rl.iltd fr •• I .i,.11 ... recain. II I ~.arttr·.'11 .ki,)
u u.J -15 o u.J
::: -201-----+ I-<{
~ -25 -- ~ --- -~~.
'" -30
-35 - ~~
-40 100
Source for Figure, 0-1, 0-2, and 0-3: W.R. Young, Jr; Bell Sy,tem Techniccl
'00<0,1, :rrT'J]] I 200 300 400 600 800
FREQUENCY (MHz) 2000 3000 5000
Table D-1.-Characteristics of Police Frequency Bands --~--~- .•....
Band In which police frequencies aro located
BandWidth
._------37-46 MHz (low band), .. ~ . __ 20 kllz. .......
15H59 MHz (high band).... 30 kHz ••• 00_ ..
.-~-- .... ----..---. ..-- ---453-459 MHz .............. 50 kHz ..... ..
--Noise or interference characteristics
Vulnerable to "skip" interference and iono· spheric noise, particularly in years of high sunspot aclivlty.
Hlf,h noise levels, particularly in urban ocations.
lower noise levels than high band in urban areas.
\ Distance characteristics comments
-Very good reception over longdistances .. ___ Interference makes this band undef",abk.
,.-----Good distance characterlstlcs __ • ______ ----- Generatly this band preferred by police. -Poor distance characteristics ....... -.----- police move reluctant~ to this ~and becaul~:
of higher costs an Incompatibility W
high band equipment. -1:1 Estimates JlTovidcll in Inrormnl corr['spn~:(l,,-uco by W. E. Plummer. Office of
Troll!t'omU\ltl\~cnthm9 'MnnL\gcmcnt. 13 Youn", \V. Rne, Jr., "Comparison o[ Mobile IbJJo Trllll!miss\on at 150, 450,
._---- -900, nud 3700 Me.," nell Sy.tem Teehnlcnl Journal, November 1952. pp. 1068, \1.
1095. 11 W. R. Young, up. cit.
I !
I , • :Ir,
Vl l-I-« 3: ..J w
'" U w 0
117
FIGURE 0·2. MEDIAN VALUE OF SIGNAL REQUIRED TO OVERRIDE NOISE
-120..--.......... ------· .
-1251----~~!Ioi.::
-130j--,--t-----=T,,=--I--i--t.--I--I-...+-1--·T----r----+---4-~
-_140'-__ ---1 ____ L-_----'L-__ L..-l __ LLLU ___ J_~ ___ ~_~_J -I
-1
10
',t: No .J .... ~J'(-'
15 I"u. ,~6'''1 '~D
·~~tv ,7"0
o~ '~"(J
-12
-12 ~ 5 !\t:</ !\tD
-13 0
-135
~-
-140 100
~ "'0 ~Iv t
"" ~ r--I...-
,b.·noNS) 1-- ~- '"'-SE"(~~~ !!\J!f"1. ~~ ----
... _0'-
---,... ~
150 200 300 400 500 600 800 1000
FREQUENCY (MH::)
I I l AT LAND RECEIVER 1 (DIPOLE ANTENNA)
-
1500 2000 3000 4000 5000
H
I!{i
~-_l_ ..... -"""" ...... m_

118
45
mUlE D·3. TRANSMITTER POWEI AT UTEIIU IIIPUT IEQUIRED fOR UIIAN AND SUIU.BAN COY('~GE
( •• ~Ile lltelill He IIII1IIed \0 ~. ~lIrttr'lIne .\1,,)
40 / 10,000
:: 35 ..t. 3' UJ 30 Z o UJ 25 > ~ 20 <t Vl
;;:! 15
'" ~ 10 o
5
-,
-:, --
DIPOLE '-. -..:rlErN~ .... ~
I GIJ.-t I .... ~N1ENNA
..... .. -i .... - -
'-
/ 5000
" / LA~D
V TRA\S/TER
2000
1000
500
J V ,;
200
100
./' ,/ 50
V ~;
" 20
10 ..., ~~ ... MOBILE lRANSM1T1E f- (assuming six land
5
re<.lvers with dipole 2 ~ncs)
~ 00 150 200 300 400 600 BOO 1500 3000 'i000
FREQUENCY (MHz)
Vl r-I-< ~
It is generally agl'eed that lowband, with its skip interference, is undesirable for police usc although major police departments-Baltimore County, Md.; Fairfax County, Va.-are among those still operating in this band because of the spectrum shortage. Section 89.101 (g) of FCC rules advises users in the Public Safety Services to use frequencies in the higher portions of the spectrum because they are not subject to skip interference from distant stations clue to reflection off the ionosphere.
REALLOOATION POTENTIAL wnHIN THE PUBLIC SAFETY
BANDS
Table D-2 provides a picture of the spectrum crowding in these bands in a vcry gencral way since it considers all the transmitters licensed all over the country. It is valicl as a genel'al picture, however, since most mobile band users, with a few notable exceptions, experience the most severe crowding in the same places-the population centel'S.
Since the police sufTer more severely from congestion than the other Public Safety users it appears to be sensible to afford them relief by reallocation from the other user allocated bands. These other bands are also well u~ed, however, and a more practical approach would seem to be that the user identification within the Public Safetr Bands be eliminated and local govcrnments be made responsible for the efficient usage of all their assigned frequencies. This would eliminate the need for further consideration of reallocation within the Public SaJet)' Bands.
,. FCC Docket No. 11997.
Table D-2.-Relative Congestion Among Users of the Mobile Bands
Number transmitters
Public Safely: pcr frequency Fire........ ••••••••• .............................. .................. 933 Forest conservation... ......... •••••••••••••••••.. •••••. ••. ........... 905 Highway maintenance................................................. 699
~~~rc~~~~~~~~:~.t::::::::::::::: ::::: :::: :::::::::: :::::::::: :::: ::::: I, m Special emergency.................................................... 743
Overall average................ .•••..•• .•••.• ..•.• . .••.•. •••• .•••.• 975. G =---~
other than public Safety: Autc ~:nerg;;ncy ........................................ ""............ 851
~~~~~te~~6~~~k::::::::::::::::: :::: ::::::.~::::::: ::::::::::: :::::::: 2, m Manufacturers radio................................................... 555 Motion picture radio........... ........................ •••••••••••••••• 43 Motor carriers................... ..................................... 319 Petroleum... .......... .............................................. 39G
~:~e6~~~;;::::::::::::::::::::: ::::::::::::: ::::: ::::::::: :::::::::: ~: ~~~ spec1al IndustriaL .................................................... 3,095 Taxicab .............................................................. 3, G08
Overall average .................................................... 1,30G.6 Note'-'From EIA study of FCC frequency cards. Only considered transmiters between
30-50,105.8-162,450-460 MHz.
REALLOCATION POTENTh\L WITHIN THE LAND MOBILE
DANOS
Table D-2 indicates that the conunercial-industrial portion of the Land Mobile Bands are, on the average, as heavily congested as the Public Safety portion. Hence, there is little possibility of additional spectrum resources being made available to the police from this source. In· deed, the commercial and indu~trial usage of the radio spectrum has grown so rapidly in the past two decades) that business int,erests can be expected to compete actively with the police at such time when additional radio spec· trum is made available.
REALLOCATION OF PORTIONS OF THE BROADCAST BANDS
The overwhelming percentage of the radio spectrum allocated to broadcasting suggests this as the most promis' ing source of additional frequencies for police. Further, consideration of the present velY light usage of the UHF TV spectrum reinforces this preliminary conclusion.
The FCC, on its own initiative in 1957, instituted an inquiry 15 into the allocation of frequencies in the range 25-890 MHz. As a conclusion to that docket, the FCC determined that the following actions could be taken:
The FCC proposed to institute a trial under which certain land mobile licenses in the State of California in certain services would be given secondary sharing rights to unused frequencies of other services. The matter was investigated under docket 15399 and the region of experimentation was broadened to include Texas and the city of Chicago under docket 16259. The matter has been terminated in view of a broader proposal being considered by the Advisory Commit· tee for the Land Mobile Radio Service.
The FCC proposed in docket 15398 to examine the feasibility of permitting the Land Mobile Service
·<f I i 1
t~ . share TV c~lannels 2 through 13 with televlslOr~ br?adcastmg. This subject is under active exammat!on.
T~e. FCC? instituted a study of the technical and admllllStrahve stel~s which might be taken to resolve problems confrontmg the land mobile services.
The ronclusion was reached in docket 11997 that the future needs of both educational and commercial TV depend upon the maintenance of the UHF TV bands.. .This. conclusion is commented upon later when It IS pOInted out that a parallel study of future ~leeds f?~' TV a.nd of future nee.ds for, Public Safety IS rcquued to assess the relative allOcations that should be made.
~he trend has, ~o~ever, clearly been toward an examinatIOn of th~ POSSibilIty of usage of TV frequencies and an exa:mnatlOn of the allocatio.n apd assignment processes ~hemsdves as the two most slgmhcant sources of relief I~ th? pr~sent congested spectrum situation. Here attention I~ dlrected tO~l'arel an evaluation of the availability of radIO spectrum m the TV broadcast bands.
Sharing the VHF TV Bands
The FCC indicated in its conclusions to docket No 1199~_ that w.hile the possibility of moving all of TV t~ the UI?-~ reglOrl: had not been completely ruled out, the proba~lhty of.doll1g so appeared to be remote. Submitted as te5tlmony In docket 15398 was a detailed engineering statement on the technical feasibility of sharing the VHF TV banels with mobile llsers .. Although the'results arc conceded to be technically sound, the National Association ~f Broadcaster.s has obj~cted on the grounds that although some th.eoretrca! sharIng may seem possible based upon
hypothe!lcal engmeering assumptions, the institution of ~ppropnate .safeguards to prevent interference to tek\Is~on reception would undoubtedly preclude the practical asslgnment.of lapel mobile stations on TV channels." 16
A Th~ ~ngllleermg analysis of the Electronic Industries ssoclation (EIA) pointed out first that other services
~~~~dy operate adjacent to VHF TV channels. See table
A~cordil1g to the ErA analysis, the above services operat~ lJ1 the s~me a~'ea as the neighboring TV channels Mthout call~mg serIOus problems, e:tCept for the 171-174 1 Hz .bancll~ areas where TV channel 7 is used. Thus, there lS a baSIS for presuming that the same could be true
Table D-3.-Bands Adjacent to VH F TV --"~-., --....~-------I'~--- -------....
TeleVision r Adjacent users
requency Band Frequency _. (MHz) (MHz)
119
of land mobil~ b~se station tra,nsmitters operating at adJ'acen~ frequencies In the same area.
Flgures D-4 and D-5, taken from the ErA anal sis ~r~ the composite graphs of VHF TV receiver charaJel:~ ~.hC curves for a low-band channel, channel 5, and for a Igh-b~nd channel, channel 11. These curves which
show the level of interference noticeable to the'viewer ?h(j\~' that, as ~xl?eeteel, the receiver is most sel~sitive t~ mterf~renc~ wlth~n the channel rather than to interfer(!nc~ m nelg~borl!1&" channels. Further, the receiver is mOle SUsccptl~le t? ~nterference in the channel below the cgannel to wlllch It IS tuned than it is to interference from a ff ove. The figures specifically consider the interfering e. eet of a CW or narrow-band, land-mobile transmitter ?lgn~1. . In ~ost cases, for adjacent channel signals the 1I1t~tfe~'lIlg Signal must be above the TV signal l~vel which lS ~ak~n .here as 225 microvolts, to cause'noticeabl~ etcct~. fillS IS ~xpectcc1 TV-signal level at the edge of t 1e glade B ?ervlce contour. Figure D-6 shows that if the laJ~d-mobde transmitter signal is kept 55 db below the 225
1-mlCrovolt reference, there would be no interferenc('
to t ~e TV even at band edge. . F.lgure. D~.7 shows the various frequencies that must be
a~?ldedm the lan~ mobile services to minimize the possi~~~ty ?f • ,local adJa~ent-c~annel television interference. . ~~ v!c1eo and audiO carner should be avoided to minImlz~ ll1terlere!lCe to the land-mobile receivers. A landmoblle tr~n~~1~tter on ~he upper ~hannel sound beat frequency.-. B In the diagram-Will mix with the u er channel Video carrier which is 't5 IvfHz away to pro~~ce 7.5 MHz sound I.F., which will cause audio interference m the upper ch~npel. Similar interference effects are ~aused by transmlSSlOns on the other frequencies indicated 111 figure D-7. . As a result of their analysis, developed more completely III t.he re~erenced EIA analysis, the EIA recommended la~d u:obde freguency assign,ments shown in figure D-8 fOl adjacent .ch~nnel operatlOn. Furthel'j they rCCOIl1-1l1el~d~d at thiS time that operations in adjacent channe!.~ be Irmlted to fixed stations.. .
As an illustrative example of the Los Angeles situation, ta?le D-4 sh?ws the number of land mobile stations that Imght be assigned in that area on the basis of adjacent cha~mel operation. A total of 307 25-kHz channels is avaIlable.
Table D-4.-Land Mobile Channels Available in Los Angeles in VHF TV Bands
TV channel In Adjacent channel available
N assignable channels umber Frequency (MHz) (25· kHz) ,..-----------------1
Los Angeles area ---~- I .----.--- Number of
.••• --~_ _ 3 I 60·66 42 4, 5 ---6--- ---az::ss-'~- '. -. \39-~
Channel F I ----;----2 ~.---
'::':::::'::::':.:.:.::.:.:.::: 54-60 I Amateur ••••••• '" •••••.... ••••. 50-54 G.............. --8-2 sa- - b '-~. - - ----7---':'':':::':: _ - FM roadcast..... .......... •.. 88.1-94.1
I~:::""'::: _ 174-180 .I-~~-;~e:~~ servlce~::.:; _ 1G8-174
..::.::.::=~... 210-216 Governmenland amateur......... ~ -----------------.-------IG Reply Contm f .~ .. ~~--...,...-----, 15398, I'. 01. ent. 01 the National Association 01 nrondeasle,", FCC ~ockct No,
· .. ------7----- '-8 --,.--.--~ 180-186 - ....... ---4'2-.. --w
- --9 --_ .. ---W-----192.:\9-8-- · __ ·······_·4i·· .--. -11:13-- ---'1-2 -"---~ .. - -_·······-42· .

, ,
120
FICURE 0·4. TV UCEIVER IIlTERHRUCE REJECTlOIl . CHAIIIIEl \; (Co.posite 01 III receivers teste.)
+30 1 ............
0
+201--A--I--I-+-+-t-j-+--j--t-t-III-iT~::; ~
+1 ol--Wl--l--J.-+-jf--I---I--+-+-l~-j--t-,..-_ tt--:.!::/tt-i""''Ii I--~""'+--+-+--t---t--t 225j.1v REFERENCE LEVEL +-_~'1~/;""'+_-+_-+--t--t-...,
-1 0 J Vl ..J UJ -2 0 '" U UJ a
1\ \ IDEO AURAL J L\ CARRIER CARRIEd -3 0
-4 0 \j j -5 0
-60
\ I, VI .J I
-701--I---!-,--l--+-+-i--I-+--j--I---t--j---j--t--r-111
-80 71 72 73 74 75 76 77 78 79 80 81 82 83 84 85 86 87 88 89 FREQUENCY (MHz)
----------------------------------------~.,----------
The analysis in favor of the practicability ~f s.haring is considered to be sufficiently sound and vahd 111 Its development and the need is sufficiently intense that the matlei' can be expected to be amenabl~ to ~e~ision at an early date. On the basis of the foreg~mg~ It IS recommen~ed to the FCC that the field investigation of th~ practIcability of sharing VHF TV spectrum with n;oblle us~r~ be given lop priority and that \~hen the tech11lca~ conchtI?ns for sharing have been established. an appropl'lale portion of those spectrum resources be made available to the police community.
Reallocation of UHF TTl Spectrum SPace
Table D-5 shows the very large amount of l:adio spe~trum space that is devoted to UHF TV: W~~le there !S C'urrently intense interest in the l?otentm! utilIty of tIm portion of the spectrum for educational TV, the fact nevertheless remains that it represents an enOlmous amount of spectrum-enough for 14,000 30-kHz mobile radio channels. Just one TV channel provides sufficier;t ban~width for 200 such channels. Finally, simple anthmettc
shows that a reallocation, for example, of two UHF TV channels would reduce that total capacity by less than 5 pe~cent. It is extremely doubtful w~1ether it i~ p?ssib~e to projeC't the future growt~ of U~F. TV to wlth1l1 thiS order of accuracy. Accordmgly, It IS ~'ecommended to the FCC that consideration should be given to rea1Joc~ting radio spectrum space from UHF TV to land mobile use.
Table D-S.-Spectrurn Allocations in Brie~_
Freque,lcy range Amount of Ire. q uency space
Comment
MH 191 MH Most heavily used land mobile frequencies. 21-216 z .... _...... z....... FM broadcast. VHF teleVision. Aviation service. Marine services. Amateur band. Government services.
6 47 MH 254 MHz Land mobile frequencies. 21 - 0 zoo........ • ••• '_. Amateur bands. Government services.
470-890 MHz .......... 420 Ml1z ....... UHF TV.
,1
11 121
FienE D·S. TV RECEIVUI IIITERfEREIlCE . CHUNEL 11 (Cnpolite ,I III receivers tested)
+40
+30
1\ .. "j .. ..1
\ lL +20
+10
t'\ 255j.1v REFERENCE LEVEL L
\ o
Vl -10 ..J UJ co u -20 w o
-3 0
-4 0
-5 0
-60
0 -7
1\ \ ~ ..
1\ :/ , l'o.
/ '\.. I V " ~ .A
I' ~ .... ' I
V~ I 1..1
I j I
I I ......... .! I i r I
VIDEO AURAL CARRIER CARRIER
CHAN~EL 1 CHAN~EL 11 -- CHANfEL 12 0
-8 192 193 194 195 196 197 1'18 199 200 201 202 203 204 205 206 207 208 209 210
FREQUENCY - MHz
THE EFFICIENT DESIGN OF MUNICIPAL MOBILE RADIO NETWORKS
MOBILE RADIOTELEPHONE NETWORK DESIGN CONCEPTS 17
There are two very different an'cl very significant gains to be made by the designing of large-scale communications 11etworks for police and public safety use as opposed to individual networks for each small user and small municipality. The advantages in scale, or more simply, the advantages that derive from the more efficient and more even loading of the channels among users of the same kind in a large network are not available to a small network. The second fe'ature is that gross differences in User habits provide advantage to all concerned. Thus, schoolbus frequencies and some highway maintena.nce f~equencies are available for police and fire use in evemngs, weekends, and during emergencies. . The basic approach to the optimum use of communica
tions nctworks developed with Erlang's work in Denmark published in 1917.18 The approach is simple in concept
11n' I' I I l! kl·"· .n. y"s presente! here w.s provided by Dr. M. Del more 01 John. op ns Unh'crsity. 1'1 Brockmeyer. Htllstrom, and Jensen, uThe Lire Rnd \"arks of A. K. Erlang,'.
•
although it can become complex in mathematical formulation. Basically, the C<lUCl!pt is that the allocation of communications channels on an exclusive basis is extremely wasteful in terms of use of resources as compared to the sharing of channel resources among a number of users.
Many studie~ have shown that the distribution of the number of telephone messages per hour may be approximated by a Poisson distribution with parameter L) where L is the average number of messagcs per hour. This distribution will be assumed for police messages. That is, J{" (t) the probability that there are n police messages during a time interval of t seconds is given by:
(Lt) 11.
[(net) = -1- exp (-Lt) n.
Additionally, it is convenient to assume that the message length is a negative exponential distribution with mean ] lu. That is) the probability that a message lasts longer than t time units is] -exp( -tlu).
Copcnhngclt Telephone Co" Copcnhngcll, 19,18, conlilins nil or Erlnng's pnpers tra~lslated into English.
',,,;
"
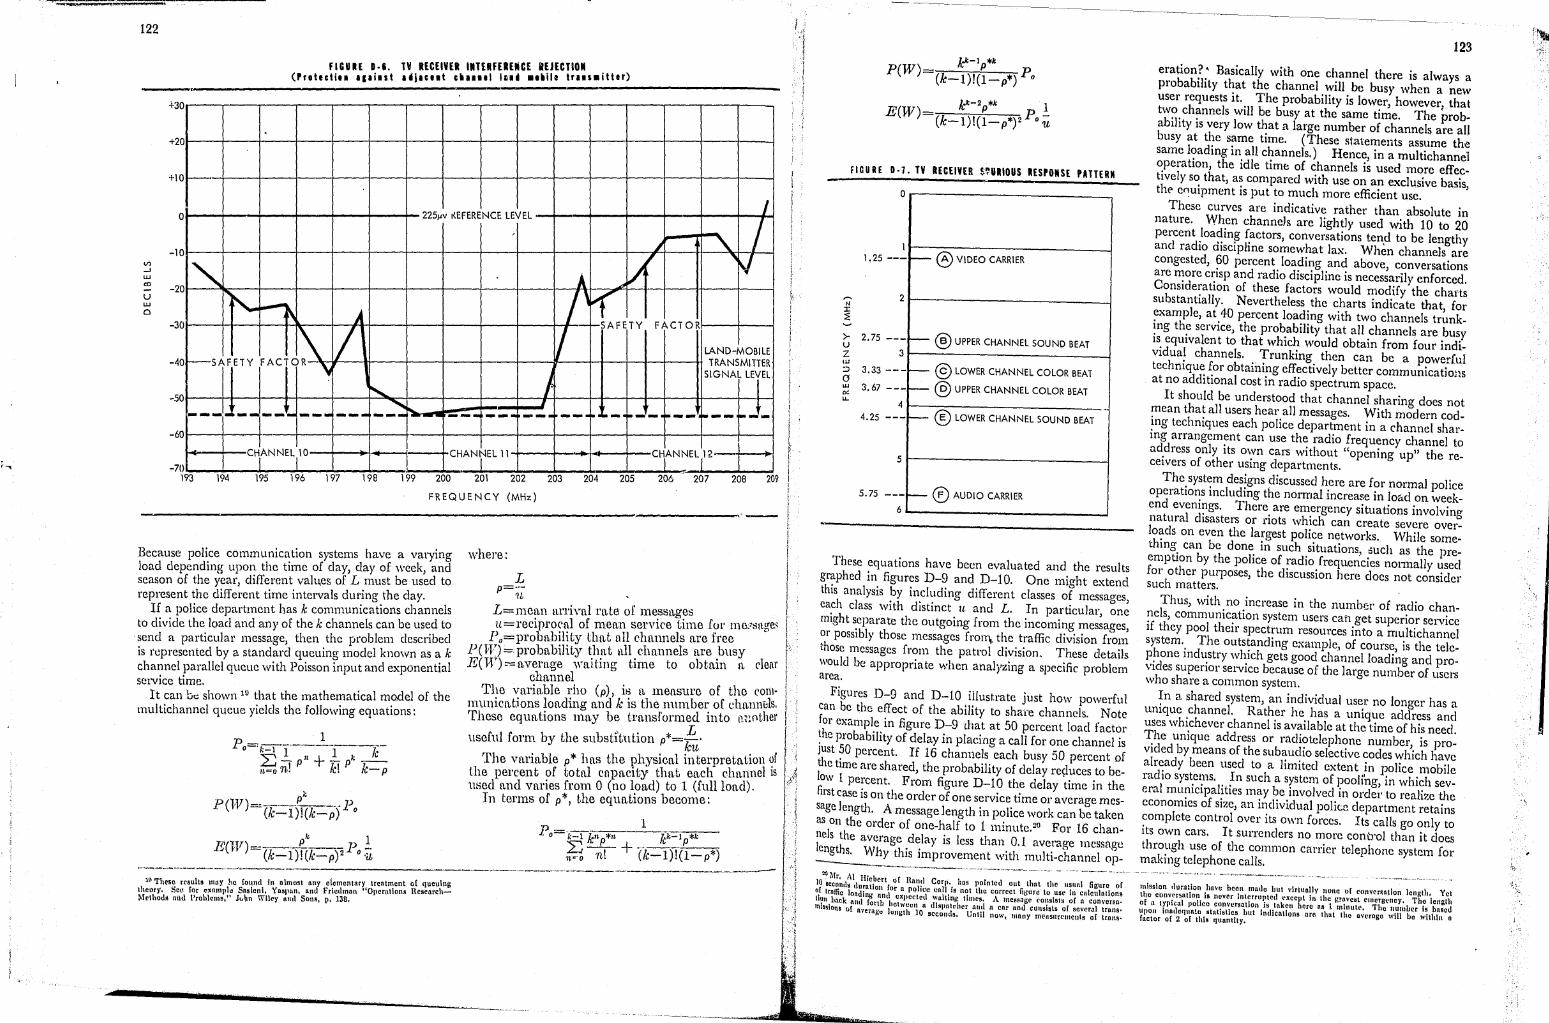
122
FIGUIE D· •• TV RECEIVER IIITERFEREliCE REJECTlOII . (Protecti ... ,.iut ._jacllt c~ .... 1 In ••• ~II, trlls.,_'_H_I_r_> __________ _ .
+30
+20
'1-10
I 2251'v r{EFERENCE LEVEL
/ 0
Vl ..J UJ
'" u UJ Cl
-1 0
-2 J'" ~ -f\
0
j\ o I.--SAF ETY FACT 0 R ,
-3
-4
50
A /1
......... .........
,
~ - ~
A l)' V
/ l' SAFETY FACTOR
V LAND-MOBILE TRANSMITTER
j. SIGNAL LEfL
J
---~. -- --'- --- --- ---t----- --- --- --- -_. 10 1._. 1--_. ~-- ~-- ~j-60
7() CHtNNELll0 CHAN~EL 11 CHtN~ELI12
193 194 195 196 197 198 199 2 00 201 202 203 204 205 206 207 208 20
FREQUENCY (MHz)
Because police communication systems have a varying load depending upon the time of day, clay of week, and season of the year, different valt~es of L .must be used to represent the different time intervals dUl:ll1g .the day.
If a police department has k commumcatlOns channels to divide the load and any of the k channels can be us~d to send a particular message, then the problem descnbed is represented by a standard queuing model known as ~ k channel parallel queue with l)oisson input and exponentIal service time.
It can be shown lU that the mathematical model of the mul tichannel queue yields the following equations:
1 PO=k-l 1 1 Ie 2:: - p 11 + _ pk __
n=o n! k! k-p
B(ll') k 1
(k-l)f(k-p)2 Po:u
111 ThcS6 results 1uny he round in nlnlOsl ony elementary treatment ~f qucutlng theory_ SM ror eXRml}1" Saslenl: Yasll""' Ilnd Friedmon "Qpcmtions cscarc 1-M(~thot.11\ altti Prohlems," Jti\m WU('y Ulul Sons, p. 13B.
where:
L p="
?L
L=mean arrival rate of mess[1,ges u=reciprocul of mean service time f?l' me~>~ltlge,
Po=probn,bility that an channels are 11'ee P( BY) = probability t)1.at ttll. ellanne1s are ,busy B(H')=average \\"al.tmg tIme to ohtam a clenT
channel The variable rho (p), is It measure of the com
IUul1icaUol1s loading and k is the,numbet: of chtUll1iJls: These equations may be translarmed ll1to rlilnthCl
b ·'. * L useful form by the su StltutlOll p = ku'
The variable p* has the physical interpretation 9f the percent of total copaCIty that each chl11meJ IS
used and varies from 0 (no l,oad) to 1 (full load). In terms of p*, the equatlOl1S become:
peW)
FIGURE 0·7. TV RECEIVUI S:I'UIOUS RESPOIlSE PATTERN
o----------------____________ ~
1.25 --- ® VIDEO CARRIER
N 2 J: ~
>- 2.75 --- ® UPPER CHANNEL SOUND BEAT U Z 3 'u
@LOWER CHANNEL COLOR BEAT ::J 3.33 ---0
@) UPPER CHANNEL COLOR BEAT w 3.67 ---"'-u.
4 4.25 --- ® LOWER CHANNEL SOUND BEAT
5
5.75 ® AUDIO CARRIER 6
These equations have been evaluated and the results graphed in figures D-9 and D-10. One might extend this analysis by including different classes of messages, each class with distinct u and L. In particular, one might separate the outgoing from the incoming messages, or possibly those messages fr011\ the traffic division from those messages from the patrol division. These details would be appropriate when analyzing a specific problem area.
Figures D-9 and D-lO illustrate just how powerful can be the effect of the ability to share channels. Note for example in figure D-9that at 50 percent load factor the probability of delay in placing a call for one channel is just 50 percent. If 16 channels each busy 50 percent of the time are shared, the probability of delay repuces to below 1 percent. From figure D-I0 the delay time in the first case is on the order of one service time or average message length. A message length in police work can be taken as on the order of one-half to 1 minute.20 For 16 channels the average delay is less than 0.1 average message lengths. Why this improvement with multi-channel op-
!.'(\ Mr. Al Hiebert of Rand Corp. has pointed out that the ulJllnl figure of 10 sccnntis durntion lor n polil,.·c call is not the correct nt~ure to "Sl' in ciliculations fllr~fic londln., antI expected wnhill~ times. A IllcIlosngc l'onsisis of n cum'Crsa. 11\ nck nlHl forth het ..... een u disJllltcher nntl n cnr nntl consists of scvcf.11 truns. m ss OilS of nvel'aglj )ungth 10 seconds. Until now, IHRny mel1snrclJlcuts of trans-
123
eration?' Basically with one channel there is always a probability that the channel will be busy when a new user requests it. The probability is lower, however) that two channels will be busy at the same time. The probability is very low that a large number of channels are all busy at the same time. (These statements assume thl!! same loading in all channels.) Hence, in a multichannel operation, the idle time of channels is used more effectively so that, as compared with use on an exclusive basis, the el1uipment is put to much more efficient use.
These curves are indicative rather than absolute in nature. When channels are lightly used with 10 to 20 percent loading factors, conversations ten.d to be lengthy and radio discipline somewhat lax. When channels are congested, 60 percent loading and above, conversations are more crisp and radio discipline is necessarily enforced. Consideration of these factors would modify the charts substantially. Nevertheless the charts indicate that, for example, at 40 percent loading with two channels trunking the service, the probability that all channels are busy is equivalent to that which would obtain from four individual channels. Trunking then can be a powerful technique for obtaii1ing effectively better communications at no additional cost in radio spectrum space.
It should be understood that channel sharing does not mean that all users hear all messages. With modern coding techniques each police department in a channel sharing arrangement can use the radio frequency channel to address only its Own cars without "opening up" the receivers of other using departments.
The system designs discussed here are for normal police operations including the normal increase in lOad on weekend evenings. There are emergency situations involving natural disasters or riots which can create severe overloads on even the largest police networks. While something can be done in such situations, 6uch as the preemption by the police of radio frequencies nOl1nally used for other purposes, the discllssion here does not consider sllch matters.
Thus, with no increase in the number of radio channels, communication system llsers cai1 get superior service if they pool their spectrum resources into a multichannel system. The outstanding example, of course, is the telephone industry which gets good channel loading and provides superior service because of the large number of users who share a common system.
In a shared system, an individual user no longer has a unique channel. Rather he has a unique address and uses whichever channel is available at the time of his need. The unique address or radiotelephone number, is provided by means of the subauclio selective codes which have already been used to a limited extent in police mobile radio systems. In such a system of pooling, in which severalmunicipalities may be involved in ordel' to realize the economies of size, an individual police department retains complete control over its own forces. Its calls go only to its own cars. It surrenders no more control than it does through use of the common carrier telephone system for making telephone calls.
mission durutlon have been mode hut virtunlly nonc or conv~rgntlon length. Yet thQ COnVCf!!ntIon Is never interrupted t"Xccllt in the (.trllvest emergency. Tho lenRlh of n t)'pleal pollce conversation is taken here us t minute, The numher is hRBet! Upon inadequato statistics hut IndicRtlons nre thut tho QV('rnga will Ue within R factor of 2 of this quantity.
I
I

124
FlCIlE I·'. U .. ·.D.IlE FIECilUCY &,-SIC.IIElT (ftr 1!I·.iI, li.i ••• Uj.ctlt Ch ... I)
LAND-MOBILE CO-AREA TV NO. OF TRANSMITTERS TRANSMITTERS ASSIGNABLE
INVHF INVHF LAND-MOBILE CHANNELS CHANNELS 25 KHz CHANNELS
''''~"'l ~ ~-cp J 36 16 1900 KH~ I 400 KH~ 2, 5, or 7 3, 6, or 8 82
I 0
2 & 4, 7 & 9, 3,8, 9, 10,11, 9&11,10&12, 42 or 12 I or 11 & 13
0
4, 6, or 13 3, 5, or 12 139 I
0
AS A REFERENCE
VHF FREQ VHF FREQ CHANNEL (MHz) CHANNEL (MHz)
2 54-60 7 174-180 3 60-66 8 180-186 4 66-72 9 186-192 5 76-82 10 192-198 6 82-88 11 198-204
12 204-210 13 210-216
DESION TECHNIQUES APPLIED TO WASHINGTON METROPOLITAN AREA 21
Present Situation in Washington Metropolitan Area
The Washington metropolitan area (fig. D-11), is defined here to include the District of Columbia, Montgomery and Prin~e Georges .C~unties in M~ryland, and Arlington and FaIrfax Counties, Va., and the mde~ndent city of Alexandria, Va. It is an area of approxunately 1,400 square miles with ap~roximately 2 million inhabitants. This complex compnses two States and a Federal jurisdiction.
The D.C. metropolitan police force, serving 61.4 square miles and 764,000 people, currently uses three duplex channels to control a mobile fleet of approximately 106 cars on patrol at anyone time.22 See table D-6. In
:l Acknowlcd~m.nt 01 s .. I.lsnce provided hy Inapeclor McAuliffe 01 the W .. h. inglon MetropoUlan Police .hould be noted but not interpreted as prior approval un his part nor on the port of his organization oJ the viewpoint developed here.
~~ In all of the diacullion, here, numben fIr pahca patrol care are taken ." equal
'*-
1 ~ I I
4 5 6 1 3 FREQUENCY (MHz)
I T r~%,!~KH; T I 1 2 3 4 5 6
FREQUENCY (MHz)
~ ~ ~ 49 28 ~ 56 6 1400 MHz li.E::5O KHz
® ® © @
CD o
1 1225 MHz !If 700 MHzlil
: ~ ~ I ; 4
FREQUENCY (MHz)
VLDEO CARRIER
UPPER CHANNEL SOUND BEAT, 1M PRODUCT
LOWER CHANNEL COLOR BEAT
UPPER CHANNEL CARRIER BEAT
LOWER CHANNEL SOUND BEAT, 1M PRODUCT
AUDIO CARRIER ~
36 NUMBER OF CHAl'tNELS AVAILABLE
I 6
Table D-6.-District of Columbia Police Department Radi() Frequencies
Channel
L ................................... .
2 .................................... .
3 ................................... ..
Green (Precinct Nos. I, i, 3, S 8,11 and 12).
Red (PreCinct Nos. 4,5,7,9, 10,13 and 14).
Other ................................ .
Frelluency (MHz)
155.250 159.030 155.310 158.850 155.415 159.150 154.80 154.920 156.030 156.090 154.890 155.515 453.550
Base. Mobile. Base. Mobile. BlSe. Mobile. Base. ratrolmen. Blse. P,lloimen.
User
Civil'dlsturbance. Handl,\lIk~. Radal hlndl·talkie. Metropolitan Area Intersysteml
communicltion.
to the number of police pltrol beats or lectort. and hence do not lDdud~ ,ule~ visory vehiclea, detective vehicles, traffic .quad-if organ bed leplrately fO patrol units-or undercover vehiclea.
H 11 " n ',.j ) 1
,)
-------'--------------------------------------------------
milE •••• PlOIUI\\lTY OF DELAY III IUlmlAilMEl SYSTEIS
1.01.-----,------,-----,--___ ,--__
>-Vl :::> co 0.1 UJ
'" « Vl oJ w Z Z « J: U oJ oJ <{
f-« J: f-
>-
= oJ
;;; 0.01 « co 0
'" o.
O.OOI~ __ L_~~----~~--.--~,------~----~ 0.2 0.4 0.6 0.8 1.0 COMMUNICATI ONS LOAD FACTOR
addition, two duplex channels are used in a well-designed syste?1 for communicating with foot patrolmen from the precmct houses. These latter channels will not be rc!cr:ed to again as the need for them is peculiar to the DistrIct and the small size constraints on handi-talkies inhibits the use of multiple channels in any sharing arrangcmen t.
Montgomery County, bordedng the District to the ~h and west, controls approximately 40 mobile units
125
mUlE D·It. EXPECTED WAITING TilES IN MULTICHANNEL SHTEIS
l00.0r------.~~ __ -r ______ .-______ .-____ ~
-' w Z Z 4: :r: u 0< 10.0 4: w -' u 4:~
z II - .S 4:1-I- ~ co .~ 02;
~
0;:: I- 0
1'-' ~
:Eil - ~ I-Z Cl~
Z
= 4: 1.0 3: Cl w I-U w D-
X w
COMMUI'ICATIONS LOAD FACTOR
on patrol by means of two simplex channels, reserving a third simplex channel for emergency usc. The county police department is responsible for the policing of all of MontgomelY County, approximately 500 square miles and 341,000 people, with the exception of the city of Takoma Park which is partly within Montgomery County and partly within Prince Georges Count)'. Table D-7 summarizes the police radio frequency usage in the Washing-
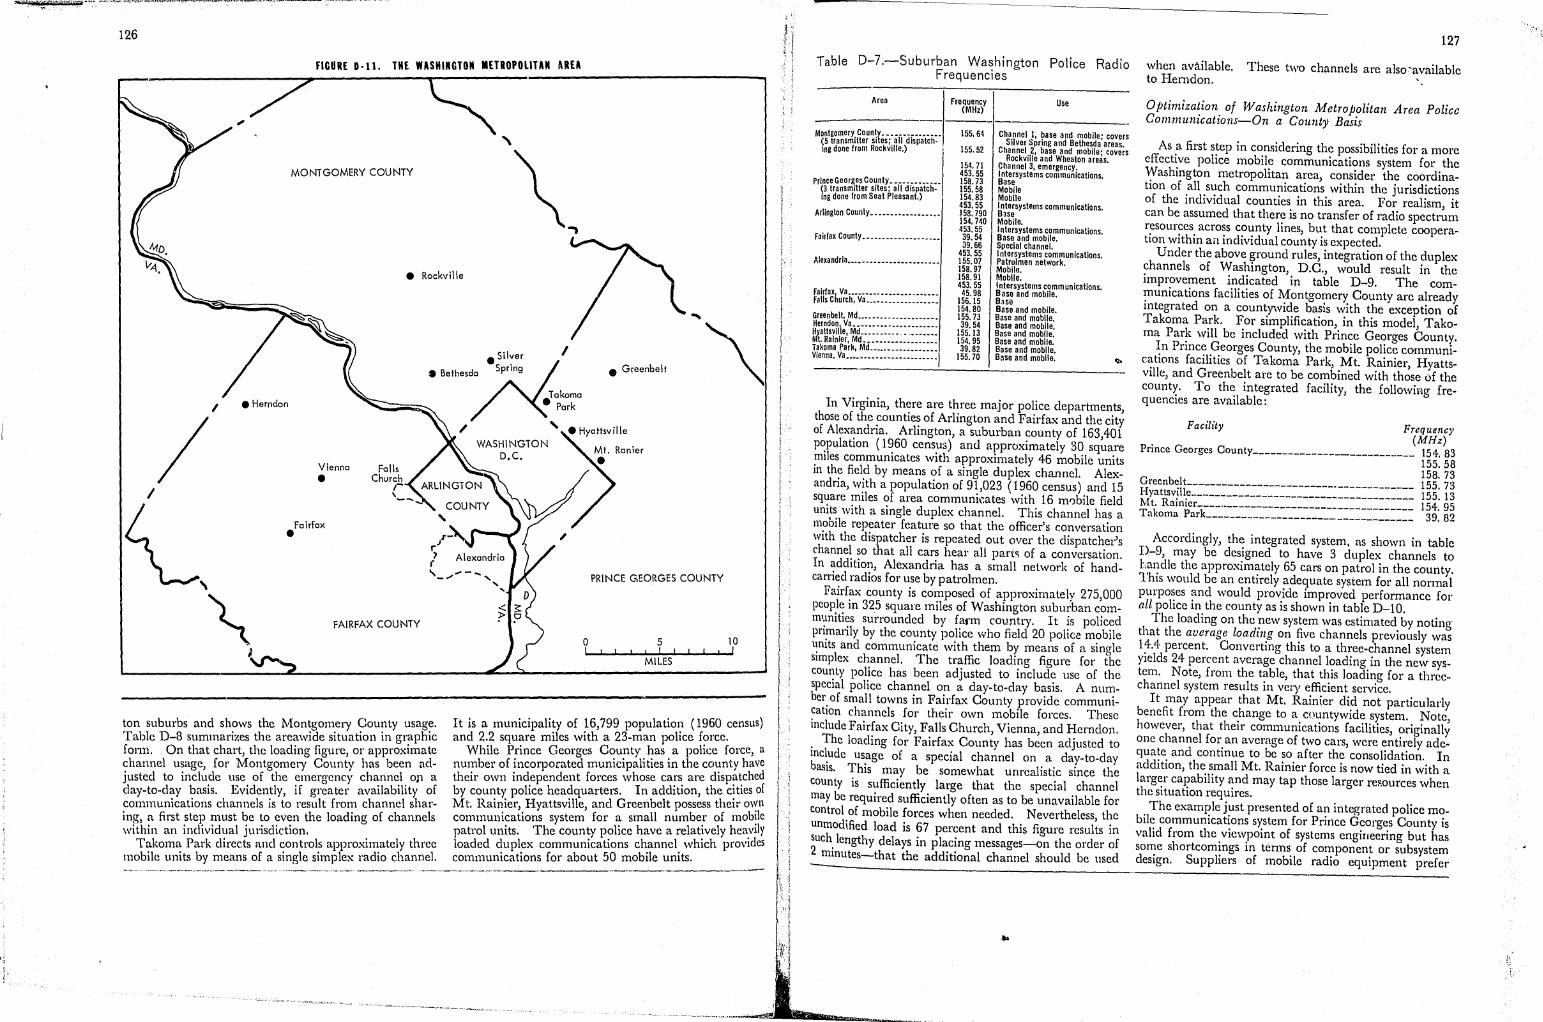
126
FIGURE D·ll. THE WASHINGTON METROPOLITAN IIREA
/7 MONTGOMERY COUNTY
• Rockville
• Bethesda • Greenbelt
I • Herndon
/ ~,
~
Vienna
• Fairfax •
FAIRFAX COUNTY
ton suburbs and shows the Montgomery Oounty usage. Table D-8 summarizes the areawide situation in graphic form. On that chart, the loading figure, or approximate channel usage, for Montgomery Oounty has been adjusted to include use of the emergency channel OIl a day-to-day basis. Evidently, if greater availability of communications channels is to result from channel sharing, a first step must be to even the loading of channels within an individual jurisdiction.
Takoma Park directs and controls approximately three mobile units by means of a single simplex radio channel.
WASHINGTON D.C.
PRINCE G.EORGES COUNTY
o 5 10 I ' ! I
MILES
It is a municipality of 16,799 population (1960 census) and 2.2 square miles with a 23-man police force.
While Prince Georges Oounty has a police force, a number of incorporated municipalities in the county have their own independent forces whose cars are dispatched by county police headquarters. In addition, the cities of Mt. Rainier, Hyattsville, and Greenbelt possess their O\~n communications system for a small number of mob!le patrol units. The county police have a relatively heaylly loaded duplex communications channel which provIdes communications for about 50 mobile units.
Table D-7.-Suburban Washington Police Radio Frequencies
Area
Montgomery County .............. . (5 transmitter sites; all dispatch. ing done from Rockville.)
Prince Georges County ........... .. (3 transmitter sites; all dispatch· ing done from Seat Pleasant.)
Arlington County ................ ..
Fairfax County .................. ..
Alexandria ....................... .
Fairfax/Va ....................... .. Falls Cnurch, Va .................. .
Greenbelt, Md .................... . Herndon, Va .................... .. Hyaltsvllle, Md.. ................. . Mt. Rainier, Md ................. .. Takoma Park, Md ................ .. Vienna. Va ...................... ..
Frequency (MHz)
155.64
155.52
154.71 453.55 158.73 155.58 154.83 453.55 158.790 154.740 453.55 39.54 39.66
453.55 155.07 158.97 158.91 453.55 45.98
156.15 154.80 155.73 39.54
155.13 154.95 39.82
155.70
Use
Channell, base and mobile' covers Sliver Spring and BetheSda' areas.
Channel 2, base and mobile' covers Rockville and Wheaton areas.
Channel 3, emergency. Intersystems communications. Base Mobile Mobile Intersystems communications. Blse Mobile. Intersystems communications. Base and mobile. Special channel. Intersystems communications. Patrolmen network. Mobile. Mobile. Intersystems communications. Base and mobile. B.lse Base a nd mobile. Base and mobile. Base and mobile. Base and mobile. Base and mobile. Base and mobile. BBse and mobile .
In Virginia, there are three major police departments those of the ~ountie~ of Arlington and Fairfax and the cit; of Alex~ndna. Arlmgton, a suburban county of 163,401 p~pulatlOn (1~60 cens~3) and approximately 30 square ~Iles commUlllcates With approximately 46 mobile units In the field by means of a single duplex channel. Alexandria, w~th a population of 91,023 (1960 census) and 15 square mtles of area communicates with 16 m0bile field uni:~ with a single duplex channel. This channel has a moolle repeater feature so that the officer's conversation with the dispatcher is repeated out over the dispatcher's channel so that all cars heal' all part.q of a conversation. In addition, Alexandria has a small network of handcarried radios for use by patrolmen.
Fairf~x county is composed of approximately 275,000 peop.l~ m 325 square miles of Washington suburban comm'~l11tJ~s surrounded by farm country. It is policed pn;nanly by the county police who field 20 police mobile l~l11ts and communicate with them by means of a single SImplex channel. The traffic loading figure for the cou~ty pol.ice has been adjusted to include use of the speCial pohce channel on a day-to-day basis. A number. of small towns in Fairfax Oounty provide communication channels for their own mobile forces. These include Fairfax Oity, Falls Ohurch, Vienna, and Herndon. . The loading for Fairfax Oounty has been adjusted to lnc~ude us.age of a special channel on a day-to-day basiS. ThiS may be somewhat unrealistic since the county is sufficiently large that the special channel may be required sufficiently often as to be unavailable for control of mobile forces when needed. Nevertheless, the unmodified load is 67 percent and this figure results in Such. lengthy delays in placing messages-on the order of 2 mmutes-that the additional channel should be used
...
127
when available. These two channels are also~available to Herndon.
Optimization of Washington "Metropolitan Area Police Communications-On a County Basis
As a first step in considering the possibilities for a more effect~ve police mobil~ communications system for the ':¥ashmgton metropohtan area, consider the coordinatIOn of all such communications within the jurisdictions of the individual counties in this area. For realism, it can be assumed that there is no transfer of radio spectrum r~sour~es. acro~s C?1:Inty lines, b~t that complete cooperatIon wlthm an mdlvldual county IS expected.
Under the above ground rules, integration of the duplex channels of Washington, D.O., would result in the improvement indicated in table D-9. The com~unications facilities of Montgomery County are already mtegrated on a countywide basis with the exception of Takoma Park. For simplification, in this model Takoma Par~ will be included with Prince Georges County.
~n Prmc~ .~eorges Oounty, the mobile police communic~tl(lns faCIlItIes of Takoma Park, Mt. Rainier, HyattsvIlle, and Greenbelt are to be combined with those of the county. To the integrated facility, the following frequencies are available:
Facility Fr.1quenC)' (MHz)
Prince Georges County ___________________________ 154. 83
155.58 158. 73
~{E1i~i~~~~~~~~~~~:~~~:~~~~~:~~~~~~~ !ll ii Accordingly, the integrated system, as shown in table
D-9, may be des.igned to have 3 duplex channels to h~~dle the approxlm~tely 65 cars on patrol in the county. l111s would be an entirely adequate system for all normal purpo~es ~nd would pro,,:ide improved performance for all polIce m the county as IS shown in table D-IO.
The loading on the new system was estimated by noting that the average loadin;g on ~ve channels previously was 1~.4· percent. Oonvertmg thIS to a three-channel system YIelds 24 percent average channel loading in the new system. Note, from the table, that this loading for a threechannel system results in ver)' efficient service.
It may appear that Mt. Rainier did not particularly benefit from the c.hange to a countywide system. Note, however, that their communications facilities, originally one channel for. an average of two cars, were entirely adequa~e. and contmue to be so after the consolidation. In addItIOn, the small Mt. Rainier force is now tied in with a larger capability and may tap those larger reRources when the situation requires.
. The exam~le j~st presented of an integrated police mobile commUl11CatlOns system for Prince Georges Oounty is valid from the viewpoint of systems engineering but has some shortcomings in tenns of component or subsystem design. Suppliers of mobile radio equipment prefer

128
TABLE 0-8, - SUMMARY OF CURRENT POLICE SPECTRUM LOADING IN WASHINGTON METROPOLITAN AREA
No. Mobiles on Modified Probabil ity User Pat ro 1 at One Load of
Original Position Diagram Load Time (approx. ) (See Text) Delay
155.250 [5] 159.030 .. • Washington, D. C. .. 155.310 [5] 158.850. 37'A 105 ---- .37
-155.415 fiil 159.150.
IDJ .. '55.64 ..
Montgomery County [Q] .. 155.52 .. 55% 40 36% .'11 (Integrated)
( Eme rg e n cy) fDl .. 154.71 ..
Takoma Pa rk [Q]- 39.82 .. 6% 3 ---- .06
Prince reorges ]< _'58.73 [Q] 154 50% 50 ---- .50 Coun ty ·8)
Mt. Rainier fDl.154.95. 2% 2 ---- .02
Hya tts vi 11 e fDl .. 155.13 ... 8% 5 ---- .08
Greenbelt 1Dl .. 155.73_ 6% 3 - --- .06
Arlington County .. 158.790 fiil 154.740. 50% 46 ---- .50
Alexandria .. 155.07 fiil 158.97 8% 16 .08
Fairfax (Ci ty) fiil. 45 .9~ 13% 2-3 -- -- .13
Fall s Church .. 156.15 fiil .. 1 54 . 80 • 14% 4 ---- .14
Vienna fDl .. 155.70 ... 3% 3 ---- .03
Herndon1 [Q] .. 39 .5~ 67% 1 33% .16
fiil. 39.51-Fa i rfax Coun ty 67% 20 33% .16
fiil ... 39.6..L
lShares channel with Fairfax County
Code: [[] Dispatcher
------ Simplex Radio Channel
-illL- Talk-out Half of Duplex
[[l. Tal k-in Hal f of Duplex
Expected Delay
(Seconds)
36
4.5
4.2
60
1.2
5.4
4.2
60
5,4
7.8
B,4
1.8
7.2
7.2
i 1 I
" ~
I I
.~
129
TABLE 0-9. - POLICE SPECTRUM LOADING IN COORDINATED COUNTY SYSTEMS
User Diagram Load
.. '55.250 fDl 159.030. Washington, D. C. 155.310 [Q] 158.850. 37% ..
.. 155.415 IDl 159.150.
.. '58.73 IDl 155.73 Integrated • Prince Georges .. '54.95 rDl 155.5Q.- 24% County .. 154.83 rDl 155.13 •
[5] .. 155.64 .. Montgomery Coun ty IDl • 155.52 .. 36% (unchanged)
lID .. 154.71 ..
Ar1 i ngton .'58.790 rDl 154.740 50% Cou n ty
Alexandri a .. '55.07 rDl 158.97 • 8/;;
.. 154.80 lID 45.98 • Integrated Fairfax .. '56.15 lID 39.54 32% Coun ty •
.'55.70 101 39.66 •
'Shares channel with Fairfax County
Code: I]J Dispatcher
--- Simplex Radio Channel
-.D[L Talk-out Half of Duplex
[[L.. Talk-in Half of Duplex
Table D-10,-Communications Delays Within Prince Georges County
Police department Present communications
system Inteerated County
System
-- I Expected-Probability 4elay Probability
of delay (seconds) of Delay
Expected Delay
(seconds) -------1------------__ ._ ~ __ Greenbelt Hya ItsV'lIe'-' -'" '.-. -- - -" -'-'
~k~ai~iper'-k'~:::::::::::::: :::: Princ~~ ar .......... - ....... .
eorges County ___ ....... _
0.06 .08 .02 .06 .50 I
3.7 5.1 1.2 3,7
60.0
0.04 1.2
No. of Mobile Units On IProbabil it,}' Expected Delay Pat ro 1 at Any Time of (approx. ) Delay (Seconds)
106 .12 4.8
65 .04 1.'2
40 .11 4.5
46 .5 60
16 . [:8 5.4
30 .08 2.4
closely spaced channels in order to simplify the design of their equipment and so keep costs within limits. The frequencies available to Prince Georges County are awkwardly spaced for inclusion in a single multichannel set due to the 158,73 MHz frequency and indicate the shortcomings and the additional costs involved in pooling on a relatively small base. Thus, the economies of scale that result from coordinated communications networks are twofold. First, the efficiencies derived from channel sharing and the resulting decrease in probability of delay in placing calls are more impressive as more channels are used. Second, the larger the base for the coordination,
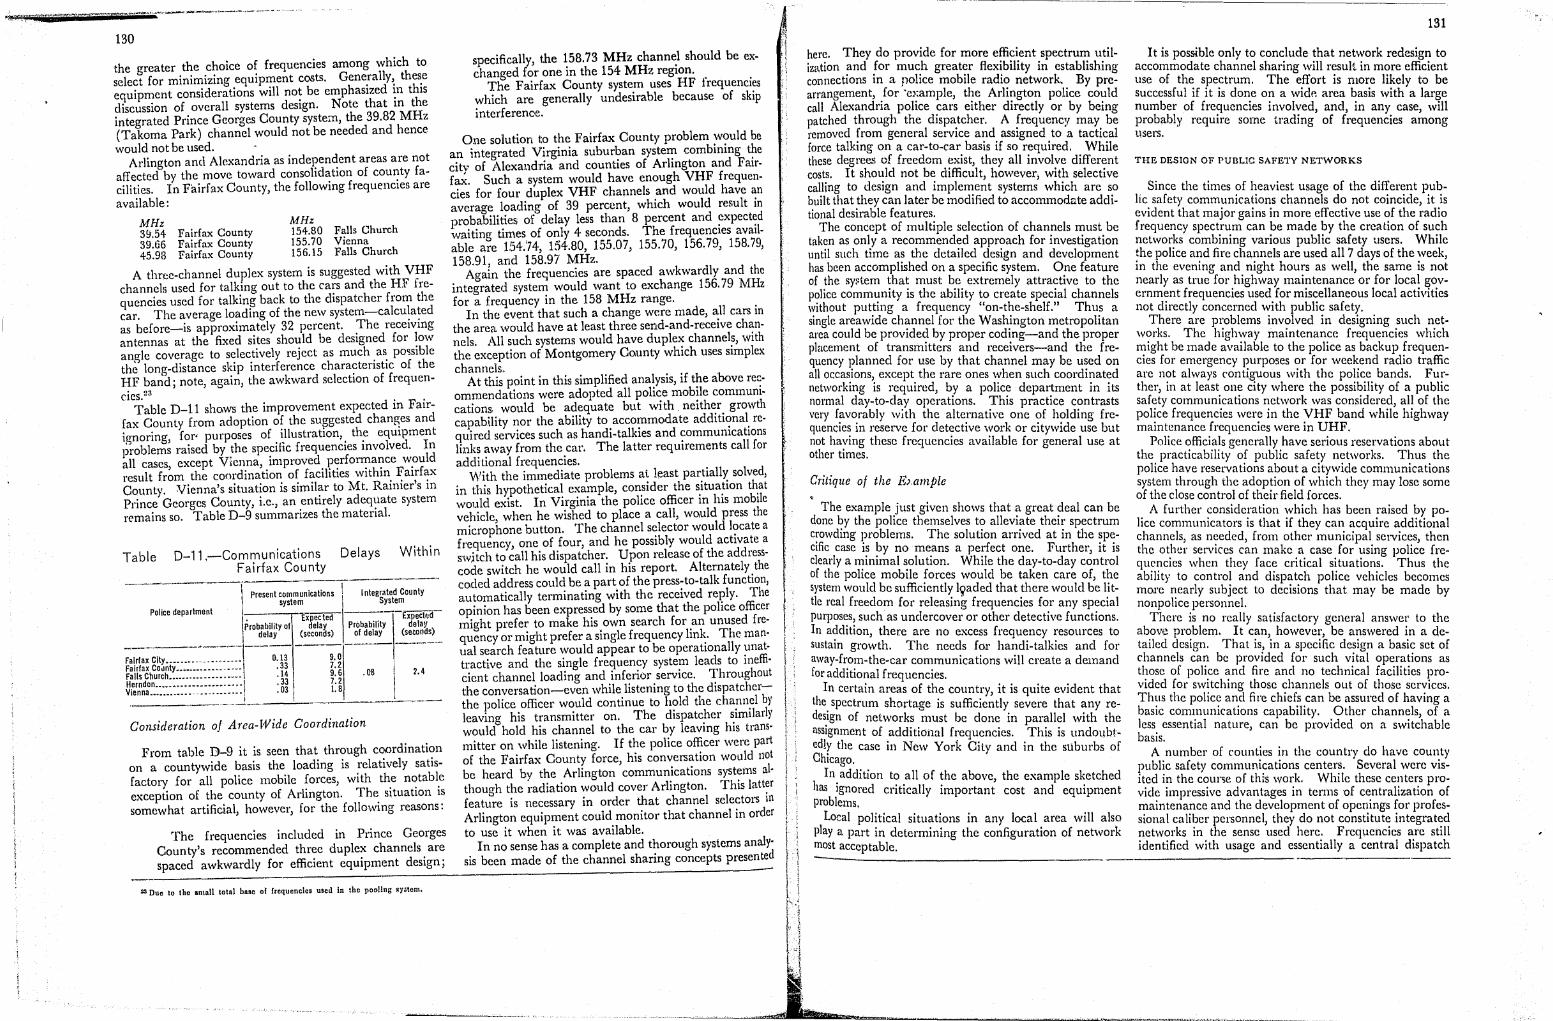
130
the greater the choice of frequencies among which to select for minimizing equip~ent costs. Gene.rally,. the~e equipment considerations WIll no! be emphasIzed ~n thIS discussion of overall systems desIgn. Note that m the integrated Prince Georges County system, the 39.82 MHz (Takoma Park) channel would not be needed and hence would not be used.
Arlington and Alexandria as indel?en~ent areas are not affected by the move toward consohd~tlOn of COUI~ty facilities. In Fairfax County, the followmg frequencIes are available:
MHz MHz 3!i.54 Fairfax County 154.80 Falls Church 39.66 Fairfax County 155.70 Vienna 45.98 Fairfax County 156.15 Falls Church
A three-channel duplex system is suggested with V:~fF channels used for talking out to the cars and the HF trequencies used for talking back to the dispatcher from the car. The average loading of the new system-calculated as before-is approximately 32 percent. The receiving antennas at the fixed sites should be designed for low angle coverage to s~lec.tively reject as much .as. possible the long-distance skip mterference characterIStIc of the HF band i note, again, the awkward selection of frequen-cies.23
Table D-l1 shows the improvement expected in Fair-fax Counly from adoption of the su~gested chan~es and ignoring, fof' purposes of. ~llustratlOn,. th.e eqUIpment problems raised by ~he spe~lhc frequencIes mvolved. In all cases, except Vienna, .Improved.l?~rfo~at;ce w.ould result from the conrdinatlOn of faclhtles wlthm FaIrfax County. Vienna's situation is similar to Mt. Rainier's in Prince Georges County, i.e., an entirely adequate system remains so. 'Table D-9 summarizes the material.
Table D-11.-Communications Delays Within Fairfax County
____ ~ ___ -_--c ____ ------------
Present communications I ntegrated County system System
Police department 1----r-1xpected -----ExpectfJd Probability of delay Probability delay
delay (seconds) of delay (seconds) .----~---------------- -------
Fairfax City •••. __ •• -. _ .• , .-.--. Fairfax Co~nty •• ______ .... __ •.•• Falls Church. ____ .............. · Herndon ... __ ......... ---- ..... \ Vienna ___ • __ ._ .... --.• -...... - -,
0.13 .33 .14 .33 .03
9.0 7.2 9.6 7.2 1.8
.08
~I. ____ ~---~-----~
Consideration of Area-Wide Coordination
2.4
From table D-9 it is seen that through coordination on a countywide basis the loading is relatively satisfactory for all police mobile forces, with the notable exception of the county of Arlington. The situation is somewhat artificial, however, for the following reasons:
The frequencies included in Prince Georges County's recommended three duplex channels are spaced awkwardly for efficient equipment design;
23 DUD to the smoll totnl baso of frequencies used in the pooUng M.)';;tem.
specifically, the 158.73 MHz channel should be ex-changed for one in the 154 MHz region. . .
The Fairfax County system uses HF frequenCies which are generally undesirable because of skip interferenc'e.
One solution to the Fairfax County problem would be an integrated Virginia suburban system combining the citV' of Alexandria and counties of Arlington and Fair· f~. Such a system would have enough VHF frequen. cies for four duplex VHF channels and would have an average loading of 39 percent, which would result in probabilitie~1 of delay less than 8 percent and ~xpect:d waiting times of only 4 seconds. The frequencIes aVailable are 154.'74, 154.80, 155.07, 155.70, 156.79, 158.79, 158.91, and 158.97 MHz.
Again the frequencies are spaced awkwardly and the integrated system would want to exchange 156.79 MHz for a fre.quency in the 158 MHz range.
In the event that such a change were made, all cars in the area would have at least three send-and-receive chan· nels. All such systems would have duplex channels, with the exception of Montgomery County which uses simplex channels.
At this point in this simplified analysis, if the ahove rec· ommendations were adopted all police mobile communications, would be adequate but with. neither growth capability nor the ability to accommodate additional required services such as handi-talkies and ~ommunications links away from the car. The latter reqll1rements call for additional frequencies.
vVith the immediate problems at least partially solved, in this hypothetical example, consider the situation that would exist. In Virginia the police officer in his mobile vehicle, when he wished to place a call, would press the microphone button. The channel selector would locate a frequency, one of four, and he possibly would activate a switch to call his dispatcher. Upon release of the addresscode switch he would call in his report. Alternately the coded address could be a part of the press-to-talk function, automatically terminating with the received rel?ly. The opinion has been expressed by some that the pohce officer might prefer to make his own search for an unused frequency or might prefer a single frequency link. The manual search feature would appear to be operationally unattractive and the single frequency system leads to ineffi· cient channcl loading and inferior service. Throughout the conversation-even while listening to the dispatcherthe police officer would continue to hold the channel by leaving his transmitter on. The dispatcher similarly would hold his channel to the car by leaving his transmitter on while listening. If the police officer were part of the Fairfax County force, his conversation would !lot be heard by the Arlington communications systems al· though the radiation would covel' Arlington. This latt~r feature is necessary in order that channel selectors III
Arlington equipment could monitor that channel in order to use it when it was available.
In no sense has a complete and thorough systems analysis been made of the channel sharing concepts presented
here. They do provide for more efficient spectrum utiliz~\tion and for much greater flexibility in establishing connections in a police mobile radio network. By prearrangement, for 'example, the Arlington police could call Alexandria police cars either directly or by being patched through the dispatcher. A frequency may be removed from general service and assigned to a tactical force talking on a car-to-car basis if so required. While these degrees of freedom exist, they all involve different costs. It should not be difficult, however, with selective calling to design and implement systems which are so built that they can later be modified to accommodnte additional desirable features.
The concept of multiple selection of channels must be taken as only a recommended approach for investigation until such time as the detailed design and development has been accomplished on a specific system. One feature of the sy~tem that must be extremely attractive to the police community is the ability to create special channels without putting a frequency "on-the-shelf." Thus a single areawide channel for the Washington metropolitan area could be provided by proper coding-and the proper placement of transmitters and receivers-and the frequency planned for use by that channel may be used on all occasions, except the rare ones when such coordinated networking is required, by a police department in its normal day-to-day operations. This practice contrasts very favorably with the alternative one of holding frequencies in reserve for detective work or citywide use but not having these frequencies available for general use at other times. .
Critique of the Ewmple . The example just given shows that a great deal can be
done ~y the police themselves to alleviate their spectrum c~owdmg problems. The solution arrived at in the speCific case IS by no means a perfect one. Further, it is clearly a minimal solution. While the day-to-day control of the police mobile forces would be taken care of, the system would be sufficiently 19aded that there would be little real freedom for releasing frequencies for any special purposes, such as undercover or other detective functions. In addition, there are no excess frequency resources to sustain growth. The needs for handi-talkies and for away-from-the-car communications will create a demand for additional frequencies.
In certain areas of the country, it is quite evident that the. spectrum shortage is sufficiently severe that any redes.lgn of networks must be done in parallel with the assignment of additional frequencies. This is undoubtedly the case in New York City and in the suburbs of Chicago.
In. addition to all of the above, the example sketched has Ignored critically important cost and equipment problems.
Local political situations in any local area will also playa part in determining the configuration of network most acceptable.
131
It is possible only to conclude that network redesign to accommodate channel sharing will result in more efficient use of the spectrum. The effort is more likely to be successful if it is done on a widp. area basis with a large number of frequencies involved, and, in any case will probably require some trading of frequencies a:Uong l\Sers.
THE DESIGN OF PUBLIC SAFETY NETWORKS
Since the times of heaviest usage of the different public safety communications channels do not coincide, it is evident that major gains in more effective use of the radio frequency spectrum can be made by the creation of such networks combining various public safety users. While the police and fire channels are used all 7 days of the week, in the evening and night hours as well, the same is nat nearly as true for highway maintenance or for local government frequencies used for miscellaneous local activities not directly concerned with public safety.
There are problems involved in designing such networks. The highway maintenance frequencies which ~ight be made available to the police as backup frequencies for emergency purposes or for weekend radio traffic are not always contiguous with the police bands. Further, in at least one city where the possibility of a public safety communications network was considered, all of the police frequencies were in the VHF band while highway maintenance frequencies were in UHF.
Police officials generally have serious reservations about the practicability of public safety networks. Thus the police have reservations about a citywide communications system through the adoption of which they may lose some of the close control of their field forces .
A further consideration which has been raised by police communicators is that if they can acquire additional channels, as needed, from other municipal services then the other services can make a case for using poli~e frequencies when they face critical situations. Thus the ability to control and dispatch police vehicles becomes mare nearly subject to decisions that mav be made by non police personnel. .
There is no really satisfactory general answel' to the abov.,! problem. It can, however, be answered in a detailed design. That is, in a specific design a basic set of channels ca~ be provided for such vital operations as tl;ose of poh~e ~nd fire and no technical facilities pro· vlded for sWitchll1g those channels out of those services. Thus the police and fire chiefs can be assured of having a basic communications capability. Other channels, of a less essential nature, can be provided on a switch able basis.
A number of counties in the country do have county public safety communications centers. Several were visited in the course of this work. While these centers provide impressive advantages in terms of centralization of maintenance and the development of openings for professional caliber personnel, they do not constitute integrated networks in the sense used here. Frequencies are still identified with usage and essentially a central dispatch

~oint is created for a large numbtt of individual mobile mdio nC!tworks. Nevertheless, these centers represent a distinct advance over the patchwork Df small separate wmmunidttions centers that exist in most counties.
Some cities, notably Los Angeles) Chicago, and New York, have such large police departments that they already have the advantages of scale needed to develop networks along the lines proposed here. In any future developments in such cities, a distinet and entirely separate police dispatching center would continue to be required.
Despite the independer'c~ o~ th: large police com~unications network, however, It IS still possible, even In the larger cities, for the municipal government to make channels available to the police dispatcher for use on weekends and under emergency conditions.
The possibility of viewing public safety needs from a total municipa' viewpoint has important implications in terms of FCC allocations and assignments. These topics are considered separately.
THE RELATIONSHIP BETWEEN THE POLlCE AND THE FCC 2·1
THE POLICE/FCC INTERFACE
The allotment of different portions of the spectrum to different usage is carried out by international agreement. Within the United States and in the nongovernment sedor of the radio spectrum, the allocation of bands of frequencies to different nongovernmental services is determined by the FCC. ''''ithin the framework of these allocations, assignments of individual frequencies to individual users, excluding agencies of the Federal Government, is then made by the FCC. The coordination of activities in the Government bands-which refers to Federal Government only since State and local government use of the radio spectnlm is under FCC jurisdiction-is carried out by the Intragovernmental Radio Advisory Committee (IRAC). IRAC has a pef!11anent staff located in the Office of Telecommunications Management of the Executive Office of the President.
In earlier years it was not uncommon for considerable sharing of frequency resources to exist on a somewhat infoi'mal basis. Before 'World War II the communications center of the Washington Metropolitan Police Department, as a service, dispatched police mobile units for the surrounding counties. The frequencies utili7;ed. were in the HF band and, althOll!rh bothered by skIp mterference, they gave very broad local coverage and were convenient for dispatching distant vehicles.
In recent years, with the increased metropolitan congestion and the shift to the less interference-prone VHF and UHF frequencies, the workloads of the large metropolitan police forces have been too large to provide service to their smaller neighbors. Their coverage has been too limited to reach distant neighbors reliably. As indicated in the preceding sections, it is proposed once again to return to a system of closer intermunicipal cooperation in
:"1 The mnjoritv or the mnlcrint in this stell on has bccn reviewed in draft form h,. ktlowll.'dgenblc individuals in tlw Federal Government nnd in police work. A('knowlcd~ern('nt of such nid is not 1I1('ont to imply prior endorsement of the materinl. Organizations [rom whom 8u('h Dssistance hils been received include the "~l't1ernl (!ommunicnttolls Commiasion. lh~ President'!! Office of Science nnd Tech-
the interest ,of rno:e ~fficient use of the radio frequency spectrum. fhe SIgnificant change proposed here, and m.ad~ p~ssible by the present state of technology, is the ehmmatlOn to a large extent of the frequency itself as a means of addressing a receiver, substituting reliance upon selective codes for addressing. The frequency is then !nere1y a communications channel available to any legitimate user as is a two-wire pair in a telephone network. The selective code is analogous to the telephone number.
To a large extent, FCC policy is in spirit already in consonance with the approach of frequency sharing. To quote from section 89.101 of the FCC Standards, the part which is concerned with the Public Safety Radio Services:
Frequencies listed in this part will not be assigned exclusively to anyone applicant.
In practice, hCrwever, frequency assignments have been made on an individual basis and sharing, when it exists, has been a result of informally developed arrangements rather than of a coherent overall policy. Although the applicant is required to submit a letter of r~commendation from the frequency advisor for the area, the advisor is a volunteer and mayor may not be properly qualified. In addition, the frequency advisor does not have any authority or desire to consider the necessity for the request and he must avoid jurisdictional disputes. In effect, then, all users deal directly with the FCC. There is no hierarchy of organization among users and no ovcr· all communications planning that extends beyond the limits of individual police departments. In many cases, the user-a police dep.artment-simply contacts a commercial service organization whose representative fills out the required forms and processes them without the leaders of the municipal government being involved.
The FCC assigns frequencies to the local government but for use by a specific service-police, fire, highway maintenance-so that in effect, although not in intent, the local government itself is not involved.
THE I'ROBLEM OF THE SMALLER COMMUNITIES
Matters of frequency assignments come to the FCC on a piecemeal basis and although the FCC has urged users to consider and present the broader implications of their requests, the actual workings of the system have led to keen competition for ever-scarcer frequencies on a highly individual basis. The result has been that, although users need relief from frequency congestion, there is a significant variation in traffic loading on the police frequencies in all areas, indicating inefficient use of the total resources. Another result has been that the FCC does not get a coherent picture of spectrum usage within an area so that it c"n properly address the policy questions on a national level with which it must be concerned.
The first set of recommendations developed here are designed, therefore, to encourage pooling of radio frequency resources into efficient communications networks on the part of Public Safety Radio Service users, to reduce the number of applicants who can deal directly with the FCC, and to require municipal governments to
nology. the President's Office of Telecommunicntions Mann(Ccment, the A88ocintl°r of Public Salety Communications Offie'ers, the Intcrnnlional Assol!intion or Chic J of ]Jalire. the police dcpnrtmentll of WashinGton, D.C., l.08 Anceles, CilIH., no. Burbank, Cnm., nnd tbe Public Snrety Coordinntlnc Committee.
I
I I
\
LA tff:
f l ,
..
take a greater responsibility for the effident use of the radio spectrum resources under their control.
It is recommended that the FCC limit by mle the size of municipalities, in tem1S of population and/or land area, which are located in major metropolitan areas with which it will deal directly in regard to frequency assignments in the Public Safety Radio Service.
This limit on municipality size need only be applied in major metropolitan areas since these are the areas where radio spectrum congestion is a problem. Such areas are subject to clear definition by means of census data. To qualify for frequency assignments, smaller municipalities would be required to work together as a group or coordinate with the core city of the area. Such a response is what is desired for it encourages networking without dictating in any way the manner in which that networking should be accomplished on a local level. It is possible that rare cases will exist where a small community cannot entcr into such a network. The FCC rule should allow for such exceptions upon the presentation of substantiating evidence.
Because of the many examples that have been found of small communities having lightly loaded channels, it is recommended that the FCC, by rule, establish a policy that municipalities which fit into the category of the previous recommendat.ion be notified that unless they show justifiable cause for exception they must release within 5 years of date of notification any public safety frequencies which have been assigned to them. Note that FCC licenses are issued for periocls no longer than 5 years in any case. Thus, this recommendation involves a decision no( to renew licenses rather than to revoke existing ones.
This second recommendation is aimed at bringing into coordinated networks those municipalities which have no motivation to do so because of their presenl: satisfactory situations. There is a sufficient number of such communities and sufficient radio spectrum resources arc involved to make the recommendation worthwhile. Note, too, that the first and second recommendations are concerned not only with police but with all public safety spectrum assignments.
THE RESPONSIBILITY OF LOCAL GOVERNMENT
It is recommended that, as soon as practicable, the FCC by rule establish a policy of assigning Public Safety Radio ~ervice frequencies only to the local government and not Identified by user and not assigned dlrectly to the users such as police or fire departments. It iR further recommended that frequency advisory matters be handled by o~e committee in each area instead of by separate commIttees for police, fire, highway maintenance, and forestry conservation. These committees should receive the same formal recognition by their State governments as docs the committee presently functioning in Michigan.
Radiotelephone traffic loading is not only uneven across the police bands, but is perhaps even more uneven across t~e entire Public Safety Radio Service bands. Further, t.here are gross characteristics of the different users which --------.~~------ - .
l -~,.
133
can be utilized for greater overall efficiency. While the fire department frequencies are neecled imperatively when they arc needed, the traffic loading is often not as heavy on the average nor as evenly distributed in time as is t~e case for the p~lke. High~\'ay maintenance frequenCIeS arc most heavIly used durmg the normal working day. Evenings and weekends, ,,~hen the police frequency bancls arc most congested, the highway maintenance bands can be expected to be idle in most cases. Other frequencies such as those used for dispatching schoolbuses are obviously busy certain hours and idle [0'1'
long periods. Police eom~unica~o:s d:>. not use these frequency re
sources <;>f theIr mUI1lc~pahtles because these frequencies are not lIcensed fo;' polIce use. ~he FCC has recognized t!1e. need Jo: multIple 1;lse of radIO frequencies b)' establtshmg wlthm the PublIc Safety Radio Service a band of local government frequencies which can be used for anI{ legitimate local government activity. The majority ;f the ~requencies in the public safety bands are, however, speCific? for type <;>f u~er. Secondly, it is not politic for the polIce t~ ex~mme the resour~es of other local govel'l1-ment orgaI1lzatlOns. Thus, a cIty may have more than adequate tot~1 radio spectrum resources to create a highly effiCient radIOtelephone network and, at the same time the police may be desperately short of radio resources: It is pro~able that th~s is the case in at least one major metropolItan area WIth serious police communications problems. . ~h.e response from one knowledgeable and experienced mdlvldual to the suggestion that the subdivisions of the Public Safety Radio Service be eliminated-·for those subdivisions. which involve municipal radio services-was that pOSSibly such a move would imply the abdication on th~ part of the FCC of some of its responsibilities. His pomt was that the ~qc is resp?nsible to see that police, fire, and other mU11lcipai functions have adequate spectrum resources.
However, it is more p.roperl)' the function of the city government to s.ee that ItS people have adequate police and fire prot~cbon. The FCC, by breaking down the freque?~y ass~gnments below the :nunicipal government leve!, I~Jects l~self, to ~n extent, l,ntO local government ~ffaIrs, .m~reaslng t~e difficulty of ItS own task and placmg artIfiCial restramts upon the municipal government. This was not the case before radio spectrum congestion became a problem. Under the broadel' characterization of thc frequencies involved, the FCC retains its capability to see that there are adequate spectrum resources [or municipal functions since individual requests for frequency assignments must still develop the jtlstifiable need. The municipality, however, is responsible for the efficient usc of its to~al radio spectrum resources, and designs based on econ.omles of .scale become possible. The proposed change 111 the assIgnment procedure is diagramed in figure D-12.
Note that the municipality retains the freedom to clevrlop, in cooperation with neighboring cities, a coordinated police network or it~ own coordinated public safety network, or any combination C'f the two. From the FCC

134 flUI£ D·12. PlESEIT AU PROPOSED IEUTlOIISIIIPS ,nIHIl TilE fCC AND "'Lie SAFETY ACUItIES
Profess iono I Organ izat ions Requests for and Committees Information
r----------:, I I ~
i i POLICE
I I
! LOCAL I
I ~ • FIRE Frequency I I FEDERAL
Requ irements ! GOVERNMENT I jHlGHWAY MAINTENANCE l-- ond COMMUNICATIONS
Frequency .
Concurs in requests for I I COMMISSION Ass ignments I spectrum resources. No I
I J-HOSPITALS • overoll responsibility i I
14 I for toto I usoge. I I
OTHER MUNICIPAL ; I FUNCTIONS I
I ._---------1 PRESENT SYSTEM FOR PUBLIC SAFETY FREQUENCY ASSIGNMENTS
Profess iona I Organ izations Policy and Comm ittees Recommendations
POLICE to-- FREQUENCY r-REQUESTS
FIRE -- FREQUENCY - FEDERAL REQUIREMENTS -- ;
HIGHWAY LOCAL ~DED 1""'"'+ COMMUNICATIONS MAINTENANCE GOVERNMENT INFORMATION I COMMISSION
HOSPITALS I- FREQUENCY t--ASSIGNMENTS
FREQUENCY OTHER MUNICIPAL ~ ASSIGNMENTS l--FUNCTIONS
PROPOSED SYSTEM FOR PUBLIC SAFETY FREQUENCY ASSIGNMENTS
viewpoint, the only requirement should be the efficient The International Association of Fire Chiefs (IAFe) usc of the limited radio frequency spectrum. The International Municipal Signal Association
The role of advisory groups shown in .figur.e D-12 (IMSA) Should not be overlooked. I1Y the I)resent SituatIOn they h A .. £ P bl' S ftC n'natl'on
T e llSOClatlOn 0 u IC a e y ommu I ... have provided, and in any new situation w'ill continue to Officers (APCO) provide, invaluable advice and guidance to the FCC on policy matters that transcend the level of local areas. The Forestry Conservation Communications Associa· These groups include: tion (FCCA)
The International Association of Chiefs of Police The American Association of State Highway Officials
._.(.:~~:]... ____ .. __ ._ .. _ .• _. _ .. _____ ~ __ .. __ . ______ . ____ (_A_A_Sf_IO_) ____ ~. ______ ._. ____ -
It
The Land Mobile Section of the Electronic Industries Association (EIA)
The Public Safety Communications Council
The Advisory Committee of the FCC for Land Mobile Radio Services
Eastern States Police Radio League (ESPRL)
The contributions from all of these groups has, in spite of the informal nature of an advisory function, often been substantial as evidenced by analyses presented in FCC dockets.
RETENTION BY THE FCC OF RESPONSIBILITY FOR SPECTRUM ASSIGNMENT
Finally, in connection with the frequency assignment procedures, the suggestion has been made on several occasions that the public safety bands be placed in a special category distinct and separate from that of the commercial, industrial, and broadcast users and possibly outside the FCC jurisdiction. The approach has obvious merit in that the criteria for evaluation of the needs in public safety are, and should be, totally different from those used for the needs of the commercial interests. This difference is emphasized by analyses currently being made of the "dollars value per unit wave length" of the spectrum. It is difficult to apply this dollar approach to the public safety users.
In spite of the fact that the public safety users are in a different category than are the commercial and industrial users of the spectrum, the creation of a special category for public safety does not appear to be practicable. The three possibilities are:
Transfer public safety from the nongovernment bands, under the FCC jurisdiction, to tile government bands, under IRAC jurisdiction.
Create a new category and a new agency to handle the public safety portion of the spectrum.
Retain the present status but create conditions to improve the "bargaining power" of public safety users vis-a-vis broadcasters and commercial users.
The first possibility does lIot appear to offer any advantages to the public safety user, and in particular, appears to have several disadvantages. IRAC, (Intergovernmental Radio Advisory Committee) is a committee of Government agencies which operates under the support of the Execlltive Office, Office of Telecommunications Management. In working with IRAC public safety officials would find themselves immersed in Federal Government activities with which they were not familiar and often discover that essential information on frequencies was classified by the military. There are obviously enormous advantages to working in a completely open atmosphere with the FCC and for this reason the shift to IRAC is not recommended. ----------------------------
.,.," _ ... ,., .. ,-_." .... ",
135
The ~etond possibility of a new catego.ry and a new agency 1S also considered to be inadvisable. The creation o~ a new category and a new agency would further complIcate the problem of gcvernment administration of spectrum allocations. Considerations of reallocation ?f spect:um sp~ce in the nongovernment bands would mvolv~ mt~ract!Ons between two Federal agencies which would mevltably slow the process and make more difficult the decisions.
Accordingly, it is recommended that the public safety bands be retained in the nongovernment portion of the radio spectrum under the jurisdiction of the FCC. This recommendation rejects the suggestion that this band of frequencies be transferred out from under FCC control to the government portion of the spectrum.
Consider now the third possibility, that of retaining the present administrative machinery, making only those changes necessary to improve the relative position of the public safety users.
PROCEDURES FOR DBVELOPMENT OF PUANTITATIVE PRO-JECTIONS OF NEEDS \
With the exception of the Associated Pub\ic Safety Communication Officers (APCO), the or~Xnizations which provide f:,ruidance to the FCC in police c(~mmllnications matters do so from the overall viewpoint of the land-mobile users. Further, industry is well repi'\)sented in these other organizations which include the Land Mobile Advisory Committee of the FCC and the Lam-J. Mobile Section of the Electronics Industries ASSOci~tion. While there is no fundamental objection to ind, stry working in support of public safety-and indeed the t~ chnical personnel supplied by industry have made some outstanding contributions--the industry sales base in poli,,;c communications is small compared to its sales base i.1 commercial and industrial mobile communications.
The only organization, then, that represents the police communications community directly is APGO. APCO, \ however, is a professional organization composed mainly of public safety communications personnel who pay their own dues to provide operating funds. There are some State, county, and municipal memberships (governmental) in Illinois, Arizona, and California, but for the most part the local governments provide no formal support. While a greatly strengthened FCC field organization would relieve APCO of many of its radio spectrum user coordination responsibilities, such a development would represent outside monitoring rather than voluntary user cooperation and would represent a more expensive and probably less effective means of effecting an FCC user interface. APGO, presuming. it can obtain the financial support to carry out the duties involved, is probably the most logical organization to provide the FCC with continued projections of police needs and to guide the police community toward a unified approach to their r~dio-spectrum problems. In spite of these handicaps, APGO has provided leadership in publicizing to the FCC the communications problems of public safety and the police. The organization supports a Washington-based
,
" \ "
'.
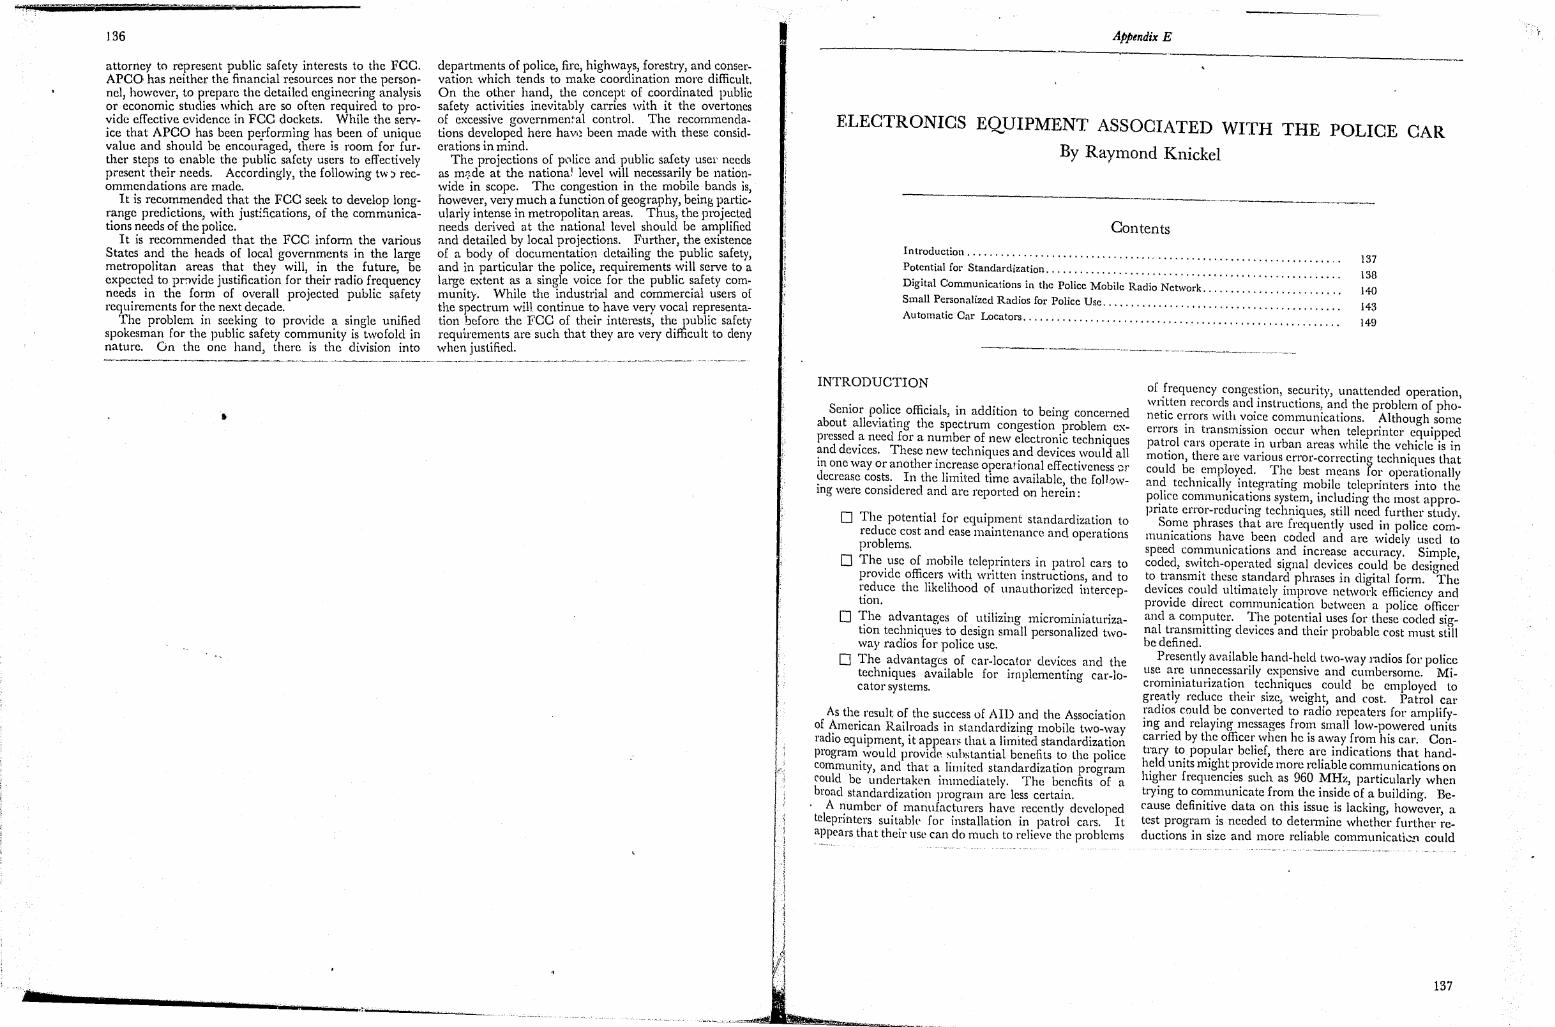
m
]36
attorney to represent public safety interests to the FCC. APCO has neither the financial resources nor the personnel, however, to prepare the detailed engineering analysis or economic studies which arc so often required to provide effective evidence in FCC docket.s. While the sel"\'ice that APCO has been performing has been of unique value and should be encouraged, there is room for further steps to enable the public safety users to effectively present their needs. Accordingly, the following tw:> recommendations are made.
It is recummended that the FCC seek to develop longrange predictions, with justi!1cations, of the commtmications needs of the police.
It is recommended that the FCC inform the various States and the heads of local governments in the large metropolitan areas that they will, in the future, be expected to prClvide justification for their radio frequency needs in the form of overall projected public safety requirements for the next decade.
The problem in seeking to provide a single unif1ed spokesman for the public safety community is twofold in nature. On the one hand, there is the division into
•
departments of police, fire, highways, forestry, and conservation which tends to make coordination more difficult. On the other hand, the concept of coordinated public safety activities inevitably carries with it the overtones of excessive governmen:'al control. The recommendations developed here haVi~ been made with these considerations in mind.
The projections of pCllice and public safety usel' needs as m;de at the nationa! level will necessarily be nationwide in scope. The congestion in the mobile bands is, however, very much a function of geography, being particularly intense in metropolitan areas. Thus, the projected needs derived at the national level should be amplified and detailed by local projections. Further, the existence of a body of documentation detailing the public safety, and in particular the police, requirements will serve to a large extent as a single voice for the public safety community. While the industrial and commercial users of the spectrum will continue to have very vocal representation before the FCC of their interests, the public safety requirements are such that they are very difficult to deny when justified.
---t -------..... ------------, --", ....... ' --~-
Appendix E
ELECTRONICS EQUIPMENT ASSOCIATED WITH THE POLICE CAR
By Raymond Knickel
Contents
Introduction ••••••••••• '0' 0 0 0 ••• 0 0 0 0 0 ••• 0 "0 0.'
•• 0 • 0 ••••••• 0 ~ 0 ••••••• , , •••••••• 137
138
140 143 149
Potcntial for Standardization Digital Communications in tl~~ ~~l;~e' ~~~;I~'l~~'d'i~ .~~~\~~~~ ........................ .
'.0 ••• 0 0 ' 0 •••• 0 ••••• 0'. "
Small Personalized Radios for Police Use ~ •••••••••••• 0 ••• ; • , ••••••• , • 0 •• 0 •• , •••• , ••
Automatic Car Locators ••••• 0 •••••••••••• , '0, •• 0 ••••• 0 ••• , ••• , •••• ,. 'f" 0" 0 ••••
INTRODUCTION
Senior p~li~e officials, in addition to being concerned about allevlatmg the spectrum congestion problem expressed ~ need for a number of new electronic techniques ~nd deVIces. These new techniques and devices would all 111 one way or another increase operational effectiveness::!, ~ecrease costs; In the limited time available, the [o)1ow-1I1g were conSidered and are reported OIn herein:
o The potential for equipment standardization to reduce cost and ease maintenance and operations problems.
o The usc of mobile teleprinters in patrol cars to provide officers with written instructions and to reduce the likelihood of unauthorized i:lterception.
o ~he advantages of utilizing microminiaturization techniques to design small personalized twoway radios for police usc.
o The advantages of car-local or devices and the techniques available for irn plementing car-locator systems.
As the result of the success of AID and the Association of ~meri~an Railroads in standardizing mobile two-way radIO eqll1pment, it appears that a limited standardization program.would provide ~uhstantial benefits to the police commulllty, and that a limited standardization program could be undertaken immediately. The benefits of a broad standardization program are less certain.
A ~umber of manufacturers have recently developed tclcprmtcrs suitable for installation in patrol cars. It a_~)pears that their USc can do much to relieve' the problems
-- --~-~------~-
of .frequency conges.tion, se~urity, unattended operation, wn.tten recor~s ancl.1I1struchons, and the problem of phonetic e:-rors With :'~lce communications. Although some errors 111 transmlSSI?n occur when teleprinter equipped patrol cars operate m urban areas while the vehicle is in motion, there are various error-correcting techniques that could be ~mplo~ed. Tl.1e best means for opcrationally an~ tcchlllcall~ lI1~egratmg mobile teleprinters into the pO.lIcc commulllca~lOns system, including the most appropnatc error-reducll1g techniques, still need further study.
SO.me .phrases that are frequently used in policc com-1l1UlllcatlOns h~ve .been coc1~d and are widely used to speed con~mUl11CatlOns a.nd 1I1crc~se accuracy. Simple, coded, sw~tch-operated Signal devlCCs could be designcd to t:'ansmlt thcse.standar~ phrases in digital form. Thc devI~cs co~tld ultimately. Improve network efficiency and prOVide direct commUlllcatlOn between a police officcr and a computer. The potential uses for these coded signal transmitting devices and their probable cost must still be defined.
Prescntly availab!c hand-h~ld two-way radios for police use are unnecessanly expcnsIVe and cumbersome. Microminiaturization. tc~lmiqu~s could be employed to grently rcducc their Size, weight, and cost. Patrol car ~'adios could ~e converted to radio repeaters for amplifyll1g ~nd rclaYll1g messages from small low-powered units carned by the officer when he is away from his car. Contrary to popular belief, there are indications that handheld units might provide more reliable communications on higher frequencies such as 960 MHz, particularly whcn trying to communicate from the inside of a building. Because definitive data on this issue is lacking, however, a test program is nceded to detClmine whether further reductions in size and more reliable communicatk.'.!l could
137

138
f!;)Sult from using higher frequencie:. .The Fe.deral Go,":ernment should assume the leadership :n car.ry.mg ~ut ~hls test program, in bringing about the mlcrom~matunzat~on of hand-held two-way radio equipment and 10 devel?pmg methods for the officer away from his car to use hIS car radio as a repeater. . '
There is a recognized need by t~e pohce com:numty for a means of tracking and plottmg the 10eatlOns of police vehicles. It has long been assumed that for carlocator systems to be effective they would have. to be accurate to within about one block. An analysu; showed that most of the potential bp.nefit of ~ car-locator system could be achieved with a system havmg an accuracy n? better than a quarter of a mile, which opens. the POSSi
bility of using techniques that had been prevlOusly con-sidered to be too inaccurate. .
A patrol car emitter-callbox sensor techmque and a modified radar transponder technique, as well as olher possible techniques, appear to warrant further study.
POTENTIAL FOR STANDARDIZATION OF POLICE MOBILE RADIO EQUIPMENT
Equipment is already standardized to a large. extent i~ police radio but only because a few large supphers dominate the field as shown in table E-l. Their products become standard for the police department that uses them; replacement units purc~ased £roJ? any other supplier in a later year would be mcompatlble.
Table E-1.-The Police Mobile Radio Market
Gross sales per annum: Total land mobile radio sales _______ .. _ •.• ________________ • Total public safety radio sales .. __________ .. ________ • __ .. __ Tota I police radio sa les. __ • --- .. ---- -- ...... ----- ----- _. --
Millions $170
30 9.8
Percent 100
18 6
Percent of total
Suppliers: markel. Major supplier ._ ••••••••. -- •• ---- •• -- ... '-' ----- .--.---------------. ~ 2d major supplier --- .---- •• -- --' --. -- •• --•• -- --. --.- --- ---- ---- ---- - 10 3d ma or suppller ____________ ... _________________________________ ·__ 10
cust:~e~~h(~~rte~liers-----. ----. ---.~---- ---- :-.-- ·---------------'---h-·-h h Approximately 40.000 separate police agencle~. the few largest a w IC purc ase
perhaps $500,000 of radio equipment per yg~r.
The radio industry 1 tends to argue against standardization beyond the clectl'icni and performance standards provided now by the EIA. These standards cover such topics as:
Minimum power supply life; Average radiated power; Amount of spurious radiation; Average radiation sensitivity.
The police speak of standardization in terms of ease of use of operating controls, ease of maintenance, and ease of replacing one manufacturer's equipment with that of another.
POTENTIAL ADVANTAGES OF STANDARDIZATION
There arc a number of possible ways in which standardizing equipment designs can lead to cost savings:
o Equipment standardization would allow co~munities, counties, and even States to comb me
1 "Stnntlllrdluulon for POltCD Communications," brief survey of the pr.oblem I!IUp' plied to ScIence and Technology Ta,k Force by tho Motorola Corp., undated.
their equipment procurements so that es~entially identical equipment could be bought 10 large quantities by competitive bid.
o Less test equipment, and in some instances simpler test equipment, would be required to maintain equipment in repair.
o A smaller variety and a smaller overall number of spare parts or interchangeable plug-in modules would have to be kept: on hand if equipment were standardized. If all the communities within a metropolitan area used identical ~q:upmen~, economies could be effected by combmmg therr repair facilities.
o When improvements or modifications to standardized equipment are require~, identical m<>?~fication kits could be procured 10 large quantltles at a lower unit cost by combining the requirements of several police organizations.
o With only one type of equipment to repair, police radio technicians would require less training.
o Even limited standardization could enable policedepartments to avoid becoming "captive customers" of a single supplier bec~!lse of previously having purchased equipment from that supplier.
POTENTIAL HAZARDS OF STANDARDIZATION
Despite the many genuine advantages of equipment standardization there are also potential di~:.\dvantages. The major m~nufacturers of police radio equipment object strongly to equipment standardization. They argue that standardization would stifle their incentive and desire to keep improving their product. The mam~facturers point out that they spend a grea~ deal of their own funds on research and development With the hope of. bettering their equipment in some way which will give them an advantage over their competitors.
Even if standardization were carried out in a very limited sense, such as requiring interchangeability of receivers, transmitters and power supplies, the manufacturers claim that their efforts to develop improvements would gain them no rewarding competitive advantage. They argue that before they could market any new technique, agreement would have to be reached by the pur· chasers to the effect that the proposed new techmque shouid be made a part of the standardized equipme~t. The time required to reach such an agreement would give the competitors time to develop similar techniques.
The manufacturers further state that at present they maintain large service organizations which provide much needed advice and :>.~sistance to police department technicians. With standardized equipment and large, highly competitive purchases, the manufacturers could not be sure what the an10unt of their police radio equipment business would be. Consequently, they say that tho)' would have to dissolve or greatly reduce the size and effectiveness of their present service organizations. This, they maintain, would require police departments to spend their own money to improve the quality of their repair service organizations.
The manufacturers also point out that several groups of mobile equipment users have in the past attempted to standardize equipment. They state that these attempts have, for the most part, ended in failure and generally have been abandoned. Cited as examples are the experiences of the Forestry Service and the Military Police.
Although all of the above arguments have counterarguments, it is obvious that standardization must be approached with caution. In the process of standardizing equipment design, means should be found to reward manufacturers that develop improved designs or features. Standard equipment designs should be developed by engineers familiar with the operational requirements of police radio and with the caliber of maintenance personnel available to police radio departments.
Every attempt should be made in adopting standardized equipment to utilize designs that will be as simple and as easy to maintain as possible, thereby lessening dependence on the service organizations of the manufacturers.
The hazards of standardization should not be risked where there is not a clear-cut advantage to standardization. Carrying standardization to the limit where every electrical component and its location is precisely specified could well result in the dire consequences of standardization predicted by the manufacturers. On the other hand, standardization to the point where police departments avoid becoming captive markets would certainly appear to be the minimum that should be considered.
AID SUCCESS IN STANDARDIZING PORTABLE RADIO EQ,UIP
MENT
The Telecommunications Branch of the Office of Public Safety of the Agency for International Development (AID), under the direction of Mr. Paul Katz, has designed a line of special radio transceivers primarily for service in Vietnam. These units have been made standardized units by the AID Office of Public Safety and they are now scheduled for AID public safety programs in Costa Rica, Colombia, Thailand, Laos, and Guatemala. AID estimates that more than $4.5 million had been saved as of 30 March} 966 as a result of adopting these transceivers as standardized units for AID public safety programs throughout the world.
The AID equipment was developed originally because available commercial equipment contained many expensive innovations that added to the weight and cost of the equipment and which were not needed in AID public safety programs. Furthermore, despite the expense and s~phistication of the commercially available units, they did. not satisfactorily fulfill the requirements of AID. AID required equipment that would be lightweight, c~pable of being carried on patrols, easily mounted and dismounted on a vehicle, usable as a base or relay station, cap~ble of using regular batteries or house current, and low In cost. The AID design fulfilled these requirements and led to the significant cost savings.
The large cost saving was derived from two aspects of ~e AID equipment development program. First of all,
to
139
the equipment, being less sophisticated (e.g., it had no selective signaling capability), cost less to build. Secondly b~ standardizing the units and by combining what other~ Wise would have been a number of relatively small indivi.dual procurements, AID was able to make nne large competitive bid procurement. The result has been that AID now pays $146 for their hand-held units as compared to $650 to $700 for previously available equipment. Larger detachable mobile units now cost $215 compared to $850 for less versatile units formerly used. '
Very little has been sacrificed in the way of quality in the AID design. However, since the units were for use in sparsely populated areas having little industry, the specifications are not as stringent regarding spurious oscillation as would normally be required for equipment to be used in the United States. Furthermore, the equipment does not have provisions for either the code; squelch or selective signaling feature used by many United States police units.
AID, by developing standardized equipment and combini,ng procurement, ~as managed to provide police radio eqUipment at approximately one-fourth the cost of comparable nonstandard commercial units. Although the equipment specifications are not as stringent as those of domestic large city police forces, the equipment is of comparable complexity and quality.
PROPOSED STANDARDIZATION PROGRAM
A significant portion of the advantages of standardization could be achieved at a very early date, and with a minimum of effort, through a program of limited standardization. The full benefit of standardization, based on equipment designs incorporating the latest and most modern techniques for enhancing the effectiveness of police communications, might require a broader and lengthier program of standardization.
Limited Standardization Program
The objectives of the limited standardization program should be to standardize equipment to the point that equipment units built by different manufacturers would be operationally compatible, electrically and physically interchangeable, and equipped with identical operating controls. This would include standardization of the following aspects of equipment design:
Sockets and plugs; Terminal strips and the utilization of the individual
terminals; Housing dimensions; Mounting racks and base plates; Control heads; Technique used for selective signalling; Crystals and crystal holders.
The Association of American Railroads has successfully standardized its equipment so that all of its mobile radios are electrically and physically interchangeable. They
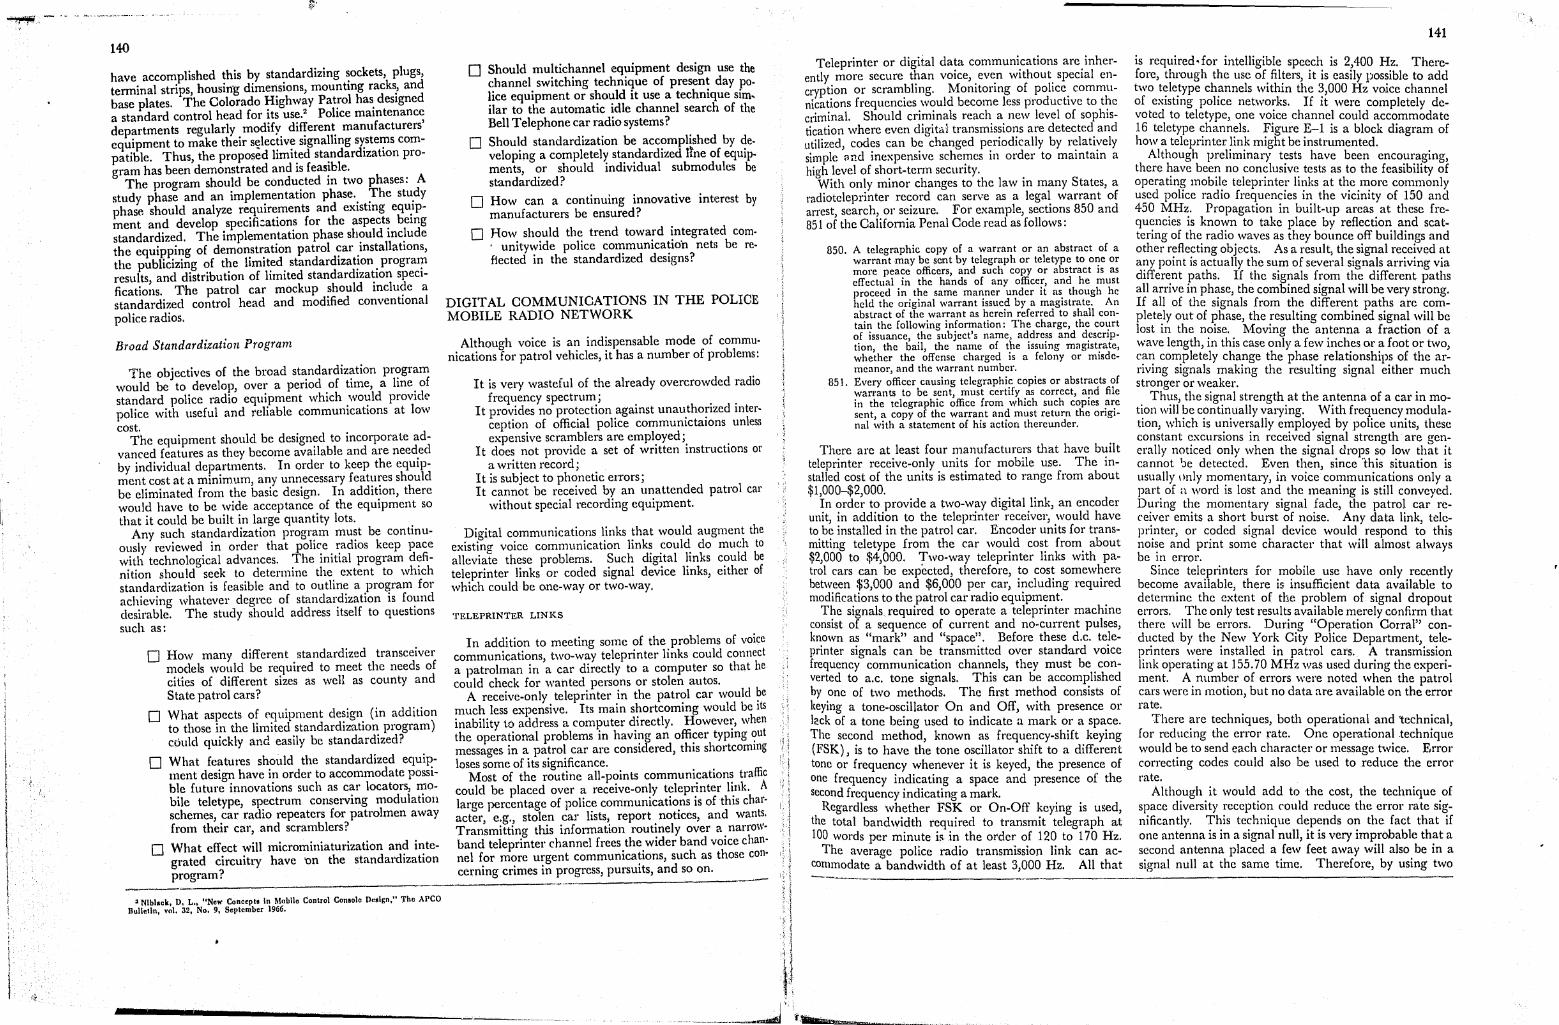
............, .--~,
! ! I
\
\ i
140
have accomplished !his ~y stal!dardizing ~ockets, plugs, terminal strips, housm'g dlmenslOns, mount1Og racks.. and base plates. The Colorado Highway Patrol has designed a standard control head for its use.2 Police maintenance departments regularly. modify. dif!erent. manufacturers' equipment to make their s~lect1v~ signalling s~stet?s compatible. Thus the proposed limited standardization pro-gram has been'demonstrated and is feas~ble. .
The program should be conducted 10 two phases. A study phase and an implet?entation phase.. :rhe stu.dy phase should analyze reqUirements and eXlstmg equ.lpment and develop specifi:ation~ for the aspect~ be10g standardized. The implementation phase should 1Oc~ude the equipping of demonstration patrol ~ar ,installatIOns, the publicizing of the limited standardlzat~on. prograI? results and distribution of limited standardization specIficatio;ls. The patrol car mockUp ~hould inc1u~e a standardized control head and modified conventIOnal police radios.
Broad Standardization Program
7'he objectives of the broad standardization program wo~ld be to develop, over a period of time, a line. of standard police radio equipment which ,'Not;ld prOVide police with useful and reliable commumcatlOns at low cost.
The equipment should be design~d to incorporate advanced features as they become available and are need.ed by individual departments. In order to keep the eqUipment cost at a minimum, any unnecessary features should be eliminated from the basic design. In addition, there would have to be wide acceptance of the equipment so that it could be built in large quantity lots.
Any such standardization program must be continuously reviewed in order that police radios keep pace with technological advances. The initial program definition should seek to determine the extent to which standardization is feasible and to outline a program for achieving whatever. degree of standar~ization is fo?,nd desirable. The study should address Itself to questions such as:
o How many different standardized transceiver models would be required to meet the needs of cities of different sizes as weB as county and State patrol cars?
o What aspects of ('quipment design (in addition to those in the limited standardization program) could quickly and easily be standardized?
o What features should the standardized equipment design have in order to accommodate possible future innovations such as car locators, mobile teletype, spectrum conserving modulatioll schemes, car radio repeaters for patrolmen away from their car, and scramblers?
o What effect will microminiaturization and integrated circuitry have 'On the standardization program?
• Niblack, 0, L .. "New Concept. In Mobile Control Con.olc Oulgn," Thc APCO null.tln, vol. 32, No.9, September 1966.
o Should multichannel equipment design use the channel switching technique of present day police equipment or should it use a technique sim, ilar to the automatic idle channel search of the Bell Telephone car radio systems?
o Should standardization be accomplished by developing a completely standardized nne of equipments, or should individual submodules be standardized?
o How can a continuing innovative interest by manufacturers be ensured?
o How should the trend toward integrated com. unitywide police communicatio'n netll be reflected in the standardized designs?
DIGITAL COMMUNICATIONS IN THE POLIOE MOBILE RADIO NETWORK
Although voice is an indispensable mode of communications for patrol vehicles, it has a number of problems:
It is very wasteful of the already overcrowded radio frequency spectrum;
It provides no protection against unauthorized interception of official police communictaions unless expensive scrat?blers are empl?yed;. .
It does not prOVide a set of written 1OstructlOns or a written record;
It is subject to phonetic errors; It cannot be received by an unattended patrol car
without special recording equipment.
Digital communications links that would augment the existinf! voice communication links could do much to alleviate these problems. Such digital links could be teleprinter links or coded signal device links, either of which could be one-way or two-way.
TELEPRINTER LINKS
In addition to meeting some of the problems of voice communications, two-way teleprinter links could connect a patrolman in a car directly to a computer so that he could check for wanted persons or stolen autos.
A receive-only teleprinter in the patrol car would ?e much less expensive. Its main shortcoming would be Its inability to address a com\?uter d,irectly. Howeve~" when the operational problems m havI;tg an offi~er typmg ?ut messages in a patrol car are considered, thiS shortcommg IDses some of its significance.
Most of the routine all-points communications traffic could be placed over a receive-on!y t~lep~nter I~Ilk. A large percentage of police commumcatlOns IS of thiS character, e.g., stolen car lists, report notices, and wants. Transmitting this information rout~nely over a. narroWband teleprinter channel frees .the. Wider band vOice channel for more urgent commumcatlons, such as those concerning crimes in progress, pursuits, and so on. _
Teleprinter or digital data communications are inherently more secure t?an voice,. ev~n without. special encryption or scram?lmg. MOllltonng of pohce. communications frequencies would become less productive to the criminal. Should criminals reach a new level of sophistication where even digital transmissions are detected and utilized, codes can be changed periodically by relatively simple and inexpensive sche:nes in order to maintain a high level of short-term secunty.
With only minor changes to the law in many States, a radioteleprinter record can serve as a legal warrant of arrest, search, or seizure. For example, sections 850 and 851 of the California Penal Code read as follows:
850. A telegraphic copy of a warrant or an abstract of a warrant may be soot by telegraph or teletype to one or more peace officers, and such copy or abstract is as effectual in the hands of anY officer, and he must proceed in the same manner 'under it as though he held the original warrant issued by a magistrate. An abstract of the warrant as herein referred to shaH contain the following infonnation: The charge, the court of issuance, the subject's name., address and description, the bail, the name of the issuing magistrate, whether the offense charged is a felony or misdemeanor, and the warrant number.
851. Every officer causing telegraphic copies or abstracts of warrants to be sent, must certify as correct, and file in the telegraphic office from which such copies are sent, a copy of the warrant and must return the original with a statement of his action thereunder.
There are at least four manufacturers that have built teleprinter receive-only units for mobile use. The installed cost of the units is estimated to range from about $1,000-$2,000.
In order to provide a two-way digital link, an encoder unit, in addition to the teleprinter receiver, would have to be installed in the patrol car. Encoder units for transmitting teletype from the car would cost from about $2,000 to $4,000. Two-way teleprinter links with patrol cars can be expected, therefore, to cost somewhere between $3,000 and $6,000 per car, including required modifications to the patrol car radio equipment.
The signals required to operate a teleprinter machine consist of a sequence of current and no-current pulses, known as "mark" and "space". Before these d.c. teleprinter signals can be transmitted over standard voice frequency communication channels, they must be converted to a.c. tone signals. This can be accomplished by one of two methods. The first method consists of keying a tone-oscillator On and Off, with presence or l~ck of a tone being used to indicate a mark or a space. The second method, known as frequency-shift keying (FSK), is to have the tone oscillator shift to a different tone or frequency whenever it is keyed, the presence of one frequency indicating a space and presence of the second frequency indicating a mark.
Regardless whether FSK or On-Off keying is used, the total bandwidth required to transmit telegraph at 100 words per minute is in the order of 120 to 170 Hz.
The average police radio transmission link can accommodate a bandwidth of at least 3,000 Hz. All that
141
is required-for intelligible speech is 2,400 Hz. Therefore, through the use of filters, it is easily possible to add two teletype channels within the 3,000 Hz voice channel of existing police networks. If it were completely devoted to teletype, one voice channel could accommodate 16 teletype channels. Figure E-l is a block diagram of how a teleprinter link might be instrumented.
Although preliminary tests have been encouraging, there have been no conclusive tests as to the feasibility of operating mobile teleprinter links at the more commonly used police radio frequencies in the vicinity of 150 and 450 MHz. Propagation in built-up areas at these frequencies is known to take place by reflection and scattering of the radio waves as they bounce off buildings and other reflecting objects. As a result, the signal received at any point is actually the sum of several signals arriving via different paths. If the signals from the different paths all arrive in phase, the combined signal will be very strong. 1£ all of the signals from the different paths are completely out of phase, the resulting combined signal will be lost in the noise. Moving the antenna a fraction of a wave length, in this case only a few inches or a foot or two, can completely change the phase relationships of the arriving signals making the resulting signal either much stronger or weaker.
Thus, the signal strength at the antenna of a car in motion will be continually varying. With frequency modulation, which is universally employed by police units, these constant excursions in received signal strength are generally noticed only when the signal drops so low that it cannot 'Je detected. Even then, since 'this situation is usually Il!1ly momentary, in voice communications only a part of n word is lost and the meaning is still conveyed. During the momentary signal fade, the patrol car receiver emits a short burst of noise. Any data link, teleprinter, or coded signal device would respond to this noise and print some character that will almost always be in error.
Since teleprinters for mobile use have only recently become available, there is insufficient data available to detenuine the extent of the problem of signal dropout errors. The only test results available merely confirm that there will be errors. During "Operation Corral" conducted by the New York City Police Department, teleprinters were installed in patrol cars. A transmission link operating at 155.70 MHz was used during the experiment. A number of errors were noted when the patrol cars were in motion, but no data are available on the error rate.
There are techniques, both operational and technical, for reducing the error rate. One operational technique would be to send each charact.er or message twice. Error correcting codes couid also be used to reduce the error rate.
Although it would add to the cost, the technique of space diversity reception could reduce the error rate significantly. This technique depends on the fact that if one antenna is in a signal nu.ll, it is very improbable that a second antenna placed a few feet away will also be in a signal null at the same time. Therefore, by using two
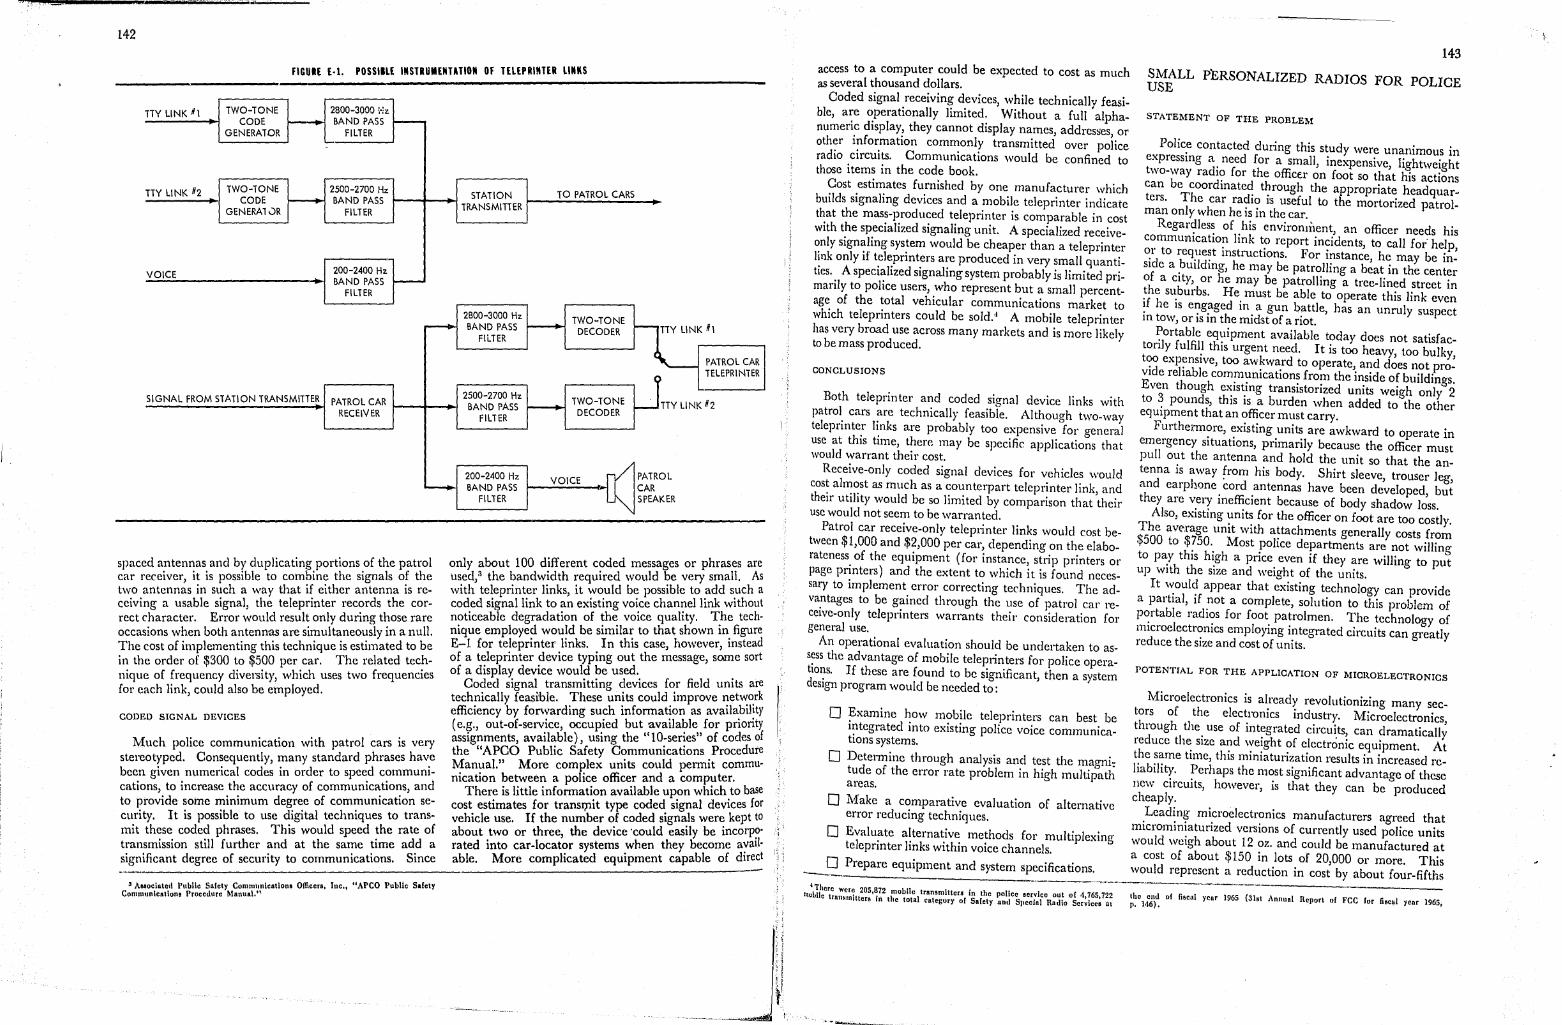
142
FlGIlIE £-1. POSSIIL£ INSTRUMENTATION OF TELEPRINTER LIIIIIS
TTY LINK HI
TTY LINK 62
VOICE
TWO-TONE CODE
GENERATOR
TWO-TONE CODE
GENERA10R
2800-3000 l-rz BAND PASS
FILTER
2500-2700 Hz BAND PASS
FILTER
200-2400 Hz BAND PASS
FILTER
SIGNAL FROM STATION TRANSMITTER PATROL CAR RECEIVER
spaced antennas and by duplicating portions of the patrol car receiver, it is possible to combine the signals of the two antennas in such a way that if either antenna is receiving a usable signal, the teleprinter records the correct character. Error would result only during those rare occasions when both antennas are simultaneously in a null. The cost of implementing this technique is estimated to be in the order of $300 to $500 per car. The related technique of frequency diversity, which uses two frequencies for each link, could also be employed.
CODED SIGNAL DEVICES
Much police communication with patrol cars is very stereotyped. Consequently, many standard phrases have been given numerical codes in order to speed communications, to increase the accuracy of communications, and to provide some minimum degree of communication security. It is possible to use digital techniques to transmit these coded phrases. This would speed the rate of transmission still further and at the same time add a significant degree of security to communications. Since
• AMoci.led Public Snlely Communicntlons Ollieera, Inc., "APCO Public SalelY Communications Procedure Manual,"
STATION TRANSMITTER
2800-3000 Hz BAND PASS
FILTER
2500-2700 Hz BAND PASS
FILTER
200-2400 Hz BAND PASS
FILTER
TO PATROL CARS
TWO-TONE DECODER
PATROL CAR TELEPRINTER
TWO-TONE DECODER
TTY LINK #2
VOICE -rrJPATROL ~~~~~ CAR
SPEAKER
only about 100 different coded messages or phrases are used,3 the bandwidth required would be very small. As with teleprinter links, it would be possible to add such a coded signal link to an existing voice channel link without noticeable degradation of the voice quality. The technique employed would be similar to that shown in figure E-1 for teleprinter links. In this case, however, instead of a teleprinter device typing out the message, some sort of a display device would be used.
Coded signal transmitting devices for field units are technically feasible. These units could improve network efficiency by fonvarding such information as availability (e.g., out-of-service, occupied but available for priority assignments, available), using the "lO-series" of codes of the "APCO Public Safety Communications Procedure Manua!''' More complex units could pelmit communication between a police officer and a computer.
There is little information available upon which to base cost estimates for transl}1it type coded signal devices for vehicle use. If the number of coded signals were kept to about two or three, the device 'could easily be incorporated into car-locator systems when they become available. More complicated equipment capable of direct
',' I
, , ,
access to a computer could be expected to cost as much as several thousand dollars.
Coded signal,receivin~ d,evices, while technically feasible, a~e ~perahonally lImlted, Without a full alphanumen~ dlsplay! they cannot display names, addresses, 01'
oth~r l~fo~matlOn com~only transmitted over police radiO CircUits, Commumcations would be confined to those items in the code book.
Cost estimates furnished by one manufacturer which builds signaling devices and a mobile teleprinter indicate that the mass-produced teleprinter is comparable in cost with the specialized signaling unit. A specialized receive~nly sign~ling sys:em would be cheaper than a teleprinter I~nk only lf t~l~pnnt~rs a:e produced in very small quantities .. A specl~hzed slgnalmg system probably is limi ted primanly to poltce users, ,who represent but a small percentage of the total vehlcular communications market to which teleprinters could be sold:' A mobile teleprinter has veIY broad use across many markets and is more likely to be mass produced.
CONCLUSIONS
Both teleprinter and coded signal device links with patrol, cars ~re technically feasible. Although two-way teleprmte,r I~nks are probably too expensive for general use at thls tune, there may be specific applications that would warrant their cost.
Receive-only coded signal devices for vehicles would cos~ al\t~~st as much as a counterpart teleprinter link, and their utthty would be so limited by comparison that their use would not seem to be warranted.
Patrol CRr receive-only teleprinter links would cost betwecn $1,000 and $2,000 per car, depending on the elaboratcness, of the equipment (for instance, strip printers or page pnnters) and the extent to which it is found necessary to implement error corrccting techniques. The adva.ntages to be g~ined through the use of patrol car recClve-only tclepnnters warrants their consideration for general use.
An operational evaluation should be undertaken to ass~ss the advantage of mobile teleprinters for police operatlo~s. If these are found to be significant, then a system deSign program would be needed to:
o ~xamine how mobile teleprinters can best be l?tegrated into existing police voice communications systems.
o Detelmine through analysis and test the magni: tude of the error rate problem in high mUltipath areas.
o Make a comparative evaluation of alternative error reducing techniques.
o Evalu~te a!terna~iv~ methods for multiplexing teleprmter Imks wlthm voice channels,
__ 0 Prepare equipment and system specifications,
'There Were 205 872 b·l. I I • mobile tr 1 I. rno Ie ransm tters In the police servIce out or ,1,765,722 lII1N," lterll In the total category of Safely and Special Radio Services at
143
t~LL PERSONALIZED RADIOS FOR POLICE
STATEMENT OF THE PROBLEM
PoIic,e contacted during this study were unanimous in ex,pressmg a, need for a small, inexpensive, lightweight t\\o-way radl? for the officer on foot so that his actions can be coord mated through the appropriate head uar~ ters. The car radio is useful to the mortorized pitrolman only when he is in the car,
Regar~les~ of ,his environlilent, an officer needs his c~mmumcatto? lmk t~) report incidents, to call for' help, ~I to req.ue~t JI1struchons. For instance, he may be insite a ,butldmg, he may be patrolling a beat in the center °h a Clty, or he may be patrolling a tree-lined street in ~ e s~burbs. He must be able to operate this link even ~f he IS eI?g~ged in, a gun battle, has an unruly suspect m tow, or IS m the mIdst of a riot.
~ortable eq':lipment available today does not satisfactonly fulfil.l thiS urgent need. It is too heavy, too bulky, t~ exp~nslve, too awkward to operate, and does not proVIde rehable com~,:mication~ from the inside of buildings. Even though eXlstmg tranSlStorized units weigh only 2 to ~ pounds, this is a burden when added to the other eqUlpment that an officer must carry,
Furthenn?re, ~xisting ,units are awkward to operate in emergency SituatIOns, pnmarily because the officer must pull o~t the antenna and hold the unit so that the antenna IS away from his body. Shirt sleeve, trouser leg, and earphone cord antennas have been developed but they are v,ery ine~cient because of body shadow l~ss.
Also, eXlstmg ~111~ for the officer on foot are too costly. The average Ul11t With attachments generally costs from $500 to $?50., Most police departments are not willing to p~y thls h~gh a pnce even if they are willing to put up with the size and weight of the units,
It \~oul~ appear that existing technology can provide a partlal, If ~ot a complete, solution to this problem of p~rtable radl?s for foot, pat.rolmen, The technology of nllcroelectr?l11CS employmg integrated circuits can greatly reduce the size and cost of units.
POTENTIAL FOR THE APPLICATION OF MICROELECTRONICS
Microelectronics is already revolutionizing many sectors of the electronics industry, Microelectronics ~hrough the, use of int~grated circu~ts, can dramaticall; leduce th~ Slze a~d \~e~ght ?f e.lectronic equipment. At t~e ~~me tt~1e, thls I111111atunzatlOn results in increased rchablltty. ! erImps the most significant advantage of these new clrCUlts, however, is that they can be produced cheaply.
.Lead~nl2 mi~roelectr~nics manufacturers agreed that mlcromm~atunzed versIOns of currently used police units would weigh about 12 oz. and could be manufactured at a cost of about $150 in lots of 20,000 or more, This would represent a reduction in cost by about four-fifths
Ihe end 01 nocul yenr 1965 (3101 Ann".i Reporl 01 FCC lor floe.1 yenr 1965, p. 146),

144
and a reduction in weight by ab?u~ two-thi~ds. ~~ssiblc size weight and power charactenstIcs of a mlcromlmaturriz;d versi~n of present day equipment would be as follows:
Radio frequency power outpuL __________ 2 watts. Audio power output ____ : ______________ 75 milliwatts. Transmitter efficiency of power consump-
tion _______________________________ 6 50 percent. Battery weighL_______________________ ~ 0.33 lbs. Total weighL ________________________ ~ 0.75Ibs. Cost per unit (in quantities of 20,000 or more) _____________________________ ~ $150.
CHOICE OF OPTIMUM FREQUENCY
One of the first steps in the design of portable radio systems would be to compare radio link perfor~ance at the different frequencies that either are now avaIlable or could be made available to the police in the future. For example, operation at higher fre~uencies mi.gl:t mean less efficient transmitters, more effiCIent transnuttmg and receiving antennas, better ~uilding .~e,:etration, greater foliage loss, decreased receIve!' sensl~IVlty, and less c.ompetition with industrial electrIcal nOIse. The combmed net effect could be favorable or unfavorable. There arc some indications that if small personalized two-way radios were operated at higher frequencies, such as 960 MHz, there might be a net improvement over the p~esenUy used lower frequencies, especially when trying to communicate from inside buildings. Motorola Corp. reported in an in-house paper 5 as follows:
One effect noted in making our urban area tests was the ability of the 900 mc signals to penetrate into tunne!s. Comparison tests with 160 mc signals showed that certaIn viaducts would attenuate 160 mc signals almost completely 100-200 feet inside the tunnel while the 900 mc signals provided satisfactory performance 400 to 500 feet inside the viaduct. Actually the viaduct was only about 1,000 feet long and it was not po~sible to get more than 500 feet from un en trance.
Another Motorola in-house report G on this same series of tests reported successful communications at 960 MHz from a test vehicle parked 40 feet underground in a parking garage. Bell Telephone Laboratories found in a series of tests run in 1952 7 that 900 MHz is to be favored somewhat for mobile communications over 150 MHz from a transmission standpoint if full use is made of the possible antenna gain. In comparing the building penetration capability of 35 MHz and 150 MHz, Bell Telephone Laboratories found that the expected range of coverage into buildings is somewhat greater at 150 MHz than at 35 MHz.s Police and others consistently report better operational results from within buildings at 450 MHz than at 150 MHz.
These results could be explained by theorizing that the windows and other apertures of buildings, being large in comparison to the shorter wave lengths, become more transparent and that the hallways of buildings act as ducts for the radio frequency energy much as a wave guide operates above cutoff.
• C. J. Srhullz "Is 960 Me Suitable I~r Mobile Operalion,"; MOlorol. Corp. o C. J. Schultr.: Motorolll in·house report, umlntrll, tilled "900 Me, a Vehicular
SUr\'I!y,h , W. nne Yuun~. Jr., "Col11pruiaon of Mobile Rallio Transmission at 150, .150, 900,
IHHI 3700 Me"; Dell System Technicnl lournal; Novemher 1952; pp. 1068-1085.
Unfortunately, there is no thoroughly collected data on the extent to which the higher frequencies outperform the lower frequencies with regard to building penetration. If experimental results verify that building penetration at the higher frequencies is substantially better than at the lower frequencies, it should be possible to design equipment which would be much less awkward to operate in emergency situations and would provide mnch more reliable communications from inside buildings, More efficient operation at the higher frequencies could result in further reductions in battery size and cost over that achieved by microminiaturization alone. With microminiaturized equipment, battery weight and cost represent a large portion (perhaps in the orc1er of 40 percent) of the weight and cost of the entire unit.
There are reasons other than improved building penetration why the higher frequencies might be superior. FOI ease of operation, the equipment should be capable of being "worn" on the officer instead of being handheld. At 150 or 4·50 MHz, some sort of trouser leg or microphone cord antenna is required, resulting in about 8 or 9 db body shadow loss. In addition, at 150 MHz, hecause there is no effective ground plane and the antennas do not even approach a quarter wavelength, the antennas are 8 to 15 db less efficient than a dipole antenna. At 450 MHz such antennas come within 2 or 3 db of regular dipole performance.
At a frequency of 1000 MHz, a quarter-wave dipole antenna would be only 7.5 cm., about 3 inches, long. The antenn(t could easily be worn on the shoulder or the top of a policeman's helmet with a small metal plate as a ground plane. Such an antenna could have a perform. ance at least equal to a simple dipole amI it probably would be possible to provide some gain in the horizontal plane, yielding another 1 or 2 db of improvement.
Therefore, by having a more efficient antenna and avoiding body shadow loss, it appears that antennas at 1000 MHz could be made 17 to 26 db better than current 150 MHz body-worn antennas, and 11 to 14 db better than current 450 MHz body-worn antennas. Table E-2 summarizes how some of these performance factors vary with frequency.
A factor militating against higher frequencies is that foilage loss tends to increase with frequency. There could well be other factors that would militate either for or against going to higher frequencies.
To resolve this frequency question, test data must be collected. The test program required to gather the nec· essary data would be similar to those conducted by L. P. Rice in 1959 0 and by W. Rae Young in 1952/° but expanded to cover the frequency rL,1ge to 3000 MHz and to include usc within buildings.
Since building penetration would vary from building to building, and between locations within buildings, a large number of readings would have to be taken to pro· vide a good statistical data b~se. Signal s~rength. r~ad. ings would have to be taken m several typIcal bUlldmgs and at several locations in each of the buildings. These would have to be repeated on about five different frequen· cies between 150 MHz and 3000 MHz. Signal strength -----------------------------------------------
8 L. P. Ricc, "Rollio Transmission into Buildings at 35 and 150 Me." Bell System Technical lournal, Jnnuary 1959.
g L. P. Rice, op. cit. 10 W. Rae Youni, Jr., Dp. elt.
145
Table E-2.-Performance Factors vs. Frequency of Portable Police Radio Equipment
Body·worn antenna frequency
Gain with respect 10 a half·wave dipole
Body shadow loss Industrial and man· made noise foliage loss Building penetration ability
-8 to -9 db (trouser leg or earphone cord) Appreciable •.••••.•••••••••••• Uncertain............. Uncertain.
ISO MHz............ -8 to -15 db •.••.•
450 MHz •••••••••••• 1 -2 to -3 db ••.••••
960 MHZ ..... ·." •.• I--.{1to +1 db •••••••
2000 MHz ••••.••••.• ~O to +3 db •••.•••
-8 to -9 db (trouser leg or earphone cord)
--.{1 db (head or shoulder antenna) •••• less than at 450 MHZ ••••••••.• / More than a! 450 MHz •. Indications of being better than at
--.{1 d!, (head or shoulder antenna) •••• Probably less than at 960 MHz. More than at 960 MHz •• Un~~~t~~~'
less than at ISO MHz.......... More than at 15C MHz.. Known to be better than at ISO MHz.
versus r:mge should be determined by taking measurements over about 20 different distances, varying from a few tens of feet out to about 15 miles. . Oth{!f steps that c~:>uld be taken in approaching the de
sign of portable radIOS for officers on foot would depend on whether the units were to be used by foot patrolmen or by motorized patrolmen while away from their vehicle. These two cases will therefore be treated separately.
COMMUNICATIONS FOR THE POLICE OFFICER AWAY FROM HIS VEHICLE
Since a motorized officer is almost always within n few hundred feet of his patrol car, its relatively reE::.bic communications set suggests that his portable radio tak'e advantage of the communications available in thc; car. Possible means of accomplishing tnis are. as follows:
o Having the car radio detachable so that the offieer can carry it with him.
D ~aying the car rece.iver unit detachable and provId!1~g the officer WIth a short-range transmitter, the SIgnal from which would be rebroadcast by the car's transmitter.
o Developing a simplified transceiver to communicate with a like unit in the car that would be connected to the car's two-way radio for rebroadcasting.
o Having a car radio capable 'Of being switched to a simple repeater mode and providing the officer with a transceiver operating on ba~e.station frequencies.
o Developing a simple short-range signaling device that could signal the car and trigger an automatic call for help.
transmitter and receiver d? operate at the same frequency. Further:nol:e, the car ~adlO units are usually designed so that sWltchl.ng of receIver and transmitter frequency is performed sunultaneously with the turning of one switch so that the transmitter and the receiver automatically stay tuned. to the same frequency. There are three possible techl1lques for coping with this problem:
o Use f~irly complicated time sharing and signal samplmg techniques to switch the receiveR' and transmitter portions of t~e repeater alternately (:n an.d off at an \Iltrasomc rate, thereby peJrmittmg smgle frequency repeater operation.
.0 Have police networks operate in a duplex mode. o Modify two-way car radios so that the frequency
of receiver and tram,mitter portions cam be switched separately.
The first technique would be too expensive. The second ~echnique would be wastef'Ul of radio spectrum and may mtroduce the ?pe;ational, disad;vantage of hindering car-to-car comn:~um~atlOns. 1 he durd appears rela.tively ~asy to accomplIsh; It does require extra frequencies; link~ mg the car and the patrohl;1an, but acquiring frequencies for such short-range use WIth law power should not be a serious problem.
Detachable Car Radio
The concept of a detachable car radio has the ob1vious appeal that it requires no additional frequencies and it avoids the single frequency repeater problem. The 1)l1ly additional equipment would be a portable antenna .and a snap-on battery power supply.
. There are, however, serious disadvantages in this tle'chmque:
The Single Frequenc~1 Repeater Problem .0 Even with fully transistorized mobile transc(~iv-J ers, the set would be cumbersome in size and
T ~~ .he above techniques, except for the first and the last, would use the patrol car radio as some form of a radio re- D The detached unit probably could not include
the final amplifier on the car transmitter and it peateI', with the car receiver aud!o output switched into wo.uld, therefore, be; a comparatively low power the car transmitter microphone input. This requires that umt. the repeater's transmitter operate on a different frequency 0 If h f . t ~ cal' transceiver is operating at a frequem:y rOm the repeater's receiver in order that the transmitter that IS less than optimum for transmission frolm
signal not block the receiver. However, many police radio within buildings, communications reliabili\ty ~tworks operate in a simplex mode in which each car's would be unduly impaired.
----------------------------------~~-------------

I I
-I I. .\ , ! l' I I,
(
146
Detachable Car Receiver
This approach is diagramed in figure B-2. The regular car radio receiver oper .. .ting .at frequency fl would be detached and serve as the receiver unit to be carried by the officer. It would be powered by a snap-on battery pack. The officer would also be: supplied with a smal}, inexpensive, short-range transmitter (Ta) to transmit to a small receiver (Ra) installed ill the car. The output of receiver Ra would feed into the regular car transmitter for retransmission to the base station.
Although this method relJ.uires an additional hand-held transmitter and an additional receiver unit for the car, it is presumed that units could be developed for this purpose that would be relatively simple and inexpensive. This is because the Ta to Ralink (fig. E-2) would always be very short and could be at whatever band of frequencies is found to be optimum for communicating from within buildings. This would mean that the transmitter Ta could have very low power output and the receiver Ra could be relatively insensitive. The advar.tages and disadvantages are compared in table B-3.
As an alternative, the officer could be provided with only the transmit capability, Ta in figure E-2, and a call to him on the radio could be signaled by remotely sounding the horn 01' siren of his car.
The possible problem of "active multipath intermodulation" warrants some consideration. It is conceivable that two or more patrol cars in range of a patrolman's hand-held units might have their radio equipment switched into a repeater mode. Even though the transmitters are crystal controlled and presumably operating on the same frequency, they would almost certainly be separated in frequency by several cycles. Reception of two signals of about equal intensity separated in frequency by only several cycles would result in severe intermodulation and probable loss of intelligibility. It J,Ilay
, FIGURE E·2. COIiFIGUUnOIi FOI DETACIIAILE Cal IECEIVEI MUIIOD
BASE STATION
T,
R2
J f, OR f2
NOTE:
I I
f,
PAl'ROL CAR EQUIPMENT
T II I R
If T2 is to operate on fl (the some frequency as R, ),
then circuitry must be provided so that R, is muted
when T3 transmits and so that the unsquelching of
R3 turns on T 2'
f3
,OFFtCE-R':Sl ,HAND-HELD , EQUIPMI:NTl
,~ , (FROM I CAR) , ,
T3 I L __
1 __
, , , , , , .I
Table E-3.-Evalualion of Detachable Receiver Approach
Advantages
Provides the officer away from his car with the use of the high·powered transmitter in hl~ patrol car.
Officer·to.patrol·car link can operate in optimum frequency band.
Takesadvantage of patrol car receiver. Can utilize relatively low power hand·held
transmitter. Car receiver (R3) can be relatively inex·
pensive, insensitive receiver. Car receiver (R3) would operate on a
different frequency than the car trans· mitter thereby automatically solving the single frequency repeater problem.
Shortcomings
Requires assignmo,nt of an extra frequency for the officer to patrol car link.
Requires an extra transmitter and extra receiver even though they may be rei. atively Inexpensive.
Officer's hand·held receiver must operate on the base· station frequency, whiCh may not be an optimum frequency for com· munication 10 the inside of buildings.
A snap·on powerpack and antenna must be attached to the car radio receIver when removed from the car.
May require the use of selective codIng techniques to avoid the "active muttipath intermodulation" problem.
be possible to handle this problem by means of operating circuit discipline, or if further analysis shows that this is not sufficient, selective coding techniques can be employed so that the hand-held unit would. turn on only the one repeater as intended.
Simj}lified Transceiver
Another technique is pictured in figure E-3. This method would theoretically provide the most reliable communications since equipment in the car would be used as a repeater for both outgoing and incoming transmissions. This method would involve providing the patrolman with a small inexpensive transceiver and installing a similar unit in the car, which would be connected to the I;ar's regular car two-way radio as shown in figure £'-3.
Compared to the previous concept, this mode avoids engaging and disengaging the regular car receiver and the portable powerpack. It would normally require two additional frequencies for the officer-to-car link unle1;s special circuitry were used that would enable operation \\lith one additional frequency. The regular two-wa.y
FIGUIE E·3. COIlFIGUIATlOIl FOI SIMPLIFIED TRAIISt:EIVU TECHNII\UE
BASE STATION
T,
R2
f, J , f2 :
I
PATROL CAR EQUIPMENT
R, T3
T, R4
t f3 , , f4 I
SEE r , . _____________ NOTE NOTE: f3 and f4 could be the some frequency if special
electronic circuitry is employed 10 operate this link in a simplex mode.
OFFICER'S HAND-HELD EQUIPMENT r---1
R3
'--_ .. -T4
I '
~ \ .:1 I
..... ~ .. ~~r
car radio would have to have an additional transceiver capable of linking up with the portable transceiver. This method may also require the use of selective coding techniques to avoid the "active multipathintermodulation" problem.
Car Radio Converted to a Simple Repeater
For radio networks operating in a duplex mode, the output of the car receiver could be connected to the transmitter microphone jack, thereby converting the two-way car radio into a simple repeater. (See fig. E-4.) The officer would be provided with a small, short-range, inexpensive transceiver which would u~e the same receiving and transmitting frequencies as the base station. This method would not work with s~mplex communication networks where both receiver and transmitter frequencies are the same.
With this method, every transmission by the base station, as well as every transmission by the patrolman, would be retransmitted by the car radio on hs regular transmitter frequency. No additional frequencies would have to be assigned. The only additional equipment required would be a relatively low power hand-held transceiver to be carried by the officer.
Use of Simple Short-Rd,nge Signalling Devices
For distress calls, the officer away from his car could be provided with a very simple low powered transmitter (Ta). When the officer presses a button, the transmitter would send a coded signal to the companion receiver (Ra) in the patrol car (fig. E-5). Upon receiving a signal of the proper code from T a, the patrol car receiver (Ra) would activate a switch that would cause the patrol car transmitter to broadcast an automatic call for assistance. This has the clear advantage that the very narrow bandwidth of the radio control link signal permits a design that could greatly increase the sensitivity of the control link receiver, and thus the link could operate with a very low power hand-held transmitter. It has the obvious disadvantage that the officer cannot describe his predicament and cannot receive an acknowledgement that this call has been rece ·wd. The dispatcher must rely on a previously reported lucation. Although expected to be inexpensive, the radio control link would require an additional hand-held transmitter and an additional receiver in the car.
fiGURE E·4. CONfiGURATION fOR THE cn RADIO CONVERTED TO A SIMPLE REPEATER
BASE STATION
T, B.S.
R2 B.S.
f,
f2
PATROL CAR EQUIPMENT
R I' ..... ' .,-
~~ T2
f,
f2
PATROLMAN'S HAND-HELD EQUIPMENT
T, P.M.
R2 P.M.
FIGURE E·5. COIlFIGURATlOIi FOR SNORT ·IAIIGE SIGllAlIlIG DEVICE METHOD
PATROLMAN'S HAND-HELD EQUIPMENT BASE
STATION l1-----,f 3'--[J
NOTE: Since the cor radio receiver would 1101 be used at all,
or only for selective signaling purposes when 12 would
not be transmitting, T2 could operate on the some
frequency as f, •
Use of Fixed Repeaters
Although all of the methods for utilizing the patrol car radio as a repeater would greatly improve the communications available to the patrolman away from the car, the methods all share some important disadvantages:
All 111ethods require at least some modification to the patrol car radio.
In high mUltipath areas such as in downtown areas, there are numerous "dead spots"; further· more the location of these dead spots can change when nearby vehicles are moved. Therefore, th~re is a possibility that a patrol car may be ineffective as a repeater because it was inadvertently parked in a dead spot.
Because of the low height of the patrol car antenna, it is not an ideall'epeatel'.
The above disadvantages raise the possibilit), that other methods may be superior to using the car radio as a repeater. These would include the possibility of a handheld transceiver linking the patrolmen directly to headquarters or to strategically located fixed repeaters, It would not be practical to communicate directly to headquarters in large cities where the patrolman might be inside a building that is several miles from headquarters. On the other hand, smaller cities may find this method both practical and economical, as exemplified by the experience of Berkeley, Calif.
The usc of fixed repeaters would be particularly practical in cities such as Washington, D.C" which have already installed a system of repeaters for their foot patrolmen, who are equipped with hand-held transceivers,
_~_='_!5~ ____________________ ~ ______ ~~~~~~~~~~~=-~~~~~~~~~
• '"~ •. , "'1"~'
. ~~-."~.< .•... ".

148
Conclusions
There are a number of methods by which the officer away from his patrol car could be provided with relatively reHa:ble communications by using the patrol car radio as a repeater station. Virtually all such methods require the assignment of additional frequencies and some modification of the patrol car equipment. Each of the methods must still be evaluated in terms of performance and cost, both of which depend on the extent to which microminiaturization and integrated circuitry can reduce the size, weight, and cost of the officer's hand-held equipment.
Once the frequency tests discussed previously arc conducted, it will be possible to prepare equipment performance specifications for various situations. These could then lead to a development and production program providing microminiaturized hand-held units for less than $150.
COMMUNICATIONS FOR THE FOOT PATROLMAN
The approach to a design of a portable radio transceiver for foot patrolmen would be very sirniliar to that Jl~cussed above. There are, however, important differences. The foot patrolman'S equipment has to communicate over a greater range since he does not have a :-Iearby vehicle whose radio could serve as a repeater. Although foot patrolmen have a genuine need to be able tt> communicate from the inside of buildings, they do not have the need on as many occasions as does the motorized patrolman. In short, compared to the motorized patrolman, the foot patrolman is more in terested in range of communications and slightly less interested in being able to communicate from the inside of buildings.
Although the foot patrolman most likely cannot take advantage of a nearby car radio repeater, fixed station repeaters can be located at frequent intervals throughout a city so as to reduce the power and range requirements of the portable radio. This, in tum, reduces the size, weight, and cost of the units.
There is a tradeoff to be made between the number of repeaters installed and the radio frequency power output requirement of the handheld transceiver. Practically speaking, there would be little advantage in reducing power output requirements below 100 miiliwatts hecause at that point the microphone, speaker, case, and antenna become dominant size and weight factors. Regardless of the extent to which the transceiver is miniaturized, the battery becomes unduly heavy and cumbersome in units above about 2 watts of power output.
Determining the number of repeaters to be used would appear to be a matter of making a simple cost comparison to find the point between 100 milliwatts and 2 watts where the cost of the system (repeaters plus transceivers) becomes the lowest. To accomplish this tradeoff analysis, it is necessary to have more factual data on the optimum frequency to be used and on how signal strength varies with range in the communications environment of a police officer.
The theoretical line-of-sight range can be shown not to
be a limiting factor in the communications range of a typic~1 port~ble police radio tra~lsceiver. For example, a tYPical umt would operate at 1.50 MHz and have 1 watt of power output. It would transmit to a receiver having a sensitivity of 1 microvolt. Under these circumstances, the frees pace range of communications is over 1,100 miles.
Considering that police often have difficulty transmitting more than a few blocks, it is obvious that factors other than transmitter power output and receiver sensitivity are primarHy responsible for limiting the range of communications at these frequencies. Even if we assume that the line-of-sight horizon limits the range of communications, that a portable transceiver is held at a height of 6 feet above the ground, and that it is transmitting to a base station with an antenna height of 50 feet, the horizon-limited line-of-sight range is 13.5 miles.
In actual practice, even a range of 13.5 miles would seldom be achieved with a portable police unit. The reason is that foot patrolmen are nOlmally trying to communicate in an environment where the line-of-sight path from their transceiver to the receiving unit is blocked by buildings, hills, towers, trees, etc. Communications between the two units is possible then only by virtue of scattering and reflections from these obstacles.
This serves to emphasize the need for performing a statistical analysis of actual field measurements to provide the data necessary for a realistic prediction of useful ranges for hand held transceivers.
In order to develop performance specifications for foot patrolmen radios and for the design of city networks, field data will be needed on reliable communication range as a function of frequency and power output and on the costs of transceivers and repeaters.
Design of radio systems for the foot patrolmen should be related to the handheld equipment for use by officers away from their cars. If the method selected turns out to be that of providing the officer with a hand-held transceiver, then it would be advisable to combine the two specifications. It might be advisable, however, to have two versions of the same equipment: The unit for motorized partolmen might have a low power output, and the one for the foot patrolman higher power.
If the performance specifications for the two types of units are similar, their developments should be combined. If the two units are considerably different, two separate development programs might be needed.
To bring this about, the Federal Government could initiate a survey to determine the size of the immediate market and also the technical specifications which the product should satisfy in order to qualify for the market. The results of the survey could then be made available to industry in the expectation that the r.ompetitive process would bring about the remainder of the development.
The Federal Government might also initiate a program to develop working prototype equipment. The highly successful program of AID in developing a standardized pmtable radio unit followed this basic approach.
Finally, it might be hoped that the exposure of the problem here will be sufficient to SpUt mdustj"Y to develop the required equipment.
AUT9MATIC CAR LOCATORS
INTRODUCTION -r
Reducing the response time in getting fie1d units to the scene upon receipt of a call from a citi1.en has been shown in chapter 2 to be related to improving the probability of making an arrest. There are frequent instances when an unnecessarily long response time results from assigning a patrol car that may falsely appear to be the closest available patrol car. Automatic patrol car locators could reduce this problem.
At present, the locations of various patrol cars within a city are known only to the extent that they arc patrolling in an assigned sector. As a result, the location of a patrol car is actually known only to within 1 to 4 miles traveling distance of its presumed location. Therefore, when handling an emergency call a dispatchl~r often requests any car in the vicinity of the incident to respund. This usually results in an unnecessarily large number of cars responding, with the closest car generally being one of the units.
There are many instances, however, when the closest car does not respond. For instance, a motor patrolman may not be aware that he is the closest available car to tIl(' scene. It was shown in chapter 2 that many calls that are classified as routi'le actually escalate into emergency situations before the police arrive. In the case of routine calls only one particular car is assigned and it often occurs that the cal' that is assigned is actually not the closest car. Car locator devices would make it possible to select and assign the closest available car.
Of equal significance, however, is the fact that car locator devices make possible more detailed control of the mobile forces. Knowing the locations of cars permits an intelligent redeployment of forces as emergency situ: ations develop, avoiding overresponses and underresponses and the possibility that sections of a metropolitan area may be inadvertently left without police protection. For example, a report of a suspected burg1ary in p~ogress is one of those cases that usually results in an unnecessarily large number of patrol cars responding to the scene. Car locator devices would permit assignment of the two or three cars closest to the scene, and if advisable, other cars could be strategicCllly deployed along likely escape routes.
RESOLUTION REQUIREMENTS
The accuracy of rcsolution required is one which will reduce, to some acceptably low level, the probability of assigning the wrong car. '.5 the number of available cars is decreased, the advantages of accuracy become less. In the extreme ca~e of there being only one car available, accuracy becomes of no consequence since that one car is, automatically, the closest available car.
Dr. Mandell Bellmore performed an analysis to estimate the accuracy that would be required in an)' car locator system. This analysis assumes that the measure of the value of the police dispatcher knowing the exact location of the patrol cars in his district was the extent
149
to which it would enable him to dispatch cars in a manner which would reduce the travel timc associated with a request for police service. For purposes of the analysi~, two systems were studied and compared. The first system is similar to the norma1 situation where the dispatcher does not have thl' information that a car Jocator would provide him. The second system simulates the situation where the dispatcher would have the use of a car locator having some specified accuracy of resolution, In both systems, cars were assigned to square beats. Each car i~ instructed to patrol its beat in an essentially random manner so that it is not possible to predict its exact location at any instant. For case of discussion, assume that the beaL~ are n\lmbered (i.e., Beat 1, Beat 2, etc.).
Assume that a call for police assistance is requested from a location in Beat 10. In the first system the dispatcher assigns the car in Beat 10 to answer the call, providing it is available; in the second system the dispatcher, based on car locator information, assigns the car which is available and he believes to be closest to the location requesting assistance.
To determine the effect of car locator accuracy on the system, it is assumed that each beat is broken into square subbeats, or resolution cells. The Car locator system can detcimine a car's subbeat but cannot specify its location within the subbeat.
The situation examined is illustrated in figure E-6, which depicts two adjacent square beats with car locator resolution distance one-third the beat ~ize. We define "resolution" to be:
J'=R/B where: 1'= l'csolut ion
R=resolut.ion distance n=bcntsize
It should be noted that "resolution" as defined here for purposes of this analysis differs from the usual defi'nition of resolution, since a larger value of rewlution here implies more coarse. position deteimination. This is shown in the two extreme cases: If R=·l, then the dispatcher has no more knowledge in the second system than the first, and the two are ide·ntical. When r=O, then the dispatcher has perfect knowledge of the location of all cars and this corresponds to an error-I,ce car locator system.
The measure of effectiveness chosen to compare systems is the difference in distance that must be driven to answer a call for police assistance. That is, the difference in distance between the car that the dispatcher assigns to the call and the car which is in fact closest to the call. To approximate the driven distance, distance is measured ru; the sum of the north-south distance and the cast-west distance as is also illustrated in figure E-6. Time lost can be calculated from this measure by dividing by the unit's average speed.
The systems described were simulated on a digital computer. A squarc area cO:1tailling 144 beats was simulated, Cars Wl:I'e assigned locatiol1f; randomly within their beats. An out-of-service rate was '.pecified for each run. A uniformly distributed random number between 0 and 1 was
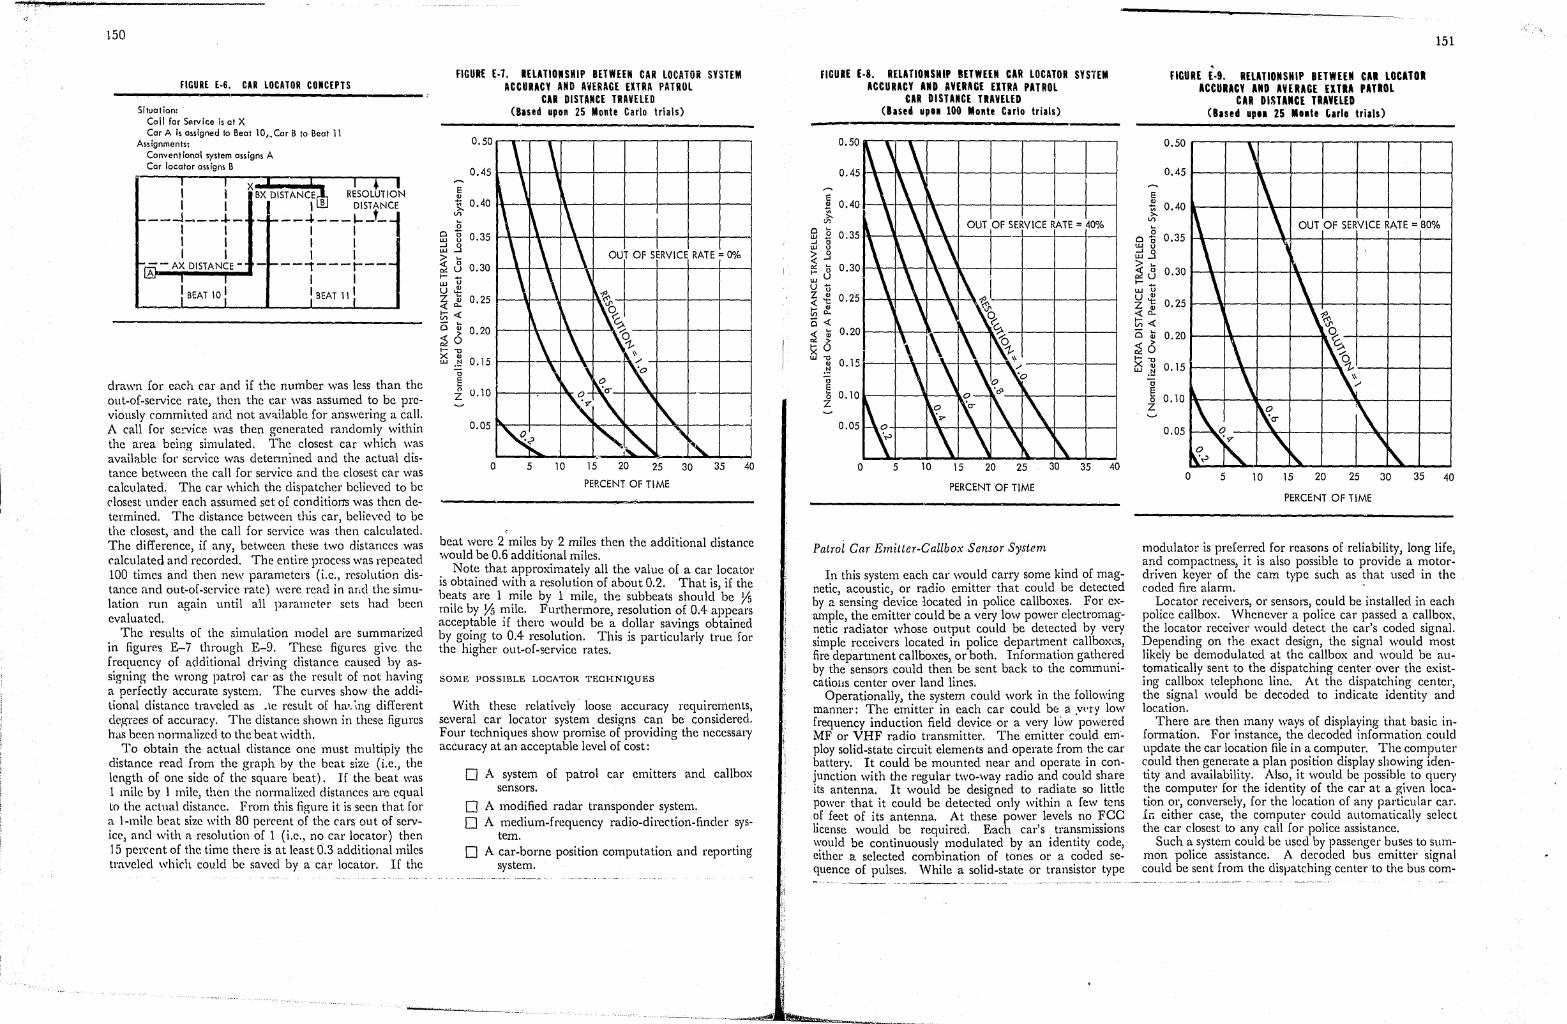
"
150
FIGURE [·6. CAR LOCATOR COIIC[PTS
Situation: . Call far Service is at X Car A is assigned to Beat 10
" Car B to Beat 11
Assignments: Conventionol system assigns A Car locator assigns B ,
i I I
~---I---~-I I I I I I
1-00- AX DISTANCE-.A I I
I BEAT 10 :
X'. I 'i I ax DISTANCE~ RESOLUTION
I B DISTANCE
,- f---4---1--'--I I I I I I -f---,---r----I I : BEAT llJ
drawn for each car and if t!1e number was less than the out-of-service rate, then the car was assumed to be previously committed and not aVllilable for answering a call. A call for service was then generated randomly within the area being simulated. The closest car which was available for service was determined and the actual distance between the call for service ,md the closest car was calculated. The car which the dispatcher believed to be closest under each assumed set of conditior1'S was then determined. The distance between this car, believed to be the closest, and the call for service was then calculated. The difference, if any, between these two distances was calculated and recorded. The entire proce,s was repeated 100 times and then new parameters (i.e., resolution distance and out-of-service rate) were read in and the simulation run again until all parametrl' sets had been evaluatecl.
The re:sults of the simulation model are summarized in figures E-7 through E-9. These figures give the frequency of additional driving distance caused by assigning the wrong patrol car as the result of not having a perfectly accurate system. The curves show the additional distance traveled as .. le result of hal, :,ng different del{t"ces of accuracy. The distance shown in these figures has been normalized to the beat width.
To obtain the actual distance one must multipiy the distance read from the graph by the beat siz(; (i.e., the length of one side of the square beat). If the beat was 1 mile by J mile, then the normalized distances are equal to the actual distance. From this figure it is seen that [01'
a I-mile beat size with 80 percent of the cars ou t of service) and with a resolution of 1 (i.e ... no car locator) then 15 percent of the time there is at least 0.3 additional mUes traveled which could be saved by a car locator. If the
FIGURE E-1. RELATlOIiSHIP BETWEEII CAR LOCATOR SYSTEM
E .,
ACCURACY AND AWERAGE EXTRA PATROL CAR DISTANCE TRAVELED
(Blsed upon 25 Monte Carlo trials)
O. 45 1--\-+---1~--t---t---+--+--t---j
~ 0.40 I\----\---I\---I---l---II---t--t----I V> ... 0
0 '0 0.35 UJ u -' 0 UJ ...J > ... « " ",u 0.30 I- U UJ u.e z ii 0.25 «0.. /j:;« o Q) 0.20 ~o I--u X .,
0.15 w .~
-0 E 0 u.10 Z
25 30 35 40
PERCENT OF TIME
, beat were 2 miles by 2 miles then the additional distance would be 0.6 additional miles.
Note that approximately all the value of a cal' locator is obtained with a resolution of about 0.2. That is, if the beats are 1 mile by 1 mile, the subbeats should be Ys mile by Ys mile. Furthermore, resolution of 0.4 appears acceptable if thel'e would be a dollar savings obtained by going to 0.4 resolution. This is particularly true for the higher out-of-service rates.
SOME POSSIBLE LOCATOR TECHNIQUES
With these relatively loose accuracy requirements, several car locator system designs can be considered. Four techniques show promise of providing the necessary accuracy at an acceptable level of cost:
o A system of patrol car emitters and callbox sensors.
o A modified radar transponder system. o A medium-frequency radio-direction-finder sys
tem. o A car-borne position computation and reporting
system.
FIGURE E·8. RELATlOIiSHIP REly/EU CAR LOCATOR SYSHM
S B ...I " W U
~ .3 '" ... :;:;Cl u -Z ~ ~1; VI c.. 0« ~ ii
E~ ., .!:!
"
ACCURACY AND ~VERACE EXTRA PATROL CAR DISTANCE TRAVELED
(lased up .. 100 Monte Carlo trials)
0.50 a--.,.. .... ..-.---,--.,---,--....,---,--,
OUT OF SERVICE RATE = 40% 0.35~-~~~~~--+--·-4--~-+-~
O. 25 I--\-j--+I--+~
0.201---\+--lI!
E o 0.10 l---+---..... -~ Z
o 5 15 25 35 40
PERCENT OF TIME
Patrol Car Emitter-Callbox Sensor System
In this system each car would carry some kind of magnetic, acoustic, or radio emitter that could be detected by a sensing device 10cated in police callboxes. For example, the emitter could be a very low power electromagnetic radiator whose output could be detected by very simple receivers located in police department callboxcs, fire department callboxes, or both. Information gathered by the sensors could then be sent back to the communicatiOliS center over land lines.
Operationally, the system could work in the following manner: The emitter in each car could be a .wry low frequency induction field device or a very It:.w powered MF or VHF radio transmitter. The emitter could em~ ploy solid-state circuit elements and operate from the car battery. It could be mounted near and operate in conjunction with the regular two-way radio and could share its antenna. It would be designed to radiate so little power that it could be detected only within a few tens of feet of its antenna. At these power levels no FCC license would be required. Each car's transmissions would be continuously modulated by an identity code, either a selected combination of tones or a coded sequence of pulses. While a solid-state or transistor type
151
, FIGURE E·9. RELATIONSHIP BETWEEN CAl LOCATOR
ACCURACY AND AVERAGE EXTRA PATROL CAR DISTAIICE TRAVELED
(Based up .. 25 Mute tarlo trills)
0.50 , 0.45
E
~ 0.40 >-
V>
15 0.35 Do
UJ u -' " UJ ...J
~ 15 0.30 ",u 1- ... UJ u U ., z't 0.25 «£ /j:;« 0 ... 0.20 ., ~o \.<-u 0.15 w .~
-0 E 0 0.10 Z
0.05
\ ~ \ OUT OF SERVICE RATE'" 80%
l , ~
~ \ ~ \~ 'S
l ~~I Il _\ \
~ ~ i\ 'o;r
" ,
1\:,"" ~ r\. o 5 10 15 20 25 30 35 40
PERCENT OF TIME
modulator is preferred for reasons of reliability, long life, and compactness, it is also possible to provide a motordriven keyer of the cam type such as that llsed in the coded fire alarm. .
Locator receivers, or sensors, could be installed in each police callbox. Whenever a police car passed a callbox, the locator receiver would detect the car's coded signal. Depending on the exact design, the signal would most likely be demodulated at the callbox and would be automatically sent to the dispatching center over the existing callbox telephone line. At the dispatching center, the signal would be decoded to indicate identity and location.
There are then many ways of displaying that basic information. For instance, the decoded information could update the car location file in a computer. The computer could then generate a plan position display showing identity and availability. Also, it would be possible to query the computer for the identity of the car at a given location or, conversely, for the location of any particular car. f~ either case, the computer could automatically select the car closest to any call for police assistance.
Such a system could be used by passenger buses to StUllmon police assistance. A decoded bus emitter signal could be sent from the dis\)atching center to the bus com-

152
pany to alert them to the sitllation. The iocation of the bus could also be presented on the computer-driven display.
In Washington, D.C., for example, there are approximately 920 police calJboxes (fig. E-10), about 14 per square mile or OIle every quarter of a mile. This would provide sufficient accuracy for patrol car location. If finer accuracy were desired, consideration could be given to locating sensors in the 2,000 D.C. fire calJboxes.
If there were not a suffident number of call boxes in a city, or if the calJboxes use party line circuits, it may be neces~arv to use carrier derived circuits which can be superimposed upon existing physical circuits, such as fire and police cables, without impairing the present service. The carrier or radio frequency technique is widely used
in the field of telephony, radio, and powerline telemetry and control. In telephony, a significant portion of all trunk and subscriber circuits are carrier derived without impairment of the physical services at a cost well below that of additional circuitry.
The inverse of this technique could also be employed with coded emitters installed at fixed locations along the: street and sensors installed in patrol cars. A radio link would then be needed in the car to rclay the car's identification and location to the communications center.
The emitter and detector devices should be comparable in cost to the transmitter and receiver devices used with automatic garage door openers. In large volumes, it is estimated that the emitter units would cost about $20 each and the calJbox detector unil~ about $30. Thus, the
FIGURE [.10. POLICE CALL lOX LOCATIONS IN THE DISTRICT OF COLUMBIA
o
Scale-Miles
1885
2
1\
I
.. -~--------.~-~
equipment for 1,000 callboxes and 200 patrol cars would cost approximately $34,000.
To this must be added th:! installation costs and the cost of the central display system, which is difficult to estimate at this time. If a city has a suitable computer wailable for time sharing and it chooses to use the simplest type of display system, the cost may be as low as $100,000 to $200,000.
Modified Radar Transponder System
Because of multi path problems, conventional radar transponder techniques cannot be used as a means for locating police cars. In a conventional radar transponder system a radar interrogator would tra~smit a coded pulse train in the form of a short burst lastmg no more than a few microseconds. The transponder in a patrol cal' would recognize its code and reply with a short signal pulse. The transit time between transmission of the interrogation pulse train and receipt of the transponder reply would be a measure of the distance to the car being interrogated. Azimuth would be determined by the pointing direction of the interrogator antenna.
Unfortunately, the coded pulse train would generally be unrecognizable to t~e intended transponder bec?-use of the overlapping of Signals as they would be received over the various paths. This multipath phenomenon was investigated by W. R. Young and L. Y. Lacy.ll Their investigations indicate that, alth?ugh. VHF pulse signals are modified severely by reflectIOns In an urban a;ea, they do get through, with t~e leading edges. of the pulses substantially unaffected m almost every IDstance. This sug{yests that some modified radar transponder system not"using coded pulse trains might be used.
Two techniques have been suggested. One wO';lld be to use the selective signaling system of the car radl.o system to sequentially turn on transponders for a fractIOn of a second. During this time, the ~ranspondCl: would be interrogated and range and bearmg determmed bas~cl on the leading edge of the pulses. No c~de~ pulse tram would be requi~ed to identify the car ~e1l1g mterrogated because this would have been accomplished by the s?lective signaling technique. Th~s tec~l1lique has ~he ~hsadvantage that the tones transmlttedlll the selective Signaling process would load up a voice cha?nel to suc~ an. extent that it would not be useable for vOice commumcatlOn.
A second technique uses a periodically synchronized timing system in each car to turn on t~le car's tran~ponder at predetermined short periods of tlm.e. In thiS te~hnique (fig. E-ll), a central. beacon lI1t?rrogator with a directional antenna, rotatmg mechamcally o,r clecI;ronically, transmits pulse interrogations. Th.e mterrogations and replies are essentially single pulses with a p\l~se width in the order of 2 /L sec. Two different frequencies (in the same band) are used, one for interrogation and the other for reply .. The frequencies used may be in the 150 or 450 MHz bands, or perhaps in the vicinity of 1000 MHz.
The basic idea in the approach is the use of a relatively high interrogation rate by the interrogator (in the order
1l1'Echocs in Trnnsmission at 450 Mcgnc)'clcs from Lond·lo·Car Radio Units," W. R. Young Dnd L. Y. Lacy, Proceedings 0/ 1/111 I.R.E., MDrch 1950.
153
fiGURE E·ll. "SSIIl( UDAl cn LOCAl". sysn.
I TRANSPONDERS I IN POLICE CARS
t INTERROGATOR
(ROTATING DIRECTIONAL ANTENNA)
I t t
CENTRAL TV MONITOR REMOTE DISPLAYS DISPLAYS SHOWING
AT PRECINCTS STREETS, CAR TRAILS, AND CAR NUMBERS
of 5 kHz), coupled with a time apportionment system where any given transponder rel?lies to 1. and only. 1 interrogation out of roughly 100 mterrog~tl<?ns; the mterrogation answered by each transponder IS different and represents the transponder's identity.
At the start of every 100-interrogatlon cycle, a special synchronizing si~:nal is transmitted. Each transponder then starts to "~ount off" successive interrogations until its assigned one is reached. The !ranspond~r repli.es to that interrogation (nnd no other mterrogat~on) WIth a single pulse. Thus, each transponder replies to every 100th interrogation at a rate of about 50 Hz, and each interrogation is replied to by only one car.. This m.akes it possible to see closely spaced ~ars ?espI~e reflectIOns, ancl provides for a very Simple IdentificatIOn that docs not require either interrogator or transponder pulse modulation.
An important question to be r7s?l:,ed before <l; fit;al judgment can be made on the feaslblhty and I?ractlcahty
. of this system is what are the e~ect~ <?f reflectl.ons on. effective interrogator antenna directiVity. It IS pOSSible that the multiple transmission paths (via different reflections) may cause effective beamwidth broadening at;d boresight shift, and presence of .false targets .at c?rtam values of azimuth. The beamwidth broadenmg, If not too severe could be tolerable. The false targets, resulting from the presence of large reflecting surfaces in certa.in directions, may be reduced to an acceptable level by (~ISpbving continuous car trails (for true targets, whIch wr,uld make sporadically received reflections easily distinf!uishable from true targets) . , Some limited field tests are needed to observG the actual effects of reflections and to verify the feasibility of the basic approach.
lvledium Frequency Radio Direction Finder S'yste7n
Because of their relatively long wave length, MF' radio signals are not characterized by extreme multipath propa-
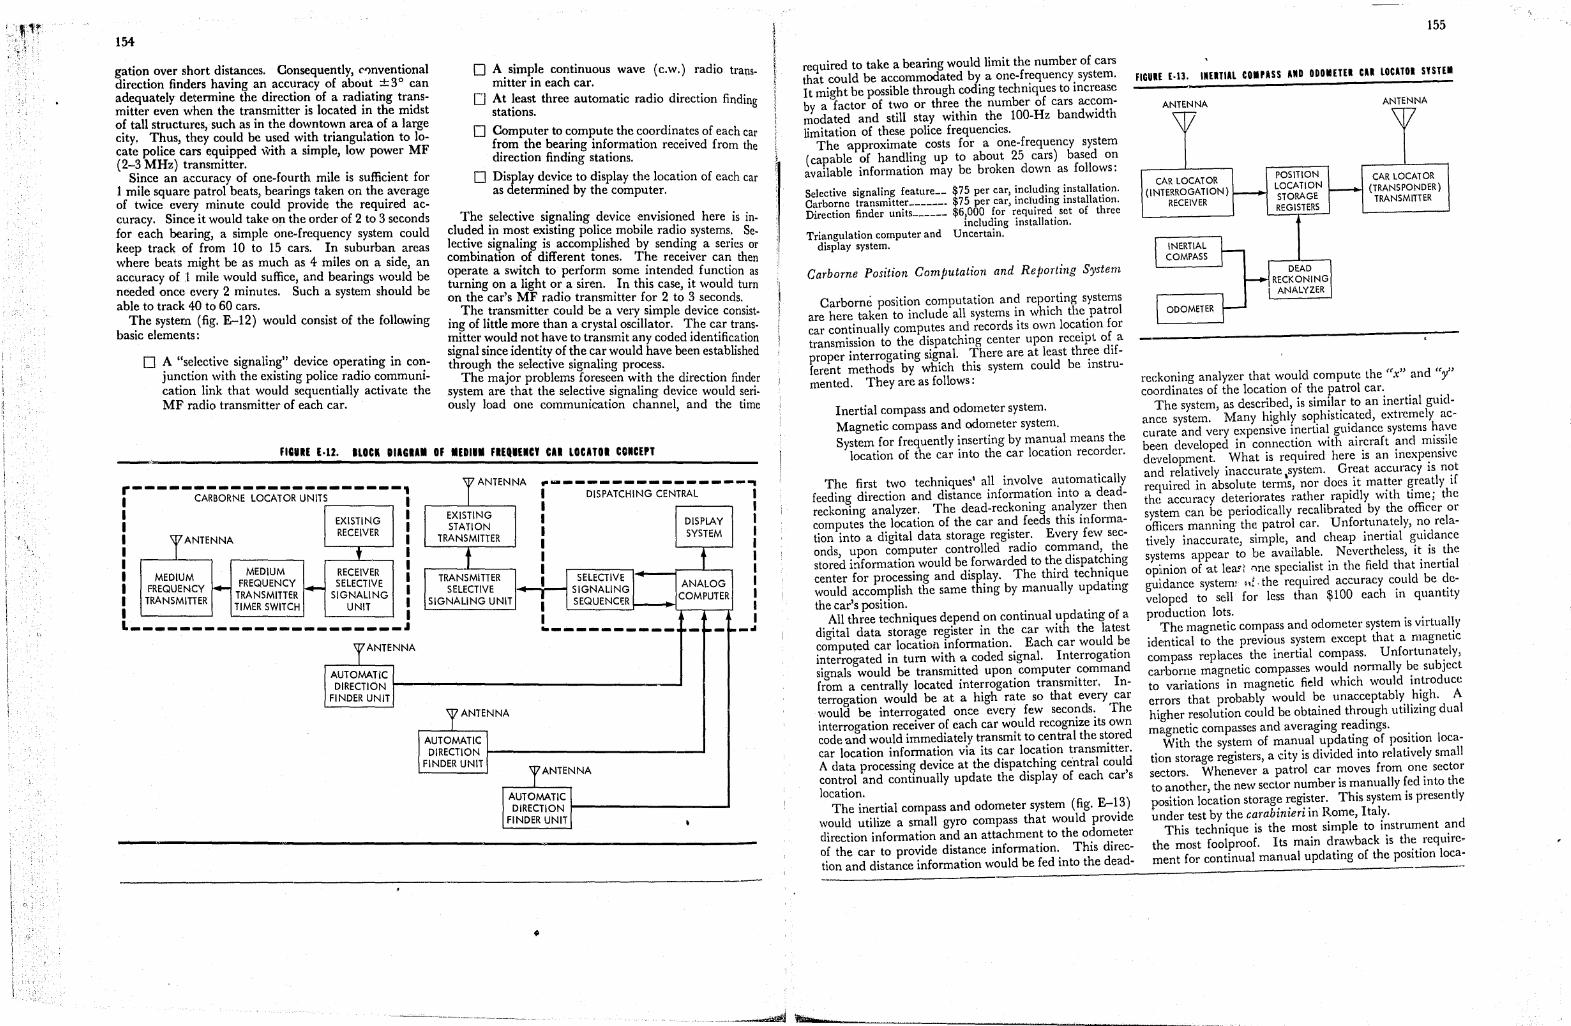
it,tr ,'[",
'1'~' ,
>') :
154
g~tio~ over short dis~ances. Consequently, c'1nventional directIOn finders havmg an accuracy of about ±3° can a~equately determine the direction of a radiating transmitter even when the transmitter is located in the midst o~ tall structures, such as in the downtown area of a large city. T~us, they could be used with triangulation to locate pohce cars equipped with a simple low power MF (2-3 MHz) transmitter. '
S~nce an accuracy of one-fourth mile is sufficient for 1 mil,,: square patrol beats, bearings taken on the average of tWice every minute could provide the required accuracy. Since it would take on the order of 2 to 3 seconds for each bearing, a simple one-frequency system could keep track of from 10 to 15 cars. In suburban areas where beats might be as much as 4 miles on a side an accuracy of 1 mile would suffice, and bearings would be needed once every 2 minutes. Such a system should be able to track 40 to 60 cars. ~he system (fig. E-12) would consist of the following
baSIC elements:
O A " 1 t' . l' "d . . s~ ec IV.C signa mg eVlce operating in con-Jun.ctlO': With the existing police radio communi-cation Imk that would sequentially activate the MF radio transmitter of each car.
o A simple continuous wave (c.w.) radio transmitter in each car.
D At !east three automatic radio direction findi stations. ng
o Computer to c.omI?ute the ~oordinates of each car fr.om !he bea~mg mf<;,rmatlOl1 received from the direction findmg statIOns.
o Display d~vice to display the location of each car as determmed by the computer.
The ~elective s!g~aling device envisioned here is inclu~ed 1~1 mo~t e~lstmg police mobile radio systems. Selectiv~ sl!?nalmg IS accomplished by sending a series or combmatlon .of different tones. The receiver can then oper~te a sWI~ch to perform some intended function as turmng on a hght or a siren. In this case it would turn on the car's ~F radio transmitter for 2 t~ 3 seconds. . The ~ransmltter could be a very simple device consistm~ of httle more than a crystal oscillator. The car trans· I~lltter ~oul? not.have to transmit any coded identification Signal smce Identity of the car would have been established through th.e selective signaling process.
The major problems foreseen with the direction finder system are that the selective signaling device would serio ously load one communication channel, and the time
_.c ________ F1_CU_.,;;.E ..;;E..;;.1,;;;2 • ....;.::l:.:OC:,: • ..;D:.:I:,.C:,:.:,..:...:O:F ..!.~E!:DI~ •• =..!F~.E:!Q~.E:!.~CY~C,.~.~l~O~CII~T~O!.. ~C!C.~C~EP~T~ ____ _
r----------------------I CARBORNE LOCATOR UNITS 1 I I I EXISTING I I 7 ANTENNA RECEIVER I I t I I -- I I MEDIUM MEDIUM RECEIVER I I FREQUENCY f+- FREQUENCY I- SELECTIVE I I TRANSMITIER TRANSMITTER SIGNALING I I TIMER SWITCH UNIT I L ____________ ~__ ,,1
-------
TANTENNA
EXISTING STATION
TRANSMITTER
t TRANSMITIER
SELECTIVE SIGNALING UNIT
.~---------------: DISPATCHING CENTRAL I I I I DISPLAY I I SYSTEM I I I I I I SELECTIVE II
T SIGNALING ANALOG
I SEQUENCER COMPUTER I I I I .. _--------- ... - ~- -_ ..
TANTENNA
AUTOMATiC DIRECTION I-----____________ ~_.J FINDER UNIT I ANTENNA
AUTOMATIC DIRECTION r-------------....J
FINDER UNIT TANTENNA
AUTOMATIC DIRECTION r------------1
FINDER UNIT
•
required to take a bearing would limit the number of cars that could be accommodated by a one-frequency system. It might be possible through coding techniques to increase by a factor of two or three the number of cars accommodated and stilI stay within the 100-Hz bandwidth limitation of these police frequencies.
The approximate costs for a one-frequency system (capable of handling up to about 25 cars) based on available information may be broken down as follows:
Selective signalin.g feature __ $75 per car, including installation. C~rbo~nc transmltt~r _______ $75 per car, including installation. DtrectlOn finder umts ______ $6,000 for required set of three
including installation. Triangulation computer and Uncertain.
display system.
Carborne Position Computation and Reporting System
Carborne position computation and reporting systems are here taken to include all systems in which the patrol car continually computes and records its own location for transmission to the dispatching center upon receipt of a proper interrogating signal. There are at least three different methods by which this system could be instrumented. They are as follows:
Inertial compass and odometer system. Magnetic compass and odometer system. System for frequently inserting by manual means the
location of the car into the car location recorder.
The first two techniques' all involve automatically feeding direction and distance information into a deadreckoning analyzer. The dead-reckoning analyzer then computes the location of the car and feeds this information into a digital data storage register. Every few seconds, upon computer controlled radio command, the stored bformation would be forwarded to the dispatching center for processing and display. The third technique would accomplish the same thing by manually updating the car's position.
All three techniques depend on continual updating of a digital data storage register in the car with the latest computed car location information. Each car would be interrogated in tum with a coded signal. Interrogation signals would be transmitted upon computer command from a centrally located interrogation transmitter. Interrogation would be at a high rate so that every car would be interrogated once every few seconds. The interrogation receiver of each car would recognize its own code and would immediately transmit to central the stored car location information via its car location transmitter. A data processing device at the dispatching central could control and continually update the display of each car's location.
The inertial compass and odometer system (fig. E-13) would utilize a small gyro compass that would provide direction information and an attachment to the odometer of the car to provide distance information. This direction and distance information would be fed into the dead-
155
flGUIE (·13. 1!I(n1Al COl PASS AIID ODOIETER ell LOCATOI SYSTEI
ANTENNA
CAR LOCATOR (INTERROGATION)
RECEIVER
POSITION LOCATION STORAGE REGISTERS
ANTENNA
CAR LOCATOR (TRANSPONDER)
TRANSMITTER
reekoning analyzer that would compute the ".t" and "y" coordinates of the location of the patrol car.
The system, as described, is similar to an inertial guidance system. Many highly sophisticated, extremely accurate and very expensive inertial guidance systems have been developed in connection with aircraft and missile development. What is required here is an inexpensive and relatively inaccurate ,system. Great accuracy is not required in absolute terms, nor does it matter greatly if the accuracy deteriorates rather rapidly with time; the system can be periodically recalibrated by the officer or officers manning the patrol car. Unfortunately, no relatively inaccurate, simple, and cheap inertial guidance systems appear to be available. Nevertheless, it is the opiinion of at leaFl "ne specialist in the field that inertial gui,dance system: h[, the required accuracy could be developed to sell for less than $100 each in quantity production lots .
The magnetic compass and odometer system is virtually identical to the previous system except that a magnetic compass replaces the inertial compass. Unfortunately, carborne magnetic compasses would normally be subject to variations in magnetic field which would introduce errors that probably would be unacceptably high. A higher resolution could be obtained through utilizing dual magnetic compasses and averaging readings.
With the system of manual updating of position location storage registers, a city is divided into relatively small seetors. Whenever a patrol car moves from one sector tOt another, the new sector number is manually fed into the position location storage register. This system is presently under test by the carabinieri in Rome, Italy.
This technique is the most simple to instrument and the most foolproof. Its main drawback is the requirement for continual manual updating of the position loca·
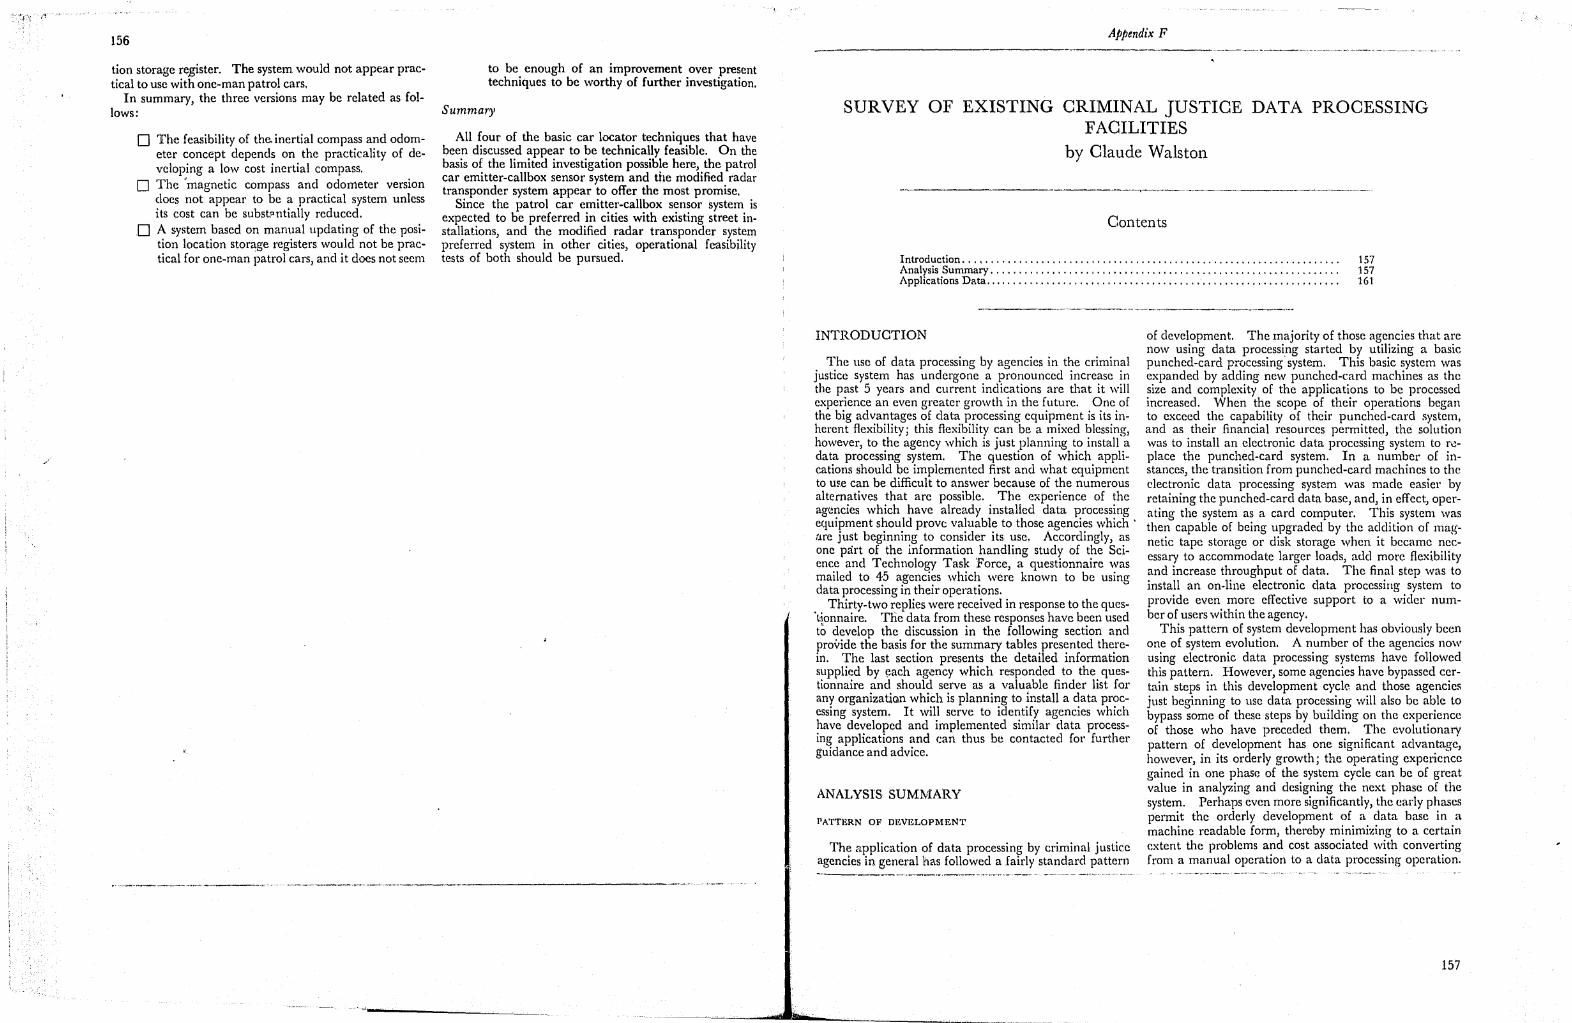
156
tion storage register. The system would not appear practical to use with one-man patrol cars.
In summary, the three versions may be related as follows:
o The feasibility of the. inertial compass and odometer concept depends on the practicality of developing a low cost inertial compass.
o The "magnetic compass and odometer version docs not appear to be a practical system unless its cost can be subst"ntially reduced.
o A system based on manual updating of the position location storage registers would not be practical for one-man patrol cars, and it docs not seem
to be enough of an improvement over present techniques to be worthy of further investigation.
Summar~'
All four of the basic car locator techniques that have been discussed appear to be technically feasible. On the basis of the limited investigation possible here, the patrol car emitter-callbox sensor system and the modified radar transponder system appear to offer the most promise.
Since the patrol car emitter-callbox sensor system is expected to be preferred in cities with existing street installations, and the modified radar transponder system preferred system in other cities, operational feasibility tests of both should be pursued.
Appendix F
SURVEY OF EXISTING CRIMINAL JUSTICE DATA PROCESSING FACILITIES
by Claude Walston
Contents
Introduction. . . • . . . . . . . . . . . . . . . . . . . . . . . . . . . . . . . . . . . . . . . . . . . . . . . . . . . . . . . . . . . . . . . . 157 Analysis Summary. . . . . . . . . . . . . . . . . . . . . . . . . . . . . . . • . . . . . . . . . . . . . . . • . . . . . . . . . . . . . . . 157 Applications Data ......... " " ... , ..•........................ '" " ., . . . . . . . . . . •. . 161
INTRODUCTION
The use of data processing by agencies in the criminal justice system has undergone a pronounced increase in the past 5 years and current indications are that it will experience an even greater growth in the future. One of the big advantages of data processing equipment is its inherent flexibility; this flexibility can be a mixed blessing, however, to the agency which is just planning to install a data processing system. The question of which applications should be implemented first and what equipment to me can be difficult to answer because of the numerous alternatives that are possible. The experience of the agencies which have already installed data processing equipment should prove valuable to those agencies which' {He just beginning to consider its use. Accordingly, as one part of the information handling study of the Science and Technology Task Force, a questionnaire was mailed to 45 agencies which were known to be using data processing in their operations.
Thirty-two replies were receiv,cd in response to the ques\~onnaire. Tlie data from these responses have been used t~ develop the discussion in the following section and provide the basis for the summary tables presented therein. The last section presents the detailed information supplied by \'!ach ag<!ncy which responded to the questionnaire and should serve as a valuable finder list for any organization which is planning to install a data processing system. It will serve to identify agencies which have developed and implemented similar data processing applications and can thus be contacted for further guidance and advice.
ANALYSIS SUMMARY
PATTERN OF DEVELOPMENT
The application of data processing by criminal justice agencies in general has followed a fairly standard pattern
of development. The majority of those agencies that are now using data processing started by utilizing a basic punched-card processing'system. This basic system was expanded by adding new punched-card machines as the size and complexity of the applications to be processed increased. When the scope of their operations began to exceed the capability of their punched-card system, and as their financial resources permitted, the solution was to install an electronic data processing system to rl:!place the punched-card system. In a number of instances, the transition from punched-card machines to the electronic data processing system was made easier by retaining the punched-card data base, and, in effect, operating the system as a card computer. This system was then capable of being upgraded by the addition of magnetic tape storage or disk storage when it became necessary to accommodate larger loads, add more flexibility and increase throughput of data. The final step was to install an on-line electronic data processing system to provide even more effective support to a wider number of users within the agency.
This pattern of system development has obviously been one of system evolution. A number of the agencies now using electronic data processing systems have followed this pattern. However, some agencies have bypassed certain steps in this development cycle and those agenciel' just beginning to use data processing will also be able to bypass some of these steps by building on the experience of those who have preceded them. The evolutionary pattern of development has one significant advantage, however, in its orderly growth; the operating experience gained in one phase of the system cycle can be of great value in analyzing anci designing the next phase of the system. Perhaps even more significantly, the carly phases permit the orderly development of a data base in a machine readable form, thereby minimizing to a certain extent the problems and cost associated with converting from a manual operation to a data processing operation.
157
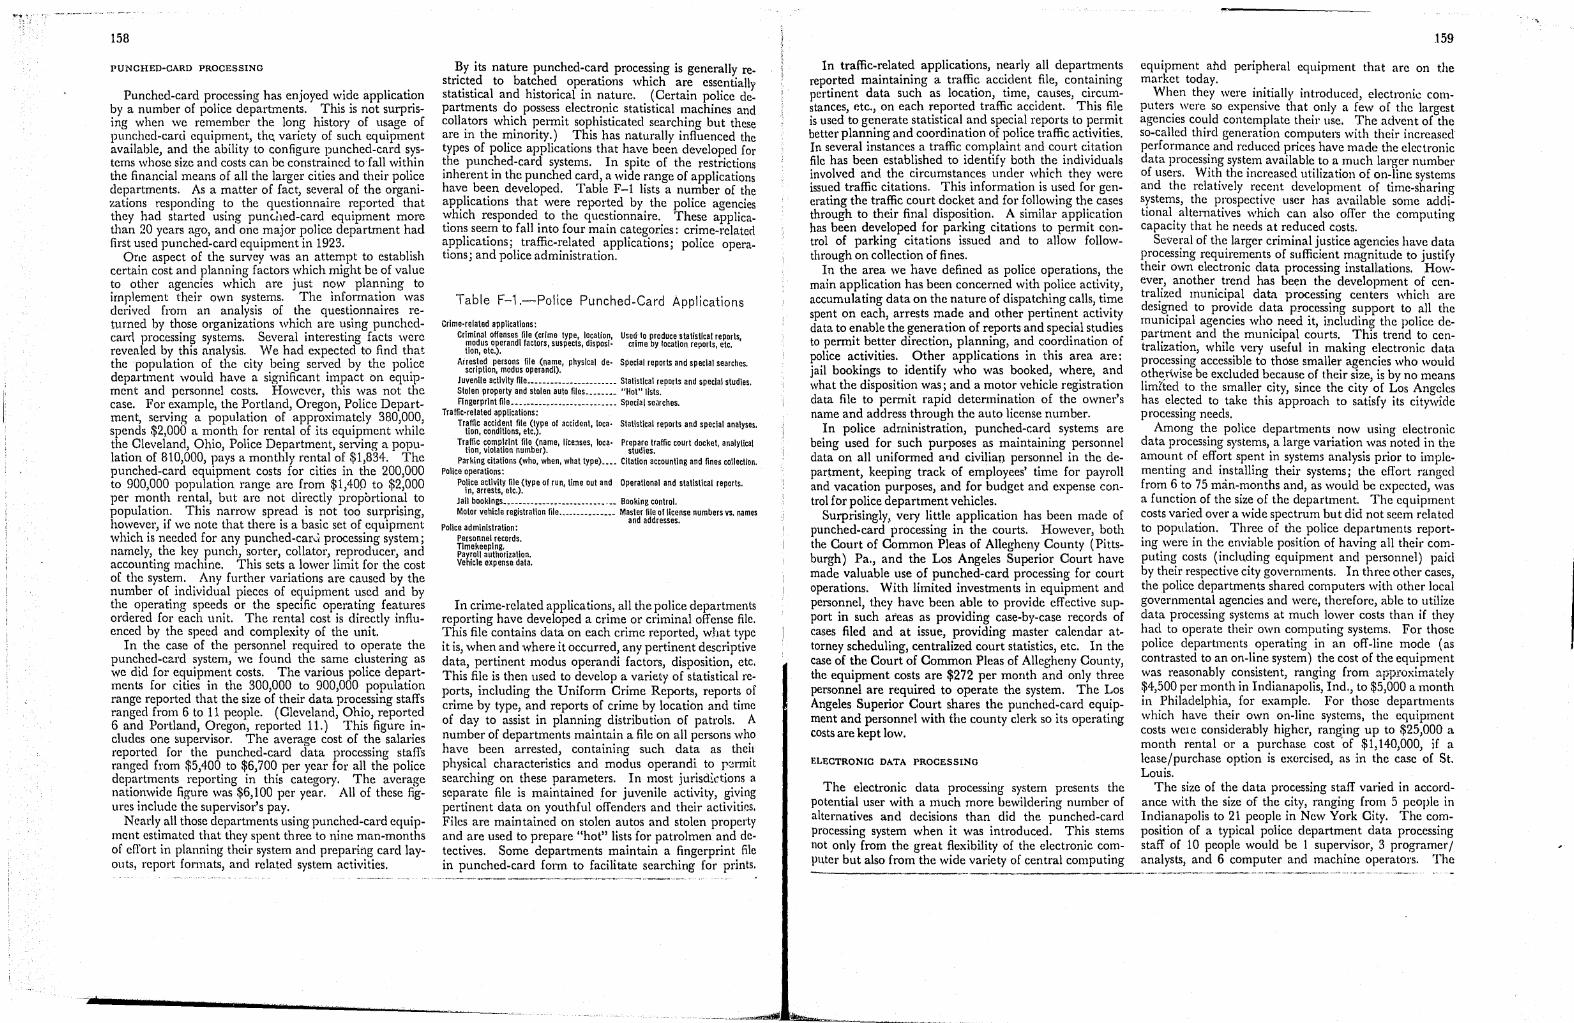
158
PUNCHED-CARD PROCESSING
Punched-card processing has enjoyed wide application by a number of police departments. This is not surprising when we remember the long history of usage of punched-carti equipment, the, variety of such equipment available, and the ability to configure punched-card systems whose size and costs can be constrained to fall within the financial means of all the larger cities and their police departments. As a matter of fact, several of the organizations responding to the questionnaire ref-orted that they had started using pum.tied-card equipment more than 20 years ago, and one major police department had first used punched-care! equipment in 1923.
Ortc aspect of the survey was an attempt to establish certain cost ane! planning factors which might be of value to other agencies which are just now planning to implement their own systems. The information was derived from an analysis of the questionnaires returned by those organizations which are using punchedcarel processing systems. Several interesting facts were revealed by this analysis. We had expected to find that the population of the city being served by the police depairtment would have a significant impact on equipment and personnel costs. However, this was not the case. For example, the Portland, Oregon, Police Department, serving a population of approximately 380,000, spends $2,000 a month for rental of its equipment while th~ Cleveland, Ohio, Police Department, serving a population of 810,000, pays a monthly rental of $1,834. The punched-card equipment costs for cities in the 200,000 to 900,000 population range are from $1,400 to $2,000 per month rental, but are not directly proportional to population. This narrow spread is not too surprising, however, if we note that there is a basic set of equipment which is needed for any punched-car~1 processing system; namely, the key punch, sorter, collator, reproducer, and accounting machine. This sets a lower limit for the cost of the system. Any further variations are caused by the number of individual pieces of equipment used and by the operating speeds or the specific operating features ordered for each unit. The rental cost is directly influenced by the speed and complexity of the unit.
In the case of the personnel required to operate the punched-card system, we found the same clustering as we did for equipment costs. The various police departments for cities in the 300,000 to 900,000 population range reported that the size of their data processing staffs ranged from 6 to 11 people. (Cleveland, Ohio, reported 6 and Portland, Oregon, reported 11.) This figure includes one supervisor. The average cost of the salaries reported for the punched-card data processing staffs ranged from $5,400 to $6,700 per year for all the police departments reporting in this category. The average nationwide figure was $6,100 per year. All of these figures include the supervisor's pay.
Nearly all those departments using punched-card equipment estimated that they spent three to nine man-months of cfTort in planning their system and preparing card layouts, report formats, and related system activities.
~y its nature punched-card processing is generally restl'l~te.d to bat~hed. op:rations which are essentially statistlcal and histol'lcal 111 nature. (Certain police departments do possess electronic statistical machines and collators which permit sophisticated searching but these are in the minority.) This has naturally influenced the types of police applications that have been developed for !he pun~hed-card systems. In spite of the restrictions mherent 111 the punched card, a wide range of applications have been developed. Table F-l lists a number of the aPl?lications that were report~d by the police agencies \~hlCh responded to the questIOnnaire. These applications. see;n to fall into four main c~tegories: crime-relater! apphcatlOns; traffic-related applications' police opera-tions; and police administration. '
Table F-1.-Police Punched-Card Applications
Crime·related applications: Criminal offenses nie (crime type, location, Useu to produce statistical reporls,
modus operandi factors, suspects, disposl· crime by location reports, etc. lion, etc.).
Aires.te~ persons file (name, physical de· Special reports and special searches. scrJpllon, modus operandI).
Juvenile activity file •••• _._ •••••• ___ •.••••• Statistical reports and special studies. Stolen property and stolen auto files •••••• _. "Hot" lists. fingerprint file •••••••• ___ ••••••• _ •••.•••• Special searches.
Traffic·related applications: Tr~ffic acclde.nt file (type of accident, loca· Statistical reports and special analyses.
tlon, conditIOns, etc.). Tra.ffic c~mp!,lnt file (name, lice~ses, loca· Prepare traffic coUrt docket, analYtical
lion, vlolallon number). studies. Parking citations (who, when, what type) •••• Citation accounting and fines collection.
Police operations: Pollee activitY file (type of run, lime oul and Operational and statistical reports.
In, arrests, etc.). Jail booklngs ••••• _ •••••.•••••••••••••• _._ Booking control. Motor vehicle registration file •••••••••••• _ •. Master file of license numbers vs. names
Police administration: and addresses. Personnel records. Timekeeping. Payroll authorization. Vehicle expense data.
In crime-related applications, all the police departments reporting have developed a crime or criminal offense file. This file contains data on each crime reported, what type it is, when and where it occurred, any pertinent descriptive data, pertinent modus operandi factors, disposition, etc. This file is then used to develop a variety of statistical reports, including the Uniform Crime Reports, reports of crime by type, and reports of crime by location and time of day to assist in planning distribution of patrols. A number of departments maintain a file on all persons who have been arrested, containing such data as theh physical characteristics and modus operandi to r~ .. !l'Tnit searching on these parameters. In most jurisd~ctions a separate file is maintained for juvenile activity, giving pertinent data on youthful offenders and their activitir-s. Files are maintained on stolen autos and stolen property and are used to prepare "hot" lists for patrolmen and detectives. Some departments maintain a fingerprint file in punched-card form to facilitate searching for prints.
In traffic-related applications, nearly all departments reported maintaining a traffic accident file, containing pertinent data such as location, time, causes, circumstances, etc., on each reported traffic accident. This file is used to generate statistical and special reports to permit better planning and coordination of police traffic activities. In several instances a traffic complaint and court citation file has been established to identify both the individuals involved and the circumstances under which they were issued traffic citations. This information is used for generating the traffic court docket and for following the cases through to their final disposition. A similar application has been developed for parking citations to permit control of parking citations issued and to allow followthrough on collection of fines.
In the area we have defined as police operations, the main application has been concerned with police activity, accumulating data on the nature of dispatching calls, time spent on each, arrests made and other pertinent activity data to enable the generation of reports and special studies to permit better direction, planning, and coordination of police activities. Other applications in this area are: jail bookings to identify who was booked, where, and what the disposition was; and a motor vehicle registration data file to permit rapid detennination of the owner's name and address through the auto license number.
In police administration, punched-card systems are being used for such purposes as maintaining personnel data on all uniformed aTld civilian. personnel in the department, keeping track of employees' time for payroll and vacation purposes, and for budget and expense control for police department vehicles.
Surprisingly, very little application has been made of punched-card processing in the courts. However, both the Court of Common Pleas of Allegheny County (Pittsburgh) Pa., and the Los Angeles Superior Court have made valuable use of punched-card processing for court operations. With limited investments in equipment and personnel, they have been able to provide effective support in such areas as providing case-by-case records of cases filed and at issue, providing master calendar attorney scheduling, centralized court statistics, etc. In the case of the Court of Common Pleas of Allegheny County, the equipment costs are $272 per month and only three personnel are required to operate the system. The Los Angeles Superior Court shares the punched-card equipment and personnrl with the county clerk so its operating costs are kept low.
ELECTRONIC DATA PROCESSING
The electronic data processing system presents the potential user with a much more bewildering number of alternatives and decisions than did the punched-card processing system when it was introduced. This stems not only from the great flexibility of the electronic compl~ter but also from the wide variety of central computing
159
equipment ahd peripheral equipment that are on the market today.
When they were initially introduced, electronic computer~ were so expensive that only a few of t.he largest agenCies could contemplate their use. The advent of the so-called third generation computers with their increased performance and reduced prices have made the electronic data processing system available to a much larger number of users. With the increased utilization of IOn-line systems and the relatively recent development of time-sharing systems, the prospective user has available some additional alternatives which can also offer the computing capacity that he needs at reduced costs.
Seve~al of th~ larger criminal justice agencies have data pro.cessmg reqUlrements of sufficient magnitude to justify their own electronic data processing installiations. However, another trend has been the development of centra~ized municip~l data processing centers which are deSigned to prOVide data processing support to all the municipal agencies who need it, including the police department and the municipal courts. This trend to centralization, while very useful in making electronic data processing accessible to those smaller agencies who would ~th;.r\vise be excluded b~cause of their size, is by no means hmlted to the smal1er CIty, since the city of Los Angeles has ele~ted to take this approach to satisfy its citywide processmg needs.
Among the police departments now llsing electronic data processing systems, a large variation was noted in the amount of effort spent in systems analysis prior to im.)lementing and installing their systems; the effort ran~ed from 6 to 75 man-months and, as would be expected, was a function of the size of the department. The equipment costs varied over a wide spectrum but did not seem related to population. Three of the police departments reporting were in the enviable position of having al1 their computing costs (including equipment and personnel) paid by their respective city governments. In three other cases, the police departments shared computers with other local governmental agencies and were, therefore, able to utilize data processing systems at much lower costs than if they had to operate their own computing systems. For those police departments operating in an off-line mode (as contrasted to an on-line system) the cost of the equipment was reasonably consistent, ranging from approximately $4,500 per month in Indianapolis, Ind., to $5,000 a month in Philadelphia, for example. For those departments which have their own on-line systems, the equipment costs weie considerably higher, ranging up to $25,000 a month rental or a purchase cost 'of $1,140,000, if a lease/purchase option is exercised, as in the case of St. Louis.
The size of the data processing staff varied in accordance with the size of the city, ranging from 5 people in Indianapolis to 21 people in New York City. The composition of a typical police department data processing staff of 10 people would be 1 supervisor, 3 programer/ analysts, and 6 computer and machine operators. The
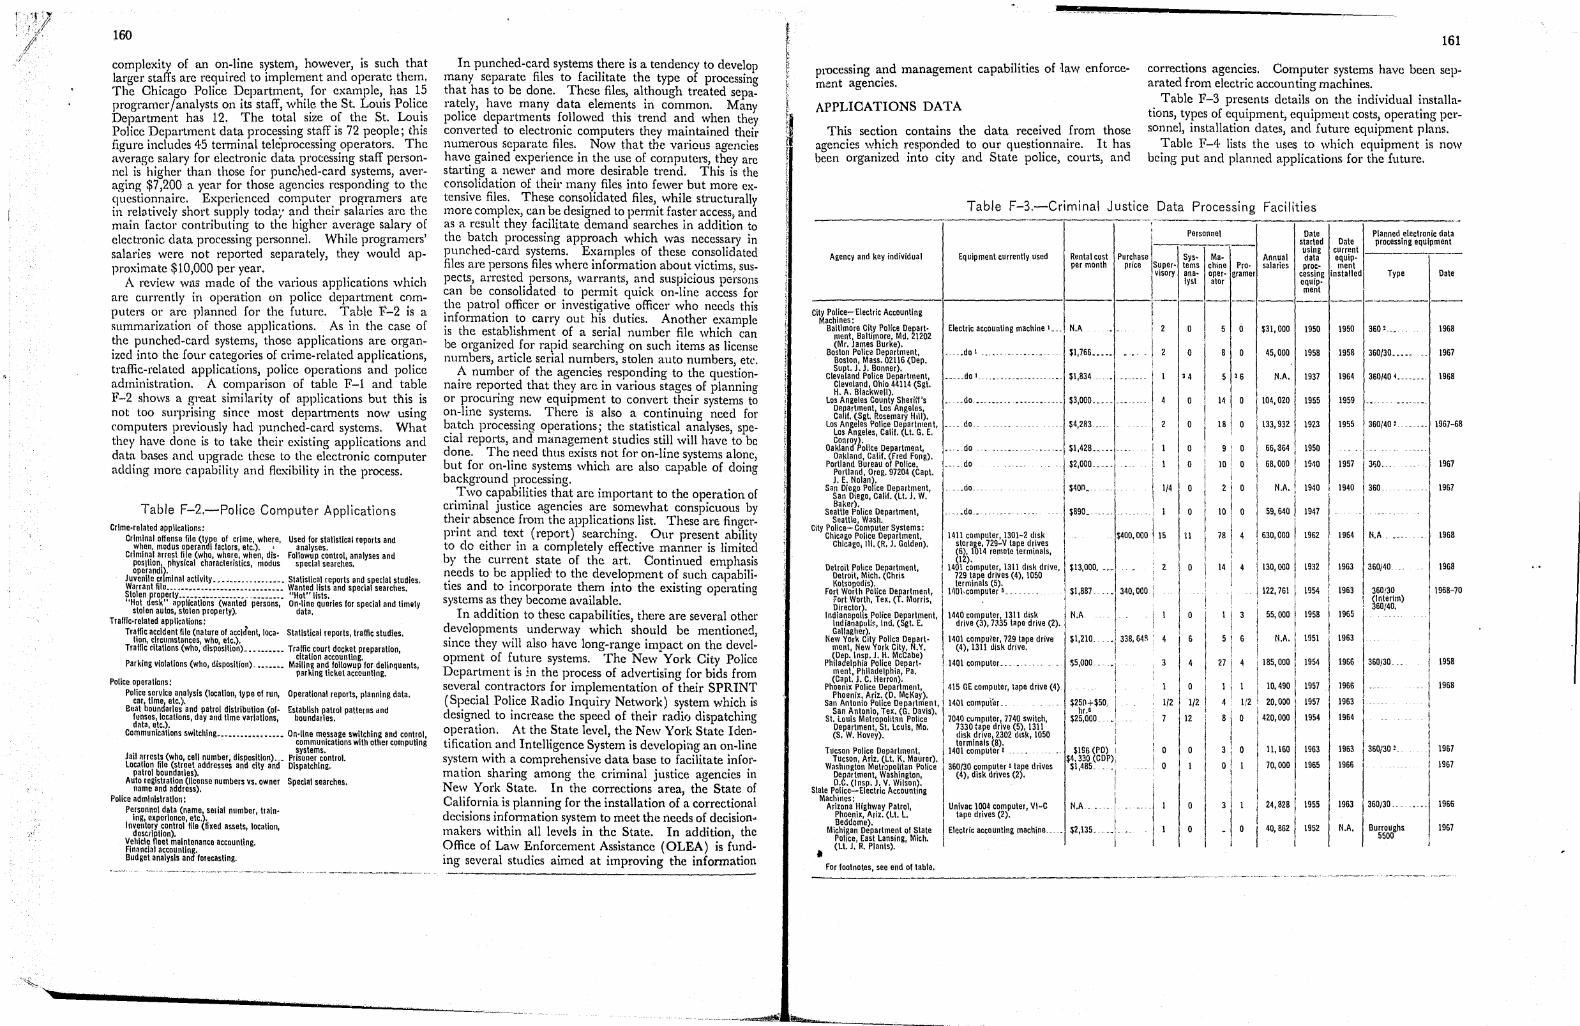
160
complexity of an on-line system, however, is such that larger staffs are required to implement and operate them. The Ohicago Police Department, for example, has 15 programer/analysts on its staff, while the St. Louis Police Department has 12. The total size of the St. Louis Police Department data processing staff is 72 people; this figure includes 45 terminal teleprocessing operators. The average salary for electronic data processing staff personnel is higher than those for punched-card systems, averaging $7,200 a year for those agencies responding to the questionnaire. Experienced computer programers are in relatively short supply toda~' and their salaries are the main factor contributing to the higher average salary of electronic data processing personne\. While programers' salaries were not reported separately, they would approximate $10,000 per year.
A review was made of the various applications which are currently in operation on police department computers or are planned for the future. Table F-2 is a summarization of those applications. As in the case of the punched-card systems, those applications are organized into the four categories of crime-related applications, traffic-related applications, police operations and police administration. A comparison of table F-1 and table F-2 shows a great similarity of applications but this is not too surprising since most departments now using computers previously had punched-card systems. What they have done is to take their existing applications and data bases and upgrade these to the electronic computer adding more capability and flexibility in the process.
Table F-2.-Police Computer Applications Crlme·related applications:
Criminal offense file (type of crime, where, Used for statistical reports and when, modus operandi factors, etc.).' analyses.
Criminal arrest file (who, where, when, dis· followup control, analyses and poslilon, physical characteristics, modus special searches. operandI).
juvenile criminal activity .................. Statistical reports and special studies. Warrant liIe .............................. Wanted lists and special searches. Stolen property ........................... "Hot" lists. "Hot desk" applications (wanted persons, On·lIne queries for special and timvly
stolen autos, stolen property). data. Tralflc·relaled applications:
Traffic accident file (nature of acclJent, loca· Statistical reports, traffic studies. tlon, circumstances, who, etc.).
Traffic citations (who, disposition) .......... Traffic court docket preparation, citation accounting.
Parking Violations (who, disposition) ........ Mal1lng and followup for delinquents, parking ticket accounting.
Police operations: Polico service analysis (iocatlon, type of run, Operational reports, planning data.
car, time, etc.). Beat boundaries and patrol distribution (of· Establish patrol patterns dnd
funses, locations, day and time variations, boundaries. data, etc.).
Communications switching ................. On·l1ne message switching and control, communications with other computing
. systems. Jail arrests (who, cell number, disposition) ... Prisoner control. location file (street addresses and city and OIspatchlng.
patrol boundatles). Auto registration (JJcense numbers vs. owner Special searches.
name and address). Police administration:
personnel data (name, selial number, ttain· lng, experience, etc.).
Inventory control file (fixed assets, location, description).
Vehicle fleet maintenance accounting. financial accoUnting. Budget analysis and forecasting.
In punched-card systems there is a tendency to develop many separate files to facilitate the type of processing that has to be done. These files, although treated separately, have many data elements in common, Many police departments followed this trend and when they converted to electronic computers they maintained their numerous separate files. Now that the various agencies have gained experience in the usc of computers, they are starting a newer and more desirable trend. This is the consolidation of their many files into fewer but more extensive files. These consolidated files, while structurally more complex, can be designed to permit faster access, and as a result they facilitate demand searches in addition to the batch processing approach which was necessary in punched-card systems. Examples of these consolidated files are persons files where information about victims, sus. pects, arrested persons, warrants, arid suspicious persons can be consolidated to permit quick on-line access for the patrol officer or investigative officer who needs this information to carry out his duties. Another example is the establishment of a serial number file which can be organized for rapid searching on such items as license numbers, article serial numbers, stolen auto numbers, etc.
A number of the agencies responding to the questionnaire reported that they are in various stages of planning 01' procuring new equipment to convert their systems to on-line systems. There is also a continuing need for b?-tch processing operations; the statistical analyses, speCIal reports, and management studies still will have to be done. The need thus exists not for on-line systems alone, but for on-line systems which are also capable of doing background processing.
.T,:vo ca'pa~ilities tha~ are important to the op!!ration of cnmmal Justice agencies are somewhat conspicuous by th7ir absence from the applications list. These are finger. prmt and text (report) searching. Our present ability to de either in a completely effective manner is limited by the current state of the art. Oontinued emphasis needs to be applied to the development of such capabilities and to incorporate them into the existing operating systems as they become available.
In addition to these capabilities, there are several other developments underway which should be mentioned, since they will also have long-range impact on the development of future systems. The New York Oity Police Department is 1n the process of advertising for bids from several contractors for implementation of their SPRINT (Special Police Radio Inquiry Network) system which is designed to increase the speed of their radio dispatching operation. At the State level, the New York State Identification and Intelligence System is developing an on-line system with a comprehensive data base to facilitate information sharing among the criminal justice agencies in New York State. In the corrections area, the State of California is planning for the installation of a correctional decisions infonnation system to meet the needs of decisionmakers within all levels in the State. In addition, the Office of Law Enforcement Assistance (OLEA) is funding several studies aimed at improving the information
161
processing and management capabilities of .Jaw enforcement agencies.
corrections agencies. Oomputer systems have been separated from electric accounting machines.
APPLIOATIONS DATA
This section contains the data received from those agencies which responded to our questionnaire. It has been organized into city and State police, courts, and
Table F-3 presents details on the individual installations, types of equipment, equipmellt costs, operating personnel, installation dates, and future equipment plans.
Table F-4 lists the uses to which equipment is now being put and planned applications for the future.
Table F-3.-Criminal Justice Data Processing Facilities ------
Personnel Date Planned electronic data started Date processing eqUipment Using current
Agency and key individual EqUipment currently used Rental cost Purchase sys· Ma· Annual data equip· per month price Super· tems chine Pro· salaries proc· ment
visory ana· oper· gramer cessing Installed Type Date Iyst ator equip·
ment ---.---------------
City Police-Electric Accounting Machines:
Baltimore City Police De~art. Electric accounting machine I ... N.'" $31,000 1950 1950 360 '_ .. 196B ment, Baltimore, Md. 1202 (Mr. James Burke).
Boston Polic'a Department, ... do 1 $1,766 __ ... 0 45,000 195B 195B 360/30 ..... 1967 Boston, Mass. 02116 (Dep. Supt. J. J. Bonner).
Cleveland Police Department, ______ do I - -.. - ~. ~ - .. -~ ~ - - -- $1,B34 34 '6 ItA. 1937 1964 360140 I ........ 196B
Cleveland, Ohio 44114 (Sgi. H. A. Blackwell).
los Angeles County SheriWs .. do ",,_,0- ........ $3,000 ..... 14 104,020 1955 1959 -. oeflartment, los Angeles.
IB I Ca if. (Sgt. Rosemary HIli). los Angeles Police Deftartnlent, ___ .do. _ $4,283... __ 133,932 1923 1955 360140~_ .. __ ... 1967-6B
los Angeles, Calif. Lt. G. E. , CO"roy~.
66,364 Oakland ollce Department, • _. do _0- $1,428.. 0 1950 Oakland, Calif. (fred fong).
. do $2,000 .. I 6B.000 1940 1957 3,0. __ 1967 Portland Bureau of Police. 0 10 Portland, Oreg. 97204 (Capt. J. E. NOlan/.
San Diego Po ice Department, . . _.do __ $400 •. 1/4 N.A. 1940 I 1940 360_ 1967 San Diego, Calif. (It. J. W.
59,640 I Baker). Seattle Police Department, . _.do. $B90. 10 1947
Seattle, Wash. I City Police-Computer Systems: 1411 computer, 1301-2 disk _ $400,000 115 !l 78 630,000 1962 1964 N.A 196B Chicago Police Department,
Chicago, 111. (R. J. Golden). storage, 729-'1 tape drives I (6), 1014 remote terminals, (12).
130,000 1932 1963 360/40 . __ 1968 Detroit Police Department, 1401 computer, 1311 disk drive, $13,000 .... 14 Detroit, Mich. (Chris ! 729 tape drives (4), 1050 Kotsopodis). terminals (5).
$1,BB7 _ 340,000 : 122,761 t 1954 1963 360/30 ! 196B-70 fort Worth Police Department, , VIOl. computer ,_ _ . _ . fort Worth, Tex. (T. Morris, ~Interim) Director).
1965 60140.
Indianapolis Police Department, 1440 computer, 1311 disk N.A _ i 3 55,000 195B Indianapolis, Ind. (Sgt. E. drive (3), 7335 tape drive (2). t Gallagher).
$1,210_ 33B,64R . N.A. 1951 1963 New York City Polic2 Depart· 1401 computer, 729 tape drive me nt, New York City, N.Y. ! (4),1311 disk drive. (D~.lnsp. J. H. McCabe)
$5,000 ___ 27 185,000 1954 1966 360/30 195B Phlla elphia Police Depart· 11401 computer. _. ment, Philadelphia, Pa. (Capt. J. C. Herron).
PhoeniX Police Department, 415 GE computer, tape drive (4) 10,490 1957 1966 196B Phoenix, Ariz. (0. McKay).
1401 compul'er .. $250+$50, 1/2 1/2 1/2 20,000 1957 1963 I San Antonio Police Department, San Antonio, Tex. (G. Davis). hr.-
Sl. Louis Metropolitan Police 7040 cumputer, 7740 switch, $25,0000- 7 12 420,000 1954 1964
I Department, St. lculs, Mo. 7330 lape drive (5),1311 (S. W. Hovey). disk drive, 2302 disk, 1050
TUcson Police Department, terminals (B).
$IS6 (PO) 1 0 11,160 1963 1963 1360130 '. 1967 1401 computer I _ TUcson, Ariz. (Lt. K. Maurer). $4,330 (COP),
70,000 1965 1966 1967 Washington Metropolitan Police 360130 computer I tape drives $1,485 __ .; oesnrtment, Washington, (4), disk drives (2).
I D .• (Insp. J. V. Wilson). i Stale Police-Electric AccountlOg I Machines: I 24, 828 l 1955 1963 360130 __ 1966 Arizona Highway Patrol, Univac 1004 computer, VI-C N.A I Phoenix, Ariz. (It. l. tape drives (2). I 40, B62 ! Beddome).
Michigan Department of State Electric accounting machine.. $2,135. __ . .1. 0- 0 1952 N.A. I Burroughs 1967 POlice, East lanSing, Mich. I 5500
" (Lt. J. R. Plants).
for footnotes, see end of labia. -~--,..-.-.---~.~-~---- -~.---~-- ......,- -. ·. _____ "_~r.· __

"rr": .~ ,1'-
162
Table F-3.-Continued
AgencY and key individual Equipment currently used Rental cost Purchase per month price
State POlice-Electric Accounting Machines-Continued
Electric accounting machlne .• _ $1,678 ••••• New Jersey State pollcV West ... ... Trenton, N.J. (Capt. • E. Gatassl).
• do 1. $1,650 ••••• Pennsylvania State Police, ... -- _. - ~ .. - .- . '" -----Harrlsburr,' Pa. (Sgt. J. R. O'Oonnel ).
State Potice-Computer Systems: Univac 418 computer. $3,000 •.••• $330,000 New York State Police, Albany,
N.Y. (fred Frank). FASTRAND drum storage. VI-C tape unit 1004, 1004 Univac reader'prlnter, 1232 optical scanner terminals.
$25,000 .... 30,000 State of California Highway 360~30 CGm9uter, 7740 switch Patr~l, Sacramento, Calif. ( ), 131\ disk drives (6), (Insp. D. Luethje). tape drives (5).
Courts: Electric accounting machine .. $272 ... Court of Commiin Pleas, Pills· .. .. ..
burgh, Pa. 1440 com(:uter, 1311 disk District of Columbia Court of - ~ - ~. - - .. ~. '" - -
General Sessions, Washing· drives 2). ton, D.C. (D. Meadows).
1460 com~uter, 729 tape $12,122 .... fulton County Data Processing ~ ~ ..... ~ ~ Department, Atlanta, Ga. drives 4). (J. W. Stephens).
Electric accounting machine .••.• No charge .. The Los Angeles Superior ~- .. ". ~ ..... Court, Los Angeles, Calif. ~Maureen McPeak). • Correct ons:
. , ... do •••• _ .................. $1,940 ..... 18,142 De~artment of Youth, acramento, Calif. (W. J.
Dondero).
New York State Department of .... dOl, ....... _._ ~ ~ _ ... $1,258 ..... • ". __ ",w ...
Correction, Gov. Allred E. Smith Bldg., Albany, N.Y. (A. Barraco).
I Standard punch.card equipment, Includln3,such Items as card punches. reproducers, sorters, collators, and accounting machines. AI, computer systems Include such equipment.
'To use city computer. 3 Planned. . I To be a city ,;amputer with the primary function to ',erve the Northeastern Ohio Police
Information Networ~.
-Personnel Dete Planned electronic daln
stlfted Dlte processing equipment uslna current Sys. Ma· Annual data equip· Super' tems chine Pro· salaries proc· me"t visorY ana· oper· gramer esslna installed Type Date Iyst ator equip· ment
--------------2 0 7 0 $46,783 1938 1952 (7) •.••••••••.••
1 0 12 0 47,000 1962 1964 _ w ..... _ ...... __ ~ ~ R".
2 0 4 3 43,000 1966 1966 ... _ .. - ~ - - _ .. ~ - ~ ~.
0 0 0 0 I 303,840 1930 1965 (8) ...... , .. 1967-68
I 0 2 0 15,264 1954 1963 ~ - - - ~ -
I I 0 4 87,000 1958 1964 . - ~ .. ~ ~ _. -.. - ~ -~
3 I 17 4 190,500 1958 1964 360/30.. ....... 1967
2 0 14 0 N.A. 1949 1949 3d generation 1968 computer.
2 2 5 5 83,000 1951 1961 1401 computer, 1967 ta~e dnves (5 ,360/40 -un·
3 0 8 0 56,645 1929 1956 certain.
~ .. ~~~-~-~~~- ........
I City computer. 'Uses computer In city's water department. 7 Planning for new facility but undecided on equipment and dates. i Planning to Install 2 large computers to repiace the 3 now In operation. N.A. Not applicable.
Table F-4.-Current and Planned Applications of Data Processing by Criminal Justice Agencies
City Policc BALTIMORE CITY POLICE DEPARTMENT
Current applications: 1. Offense statistics for monthly report and "Uniform
Crime Reports." 2. Arrest statistics. 3. Radio complaints statistics by location. 4-. Filc of general appearance of suspects. 5. Traffic summons. 6. Statistics on locations of accidents. 7. Personnel records.
Planned applications: 1. Immediate inquiry files on wanted persons, war·
rants, and stolen automobiles.
BOSTON POLICE DEPARTMENT Current applications:
1. Monthly report of part I olTenses for "Uniform Crime Reports."
2. Arrested persons. 3. Daily recapitulation of offens(:s and incidents. 4. Location of theft and recovery of stolen cars. 5. Moving traffic violations and recommended dis·
positions.
6. Amounts earned by officers on offduty paying de-tails.
7. Parking ci ta tions issued by location. 8. Index of incidents. 9. Analysis of vehicular accidents.
10. Miscellaneous court statistics for department an· nual report.
11. Miscellaneous business of the department for de· partment annual report.
12. Ambulance services performed by the department. 13. Age and sex of persons injured or killed in acci·
dents. 14-. Notification of fines to out·of·State parking vio·
lation defaulter~. 15. Officers' training scores on revolver range. 16. Personnel evaluation scores. 17. Citizen alarm box calls and reasons.
Planned applications: 1. Warrant infonnation on wanted persons. 2. Selected stolen property. 3. Firearms identification. 4-. Stolen cars and plates and auto parts. 5. Linkage with NCIC. 6. Personnel distribution, car usage, gas and oil
studies, payroll, licenses, etc.
" , u ~J
Table F-4.-Continued
CLEVELAND POLICE DEPARTMENT Current applications:
1. Crime reports. 2. Daily traffic court docket report, continued docket,
and monthly disposition report. 3. Physical characteristics and modus operandi of
arrested persons. 4. Payroll authorization lists. 5. Control of the sick time, overtime, holidays, and
furlough time for cach member of the department. 6. Parking citations received and amount paid.
LOS ANGELES COUNTY SHERIFF'S DEPARTMENT Current applications:
1. Arrests and bookings. 2. Cases handled. 3. Time and location of moving traffic violations.
Planned applications: 1. Jail records. 2. Criminal statistics.
LOS ANGELES POLICE DEPARTMENT Currcnt applications:
1. Arrests. 2. ,Crimes, 3. Traffic citations and accidents. 4. Personnel.
Planned applications: 1. Immediate inquiry wanted persons. 2. Immediate inquiry warrants.
OAKLAND POLICE DEPARTMENT Curren t applications:
1. Juvenile reporting. 2. Ficld contact reporting. 3. Complaint dispatch and out.of-service 4. Offense and arrcst reporting. 5. Accident reporting. ' 6. Traffic <'itation reporting. 7. Assignment reporting. 8. N alline test reporting. 9. Miscel\an\!ous reporting.
10. Mal'lagement control report~. 11. Officer's activity report. 12. Consumed time report. 13. Personnel reports. i4. Talent inventory. 15. Leave·of·absence reporting. 16. Man·days·worked repo:ting. 17. Personnel duty rosters.
CITY OF PORTLAND BUREAU OF POLICE Current applications:
1. Offenses reported. 2. Traffic complaints and summons issued. 3. Daily timecards for personnel. 4. Cars and persons involved in reported 5. Parking tags. 6. Auto registration data by license number.
SEATTLE POLICE DEPARTMENT Current applications:
1. Crime records. 2. Arrests or citations. 3. Court dispositions. 4. Traffic accidents. 5. Personnel records of employees. 6. Stolen property. 7. Juvenile activity. 8" Moving traffic violations.
Planned application: 1. Allocation of manpower and equipment.
CHICAGO POLICE DEPARTMENT Current applications:
1. Crime statistics.
reporting.
accidents.
2. Opera'cions rrports. 3. Arrest.s. 4. Traffic accident and citation reports. 5. Hot desk reports on stolen autos and wanted
persons. 6. Aut.omotive cost accounting. 7. Payron and personnel statistics.
Planned applications: 1. General index file. 2. Arrest processing. 3. Field reporting. 4. Personnel files.
DETROIT POLICE DEPARTMENT Curren't applications:
L Crime analysis·-by precinct, time, day, object of attack, scou t car area.
2. ~raffi~ tickets-by ticket number, violation, pre. cmct Issued .
3. A:rrest analysis-by prosecution, age, sex, color, pre. cmct, etc.
4. Accident analysis-by cause, violation day night ct~ , , ,
5. Stolen car inquiry-stolen car$ by license number vehicle identification on random access. '
6. Modus operandi-~radt'marks of crime to pick sus. pect.
7. Women's division report-contacts by crime pre. cinct, disposition. '
8. Xouth. ~ureau report-contacts by crime, precinct, dISpOSition.
9. Hot car file-listing by license number of stolen cars.
10. Personnel--name, precinct assigned to, rank. Planned applications:
1. Traffic \\'arran ts. 2. Gun registrations. 3. Serialized property. 4-. Personnel, history. 5. Scou t car assignments. 6. Answers to radio caUs. 7. Police inventory.
FORT WORTH POLICE DEPARTMENT Current applicatiom:
1. Radio calls. 2. Traffic ar.cidents. 3. O!fense reports, clearance and recovery records. 4 . .Tailed arrr,stees. 5. Traffic citations. 6. Police personnel list. 7. Pol!ce mailing list is kept on IBM cards. 8. Poltce garage report. 9. Patrol division personnel assignment.
10. Possible add resses in each cellsus tract. Planned applications:
1. Identification filcs. 2. Auto registration files. 3. Suspicious person reports. ,t Warrant files. 5. Traffic offender file.
INDIANAPOLIS POLICE DEPARTMENT Current applications:
1. Records of calls for service and response time, location, and action.
2. Delinquent notices for unpaid traffic violations. Planned applications:
1. Immediate inquiry for stolen cars and wanted persons.
2. Inventory control. 3. Budget analysis and forecasting. 4. Vehicle fleet maintenance accounting. 5. Modus operandi file.
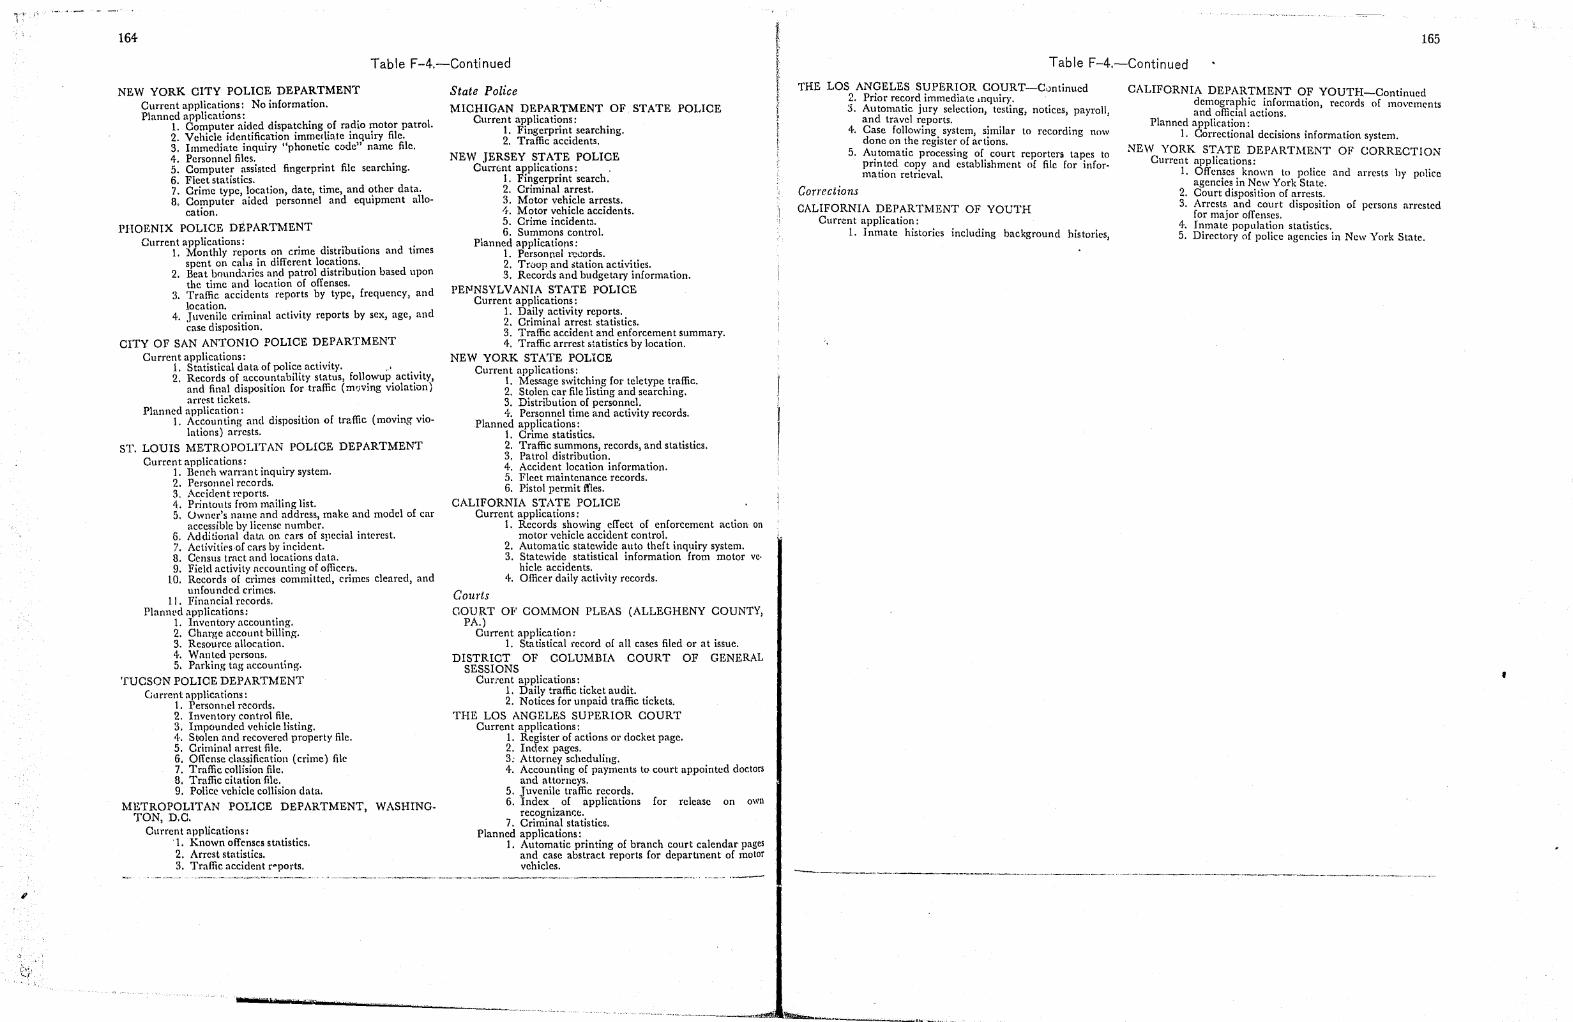
164
Table F-4.-Continued
NEW YORK CITY POLICE DEPARTMENT Current applications: No information. Planned applications:
1. Computer aided dispatching of radio motor patrol. 2. Vehicle identification immc!\iate inquiry file. 3. Immediate inquiry "phonetic code" name file. 4. Personnel files. 5. Computer assistcd fingerprint file searching. 6. Fleet statistics. 7. Crime type, location, date, time, and other data. S. Computer aided personnel and equipment allo
cation.
PHOENIX POLICE DEPARTMENT Current applications: .. ., "
1. Monthly reports on crIme dlstnoutlons and times spent on caI.s in different locations.
2. Beat bOllnd:tries and patrol distribution based upon the time and location of offenses.
3. Traffic accidents reports by type, frequency, and location.
4. Juvenile criminal activity reports by sex, age, and ~ase disposition.
CITY OF SAN ANTONIO POLICE DEPARTMENT Curren t applications:
L Statistical data of police activity. .' 2. Records of accountability status, followup activity,
and final disposition for traffic (m'Jving violation) arrest tickets.
Planned application: 1. Accounting and disposition of traffic (moving vio
lations) arrests.
ST. LOUIS METROPOLITAN POLICE DEPARTMENT Curren t applica tions:
1. Bench warr:ln t inquiry system. 2. Personnel records. 3, Aceident reports. 4,. Printouts from mailing list. 5. Uwner's name and address, make and model of car
accessible by license number. 6. Additional data on cars of special interest. 7. Activitirs·of cars by incident. S. Census tract and locations data. 9. Ficici activity accounting of officen.
10. Records of crimes commi tted, crimes cleared, and unfounded crimes.
11. Financial records. Planned applications:
1. Inventory accounting. 2. Charge account billing. 3. Resource allocation. 4,. Wanted persons. 5. Parking tag accounting.
TUCSON POLICE DEPARTMENT Cllrrent applications:
1. Personhel records. 2. Inventory control file. 3. Impounded vehicle listing. 4,. Stolen and rccovered property file. 5. Criminal arresUile. 6. Offense classification (crime) fill' 7. Traffic collision file. B. Traffic citation file. 9. Police vehicle collision data.
METROPOLITAN POLICE DEPARTMENT, WASHINGTON, D.C.
Current applications: '1. Known ojfenses statistics. 2. Arrest statistics. 3. Traffic accident r~ports.
State Police MICHIGAN DEPARTMENT OF STATE POLICE
Curren t app lica tions : 1. Fingerprint searching. 2. Traffic accidents.
NEW JERSEY STATE POLICE Curr(;nt applications: ,
1. Fingerprint search. 2. Criminal arrest. 3. Motor vehicle arrests. It. Motor vehicle accidents. 5. Crime incidenta. 6. Summons control.
Planned applications: 1. Personnel l'c\!ords. 2. Troop and .tation activities. 3. Records and budgetary information.
PE]'JNSYLVANIA STATE POLICE Current applications:
1. Daily activity reports. 2. Criminal arrest. statistics. 3. Traffic accident and enforcement summary. 4. Traffic arrrest statistics by location.
NEW YORK STATE POLICE Current applications:
1. Message switching fOI' teletype traffic. 2. Stolen car file listing and searching. 3. Distribution of personnel. 4. Personnel time and activity records.
Planned applications: 1. Crime statistics. 2. Traffic summons, records, and statistics. 3. Patrol distribution. 4-. Accident location information. S. Fleet maintenance records. 6. Pistol permit {nes.
CALIFORNIA STATE POLICE Current applications:
Courts
1. Records showing effect of enforcement action on motor vehicle accident control.
2. Automatic statewide auto theft inquiry system. 3. Statewide statistical information from motor ve·
hicle accidents. 4. Officer daily activity records.
COURT OF COMMON PLEAS (ALLEGHENY COUNTY, PA.)
Current application: 1. Sta tis tical record of all cases filed or at issue.
DISTRICT OF COLUMBIA COURT OF GENERAL SESSIONS
Current applications: 1. Daily traffic ticket audit. 2. Notices for unpaid traffic tickets.
THE LOS ANGELES SUPERIOR COURT Current applications:
1. Register of actions or docket page. 2. Index pages. 3; Attorney scheduling. 4. Accounting of payments to court appointed doctors
and attorneys. 5. Juvenile traffic records. 6. Index of applications for release on own
recognizanc:t. 7. Criminal statistics.
Planned applications: 1. Automatic printing of branch court calendar pages
and case abstract reports for department of motor vehicles. --- ~-'--------
165
Table F-4.-Continued
THE LOS ANGELES SUPERIOR COURT-Cuntinued 2. Prior record immediate lnquir),. 3. Automatic jury selection, testing, notices, payroll,
and travel reports. 4. Case following system, similar to recording now
done on the register of actions. 5. Automatic processing of court reporters tapes to
printed copy and establishment of file for information retrieval.
Corrections CALIFORNIA DEPARTMENT OF YOUTH
Current application: 1. Inmate histories including background histories,
CALIFORNIA DEPARTMENT OF YOUTH-Continued demographic information, records of movements and official actions.
Planned application: 1. Correctional decisions information system.
NEW YORK STATE DEPARnmNT OF CORRECTION Current applications:
1. Offenses known to police and arrests hy police agencies in New York State.
2. Court disposition of arrests. 3. Arrests and court disposition of persons arrested
for major offenses. 4. Inmate popUlation statistics. 5. Directory of police agencies in New York State.
t

..
Appendix G •
INFORMATION SYSTEM FLOW DIAGRAMS
by Ronald A. Finkler
Contents
Introduction. . . . . . . . . . . . . . . . . . . . . . . . . . . . . . . . . . . . . . . . . . . . . . . . . . . . . . . . . . . . . . . . . . . . 167 System Convention.... . . . . . . . . . . . . . . . . . . . . . . . . . . . . . . . . . . . . . . . . . . . . . . . . . . . . . . . . . . . 168 Police Illow Diag·ram .. , ........... " ...... " .............. " .... " . . . .. . . . . . . . . . . 168 Court Flow Diagl'am ............ , .............. , ...... " .......... , ....... " . . . . . 172 Corrections Flow \Oiagrams. . . . . . . . . . . . . . . . . . . . . . . . . . . . . . . . . • . . . . . • . . . . . . . . . . . . . . . . 172
INTRODUCTION
In designing or revising an information handling system, the system planner mus!; be able to identify those functions and processes which represent either the greatest difficulties, bottlenecks, or inefficiencies, or provide the greatest potential for improvement from either a cost or efficiency point of view. This requires an understanding and description of the way in which information is generated, transmitted, and processed in the system. An accurate description of the system is necessary:
To obtain data on the information flow rates, volume:'I, processing times, elapsed time intervals, sequen,:es of opei'ations and operating costs.
To provide the foundation and benchmark against which to measure the performance of any proposed , new system.
To serve as an experimental model for testing and evaluating changes to the system.
If the operation being analyzed is a complex one, the system planner IS faced with the problem of collecting the information in a systematic way so that he is not inundated by a huge assortment of facts and figures. He needs to organize his description of the current operation so that it can be effectively used for system design purposes. One tool that has been useful in the analysis of an information handling system is the system flow diagram. The flow diagram by itself is not sufficient, however. Generally more operational data is needed than can be conveniently shown on a chart or a diagram. Accordingly, a unique approach was developed and programed to assist in analysis effort of the police, the courts, and the correctional systems. This method is described in detail in a separate report. 1
Briefly, this approach is based on identifying the major functions within the information handling system and the
informatIOn paths by which information moves from function to function. By "function" we mean those related processes (be they performed by a person, within an office, or by a machine) by which information is originated, processed, filed, presented to decisionmakers, or otherwise utilized. This identifying information is encoded in digital form and serves as the description of the basic structure of the system. Associated with this can be the other parameters of information content, rate, processing time, and delay time. However, in this analysis we were only able to complete a fairly detailed description of the system structure (the flow diagram). This is presented at two levels, by aggregated functions and information paths in this section, and by details of each function in the separate report.2
. The encoded information was used by a computer to draw the information flow charts in the following sections.
These flow charts can serve as a model of the first step necessary in analyzing the information flow in any department, organization, or jurisdiction. To utilize this information, the flow charts must be tailored to represent th(' specific system being analyzed. With this framework, important questions, such as whether each functioning entity is receiving the information it requires and whether it is rec,!iving unnecessary or redundant information, can be 'addressed and proper adjustments made 10 streamline and optimize the information flow. Then specific operational data and statistic~ can be gathered. The sum total of these are the system requirements and design which may then be presented to appropriate levels of supervision and management for review and approval. They then serve as a basis for detailed system planning, approval, and implementation.
It must be realized that these flow charts are only a tool for the systematic description of complex operating systems and are only as valuable 2, the competence and un-
1 hCriminal Justice Information System Flow Diagrams" now in preparation. :I Ibid. The report will b. available from th. Fedc:·.1 Clenringhoul. for Sclenti6c nnd Technical Information of the National Bureau of Stanc.Jards.
167

,; ;
168
derstanding of the system designer makes them. Insofar as the included flow charts represent reality, they can serve to elucidate the complex information flow in the criminal justice system and serve as an example of one approach to the design of such information systems.
SYSTEM CONVENTION
The following system conyentions are used in depicting the information flow in ;the criminal justice system. The information system was C:'ivided into four subsystems: police, courts, corrections, '~other" (persons or systems outside the criminal justice system). The functions and information paths are encoded as follows:
Po lice ••••••• _' __ •• __ •••••••• _ Courts. _ .................... . Corrections '" ............... _ Others ............ ____ ..... _
Information Function ~ 5---6---7---9---
10---1---2---3---
I On the flow charts the leading zeros are suppressed on the Identifyl~g codes for informallon paths.
The last three digits of the codes are arbitrarily assigned. Conventions for functign blocks and information flows
are shown in figures G-l and G-2.
POLICE FLOW DIAGRAM
The constraints of time and manpower precluded the possibility of undertaking and completing detailed analysis of the information flow within several major U.S. police departments in order to arrive at a model fnr the information flow within a typical or generic police department. Instead, the police information flow diagrams were developed on the basis of a prior detailed analysis 3 of a major city police department. The information flow data collected during' that extensive analysis were generalized to form the basis for the information flow diagram presented in this section. While it is recognized that there are differences in procedure from one police department to another, it is felt that this generalized information How diagram represents the major functions in the police system with sufficient accuracy to
fIIlUIE G·l, COIIVUTlOU FOR FUIICTlOII IlOCIIS
INPUTS _...-...----+1
·POSSIBLE LOCATIONS OF INPUTS
t--.,.~ ... ALL OUTPUTS
ONE LINE I-OR EACH OUTPUT INFORMATION PATH
:l ULApD System" AnalYMis Summary''. SDC-LAPD Joint Study Team, SYlltem8 D"eIopmelll Corp., Rellorl No. TM (L)-2-191, Dec. 31, 1965.
FIGURE G·2. CONVENTIONS FOR INFORUnON FLOWS
w Cl o U
I I rSPLITS
(CODE) (NAME)*
'-ARROWHEADS AT EACH CHANGE IN
DIRECTION
CROSSOVER NO CONNECTION)
*IDFNTlFYING LEGEND SHOWN ABOVE OR TO LEFT OF PATH. LEGEND SHOWN ONLY ONCE FOR EACH CONTINUOUS PATH.
provide at least a starting point for other police information handling systems.
The police flow diagram is presented in figure G-3. The main activities of the police denartment have been categorized and included in the 22 fu'nctions shown in the flow diagram. Each of these functions COI'.sists of many nodes which are not shown on this diagram. The police activities have.been aggregated into those functions concerned with patrol and traffic, investigation, command and communication, supporting and management activities, and those activities through which the police system interfaces with other systems.
Many important police activities are embodied in. the function that has been labeled field officer (patrol and traffic) (5005). This function in the form of field observations, field interviews, preliminary investigations, arrests, and ir<:ident reporting is an extremely important source of information for the entire police system. In turn, it is one of the main instruments of the department in deterring crime and apprehending criminals. If he is to carry out this latter mission effectively, then the field officer in turn needs inforn1ation from a number of other functions as is evidenced by the information paths on the flow diagram.
Command and control is an extremely important aspect of the ,field activity, and within the constraints of t~e current system, is maintained through the reporting hlerarchy of the patrol supervisor' (5006), patrol commander (5007), bureau chiefs and the chief of police ,(.'j004). The communiciltions center function (5012) l~, O! course, vital to the entire field operation. This is parttcularly true for monitoring patrol activities allocating ~esources for rout~ne or emergency needs,' and deploymg officers for speCial situations.
Another impurtant function of the police department is the investigative function (5001). Here the flow of
:1
iJ ~1
r s:~ ~
II
III 0
--: 5001 , 5002 • SODS : .5006 , 500a
, , I
169
flClIE 1:·3. 'OLICE flOW DIACUII'
F: H 1 r--~
i 00'10 S/'ECIIl. Ilf.flOlI1ENT lIoFCIWlTlC!l
I I ~.
• 3;; Fm n INt •• YI •• no'
.g '~
~ e, ~
'"
~ ~ ~ ~
~ 5001 r -, =
10 INC lDEI _Hill',l I !&nR"'1T TnN .
Q( filllF<T ."" rn "" "N' .
TR""<... lIV"NfI" rnMPT oINt ""OFRRo)
,
II UN
COlI .nA PI'I I OF O~.I.T __ F
~ tJ
o ... IT .... """ crT! ....
I I'IF ,tAli FA 11f.;nU:TI"'S
U
INYESTIGATI~E DETECT I VE SUPERV I sm FIELD OFflCfR IfATfl(l. AI() TPMFICI PATROL SUf'ERY I SOR CITIZEN
5009 MAESTEE 5013 BOOKING UNIT SOIq JAILER 6810 PROSECUTOR
ION
oot9 SPECIAL ~VELor""NT lIoFOf\HIlTl"" r-H 5002
-~ .
N - v
.... ~
15013
L "~
006lJ T "" r.L-
a:
~ i
! !i ! ~
1 ! ? ~
I G
l ~ r 1 sm I f I
L Ll I
j',J Eal:! l ----"-------------------------------------------------------
~
.. -~i,~~~
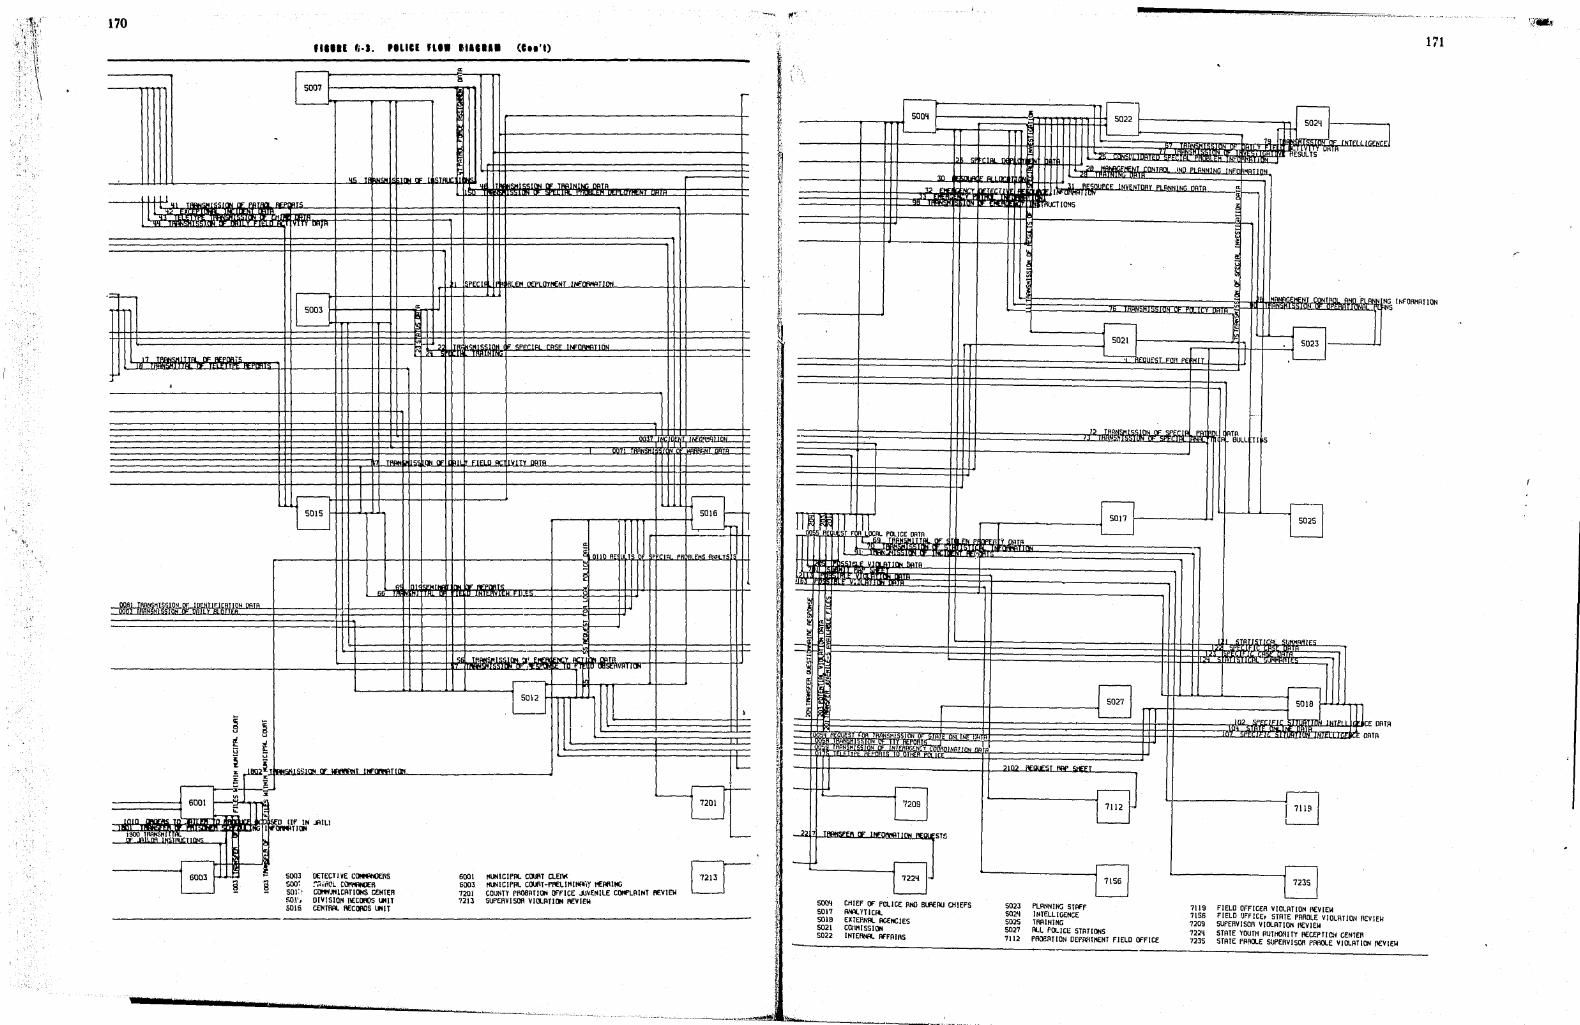
170
"==f--
1? T_""!TTIll OF PEl'(]R,S
MA' 'I"<' ; IlATR
6001
Inlo CWF""
fTo
-I 6003
fI.III f.·J. .. LICE fLiI till ... (ell't)
, "" TRAININt: ""TO
""IH
ISPECIF ~R' F" """'OYH£NT INFDRHATIOH
I 5003 1f+----t--.,H--r;,.-r+<J ~
SOD3 SOD: 501:~ ~r .. 5016
. ,
T_ il«bON OF kln fIELD .... ·IIIIITY nOTO
'CIRL P"\sLEMS R",,-Y5
"' Inl 1"'"1'" InN k1F" A£?MTS
.:
,. TP.AHSMISSIc.. "" ....... iF,.-v
L-__ ..u..-'-~U-..!-__ -1J 5012 Im~~
l
DETECT! IE COtOl4Fll«RS ~iii\1L CllIIllAlCEfl CO!IIfJltICATlONS CE"TER DIVISIO~ IIEC(]fl()S lJ4lT mll1FlL flECOflOS lJ4lT
6001 6003 7201 7213
I41JNIClpFIL COUIIT CLE!1II tMlICIPFIL COUIIT-I'!lELI"INF*tY ~IVIII«) COUNn pR08RT!~ OFfiCE .mE~ILE COIOI'LRINT flEVIEII SUPERVISOR VI!J.RTlCJI flEVIEW
.-..... -----.-------~-.. -~.-... -
!fI".
I
r I , , f~
fj ~ j,
t' j i' ,I
t, ~
t fi " f! t r ~:I
~) ~ !. {,
r L £
} , Ii I' -'." I
1: ,-e t i I; ii ? r ;~' B II 1-,. i Ji
~ f t r t ~ ~
It!
1 II! ~i -~
~ p , y .. t I· I
\
i ~
t I·
~ n
L " ~ -, l E
t "
I t -
t i ('
~ ~ t f
171
~
r---J 500~ l ~ 1 5022 5024 -~ ~ -~
79 tit INTFI Ir.FNrJ
SFFCIAL III ESUlTS UII'H
"R ""NAI""""NT CONTAOI INO PLANNINC, INF HRTION '0 mA . "',nri
" ""n".rF INV~NIQBr ~LBMMI~G 0818 J~ EH£j OCT bFr."CT I
"""TlONS
~
r--1 5021
1 . mR Pf" ~Hrr
12 TARNSHISSION OF SPEr" PA'
5011 ~
'h~- Lm~¥ Oilrt> A
I F"N •
,;;
~£ VlII.ATIc.. llATA !.iii --
"-
,
>
B I _hNcrnn;:
21 Q2 ",""""" RAP ..... FT
'1209
T-"-FA (F INFONoAII"" ""Ill, ST5
500'1 SOl7 SOIB 5021 5022
B· tHIEF Of POLICE RNO But1f1lU CHIEFS ANFIL YTl CI4. EXTEflNFIL AGENCIES COIIHISSICJI INTER!«. IlfFRIRS
S023 502~ S02S 5027 7112
PLRHNIN',; STIlfF INTELLIGENCE TRAINING
B 7156
ALL f'OLICr: STRTlCJlS PAOBRTION DEPMT~NT FIELD OfFICE
7119 71S6 7209 722~ 723S
~
! i ~
CONTAOL ANn 'PI A' N G INFOAHRTION S
~ ~
! I
ATA BUlL TI S
5025
STRTISliCll!. SUNNRAIF5
Q 102 SPECIFIC br:J INTFlllllcE DR
c DATA
r::l ~
7235
FIELD OfFICER VIOLRTlON f1EVIEW FIELD OFFICE, STATE PAAOLE VIOLRTlON f1EVIEH SUPERVISOR VIOLATION f1EVIEW STRTE YOUTH AUTHORITY f1ECEpTlC.4 CENTEA
N
TR
STATE PAA!J.E SlJi'ERVISOR pAflOLE VIOLRTlOR f1EVIEW

172
infonnation becomes even more important. This function must rely heavily on informati~n provided to it fro~l the division and central records UTIlt (5015, 5016), but It in turn is also an important contributor of infonnation as a natural product of its investigative activities. The investig[\tive function al~o ha,s, its .hierarchic~l command structure through the mveStlgatlVe supervisor (5002) and commander functions (5003), which are concerned with effectiveness monitoring and control, allocation of resources, and deployment of personnel for special problems. . .. .
As indicated the held offi.:er and mvesllgatlve functions interact ~ith the citizen (5008), who provides information concerning incidents or requests assistance from the police. Until an arrest occur~, a &reat deal. of the information generated and t~ansmltted m the p~h~e system concerns itself with vanous aspects of the mCldent. Once an arrest is made, the information generated and transmitted begins to centralize on the arr7stee (50q9) himself as he proceeds through the bookmg functIOn (5013) and is jailed, or released or, b~il or his own ~ecognizance. At this point also, the pollce system begms to interface with the courts and corrections systems.
The police information flow diagram portrays the pro:::essing of infonnation associated primarily with adults. For those incidents associated with juveniles, a special element of the investigative function is involved and at this point the police system interfaces with the juvenile court and the correction agencies (7201).
The supporting functions of the police system are those concerned with analysis, planning and management. The police commissioner function (5021) is concerned with such broad management functions as the formulation of policy and the ~conduct of special investigations of police department activities. These special investigations are carried out by the internal affairs function (5022). The planning function (5023) supports the chief of police (5004) through long-range planning, budgeting, and resource inventory activities. The analytic function (5017) is concerned with the analysis of incidents to detect patterns of activity which are used for alerting the other elements of the department.
In the normal course of conducting its affairs, the police department must interact wit~ a number of other systems which have not been portraye'd in detail, but have been categorized as external agencie's (5018) on t.his flow ~iagram. These agencies are other local police agencies, State agencies, and Federal ageI~cies. The State agencies typically include such functions as State hignway patrols, motor vehicle bureaus, criminal identification bureaus, etc. The Federal agencies include organizations such as the FBI which both collects data from and supplies data to the police department.
COURT FLOW DIAGRAM
The flow of information in the court closely parallels the course of the case as it proceeds through the court
~ystem. The infonnation flow diagram presented here in figure G-4 is based on an analysis made of the operation of the criminal courts in a typical county in an Eastern State. Since there are important differences in the procedures and operations of the courts from State to State, this flow diagram is only broadly typical of the operations of the court system.
The flow of information starts with the decision by the prosecutor (6810) to prepare a complaint which identifies the accused and the charge against him. The complaint goes to the municipal court clerk (6001) who generates the municipal court docket and prepares the court calendar. If the accused has been arrested for a misdemeanor, the clerk schedules the municipal trial (6008) and notifies the various parties involved-the accused (6004), his counsel (6010), the prosecutor, and the witnesses (State's 6002, defense 6012) -of the date for the trial, If the accused has been arrested for a felony, the clerk schedules a preliminary hearing (6003).
At the preliminary hearing, the infom1ation relating to the case is reviewed and if probable cause is established, the accused is bound over to the grand jury (in those States that use the grand jury system). The prosecutor
)'1
may conduct an investigation (6014) of his own. H so, . :'1 the prosecutor's investigative reports plu:; the earlier in- J'~ formation on the case are presented to the grand jury. hearing (6018) which is scheduled by the grand jury clerk (6016). If the grand jury review results in a decision to indict, then the indictment, after judicial review (6020), is transmitted to the clerk of the criminal court (6021) who prepares a docket for the case. An arraignment and plea schedule (6022) is prepared, the files are transmitted to the judge and the accused is arraigned (6024). If the accused pleads not guilty, a trial (6028) is necessary and the case must be added to the court calendar (6046), the principals notified, and any required summons issued. If the defendant pleads guilty or is found gu,ilty, he must be sentenced (6030, 6034), At this point the court system interacts with the corrections system in the form of the presentence report which is prepared by the court's probation department (7112).
The sentences can take a number of forms-for example, detention in the county jailor in a State prison, suspension of sentence, or probation. At any of these points, the defendant and the infonnation about him enters the corrections system.
CORRECTIONS FLOW DIAGRAMS
The corrections system flow diagrams present a picture of the flow of information between the various functions required in the corrections areas. For this discussion the corrections system has been divided into adult an? juvenile pal'ts. Since the Federal correction syst(:m IS
very similar to the local and State adult corrections system its flow charts have been included in the separate Report.
MUNICIPAL AND COUNTY ADULT CORHECTIONS
As shown in figure G-5, the local prosecutor (6014) mayor may not have adequ,ate means via special i.nvestigators to obtain sufficient information about the circumstances under which the accused is charged. In either case, he may decide to utilize the services of probation and parole office personnel (7751) to conduct a pretrial deferred prosecution investigation. With leads from the prosecutor's available files on the case, the assigned field officer (7752) obtains information about the defendant's alleged crime and his background through interviews (7753) with the defendant and his attorney (9110), codefendants (911.1), his wife and family (9112), the welfare agency (9113), his employers (9114), doct~rs (9115), religious and civic leaders (9116), and any Witnesses, complainants, and victims (9117), The field officer summarizes the interviews and prepares a S:.1I11-
mary of results in the form of a pretrial investigation report; the interview summaries and one copy of the ~eport go to the probation and parole office (7751) while another copy of the report is transferred to the prosecutor (6014). .
The next functional area involves a presentence Investigation, usually requested by the municip~l .(6.oq~) or the felony court judge (6030, 603-+). ThiS IS Initiated by the assignment of a county probation department field officer (7111, 7112) who -primari!y utili.zes the i~tervjew technique (7113) to obtain pertment mformatlOn concerning the background of the accused from persons .acquainted with him and information related to the cnme from any available source. Specific requests-a rap sheet from police (5016), a crime report from the pros.ecutor and an FBI identification record (5111), if aVallable~are made, and any response information is added to the investigation details. The field officer then makes a summary report and sometimes, when requested, adds his recommendation for sentencing.
Another function involves the temporary evaluation and/or treatment of the accused by the department of mental health. (Fig. G-4, 7110) This action is taken on recommendation by the court. A mental health report is generated and forwarded to the court upon release of the accused from temporary detention.
Prol)atiOl'! (711.4) is a corrections area procedure initiated by appropriate court order. The order, the terms of probation and the presentence report are forwarded to the assigned probation field office supervisor (7115). The supervisor conducts periodic interviews with the probationer (9123), recording information in his field book and issuing periodic probation reports which go to the probation department. Any information obtained from the probationer, the police, 01' the prosecutor indicating possible violation of probation is reviewed by the field office supervisol' (7119) and, if serious enough, submitted to the probation department (7116) for a decision on dismissal or court referral. On referral, the court with jurisdiction in the case holds a violation hearing (6113, 6114) and either disl11iss~s charges O~ issues a
.------.~~.-------- -_.
173
detention order. Appropriate notices go to the supervisor and the probation department file.
H the sentence involves short term detention, a detention order accompanies the sentence to the local detention facility (711'7). Here the duration of detention varies from days and weeks in municipal jailor short-tem1 city institutions to weeks and months in county jails, camps, or farms.
STATE ADULT CORRECTIONS
As shown in figure G-6, a sentence for State detention is given by the court (6034) in more serious cases where confinement duration of at least 1 year is called for. Upon issuance of such a sentence, the court's detention notice and presentence report accompany the offender to the State institution reception center (7118) for reception processing. This processing includes the solicitation of specific information about the individual's background and about his current attitudes via questionnaire fonns to the defendant and his att6rney (9140), his employers, teachers, family (9141) and other State and Federal institutions and agencies (9142) that may have information about him. Based on all the available information on the offender, a C:ecision is reached on the appropriate State institution to be used for his confinement.
Upon receipt of reception center advice, including detention tenns and the inmate's record, an institution classification committee selects (7141) the appropriate program from among those available within the assigned institution based on security requirements and rehabilitative goals. An assigned institution program supervisor (7142) monitors the inmate's progress, performs counseling (7143), and prepares periodic assessment reports, which are regularly reviewed by a reclassification committee. Based on supervisor recommendations, security or program requirement reconsiderations, or expiration of specified periods of detention time, a decision is reached on reclassification (7144) of the inmate. Alternatives include no change in status, transfer to another program in the institution (7146), transfer to another State institution (7145), submission of a parole plan to the State parole board (7147) l or release upon completion of sentence.
The State parole board, which receives the paro;e plan and available assessment reports, reviews the plan and either rejects it or orders a preparole investigation (7148) to augment existing information for subsequent acceptability review. The investigation is conducted by a State parole field officer (7149) who usually interviews (7150) intended sponsors (9146), and potential school (914·5) and/or employer (9144). Interview details are used as the basis of a preparole investigation summary report; details am retained in the State parole office investigation file ancl the summary report is transferred to the parole board for its acceptability review (7151).
Prior to a parole decision, the board may require psychiatric treatment (7154) for the inmate at the ou tpatient psychiatric clinic. A treatment order for temporary
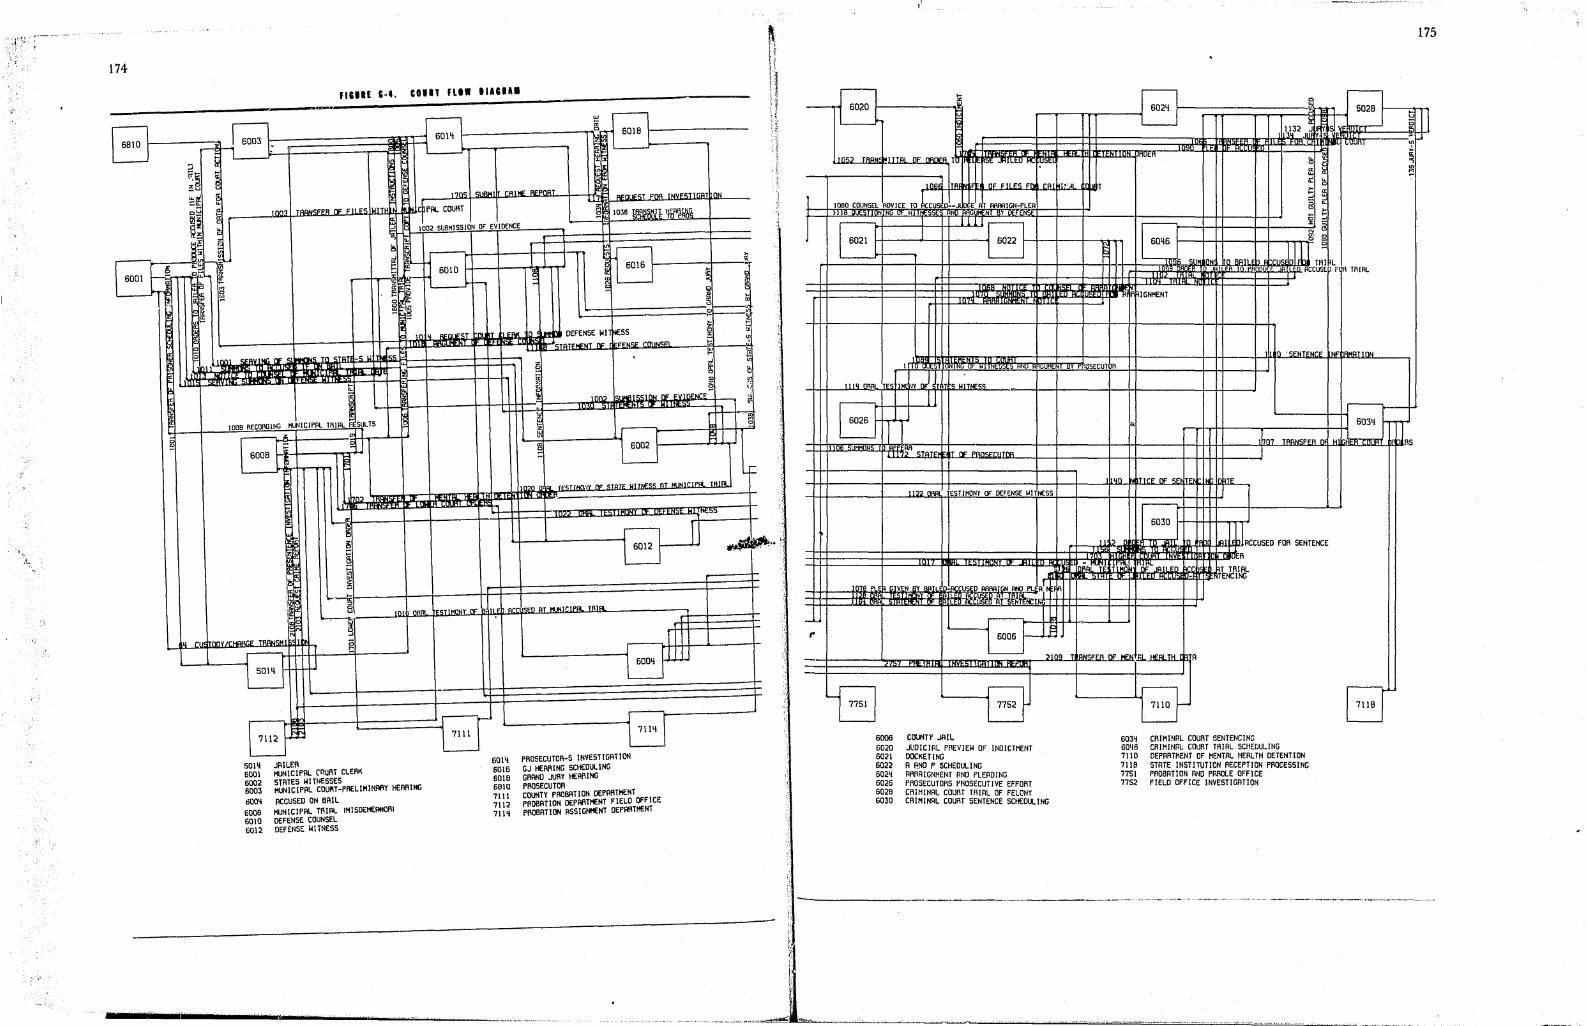
:
".11£ C-4. CUlt flU IIACIAI
UJ
B tt c
z
" '"
RFallF~T ~nR 'NVF~T'r.R' hnN
~ 1036 !:\I\\:!~m ljfJl~lIJ/i; -
~
I Ii
IE " V, ,. " t;
15 !'> l! ;3
'" i'a>
2
1020 01", ""TlHO.'!Y rtF <TQTF "ITNI'« QT "'N,r,p", TR''''
hn~
6012 I--_~l~ ~ i5
~ § ~ ~_~l-_+---4----I-+=jq=====================::l:===I:
101; ORA'. ~ESTIMONY OF' L om',«n aT .... "'PCl TRIO!
T
-B~
5014 JAILER 6001 HUNICIPAL CO~RT CLERK 6002 STRTES WI TllESSES 6003 HUNICIPRL COU~T-PREL1HIN!lRY HEARING
ti004 ACCUSED ON BRIL 600B HUNICIPAL TRIAL IHISDEHERNORI 60 I 0 DEFENSE COUNSEL 6012 DEFENSE WITNESS
~-= r U 6014 60\6 6018 6810 7111 7112 7114
6004
7114
PROSECUTOR-S INVESTIGATION GJ HEARING SCHEDULING GRANO JURy HEARING PROSECUTOR COUNTY PROBATION OEPARTtlENT PROOATION OEPRRTHENT FIELO OFFICE PROBATI ON ASS I GNHENT DEPRRTHENT
1
ft 1,
It ! i ,.
L t ;~ d '::
"
: ~ ~
:1 '1j J
"1
J
7751
I.:
6006 6020 6021 6022 6024 6026 6028 6030
o N
6006 L...l-.
21 09 T hRNSFEA nF MFN]I. HEALTH [ R
B CO'.JNH JAIL J~DICIRL PREVIEW OF INDICTMENT DOCKETING R RJIO P SCHEDULING RRRRIGNMENT RND PLERDING PROSECUTORS PROSECUTI VE EFfORT CRIMINRL COURT TRIRL OF FELONY CRIHINRL COURT SENTENCE SCHEDULING
6034 CR I M I HRL COURT 5ENTENC I NG 6046 CRIMINRL COURT TRIRL SCHEDULING 7110 DEPARTMENT OF MENTAL HERLTH DETENTION
7771SIBI STRTE INSTITUTION RECEPTION PROCESSING
PROBRTlON RND PAROLE OFFICE 7752 FIELD OFFICE INVESTIGATION
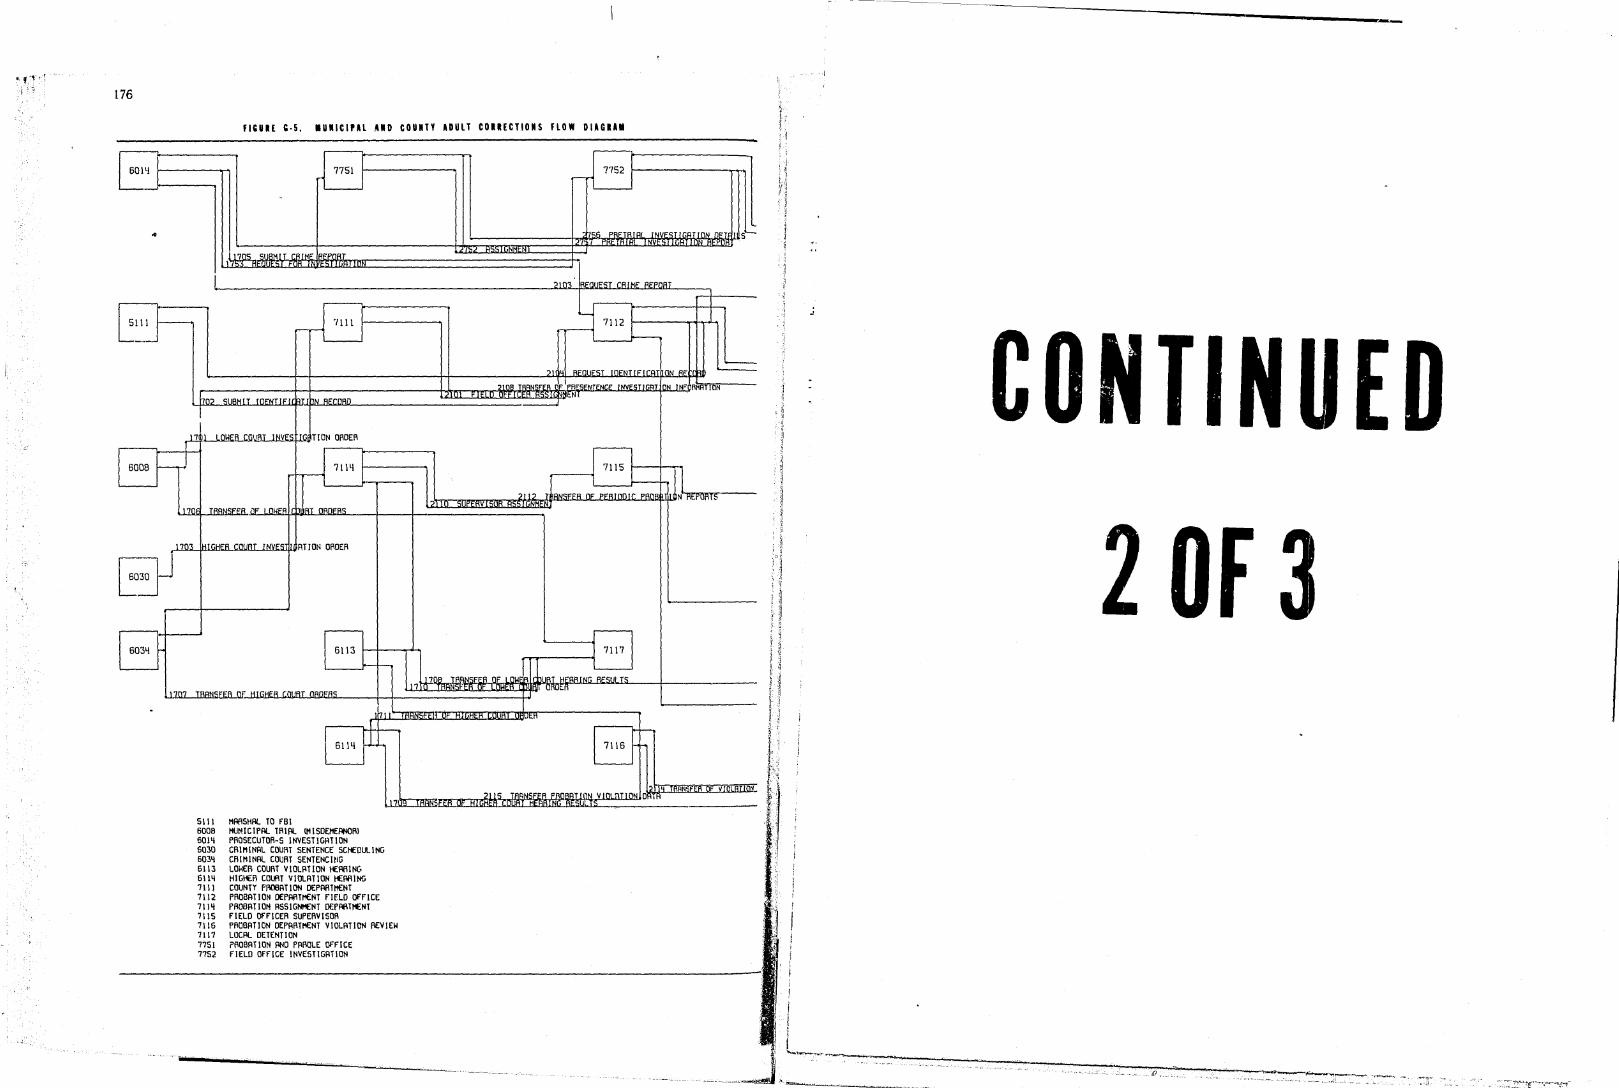
176
flUU ;·5. IUIIICIPH UD COUillY ADULT COllECTIONS flOW DUG .. I
pOI'!
..
I
SIll I----
11705 SUSHI L CfllliE BEPOlU'_
7111 .-rl
'--
~~ 11
156 _PElEIBlFlI rNVF~LIGAJ/ON DETfill sU
2103' IREaUEST CR I ME REPORT
I
7112L I
211~qElEQUESLIDENTIFICATlON REte
2108 TRRNSFER F 'PRESENTENCE INVESTIGRT: ON INF RHATION
Ljwho?_.s! SlllJlll1jBH IlLlTlmOENtLTII�tru:F�(trflTlr.lj:JtbNuABECIEComAD _____ --.:~~L~I~EL~O~tE..::~~~:.Ji~B~l:5:;~jlN-",rJ~N I I
17 I I
LOWER C(l\.lf\T I NVES rIGI TIoN ORDER -
. 170E TRANSFER. DF LOIiEA iAT ORDERS
1703 HIGHER COUnT lNVESl ATION ORDER
0030 ~
~ 6113 ~I-1 \7n7 TRANSFER nF HIGHER COllRT ORDFRS
Sill HIlRSHRl TO FBI 600B HUNICIPRl TRiAl II1ISDEHEFltlORl 60lQ PROSECUTOR-S INVESTIGATION 6030 CRIHltlAL COURT SENTENCE SCHEDULING 603Q CRIHINAl COURT SENTENCING 6113 LOIlER COURT VIOLATION HEARING 6ltq HIGHER COURT VIOLATION HEARING 711) COUNTY PROOAT I ON DEPARTMENT 7112 PROBATION DEPARTMENT f1flD OfFICE 711 ~ PROBAT 101'! ASS I GNHENT DEPARTI1ENT 7115 FIELD OFflCER SUPERVISOR 7116 PROBATION DEPARTMENT VIOLATION REVIEW 1111 LOCAL DETEtm ON 77S1 rROBAT ION RNll PAROLE OFFICE 7752 FIELD OFFICE ltlVESTIGATlON
rrr----~~ .. . 1708 TAANSFER OF LOWE ~ 7 IIlRN5rtR Oc_
,uRT HEARING RESULTS ORUtR
1 t F II 2115 TRANSFER FRoBATlllN VIOLATION D It-!
.:
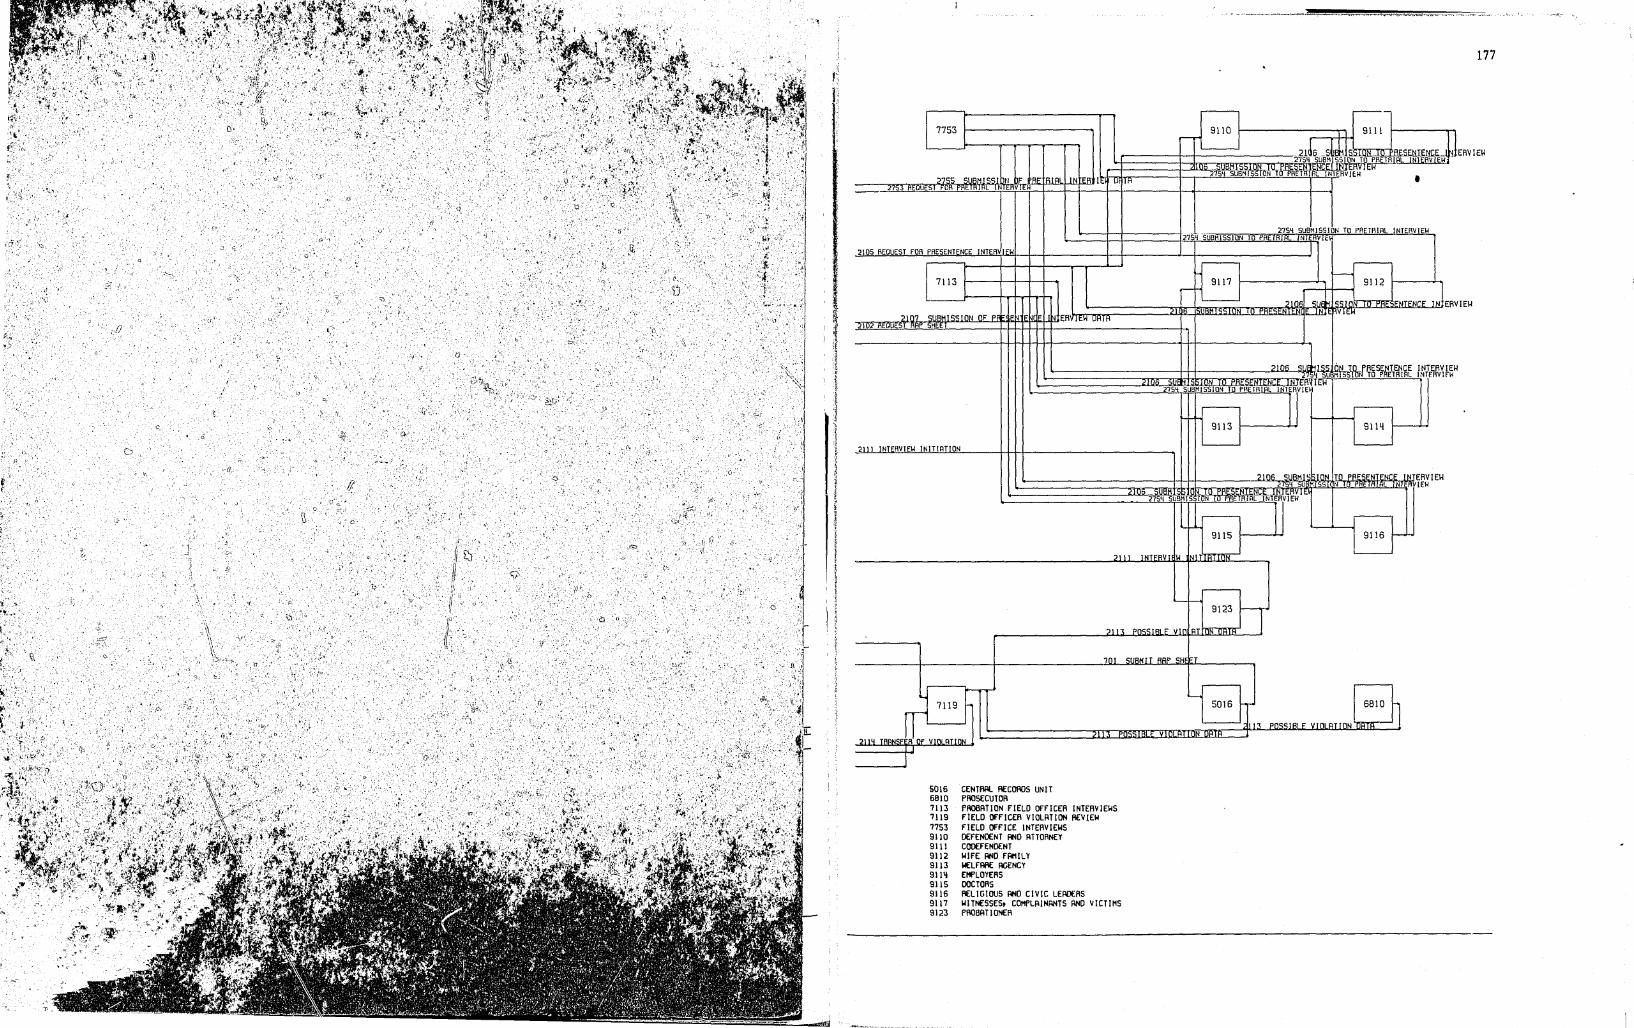
EOU
27S4 -SUBMIS ION TO P E 2754 SUBMISSION TO PRETRIRL INTERVIEW
L NIG'rIEW
2105 REQUEST FOR PRESENIENCE INTERVIFW
.ll.l.I....lliIWIEW INITIRTION
5016 6BIO 7113 7119 77S3 9110 9111 9112 9113 911~ 911S 9116 9117 9123
:>IOfi SIl~~.fuL TO PRESENTENCE INTERVIEW '.!.:t. U M ,llft>! 10 ~AETRIRL INTERVIEW
JOlt 27 SUBMISSION T PR TRI , rr~I-I_EW+---i'-_--' 31---....., 19114 r--
2111 INTERVII II HI
-~- 9123 IT
CENTfIIlL RECOflOS UNIT PROSECUTOR
?113 POSSIBLE VIOI~AT 1lIfll1rn11 __ J 701 SUBHLI RAP SHFF'T
PROBATION FIELO OFFICER INTERVIEWS FIELD OFFICER VIOLATION REVIEW FIELD OFFICE INTERVIEWS DEFENDENT AND ATTORNEY COOEFENDENT WIFE AND FAI1ILY WELFAIIE AGENCY EttI'LOYERS DOCTORS RELIGIOUS AND CIVIC LEROERS WITNESSES. COI1PLRINRIITS RIID VICTIMS PROBR T1 ONER
177

178
6034
7118
71l!5
7147
7158
FIeIiE c·.. STATE ADllT COII£CTlOU flOW "ACU'
a: W 0 a: 0 71111
, ~
~ @
, J:
~ 21liC OF RECEPTI ON
21bt HI:LlUI: :>t"1:. II" INI"UHI'H [ON W (fl Z a:
71l!4 a: I-.... 0 ........., .... -
211!3 I HI- N:>rl:. OF FILC::S 2153 IMA "E [N{;l
o<'j:>'f W
11j~ II: INLIl IH' u
T 1 > .... fE
J w 7148 ;--6
,..---< a: a: n.. u. 0
a: W u. (fl Z a: a: I-
211i5 Of lNVESYlGA~lON F UE5T J 152 I HHN~I" 1:.' OF PRROLE'PLAN f'RE I NARY REJECT! 0
1 .llJ
J 7151 N
10---.
~ 167 ..JRBNSFER OF PAROLE BOAAC OETENTTC NORDER
tt~
166
6031i 7118 7141 7144 7145 7147 7148 7151 7158
UI- t-'HHI1LI: V ,IL H (IN Ill-:> l::j, Uti.
CRIMINAL COURT SENTENCING STATE INSTITUTION RECEPTION PROCESSING INSTITUTION CLASSIFICATION PROCEDURE INSTITUTION RECLASSIFICATION PROCEDURE OTHER STATE INSTITUTION STATE PA~OLE BOARD PLAN REVIEW STATE PAROLE OFFICE INVESTIGATION PAROLE BOARD PLAN ACCEPTABILITY REVIEW STATE PAROLE BOARD VIOLATION HEARING
21ql TRANSFER 0 I ~S W HIN INS U 21ql TRANSFER O~ ~IL S WITHIN INSTITUTIO~ 21ql TRANSFER OF ~S W ,H ill N:o
r--
.21 ITO PARO.f
:2 SUPERVISOR NL ~I:
OARD [A'
r---t--<
"" TflRNSFEA OF 1 ""''' "AT'" ",t" ;.>] % rHRN~FER N"'~~T liB" ON HS~liNHENT
r 2158 PSYCHIATRIC CLINIC AEPOAL
I~'( t-'HHllLI: HUHHl. 'IHUl"..tI
2165 TRANSFER OF PAROLE VIOLATION DATA
, .. t1 I ~ II I I. I' 1)
1 j \ ., I 7142 9140 9141
I ~ r-' r--
" /jb~ I NFORMAT I bN 2lb~ INI lHMH UN
:.!1'f rHHN~FI:H F F E~ W HIN N .TUTION
(fl :::> I-a: ,.--r (fl
W
~'--< 7 )l±6 ~--1 71l!3
0 .... N
2: 7r INMAIE ::iIRUS --
7149 7150
r--
2169 lI'1r UMM
N
9142
ON MI::>I
9144
2 4
UN~t 1
, 9145 rt----<j
I I RN FE F PA OLE INVESTIGRTION REPOAT
a: l a: 7154 7155
W 9146 >-----. I-
Z W U (fl
o~~ ~ I-0
WZ OU I-W IDa: [f~a: _a:
NZ - _p".:l.a: ~ ~§M:'p 7152 7153
C\ltnl-lL. 9143 ~n
,2161 lIHIEBVIEW INITII UN 21 3 JS::i ItlLI:.. V IILH UHIH
,62 OF PERIODIC PAROLE" EP{ffIIS
-7157 7156 SOW 6810 n iIBLE VIOLAH ~ lb;5_ 1'1 DATA
? ,~\ t"'l~~ I tlLt: vOLA ON URLR .::1 lj OF V IClLATI ON DATA
CENTRAL RECORDS UNIT STATE NARCOTICS CENTER TREATMENT 5016 6810 7142 7143 7146 7149 7150 7152 7153 7154
. PROSECUTOR 7155 7156 7157 9140 9141 9142 911i3 9141i 9145 911i6
IFIELD OFFICE,STATE PAROLE VIOLATION REVIEW STATE PAROLE OFFICE VIOLATION REVIEW DEFENDANT AND ATTORNEY
INSTITUTION PROGRAM SUPERVISOR (Al INMATE COUNSELING INSTITUTION PROGRAM SUPERVISOR (Bl STRTE PAROLE FIELD CFFICER INVESTIGATION PRROLE FIELD OFFICER INTERVIEWS STATE PAROLE OFFICE SUPERVISOR ASSIGNMENT STATE PAROLE FIELD OFFICER SUPERVISION OUTPATIENT PSYCHIATRIC CLINIC TREATMENT
EMPLOYERS, TEACHERS, FAMILIES, ETC OTHER STATE AND FEDERAL INSTITUTIONS AND AGENCIES PAROLEE POTENTIAL EMPLOYER POTENTIAL SCHOOL PLANNED SPONSOR FAMILY
179
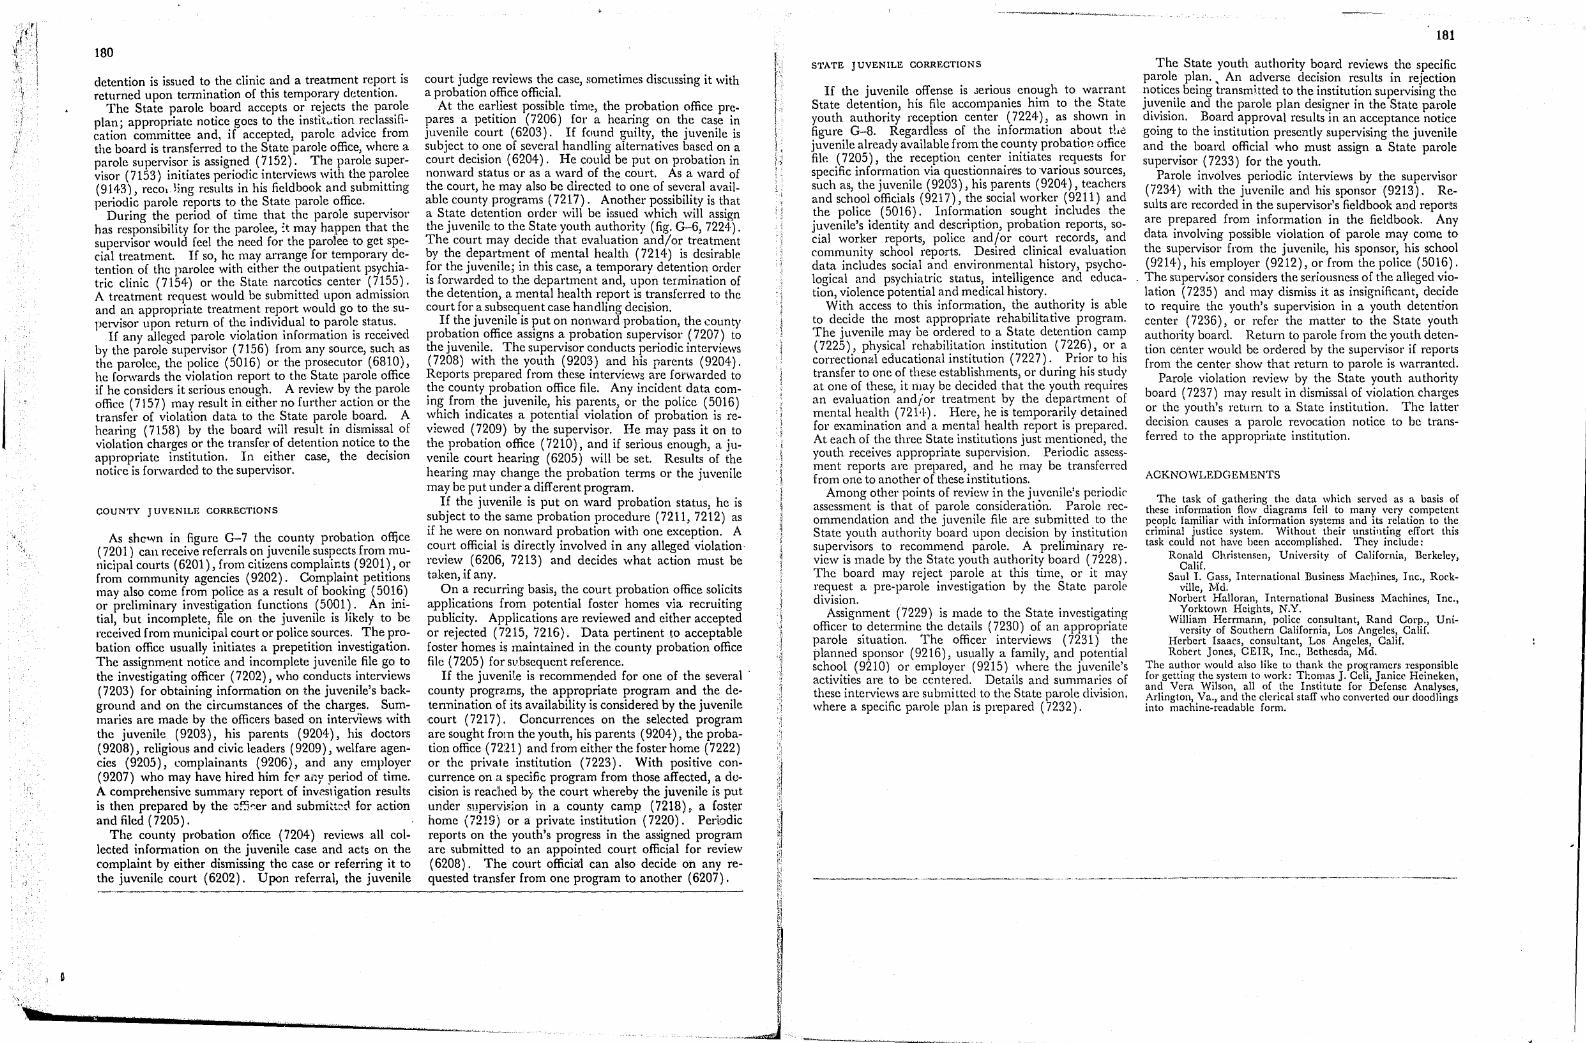
,t'!fj Ii: \
\1 '1 ./\
\.
180
detention is issued to the clinic and a treatment report is returned upon termination of this temporary dr;tention.
The State parole board accepts or rejects the parole plan; appropriate notice goes to the instit..tion reclassification committee and, if accepted, parole advice from the board is transferred to the State parole office, where a parole supervisor is assigned (7152). The parole supervisor (7153) initiates periodic interviews with the parolee (9143), recolling results in his field book and submitting periodic parole reports to the State parole office.
During the period of time that the parole supervisor has responsibility for the parolee, :t may happen that the supervisor would feel the need for the parolee to get special treatment. If so, he may arrange for temporary detention of the parolee with either the outpatient psychiatric clinie (7154) or the State narcotics center (7155). A treatment rl.'quest would be submitted upon admission and an appropriate treatment report would go to thesupervisor upon return of the individual to parole status.
If any alleged parole violation information is received by the parole supervisor (7156) from any source, such as the parolee, the police (5016) or the prosecutor (6810), he forwards the violation report to the State parole office if he considers it serious enough. A review by the parole office (7157) may result in either no further action or the transfer of violation data to the State parole board. A hearing (7158) by the board will result in dismissal of violation charges or the transfer of detention notice to the appropriate institution. In either case, the decision notke is forwarded to the supervisor.
COUNTY JUVENILE CORRECTIONS
As shc"Vn in figure G-7 the county probation office (7201) can receive referrals on juvenile suspects from municipal courts (6201), from citizens complaints (9201), or from community agencies (9202). Complaint petitions may also come from police as a result of booking (5016) or preliminary investigation functions (5001). An initial, but incomplete, file on the juvenile is likely to be received from municipal court or police sources. The probation office usually initiates a prepetition investigation. The assignmp.nt notice and incomplete juvenile file go to the investigating officer (7202), who conducts interviews (7203) for obtaining information on the juvenile's background and on the circumstances of the charges. Summaries are made by the officers based on interViews with the juvenile (9203), his parents (9204), his doctors (9208), religious and civic leaders (9209), welfare agencies (9205), complainants (9206), and any employer (9207) who may have hired him fer ally period of time. A comprehensive summ:ary report of inves'\ igation results is then prepared by the ;:;5".er and submi~t~~ for action and filed (7205) .
The county probation office (7204) reviews all collected information on the juvenile case and acts on the complaint by either dismissing the case or referring it to the juvenile court (6202). Upon referral, the juvenile
court judge reviews the case, sometimes discussing it with a probation office official.
At the ea:l~est possible timt~, the p:obation office prepares a petltlOn (7206) for a hearmg on the case in juvenile court (6203). If found guilty, the juvenile is subject to one of several handling aiternatives based on a court decision (6204). He could be put on probation in nonward status or as a ward of the court. As a ward of the court, he may also be directed to one of several available county programs (7217). Another possibility is that a State detention order will be issued which will assign the juvenile to the State youth authority (fig. G-6, 7224). The court may decide that evaluation and/or treatment by the ?epar~me~t of. mental health (7214) is desirable ~or the Juvemle; 111 thIS case, a temporary detention m'der IS forwarded to the department and, upon termination of the detention, a mental health report is transferred to the court for a subsequent case handling decision.
If the juvenile is put on nonward probation, the county proJ;latior; office assigns a probation supervisor (7207) to the Juvemle. The supervisor conducts periodic interviews (7208) with the youth (9203) and his parents (9204). Reports prepared from these interviews are forwarded to the county probation office file. Any incident data coming. fro;n t.he juvenile, hi~ pa~'entSt or the police (5016) wlllch mdlcates a potential vlOlatlOn of probation is reviewed (7209) by the supervisor. He may pass it on to the probation office (7210), and if serious enough, a juvenile court hearing (6205) will be set. Results of the hearing may change the probation terms or the juvenile may be put under a different program.
If the juvenile is put on ward probation status he is subject to the same probation procedure (7211, 72i2) as if he were on nonward probation with one exception. A court official is directly involved in any alleged violation review (6206, 7213) and decides what action must be taken, if any.
On a recurring basis, the court probation office solicits applications from potential foster homes via recruiting publicity. Applications are reviewed and either accepted or rejected (7215, 7216). Data pertinent to acceptable foster homes is m.aintained in the county probation office file (7205) for subsequent reference.
If the juveni1.e is recommended for one of the several . county progr2,ms, the appropriate program and the detennination oJ its availability is considered by the juvenile court (7217). Concurrences on the selected program are sought from the youth, his parents (9204), the probation office (7221) and from either the foster home (7222) or the private institution (7223). With positive concurrence on a specific program from those affected, a decision is reac'hed b~ the court whereby the juvenile is put under sl!pervi~;on ina county camp (n18)r a foster home (7219) or a private institution (7220). Per1tJdic reports on the youth's progress in the assigned program arc submitted to an appointed court official for review (6208). The court officia:l can also decide on any requested transfer from one program to another (6207).
1'1 n 1: ! '
I
STATE JUVENILE CORRECTIONS
If the juvenile offense is Jerious enough to warrant State detention, his file accompanies him to the State youth authority reception center (7224), as shown in figure G-8. Regardless of the information about the juvenile already available from the county probation office file (7205), the reception center initiates requests for specific information via questionnaires to various sources, such as, the juvenile (920~~) , his parents (9204), teachers and school officials (9217), the social worker (9211) and the police (5016). Information sought includes the juvenile's identity and description, probation reports, social worker reports, police and / or court records, and community school reports. Desired clinical evaluation data includes social and environmental history, psychological and psychiatric status, intelligence and education, violence potential and medical history.
With access to this information, the authority is able to decide the most appropriate rehabilitative program. The juvenile may be ordered to a State detention camp (7225), physical rehabilitation institution (7226), or a correctional educational institution (7227). Prior to his transfer to one of these establishments, or during his study at one of these, it nlay be decided that the youth requires an evaluation and lor treatment by the department of mental health (721-1-). Here, he is temporarily detained for examination and a mental health report is prepared. At each of the three State institutions just mentioned, the youth receives appropriate supervision. Periodic assessment reports are prepared, and he may be transferred from one to another of these institutions.
Among other points of review in the juvenile's periodic assessment is that of parole consideration. Parole recommendation and the juvenile file are submitted to the State youth authority board upon decision by institution supervisors to recommend parole. A preliminary review is made by the State youth authority board (7228). The board may reject parole at this time, or it may request a pre-parole investigation by the State parole division.
Assignment (7229) is made to the State investigating officer to determine the details (7230) of an appropriate parole situation. The officer interviews (7231) the planned sponsor (9216), usually a family, and potential school (9210) or employer (9215) where the juvenile'S activities are to be centered. Details and summaries of these interviews are submitted to the State parole division. where a specific parole plan is prepared (7232).
" '0'
181
The State youth authority board reviews the specific par?le plan., An adverse decision results in rejection ~10tlC~S being transmitted to the institution supelvising the J~v~~l1le and the parole plan designer in the State parole dIVISIon. Board approval results in an acceptance notice going to the institution presently supervising the juvenile and the board official who must assign a State parole supervisor (7233) for the youth.
Parole involves periodic interviews by the supervisor (7234) with the juvenile and his sponsor (9213). Results are recorded in the supervisor's fieldbook and reporiS are prepared from information in the fieldbook. Any data involving possible violation of parole may come to the supervisor from the juvenile, his sponsor, his school (9214), his employer (9212), or from the police (5016).
. The superv~sor considers the seriousness of the alleged violation (7235) and may dismiss it as insignificant, decide to require the youth's supervision in a youth detention center (7236), or refer the matter to the State youth authority board. Return to parole from the youth detention center would be ordered by the supervisor if reports from the center show that return to parole is warranted.
Parole violation review by the State youth authority board (7237) may result in dismissal of violation charges or the youth's return to a State institution. The latter decision causes a parole revocation notice to be transferred to the appropriate institution.
ACKNOWLEDGEMENTS
The task of gathering the data which served as a basis of these information flow diagrams fell to many very competent people familiar with information systems and its relation to the criminal justice system. Without their unstillting effort this task could not h3,ve been accomplished. They include:
Ronaid Christensen, U nivrrsity of California, Berkeley Calif. '
Saul 1. Gass, International Business Machines, Inc., Rockville, Md.
Norbert Halloran, International Business Machines, Inc. Yorktown Heights, N.Y, '
WilJia,? Herrmann, polic~ cO~1sultant, Rand Corp., Uni. verslty oE Southern Cahforma, Los Angeles, Calif. Herbert Isaacs, consultant, Los Angeles, Calif. Robert Jones, CEIR, Inc., Bethesda, Md.
The au~hor would also like to thank the programers responsible for gettlllg the system to work: Tl:omas J. Ccli, Janice Heineken an~ Vera Ylilson, all of ,the Institute for Defense Analyses: ArlIngton, va., and the clencal staff who converted our doodlings into machine-readable form.
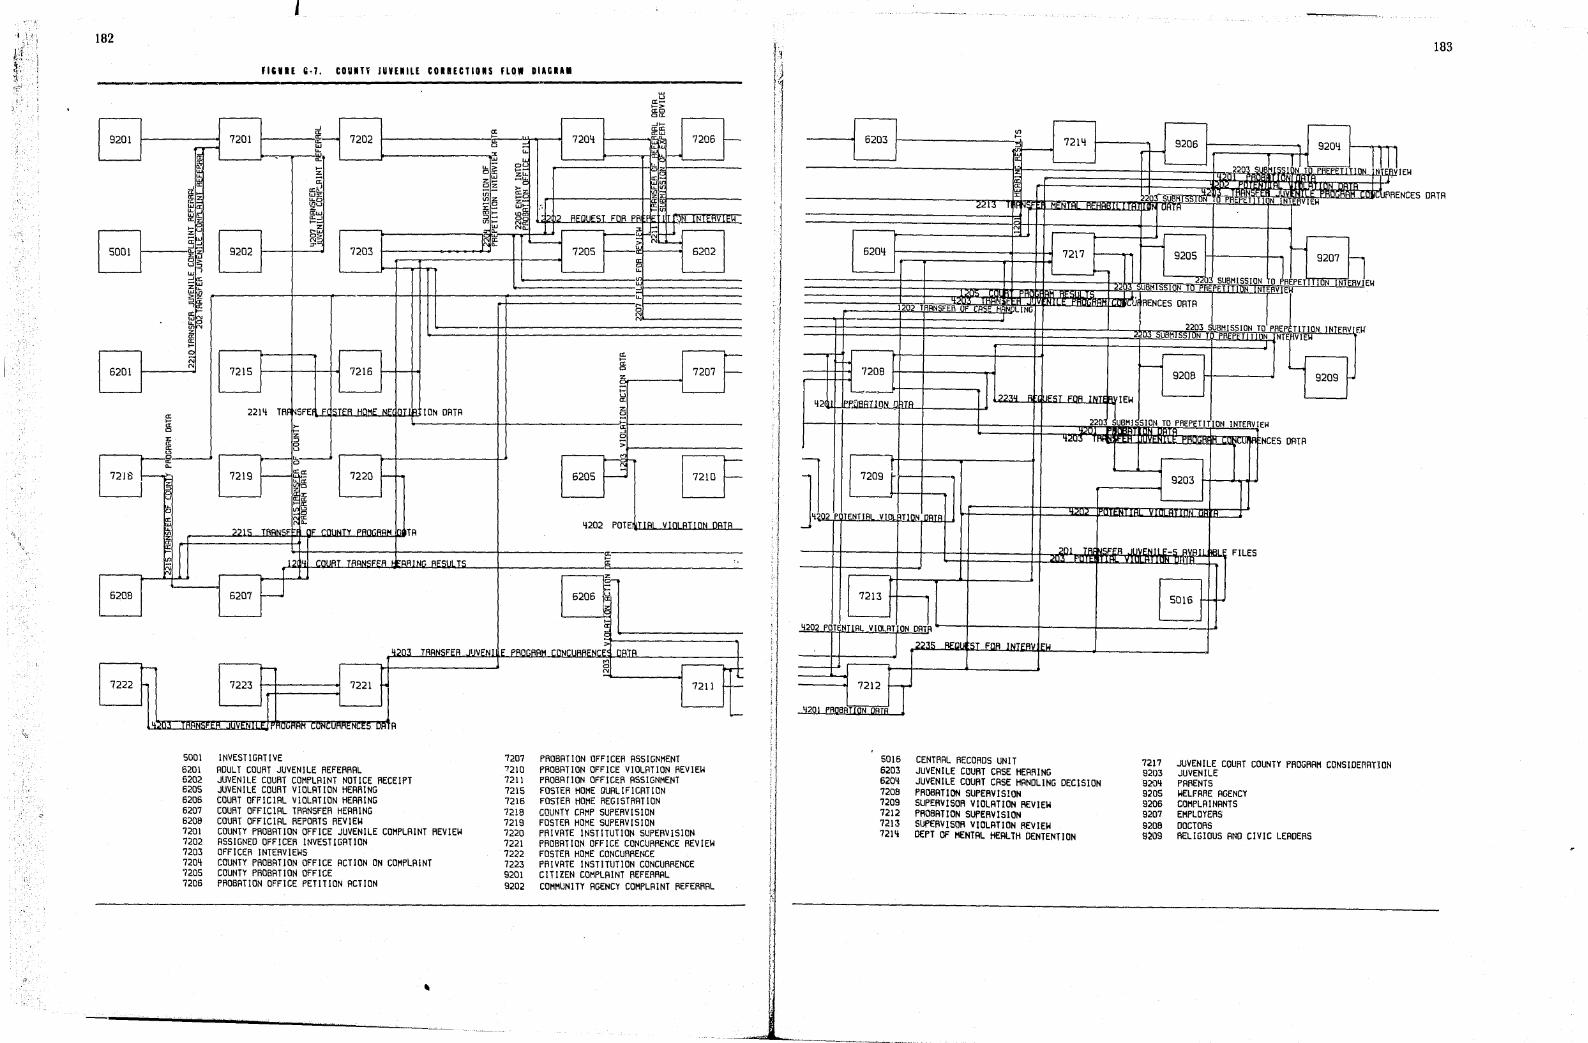
", ;,
182
flUIE C-7_ conn IUVE.ILl COllECTIOn FLOW DIAGUI ----"-----------------------------------------------------
9201
I 5001
6201
7218
6208
7222
-l a: 7201 li:- 7202
r-' w u. I[ . UJ
a:.
I[ I-Z
J~ ;;: a:~ a: W,""
:fl~ "-0 Wa: 'j2u IL-l a:w
~~ a:....J 1--
z
I z t-w ;;:t, ~; ...J.
9202 7203 D..z
s~ w'
II ~~ z a: a: I-
~ '" 7215 7216
a: 221'1 TRf ~SfE FeiSTER HOME NE( I-0:
~ 0
:J: Z :;)
~ 0 u '" r-f€ ,.--~-D..
t--- 7219 a: 0: 7220 r-[3 Ii; u
~ '" 0
@ a: ...
~ -.2.2.lli OF COUNTY PROGRAM a:
~ 1 ~2 COUAT TARN~FFA f
T
6207 ~~
a: >-g,---P, '" u. Ie "!~ I.J..> ~_
oa: zlL. f5~ -~ iil- 1]:% ~a ffi;: ~~ ~~ V1.- Na: =t~ Na..
~[
lor B: ION DATA
TA
FRAING AESUlTh
7204
['1 ~ ~E£lUESI EDB_f'B j '"
'----< ; 7205 i>,
a: 0 lL
IJ) UJ ...J
G: t-o '" '"
a: I-0: 0
z ::: t-u a: z 0 ;:: u: -l 0
>
r-~ 6205 r--
tl a:t-> a:o 00:
-l>-a: a: a:w
~ u.
a:
z
~
..... '"
7206 t--
'IN INTERVIEW W' '--
6202
I'--
7207 t--
[:f 'I2D2 POTE hIi'll VInlI'lTlnN--.DBI8.
a: t-
" a: 0
z
6206
~ >
42D3 TRANSFER JUVENII lE PROGRAM rnNr:IiAAFNr:F' DATA J --- 0--,
7223 7221
1 "'U~ Ll:1j-1Nl>tt.tt 1l.IYt.I'i. jrnuunt1n l.UNI..UMMtNl..t~ UH A
5001 6201 6202 6205 6206 6207 6208 7201 7202 7203 7204 '7205 7206
INVESTIGATIVE ADULT COURT JUVENILE REFERRAL JUVENILE COURT COMPLAINT NOTICE RECEIPT JUVENILE COURT VIOLATION HEARING COURT OfFICIAL VIOLATION HEARING COURT OFFICIAL TRANSFER HEARING COURT OFFICIAL REPORTS REVIEW COUNTY PROBATION OFFICE JUVENILE COMPLAINT REVIEW ASSIGNED OFFICER INVESTIGATION OFFICER INTERVIEWS COUNTY PROBATION OFFICE ACTION ON COMPLAINT COUNTY PROBATION OFFICE PROBATION OFFICE PETITION ACTION
7207 7210 7211 7215 7216 72!8 7219 7220 7221 7222 7223 9201 9202
M 0 N
7211
PROBATION OFFICER ASSIGNMENT PROBATION OFFICE VIOLATION REVIEW PROBATION OFFICER ASSIGNMENT FOSTER HOME QUALIFICATION FOSTER HOME REGISTRATION COUNTY CAMP SUPERVISION FOSTER HOME SUPERVISION PRIVATE INSTITUTION SUPERVISION PROBATION OFFICE CONCURRENCE REVIEW FOSTER HOME CONCURRENCE PRIVATE INSTITUTION CONCURRENCE CITIZEN COMPLAINT REFERRAL COMMUNITY AGENCY COMPLAINT REFERRAL
r± -
---
J q 'I j : ! "
:1 . I
! "
I '1
, I
:1
, !
7208
c....,..-----.H--Ir---.,J l223'1 RtGiuEST FDA ~If YIEW 42 U ~lJfl£lllil.t:L~"£"'t. 8Ia~t-----I1-"
'---<
9208
9207 h SUBMISSION OlEPET TlON NTkRV}EI~ E tJ1V EW
UBMISSION TO PREJTlTION INTER" Elf PR P N NTE VIEW
9209
r--~lr-------r--lr-------t::::::=t1=~r.ro~2~2=0~UBB~M~I~S~10~N~T~O~P~RE~P~E~TI~T~IO~N~I~N~TE~RV~lEW WHi 'totu.) I"" ~ NCES DATA
9203 t-t--.... Jr<f-'I
l.lJ:Hii
201 .JUYENILE-S IlVAIlhBL FILES Hll.
"13 ~Ol:: 4202 POTE~IlflL V(.Q6flT~ Dfll----r-------,------r--------.-----J ~ REcutST FDA II
j
7212 IT ~QLf'llll6 r ION IflTI ~
SOl6 6203 620'1 7208 7209 7212 7213 721'1
CENTRAL RECOROS UNIT JUVENILE COURT CASE HEARING JUVENILE COURT CASE HANDLING DECISION PROBATION SUPERVIS!ON SUPERVISOR VIOLATION REVIEW PROBATION SUPERVISION SUPERVISOR VIOLATION REVIEW DEPT OF MENTAL HEALTH DENTENTION
7217 9203 92\14 9205 9206 9207 9208 SW9
JUVENILE CQURT COUNTY PROGRAM CONSIPEAATlON JUVENILE PARENTS WELFARE AGENCY COMPLAINANTS EMPLOYERS DOCTORS RELIGIOUS AND CIVIC LEADERS
183

184
fIGURE c·s. STATE JUVENILE COIiECTlOIIS flOW DIACI ..
I I IX
7205 7224 6204 1-IX 0
3: lLJ
> l.u II:
,
lLJ 2220 TRANSFER OF CASE DIS~OSITION DATA . ..J
r262 TRANSFER OF CASE HANDLING DEC I fi I ON. 2237 TRA~SFER OF FILES 0
(I: a: r~
:- f
~! 7225 7226 I-
7232
7214
5016
z ...... 0 Cl (f) :r::
2216 JUVENILE TRANSFER DATA UJ u ...... 2218 PAROLEAF UJ 'f)
D Z 1216 JIJIlEN IR' ~FEH IH a: z n:: IB t'RR( t- Df rA a: 1-..J 0.. en w r~ ..J N 0 n:: a: 0..
...... Cl 7229 7230 n:: UJ
1--1-= f--I~ a: D a: a: a: .... Lu <Xl ...... N
???S TRRNSFER INVFST (f) Z N a: N
2226 t1Hr ::>t n:: b2'j sllf IMISSION nF ~~Rnl Ipi RN DR R ....
IJJ
::l ~ MEN . BEliRliI IT IIOtl PRTR <!: ~2J3 == l.C
N N
7236 7233 10- I-.
.2231 TRI=lN"FFA OF YDe DATR
204 . TRRNSFER QUEST I m INA I RE..BES.E'OJ S T
I ~J 7237
205 POSSIRI F vIm J:lTIDN OBIS SOl 6 620l! 7205 721l! 722l! 7225 7226 7228 7229 7230 7232 7233 7236 7237
CENTRAL RECORDS UNIT JUVENILE COURT CRSE HANDLING DECISION COUNTY PROBATION OFFICE DEPT OF MENTAL HERLTH DENTENTION STRTE YOUTH RUTHORITY RECEPTION CENTER STRTE DETENTION CRMP SUPERVISION PHYSICAL REHABILITATION INSTITUTIONS SUPERVISION STRTE YOUTH AUTHORITY BORRD PRELIMINARY PRROLE REVIEW STATE PRROLE DIVISION .!NVESTIGATION ASSIGNMENT STATE OFFICER INVESTIGRTION STATE YOUTH AUTHORITY BOARD PAROLE PLAN REVIEW STATE YOUTH RUTHORITY·BOARD SUPERVISQR RSSIGNMENT YOUTH DETENTION CENTRRL SUPERVISION SYAB(STRTE YOUTH AUTHORITY BORRD)PRROLE VIOLRTION REVIEW
..........
I
IMMFN IA· D~ nATA
;J:lTT( iN f tFSl S z
~ ~ § <-
~T-~ ~ > g,
~ ~ a: IJJ
~ a: a: ....
en N N
II
I
4204 TRJ:lNSFER QlIF~TTnNNj:HRE RESPDI SES
'--t 7227 9215 9204 -----.
-tttii----?-?>1-, hL .-III1-VF-NIl-.J[ LE TRANSFER OR. r~223 S BM l5: ION T PREPRROLE I NTERV I L 2218 PRR(.E t1~ UJ'"!MtNUH ON DRTA
--~ 2 REQUEST FOR PREPAROI E INTERVIEW
1 7231
l 2 2224 TRBNSFER DF INTERVIEW DRTR 1'"
9216 1 9210 h '--~UBMISSION Jo I PREPAR ~
SUBMISSION TO PREPAROLE INTERVIEW
I
2233 lHN::>r OF PRROLE REPORrS 4)[']14 TRI=lNSFER DlIEsrrnNNJ:!IRF RESPO SES
7227 7~31 7i23l! 7235 9203 92011 9210 9211 9212
a: a: Cl
7234 ~--"""''---+------.I 9203
Li2C5JINTFRVIFW INI IR nN 4~b6 1'1 ISS I AI F V. OLR nN mnJ:!
~_--.Jr~
~ ::>231 THHNsr-- OF ynr: mm:)
a: z Cl
CORRECTIONAL EDUCATIONRL INSTITUTIONS SUPERVISION STRTE OFFICER INTERVIEWS STRTE PAROLE SUPERVISION STRTE PRROLE SUPERVISOR PAROLE VIOLATION REVIEW JUVENILE PRRENTS POTENTIAL SCHOOL SOCIAL WORKER EMPLOYER
'-+-+1--8
9213 SPONSOR 921l! SCHOOL 9215 POTENTIAL EMPLOYER 9216 PLANNED SPONSOR (FAMILY) 9217 TEACHERS, SCHOOLS
185

Appendix H
ANALYSIS OF THE COSTS OF A CENTRALIZED VERSUS DECENTRALIZED NATIONAL INQUIRY SYSTEM
by Ronald Finkler
Contents
Introouction, ' , , , , , , , , ... , , , • , , , , , , , , , . , , , , , , , , , , . , , , , , , , , , , , , . , , , , , . , , , , , , , , , , 186 The Cost Model." , , , . , , , , , , , , , , , , , , . , , , , , .. , , , . , , , , , , , , , , ............ , . . . . . . . . 186 Estimation of Number of Entries and Inquiries .... , ...... ,', ... ,',.,.,.,', .. ,., .• ," 190 Estimation of Required Storage Size. , . , . , . , .•• , . , . , •. , , . , .........•......... , . . . . . 193 Cost Factors .. , ......... ' ........... , . . . . . . . . . . . . . . . . . . . . . . . . . . . . . . . . . . . . . . . . . . 195 Cost Summaries ... ' .......•......... , ........ , ............ ,................... 195
INTRODUCTION
Modern computer technology makes possible a national inquiry system by which local law enforcement agencies can obtain information from a national file on stolen automobiles, stolen identifiable property, guns, and wanted persons. An analysis has been conducted to investigate several altemative system configurations to determine which one involves the least incremental system cost. The three major cost factors considered are the cost of computation, the cost of computer storage, and the cost of communkation. The cost and workload estimates are based on analyses being carried out for the FBI by the Institute of Telecommunication Sciences and Aeronomy of the Environmental Science Services Administration of the Department of Commerce. The information is prelimina,y since their t1nal report has not yet been written.
Three national system models were chosen for this analysis. The first is a centralized system where all functions are performed at a single centralized location. For this morlel, two location altcmatives weI'''' considered: the minimum cost location and Washington, D.n The second model was a national system maintained in two locations to minimize communication costs. Here again, two alternatives were considered: a minimum cost pair of locations, and a pair of locations where one was constrained to be Washington, D.C. and the second positioned so as to minimize costs. It is assumed that each location has a complete copy of the national file. The third model was a completely distributed system where eaeh State had to interrogate all States in order to search the national file completely.
Tilt! analysis of the three system models was essentially divided into two parts, one related to the problem of
186
stolen autos and the second related to tI. emblem 'of stolen identifiable property, guns, and wanted persons. This differentiation was made because inquiries of the stolen auto file, based on license plate infol1nation, have a specific State location to which they can be addressed. This is not the case for inquiries of the other files. A second consideration is that about 45 percent of stolen autos are recovered within 24 hours and about 70 percent are recovered within the jurisdiction of theft, with a high probability that a large fraction of the remainder are recovered in immediately surrounding jurisdictions. In the case of wanted property, guns, and persons, the probability of inquiry also decreases rapidly with distance from the point of theft or crime. More data are needed to assess the value of national integration of the inquiry system. Eventually, a judgment must be made weighing the loss in non recovery or nonapprehension as a result of a police jurisdiction not having ready access to a complete national file against the cost of maintaining such a file. This cost analysis will attempt at least to place cost on some aspects of these various alternatives.
All the systems studied here, including the decentralized one, were nationally integrated in the sense that a complete national file is made available to each inquiry station. It is still possible to have separate, nonintegrated Slate or regional systems, accepting the penalty of losing track of people or property crossing the regional boundary.
THE COST MODEL
It is assumed in the cost model that each State has implemented in its State capital a State-wide inquiry system to serve its other needs. From the resulting work-
187
load, only the following portions are treated in this For this analysis, we assume that: analysis:
Stolen autos;
Stolen identifiahle propClty over $1,000 in value;
Wanted persons whom the State is willing to extradite from anywhere in the United States.
This workload consists of:
Entries, either the generation or deletion of a record in a file of reports of thefts or wants;
Inquiries, the processing and searching of these files.
After processing each entry, other than those relating to stolen autos, the State will pass on the entry to the national system for the generation or deletion of a file available to other State systems. Similarly, after processing each inquiry, other than those relating to stolen autos, the St.ate will pass on the inquiry for search of the national file. This is necessary since a given item or person may appear in either or both the State and national files even with the nonoverlapping definitions of the files.
For the stolen auto file, two cases are considered:
Case I.-Entries related to tl.e theft of an a1,lto are sent to the national system after 24 hours and the entry is deleted from the State file. Inquiries related to this file must be processed both in the State system and sent on to the national system since the time of theft would not be known.
Case 2.-Entries are still sent on to the national system after 24 hours but they are not deleted from the State system. Inquiries based on "own State" license plate information are processed only in the State system; inquiries based on out-of-State license plates or on autos without plates are sent on to the national system without prior State processing.
The incremental cost equation for computer time in the jth State for both cases is ghren by:
OIJ= (EJr(J/~+l)Tcr) Cc where:
EJ=Total number of entries/month genel'u.tecl in the jilL State.
Ij=Total number of inquiries/month generated in the jtlL State.
TCJ;=Computer time necessary to process one entry.
Tcr=Computer time necessary to process one inquiry.
Cc=Cost per unit computer time.
Therefore,
where:
Cc=Oost per second of computer time.
The incremental cost equation for storage in the jtIL State is given by:
Case 1:
Case 2:
where:
SIj=File storage size for Case 1 in millions of characters for the jilL State.
S2j=Same for Oase 2.
Cs=Storage cost per million charactell!!':
It is assumecl in the cost model that communications between the State and national systems will be provided on a dedicated line basis by GSA utilizing Telpak lines at standard GSA rates. This cost per line is of the form:
where:
Ot=terminal eost/lille/mon tho
C\=1ine cost/mile/line/montb.
d = toll line distance of the line as given by A. T. &; T .
The number of lines required betweer, the jth State and the national system for the two cases considered are given by:
Case 1:
LI J= (4[( (Eoj+~E"J)r E+ IjTr)]+ 1
Case 2:
L2j= (4J((.b.,'oJ+}E",) TE+ (I oj+.051 aJ)rr) 1 + 1
where:
[x]==Largest integer less Lllan the argument x.
EOJ='l'otal number of entries/month for files other than stolen auto generated in the jth State.
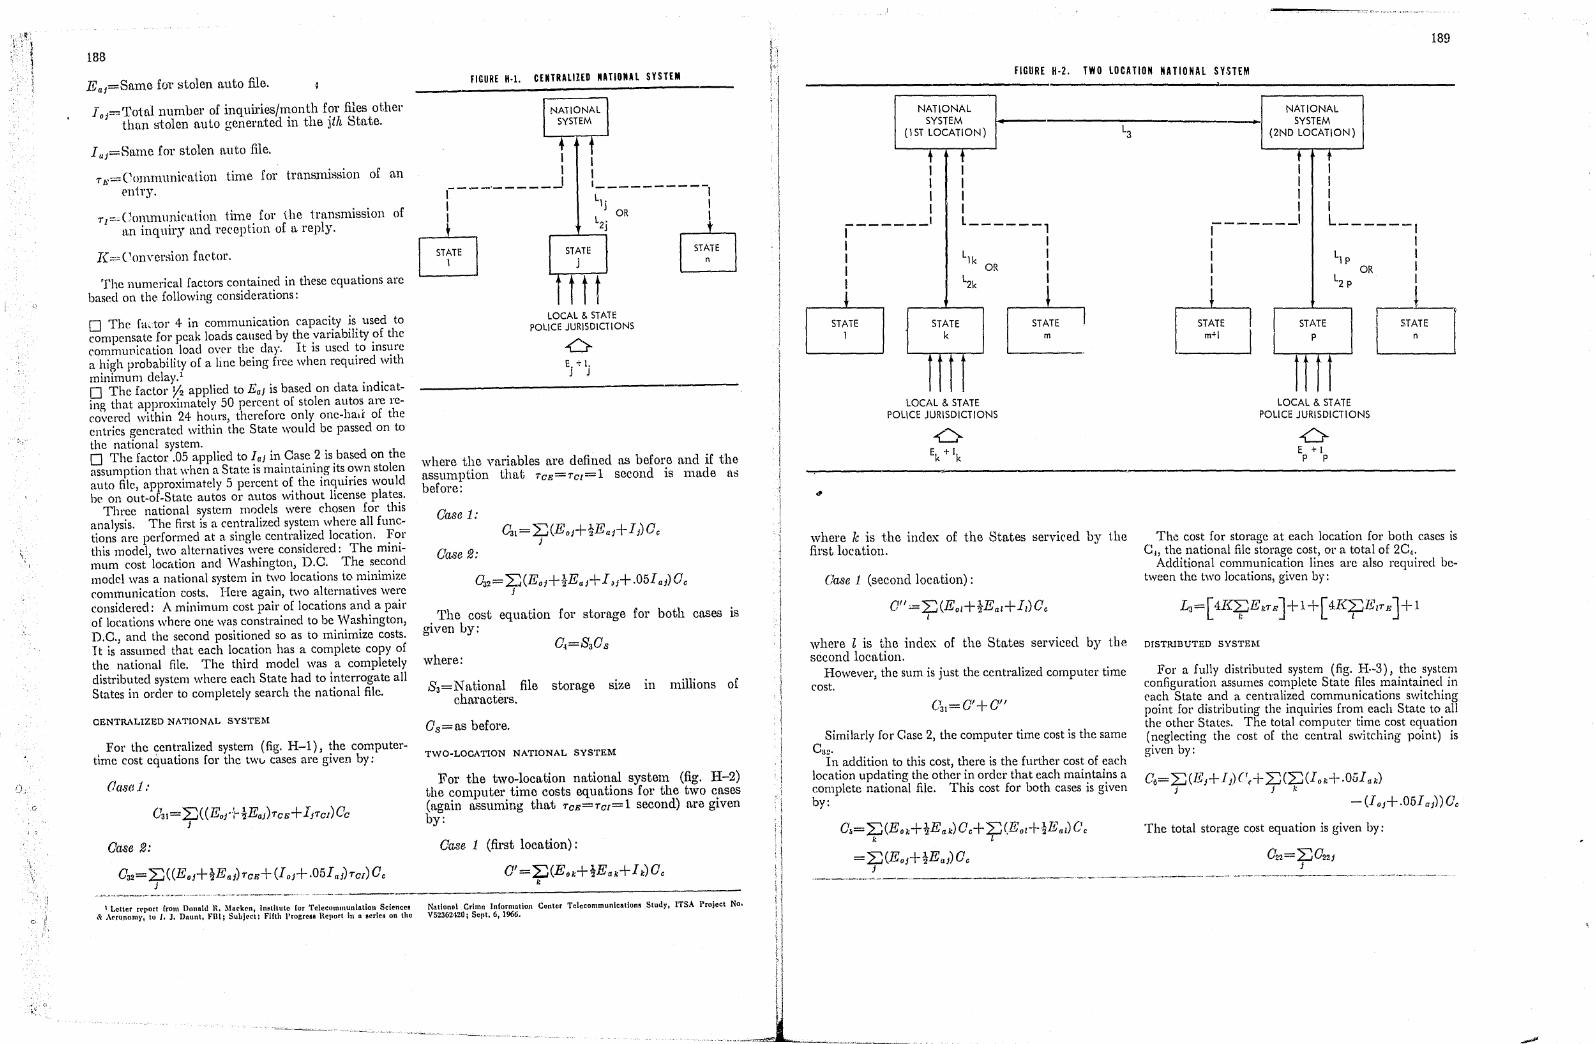
J'
188
EaJ=Same for stolen auto file.
10J=Totul number of inquiries/month for files other thftU stolen auto genemted in the jtlL State.
1 aJ=Same fOl' stolen ILUto file.
T b,=Colllnnmicn.tion time for transmission of an entry.
Tz=-Communictttion time for the transmission of !t11 inquiry and reception of !treply.
K:=:= ('onYCrSiOll factor.
The numerical factors contained in these equations are based on the following considerations:
o The fa,tot' ,} in communication capacity is used to compensate for peak loads caused by the variability of the commul1ication load over the day. It is used to insure a high probability of a line being free when required with minimum delay.l o The factor Y2 applied to Ea} is based on data indicating that approximately 50 percent of stolen autos are recovered within 24 hours, therefore only one-half of the entries generated within the State would be passed on to the national system. o The factor .05 applied to I aJ in Case 2 is based on the assumption that when a State is maintaining its own stolen auto file, approximately 5 percent of the inquiries would be on out-or-State autos or autos without license plates.
Three national system mr)(l('ls were chosen for this analysis. The first is a centralized system where all functions arc performed at a single centralized location, For this model, two alternatives were considered: The minimum cost location and Washington, D.C. The second model was a national system in two locations to minimize communication costs. Here again, two alternatives were considerecl: A minimum cost pair of locations ancl a pair of locations where ont was constrained to be vVashington, D.C" and the second positioned so as to minimize costs, It is assumed that each location has a complete copy of the national file. The third model was a completely distributed system where each State had to interrogate all States in order to completely search the national file.
CENTRALIZED NATIONAL SYSTEM
For the centralized system (fig. H-1), the computertime cost equations for the tWlJ cases arc given by:
(/(V3(J j :
Case 2:
C32= ~«EoJ+tEaJ)TCg+ (I oJ+ .051 aJ)TCI) Cc j
fiGURE H·i. CEIHRALlIED NATIONAl SYSTEM
I I
r---··------I
I \ '----------1 Ll j I I
I
~ OR \
ST~TE L2j B
t t t LOCAL & STATE
POLICE JURISDICTIONS
where the vILriables are defined ILS before and if the assumption that 'iCg=TC[= 1 second is made as before:
Case 1:
Case 2:
C32 = ~(EoJ+tEaJ+l /,+ .051 aJ)Oc J
The cost equILtiol1 for stomge for both cases is given by:
where:
S3=N ILtional file stomge size ll1 millions of cha1'lwters.
Cs=as before.
TWO-LOCATION NATIONAL SYSTEM
For the two-location national system (fig. H-2) the computer time costs equations for the two cases (again assuming that TCg=TC[= 1 second) are given by:
Case 1 (first location):
0' = :E(Eok+tEak+l k)Cc k
\ Letter rrpurt from Donnltl n. Ml1ckl'n, 1n!thute rOT Tclecommunlallon Sciences NRtlon~l Crime Information Center Telecommunications Study, ITS A Project No. ~\ At'runom)" to J. J. Daunt, Io"Bl; Subjrct: Fifth Progrcu He port in 0 aeries on the V52362'l20; Sept. 6, 1966.
189
FIGURE H·2. TWO LOCATION NATIONAL SY.STEM
NATIONAL SYSTEM
(1ST LOCATION)
1 1 1 1
I 1 I 1 _______ 1 L ______ ,
1 1 I 1 I
\ Llk \
OR 1 L2k 1
c:b STATE k
~
C l
LOCAL & STATE POLICE JURISDICTIONS
6-Ek + lk
where k is the index of the States serviced by the first location.
Case 1 (second location) :
Oil = ~(Eol+~-Eal+II)CC I
where l is the index of the States serviced by the second location.
However, the sum is just the centralized computer time cost.
031=C1+C1'
Similarly for Case 2, the computer time cost is the same C32•
In addition to this cost, there is the further cost of each location updating the other in order that each maintains a complete national file. This cost for both cases is given by:
C~= ~(Eok+~Eak)Cc+ ~(Eod·tEal)Cc k I
= ~(EoJ+!EaJ)Oc j
'_._----------NATIONAL
SYSTEM (2ND LOCATION)
1 1 I 1
\--_. ____ 1
I 1 I I
~ ~
STATE p
LOCAL & STATE POLICE JURISDICTIONS
-6 E +, p p
The cost for storage at each location for both cases is G I , the national file storage cost, or a total of 20.,.
Additional communication lines arc also required between the two locations, given by:
DISTRIBUTED SYSTEM
For a f~llIy distributed system (fig. H·-3), the system configuratIOn assumes complete State files maintained in each State and a centralized communications switching point for distributing the inquiries from each State to all the othe~' States. The total computer time cost equation (?eglectmg the cost of the central switching point) is gIven by:
06=~(E}+I})C(+ ~(~(Iok+.O[jJ ak) j j k
-(Io}+.051d)Oc
The total storage cost equation is given by:
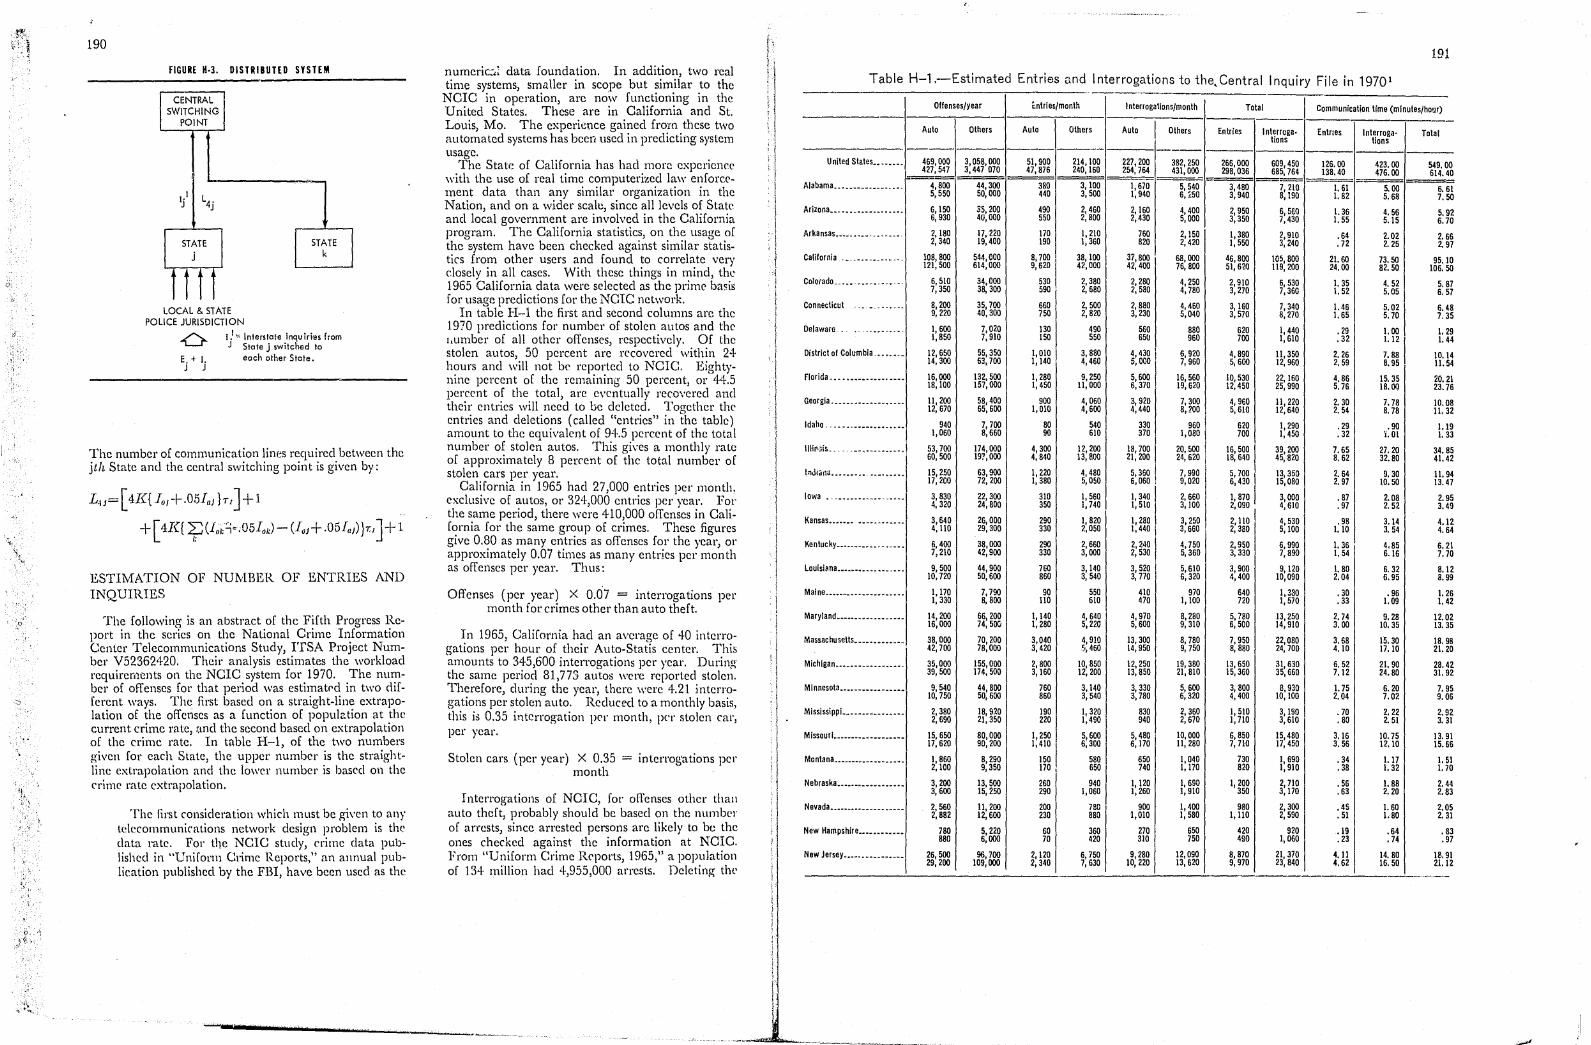
d.
., ,
190
FIGURE H·3. DISTRIBUTED SYSTEM
STATE STATE k
LOCAL & STATE POLICE JURISDICTION
E.t 1. J J
[.1" Interstate inquirills from J State j switched to
each other State.
The number of communication lines required between the jth State aml the central switching point is given by:
LH =[4K{Jo,+.05IaJ }TtJ+l
+[Hq ~(Iok::;e.05fok) - (JoJ+.05IlIJ)}7:1]+ 1
ESTI"NfATION OF NUMBER OF ENTRIES AND INQUIRIES
The following is an abstract of thc Fifth Progress Report in the series on the National Crime Information Genter Telecommunications Study, ITSA Project Number V523624·20. Their analysis estimates the workload requirements on the NCIC system for 1970. The number of offenses for that period was estimatrd in two different ways. The first based on a straight-line extrapolation of the offenses as a function of populz.tion at the current crime rate, and the second based on extrapolation of the crime rate. In table H-1, of the two numbers given for each Slate, the upper number is the straightline extrapolation and the lower number is based on the crime rate extrapolation.
The first consideration which must be given to any telecommunications network design problem is the data mtc. For the NClC study, crimc data published in "Uniform Grime Reports," an allnual publication published by the FBI, have been used as the
numeric:.: data foundation. In addition, two real time systems, smaller in scope but similar to the
NCIC in operation, are now functioning in the United States. These are in California and St. Louis, Mo. The experit:nce gained from these two automated systems has been used in predicting system usage.
The State of California has had more experience with the use of real time computerized law enforcement data than any similar organization in the Nation, and on a wider scalc, since all levels of State and local government are involved in the California program. The California statistics, on the usage of the system have been checked against similar statistics from other users and found to correlate very closely in all cases. With these things in mind, the 1965 California data were selected as the prime ba~ig for usage predictions for the NOTC network.
In table H-1 the first and second columns arc the 1970 predictions for number of stolen autos and the (,umber of all other offenses, respectively. Of the stolen autos, 50 percent arc recovered within 24-hours and will not be reported to NClC. Eightynine percent of the remaining 50 percent, or 4Lk5 percent of the total, arc eventually recovered and their entries will need to be deleted. Together the entries and deletions (called "entries" in the table) amount to the equivalent of 94-.5 pcrcent of the total number of stolen autos. This gives a monthly rate of approximately 8 percent of the total number of stolen cars per year.
California in 1965 had 27,000 entrics per month. exclusive of autos, or 324-,000 entries per year. For the same period, there were 410,000 offenses in California for the same group of crimes. These figures give 0.80 as many entries as offenses for the year, 01'
approximately 0.07 times as many entries per month as offenses per year. Thus:
Offenses (per year) X 0.07 = interrogations pel' month for crimes other than auto theft.
In 1965, California had an average of 40 interrogations per hOlLr of their Auto-Statis center. This amounts to 34·5,600 interrogations per year. During the same period 81,773 autos \\'ere reported stolen. Therefore, during the year, there were 4.21 interrogations per stolen auto. Reduc!:'cl to a monthly basis, this i5 0.35 interrogation per month, pCI' stolen car, per year.
Stolen cars (per year) X 0.35 = interrogations pCI' month
Interrogations of NCIC) for offenses other than auto theft, probably should be based on the number of arrests, since arrested persons arc likely to be the ones checked against the information at NCrC. From "Uniform Crime Reports, 1965," a population of 134· million had 4,955,000 arrests. Deleting the
191
Table H-1.-Estimated Entries and I nterrogations to the, Central I nquiry File in 1970 1
Offenses/year entries/month
Auto Others Auto Others
United States ••••••.. 469,000 3,058,000 51,900 214,100 427,547 3,447 070 47,876 240,160
= Alabama •••••••••••••••••. 4,800 44,300 380 3,100
5,550 50,000 440 3,500
Arizona •••••••••••..••• '" 6,150 35,200 490 2,460 6,930 40,000 550 2,800
Arkansas •••••••• _ ..••••.• _ 2,180 17,220 170 1,210 2,340 19,400 190 1,360
California .•.••••.•.••••.. 108 800 544,000 8,700 38,100 121: 500 614,000 9,620 42,000
Colorado. _'" _ •••.•.•••... 6,510 34,000 530 2,380 7,350 38,300 590 2,680
Connecticut .". -~-~-~-~. 8,200 35 700 660 2,500 9,220 40: 300 750 2,820
Delawaro . .- - --~ -~ .. -- 1,600 7,020 130 490 1,850 7,910 150 550
District of Columbia .•••• '" 12,650 55,350 14,300 63,700
1,010 3,880 1,140 4,460
Florida ................... 16,000 132,500 1,280 9,250 18,100 157,000 1,450 11,000
Georgia •••••••••••.••••••• 11,200 12,670
58,400 65,600
900 4,060 1,010 4,600
Idaho ...•••.••.•••••.•••• 940 7,700 80 540 1,060 8,660 90 610
IIIINis •.....••.•••••••••• 53,700 174,000 4,300 12,200 60,500 19?,000 4,840 13,800
tnJIa.1iIl_ •••• __ ~_. __ ." __ .... 15,250 63,900 1,220 4,480 17,200 72,200 1,380 5,050
Iowa •.. _ ••••••••••..•••• 3,830 22,300 310 1,560 4,320 24,800 350 1,740
Kansas •.••• _ ••••••.•••••• 3,640 26,000 290 1,820 4,110 29,300 330 2,050
Kentucky ••••• _ ••••••.•.••• 6400 7:210
38,000 42,900
290 2,660 330 3,000
Louisiana ••.•••••••••.•.•.• 9,500 44,900 760 3,140 10,720 50,600 860 3,540
Maine ••••••.•••.•••••••••• 1,170 7,790 90 550 1,330 8,800 lIO 6\0
Maryland •• _ •• _ •••.•••••••• 14,200 16,000
66,200 74,500
1,140 1,280
4,640 5,220
Massachu selts ............. 38,000 70,200 3,040 4,910 42,700 78,000 3,420 5,460
Michigan •••••••.•••••••••. 35,000 155,000 2,800 10,850 39,500 174,500 3,160 12,200
Minnesota ••••.•• _ •••.•..• _ 9,540 44,800 760 3,140 10,750 50,600 860 3,540
Misslssippi._ •••••••••••••• 2,380 18,910 190 1,320 2,690 21,350 220 1,490
Missourl. ••••••••• ___ •••••• 15,650 80,000 1,250 5600 17,620 90,200 1,410 I 6: 300
Montana •••.••••••••••••••• 1,860 8,290 150 580 2,100 9,350 170 I 650
Nebraska •••••••••• _ ••••••• 3,200 13,500 260 940 3,600 15,250 290 1,060
Nevada ••••••••• __ ••••••••• 2,560 11,200 200 780 2,882 12,600 230 880
New Hampshire ••••••••••.• 780 5,220 60 360 880 6,000 70 420
New Jersey •••••••• _._ ••••• 26,500 96700 2,120 6750 29,200 109: 000 2,340 7: 630
Interrogallons/month Total
Auto I Others Entries Interroga. lions
227,200 382,250 266,000 609,450 254,764 431,000 298,036 685,764
1,670 5,540 3,480 7,210 1,940 6,250 3,940 8,190
2,160 4,400 2,950 6,5€O 2,430 5,000 3,350 7,430
760 2,150 1,380 2,910 820 2,420 1,550 3,240
37,800 68,000 46,800 105 800 42,400 76,800 51,620 119: 200
2,280 4,250 2,910 6,530 2,580 4,780 3,270 7,360
2,880 4,460 3,160 7,340 3,230 5,040 3,570 8,270
560 880 620 i,440 650 960 700 1,610
4,430 6,920 4,890 11 350 5,000 7,960 5,600 12: 960
5,600 16,560 10,530 22,160 6,370 19,620 12,450 25,990
3,920 7,300 4,960 11,220 4,440 8,200 5,610 12,640
330 960 620 1,290 370 1,080 700 1,450
18,700 20,500 16,500 39 200 21,200 24,620 18,640 45: 820
5,360 6,060
7,990 9,020
5,700 6,430
13,350 15,080
1,340 1,510
2,660 3,100
1,870 2,090
3000 4: 610
1,280 3,250 2,110 4,530 1,440 3,660 2,380 5,100
2,240 2,530
4,750 5,360
2,950 3,330
6,990 7,890
3,520 5,610 3,900 9 120 3,770 6,320 4,400 10: 090
410 970 640 1,330 470 1,100 720 1,570
4,970 5,600
8,280 9,310
5,780 6,500
13,250 14,9\0
13,300 14,950
8,780 9,750
7,950 8,880
22,080 24,700
12,250 13,850
19,380 21,810
13,650 15,360
31,630 35,660
3,330 3,780
5,600 6,320
3,800 4,400
8.930 10,100
830 2,360 1,510 3, ISO 940 2,670 1,710 3,610
5,480 10,000 6,850 15,480 6,170 11,280 7,710 17,450
650 1,040 730 1,690 740 1,170 820 1,910
1,120 1,260
1,690 1,910 1, ~~~ 2,710
3,170
900 1 400 980 2 300 1,010 1: 580 1,110 2: 590
270 650 420 920 310 750 490 1,060
9,280 10,220
12,090 13,620
8,870 9,970
21,370 23,840
Communication lime (minutes/hour)
Entnes Interroga-lions
126.00 423.00 138.40 476.00
1.61 5.00 1.82 5.68
1.36 4.56 1.55 5.15
.64 2.02
.72 2.25
21.60 73.50 24.00 82.50
1.35 4.52 1. 52 5.05
1. 46 5.02 1.65 5.70
.29 1.00
.32 1.121
2.26 7.88 2.59 8.95
4.86 15.35 5.76 18. (1)
2.30 7.78 2.54 8.78
.29 .90
.32 1.01
7.65 27.20 8.62 32.80
2.64 9.30 2.97 10.50
.87 2.08
.97 2.52
.98 3.14 1.10 3.54
1.36 4.85 1.54 6.16
1. 80 6.32 2.04 6.95
.30 .96
.33 1.09
2.74 9.28 3.00 10.35
3.68 15.30 4.10 17.10
6.52 21. 90 7.12 24.80
1.75 6.20 2.04 7.02
.70 2.22
.80 2. 51
3.16 10.75 3.56 12.10
.34 1.17
.38 1. 32
.56 1.88
.63 2.20
.45 1. 60
.51 1. 80
.19 .64
.23 .74
4.11 14.80 4.62 16.50
Total
549.0 o o 614.4
6.6 1 50 7.
5.9 2 o 6.7
2.6 2.9
6 7
95.1 o 50 106.
5.8 6.5
6.4 7.3
1.2 1.4
10.1
9 4
11.5
ZOo 21 6 23.7
10.0 11. 3
1.1 1.3
9 3
34.8 41.4
11. 94 7 13.4
2.9 3.4
4.1 4.6
6.2 7.7
8.1 8.9
1.2 1.4
12.0 13.3
2 4
2 9
18. 98 o 21.2
28.4 2 92 31.
7.9 9.0
2.9 3.3
13.9 15.6
1.5 1.7
2.4 2.8
1 o
2.0 5 31 2.
1~,.
83 97
91 2 21.1
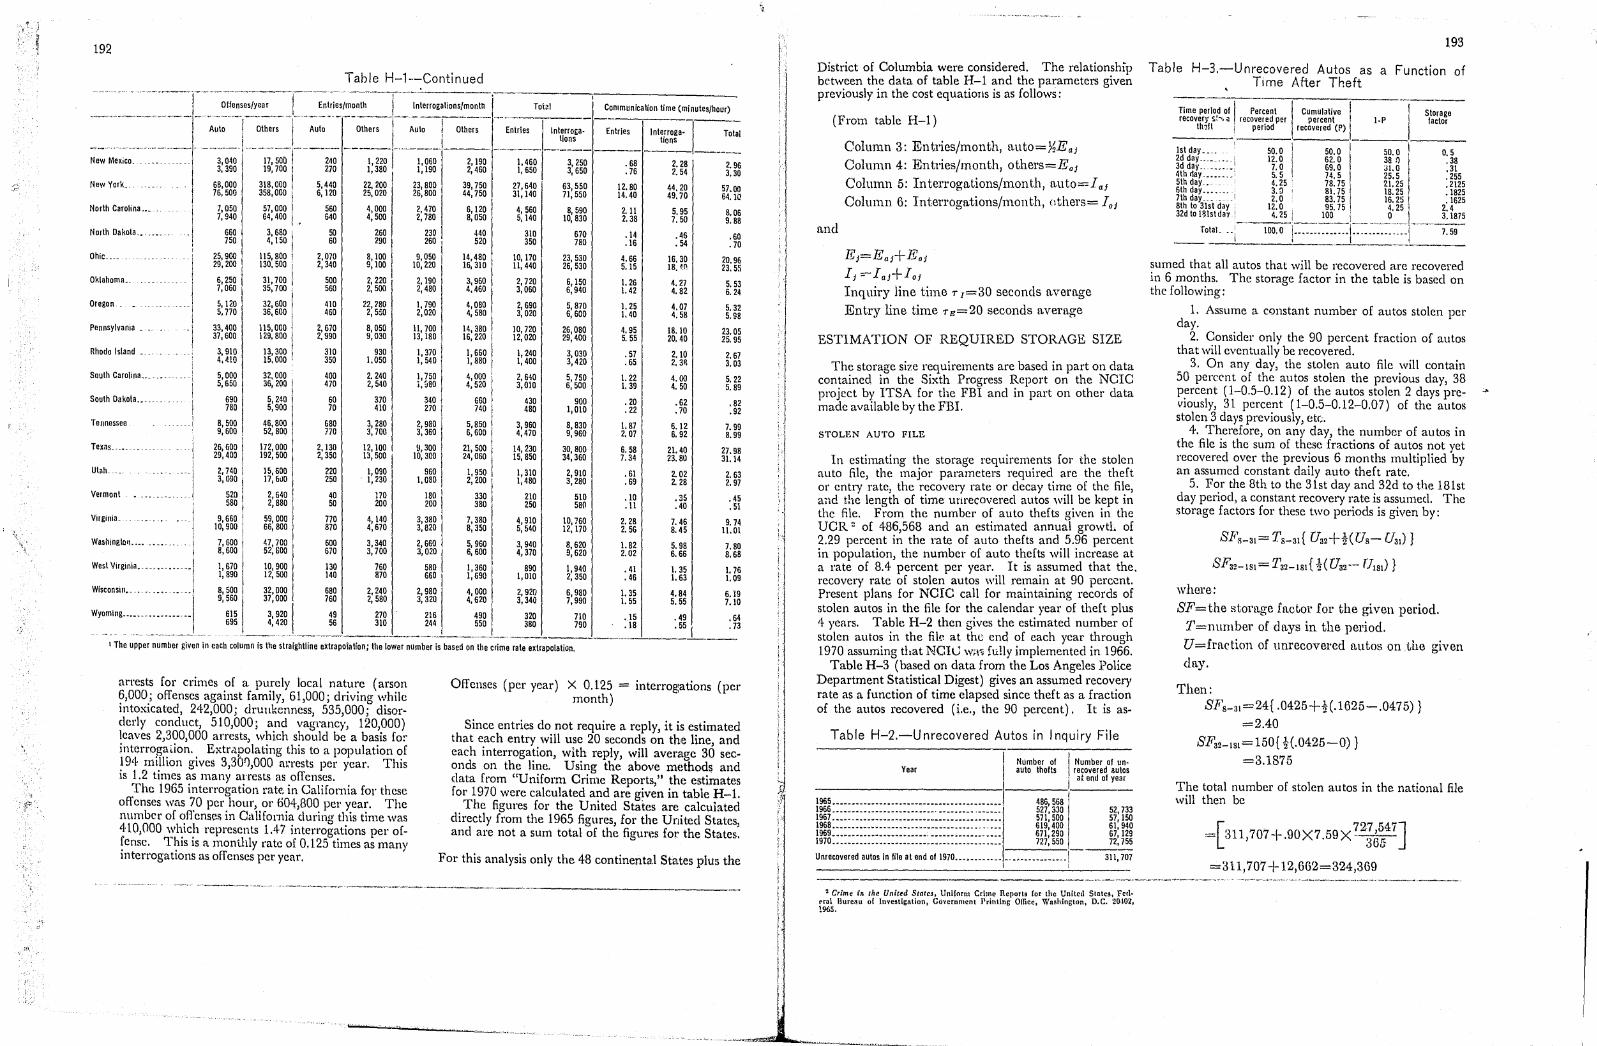
.,
, , ;.!l
192
Table H-1--Continued
.........• ····-··--·!--·-·;f~~;~:;;;--I~··~~l~~s/m~~-· --lnlerrOgalions/monlh j Tot21 Communication time (minutes/hour)
--.. - ... -.-.- .. - .. -- -·-A:t;··-·!-~~:;s- -l'·~t~·· --O~ --A:t-o -!-O~:-- --~~ries Interroca· Entries Inlerroga'l Tolal
I lions tions -_ ....... --. .. ... -I .- -'--'1-'--'- ---j" -------'''------------.--New Mexico. 3,040 17,500 240 1,220 1,060 2,190 1,460 3,250 .68 2.28 2.96
3,390 19,700 I 270 1,380 I 1,190 2,460 1,650 3,650 .76 2.54 3.30
New York.. 68,000 318,000 5,440 22,200 23,800 39,750 27,640 63,550 12.80 44.20 57.00 76,500358,000\ 6,120 25,020 26,800 44,750 31,140 71,550 14.40 49.70 6UO
NorthCarolina.... 1,050 57,000/ 560 4,000 2,470 6,120 4,560 8,590 2.11 5.95 8.06 7,940 64,400 640 4,500 2,780 8,050 5,140 10,830 2.38 7.50 9.88
NOlth Dakota.. 660 3,680 50 260 230 440 310 670 .14 .45 .60 750 4,150 60 290 260 520 350 780 .16 • 54 .70
Oklahoma..
Oregon .
Pennsylvania ..
Rhode Island ....
South Carolina... . ....
South Dakota .•...
Tennessee
Texas.
Utah ...
Velmont
Vilginia.
Washingtoq ....... .
West Virginia ............. .
Wisconsin ............... ..
Wyoming ................. .
25,900 29,200
6,250 7,060
5,120 5,770
33,400 37,600
3,910 4,410
5,000 5,650
690 780
8,500 9,600
26,600 29,400
2,740 3,090
520 580
9,660 10,900
7,600 8,600
tl5,800 130.500
31,700 35,700
32,600 36,600
tiS, 000 129,800
13,300 15.000 .
32.000 . 36,200 I 5,240 5,900
46,800 52,800
172,000 192,500
15,600 17,600
2,540 2,880
59,000 I 66,800
47,700 52, SOO
2,070 8,100 2,340 9,100
500 2,220 560 2,500
410 22,?80 460 2,550
2,670 8,050 2,990 9,030
310 930 350 1.050
400 2.240 470 2,540
9,050 10,220
2,190 2,480
1,790 2,020
tI,700 13,180
1,370 1,540
1,750 i, ftao
60 370 340 70 410 270
14,480 15,310
3,960 4,460
4,080 4,580
14,380 16,220
1,660 1,880
4,000 4,520
550 740
10,170 11,440
2,720 3,060
2,590 3,020
10,720 12,020
1,240 1,400
2,640 3,010
430 480
~ ~~ ~~ ~~ ~~ m ~~ ~B ~B ~m
2,130 12,100 9,300 21,500 14,230 2,350 13,500 10,300 24,060 15,850
220 1,090 960 1,950 1,310 250 1,230 1,080 2,200 1,480
40 170 180 I 330 210 50 200 200 380 250
770 4,140 3,380 I 7,380 4,910 870 4,670 3,820 8,350 5,540
600 3,340 2,660 I 5,960 3,940 670 3,700 3,020 I 6,600 4,370
1,670 10,900 130 760 580 1,360 890 1,890 12,500 140 870 660 1,690 1,010
~~ ~~ ~ ~m ~~ ~~ ~m 9,560 37,000 760 2,580 3,320 4,620 I 3,340
615 3,920 ! 49 270 216 490 320 595 4,420 56 310 244 550 380
.... -~ ..... - .. _------_._.--'.---
23, 530 26,530
6,150 6,940
5,870 5,500
26,080 29,400
3,030 3,420
5,750 6,500
900 1,010
8,830 9,960
30,800 34,360
2,910 3,280
510 580
10,750 12,170
8,620 9,620
1,940 2,350
6,980 7,990
710 790
I Tho upper number given in each column is Ihe straightline extrapolation; the lower number is based on the crime rate extrapolation.
4.66 5.15
1. 26 1. 42
1.25 1. 40
4.95 5.55
.57
.65
1. 22 1,39
.20
.22
1,87 2.07
6.58
1 7.34
.61
.59
.10
.11
2.28 2.56
1. 82 2.02
.41
.46
1.35 1.55
.15
.18
16.30 18 ... ~
4.27 4.82
4.07 4.58
18.10 20.40
2. \0 2. 3~
4.00 4.50
.52 • 70
6.12 6.92
21. 40 23.80
2. 02 2.28
.35
.40
7.46 8.45
5.98 6.66
1. 35 1.53
4.84 5.55
.49
.55 I
20.96 23.55
5.53 6.24
5.32 5. sa
23.05 25.95
2.67 3.03
5.22 5.89
.82
.92
7.99 8.99
27.98 31. 14
2.63 2.97
.45 .51
9.74 11.01
7.80 8.58
1. 76 1.09
6.19 7.10
.54
.73
arrests for crimes of a purely local nature (arson 6,000; offenses against family, 61,000; driving while intoxicated, 242,000; drullkcnness, 535,000; disorderly conduct, 510,000; and vagrancy, 120,000) leaves 2,300,000 arrests, which should be a basis fo; interrogaLion. Extr,l.polating this to a population of 19'~ million gives 3,301),000 arrests per year. This is 1.2 times as many aIt'ests as offenses.
Offenses (per year) X 0.125 = interrog:ations (per month)
The 1965 interrogation rate. in California for these offenses was 70 per hour, or 604,800 per year. The number of ofTense~ in California during this time was 410,000 which represents 1A7 interrogations per offense. This is a monthly rate of 0.125 times as many interrogations as offenses per year.
Since entries do not require a reply, it is estimated that each entry will use 20 seconds on the line, and each interrogation, with reply, will average 30 seconds on the line. Using the above methods and data [I'om "Unifolm Crime Reports," the estimates for 1970 were calculated and are given in table H-l.
The figures for the United States are calculated directly from the 1965 figures, for the United States, and are not a sum total of the figul'\~s for the States,
For this analysis only the 48 continental States plus the
I I
: I : I i I 'I J , 1
~ I
J 1
District of Columbia were considered. The relationship between the data of table H-1 and the parameters given previously in the cost equations is as fol\ows:
(From table H-l)
Column 3: Entries/month, auto=}6Eai
Column 4: Entries/month, others=Eoi
Column 5: Interrogations/month, anto=Iai Column 6: Interrogations/month, othel's= Ioi
and
Ej=Eai+Eoj I j =- I ai+loi Inquiry line time 71=30 seconds average
Entry line time 78=20 seconds average
ESTlMATION OF REQUIRED STORAGE SIZE
The storage size requirements are based in part on data contained in the Sixth Progress Report on the NClC project by ITSA for the FBI and in part on other data made available by the FBI.
STOLEN AUTO FILE
In estimating the storage requirements for the stolen auto file the major parameters required are the theft or entry 'rate, the recovery rate or decay time of the file, and the length of time unrecovered autos will be kept in the file. From the number of auto thefts given in the UCR 2 of 486,568 and an estimated annual growtl. of 2.29 percent in the rate of auto thefts and 5.96 percent in population, the number of auto thefts wil\ increase at a rate of 8.4 percent per year. It is assumed that the. recovery rate of stolen autos will remain at 90 percent. present plans for NCrC can for maintaining records of stolen autos in the file for the calendar year of theft plus '~years. Table H-2 then gives the estimated number of stolen autos in the fil~ at the end of each year through 1970 assuming that NCI0 W;\~ fu!Jy implemented in 1966.
Table H-3 (based on data from the Los Angeles Police Department Statistical Digest) gives an assumed recovery rate as a function of time elapsed since theft as a fraction of the autos recovered (i.e" the 90 percent), It is as-
Table H-2.-Unrecovered Autos in Inquiry File
Year
1965 .......................................... . 1966 .......................................... . 1967 .......................................... . 1968 ••••••••••••••• _ .......................... . 1969 •••••••••••••••••••• _ ...................... . 1970 ....................................... ""
Number of I Number of un· auto thefts recovered autos
I al end of ye:..,
486,568 527,330 571,500 619 400 671: 290 727,550
52,733 57,150 61,940 67,129 72,755
311,707 1-----:
Unrecovered autos in liIe at end of 1970 ............................ !
'l Crime IOn. the United Statc,s, Uniform Crlme Reports tor the United States, Fed. t'fal Bureau of hn'C5licntion, GO\'crn01cnt Printing Office, Washington, D.C. 20,102, t965.
193
Table H-3.-Unrecovered Autos as a Function of Time After Theft
Time period of I Percent ! Cumulative I recovery $!", a I recoveled per percent I
th1ft i period recovered (P) I·P
Storage factor
1st day.... . 50.0 II 50.0 50.0 0.5 2d day ........ , 12.0 62.0 38 n .38 3d day ........ ' 7.0 69.0 :l1.0 .31 4thrlay ........ : 5.5 74.5 25.5 .255 5th day...' 4.25 . 78.75 21. 25 .2125 6th day. ..... 3.0 ' 81.75 18.25 .1825 7th day.....1 2.0 83.75 16.25 1 . 1625 8th to 31s\ day: 12.0 . 95.75 . 4.251 2,4 32d to l~lstda'l i 4.25 i 100 i 0 3. 18i5
rota!. .. : 100.0 1===r:=:::~~:-=T-~-7:59-
Slimed that all autos that will be recovered are recovered in 6 months. The storage factor in the table is based on the following:
1. Assume a constant number of autos stolen per day.
2. Consider only the 90 percent fraction of autos that will eventually be recovered.
3. On any day, the stolen auto file will contain 50 perccnt of the autos stolen the previous day, 38 percent (1-0.5-0.12) of the autos stolen 2 days previously, 31 percent (1-0.5-0.12-0.07) of the autos stolen 3 days previously, ete; .
4. Therefore, on any day, the number of autos in the file is the sum of these fractions of autos not yet recovered over the previous 6 months multiplied by an assumed constant daily auto theft rate.
5. For the 8th to the 31st day and 32d to the I8Ist day period, a constant recovery rate is assumed. The storage factors for these two periods is given by:
SPS-31 = TS- 31 { U32+H U8- U31 ) J
SF32-1S1=7~2-1Sd HU32 -- TI1S1)}
where:
SF=the stol'l1.ge factor for the given period.
T=nllmber of days in the period.
U=frn.ction of unrecovered autos on the given day.
Then: SFS- 31 =24{ .0425+H·1625-.0475)}
=2.40
S]i~2_181=150{ H.0425-0)}
=3.1875
The total number of stolen autos in the national file will then be
=[311 1707+.90X7.59 X 72;6~,47J
=311,707+12,662=324,369
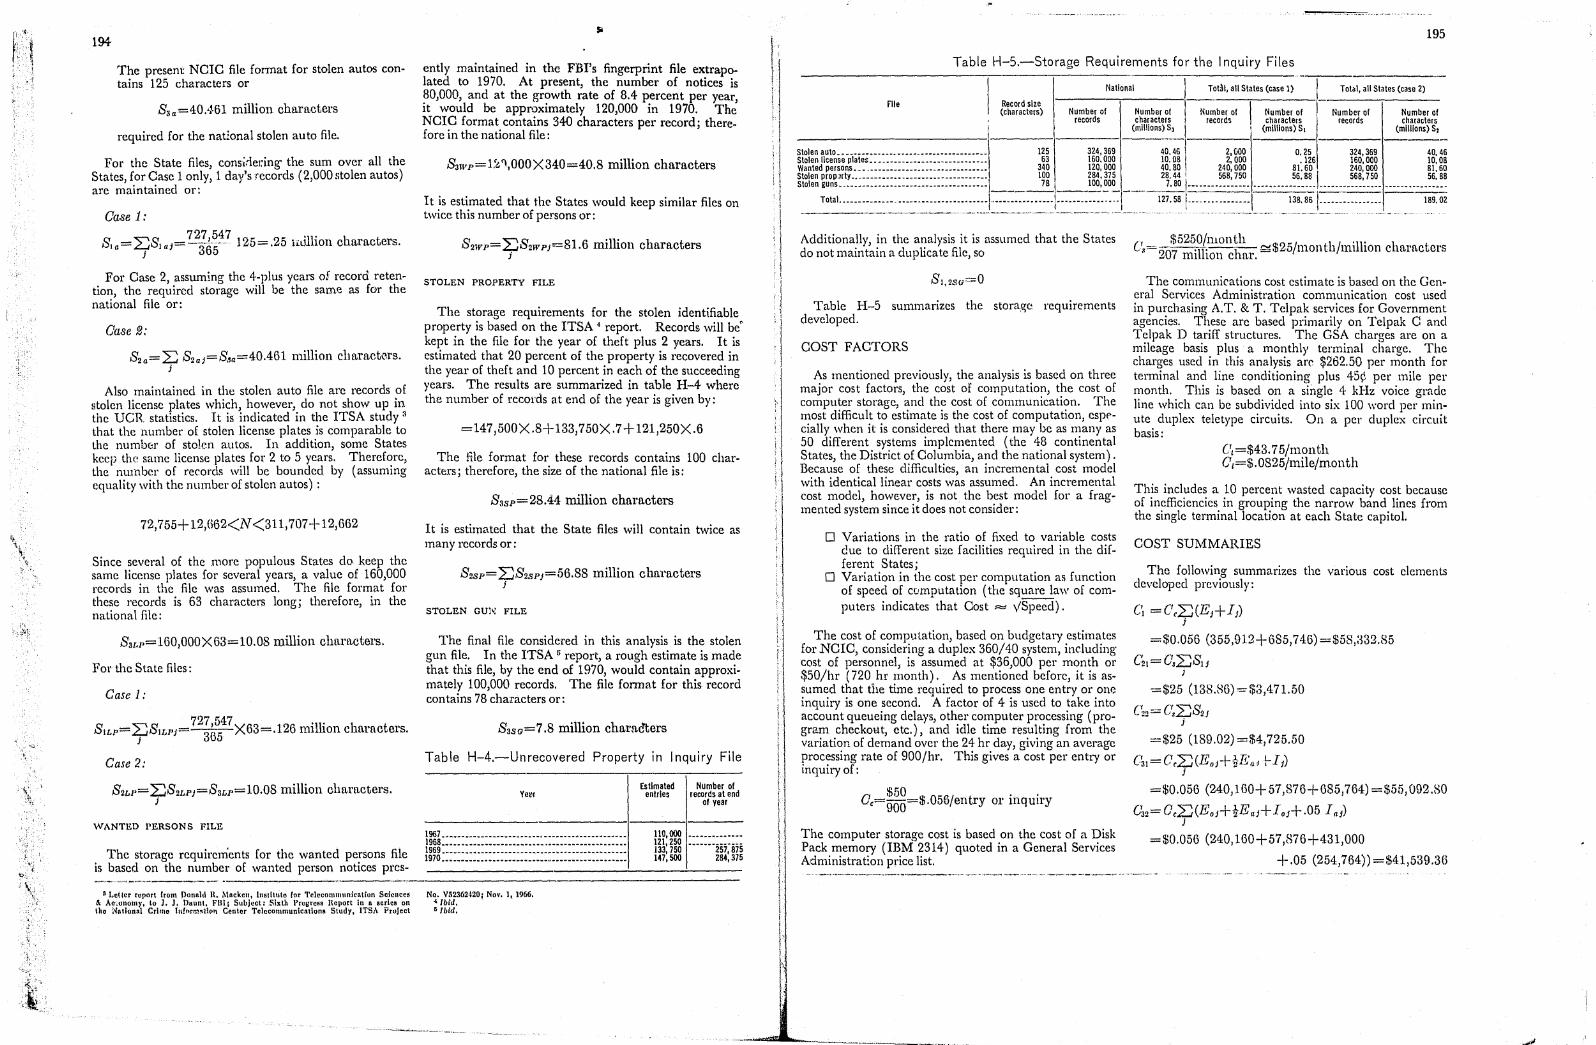
f~"t . 1
,
\,
't?~
;\': 1i "
194
The present NCIC file fonnat for stolen autos con· tains 125 characters or
83a=40.'~61 million characters
required for the national stolen auto file.
For the State files, consi:!edng the sum over all the States, for Case 1 only, 1 day'stecords (2,000 stolen autos) are maintained or:
Case 1:
8 ""8 727,547 12- 25' ill' h ·t la=4 laJ=-36K- b=. lil. IOn c arac ers. )
For Case 2, assuming the 4.plus years of record reten· tion, the required storage will be the same as fO'r the national file or:
Case 2:
82a= ~ 8 2aJ=8"a=40.461 million characters. j
Also maintained in the stolen auto file are records of stolen license plates which, however, do not show up in the UCR statistics. It is indicated in the ITSA study 3
that the number of stolen license plates is comparabJc to the numb"r of stolen autos. In addition, some States keep the same license plates for 2 to 5 years, Therefore, the number of records will be bounded by (assuming equality with the number of stolen autos) :
72,755+ 12,G62<N <311,707+ 12,662
Since several of the more populous States do keep the same license plates for several years, a value of 160,000 records in the file was assumed. The file format for these records is 63 characters long; therefore, in the national file:
8 31,1'=160,000X63=10.08 million characters.
For the State files:
Case 1:
727,547 'n' h t 8 1LP= ~81I'PJ 365 X63=.126 ml Ion c arac ers.
Case 2:
WANTED PERSON S FILE
The storage requirenients for the wanted persons file is based on the number of wanted person notices pres·
:I Letter report front Ponnltl H. Mncken, Institute for 'l'eleconnl1unicntion Sciences &. AC'.ol1omYt to 1. J. Daunt, FBI; Subject: Sixth Progress HCllort in n 8eries on tho Natlonnl Crimo 111!flrm~Hrm Center TelecomDlunications Study, ITS A Project
ently maintained in the FBI's fingerprint file extrapolated to 1970. At present, the number of notices is 80,000, and at the growth rate of 8.4 percent per year, it would be approximately 120,000 in 1970. The NClC format contains 340 characters per record; there. fore in the national file:
8 3WP=1.'t,'\000X340=40.8 million characters
It is estimated that the States would keep similar files on twice this number of persons or:
8 21VP= ~821Vpj=81.6 million characters j
STOLEN PROPERTY FILE
The storage requirements for the stolen identifiable property is based on the ITSA 4 report. Records will be" kept in the file for the year of theft plus 2 years. It is estimated that 20 percent of the property is recovered in the year of theft and 10 percent in each of the succeeding years. The results are summarized in table H-4 where the number of records at end of the year is given by:
=147,500X .8+ 133,750X.7 + 121,250X.6
The Hie format for these records contains 100 char· acters; therefore, the size of the national file is:
8a8P=28.44 million characters
It is estimated that the State files will contain twice as many records or:
8 28P= ~828PJ=56.88 million characters j
STOLEN GUN FILE
The final file considered in this analysis is the stolen gun file. In the ITSA 5 report, a rough estimate is made that this file, by the end of 1970, would contain approxi. mately 100,000 records. The file fonnat for this record contains 78 characters 01':
838G=7.8 million charaCters
Table H-4.-Unrecovered Property in Inquiry File
1967 •••••••••••••••••••••••••.•••••••.••••••••••••• 1968 •••••• " •••••••••.••••••••.•••••••••••••••••••• 1969 ••••.•••••••••••••••••••••••••••••••••••••••••• 1970 ............................................... .
No. V52362·120; Nov. J. 1966. <Ibid. • Ibid.
Estimated Number of enf,rles records at end
of year
m;m ............. . 133, 750 ·······257~m 147,500 284,375
195
Table H-5.-Storage Requirements for the Inquiry Files
National I Tot3l, all States (case 1) Total, all States (case 2)
Number of Number of I Number of I Number of Number of Number of File Record size
(characlers) records characters records characters records characters
(millions) 5, I ~ (millions) 51 (millions) 51_
-St-ol-en-a-ul-o .-.'.-.-•• -•• -.-.. -•• -•• -.-•• -•• -.• -•• -.-•• -•• -.. -.-.. -•• -••. 1----12-5-1---3-24-, 3-69-1----4-0'-.4-6 \ 2,000 O. 25 324.369 40. 46
Slolen license plale~... ........................... 63 160.000 10. 08 2,000 . 126 160,000 10. 08 Wanled persons... ............................... 340 120,000 40.80 240, 000 81.60 240,000 81.60 SlolenpropJrly................................... lOa 284,375 28.44 I 568,750 56.881 568,750 56.88 Siolen guns ...................................... ____ 7_8 __ 100,~0~ ----~l ................................................ ==~
TOlal. ................................ ~~:~=.-..=:.-=:.::=~~~~-.::.-.. J ___ .127~58 ....•...• ~~:.-=:. ____ 13~.~~L.~.:::......... 189.02
Additionally, in the analysis it is assumed that the States do not maintain a duplicate file, so
Table H-5 summarizes the storage requirements developed.
COST FACTORS
As mentioned previously, the analysis is based on three major cost factors, the cost of computation, the cost of computer storage, and the cost of communication. The most difficult to estimate is the cost of computation, espf'· cially when it is considered that there may be as many as 50 different systems implemented (the 48 continental States, the District of Columbia, and the national system) . Because of these difficulties, an incremental cost model with identical linear costs was assumed. An incremental cost model, however, is not the best model for a frag. mented system since it does not consider:
o Variations in the ratio of fixed to variable costs clue to different size facilities required in the dif· ferent States;
o Variation in the cost per computation as function of speed of computation (the square law of com· puters indicates that Cost ~ \/Speed).
The cost of computation, based on budgetary estimates for NCIC, considering a duplex 360/40 system, including cost of personnel, is assumed at $36,000 per month or $50/hr (720 hr month). As mentioned before, it is as· sumed that the time required to process one entry or one inquiry is one second. A factor of 4 is used to take into account queueing delays, other computer processing (pro· gram checkOl:lt, etc.), and idle time resulting from the variation of demand over the 24 hr day, giving an average processing rate of 900/hr. This gives a cost per entry or inquiry of:
C $50 ° / .. c=900=$. 56 entry or mqUlry
The computer storage cost is based on the cost of a Disk Pack memory (IBM 2314) quoted in a General Services Administrat:oll price list.
$5250/month .. (),= "07----;-1-1.--~1- ~ $25/111on th/lmlholl characters . ~ ml 1011 c U1,I'.
The communications cost estimate is based on the Gen· eral Services Administration communication cost used in purchasing A.T. & T. Telpak services for Government agencies. These are based primarily on Telpak C and Telpak D tariff structures. The GSA charges are on a mileage basis plus a monthly terminal charge. The charges used in this analysis arr $262.50 pel' month for terminal and line conditioning plus 4S¢ per mile per month. This is based on a single 4· kHz voice grade line whieh can be subdivided into six 100 word per minute duplex teletype circuits. On a per duplex circuit basis:
Ct =$43.75/month Ct =$.0825/mile/month
This includes a 10 percent wasted capacity cost because of inefficiencies in grouping the narrow band lines from the single terminal location at each State capitol.
COST SUMMARIES
The following summarizes the various cost elements developed previously:
01 =Cc~(EJ+lj) j
=$0.056 (355,912+ GS5, 7 46) =$58,a32.85
C21=C;~81j j
=$25 (138.86)=$3,471.50
C22=Cs~82J j
=$25 (189.02)=$4,725.50
C~I=Cc~(Eoj+?JE:a; !-I j ) j
=$0.056 (240,160+57,876+685,764) =$55,092.80
032=Cc~(EoJ+tEaJ+loj+.05 I aj) j
=$0.056 (240,160+57,876+431,000
+.05 (254,764)=$41,539.3H

,j
~, "
,~
'\:..
I
I
~, .
" ','
196
0, =O.Sa
=$25X (127.58)=$3,189.50
O~ =Oc~(Eorf-~EaJ) j
=$0.056 (240,160+57,876) =$16,690.02
06 =OC{ 2:(Ej+IJ) + ~(2J(Iok+.05Iak) 1 j k
-(1oj+.05 I a,)}
=$O.056{ (355,912+685,746)
+48(431,000+.05 (254,76~)}
The cost of communication is the only cost which is a function of the choice of location (s) of the national file. Because of the particular form of the equations and the need to minimize the sum, these costs had to be computed by means of a computer program. The results are summarized below:
07 =min2:(Ot+Old j)Ll} J
=min2:($43.75+$.0825 clj)LJj j
=$7,909.60 (Location: Springfield, Ill.)
(}s =min2:(O,+O/dj)kJ j
=$6,909.14 (Location: Springfield, Ill.)
Go =min [t2: (Ot+0/ch)L1k } k
+ {~ (Ot+O/d/)LJl } + (Ot+0/d k /)L3]
=$7,071.38 (Locations: Harrisbmg, Pa.-Denver, Colo.)
Olo=m,in [{~ (Gt +G/dk)L2k }
+ {fJ (Ot+O/d/)L21 } + COt+Old k1)L3 }]
=$6.257,12 (Loc!1tions: Harrisburg, Pa.-Denvel', CoLJ.)
Gll=min:8 (Ot+Old j )L41 j
=$112,420 (Loc!1tion of switching center: Spring. field, Ill.) ,
These costs are summarized for various locations in tables H-6, H-7, and H-8. The total systems costs for the various alternatives are summarized in table H-9.
The lowest national and total system cost occurred for a centralized system located at Springfield, Ill. (Case ~I' However, there would be an increase of only $840 per month if the location were moved to Washington, D.C, Since other costs such as facilities, staffing, and adminis· trative control would far outweigh this, these computations would indicate that any other city, including Wash. ington, D.C., would be as good a choice for the location of the national system. These computations do show that, within the assumptions, it would be best if the States maintained their own stolen auto file. This cloes not mean nec:essarily that the national system could not pro·
Table H-6,-Communication Costs for Centralized Inquiry Systems ---_. --.~~~--~------.--.,------.,------~--------------~---.-,'---
Centralized system Total number of line miles
Communica· tions costs
(C,) Centralized system
Total number of line miles
Communica, tlons costs
(Ca)
--------------------------,-----------·-------11,------------·-----------------1---------1---------Case 1 ({,1=72) ................................. .
sprlngfieldr
111.. •••••••••••••••••••••••.••••• Indlanapol 5, Ind ........................... " Jefferson City, Me ••••••••••••••••••••••••••.• Madison, Wis ............................... . Washlngten, D.C ............................ .
57,692.1 58,235.4 59,222,4 60,232.9 69,471.6
;7,909,60 7,954.4Z 8,035.85 8,1\9.21 8,881. 41
Case 2 (L,=63) ................................ . Springfield, III .............................. . Indianapolis, Ind ............................ . Jefferson City, Mo •••••••••••••••••••••••••••• Madison, Wis ............................... . Washington, D.C_ ........................... .
50,338. I 50,670.7 51,639.9 52,499.2 60,512,1
Table H-7,-Communication Costs for Two Locations for Centralized Inquiry Systems
6,909.14 6,936.58 7,016,54 7,Q87.43 7,748.50
-.--.--------------;----------;------;------;------;------.,.---'--I
Two·locatlon centralized syslem \ Tolal number of line miles Communications cost
Number of Interconnecting
lines (L3)
Number of Interconnecting
line miles
Interconnecting communications
cost
------Case H~r~~h~7i.) p';:: Denver; cOIo::::::::~:::::::::: I···· ....... 'j7; 4 7S: 5············ ··-$6; 24 i: 8 i····1 5 •••• j; 403: 82···· · .. ··$829: 5]"···
Columbus, Ohlo·Sacramento, Caliv. ............. , 34,101. 8 5,963.40 6 12,258. 1 1,273.79 Indianapolis, Ind.·Denver , Colo •.•••• ' ......... l 39,693.3 I 6,424.69. 6 I 5,988.32 756.54 Washington, D,C.·Sactamento, Calli ............ ,' 37,300.0 6,227.27; 6 14,217.7 1.436,46
Case ~as(~~~8~l~:~:·~~~~~~ ~o!~:: ::::::::::::::: :1' ............ :~: ~~~: ~ ................ ~~ ~~~: ~~ .... 1' ...... -~........ . ... ~ ~ ~~ ~:~~ .......... ~:~: ~~ ... . H~rrlsburg, Pa.·Denver, Gelo................... 32.379.4 5,427.55 5 7.403.82 829.57 ColumbUS, Ohlo.Sacramento, Calif. .............. 30,320.6 5,257.70 6 12,258.1 1,273.79 IndlanapQlls,lnd.·Denver,Colo", .............. \' 34,272.8 5,583.75 I 6 5,988.32 756.54 Washington, D.C.·Sacramento, Calif ............. 33,080. a I 5,485.35 6 1 14,217.7 I 1,435.46 Washlng~~n~~.:.~:~~IO· .. •• .. ••••••• .. ·1 32,550.0 I 5,441.62 i 5 (7,442.87 832.79
Total communications
cost
(CI) $7, 071. 38 7,237.19 7,181,23 7,662.73 7,107.02
(CIO) 6,257.12 6,53U9 6,340.29 6,920.81 6,274.41
Table H-8,-Communications Costs for Decentralized Inquiry Systems
Location of switchingcenter(L,= 1073) Total number of tine miles
Communica· liol's cosl (CII)
197
which have not been taken into account, would far out\\:eigh any differente calculated here. from the point of VIew of system reliability, although two locations mig-ht have some small advantages, a single location can be m;de more than sufficiently reliable for this application.
i Springfield, III.................................. 793,652 I Indianapolis, InL............. ................. 797,369
$ll~, 120 The decentralized system suffers from the major problem that all States must process the inquiries of all other States and the resulting communications and administrative ~osts are high. Admittedl)" this is an extreme case, but It illustrates the problem of trying to provieb a national capaHlity without a centralized national system, On the other hand, if the States were interested in maintaining only information of concem to themselves without a~ly national exchange, the costs would be essentially that gIven as the State costs fot' a Case 2 situation, i.e., about $63,000 per month.
I Jellerson City, Mo .............................. _ 814,565 J Madison, Wis.............. ............. ••• ..... 833,294
11 w_a_Sh_ing_to_n,_D._C._ ... ~ •• ~: ... ~~~~_-•• _.~,"~.:~'-~ .... ~.~61,598
llt.,1.21 114, J4'i !l5,690 126,275
\1 11 f I 11 II Ij
II lj 11
II II , I h 11
II 1-'1 I'
I I-
I 1 I,
I II r
I (I
I t
! 1
vide this service for some interim period 01', in the case of smaller States, for an indefinite period.
For the two-location system, the majOl' difference in cost was the cost attributed to each of the two information centers updating each other. If this cost were re~ moved by assuming that such updating was accomplished during times of low demand (in effect reducing the size of the computer required for meeting the peak demand), the centrali?ed system is slightly less expensive, since the savings in communications by having two or more centers would be more than offset by the increase in storage costs. The additional administrative costs of the two locations,
This cost model is admittedly crude and docs not take into account such items as the ratio of fixed to variable costs, the relatively high cost per operation for small computers, and data conversion costs. It is indicative, howe\'er, of the magnitude of the costs and the relative costs of the several system alternath'es investigated.
Table H-9,-Total Costs for I nquiry Systems
-'-~---._ .... ----------T-~--~_ -_,-_Na_tl_Dn_a_1 c_osts per month
I Communica. I All States, costs per month ___ I;~~,,_.
I I 'i ! tion system I Centralized system (location,' Springfield, III.):
Case 1. .................................. $7,909.60 Case 2 •••••. _ ••••••••••••••••• _ .......... 6,909.14
Centralized system (toealion, Washington, D.C.): Case I .................................... 8,881.41 Case 2 .................................... 7,748.50
Two location s~stem (locations,' Harrisburg, Pa. and Denver, 010.):
Case I .................................... 7, 071. 38 Case 2 ............................... _ •••.• 6,257.12
Two location system (locations, Denver, Colo. and Washington, D.C.):
Case 1 .............................. _ ••••• 7,107.02 Case 2 ............ _ ....................... 6,274.41
Decentralized system: Case 2 ••••••••••• _ ........................ 126,276.00
Computer operating
$55, 092. 80 41,539.36
55,092.80 41,539.36
71,782.82 58,229.38
71,782.82 58,229.38
~---'" .. -- .. ----.-
Computer storage
$3,189.50 3,189.50
3,189.50 3,189.50
6,379, 00 6,379.00
6,379,00 6,379.00
--- ........ -- ...... _-
Total Computer ) C~"puter : I Nalional and operating I storage I Total States, costs
I . 1
$66,191. 90 I 51,638. 00
67,163.71 I 52,477. 36
85,233.20 70,865.50
$58,333 .86 86 58,333.
58,333, 86 .86 58,333
58,333. 58,333.
86 86
85,268. 841 58,333. 70, 882,79 58,333.
126,276. 00 1,251,101.
86 86
13
) ____ I __ ~-~~
$3,471.50 4,725.50
$61,805.36 63,059.36
$127,997.26 114,697.36
3,471. 50 61,805.36 \28,969.07 4,725.50 63,059.36 lIS, 536. 72
3,471.50 6\,805.36 147, 038. 56 4,725.50 63,059.36 133,924.86
3,471.50 61,805.36 147,074.20 4,725.50 63,059.36 133,942.15
4,725.50 1,255,826.63 1,382,102.63
I Includos estimates of stolen property and Wanted persons files not maintained on nalionallevel.
Notes: Estimates are for 1970. Functions Included are stolen auto and license plates, stolen idenlifiable property, gUns,
and wa nted persons. , Minimum cost locations. . Case I: States do not maintain stolen auto file beyond 24 hours.
Case 2: Slates do maintain stolen auto file beyond 24 hours.
--, -~---, ~---~~,
\

I' iT'
-------------~------------------------------
I· I' (~
,: \ !;
Appendix I
DATA ANALYSES AND SIMULATION OF COURT SYSTEM IN THE DISTRICT OF COLUMBIA FOR THE PROCESSING OF FELONY DEFENDANTS
by Joseph A. Navarro and Jean G. Taylor
Contents
Introduction ........... , ..................................... , . , . . . . . . . . . . . . . . . . 199 The D.C. Court System for Processing Felonies ................ , . . . . . . . . . . . . . . . . . . . . . 199 Elapsed Time for Processing of Felony Defendants in the District of Columbia Court System. 201 Simulation of the Processing of Felony Cases in the D.C. Court System. . . . . . . . . . . . . . . . . 207
In chapter 4, the Task Force study of the processing of felony defendants in the District Court for the District of Columbia is summarized. This appendix provides more detailed description of the court statistics and the simulation model. To provide continuity in the appendix, certain parts of the summary in chapter 4-have been repeated here.
INTRODUCTION
For years judges, lawyers, and court administrators have been grappling with the problem of delay. Many solutions have been tried but found wanting. Some have been rejected out of hand; others, obvious to a management expert, either have not been thought of or have been deemed too disrupting for the anticipated improvement. A test of any proposed solution might require considerable disruption of court operations and a vast expenditure of time 3:nd energy which might prove worthless. Courts could be helped appreciably if means were developed for accurately analyzing the causes of delay and then pretesting alternative approaches to reducing delay.
The Task Force has explored the feasibility of computer simulation of court operations to meet this need. Briefly, a simulation model is a representation of the system and its operations which can be used to examine the effect of changes in the system.1 In the courts, simulation could provide a means for examining methods for expediting the processing of defendants through the system. Further, simulated pretesting provides a first estimate of the effects of proposed changes on resources, workloads, and delays. This process allows the administrator to test alternative allocations of resources and find the combination which balances delay reduction against expended resources.
The simulation developed here required, as all simu-
I Simulation h .. been uoed eucc.solully by Ih. mllilary and Indu8try lor planning anti for evalullting various courses or aCllon.
2 Decause of the many differences amonR the court systems in the United StateR, Ih. I .. k lorce examined only I court In dclail, Ihe U.S. Dlslrlcl Courl 01 Ihc 01,. Irlct 01 Columbia. The melhodology, howevcr, is applicable 10 any jurisdiclion
lations do, first, a description of the system being simulated; and, second, collection and analysis of data describing court operations. Only then could the model be constructed and manipulated. Thus the work was cond ucted in three parts:
1. The organization and structure of the trial court system for the District of Columbia 2 and its procedures for processing felony defendants were described.
2. The available data on felony defendants in the District Court were analyzed to determine the distribution of total time to disposition, time intervals between major events in the system, potential areas of delays, and possible causes.
3. A simulation model of the processing of felony defendants in the District of Columbia trial court system was developed which:
a. Operated like that observed in the data (i.e, to produce the average time intervals between steps in the process similar to those observed in the data) .
b. Could be manipulated to investigate possible organizational or procedural changes in the system and to measure their impact on reducing delay and on the available resources in the system.
In this analysis neither the substantive law nor the use of improved business practices were addressed.
THE D.C. COURT SYSTEM FOR PROCESSING FELONIES
The U.S. District Court for the District of Columbia (referred to hereafter as the District Court) is unique·. in the Federal system because it has jurisdiction over all felonies committed in the District of Columbia. It
which can collect adequate data about It" pr.~aent operational Hcrcaher, the term "District Courl" io usco for convenience; it should be
underslood tha, 'hi' relcrs ollly 10 Ihe U.S. Dlelrlcl Courl I"r Ihe DI,trlcl 01 Co. lumbll1 ano not the other Federal district courts.
199

,j
,l
I.
"f
\ • 1
'. \ ,
'., • ,. I"
200
FIGURE 1.1. STEPS IN PROCESSING OF FElONY DEFENDANTS
COURT OF GENERAL SESSIONS U.S. COMMISSIONER
1 ASSISTANT U.S. I U.S. BRANCH (I COMMISSIONER)
ATTORNEYS (7-10) (I JUDGE)
PRELIMINARY J J SCRfENP-lG PRESENT-
~~ MENT HEARING
'--
\ J PRESENT- PRELIMINARY} I-
-I MENT HEARING
----------------------1----------------No papered by A"istant U. S. Attorney.
Referred as misdemeanor to Court of General Sessions.
MEANS OF EXIT Felony charge reduced to Removed. misdemeanor.
No proboble couse. FROM SYSTEM Dismilled by Assistant U.S. Attorney.
10 A' t t U S Attorney, Grond Jury Division, spends 2-4, I~ours on Tuesdays ond Thursdays 01
U ~~. ~~~~~sSiO~C;'S oHice £0\ prelimin~ar~y~h~e=ar~i~ng~S~a~n~d~d_:s~pa_s_'I_'o_n_o_f_c_o_se_s _. ______________________ _
is not confined, like other Federal courts, to Federal crimes such as tax evasion and fraud. It als~ processes felonies which would ordinarily b~ handle.d 1l~ a S~ate court. Further, because the court IS oper~tmg m ~ l<.edera I jurisdiction, the procedure followc~ .m all cnmll1al cases is that of the Federal Rules of Cmmnal Proced;lre and the interpretation of these rules by tl;e court.~ Slm~ ilarly, Federal legislation such as the Ball Reform Act and the Criminal Justice Act G apply to all ~ases.. .
The first step in the development .of a sUTlUlatlOTl .1S a description of the court system. TIllS must be des~nbe~ in terms 'of the flow of defendants and th? flow of mfmmation through the system, and the asslgnrnent of the courl resoll rces (judges, courtr~oms, attorney~, etc.) to the various events associated With the processll1g of the defendants,. .
The various steps and the asSOCiated rcsources for pro~-essing felony defendants, in. the. District ?f Col~'mbla court system 0 are shown m slmphfie? form 111 figule 1-1. The first step is presentment,7 wh~ch occurs bef?r? a judge of' the Court of General SesslOns (the mumc1pal ('OUI:t of the District of Columbia) ,8 or the U.S. Com-
II For t'XllIllllir ~;'III;ory v. United Statc!, 35,i U.S. ",'9 (1957). i Ballllel""" 'An 01 1966, 1', \,,119·465, HI U.S,C. 31>16-3152, ~ Crlml,,"1 JII,He" Act 01 1961, 78 :llilt. 522, III U.S.C.A. 300M. B Only Ihal 1'111'1 01 Ihe m'lriel "I Coillmhia rOllrt sy.tclII I'crllll"lug to 1/'0
proco .. illU 01 felony ell'o' I. 1""I"dc.l; Iho," pllrl, Ihal d".1 .xclu.l"ely with m ,. t\(,U\l'lHH)(15 nrc uat CXBlI1tl1cd. II d I
T Thl. 15 Ih" frrst Judlcl.1 '1'1'.II",nc(, and ha, been "arlously ea c pr",enlmen, Initial presentm.nl Inltl.1 nppearance. Or prclln,ln.ry arr.lsnment. Under Hulo 5, rederal n"l .. of Cr\r"lnal Procedure, this appeorance must b. "without ~nllcec •• .nry ,Ielny". IlIlerpreted to Illeali lIIuch le08 th.n M hours (01/al/ory". Un lie Stale._ 3M U,S. ,1,19 (1957)). I GIS
• Tho struoture lind opcratloll of the U.S. Ilraneh 01 the Courl a .lIct. 08' • Ions h.\'o beell de.crlbed In d"lnll by: Harry I. Snbln. "Criminal JU811ce In • Mclropolltan CoUrI' The I'ro .... III" 01 SOriOIlS Criminal CM •• In Ihe DI,trIet 01 Colunthin Courl 01 belleral S" .. lons," omca of Crirlllll.1 Justice. U,S, Dcparlmenl
missioner. Both are available for presentment a!ld re-liminary hearing in felony cas~s. Presentment IS 0 ten
receded by a review or screenll1g of the case by an A~~stant U.S. Attorney (Court of General SessIOns DIvision). He determines whethe~' to reduce th~, felony charge to a misdemeanor, t? termll1ate ~he case ( no papering") or to proceed With prosecutlOn.
In 1965, the U.S. Branch 0 of the Court of General Sessions handled approximately 12,000 defendants. Abou t 5 200 of these were arrested on a felony charge. In addition, the U.S. Commissioner received about 1,100 felony defendants. From among these 6,300 persons ~rrested for a felony charge, about 2,000 were h~ld for aC;lOn by the grand jlllY (i.e., the defe~d~nt had el~her WaIved preliminalY hearing 01' the prehmll1ary hearmg had led to a f\nding of probable cause to hold the accused for grand jury action) .10
A case is next processed in the office of the U :S. At-, torney (Grand Jury Un~t). It is sc:eene~l ~g~;n I~~~ calendared for presentatlOn to t?e glan~ JUlY· .. grand jury votes an indictment If th~r~.ls _~~ncul~cnce
• _~~. __ .T-~" .• "-~~.-~--<-- ........ -- ~ .. --- t
of Justice. W"shlllglon, u.Cc·, OClobtGI%6~1 Sc .. lons Iltocc .. ,,101.110110 u[ 1II1I1I1el· II Other branches of the ourt ffo. ;l1cr osccutcd by the CorlJOrlltlon Counsel {or
pnt orttlullncl's and other petty 0 ellS':! I'r .Iho lIlolrlcl uf Columbln, f' •. I yenr 1965 and so do nol rcnecl preclsely .. Itt Ftgures nrc based on dnill 10lll 11seR t
~IO currenl .Ituntlon. b I I d by dc.lh shnll be proseculed by Indici. 11 "An olll'n~\\ which mti)' c pun S Ie i rlsonment (or u term cxcecdll1~
1I1elll. An offell.e which InlaY11
bl', .t'unlshc~I~J L;P Indlclment, or 11 IndletlllClll I. I yoar or .t hard I.bor • In I, pro.ec A II offellse may be prosecuted wah'cd, it ma)' be pro"ecUlcd by Inlorm.lIolI. rna ,~~r be riled W\lhaul lea"e of by Indltlman, or by Inlormatloll. t\lInh\lor;'("j 0) A"~II.ble District 01 Columbln cou,t." (F .. <I. Rul.s UII Srll,"o' Pro~;;l o~ ~ltc ieiony ,le(clI<lalllo wni". cran,1 Jury dal. \ndlt.I.' lI,ol all l' 0- ller • In,lIol'mollt.
h I' i I {I [1 \ . :\1 \~
\ 1 '\ I i
I \
\
! \
1
\
I I
201,
. _.
GRAND JURY U.S. DISTRICT COURl
ASSISTANT U.S. I (1 GRAND JURY) ASSISTANT U.S. I CRIMINoI..L COURT (4-5 JUDGES) 2
., ATTORNEYS (3) ATTORNEYS (13)
r-~ SEN'ENCINO I H SCREEN & ~RAND JURY .~ PREPARE & 1-1 INDICTMENT I-I ARRAIGN-I
PREPARE CONSIDERS REVIEW I-- RETURNED MENT MOTIONS
INDICTMENT
r GUILTY I • PLEA I
---------------------- ------------------------------------Certified as misdemeanors to Court of General Sessions.
Ignoramus,
Dismissed by Assislanl U.S. Attorney.
2 The number of judges assigned 10 Criminal Courl increased 10 7 in 1966.
of 12 or mOlf.l of the jurors,12 Thereafter, the indictment is signed by the foreman and by the U,S. Attorney and returned (generally on Monday) in open court.
Arraignment is the next step. It is in general a perfunctory proceeding in which the accused appears/I is aclvised of the formal charge and enters a plea-usually not guilty. At about this time the case is assigned to an Assistant U.S. Attorney who will probably handle it until final disposition, and a defense counsel is appoinLed by the court for a defendant who cannot afford counsel.
Following arraignment) trial preparation pro('eeds, motions are filed and heard, the case is placed on a cal enda!' 11 and finally progresses to trial. Of the defendants disposed of in 1965, only about 30 percent completed the final step of trial; approximately 55 percent pleaded guilty to the offense charged or to a lesser offense prior to or during the trial. The remaining 15 percent of the defendants were dismissed.
J:1 Tho incllclnu.'nt is I)rcpurt.'d hy n clerk in the U.S. AHorne),'. office, proof. rl.'nd hy l'uch or lho tlttel' AssistAnt U.S. Attort1rys, And rcvi~w('11 bv hoth th(' Chid iii~li:I\~,~.t 01 Iho Grand Jury Unit and Ihe Chief A .. lslnnl "I Ihe.Crimln,,1 Tri.1
ta Derc;>udunhl ill the DIstrict of Columhln nr€' not u8uullr uoHlietl by Ihe l'omL uf Iheir hul1etn",nl. 11 Ihe d"londnllt Is III Jnll. II", Jllilor I, nol\lit·d 10 \lro<lurr II", tlclendal1t on the dRY or nrrnignlUt.·nt. If lilt" deflltHlant hl on Illon{'y hond, his bontismAn is notlfi('lI to prOthf:"(' lht' ,left'UtlllUt. Othcr\\ iSli. the dl.'rc;>utinnl IltUs1 tt"HI it In til£' newlll.Aper nUtl RPllcar. If Itt' dm's nOI IlPIH'Ar, It ht'lH'h wllrrant III 1~!\1It'(1 fur hi/i. nnt'st
H Cnltmdnr systCIlIK vary wilh jurisdiction. "11l1 sysh'IU pr('scl1tly used in the District Court plnces All CQM('l:( 011 n tnltsh.lr f.·nlcndar as 80011 as the tndictllH'nt Is returneu; !vhen motions ure cOl11ph,'lcd or tht' ltruu to fih.' mot inns has explrlld. the lmSe {", /llacl'd on tho rt'St'r\'O cllll'rlllnq nlHi. finnlly, wlll'l1 all impedhnt.·nhl Brc fl.'. moved c,g., defendant's mcntal exam ('CJm}JII!tcd, nil witnl'KSC" urc avnllnbl<", loh
Dismissed.
Acquitled.
Transferred.
ELAPSED TIME FOR PROCESSING OF FELONY DEFENDANTS IN THE DISTRICT OF COLUMBIA COURT SYSTEM
Data collected for the D.C. Crime Commission were analyzed to ('<;timate the elapsed time ill processing defendallts through the District Court.15 While these data were probably the most comprehensive ever collected in a c!'iminal court system they still had some limitations.
First, the data were collected from the criminal jackets (or records) of the felony cases which were commenced in the District Court in ,calendar years 1950, 1955, 1960, and 1965.10 Felony cases which, one way or another, were reduced to misdemeanors and prosecuted in the Court of General Sessions are thus excluded.
Second, the clata measure the days, weeks or months between various stages of the criminal process. The detailed data on the hours and minutes required to pC'rform C'ach step of the process were not available .
UIIUJ,!WK l'UII1J11t\h\tl), t111' ('"!It' IH 1'111('('11 on Iht' r('ully cnll"ntlar. CR)!t'S II1l\y then b,. 5('h(·tiuh'll ror trial a('coruinG to \'arloU! Jlrlorit'~a. Ca!ilcs where defClHlnnls nrt' In JltH I1rl.' sl'}U:'du!c(1 ilht'nd ot thost' Oil huH; lht'sc. in turn. IlTt' sl'lH'llu\t·d III urliN of dull' of iudt('lllll'rlt pr()\'itiing tlulTt· ilt 110 ('onflh't o( prOlll'('utillg ntlorn~y!. Thhl "y,h'lIl was J111111e111l'l1tNi il1 Inte 1966 •
11\ Thral' tlnln an. Ullin' full)' nlllil)"1.1.,t! In n fl'}lort IIGollrl Or-NuttOIlI': Dilln Annlf"" on,l SllIIulalion 01 Iho Prarr.slng 01 rclony Drl('n,l.nl. In the TrIlil Cuurt ~YKtCJ1l uf th~ District of Culumhin" In 1.ceparntiol1. TIll' rrpnrt will b~ 11\,I1i1nhll\ from th,' Clt.·lirin~hull!lc of Fl'dl'rnl ~l'l(,lItirir ttllli 'J'N'hnh'nl Inf.lrtlHlllnn or 1111' Nuttutlnl HllrCnl1 of Slnntlltrd~.
111)965 IIAtn is IlnrtInlly JnCUnlplt'll\ hN'RUI4I! all ('tUn'S tOlllllwnCl'tl In 19()a \\'l'1{" IHlt rom"hll{, hy tht.' tin\!' of tim Iintn ('ullHtlon in May 1966. :\vl'rngl' linWK lor 1965 nrc thcrt'lore sOI1l~whl1t und~r8IRh·d bl'(,'nu~!{' sume of tl)(1 \'loty 1011", tinH'K nft' lHH In Ih(, s81Ilplt'.

, if f
;~ ,
\
202
FIGURE 1·2, DAYS BETWEEII UREST AND ARRAIGNMENT STEPS IN PROCESSIIIG OF FElONY DEFENDANTS· 1965
8 N = 32 X=11
r----- 50% = 0 80% = 22
10(J% = 92
N '" 65
~ "6 -=-r I NFORMATIONl 5~ : 10 ___ ., X " 13 _ =-r- 80% " 0
50%=0 100% = 38
N = 279
80%" 2B 100% e 42
e N = 50B X" 40 RETURN OF
N" 1060 X" 10 5( " 8 DAYS
E&50"k = o DAYS 80% " I DI>>Y
100"k = 218 DAYS
50% " 80% "
100% "
50"k = 33 _ GRAND JURY I- 50% = 4 80"k = 54 INDICTMENT 80% = 11
100% = 178 100% " 369
N'" 500 X" 54
~ _______ ;_ 50% = 42 y,--------... 80% = 72
O \~·w "Ma)(lmum number af days recommended by the Administration of Justice Task Force,
N c. Number of defendants with bath dates of steps recorded in criminal file jackets,
lZ "Number of days (arithmetic mean) belwcen steps for the N defendants,
50% "50th percentile or median, The time for 50% of the N defendants exceeded or fell below the median,
<9 N=90 X" 13
50% '" 4 80%" 19 100%" 143
ARRA1GNMr.NT
BO% "80th percentile The time fur 20% of the N defendants exceeded or 80% fell below the median,
100% "The max Imum time abserved of the N defendants,
Finally, it should be noted that the District Court handles a vcr)' small proportion of criminal cases, In the District of Columbia there were approximately-150,000 nonlraffic adult arrests in fiscal year 1965, but only about 6,300 adult persons were a\'l'ested on felony charges, Only 1,603 of those came before the District CoUt't; the other 4',700 either had their cases reduced to a misdemeanor charge, no papered, or otherwise dropped,li
The median time for trial court disposition of cases commenced in 1965 was 5,5 months, For non trial disposition, the median was +,5 months."" The observed times between the various stnges of the process arc shown on Hgure 1-2, The median intervals are summarized in table 1-1.
The obsclved time betweel~ processing stages can be compared to the model timetable H\ proposed by the Ad-
U' "lll' (I"lil iUU\)Y81l S thl\\ {UUlh\' 1If(' lll\st"d on 1.550 of thr 1,603 deft'Olltlnts. Flit~·.'hr('c tlt-f:<OIII1I1\tI were not Included due tu ('nora tn trnn!lpol51n~ the tJatll Irol11 Ih. "rlmll1nl JIICkcI 1o Ihe dnln bn.c,
"Tlu' ,Inln Inr 1950, 1955, n,ul 1%0 Were nllnly"cd In Ihe .ame wny no Ihe 1965 ,In'n hut not llfcecntcolt hern hrCR\lfic thl' court Mructurc nlHI ulH,,'ratloll
ministration of Justice Task Force, That Ta~k Fotce concluded that the procc~sing of criminal cases takes too long and recommended a model timetable (table 1-2) with a maximum of ·1, months from arrest to trial court disposition, Figure 1-2 shows that the observed times in the collected data are appreciably longer than those in the \'ccommended timetable,
In order to compare the processing times in the collected data with the model timetable and find causes of delay, a more detailed analysis of the data is necded, For examp I!', do time intelvals at each step in the process \'ary substantially when different statistical measures of tin1(' (e,g" mean, median, or 80th percentile) are used? Are there substantial variations in processing times £01' persons indicted as distinguished from persons against whom informations were filed? Do these vary depending on whether the case is presented in the Court of Genera! Ses-
tlltrlng those Ill'riod" nrc known 1n less detail 00,1 h-ence tho data lulerpr~tn.lion b ICb_ nH~linlngftll. These dntn nrc avallahle {rom ths [n81ilute {N Dclcnse Analyses.
1U Tha model ;!molnbl. lor lelony ca.e. I, <11001\ ... ,1 on pp, lM-Hi5 of Ihe Com· minion'! rCllOrt.
203
------~~-----------~-\!V N" 91 X " iDB DAYS
50% " 92 DAYS 80"10 " 154 DAYS
]01)'0{, ..,. 316 DAYS
N" 23 X = 113
CONVICTION (JURY TRIAL)
8 --50% " 106---_-"
80% = 180 CONVICTION
(NONJURY TRIAL)
N", 724 X =35
50% 5338 -[-S-E-N-T-EN--'.,e] 80% _ CIN?_ 100% = 232
100':" 418 N = 622 X" 78
50% 64 -'---.-li j--i 80% := 124 .. GUILTY PLEA
100% " 4(,3
N" 67 X" 140
50% = 120 - ___ --1 __ 1
BO% " 215 100% :0. 424
N = 14 X = 136
50% '" 1 06 ___ --I~
BO% = 200 100% 315
N:- 256 X'" 103
ACQUITTAL (NONJURY TRIAL)
50% " 78 - ____ ........ 1
80% " 155 100% " 372
-------------------------------------
Csions~s ~ distinguished from presentment to th V S i ommlssloner? e "
: 1 ,T~e l1l~i1erical value ~f t~1e time interval between stages i was, ou~ to depend slgmficantly on whether me . ) I mecitan tIme statistics were used '1'1 an 01
'1 median at ever ..', le mean exceeded the (I t 'I, ' Y s~ep ~f, the jJlOcess between arrest and : I l'Ia 01 nontJ'lal diSpOSitIOn (fi y J 2) Th' , ' i' indicates that the d' t ,'b' g,.:-, 15 difference ,! ' I, ' IS \I utlOns of tnnes are skewed posi; i l1ve}, that IS, there are some very high values i e wh'l ,1 most cases are dealt with in a r'elatl'vel ' '" 1 1 e 'j t' f '. . y narrow range of 1 F~~'~i1~'~w cases take very ~nllch longer time to process, i I the modelo~~~~~~etl~~ :nfdtandvahlues are compared with \, th d [ ,I IS olin t at about 50 percent of lJ: m~de~ ti~~~~~ ar~ belling proc~ssed in accordance with the ! , e a a prearraignment stages of the Jr _ r ess e~cept [0: the s,tal?e between preliminar hearinl (c, ! I p:esentment If prehmll1~ry hearing is waiveJ) and i!dic~~ I 1 . Tho srealest proportion 01 I ' I Indlelmanl The 40 da • whl prea"a gnmenl hme Is 'pent awallins relurn 01 I lu~slQntlQny In excess ~f the c~ec~l!~~: 3cdween trescnt.ment and indictment arc { I" Because some of the times betwee~l e max mum time of 3-7 days. J f~nGd they Were checked against the 1966 at~!~i~n a:~ arraignment aeemed unduly I un, In lael, wllh Iho promulgnlion 01 I I . n no .Ignific"nl dillerence was ! ocn eruninal rule 87 some times ha\'~
~en~,20 Ho,.vever, if one looks at the amount o[ time reqUlred to process the 80th percentile defendant 11 t '
Off tthhe projcelss, are 2 to '} times longer than thc n~a:in~~~~ o e moe e tlllletable,21
The time interval between arrest and ' d' [l d' d " JI1 Ictment was o 111 ~o e~end ,strongly on where presentment occllrred, T~1e,ptOcessll1g tune [or c,;tses presented to the V,S, Com-miSSIoner was usually longer than pr'ocessl'11g t' f ' , . , Ime Ol' cases 1I11t1at,ed In the Court of General Sessions (table 1-3) , If tl:el'e IS no pr,eliminary hearing, the median time bet~\'een plesel:tment m the Oourt of General Sessions and imlict-ment IS 39 days, and 58 days when the V S C ,',' h dl h ' , " ommlSSloner
an es t e case" If the;e l~ a preliminary hearin , time ?et\~een the heal'lng and mdlctment among cases in1tiated 111 eIther the Court of General Sessions Ot' the V S C
" '34 d " 0111-miSSIoner IS aysi however, the median intelval be-
aelunlly Incren.ed. Speeifleally In 1966 2 a defendanl i. held lor aciion by' 11 weeks tap,e between Ihe limo when his cnse is presented to the grand 'u . 10 grnn jury and the time when tho indictment IS returned in a en c~lIrr1' another 2 weeks usunlly elapse before day,; therealler Ihe rul. aUow~ 8-12 da a~thou~~l On ?cca,ion, il only require. 6 rather than the" days observed in 1965 Jnta~ebieen ltldlctmcnt and nrrRfgnmcnt
~ -,-,--~~~-
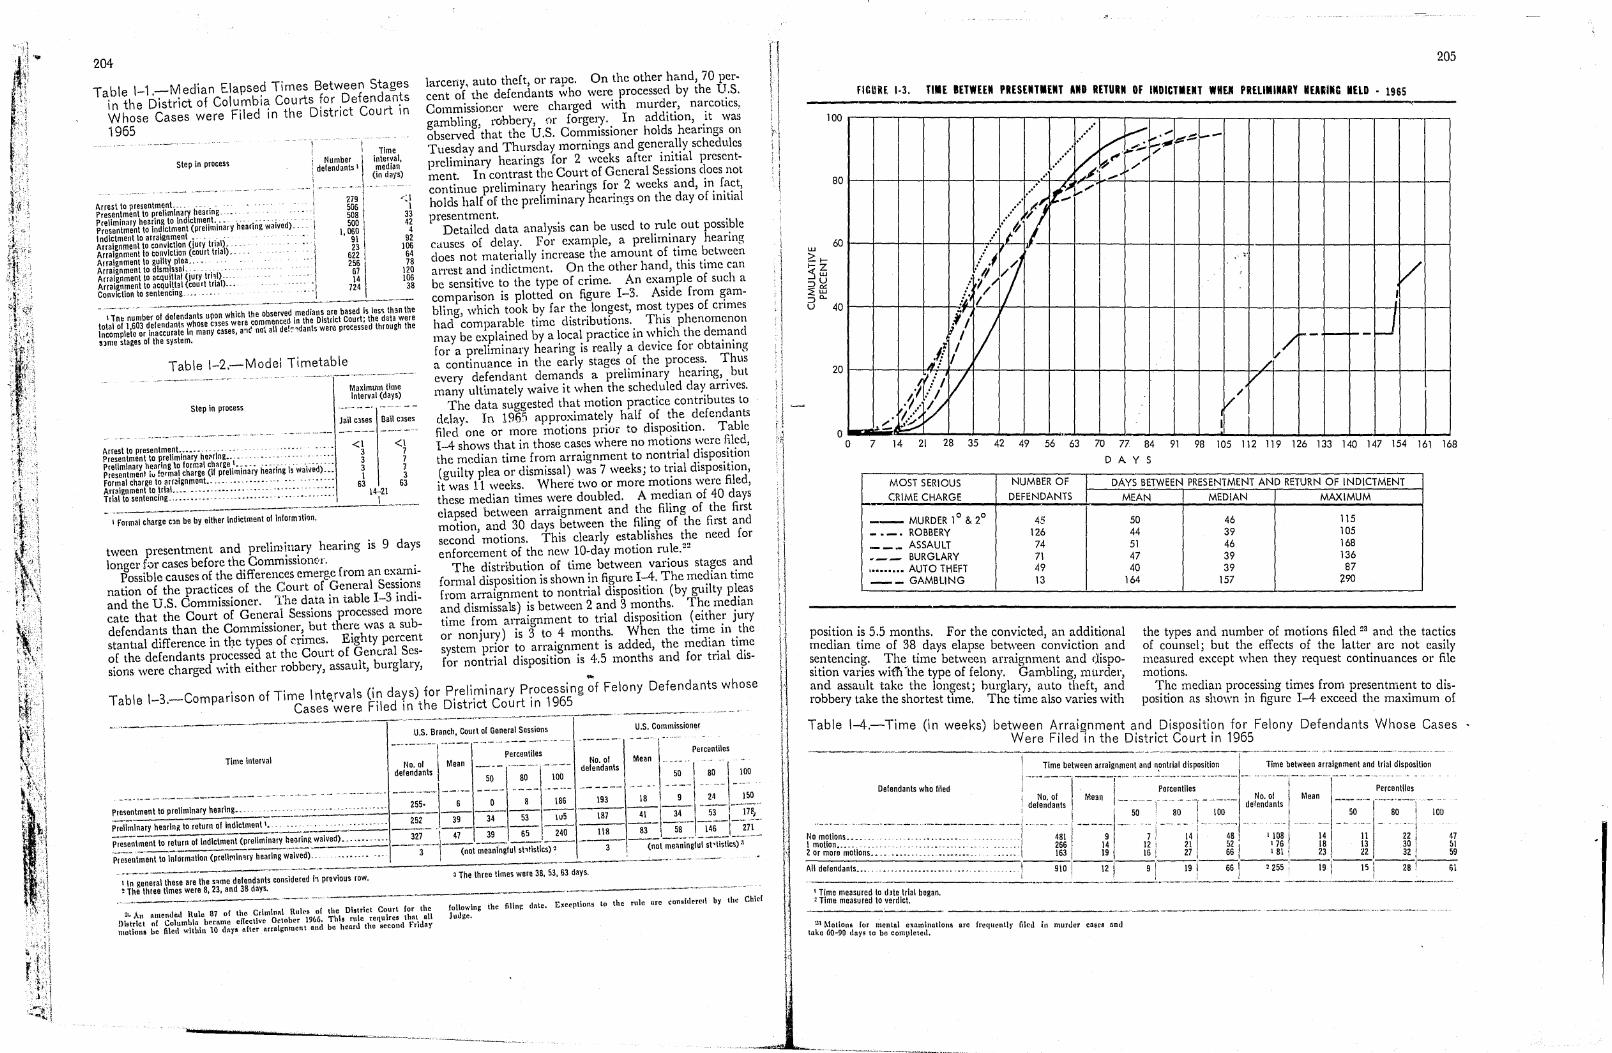
204
Table 1-1 ,-Median Elapsed Times Between Stages in the District of Columbia Courts for Defendants Whose Cases were Filed in the District Court in 1965
step in proces, i Number i defendants I
Time interval, median
(in days)
\ Arrest to presentment. --- -- - 1 Presentment to preliminary hearing_ -. - - - -i Preliminary hearing to Indictment. -. --- - -- - -' -- -- \' Presentment to indictment (preliminary hearing waived) __ I ndictment to arraignment. -,' -Arralgnmgnt to conviction (jury trial). -, Arraignment 10 tbl1vil:t1on (court trial). Arraignment to guilty 1)lea.. . Arraignment to dismissaL -. - ,,Arraignment to acquittal (jury trhl) .. -Arraignment to acquittal (court trial)." Conviction to sentencing ....
279 506 508 500
1.060 91 23
622 256
67 14
724
<I 1
33 42 4
92 106 64 78
120 106 38
I Tne number of defendants upon which the observed medians are based I, les, than the total of 1 603 defendants whose cases were commenced in the Disltlct Court; the data were Incomplete or Inaccurate In many cases, a"d n01 all dp,!"'dants were processed through the same stages of the system.
Table 1-2.-Model Timetable
Step in process
MaxlmulI! time Interval (days)
Jail cases Ball cases ~A_."._. __ -_~ ________ -' --_.--" --.-.-~--~- -~--- ----- .. -
Arrestto presentmenL ....... _ .. ' .. ' <1 <I Presentment to ~rellmlnary he~rlng •. -. _ _ _ _ 3 7 Preliminary hearing '0 formal charge I •.• _ ..... _. _ _ ...... -. 3 7 Presenlment Iv !~rmal charge (If preliminary hearing Is waived)... 3 1 Formal charge to arr~lgnment.. ." .. , _ .......... , _ .. ' -•. -.. 1 3 Arralgnmenttotrlal._ .••..•• -.............. _,_,_,,_ 63 63 Trial to sentencing. ' •.•.•. _ .... _._ ..... _ ..... _ .... -.. - 14-21 - --------------~ _____ -'-I-
I Formal charge can be by either Indictment of information,
tween presentment and preliminary hearing IS 9 days longer f0r cases before the Commissionor.
Possible causes of the differences emerge from an examination of the practices of the Court of General Sessions and the U.S. Commissioner. The data in table 1-3 indicate that the Court of General Sessions processed more defendants than the Commissioner, but there was a substantIal difference in tlJe types of crimes. Eighty percent oE the defendants processed at the Court of Gen(;ral Sessions were charged with either robbery, assault, burglary,
larceny, auto theft, or rape. On the other hand, 70 percent of the defendants who were processed by the U.S. Commissioner were charged with murder, narcotics, gambling, robbery, (H' forgel),. In addition, it was observed that the U.S. Commissioner holds hearings on Tuesday and Thursday mornings and generally schedules preliminary hearings for 2 weeks after initial presentment. In contrast the Court of General Sessions does not continue preliminary hearings for 2 weeks and, in fact, holds half of the preliminary hearings on the day of initial presentment.
Detailed data analysis can be used to rule out possible causes of delay. For example, a preliminary hearing does not materially increase the amount of time between arrest and indictment. On the other hand, this time can be sensitive to the type of crime. An example of such a comparison is plotted on figure 1-3. Aside from gambling, which took by far the longest, most types of crimes had comparable time distributions. This phenomenon may be explained by a local practice in which the demand for a preliminary hearing is really a device for obtaining a continuance in the early stages of the process. Th~s every defendant demands a preliminary hearing, but many u\t\mately waive it when the scheduled day arrives.
The data suggested that motion practice contributes to de.lay. In 196'1 flpproximately half of the defendants fil('d one or more motions prior to disposition. Table 1-4 shows that in those cases where no motions werc filed, the median time from arraignment to nontrial disposition (guilty plea or dismissal) was 7 weeks; to trial disposition, it was 11 weeks. Where two or more motions were filed, these median times were doubled. A median of 40 days elapsed between arraignment and the filing of the first motion, and 30 days between the filing of the first and second motions. This clearly establishes the need for enforcement of the new 10-day motion rule.
22
The distribution of time between various stages and formal disposition is shown in figure 1-4. The median time from arraignment to nontrial disposition (by guilty pleas and dismissals) is between 2 and 3 months. The median time from arraignment to trial disposition (either jury or nonjury) is 3 to 4 months. When the time in the system prior to arraignment is added, thc median time for nontrial disposition is 4.5 months and for trial dis-
... Table 1-3,-Comparison of Time Intervals (in days) for Preliminary Processing of Felony Defendants whose
Cases 'were Filed in the District Court in 1965
I In general these are the "me defendants considered i, previous row, 3 The three times were 38, 53, 63 days, l The three times were 8, 23, and 38 days.
"" An RllIe".!e.! I\ulo 87 or Ihe Crilllinat I\ule. or Ihe Dlglriol Courl lor Ihe following Ihe filing elRle. Excepllon. lo Ihe rule Rre eonsielered by Ihe Chief
DI.trlcl of ColullIhin hecRme elTccllvc Delobcr 1966, This r\lle requires nUll all Judge. motions be filmt within 10 days nfler nrrnignmcnt nnd be heanl the second t"rltlny
'I I \ \ \ I 1 \ ! \
U : ! } I
1 I
_ I
: i
i
1 i. 1
1 \
\'
! I 11
I t
I r I I'" -.
r ,
205
FIGURE 1·3, TIlE BETWEEN PRESEIITIENT AND RETURN OF IMDleTIEIIT WHtII PRELIMINARY IIEUiNG IIELD . 1965
MOST SERIOUS NUMBER OF DAYS BETWEEN PRESENTMENT AND RETURN OF INDICTMENT CRIME CHARGE DEFENDANTS MEAN MEDIAN MAXIMUM
_ MURDER 1° & 2° 45 SO 46 115
- --- ROBBERY 126 44 39 105 ___ ASSAULT 74 51 46 168 ___ BURGLARY 71 47 39 136 ••••••••• AUTO THEFT 49 40 39 87 __ GAMBLING 13 164 157 290
posi~ion i~ 5,5 months. For the convicted, an additional medIan. tIme of 38. days elapse between conviction and s~l:tencm~. ~hc: tIme between arraignment and dispoSItIOn vanes WltT1 the type of felony. Gam.bling, murder, ~nd a~sault take the lon~est; burglary, auto theft, and robbery take the shortest tIme. The time also varies with
the types and number of motions filed 23 and the tactics of counsel; but the effects of the lalter are not easily mea,sured except when they request continuances or file motIOns.
Table 1-4,-Time (in weeks)
~~e median processing times from presentment to disPOSI tlOn as shown in figure 1-4 exceed the maximum of
betwween FATlradi,!;{nment ~nd, Dispositi?n for Felony Defendants Whose Cases ere I e In the District Court In 1965
------------~-----------1 ____ ~~e~t~e~~rraignment an-d~:ntrial di:poSitiOn I Ti:e betwee~-a~r:i~nment a:-t~~d~s~:;~I~n ! No, 01 Mea~-I;-- -- ---p-~r:~~~~------- -·---·-I·--'---T----~;r~~~lues , defendants -- -- - - 1- --- -- --; - -----,- No, 01 Mean __ I ,I de!nndants ----- -.-.-.----
.___________ i _______ • 1 ______ -- 50 80 I 100 1 50 80 I 100
r~~t~~~O~~~: ..... -- ........ -...... J 246861 194
1'2; 11 -- - -2141 Ii 5428 -- 11;7~68·1--· ~I; -- --II'· - . -'2"2"11 47
';;j2j1or;;;m:;:0::re;;:n::lo;:tI_on_s_:._:_. __ .:.. •• .:.. .. :..::,;::::.:.:,;:::,;:·:::.:.:.:::~:':":-:';:'_:':'_':"_ .:.-..:.-.:.: •. ~.:..:..:. .. i 163 I 19 ___ 1_6 : ___ 27_1 ___ 66_1 181 ! 2~ I n 33°2 5591
All defendants ..... , .... "............. t I ~ _________ .. 910 i 12 9 I 19 ! 66 I ~ 255 ! 19 \--1-5 1--2-8 1---.-1
: T!me measured to d3te trial began, "--------' ----'-- -'---- .----•. -----I,.----:...-.~"--"Time measured to verdiCt.
Defendants who filed
--------,---- -----------,---- _ .. - ----.. -- -
2.1 Motions [or mental examinations nrc fl'equ""ll)' ',Ic'\ • lakc 60-90 days to be cOI1l1'}clcd. ..- II U 111 murder ense! lind
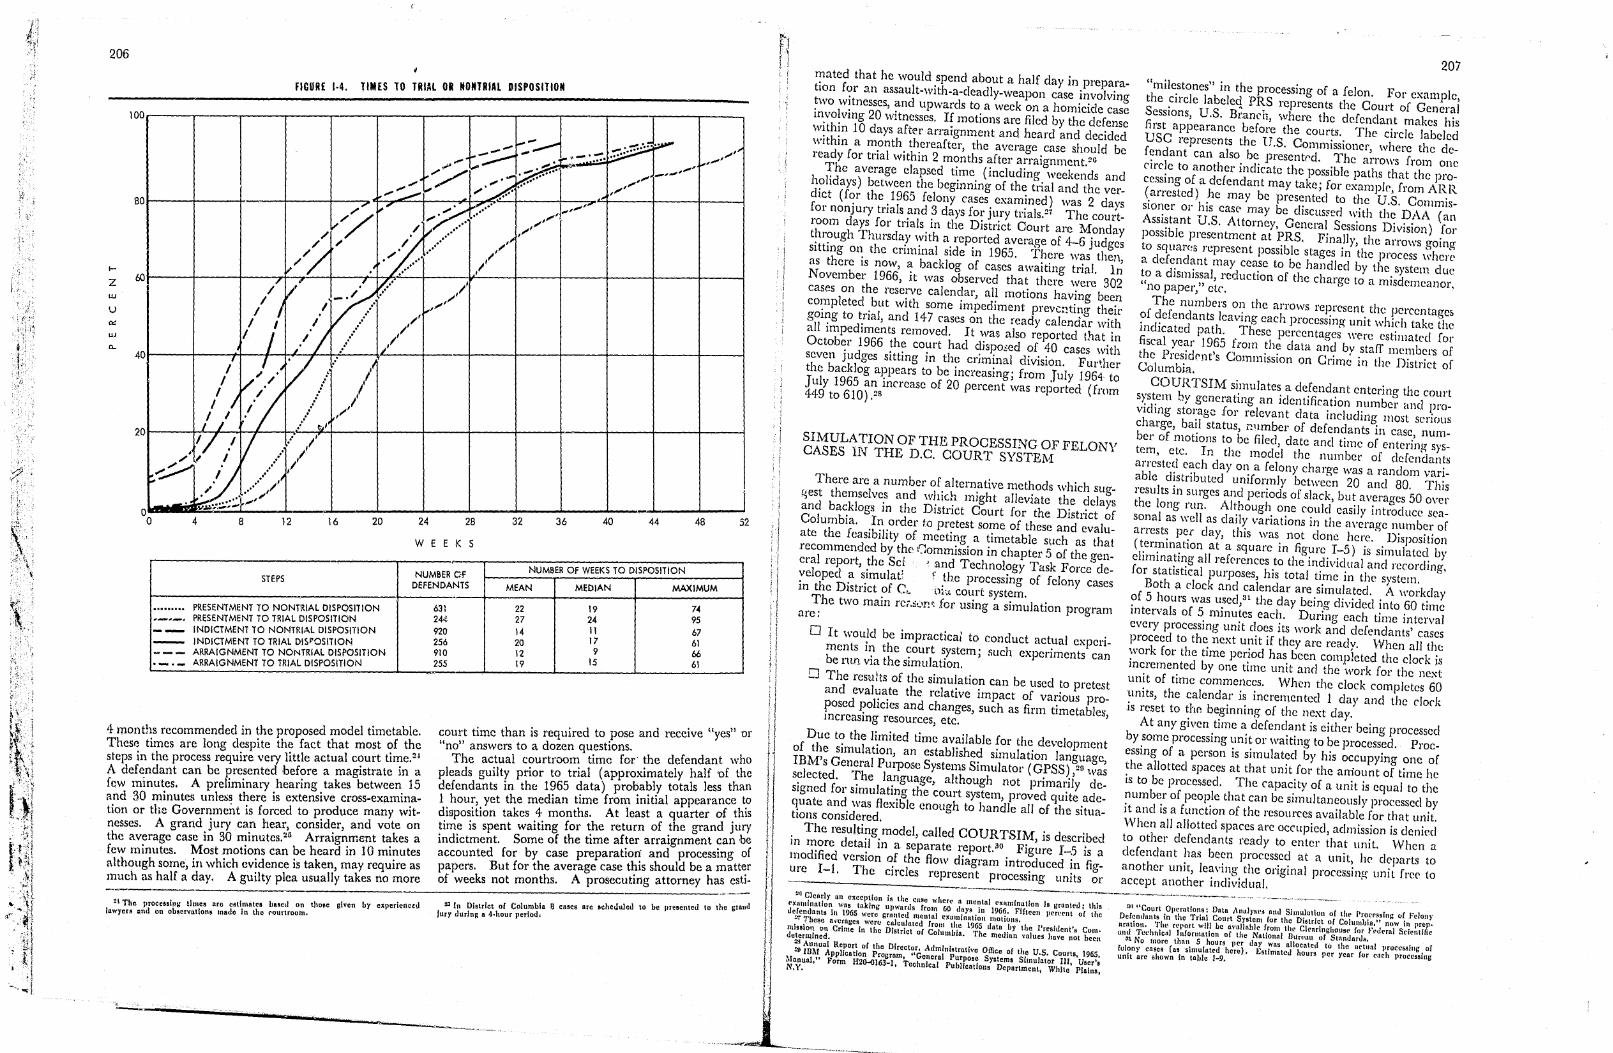
. ;
I ....
206
FIGURE 1·4. TIMES TO TRIAL OR NONTRIAL DISPOSITION
100~--....,...----
lloL_~~_-+.--+--t--:.7'/ ~7 b'i' ;..:' .... 1./// "" ..... . V /.'
//; ~ ........ . / /' .. ,
t,./// .,' ....... .
/ f /.- ~/ .. ': / I ' / /... I
I-
Z 60 I
w
V ~
LlJ
"-40
.' -, .' v.;' / / I' /)'" ;I' ,I I .' _. .,/ /' ~,,.....,
/ " /1) .""/ ,I' I' ... ~/
/ /' 'j' "'/,il
I' /:~~,;---l---+--~----+---+~---r---t--~--~ /i' i.~t:' 7 '7 ... I'
~.?LL' ,/ ",/>~/ I
20
;f •• I • __ L __ J. ___ L __ ~ __ ~:-__ -!;; ___ -:;-_~~ __ ~ L· ..,'
~ .. ~~:::;;"I-' 40 44 48 52 O'-tJIIYI-~~:;';;;'.I.---":' 20 24 28 32 36 o 4 8 12 16
WEE K 5
STEPS NUMBER DEFENDA
PRESENTMENT TO NONTRIAL DISPOSITION PRESENTMENT TO TRIAL DISPOSITION INDICTMENT TO NONTRI,!..L DISPOmlON INDICTMENT TO TRIAL DISPOSITION ARRAIGNMENT TO NONTRIAL DISPOSITION ARRAIGNMENT TO TRIAL DISPOSITION
4 months recommended in the proposed model time~ab~e. These times are long despite th~ fact that most ~ t"~ steps in the process require very little actual c~urt tlIl;e.A defendant can be presented before a magIstrate 111 a few minutes. A preliminary hearing. takes between. 15 and 30 minutes unles~ t~ere is extenSIve cross-examu:ation or the Government IS forced to p,roduce many WItnesses. A grand. jury ca.n hea~, consld:r, and vote on the average case 111 30 mmutes. 25 Arralgr;ment t~kes a few minutes. Most motions can be heard 111 10 mI!1utes although some, in which cv~dence is taken, may reqUlre as much as half a day. A gUllty plea usually takes no more
631 2# 920 256 910 255
OF NTS -
NUMBER OF WEEKS TO DISPOSITION
MEAN MEDIAN MAXIMUM
22 19 74 27 24 95 14 11 67 20 17 61 12 9 66 19 IS 61
2\ The processing !hnes nre c!l matea ua8C( on '0(1 '" I •. I t! e "tven by cXl}cricnc~tI Inwren ;.nd on ob8crvatlona made 1n the rQUrtroom.
23 In District or Columbia 8 cnlles orc achcdulctl to be Incacntcd to the stalul jury during a ·I·hour period.
r-.j r { - 207
mated that he would spend about a half day in preparation for an assault-with-a-deadly_weapon case involving two witnesses, and upwards to a week on a homicide case involving 20 witnesses. If motions are filed by the defense within 10 days after arraignment and heard and decided within a month thereafter, the average case should be ready for trial within 2 months after arraignment. 2G
The average elapsed time (including weekends and holidays) between the beginning of the trial and the verdict (for the 1965 felony cases examined) was 2 days for nonjury trials and 3 days for jury tria1s. 27 The courtroom days for trials in the District Court are Monday through Thursday with a reported average of 4-6 judges sitting On the criminal side in 1965. There was then, as there is now, a backlog of cases awaiting trial. ln November 1966, it was observed that there were 302 cases on the reserve calendar, all motions having been completed but with some impediment prevc!!ting their going to trial, and 147 cases on the ready calendar with all impediments removed. It was also reported that in October 1966 the court had dispo~ed of 40 cases with seven judges sitting in the criminal division. Fur~her the backlog appears to be increasing; from July 1964 to July 1965 an increase of 20 percent was reported (fl'Om 449 to 610) .28
"milestones" in the processing of a felon. For example, the circle labeleq PRS represents the Court of General Sessions, U.S. Branch, where the defendant makes his first appearance before the courts. The circle labeled USC represents the U.S. Commissioner, where the defendant can also be presentl'd. The arrows from one circle to another indicate the possible paths that the processing of a defendant may take; for example, from ARR (arrested) he may be presented to the U.S. Commissioner or his casC' may be discus~ed with the DAA (an Assistant U.S. Attorney. General Sessions Division) for possible presentment at PRS. Finally, the arrows going to square:" represent possible stages in the process where a defendant may cease to be handled by the system due to a dismissal, reduction of the charge to a misdemeanor, "no paper," etc.
SIMULA TION OF THE PROCESSING o.F FELONY CASES IN THE D.C. COURT SYSTEl\{
There are a number of alternative methods which sugr.;est themselves and which might alleviate the delays and backlogs in the District Court for the District of Columbia. In order to pretest some of these and evaluate the feasibility of meeting a timetable such as that recommended by the' Commission in chapter 5 of the gen-eral report, the Sci ' and Technology Task Force de-veloped a simulat: r the processing of felony cases in the District of C. bb. court system.
The two main re('.Stm~ for using a simulation program are:
o It would be impractical to conduct actual experiments in the court system; such experiments can be rtm via the simulation.
CJ The results of the simulation can be used to pretest and evaluate the relative impact of various proposed policies and changes, such as firm timetables, increasing l'esources, etc.
Due to the limited time available for the development of the simulation, an established simulation language, IBM's General Purpose Systems Simulator (GPSS) ,20 was selected. The language, although not primarily designed for simulating the court system, proved quite adequate and was flexible enough to handle all of the situations considered.
The resulting model, called COURTSIM, is described in more detail in a separate report.~o Figure 1.-5 is a modified version of the flow diagram introduced in figure 1-1. The circles represent processing units or
!;!tl Clearly nn exception is the CaSe whefe n menta) cXllll1inatiol1 is Granteo: this (>xlI.lTlination was tnking 1I1Jwnrds froln 60 days in 1966. Fifteen llcn~cnt ot the defendants 111 1965 Wefe, gnllltct.l lucntal examination IIlotions.
!rj These 8,.'crago! wero calculated from the 1965 dntn by the President's Com. mission on Crime in the District of CoJumbia.. The medinn ,'alues have not been dctern;!ned.
0:1 Annual Report of the Director. Administrative Olliee of the U.S. Courts, 1965. ." IDM Application Program, "Gelleral Purpo,e S,.tem, Simulator Ill, U.er'.
Manual," Form H2t>-OI63-!, Techn!ea! Publication. Department, While Plain" N.Y.
The numbers on the arrows represent the pcrcentage& of defendants leaving each processing' unit whirh take the indicated path. These percentages were estimated for fiscal year 1965 from the data and by stan' members of the Presidpnt's Commission on Crime in the District of Columbia.
COURTSIM simulates a defendant cntering the Court system by generating an identification number and providing storage for relevant data including Illost serious charge, bail status, ~11mber of defendants in case, numbel' of motions to be filed, date and time of entering system, etc. In the model the number of defendants arrested each day on a felony charge was a random variable distributed uniformly between 20 ancl 80. This results in surges and periods of slack, but averages 50 over the long run. Although one could easily introduce seasonal as well as daily variations in the a\'erage number of arrests per day, this was not done here. Disposition (termination at a square in figure 1-5) is simulated by eliminating all refC'rences to the individual and recording, for statistical purposes, his total time in the s)'steIl1.
Both a clock and calendar are simulated. A workday of 5 hours was used,31 the day being divided into 60 time intervals of 5 minutes each. During each time interval every processing unit does its work and defendants' cases proceed to the next unit if they arc ready. When all the work for the time period has been completed the clork is incremented by one time unit and the work [or the next unit of time commences. When the clock completes 60 units, the calendar is incremented 1 day and the c10ek is reset to thr. beginning of the next day.
At any given time a defendant is either being processed by some processing unit or waiting to be processed. Processing of a person is simulated by his occupying one of the allotted spaces at that unit for the amount of time he is to be processed. The capacity of a unit is equal to the number of people that can be simultaneollsly processed by it and is a function of the resources available for that unit. When all allotted spaces arc occupied, admission is denied to other defendants fcady to enter that unit. When a defendant has been processed at a unit, he departs to another unit, leaving the original processing- unit freC' to accept another individual.
3U "Court OJ1Crlltions: Dotn ,\nllJ)'SC$ Rlhl Simulatloll of tltr Processing of Felon)" Defendants in the Trial Court Systent (or tho District of Columbio ," now in prep .. oration. Tim rt'l'ort ""HI he Q\'allnhle frorn the Clenrtu(;hOtl5l' (or Fl'dernJ Scientific and TcdmicllJ Information o( the Nationul Dun'nn of Stnntlnnb.
31 No mOre than 5 hours per do)' was alJocntcti to the IIctua) processJng of Culon), CDses (as simulated here). Estimated hours per year lor each processing unit arc shown in table 1-9 •
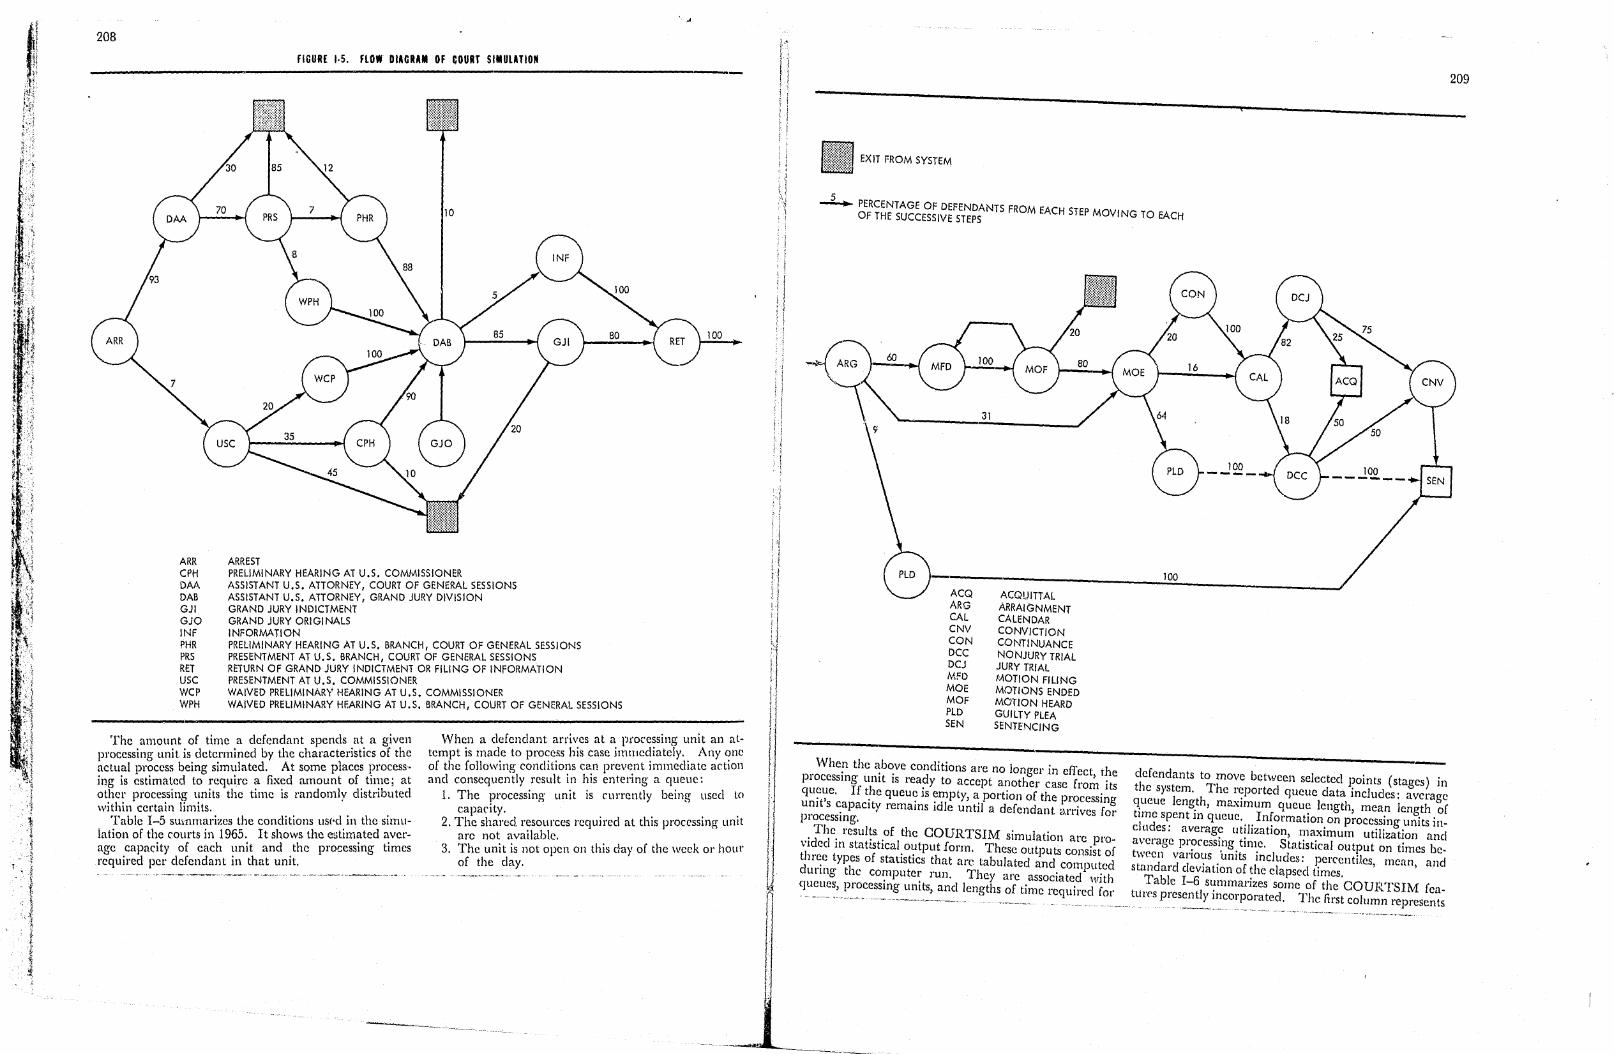
208
ARR CPH DM DAB GJI GjO INf PHR PRS RET USC WC? WPH
FIGURE 1·5. FLOW DIAGRAM OF COURT SIMUUTlON
ARREST PRELIMINARY HEARING AT U.S. COMMISSIONER ASSISTANT U.S. ATTORNEY, COURT Of GENERAL SESSIONS ASSISTANT U.S. ATTORNEY, GRAND JURY DIVISION GRAND JURY INDICTMENT GRAND JURY ORIGINALS
~~:~~~l~~~EARING AT U.S. BRANCH, COURT OF G~~S~~~SSESSIONS RESENTMENT AT U.S. BRANCH, COURT OF GENERAL S ~ETURN OF GRAND JURY INDICTMENT OR fiLING OF INFORMATION
PRESENTMENT AT U.S. COMMISSIONER
WAIVED PRELIMINARY HHEF.AARRIINNGG ~TT ~.;. i3.~~~Slc?~J:T OF GENERAL SESSIONS WAIVED PRELIMINARY . • • ,
100
The amount of time a defendant spends .at. a given 1)I'Ocessing unit is detcrmined by the charactlerlstIcs of the
b · . I tccl At some p aces process· actual process emg Slmu a . f . .. t in is estimated to require a fixed amount 0 . tu;1C) a ot~cr processing units the time is randomly chstl'lbuted within certain limits. . . . h . _
When a defendant arrives at a processing unit an attempt is made to process his case imlIlec!iate!y.. Any ~n~ of the fol!o\ving ('onditio~s Cll;11 prev~nt ,lmmechat: actiO ancl consequently result m /115 entenng a q~lCue.
1. The processing unit is currently bemg used to
Table 1-5 suwmarizes the conchtlOl1s US(·d.lll t e slml~ lation of the courts in 1965. It shows the C'Jtlm~ted ~velage capacity of each ~mit and . the processmg tImes required pel' defendant 111 that umt. _~~~_ ... __ .. ~_.
~ .-.---~----.... ~, -----~. - ~--
capacity. . I . . . nit 2. The shared resources reqUired at t 115 processll1g u
arc not available. k / . 3. The unit is not open on this day of the wee' 01' )Olll
of the clay.
i , j
i i tj
:'1 i i
I'
I (
I f 1
I I j,j
! I !
EXIT FROM SYSTEM
-1..... PERCENTAGE OF DEFENDANTS FROM EACH STEP MOVING TO EACH OF THE SUCCESSIVE STEPS
31
ACQ ACQUITTAL ARG ARRAIGNMENT CAL CALENDAR CNV CONVICTION CON CONTINUANCE DCC NONJURY TRIAL DCJ JURY TRIAL MFO MOTION FILING MOE MOTIONS ENDED MOF MOTION HEARD PlO GUILTY PLEA SEN SENTENCING
When the above conditions are no longe!' in eifect, the processing unit is ready to accept another case from its queue, If the queue is empty, a portion of the processing unit's capacity remains idle until a defendant arrives for processing.
The results of the COURTSIM simulation are provided in statistical output form. These outputs consist of three types of statistics that arc tabulated ancl computed during the computer run. They are associated with queues) processing units, and lengths of time required for
100
defendants to move between selected points (stages) in the system. Thc reported queue data includes: average queue length, maximum queue length, mean length of time spent in queue. Information on processing units inchicles: average utilization, maximum utilization and average processing time. Sta.tistical output on times between various 'units includes: percentiles, mean, and standard deviation of the elapsed times.
Table 1-6 summarizes Some of the COURTSIM featUrf'S presently incorporated. The first column represents
-.. _-_._------------------------------
209
.J
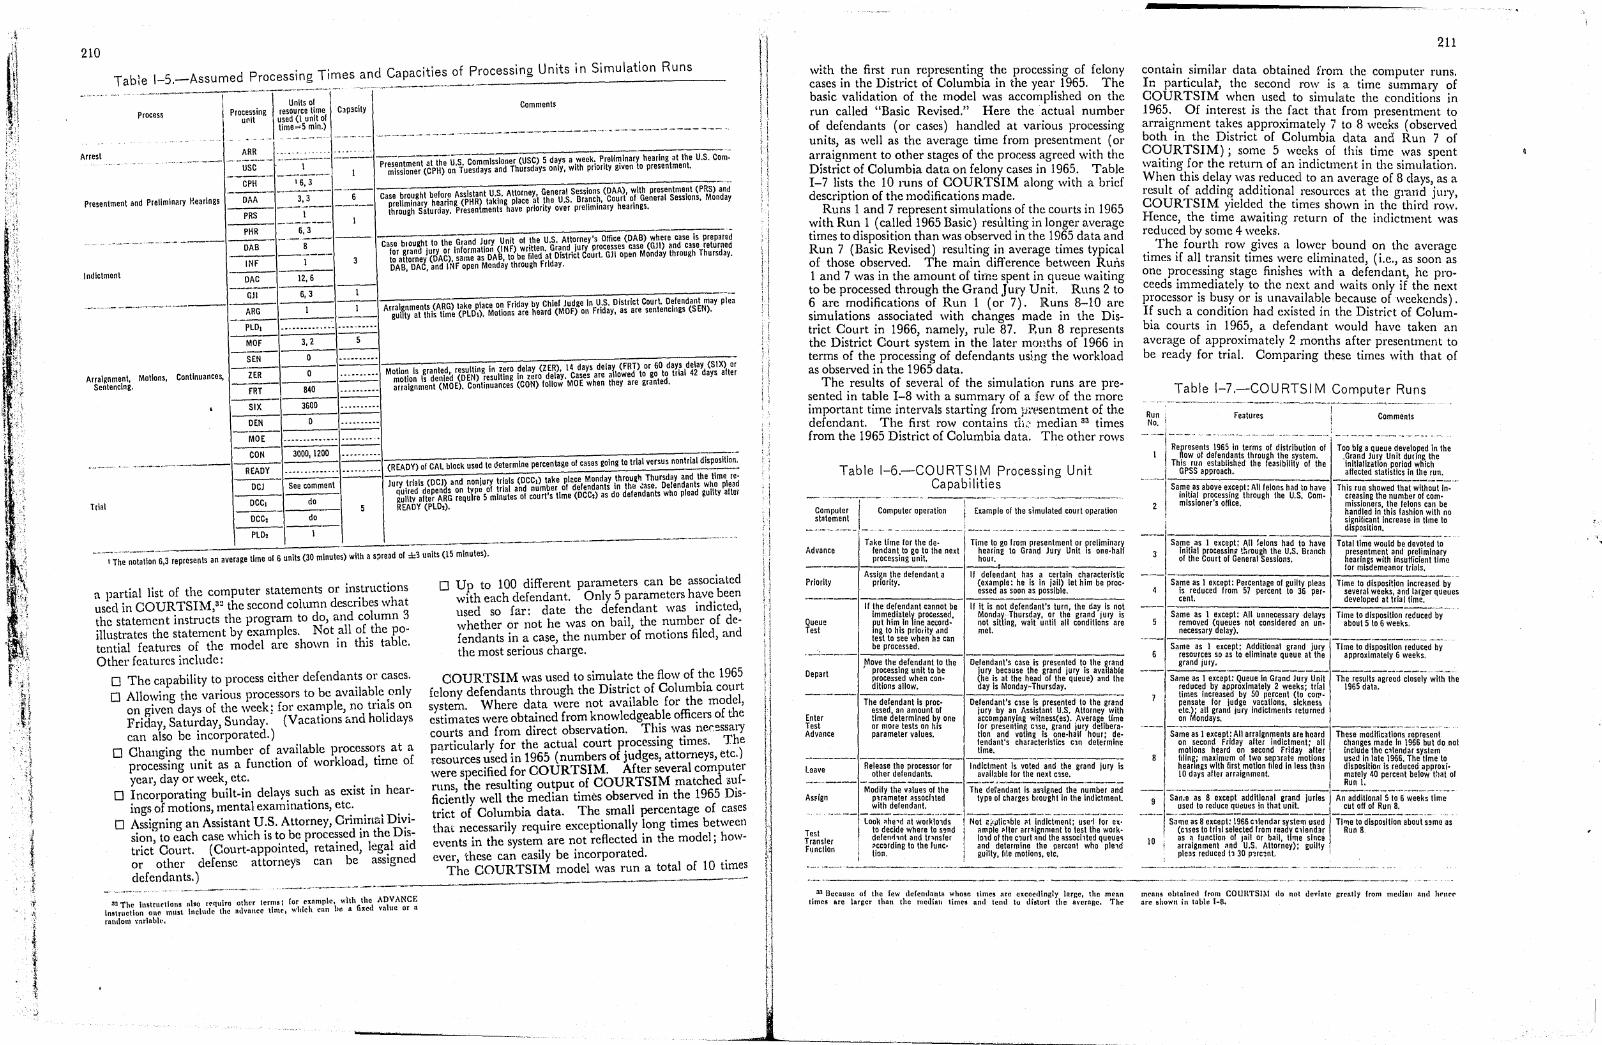
j
210
Table 1-5,-Assumed Processing Times and Capacities of Processing Units in Simulation Runs ... ~.-~-" '_L_~ ____ ~ ___ ~ ___
«-Units 01
ess Processing resource time CJplcity Comments
u~it used (I unit 01 time;:5 min.)
-- -. - .. - ~- - -.---'-~ . -~--.----~------ .---- - -~....----""--------------"""'-'~'" ------~--- ---- ---
Proc
-ARR - ~ - .. _.. ".- . - -.. ~ .. -
.. - --~.-- ---~--- -----~ ~---------- "
USC 1 Presentment at the U.S. Commissioner (USC) 5 days a week. Preliminary hearing at the U.S. Com·
----- ------- 1 missioner (CPH) on Tuesdays and Thursdays only, with prlorily given to presentment. Arrest
CPH 16,3 ---- ~----- ----
ellmlnary Hearings OM 3,3 6 Case brought belore Assistant U.S. Attorney, General Sessions (DAA), with presentment (PRS) and
---- ----- preliminary hearing (PHR) taking place at the U.S. Branch, Court 01 General Sessions, Monday through Saturday. Presentments have priority over preliminary hearings. Presentment and Pr
PRS 1 --- I PHR 6,3
~--.--------- _._._--....... ---DAB 8
Case blought to the Gland Jury Unit of the U.S. Attorney's Office (DAB) where case Is prepared
---------- for grand jury or Information (lNF) written. Grand IU~ processes Clse (GJI) and Clse returned
INF 1 3 to attorned' (DAC), same as DAB, to be filed at District ourt. GJi open Monday through Thursday. DAB,DA ,and INF open Monday through friday.
Indictment DAC 12,6
1 GJi 6,3
-- Arraignments (ARG) take place on friday by Chief Judge In U.S. District Court. Defendant may plea ARG 1 1 guilty at this time (PlDI). Motions are heard (MOF) on Friday, as are sentencings (SEN).
PlDI ..... ~ ......... ~ ~ ...... .. -- ~ .- .. -... ----
MOF 3,2 5
0 ---"' ..... -.. -
Arraignmenl, Motlo Sentencing.
ns, continuances,
SEN
ZER 0 ... ~ ....... , .... Motion Is granted, resulting In zero delay (ZER), 14 days delay (FRT) or 60 days delay (SIX) or motion Is denied (DEN) resulting In zero delay. Cases are a lowed to go to trial 42 days after arraignment (MOE). Continuances (CON) follOW MOE when they are granted.
FRT 840 ...... -........ ---_. • SIX 3600 .. ............. ---
DEN 0 ........ ~ ...... -. MOE ~ ................... ~ .. .. -_ .... ~ ... -..
--CON 3000, 1200 ...... -_ .... -- ~
~'--"""-- READY ~ -_ ........... ~ .. . ...... ~ ... ~ _ .. (READY) of CAL block used 10 determine percentage of cases going to trial versus nontrlal disposition.
DCJ See commenl Jury trials (DCJ) and nonjury trials (DCCI) take piece Monday throug~ Thursday and the time reo
qulred depends on type of trial and number of defendants In th~ ~ase. Defendants who plead
Trial DCCI do gulltv after ARG require 5 minutes of court's time (DCC,) as do defendants who plead guilty aftor READY (PlD,). 5
DCC. do
PlD, 1 .~-~ .. ---
I The notation 6,3 represents an average time of 6 units (30 minutes) with a s?read of ±3 units (15 minutes).
a partial list of the computer statements or instructions used in COURTSIM,32 the second column describes what the statement instructs the program to do, and column 3 illustrates the statement by examples. Not all of the potential features of the model are shown in this table. Other features include:
o The cap~bility to process either defendants or cases. o Allowing the various processors to be available only
on given days of the week; for example, no trials on Friday, Saturday, Sunday. (Vacations and holidays can also be incorporated.)
o Changing the number of available processors at a processing unit as a function of workload, time of year, day or week, etc.
o Incorporating built-in delays such as exist in hearings of motions, mental examinations, etc.
o Assigning an Assistant U.S. Attorney, Criminal Division, to each case which is to be processed in the Distl'ict Court. (Court-appointed, retained, legal aid or other defense attorneys can be assigned defendants. )
3:) 'rhe Instructions Rlso rrquiro. other terms; for exnmple, with the ADVANCE instruction Ollt' m\l!l include the ntl\onJ1ee tiO\('. which cnn be n fixed vnluc or n rRllllom "nrlnllil"
o Up to 100 different parameters can be associated with each defendant. Only 5 parameters have been used so far: date the defendant was indicted, whether or not he was on bail, the number of defendants in a case, the number of motions filed, and the most serious charge.
COURTSIM was used to simulate the flow of the 1965 felony defendants through the District of Columbia court system. Where data were not available for the model, estimates were obtained from knowledgeable officers of the courts and from direct observation. This was necessary particularly for the actual court processing times. The resources used in 1965 (numbers of judges, attorneys, etc.) were specified for COURTSIM. After several computer runs, the resulting outpm of COURTSIM matched 'Sufficiently well the median times observed in the 1965 District of Columbia data. The small percentage of cases thai: necessarily require exceptionally long times between events in the system are not reflected in the model; however, these can easily be incorporated.
The COURTSIM model was run a total of 10 times
; f , I ) I
I !
\! q 'j II iI 11 l' t
! II Ij [1
! I
!
11
J
with ~he first. ru~ representing the processing of felony cas~s m t~e I?IStl'lCt of Columbia in the year 1965. The baSIC vahdatlOn of the model was accomplished on the run called "Basic Revised." Here the actual number of .defendants (or cases) handled at various processing UnIt~, as well as the average time from presentment (or ar~al~nment to other stages of the process agreed '."ith the Dlstr~ct of Columbia data on felony cases in 1965. Table 1-7 l~sts. the 10 runs of COURTSIM along with a brief deSCrIptIOn of the modifications made.
. Runs 1 and 7 represent simulations of the courts in 1965 ~lth RunJ (c~l.led 1965 Basic) resulting in longer average times to diSpOSitIOn than was observed in the 1965 data and Run 7 (Basic Revised) resul~ing ~n. average times typical of those obs~rved. The mam dlfI erence between Runs 1 and 7 was m the amount of time spent in queue waiting to be proce~sed through the Grand JUly Unit. Runs 2 to ~ are ~odlficati~ns of ~un 1 (or 7). Runs 8-10 are s~ujatlOns associated wIth changes made in the Distnct ~ou.rt in 1966, namely, rule 87. Run 8 represents the DistrIct Court system in the later months of 1966 in terms of the processing of defendants using the workload as observed in the 1965 data,
The results of several of the simulation runs are pre~ented in ta?le ~-8 with a su~mary of a few of the more Important tIme mtervals startmg from iw;,sentment of the defendant. The first row contains th,~' median 33 times from the 1965 District of Columbia data. The other rows
Table 1-6,-COU RTSI M Processing Unit Capabilities
Computer st~tement
Adva nee
Prior ity
----Queue Test
.-~-
Depar t
Enter Test Advan ce
----la8ve
---, ----I --- - ------- -----~--Computer operation I Example of the simulated court operation
Take time for the de- Time to go from presentmenl or preliminary fendant to go to Ihe next hearing to Grand Jury Unit is one· half processing unit. hour.
I Assign the defendant a If defendant has a certain c haracteristic
priority. (example: he is in jail) let h im be proc· essed as soon as possible.
If the defendant cannot be If it is not defendant's lurn Ihe day Is not Immedlatelr processed Mond~yThursday, or the gr and jury is pul him In ine accord: not sitting, walt until all con ditlons are Ing to his prlodty dnd mel. lest to see when ha can be processed.
!~ove the defendant to the De!endant's case Is presenled to the ~rand processing unit to be JUry because the grand jury I processed when con-
s avaIlable (he !s at the head of the queu e) and the
ditions allow. day IS Monday-Thursday,
The defendant is proc- Defendant's Clse Is presented 10 Ihe grand essed, an amount of jury by an Assistant U.S. Att orney with time determined br, one accompanying witness(es). Av erage time or more tests on h s for presenting Clse, grand jur parameter values.
y delibera-tion and voting Is one·half hour: de-fendant's characteristics can delermlne time.
Release the processor for I ndlclment is vot;,J;dti;;-grand jurv is other defendants. available for the next Clse. '
As~ign -- -M-;;-dify the values of tt;;"- The dere-;;dant Is a~igned the number and
parameter ~ssoci1ted type of charges brought in the Indlctmenl. with del end ant,
~~~~----
look .h;d;;o7k·I~ld;-- tw-;.'~lic-;t,le-;ti;;dlci';;;;;;;-;s~1 lor ex· Test Transler Function
to decide where to s~nd ~\11ple _fter amignment to le.st Ihe work· defen~'nt and tr,nsfer 101d 01 Ihe C1urt ~nd the ~ssocl1ted queue, ?ccardlng to the func· and determine the percent who pleld tion. guilty, fIle motion;, etc.
" 3.1 Because or the re", deCendnllt!\ whose times nrc exceedingly large the men limes are Inq;cr thnn the mccHali times nnd tenll to distort the B\·;rngc. Th~
211
contain .similar data obtained from the computer runs, In particular, the second row is a time summary of f90URTSI~ whe~ used to simulate the conditiOl;s in
6~. Of mterest IS the fact that from presentment to arralg,nment ta~es. approximately 7 to 8 weeks (observed both 111 the DistrIct of Columbia data and Run 7 of CC?1!RTSIM); some 5 weeks of this time was Spl'Ilt waltmg f?r the return of an indictmclit in the simulati~n, When thiS delay was reduced to an average of 8 days as a result of addinq additional resources at the grand 'jury, COURTSn.~ Yielded. ~he times shown in the third row, Hence, the tune awattlng return of the indictment was reduced by some 4 weeks. . Th~ fourth r~w .gives a lower bound on the avera e
times If all ~ranslt times were eliminated, (i.e., as soon ~s one p,:,ocessl~g stage finishes with a defendant, he proceeds Imn:edlately t~ the next and waits only if the next processor 15 bu~">: or IS una,:,ailable because of weekends) . I~ such a c~ndlt\On had eXisted in the District of Columbia courts m 196?, a defendant would have taken an average of apP:oxlmately 2 months after presentment to be ready for trIal. Comparing these times with that of
___ ~abl:_I.-7,-COURTSIM Computer Runs -~-~ ~-~.-.--~~--.-~----~--.. -.-
Run ' No. ! features
Represents 1965 In terms of distribution of (tow of defendants through the system.
ThIS run established the feasibillly of the GPSS approach. -I Sa.me .as above except: Ail felons had to have 1II\\la.1 processing Ihrough the U.S. Com-
2 miSSIoner's office.
Comments
Too big a queue developed in Ihe _Grand Jury Unll during the initialization period which aHected statistics In Ihe run.
This run showed that without Increasing the number of com· miSSioners, the felons can be handled in this fashion with no significant Increase in time 10
_ -=:-:-:--:---:-:--:--::-:""7 ________ di_sPosition. Same.as I exce.pt: Ail :elons had to have
InitIal processlnP !~rough the U.S. Branch of the Court of General Sessions.
Total time would be devoted to presentment and preliminary hearings with insuHicient time for misdemeanor trials.
10 i
Same as 1 except: Pelcentage of guilty pleas ~~n\~dUced from 57 percent to 36 per-
Same as 1 except: All unnecessary delays removed (queues not considered an unnecessary delay),
Same as I except: Additional grand jury resources so as to eliminate queue at the grand iury,
Same as 1 except: Queue In Grand Jury Unit reduced by approximately 2 weeks' Irial times Increased by 50 percenl (to' COil'pensate for Judge vacations slcknesl elc.); all grand jury Indlctmen'ts returned on Mondays.
Same as 1 except; All arraignments are hoard on second Friday after Indictment· all m9lions h~ard on second Friday after filing; maxImum of two seplrale motions hearings wllh first motion fIled In less than 10 days after arraignment.
Time 10 disposition Increased by several weeks, and larger queues developed at trial time.
Time to disposition reduced by about 5 to 6 weeks.
Time to dispo-;iii~~d~;d by approximately 6 weeks.
These modlfic3t1ons-;~p;;sent changes made In 1966 but do nol inclUde thQ c.lendar system us~d In late 1966. The time to dlsposllion Is reduced approxi· w:~el~ 40 percent below I~~t of
S;~7e as 8 exc;;;t;.jdiii~;;;I;.;;;;Jjurles 'A; addltl~;;;1sto-6~w-;ek;time used 10 reduce qu~U"S In that unit. cut oH of Run 8.
S;;;;;;-8ex~ePt: iSGGc;lendar SY~-;;'--;;;;d Tj;;.';;di;;~U;;;;- ;b~t~~ (clses to tml selected from ready cllendar Run 8_ me as as a function of j~1I or bail, time slnca ~\~~~g~~~~~ct"t~d 30Up~;rc~~\~rney); guilly I
means obtained rrom COUHTSIM tlo not ucviatc Rrentl u from metJl'4n BI"I 1"'01"" nre shown in table 1-0. J q
, ,
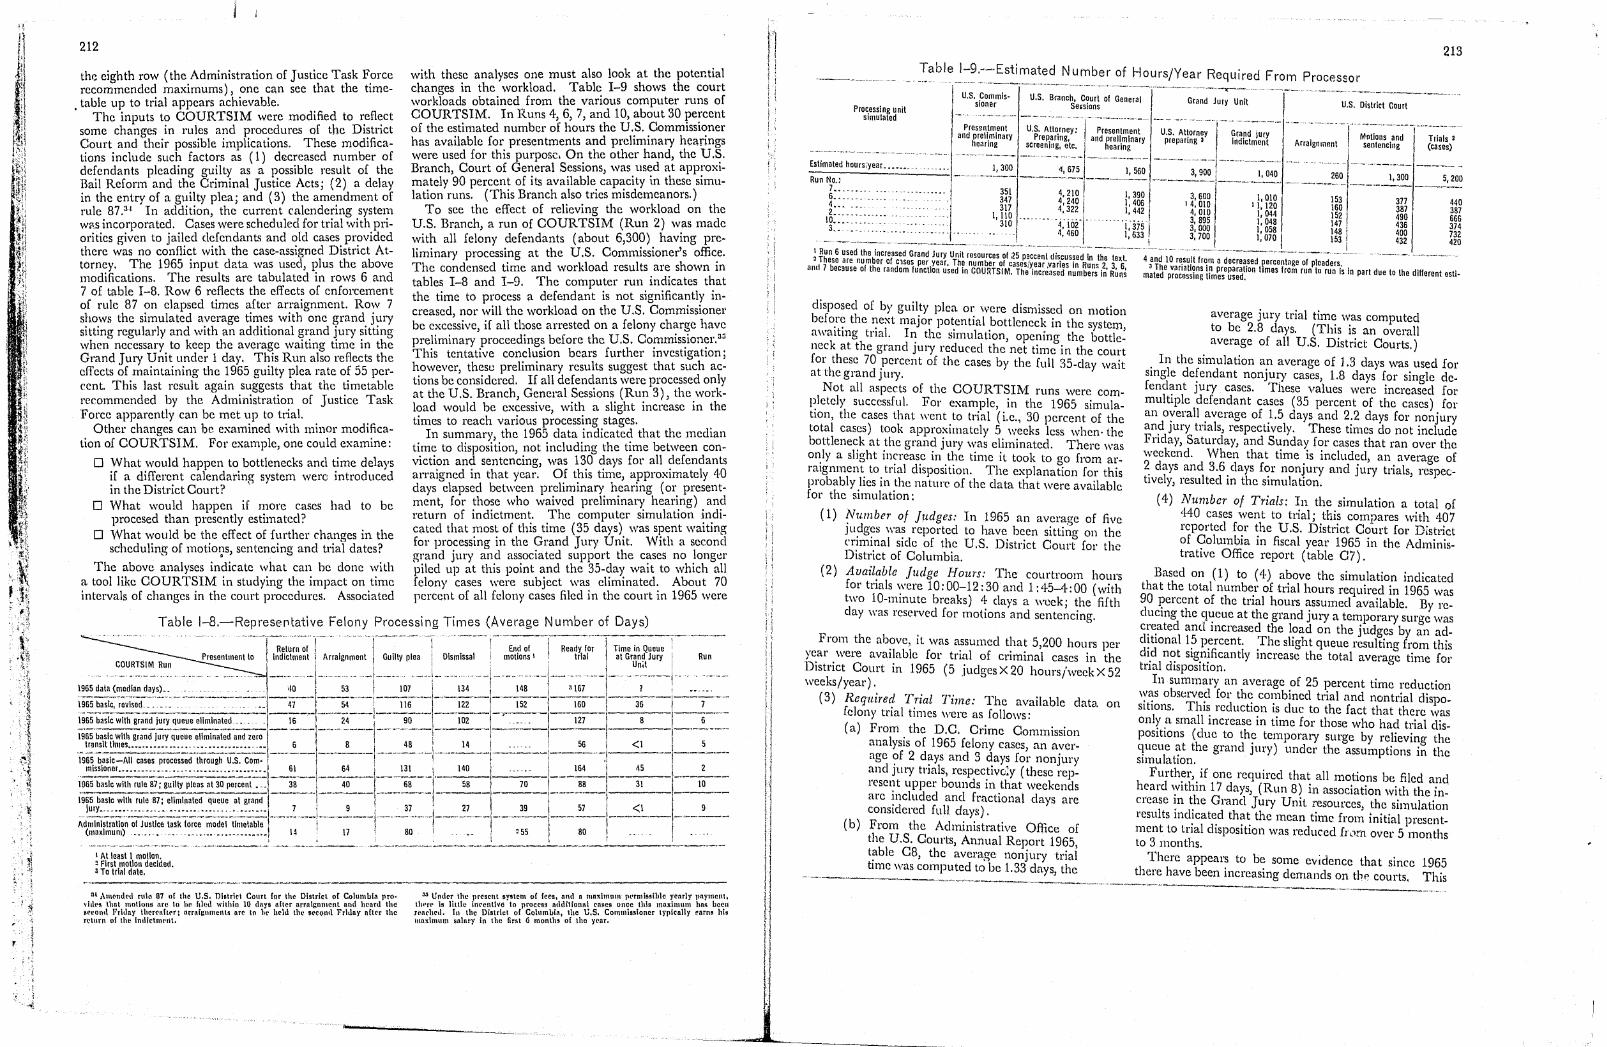
, ~ "~" 1 -"-~
212
the eighth row (the Administration of Justice Task Force recommended maximums), one can see that the time
. table up to trial appears achievable. The inputs to COURTSIM were modified to reflect
some changes in rules and procedures of the District Court and their possible implications. These modifications include such factors as (1) d~creased number of defendants pleading guilty as a possible result of the Bail Reform and the Criminal Justice Acts; (2) a delay in the entry of a guilty plea; and (3) the amendment of rule 87.31 In addition, the current calendering system w<,.s incorporated. Cases were scheduled for trial with priorities given to jailed clefendanl~ and old cases provided there was no conflict with the case-assigned District Attorney. The 1965 input data was used, plus the above modifications. The results are tabulated in rows 6 and 7 of table 1-8. Row 6 reflects the effects of enforcement of rule 87 on elapsed times after arraignment. Row 7 shows the simulated average times with one grand jury sitting regularly and with an additional grand jury sitting when necessary to keep the average waiting time in the Grand Jury Unit under 1 day. This Run also reflects the effects of maintaining the 1965 guilty plea rate of 55 percent. This last result again suggests that the timetable recommended by the Administration of Justice Task Force apparently can be met up to trial.
Other changes can be examined with minor modification of COURTSIM. For example, one could examine:
o What would happen to bottlenecks and time delays if a different calendaring system were: introduced in the District Court? -
o What would happen if more cases had to be procesed than presently estimated?
o What would be the effect of further changes in the scheduling of motioIJs, sentencing and trial dates?
The above analyses indicate what can be done with a tool like COURTSIM in studying the impact on time intervals of changes in the court procedures. Associated
1 At least I mollon. 2 First motion decided. l To trial date.
nl Alllcntl"d ruto 87 u[ th. U.S. District COllrl [or the Dlstricl of Columbia pro· ,'hIt·s lhnt motions nrc 10 lit' fllNl "dtMn 10 tIlly; after nrrnh;nmcnt and hcnnl the IIfCOIHt Friday lhert'llit('r; nrrRi~IIIJ\C1\\S nrc to hl" beld tIle SCCQIHl Friday aftl'r the f('turn or the Indictment.
'b
with these analyses one must also look at the potential changes in the workload. Table 1-9 shows the court workloads obtained from the various computer runs of COURTSIM. In Runs 4,6, 7, and 10, about 30 percent of the estimated number of hours the U.S. Commissioner has available for presentments and preliminary hearings were used for this purpose. On the other hand, the U.S. Branch, Court of General Sessions, was used at approximately 90 percent of its available capacity \n these simulation runs. (This Branch also tries misdemeanors.)
To see the effect of relieving the workload on the U.S. Branch, a run of COURTSIM (Run 2) was made with all felony defendants (about 6,300) having preliminary processing at the U.S. Commissioner's office. The condensed time and workload results are shown in tables 1-8 and 1-9. The computer run indicates that the time to process a defendant is not significantly increased, nor will the workload on the U.S. Commissioner be excessive, if all tbose arrested on a felony charge have preliminary proceedings before the U.S. Commissioner.3:; This tentative conclusion bears further investigation; however, these preliminary results suggest that such actions be considered. If all defendants were processed only at the U.S. Branch, General Sessions (Run 3), the workload would be excessive, with a slight increase in the times to reach various processing stages.
In summary, the 1965 data indicated that the median time to disposition, not including the time between conviction and sentencing, was 130 days for all defendants arraigned in that year. Of this time, approximately 40 days elapsed between preliminary hearing (or presentment, for those who waived preliminary hearing) and return of indictment. The computer simulation indicated that most of this time (35 days) was spent waiting for processing in the Grand Jury Unit. With a second grand jury and associated support the cases no longt!r piled up at this point and the 35-day wait to which all felon), cases were subject was eliminated. About 70 percent of all felon)' cases filed in the court in 1965 were
3:1 Umlt'r the present system of fees. nud n mDximum pl'rmissiblc yearly payment, thl'rr Is little inrcnliv-c to process additional CRses once this maximum hM been I('l\rlu'll. III the District or ColumbiA, the U.S. Commissioner l)'picolly !.'ilrn8 his lllnxinuun so.lnr~· in the first (j month! o( the yenr.
n J I i; i 1
l -, i J \
: ;
; !
I IJ 11 Ii !1 d lj \.
11
I I
213
!able~=~~-=Es~mated Number of Hours/Year Required From Processor I ~-... -.-.. ----.----.--~.-----.-.~-.--~---~ ---.--------. -~--
Proc.essing unit Simulated
u.s .. Commis· u.s. Branch. Court of General Grand Jury UI11·t I - -------- ------~--.---sloner Se;slons U.S. District Court .~-- -~-~ ---~--.-- - -- - --'-~---.,-~ ....... --- --- -~ -~.- .-
Pres~ntment US Att I p ----+.-~---~.- -.. - - ~ ~ -- - - . ~---- -'--~---
_. o.rney: resentment U.S. Attorney and preliminary Prep.anng. and preliminary preparing 3 Grand jury ! Motions and Trials 2
(cases) hearing screenIng, etc., hearing indictment Arraignment sentencing -.-.~ .. ~-~-.-- ---~---.--- ~--~-~~--- -~
Eslimatedhours;year........ 1300 4675 I 560 ~-~--- - .•.. ----- ..... --.-----.. - ------.-.----.--.~-Run No.: --.---'-----.--.~--_~~ ___ ~~900 __ ._ .•• 1,040 _ 260 1,300 5,200
~:::::::............... m ~:m H~~ I~'~~~ 1,010 ----~;----~---~:~ ~:::.::....... I 1m 4.322 1:442 4:010 'l:~~~ m 387 387
I~::.:::: ... : ..... : .. :. '310 ... "(i02- ··1;375 ~:~~g I l:~~~ l:~ :~~ ~~~ ____ .. ___ . _ ..... ~_. ____________ .. _._._ ... ~_~.~ __ .. ___ 1,6331 _ 3,700 1,070 153 :~~ m
1 Run 6 used the increased Grand Jury Unit resources of ;'5 p3cce I d' d I --. - ~.---"- .--.-.~- .. ----~--•. ---~- .• - .----.-.. -.••• ----2 These are number of Clses per year. The number of cases I ean Is.cus~e n the texl. 4 and 10 r~su!t from a decreased percentage of leaders
and 7 because 01 the random IUnction used In COUnSIM. Th/inc~e~~~ljSn~nm~~~: i* ~u;s m~t~~e p~~~le~~~~~ U:n~~ee~~~~ion ltmes from rulto run is In part due to the different esti.
disposed of by guilty plea or were dismissed on motion bef0.r~ the ~ext major potential bottleneck in the system, awaltmg tnal. Ir: the simulation, opening the bottle~ neck at the grand Jury reduced the net time in the court for these 70 ,Percent of the cases by the full 35-day wait at the grand Jury.
Not all aspects of the COURTSIM runs were com-1~letcl)' successful. For example, in the 1965 simulatIOn, the cases that went. to trial (i.e., 30 percent of the total cases) took approxllllately 5 weeks less when- the bottleneck at the grand jury was eliminated. There was 0r:ly a slight increase in the time it took to (TO from arraignment. to. trial disposition. The explanation for this probably.hes 1Il .the natl\l'e of the data that were available for the simulatIOn:
(1) !lumber of jltdges: In 1965 an average of five JlI?g?S \\'a~ reported to have been sitting on the t'r.lml.nal Side of th.e U.S. District COLlrt for the Dlstnct of Columbia.
(2) Avail~ble Judge Hours: The courtroom hours for tnals ,:,'ere 10: 00-12 : 30 and 1: 4-5-4: 00 (with two 10-mmute breaks) 4 days a week; the fifth day was resel'ved for motions and sentencing.
average jury trial time was computed to be 2.8 days. (This is an overall average of all U.S. District Courts.)
. In the simulation a? average of 1.3 days was used for slllgle defendant nonJ;try cases, 1.8 days for single defend~nt JUry cases. fllese values were increased for multiple defendant cases (35 percent of the cases) for an oyeral! ~verage of .1.5 days and 2.2 days for nonjury an? Jury tnals, respectIVely. These times do not include Fnday, Saturday, and Sunday for cases that ran over the week~nd. When that time .is includ~d, an. average of ~ da)s and 3.6. days for nonJury and Jury tl'lals respec-tIvely, resulted 111 the simulation. '
(4) Number of Trials: In the simulation a total of 440 cases went to trial; this compares with 407 reported for the U.S. District Cciurt for District of <?olumbia in fiscal year 1965 in the AdministratIVe Office report (table C7).
Based on (1) to (4) above the simulation indicated that t~e total numbe,r of trial hours required in 1965 was 90 l?elcent of the tnal hours assumed available. By red~lc1l1g the q,:cue at the grand jury a temporary surge was c~~ated amlmcreased the load on the judges by an ad-
From the ab?ve~ it was assumed that 5,200 hours per d~tlonaI1~ p~rcent. The slight queue resulting from this ye.ar . were aVailable for trial of criminal cases in the dl.d n~t slg?!ficantly increase the total average time for Dlstl'lct Court in 1965 (5 judges X 20 hoursiweek X 52 tnal dispOSItIon. ' weeks/year). In summary an average of 25 percent time reduction
(3) Requirc(! T;ial Time: The available data. on \~~s obst:rve~l for th~ cOl.nbined trial and nontrial clispo-felony tnal times were as follows: slttons. Thl~ reductl~n I~ due to the fact that there was ( ) F onlr .a small 1I1ctease m tllne for those who had trial elis-a 'rom the D.C. Crime Commission pos t ( I I
analysis of 1965 felony cases, an ave\'- lions cue to tl? temporal",! surge by relieving the f 2 d c1ueue ~t the grand Jury) under the assul11l)tions in the
age ? ~ys and 3 days for nonjury sllnulation. and JUry tnals, respectivc:y (these rep- Furth~r,. if one required that all motions be filed and resent upper bounds in that weekends heard '."lthm 17 days, (Run 8) in association with the in-are included and fractional days are crease m the Grand Jurv Unil"esources the s· I t' considered full days). . . I ." , llnu a IOn
(b) results md~cat~d th~~ the mean time from initial present-yrom sthe Administrative Office of I11cnt to tnal dispOSItion was reduced fI.1m over 5 months t le U .. Cou\'ts, Annual Report 1965, to 3 months. t~ble C8, the average nonjury trial There appears to be some evidence that since
___ t_ll_l1_C_\\·as~~ted"~o be 1.33 days, the ____ ._~~~~~~~ have been increasing demands on the courts. ~~i~
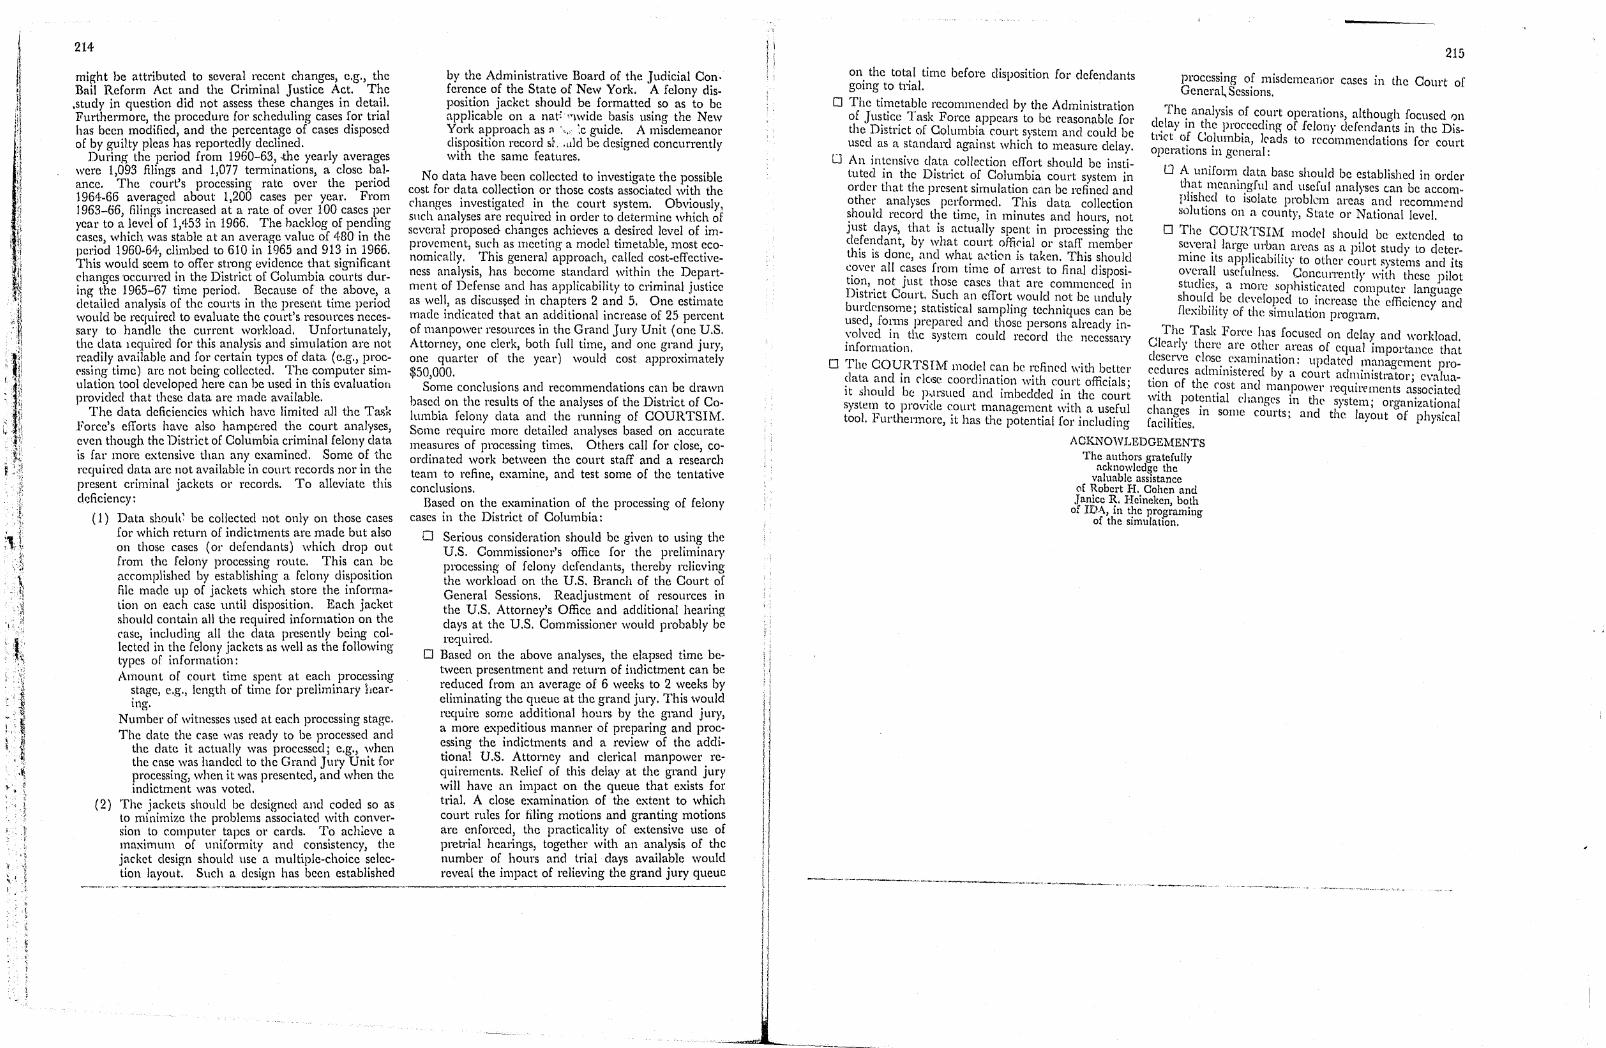
'-:-1
214
might be attributed to several recent changes, e.g., the Bail Reform Act and the Criminal Justice Act. The ,study in question did not assess these changes in detail. Furthermore, the procedure for scheduling cases for trial has been modified, and the percentage of cases disposed of by guilty pleas has reportedly declined.
During the period from 1960-63, ,the yearly averages were 1,093 filings and 1,077 terminations, a close balance. The court's processing rate over the period 1964--66 averag;ed about 1,200 cases per year. From 1963-66, filings increased at a rate of over 100 cases per year to a level of 1,453 in 1966. The hacklog of pending cases, which was stable at an average value of 480 in the period 1960-64, climbed to 610 in 1965 and 913 in 1966. This would seem to offer strong evidence that significant changes 'occurred in the District of Columbia courts during the 1965-67 time period. Because of the above, a detailed analysis of the courts in the present time period would be required to evaluate the court's resources necessary to handle the current workload. Unfortunately, the data lequired for this analysis and simulation are not readily available and for certain types of data (e.g., proc('ssing time) are not being collected. The computer simulation tool developed here can be used in this evaluation provided that these data arc made available.
The data deficiencies which have limited all the Ta.~k Force's efforts have also hampered the court. analyses, even though the District of Columbia criminal felony data is far more extensive than any examined. Some of the required c1ata are not available in court records nor in the present criminal jackets or records. To alleviate this dcficiency:
(1) Data shoul(~ be collected not only on those cases for which return of indictments are made but also on those cases (or defendants) which drop out from the felony processing route. This can be accomplished by establishing a felony disposition file made up of jackets which store the information on each case until disposition. Each jacket should contain all the required information on the case, including all the data presently being collected in the felony jackets as well as the following types of information: Amount of court time spent at each processing
stage, e.g., length of time for preliminary llearing.
Number of witnesses used at each processing stage. The date the case was ready to be processed and
the date it actually was processed i e.g., when the case was handed to the Grand Jury Unit for processing, when it was presented, and when the indictment was voted.
(2) The jackets should be designed and coded so as to minimize the problems associated with conversion to computer tapes or cards. To achieve a maximulll of uniformity and consistency, the jacket design should use a multiple-choice selection layout. Such a design has been established
by the Administrative Board of the Judicial Con. ference of the State of New York. A felony disposition jacket should be formatted so as to be ;tpplicable on a nat'\'\wide basis using the New York approach as ::I -,., :c guide. A misdemeanor di~position record 51, .tlld be designed concurrently With the same features.
No data have been collected to investigate the possible cost for data collection or those costs associated with the changes investigated in the court system. Obviously, slIch analyses arc required in oreler to determine which of several proposed changes achieves a desired level of improvement, such as meeting a model timetable, most economically. This general approach, called cost-effectiveness analysis, has become standard within the Department of Defense and has applicability to criminal justice as well, as discus~ed in chapters 2 and 5. One estimate made indicated that an additional increase of 25 percent of manpower resources in the Grand J lily Unit (one U.S. Attorney, one clerk, both full time, and one grand jury, one quarter of the year) would cost approximately $50,000.
Some conclusions and recommendations can be drawn based on the results of the analyses of the District of Columbia felony data and the running of COURTSIM. Some require more detailed analyses based on accurate measures of processing times. Others call for close, coordinated work between the court staff and a research team to refine, examine, and test some of the tentative conclusions.
Based on the examination of the processing of felony cases in the District of Columbia:
o Serious consideration should be given to using the U.S. Commissioner's office for the preliminary processing of felony defendants, thereby relieving the workload on the U.S. Branch of the Court of General Sessions. Readjustment of resources in the U.S. Attorney's Office and additional hearing days at the U.S. Commissioner would probably be required.
o Based on the above analyses, the elapsed time between presentment and return of indictment can be reduced from an average of 6 weeks to 2 weeks by eliminating the queue at the grand jury. This would require some additional hoUl's by the grand jury, a more expeditious manner of preparing and processing the indictments and a review of the additional U.S. Attorney and clerical manpower requirements. Relief of this delay at the grand jury will have an impact on the queue that exists for trial. A close examination of the extent to which court rules for filing motions and granting motions are enforced, the practicality of extensive use of pretrial hearings, together with an analysis of the number of hours and trial days available would reveal the impact of relieving the grand jury queue
215
on the total time before disposition for defendants processing of misdemeanor cases in the Court of going to trial. General,Sessions.
o The timetable recommended by the Administration T of Justice Task Force appears to be reasonable for h~ ;:malysis of co.urt operationti, although focllsedOI1 the District of Columbia court system and could be d<;lay 1\1 the proceeehng of felon), defendants in the Disused as a standard against which to measure delay. tl'lct of Co,lumbia, leads to recommenclations for court
operatlOns 1Il general: LJ An intensive data collection effort should be insti-
tuted in the District of Columbia court system in [J A unifOl1l1 clata base should be established in order QI'dcr that the present simulation can be refined and th~t l11eani~gJul and useful analyses can be aCCOl11" other analyses perfornlecl. This data collection phsh?d to Isolate problem areas ancI recommend should record the time, in minutes and hours not solu tlOns on a county, State or National level. just days, that is actually spent in processing th~ 0 The COURTSIM model should be extended to defendant, by what court offirial or staff' member se:'era.1 large .urb~l~ arcas as a pilot study to deter-this is done, and what a,-tian is taken. This should mme Its applicability to other court R),stems and its c.over all ~ases from time of arrest to final disposi- over~ll usefulness. C.o~currentl}' with these pilot tlOn, not Just those cases that are commenced in stuches, a more sophisticated computer language' District Court. Sl;c1; an efTor~ would n?t be unduly sho~d~. be clcveloped to increase the efficiency m\d burdensome; statistical samplmg techmques can be ficxJiJllity of the simulation program. uSe'd, fo~'l11s prepared and those persons already in-\'olved 111 the system could record the necessary , The Task Force has focused on delay and workload. information. Clearly there arc o~her. areas of equal importance that
o The COURTS 1M model can be refined with better deser~'e clos~ ~Xamll1l1tlOn: upc1atC'cI ~11~nagC1l1ent 1'1'0-
1 I · 1 c .. cclll\ es aciI11ll1lsterecl by a Court aclnll\1lstrator,' e""llla-~ ata ane 111 c ('se coordination with court officials; t f tl I vu It should be p .. l1'Suec! ancl imbedded in the court 1~11 0 -le ~ost ane manpower )'equir('mcnts associated s),stem to provide court management with a useful With pot?ntlal changes in tht, system; organizational t I I~ I . ~hD:~g.es 111 some courts; and the lay'ou t of !)hysical 00. j urtlermore, it has the potential [or including lacllltles.
AOKNOWLEDGEMENTS The authors gratefully
acknowledge the valuable assistance
of Robert H. Cohen and Janice R. Heineken, both
of IDA, in the programing of the simulation.
--~.---'---..-.. -, - .. - -- -'"-_ .. ---...,., ...... --
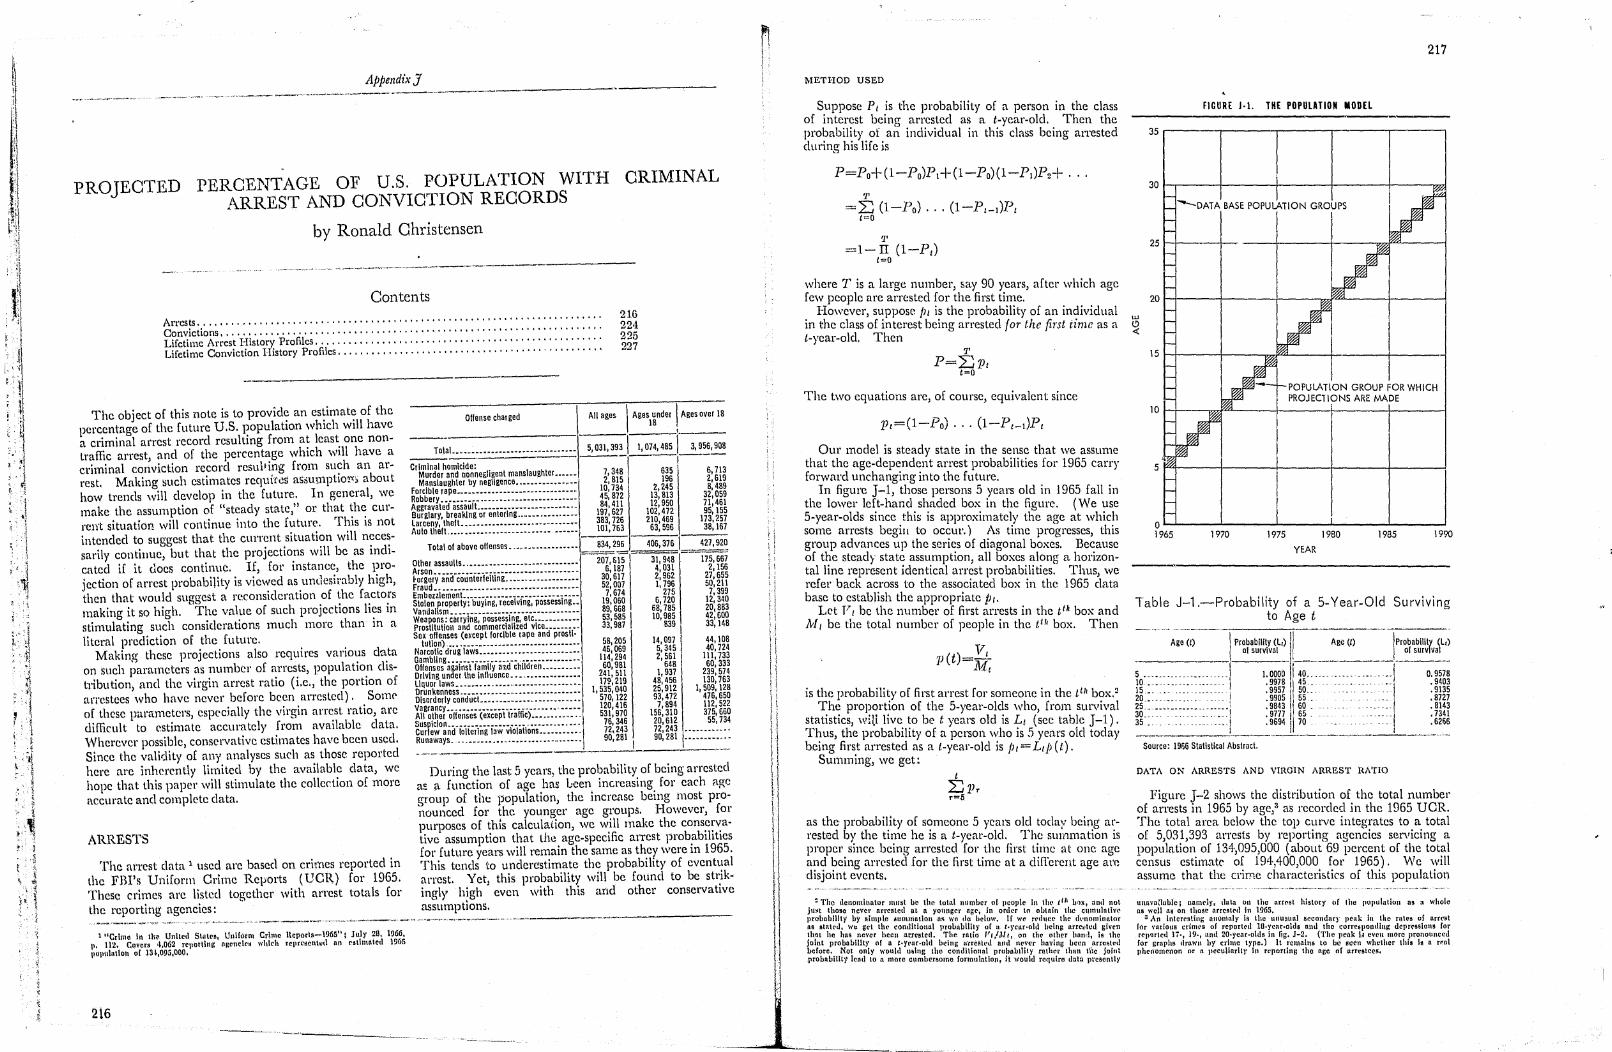
I, .
Appendix]
PROJECTED PERCENTAGE OF U.S. POPULATION WITH CRIMINAL ARREST AND CONVICTION RECORDS
by Ronald Christensen
Contents Arrests ...................•...........•.....•..............•....•............... Convictions, .........................................•.........•....... , ... , . , •. Lifetime Arrest History Profiles, .......•...•.......... , ...........•..•............. Lifetime Conviction History Profiles ......•.•............................ ' , ........•
216 224 225 227
The object of this note is to provid~ an es~imat~ of the percentage of the future U.S. populatiOn which will have a criminal arrest record resulting from at least. ?ne nontraffic arrest and of the percentage which Wilt have a criminal co~viclion record resul!ing from such an arrest. Making such estimates requir.::s assumptio!<~ about how trends will develop in the future. In general, we make the assumption of "steady state," or that ~h~ current situation will continue into the future. ThiS IS not intended to suggest that the current situation will necessarily contiIlue, but that the projections will be as indicated if it does continue. If, for instance, the projection of arrest probability is viewed as undesirably high, then that would suggest a reconsideration of the factors making it so high. C The value of such projections lies in stimulating such considerations much more than in a literal prediction of the future.
Makincr these projections also requires various data on sllch l~arameters as number of arrests, population distribution, and the virgin arrest ratio (i.e., the portion of arrestees who have never before been arrested). SO\11(' of these pal'ametc1's, especially the virgin arrest ratio, are difficult to estimate accurately from available data. Whercver possible, conservative estimates have been used. Since the valklity of any analyses such as those reported here are inherently limited by the available data, we hope that this paper will stimulate the eollertion of more accurate and complete data.
ARRESTS
The arrest data 1 used are based on crimes reported in the FBI's Uniform Crime Reports (OCR) for 1965. These crimes are listed together with arrest totals for
Offense char ged All ages \ Age\~nder tAgeS over ~ -----
~~I 1,074,485\ TotaL ______ • _________ • -. --------. --- 3,956,908
Criminal homicide: 7,348 635 6,713 Murder and nonne,ligenl manslaughler. _____ Manslaughter by negllgence •• -----------.-- 2,815 196 2,619
10,734 2 245 8,489 Forcible rape _________ ••• ------ '-' -------- .. 13: 813 Robbery __________ ._ -_ •• _. ------- -- -. --' --- 45,872 32,059
Aggravaled assaull.. _______ .------------ -- •. 84,4!1 12,950 71,461 Burglary, breaking or enlerlng .. -___ • ____ . ____ 197,627 102,472 95,155 Larceny, lhefl. ____ ._ •• _. ---. --., -' --- ------ 383,726 210,469 173,257 Aulo lhefL._ ••• _______ .·.··_·_· _____ ------ 10!,763 63,596 38,167
Tolal of above offenses_._. _________ •• ___ 834,296 406,376 427,920 ==-= -
other assaults. , _____ -. --.------ -., • -------- 207,615 31,948 175,667 Arson_. ___ • __ • __________ • ________ .. _._. ___ 6,187 4,031 2,156 forgery and counlerfelting .. __ ... ____ ••• _____ 30,617 2,962 27,655 Fr~ud _ •. ________ .. -___ •• _ ----.--. ---- --.-- 52,007 1,796 50,211 EmbezzlemenL. _____ •• -- ____ ----- ---- ------ 7,674 275 7,399
~~o~~~lrsr~~~r_l~~_b_~:I_n~~::::~~I_n_g~_~~:s_e_s:~~~:: 19,060 6,720 12,340 89,668 I 68,785 20,883
Weapons: carrying, possessing, elc. ______ ._ ... 53,585 10,985 42,600 Prostitution and commercialized vlce __ • ____ •• 33,987 839 33,148 Sex offenses (excepl forcible rape and prostl·
58,205 14,097 44,108 lutlon) ..... ____________ ••• --•• --. -- -.-- --Narcotic drug laws. ___ • __ ._ ... _. __ • ___ ••• __ · 46,069 5,345 40,724 Gambling •• _______ ., '-'-' -- .. - --- -" -'--- -- 114,294 2,561 111,733 Offenses agalnsl family a~d chlldren. __ • ______ 60,981 648 60,333 Driving under lhe innuence .. _,. ________ • __ •• 241,511 1,937 239,574 Liquor laws •• __ .,. _ •.•• __ ,. _______ ••• _ '--"- 17~, 219 48,456 130,763 Drunkenness. ___ • _ •• ____ -•.•• --.- -. -. ---.-- 1,535,040 25,912 1,509,128 Disorderly conduc!._ ••••••• __ • __ ............ 570,122 93,472 476,650 Vagrancy ...... ____ • __ • ___ ••• __ ••• _ ... -.--- 120,416 7,894 112,522 All olher offenses (except lralfic)._ ........... 531,970 156,310 375,660 Susplclon .•• _ .... _ •••• ____ .. _ .•• ---........ 76,346 20,612 55,734
*~~:~a~~~ .1~~~e:~~~_I~~ .~i~~~I~~~~:: ::::::::: I 72.243 72,243 .. -_ .. ~ .......... ~ . 90,281
I 90,281 .. -.............. ~ ....
--,....,. .. -~.-
During the last 5 years, the probability of being arrested aE a function of age has been increasing for each ag:c group of the population, the increase being most pronounced fer the younger age groups. However, for purposes of this calculation, we w.ilI make the cons::~ative assumption t!lat the. age-speclfk arrest prob.ab1htl~s for future years Will rema1l1 the same as they were 111 196::>. This tends to underestimate the probability of eventual arrest. Yet, this probability will be found to be stl:ikingl)' h!gh even with thi.s arid other conservative assumptions. the reporting agencies:
. ,~-.'-'-~ .-.".~ ........................ _ ..... _- --,_ .. , ............ '-_ ..• -'" .. "-.. ~ ... -".---~"-.. ----------_.---------1 "Crime III 1110 Unlt«1 Shlte., Uniform CrIme l\cporls-1965"; July 28, 1966.
11, 112~ Covers 4,062 rrVuttlnc ili:Cnc:icll whirll rCllrcscuh:t1 no ('sthnnt~Hl 1965 pOllltlnlloll of 131,095,000.
216
, , i'
i 1\ , '
I! \ ' q \ 1 i I , \ i I \ i I'
II II , i q II !I \ I
METHOD USED
Suppose PI is the probability of a person 111 the class of interest being arrested as a t-year-olcl. Then the probability of an individual in this class being arrested during his life is
'1' =1- II (1-PI)
1=0
where T is a large number, say 90 years, after which age few people are arrested for the first time.
However, suppose III is the probability of an individual in the class of interest being arrested for the first iime as a t-year-old. Then
T
P=~1)1 1=0
The two equations are, of course, equivalent since
Our model is steady state in the sense that we assume that the age-dependent arrest probabilities for 1965 carry forward unchanging into the future.
In figure J-1, those persons 5 years old in 1965 fall in the lowel' left-hand shaded box in the figure. (We use 5-year-olds since this is approximately the age at which some arrests begiu to occur.) As time progresses, this group advances up the series of diagonal boxes. Beeause of the steady state assumption, all boxes along a horizontal line represent identical arrest probabilities. Thus, we refer back across to the associated box in the 1965 data base to establish the appropriate PI.
Let 1"1 be the number of first arrests in the till box and MJ be the total number of people in the ttll box. Then
p(t)=Y: NLt
is the probability of first arrest for someone in the ttll box.2
The proportion of the 5-year-olcls who, from survival statistics, witi live to be t years old is L t (see table J-l). Thus, the probability of a person who is 5 yenrs old today being first arrested as a t-year-old is j1t=Ltj1(t).
Summing, we get: 1
~Pr r=5
as the probability of someone 5 years olel toclay being arrested by the time he is a t-year-olel. Thc summation is proper since being arrested for the first time at one age and being arrested for the first time at a difl'erent age am disjoint events.
~ Tho denominator mllst bn the totnl number or people in th~ tl1~ b"'~x, nnd nol jll!&t thoso "eyer arrested at n YQ\ln~cr nst'. in order to obtall1 the «:nmululiw.' probahillty by ailllilic AUIlUnntlol1 n:<li WO do heluw. If W~ rt'duc(' the d~'nomlnntot as stntl·d. we gel thl' conditional pfobnbilil)' or n i·renr-old heing nrrc~\:tctl given thl1t he hns neVer heell arrested. The rotio 1',,IM, I on the other hnll!'1, is the jo1nt probability nr n t·yrur.old bl!ing tl'rrcstl'J, arut nevcr havIng heen ,arrested before. Not ani)' would using the conditional probabIlity rathel' than t)11C joint rrobabilit ,' lend 10 n more cumbersome formulation, it woultl require do.tn presently
217
FIGURE J.1. THE POPULATION MODEl
35r-------r-------r-------r-------r-----~
30r.----_+------4-----~~----_+----~~
---DATA BASE POPULATION GROUPS
I I
25~-----4------+_------~----~
20~------+_------~----~,~----~r_----~
15~------+_--___ ~~~-----+-------+-------~
POPULATION GROUP FOR WHICH PROJECllONS ARE MADE
101-+----
5~----~~-----+------~------4_----~
O~----~------~-----L------~-----J 1965 1970 1975 1980 1985 1990
YEAR
Table J-1.-Probability of a 5-Year-Old Surviving to Age t -_ ......... _._--------,.,.".
\1 Probability (L,) II of survival
Age(t) Age (I)
.-------!prObabllitY (L,)
of survival
5 ............. __ ........ !r---!.-OO-Oil-II~~~-10 ........ " ......... _. .9978 \45 .. ::I 0.9578
.9403
.9135
.8727
.8143
.7341
. 62~6
15._ ... _ .......... . .9957 50..
~L:::::::::::" .. ::.:.! :~~~~ \ ~g: 30 ... -. .. -.... " .... I .9777 1 65 ... 35. ........ .•. .9694 70
SOUrce: 1966 Statisllcal Abstract.
DATA ON ARRESTS AND VIRGIN ARREST RAnO
Figure J-2 shows the distribution of the total number of arrests in 1965 by age,3 as recorded in the 1965 VCR. The total area below the top curve integrates to a total of 5,031,393 arrests by reporting agencies servicing a population of 134,,095,000 (about 69 percent of the total census estimate of 194',400,000 for 1965). We will assume that the crime characteristics of this population
unavunablc; nnmely. dut« 011 lllo arr~st history of the pOJlulation os n Whole os well as on those arrcstC'd In 1965 •
:J An interesting lHu)lIlaly is the urlu9unl sccondurr )leak in the- rntes of nrfrst hlr various crimrs of rcportrd IS,year.olds nnd the correspondIng ucpr('ssions for repurtetl 17., J9,. and 20'ycar.tllds in rig. J-2. (The peak h cn'u mOre pronounced (or graphs drawn by crime type.) It remains to be $crn whether this Is n rrn) phcllomcnon or u pceuUnrHl' in rl'porting the aGe o( Urrcsll!ecs.
li
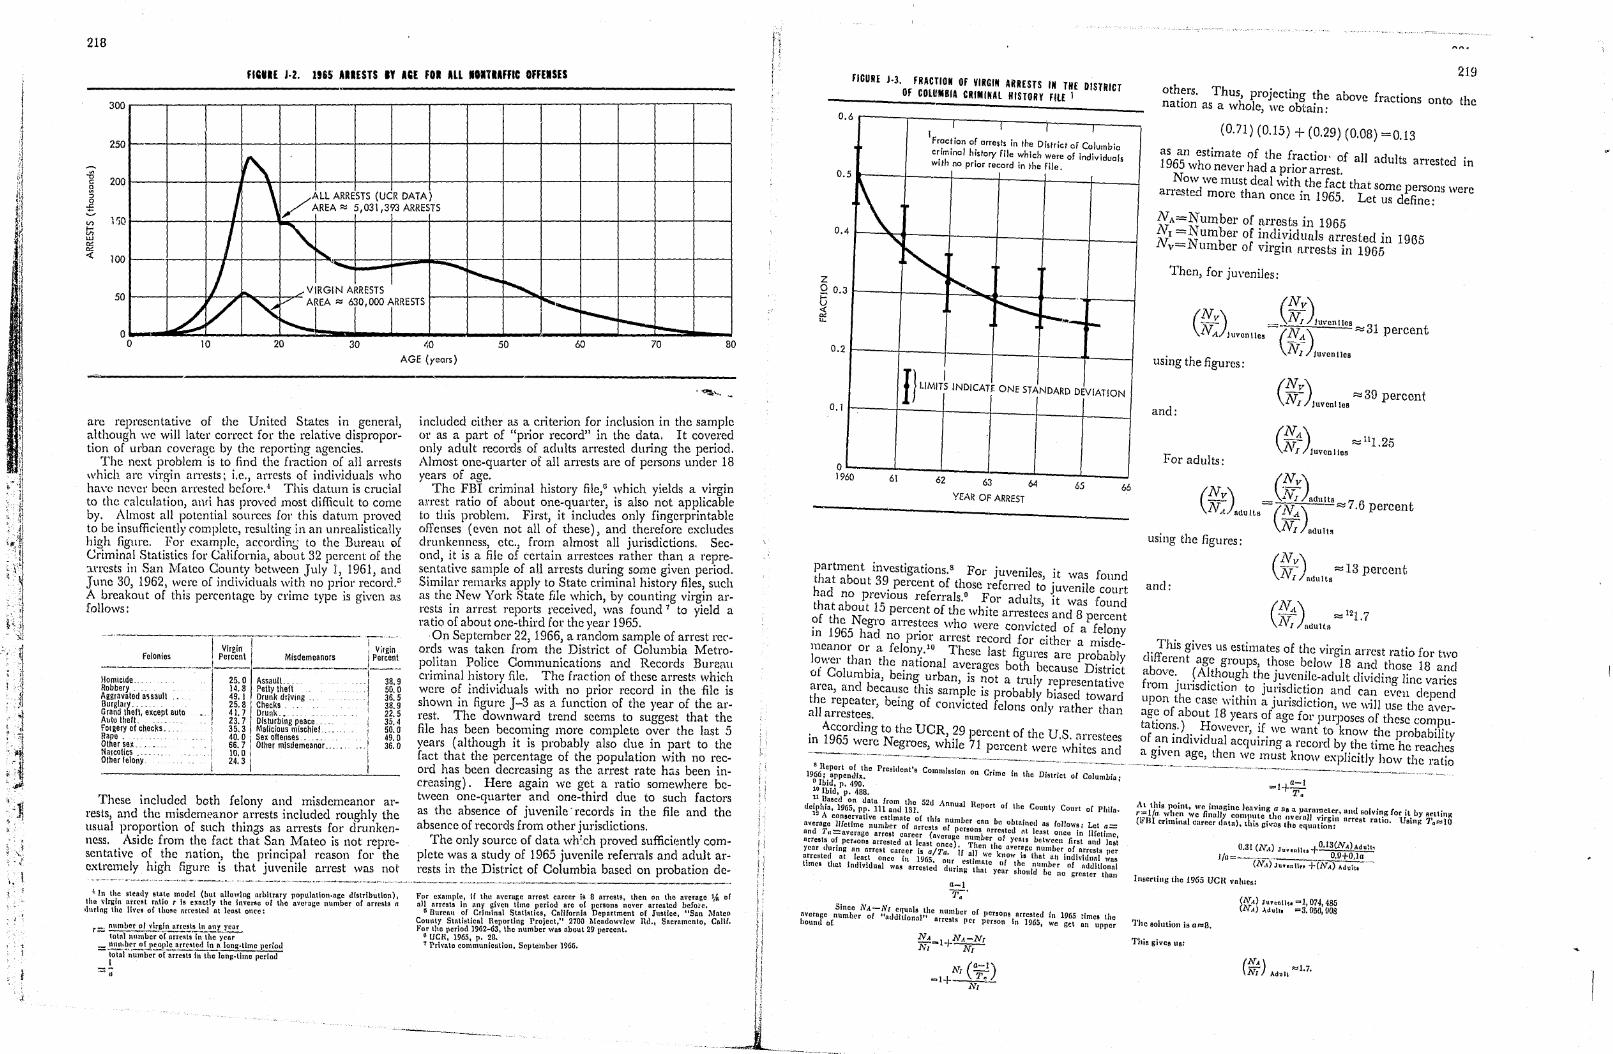
; :
I, i
. ,
.. I
218
flCllI1£ J·2. 1165 .IIESTS IY ACE FO. ALL 'OIlUFfle OFFEISES
300
250
11 200 c If\
Sl '" 0
J \ ALL ARRESTS (UCR DATA) / AREA:::: 5,031,393 ARRESTS t
V) 1'iO l-V> w
"" "" <: 100 7 ~ ~ /
.. , ........ ~
'" VIRGIN ARRESTS ~ 50
o o
L V '< ~lEA :::: , 0,000 TRESTS 1' ......... r---. 10 20 30 1,0 50 60 70 80
AGE (years)
are representative of the United States in general, although we will later correct for the relative disproportion of urban coverage by the reporting agencies.
The next problem is to find the fraction of all arrests which are virgin arrests; i.e., arrests of individuals who have ne\'er been arrested before.·1 This datum is crucial to the calculation, and has proved most difficult to come by. Almost all potential sources for this datum proved to be insufficiently complete, resulting in an unrealistically high figure. For example, accord in;; to the Bureau {)[ Criminal Statistics for California, about 32 percent of the :U'rests in San 1tfatco Cl1unty between July 1, 1961, and June 30, 1962, were of individuals with no prior record.:; A breakout of this percentage by crime type is given a.s follows:
Felonies I Virgin ~rg'i~ . Percent Misdemeanors i Percent _____ .. __ 1 _______________ 1 __ _
Homicide.. 25.0 Assault... . "'1 38.9 Robbery. .. 14.8 Petty theft . 50.0 Aggravated assault .' 49.1 Drunk driving. . I 36.5 Burglary.. . . .. 25.8 Checks. , 38.9 Grand theil, except auto 41. 7 Drunk... '. '22.5 A~tu Ihefl. . ... 23.7 OIsturblng peace.. .. 35.4 FOlgery of checks. 35.3 Malicious mischief... . 50. a Rape. . 40.0 I Sex offenses ... -. 49.0 Other sex.. . 66,7 Other mlsdemeanor..... 36.0 Narcotics.... 10.0 I Other felony. 24.3
These included beth felony and misdemeanor arrests, and the misdemeanor arrests induded roughly the usual proportion of slich things as arrests for drunkenness. Aside from the fact that San 1'fateo is not representative of the nation, the principal reason for the extremely high figure is that juvenile arrest was not
·1 In the stendy stato model (hut nllowlng nrbltrnry pop~Iatlon.age dislribution). tho virgin arrest mUo r is exactly the inverse or the avc.!'tlgc number of arrests n
.\I11rinl; the th'cs oC thop,c nrrested nt leust once:
r ~ ~'m~e\'-2..!.!!!~~l!1~.!.t!.~~~ tutal number of arrcsts tn the year
_ tHllhlH'f or people nrrC!olcd tn n long.litnc PCf(OU - i;Gr;;umbCror;;rrosls in tho long.thn. period
I =-;;
'~'-- .. included either as a criterion for inclusion in the sample 01' as a part of "prior recQrd" in the data. It covered only adult records of adults arrested during the period. Almost one-quarter of all arrests are of persons under 18 years of age.
The FBI criminal history file,o which yields a virgin arrest ratio of about one-quarter, is also not applicable to this problem. First, it includes only fingerprintable offenses (even not all of these) and therefore excludes drunkenness, etc., from almost all jurisdictions. Second, it is a file of certain arrestees rather than a representative sample of all arrests during some given period. Similar remarks apply to State criminal history files, such as the New York State file which, by counting virgin arrests in arrest reports t'eceived, was found 7 to yield a ratio of about one-third for the year 1965.
On September 22, 1966) a random sample of arrest reC'ords was taken from the District of Columbia Metro· politan Police Communications and Records Bureau criminal history file. The fraction of these arrest~. which were of individuals with no prior record in the file is shown in figure J-3 as a function of the year of the arrest. The downward trend seems to suggest that the file has been becoming more complete over the last 5 years (although it is probably also due in part to the fact that the percentage of the population with no record has been decreasing as the arrest rate h:is been increasing). Here again we get a ratio somewhere between one-quarter and one-third due to such factors as the absence of juvenile' records in the file and the absence of records from other jurisdictions.
The only source of data whl.ch proved sufficicmtly complete was a study of 1965 juvenile referrals and adult arrests in the District of Columbia based on probation de-
For example, if tho average nrrest career is 8 arrests. then on the nverng,e lh DE 811 arrests in nny C"'CIl lime period arc of persons never arroatcd Vcf01C.
G Uurenu of Crlminal St.o.tistics, CaBfornia Department of Justicc, liS an ~"fnteo COlltlty Siniisiioni Reporllng Project," 2700 Meadowview Rd •• Snernmenlo. Cnlif. For Iho period 1962-63, the nllmber wns nbollt 29 porcent.
• UCR, 1965, p. 2B. T Private communicnt:on, Scptclnhcr 1966.
! I
: !
J I i
fiGURE J·3. fRACTlOIi or VIRGIN ARRESTS III THE DISTRICT Of COLUMBIA CRIMINAL HISTORY filE 1
0.6 r--r-j---r-----r---,-----. I I I I
219
oth~rs. Thus, projecting the above fractions onto the natIon as a ,.."hole) we obtain:
(0.71) (0.15) + (0.29) (0.08) =0.13 IFr?C!iO~ 0h: arrests in the District of Columbia c~lmlna ~story file which were of individuals WI th no prior record in the file.
0.5 t---r-.~r--+--t--+----!
\' ~~6'5n ehstimate of the f:actiol' of all adults arrested in
w 0 never had a pnor arrest. Now we must deal with the fact that some ersoll~ were
arrested more than once in 1965 L t dPfi . . e us e ne:
0.4,~~--t---+---I--4-_! ':" NA=Number of arrests in 1965
NNI =N umber of h~diyiduals arrested in 1965 v-Number of vIrgm arrests in 1965
Then, for juveniles:
§ 0.3 r---t---f-~~~l---!--o ~ ~----~
~ , ,r-."'-t-(Nv)
(Nv) ~ \N; JWenlies
0.2 ,--r--r---+--t---~--J l.V,l juveniles -C-!!1.) ""'31 percent
. NI Juveniles uSing the figures:
I} LIMIT~ INDICAn: ONE STANDARD DEVIATION
0.1 ~--r--t--+-_l--_+_-_J
?9~60~----6;1~----:6:2------6~3------~1------J65L-----~66 YEAR OF ARREST
partment investigations.s For juveniles, it was found ~h~t about 39. percent of those referred to juvenile Court . a no preVlQUS referrals.o For adults) it was found t1athab~,t 1.5 percent of the white arrestees and 8 percent ? i9~" egtO arr('s~ees who were convicted of a felony lJ1 ::J had no pflor arrest record for either a misde meanor or a felony.lO These last figures are probabllo\<:er than the national averages both b D' ' . Y of Columbia b . . ' ecause Istrrct
. ' emg ~rban, IS not a truly representative mea, and becau~e tIllS sample is probably biasecl toward tlllle repeater, bemg of convicted felons only rather than a arrestees.
According to the UCR 29 f h in 196r. ' . percent 0 t e U.S. nrrestees :J were Negroes, whIle 71 percent were whites and
and: (~v) "'" 39 percent
I Juveniles
For adults: (NA) -r- "",111.25
1\ I luven 1108
(~)ndtllta (NA) ::::::7.6 percent
NI nduliR using the figures:
ancl: C
Nv) 7\r "'" 13 percent .l\ I / ndults
( N'l) -1217 lV1 adults - •
rJ'l~is give~ US estimates of the virgin arrest ratio for two (1 e,lCnt age groups, tl-;ose ~elow 18 and Chose 18 and fbove.. ~A~th~)llgh the Juvcl111e-adult dividing line varies
'Report of Ihe Presid I' C t I • 1966; appendix. en s omm 8S 011 on Clime in the District ot Columbia i
rom JunsdICtlO~ ~o jU~'is~ic~ion and can evell ell! ;end ~pon the case wlthm a JUrisdiction, we will use the ~ver,g~ of about 18 years.of age for purposes of these computatlOn~.) . ~owever) If we want to know the probabilit of ~n mdlvldual acquiring a record by the time he reach!s a gIVen age, then we must know explicitly how the ratio
-~~-~.- .-~~ --......,...--------'.-....... ~-------........---~ . ..-.."-
D Ibid. p. 490. 10 Ibid, p. 488. 11 na.ed on ~ala from the 52<1,., 1 R
dcl~ltia, 1965, pp. III nntll31. • nnun eport of Ihe Coullty Court of Phil •• A conservative estimate of tM h .
average lifetime number of nrrcslss arume cr CDn hl~ obtnmcd Ds (ollows: Let a= nnd Tu=nveragc nrrest cnreer (nv p nons nrrc~ted "t least once in lifetime arrests of perdons arrested at least o~~~~c "TIlLer I o~ yeDIB between first anti last )'cnr during nn arrest career is alTa if 1100 t k nver8~e number of arrests per a,rrested at IeD!.t Ollce in 1965 . a. We now 15 that uu indlvidual was tllne8 that individual was arrested ':Jur. CSlJTIUC of the number of ndclltionni
unog 110t yc:ur should be no grenter thon
a-I 'l'd'
Since NA-Nt equnl. Ih b f nvcrage number of "additionalH c nom cr 0 l)Crso"! arrested in 1965 times the hound o( arrests per person in ]965, we get an upper
=l+!:.=.! 7!.
.t~l this point, we imagine lenving a 3S i3. l,aru t tl I. . r·~l/(1 when We finally compute the ovefuH R!e ~r, Ull so Vl~g {o~ It by seUinK (lfBI criminal career dntu). this gi'-"us the eqUn~i~~ll:" Ilrrest ratio. Using TQ~10
0.31 (NA) Ju ... U .. + O.13(N.lAdult. 1/a=-__ .... __ 0.9+0.la
(N.,) JUHnn" +(1V.) Ad"lt"-'~
Insertillg tIte 1965 UCH vullle.:
'rhe solution is a~8 •
This gives us!
«'NV.) Ju".U" =1,074,485
A) Adul" "'3.956,008
(NA) - ""1.7. Nt Adult
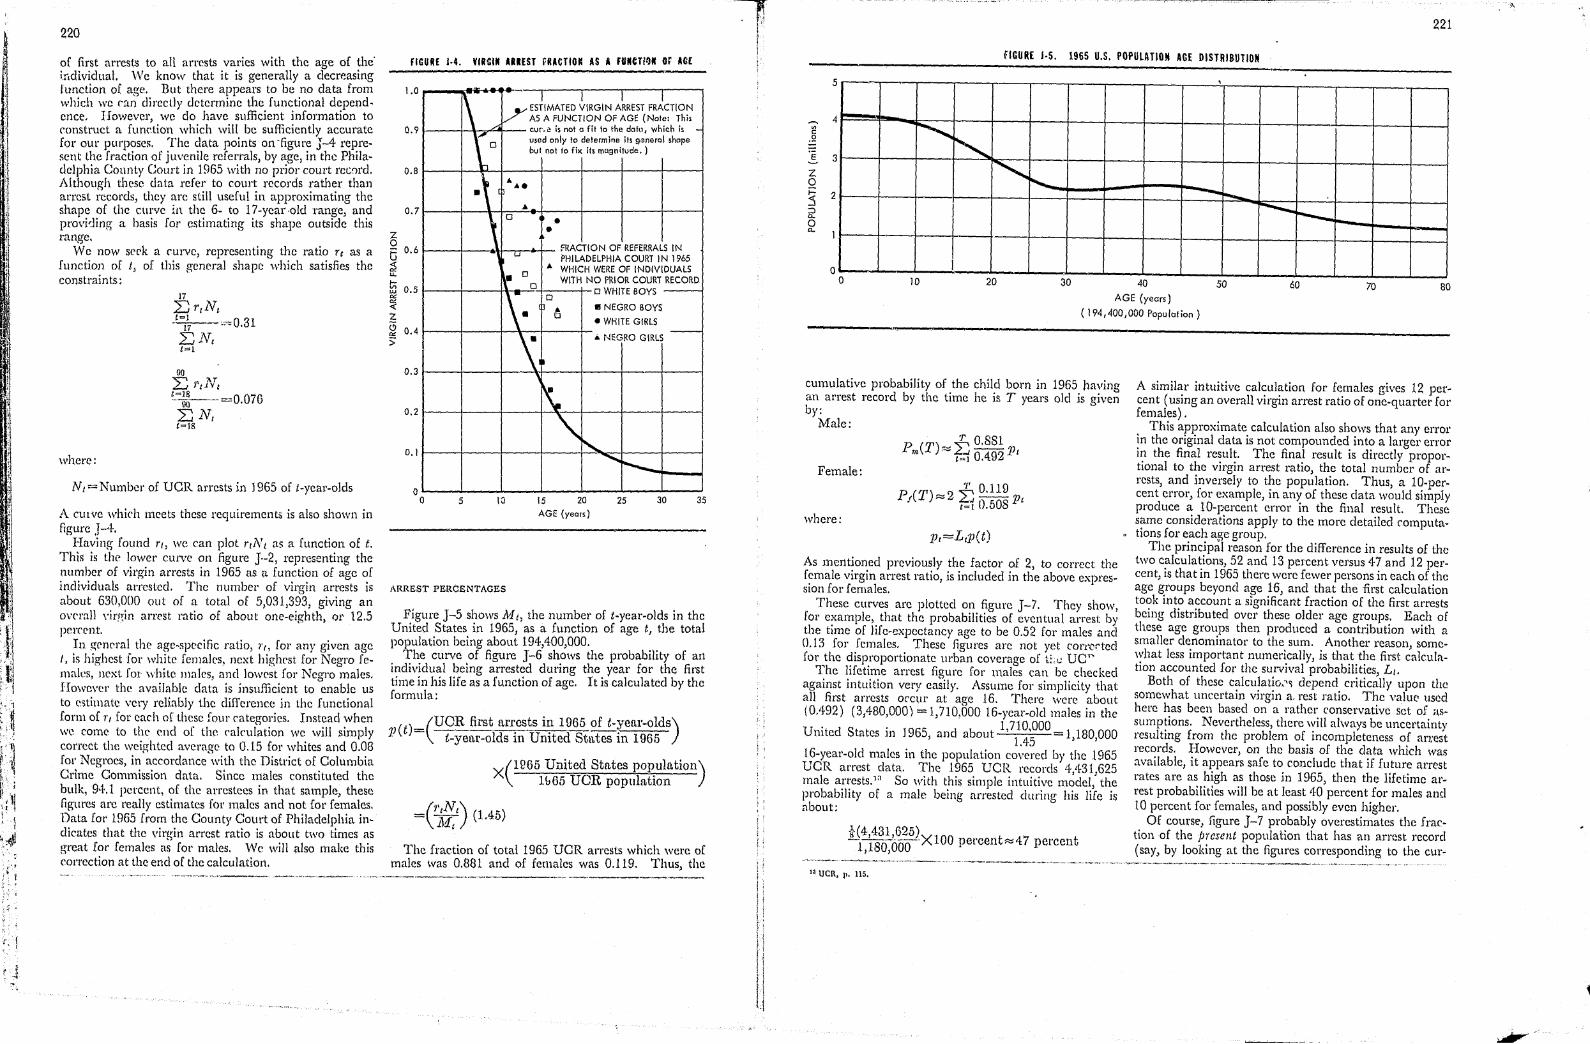
[\ .' I
220
oC first arrests to all arrests varies with the age of the' irldividual. 'Ve know that it is generally a decreasing function of age. But there appears to be no data from which we (,.1n directly determine the functional depend. ence. However, we do have sufficient information to construct a funetion which will be sufficiently accurate for our purpose,. The data points on -figure J-4 represent the fraction of juvenile referrals, by age, in the Philadelphia County Court in 1965 with no prior court rewrd. Although these data refer to court records rather than arrest records, they arc still useful in approximating the shape of the curve 111 the 6- to 17 -year ·old range, and providing a basis for estimating its shape outside this range.
We now sC'ek a curve, representing the ratio rt as a function of tj of this general shape which satisfies the constraints :
where:
N/ = Number of UCR arrests in J 965 of t-year-olds
A CUlve which meets these requirements is also shown in figure J-+.
I-laving found r/, we can plot TINt as a function of t. This is the lower curve on figure J-2, representing the number of virgin arrests in 1965 as a function of age of individuals arrested. The number of virgin arrests is about 630,0[)0 out of a total of 5,031,393, giving an overall \'irgin arrest ratio of about one-eighth, or 12.5 pCl'cl"nt.
In gem'ral the age-specific ratio, 1"/, for any given age J, is highest [or white females, next highest for Negro femall.'s, next fot white males, and lowest fol' Negro males. However the available data is insufficient to enable us to (~stilllate very reliably the difference in the functional form of 1", for each of these four rategol'ies. Instead when we come to the end of the calculation we will simply correct the weighted average to 0.15 for whites and 0.08 fO!' Negroes, il1 accordance with the District of Columbia Crime Commission data. Since males constituted the bulk, 94.1 jlercent, of the arresters in that sample, these figures arc really estimates for males and not fat' females. Data [or 1965 from the County COllrt of Philadelphia indicates that the virgin arrest ratio is about two times as great [Of females tiS [or males. We will also make this (,Ol'l'cction at the end of the calculation.
fiGURE 1·4. VIRSIII ARREST rUCTIOIC AS A FUllerl!)1I or AG£
z o
1.0
0.9
0.8
0.7
6 0.6
~ u.
ffi 0.5 P<
~ Z
~ 0.4 >"
0.3
0.2
0.1
I
a o
1\ ~ - i
/'" ES~IMATED ~IRGIN A~REST FRACTION AS A FUNCTION OF AGE (Note: This cur"" is not a fit 10 the datu, which is -
~o used only to determine its general shope but not fo fix its magnitude. )
.\ ••• ..
\ 0 • •
fRACTION OF REFERRALS IN , u PHI LADELPHIA COURT IN 1965
0 • WHICH WERE OF INDIVIDUALS r WITH NO PRIOR COURT RECORD 0 o WHITE BOYS
~. 0
• II NEGRO SOYS 0
• WHITE GIRLS
'\ ... NEGRO GIRLS -
~.
" ~ ........ r----5 10 15 20 25 30 35
AGE (years)
ARREST PERCENTAGES
Figure J-5 shows M t, the number of t-year-olds in the United States in 1965, as a function of age t, the total population being about 194,400,000.
The curve of figure J-6 shows the probability of an individual being arrested during the year for the first time in his life as a function of age. It is calculated by the formula:
(t)=(VCR first arrests in 1965 of t.year-olds) p t-yea~'-olds in United States in 1965
X(HJ65 United States populatiOll) 11165 VCR population
The fraction of total 1965 DCR arrests which were of males was 0.881 and of females was 0.l19. Thus, the
W I . [ j
j I
; , .
; 1
> . 1 ' , \ ;
221
mURE J-5. 1965 U.S. POPULATION ACE DISTRIBUTION
5 ,
~ 4 "' c
,Q
I 3
Z 0 j::
2 :5 it 0
~
" '" i'.... - 1"'-0...
I -........ r--.. "-
o I o 10 20 30 40 50 60 70 80
AGE (years)
(194,400,000 Populotion)
cumulative probability of the child born in 1965 having an aI'l'est record by the time he is T years old is givcn by:
Male:
Female:
where:
As mentioned previously the factor of 2, to correct the female virgin arrest ratio, is included in the above expression for females.
These CUlves are plotted on figure J-7. They show, for example, that the probabilities of eventual arrest by the time of life-expectancy age to be 0.52 [or males ;and 0.13 for females. These figurcs arc not yet con:"{,c·tccl [or the disproportionate urban coverage of tLJ UC"
The lifetime arrest figure for males can be checked against intuition very easily. Assume for simplicity that all first arrests occtn' at age 16. There were about (OA92) (3,480,000) = 1,710,000 I6-year-old males in the
United States in 1965, and about 1,711.~~00 1,180,000
16-year-old males in the population covered by the 1965 UCR arrest data. The 1965 UCR records 4A31,625 male arrestsY So with this simple intuitive model, the probability of a male being arrested dming his life is about:
H4,431,(25) -1,180,000 XIOO pel'cent~47 percent
la ueR, )1. 115.
A similar intuitive calculation for females gives 12 percent (using an overall virgin arrest ratio of one-quarter for females) ,
This approximate calculation also shows that any errol' in the original data is not compounded into a larger error in the final result. The final result is directly proportional to the virgin arrest ratio, the total number of arrests, and .inversely to the population. Thus, a lO-percent error, for example, in any of these data would simply produce a lO-percent error in the final result. These same considerations apply to the more detailed computations for each age group.
The principal reason for the difference in results of the two c~lcula~ions, 52 and 13 percent versus 47 and 12 percent,lS that III 1965 there were fewer persons in each of the age groups beyond age 16, and that the first calculation took into account a significant fraction of the first arrests being distributed over these older age groups, Each of these age groups then produced a co.ntribution with a smaller denominator to the sum. Another reason, somewhat less important numerically, is that the first calculation accounted for the survival probabilities, Lt.
Both of these calculati(h'~ depend critically upon the somewhat uncertain virgin a, rest ratio, The \'aluC' used here has been based on a rather conservative set of <issump~ions. Nevertheless, there ,~'ill always be uncertainty result1l1g from the problem of lI1completeness of arrest records. However, on the basis of the dat:a which was available, it appears safe to conclude that if future arrest rates are as high as those in 1965, then the lifetime arre8t probabilities will be at least 4·0 percent for males and 10 percent for females, and possibly even higher.
Of course, figure J-7 probably overestimates the fraction of the jncsent population that has an arrest record (say, by looking at the figures corresponding to the cur-

I l
I I
I !
222
FIGURE 1·5. IUS VIIiCIN AlIEST PlO'UILITY BY AGE fOR All lOUIAFfle OfFENSES
0,025
~ ."" 0.020 ~ ~"" 0;5 ~ >- 0.015 >0 O?: ~ ~ 0,010 ::;0 i:Q
~ 0.005 g;
o o
1\ L .. ~. } 1 ,
i' .... ~
J "-10 20 30 40 50 60 70 aD
AGE (years)
FIGURE J.7. PROBABILITY OF AN INDIVIDUAL S·Y£AR OLD BEING ARRESTED FOR A NOIHRAFflC OFfENSE BY THE TIME HE RUCHES GIVEII AGE, ASSUMING FUTURE ARREST PROUBllITlES REMAIN THE SAME AS THOSE III 1965
0.6 0
"" 0 0.5 u -UJ
"" l-V> UJ
"" 0.4
rr6Cleo) ~ .;;~~ "" <I;
0 Z
0.3 ~ J: ll. 0 0.2 >-I-:::; <0 <I; 0.1 <0
0 "" 0-
0
/ ~
L I
J ? ~ ~-~
0 10 20 t30
MEDIAN AGE OF 1965 U.S. POPULATION
rent population median age of 29.5) since the probability of being arrested was lower in the years prior to 1965. A statewide representative sample of 11,329 Minnesota boys and girls (28 ?~:rcent of all 9th-grade public school children for the 1953-54 school year) showed that by the time the)' reached 170z years of age N.2 percent of the bo)'s and 6.3 percent of the girls had either police or court records for offenses more serious than a minor difficulty
H Hathaway, Stein. EHo Monnehc$i, nntt Lo,wnmco A. Young, Journal of Crhninnl Lin" Crimlnology .. d Police Science. 5Q, -133-140 (Jnnuary-Febtuary 1960).
FEMALES (uncorrected)
40 50 60 t 70 t 80
AGE (years) U.S. MALE U.S. FEMALE LIFE LIFE
EXPECIANCY EXPECTANCY
with the police, such as a traffic contact.H Using 1965 arrest probabilities, figure J-7 shows that, to an age of 17 % years, our analysis gives an estimate of about 25.1 percent for males and 6.5 percent for females.
Statistical research of the County Court of Philadelphia, together with school census figures and U.S. census data., shows that as of 1961 about 21.4 percent of Philadelphia boys and 7.1 percent of the girls were referred to courts
before reaching age 18.15 In Fayette County, Ky., as of 1960 it has been estimated that 20:7 percent of the boys and 5.2 percent of the girls were referred to juvenile court before age 18.10 Based on data from a representative nationwide sample of juvenile courts, it has been estimated that about 1 in 6 bOys and about 1 in 23 girls in the country will be brought into juvenile court for delinquency before 18 years of ageY
To distinguish city, suburban, and rural populations on the curves in figure J-8, the appropriate correction factors are:
Males _____ • ______ • _____ • ________ • __ _ Females. _ ... ____ ..... _ ._._ ••• _ ••• __ _
City
1. 190 1.177
Suburban
0.616 .584
Rural
0.431 .305
For example, the city male correction factor was calculated as follows:
(Number UOR city mule arrests in 1965)
Number UCR mule arrests in 1965
( 1965 DCR popUlation )
X 1965 UOR city population
(U.S. male-fraction)
X Urban male-fraction
(3,928,314) (134)095,000) (0.492)
=, 4,43\,625 101,652,000 0.484
=1.190
As an illustrative application, consider a male who was 1 ° years old in 1965 and who can be expected to live in the city for the next 20 years. The probability that he will be arrested at least once by the time he is 30 is:
1.190 (0.40-0.03)=0.44
Using the above correction factors to provide geographic distinctions for the population, we estimate the lifetime probability of a non traffic arrest to be:
______________________________ j __ (-P~_~_~_t) __ :I:--(-~-e~-:-~)-gnt·~!~~~~!~·~:~~~a.I::=:==:=:::::=::=::=:::=:::::=! ~~ r ~~~~~::.: =:=: =: =: = =: =: =:: :=:: ::: =: = =:::: = =: ==: == I
50 62 32 22
12 15 7 4
The "United States in general" figures were obtained from the specific figures for "city," "suburban," and "rural" by allocating 67 percent of the U.S. population to city, 12.6 percent to suburban, and 20.4 percent to rural,1B
milE J·I. ..IU)' 81STORY FOR SAMPLE OF CONVICTED ADULT FElOIIS
UJ ..J Q..
:::;;: «1: VI
Z w Vl
0 J: l-ll.
0 I-Z UJ u "" W 0-
10
9
8
7
6
5
4
3
2
o o
1\ \.
,-
I
.
5 10 15 20 25 30 35 40 NUMBER OF ARRESTS
"481h Annu.l Report of the County Court of Philadelphia. 1961, p. 134; Mann· han, Thoma! P., liOn the Inchlence of Delinquency Soc1n1 }-"orce8," 39, 66-72 (October 1960).
1(1 Dall, John C., AJan Ross, and Alice Simpson, 14lncidcncc Rnd Estimated Prevalence of Recording Deliqucncy jn D lUelropoHtan ,Arcn," AmcriClJn SocIological Review. 29, 91}-93 (Febru.,,· ~-")4).
A
11 Perlman, r. Riehntd, HJuvenitc Court StMistics,u 196,1; ChUdren'e Burenu Slnli$tical Series, No. 83, HEW, 1965, p. 1.
,. 1965 UCR. p. 44. Aclually, Ihe 67 percent releu 10 stAnd.rd metropolitan IIlntisticnl arenSj "suburbnn,1I os u!!Ied in the UCR, inc1uues 1I0me couutles lyIng within SUcll .rcns hut ex~ludlng the core c{ly. However, lho UCR give. In.ur· fic:ient information to improve the alJocDIiQn~
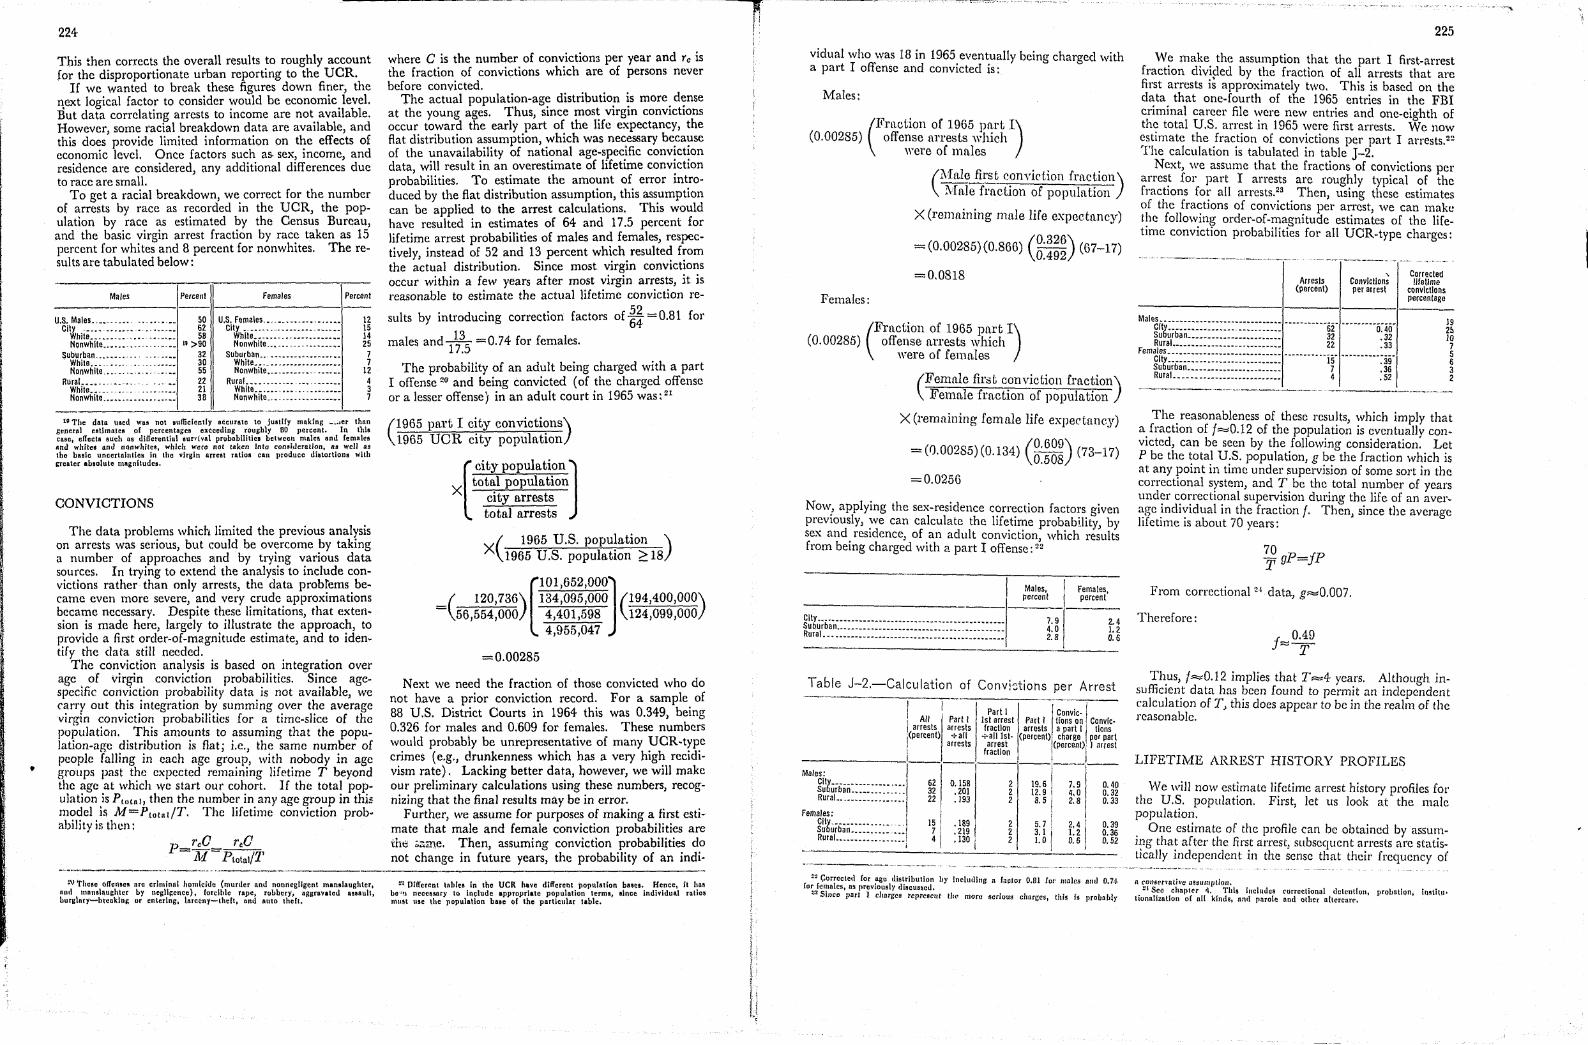
I I
•
224
This then corrects the overall results to roughly account for the disproportionate urban reporting to the UCR.
If we wanted to break these figures down finer, the next logical factor to consider would be economic level. But data correlating arrests to income are not available. However, some racial breakdown data are available, and this does provide limited information on the effects of economic level. Once factors such as, sex, income, and residence are considered, any additional differences due to race are small.
To get a racial breakdown, we correct for the number of arrests by race as recorded in the UCR, the population by race as estimated by the Census Bureau, and the basic virgin arrest fraction by race taken as 15 percent for whites and 8 percent for nonwhites. The results ate tabulated below:
Males
U.S. Males .. _ •....• " ...• " •.•• CUy ................ """
White ......... _. ........ . Nonwhite ............... __ ••
Suburban .•••••.•... """" While......... .. __ ..••••• Nonwhite ..•......•.•.
RuraL..... • __ . . ... _. While ••.•. _ .... _ ........ _. Nonwhite ............. , .•.• _.
Percent
50 62 58
11>90 32 30 55 22 21 3S
Females
U.S. Females .• __ ._ ....... __ ... _. Clty ............... _ •• ___ .. ..
Whlle •• __ ......... _ ....... . Nonwhite.. ....... ' . ______ __
Suburban ..... ____ •• __ ... __ ••• White ......... __ ._._._ .... _ Nonwhite .............. ____ •
Rural. _ ............... ____ __ White .................... _. Nonwhite ..•. _ ...... ______ ..
Percent
12 15 14 25 7 7
12 4 3 7
10 The data used was not sufficiently accurate to justify making •• ;,et than general estimates of pcrcentngcB exceeding roughly 00 percent. In this case, effects such 88 differential 1Iunt'.,.al probnbilitic8 between malcs and femalcs and whites and nQnwhHcft". which were not taken Into consideration, lU wcJJ as tho basic uncertainties in tho vIrgIn aneal rntios can produce dialortions with greater absolute magnitudcs.
CONVICTIONS
The data problems which limited the previous analysis on arrests was serious, but Gould be overcome by taking a number of approaches and by trying various data sources. In trying to extend the analysis to include convictions rather than only arrests, the data probtems became even more severe, and very crude approximations became necessary. Despite these limitations, that extension is made here, largely to illustrate the approach, to provide a first order-of-magnitude estimate, and to identify the data still needed.
The conviction analysis is based on integration over age of virgin conviction probabilities. Since agespecific conviction probability data is not available, we carry out this integration by summing over the average virgin conviction probabilities for a time-slice of the population. This amounts to assuming that the population-age distribution is flat; i.e., the same number of people falling in each age group, with nobody in age groups past the expected remaining lifetime T beyond the age at which we start our cohort. If the total population is P lotn " then the number in any age group in thi!; model ill M=PtotRI/T. The lifetime conviction probability is then:
p_7'cO_~ - ~M - PlotatlT
!lU ThcBC off'Cllscs arc criminal homtcide {murder nnd nonnegligcnt manslaughter. {uul manslaughter by neglisence}, forcible rape, robbery, aggravlted assault, bur.:\nry---b~eaklnG or cntering, larceny-theh, and auto theft.
where C is the number of convictiol13 per year and ro is the fraction of convictions which are of persons never before convicted.
The actual population-age distribution is more dense at the young ages. Thus, since most virgin convictions occur toward the early part of the life expectancy, the flat distribution assumption, which was necessary because of the unavailability of national age-specific conviction data, will result in an overestimate of lifetime conviction probabilities. To estimate the amount of error introduced by the flat distribution assumption, this assumption can be applied to the arrest calculations. This would have resulted in estimates of 64 and 17.5 percent for lifetime arrest probabilities of males and females, respectively, instead of 52 and 13 percent which resulted from the actual distribution. Since most virgin convictions occur within a few years after most virgin arrests, it is reasonable to estimate the actual lifetime conviction re-
sults by introducing correction factors of ~~ = 0.81 for
males and 1~~5 =0.74 for females.
The probability of an adult being charged with a part I offense 20 and being convicted (of the charged offense or a lesser offense) in an adult court in 1965 was: 21
(1965 part I city convictions) 1965 UOR city popUlation
[
city population J X tot~l population
CIty arrests total arrests
( 1965 U.S. population )
X 1965 U.s. population ;:: 18
[
101,652,000]
( 120,736) 134,095,000 (194,400,000)
= 56,554,000 4,401,598 124,099,000 4,955,047
=0.00285
Next we need the fraction of those convicted who do not have a prior conviction record. For a sample of 88 U.S. District Courts in 1964 this was 0.349, being 0.326 for males and 0.609 for females. These numbers would probably be unrepresentative of many UCR-type crimes (e.g., drunkenness which has a very high recidivism rate). Lacking better data, however, we wjlJ make our preliminary calculations using these numbers, recognizing that the final results may be in error.
Further, we assume for purposes of making a first estimate that male and female conviction probabilities are tht:i ~ame. Then, assuming conviction probabilities do not change in fut.ure years, the probability of an indi-
"' Differenl t.ble. in the VCR have dIfferent populallon bue.. Hence, II h •• be'I!, nece~54ry tQ in(:lude appropriate population terms t eince individua.l ratio!! mU$t usc the population baae of the particular table.
vidual who was 18 in 1965 eventually being charged with a part I offense and convicted is:
Males:
(0.00285) oft'ense arrests which (
Fraction of 1965 j)flTt I) were of nudes
(1\1ale first conyiction fraction) l\:fale fraction of population
X (remaining male life expectancy)
= (0.00285) (0.866) (~:!~~) (67-17)
=0.0818
Females:
(Fraction of 1965 part I)
(0.00285) ofl'ense arrests which were of females
(Female firi;t con victioll fraction) Femu,le fraction of population
X (remaining female life expectancy)
= (0.00285) (0134) (0.609) (73-17) . 0.508
=0.0256
Now .. applying the sex-residence correction factors given preVIOusly, ;ve can calculate the lifetime probability, by sex and reSIdence, of an adult conviction which results from being charged with a part I offense: 2'2
Males, Females, percent percent
~~tf~iiiaj,::=::::=::::::::::::::::::::::::::::::::::: ~ - .. - .-~-~ .. - ~ .. ---~ ~~ ... ~ - ~ _ ~ .. ~. __ .. w .... ~ .. _ ~ ~ ~ .. ~ ~_M_
7.9 4.0 2.8
2.4 1.2 0.6
Table J-2.-Calculation of Conv!~tions per Arrest
I I -. Part I convic,!
I All Part lIst arrest Part I lions on Convic· arrests arrests fraction arrests a part I I lions
I(percent) +all +all 1st· (percent) charge per part
arrests arreSl (percent), I arrest fraction I
Males: 1'----;--1-~~t6iirliiiii:::::::::::::: ~~ 0:~5r ~ l~:~! ~:~ ~:~~ RuraL .... _ .. ___ ....... 1 22 .193 2 8.5 I 2.8 0.33
Females; i
~~f~I~~~~::::::::::.:::! 1~ I :m I ~ U i U j n~
225
W~ ma~e. the assumption !hat the part I first-arrest fractIon chvlded by the fractIOn of all arrests that are first arrests is approximately two. This is based on. the data that one-fourth of the 1965 entries in the FBI criminal career file were new entries and one-eighth of th~ total U.S. arrest in 1965 were first arrests. We now estimate the fraction of convictions pel' part I arrests. 2Z
The calculation is tabulated in table J-2. Next, we assume that the fractions of convictions per
arres~ for part r arrests are roughly typical of the fracttons fo~' all arrests.~3 . Then, using these estimates of the fractIOns of conVictIOns per arrest, we can make the following order-of-magnitude estimates of the lifetime conviction probabilities for all VCR-type charges:
Arrests (percent)
Convlctlon~ per arrest
Corrected lIfeUme
conVictions percentage
19 2~ JO 7 5 6 3 2
The. reasonableness of these results, which imply that a. fractIOn of f=0.12 of the population is eventually conVIcted, can be seen by the following consideration. Let P be the total U.S. population, g be the fraction which is at any point in time under supervision of some sort in the correctional system, and t be the. total number of years under correcttonal supervISIon durmg the life of an average individual in the fraction f. Then since the average lifetime is about 70 years: '
From correctional 21 data, g=O.007.
Therefore:
Th.us, f=0.12 implies that T=4- years. Although insuffiCIent data has been found to permit an independent calculation of T, this does appear to be in the realm of the reasonable.
LIFETIME ARREST HISTORY PROFILES
We will now estimate lifetime arrest history pl'Ofiles for the V.S. population. First, let us look at the male population. . One estimate of the profile can be obtained by assumlllg that after the first arrest, subsequent arrests are statistically independent in the sense that their frequency of
... ~ .-----~~"----- -~---~~. - --- -.~ .. ,--- ~-. -.. -.-.~~-- ... "
2::1 Currected tor ~cc rtis~ribution by including n factor 0.81 lor males nnd 0.7,1-for fClllnles, n~ preViously dIBCUS5Cd.
!!:I Sinco part I charges represent tJw more serious cllnrgcs, this is probably
n ron.!ier,'ath'c assullJption. !!, Sec chapter I\, This includes ('orrcctional detention prohation, iusli(u'
llonnlizntion or nil klolh, nnd pnrole nnd other nhcrcarr. '
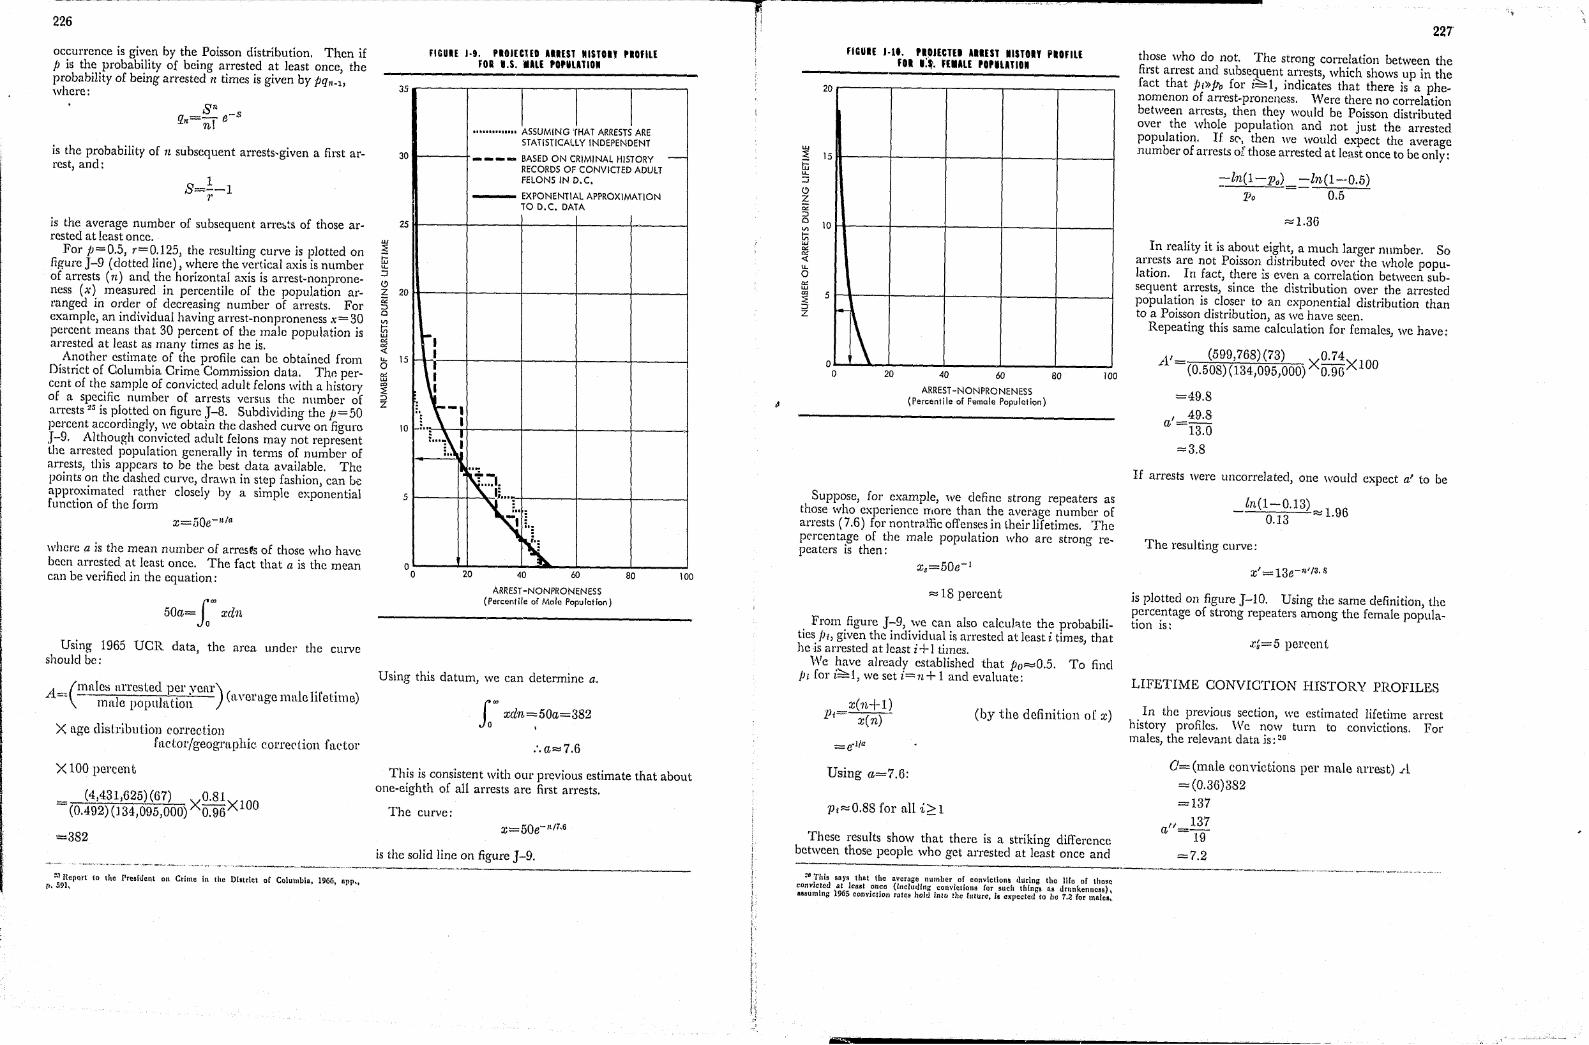
226
occurrence is given by the Poisson distribution. Then if p is the probabi,lity of being a~'rest~d ~t least once, the probability of being arrested 11 times IS gIven by Pqn-l, where:
8 n -8 rJ.n=-I e n.
is the probability of n subsequent arrests-given a first arrest, and:
1 8=-~1
l'
is the average number of subsequent arre~~s of those arrested at least once.
For /)=0.5, r=0.125, the resulting ~urve i: l?lotted on figure J-9 (dotted line); w~ere the v~r!lcal aXIS IS number of arrests (n) and the hOl'lzontal aXIS IS arrest-non proneness (x) measured in percentile of the population a1'l'anged in order of decreasing number of arrests. For example an individual having arrest-nonp1'oneness x=30 percent ~eans that 30 percent of the male population is arrested at least as many times as he is.
Another estimate of the profile can be obtained from District of Columbia Crime Commission data. Thn percent of the sample of convicted adult felons with a history of a specific number of arrests versus the nl1mber of arrcsts 20 is plotted on figure J-8. Subdividing the p=50 percent accordingly, we obtain the dashed curve on figure J-9. Although con,:icted adult fe!ons may not represent the arrested populatIon generally 111 terms of number of arrests, this appears to be the best. data avail~ble. The points on the dashed curve, dra\vn III step fashlOn, can Go:: approximated rather closely by a simple exponential function of the form
where a is the mean number of arrests of those who have been arrested at least once. The fact that a is the mean can be verified in the equation:
50a= So'" xdn
Using 1965 UCR data, the area under the curve should be:
A:::~(rnnle8 ~ll'l'este~ P?l' yenr) (n,yerage lllale liI'etime) IDa c popn !ttlOn
X age disll'lbu tion correction. . factor/geographIC. eOl'1'eClIOn factor
X 100 percent
(4,431,625)(67) XO.81XlOO (0.492) (134,095,000) 0.96
=382
"', Report (0 the Pre.;oent on Crime in the DIstrict of COlulubia. 1966, app., ,>.591.
w ::E 6 u. :::;
FIGURE J·9. PlOJECHD UIEST \lISTDIY PlOfIL£ fOR '.5. IALE POPULlTIOII
35 .--------.------rl. ----'-1 ---r-I ~ .............. ASSUMING 'fHAT ARRESTS ARE
STATISTICALLY INDEPENDENT 30 --.---t ____ BASED ON CRIMINAL HISTORY -
RECORDS OF CONVICTED ADULT FELONS IN D.C.
--- EXPONENTIAL APPROXIMATION TO D.C. DATA
~R-----~----~~----~-----i----~
~ 20~------~----~-------t-------t------c;;: ::> o
§ 0<
;:f U. o 0< UJ
'" ::E ::> z
~"O: ,\::'1:
5 1----++--'l~t""';j .. 2 .. _ I .. _
r'l oL---~~--__ ~~~~~ __ ~~----~ o 20 40 60 80 100
ARREST -NONPRONENESS (Percentile of Male Population)
Using this datum, we can determine a.
f'" xcln=50a=382 Jo , :.a:::::7.6
This is consistent with OllI' previous estimate that about one-eighth of all arrests are first arrests.
The curve: x=50e- n/1,6
is the solid line on figure J-9.
FIClUIE )-1'. PlOIECTEI .IIEST IISTOn flOFllE fOR .:~. FE.ALE POULATlOII
20
0
~~ o 20 40 60 80
ARREST -NON PRONENESS (Percentile of Female Population)
100
Suppose, for example, we define strong repeaters as those who experience 11'tore than the average number of arrests (7.6) for nontrtlffic offenses in their lifetimes. The percentage of the male population who are strong repeaters is then:
~ 18 percent
From figure J-9, we can also calcuh.te the probabilities jll, given the individual is arrested aUeast i times, that he js arrested at least i + 1 times.
We have already established that Po=O.5. To find j)i for i::::"l, we set i=n + 1 and evaluate:
x(1/,+ 1) Pi x(n) (by the definition of x)
Using a=7.6:
PI::::: 0.88 for all i21
These results show that there is a striking difference between those people who get arrestee! at least once and
~IJ This says that the average number of convictions during the lire or lho~c com·lcteu at least onCQ {including COh'.'iClions (or such things l\8 drunkenness), aa8uming: 1965 convjction ratcs. hold jnto the future, h: expected to be 7.2 for males ..
227
those who do not. The strong correlation between the first arrest and subsequent arrests) which shows up in the fact that p/»fro for i::::"l, indicates that there is a phenomenon of arrest-proneness. Were there no correlation between arrests, then they would be Poisson distributed over the whole popUlation and not just the arrested population. If s(" then we would expect the average number of arrests ot those arrestee! at lea.st once to be only:
:-In(l-po) -In(1--0.5) 1)0 0.5
:::::1.36
In reality it is about eight, a much larger nnmber. So arrests are not Poisson distributed over the whole population. In fact, there is even a correlation between subsequent arrests, since the distribution over the arrested population is closer to an exponential distribution than to a Poisson distribution, as we have seen.
Repeating this same calculation for females) we have:
I (599,768)(73) 0.74 A = (0.508) (134;095;000) X O.96 XlOO
=49.8 , 49.8
a =13.0
=3.8
If arrests were uncorrelatecl, one would expect a' to be
In(1-0.13):::::1.96 0.13
The resulting curve:
x'=13e- II '/3.8
is plotted on figure J-lO. Using the same definition, the percentage of strong repeaters among the female population is:
.l:~=5 percent
LIFETIME C01VVICTION HISTORY PROFILES
In the previolls section, we estimated 1i~et!me arrest history profiles. We now turn to convlctlOns. For males, the relevant data is: ~G
0= (male convictions pel' male fll'l'est) .tl =(0.36)382 =137
/I 137 a =19
=7.2
.wz ........ ____________________________________________ __
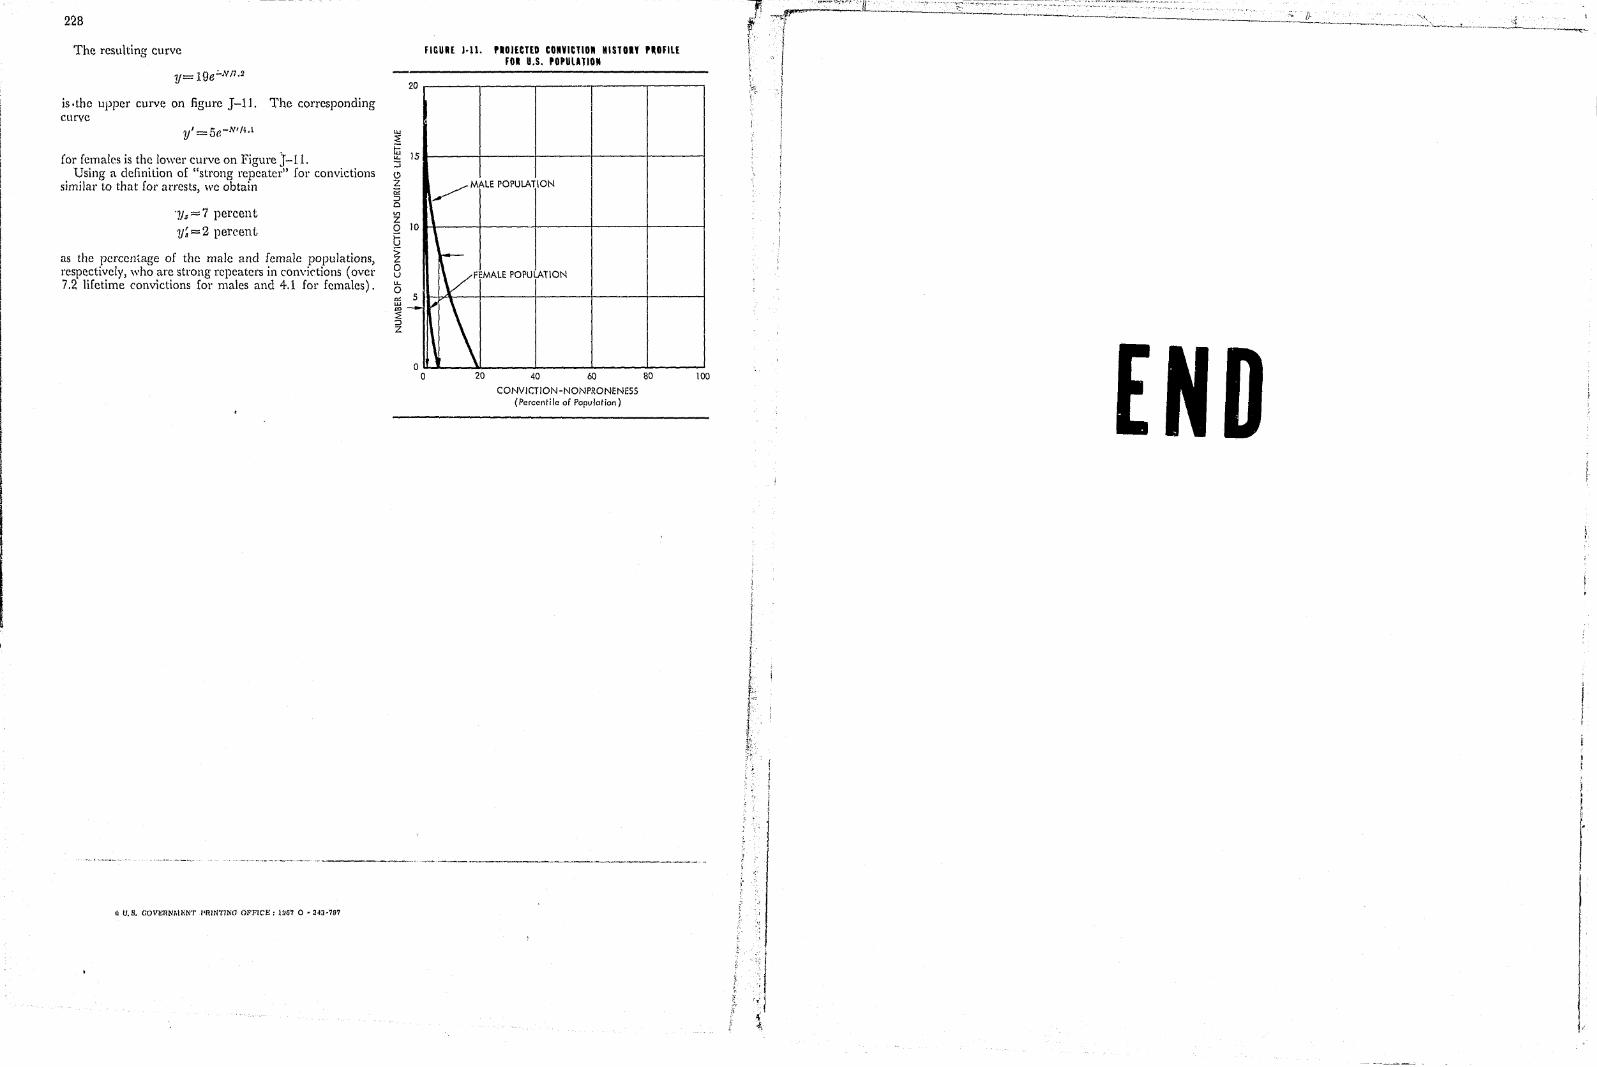
228
The re~ulting curve
y=1ge':"Nn •2
is.tho upper curve on figure J-11. The corresponding curve
for females is the lower curve on Figure J-11. Using a definition of "strong repeater" for convictions
similar to that for arrests, we obtain
'1/s=7 percent y~=2 percent
as the percentage of the male and female populations, respectively, who are strong repeaters in convictions (over 7.2 lifetime convictions for males and 4.1 for females).
» u. s. GOV~;RNMIlN'r PRINTINO Ol'FICE: lUG1 0 • 243-797
U,J
~
6 u. ::; C> Z 0< ::> o In Z o 6 ~ o u u. o '" u.J a> ~ ::J Z
FIGURE )·11. PlOIECT£D CONVICTION HlSTOIY P~OfllE
20
15
10
5 -0 o
FOR U.S. POPULATION
~MALE POPULATION
\ , l--
~FEMALE POPULATION
~\ 20 40 60 80
CONVICTION-NONPRONENESS (Percentile of Population)
100
-----.~--- ._-----_._.,
I I ;
I r I