服務業統計摘要- Statistical Digest of the Services Sector
335
服務業統計摘要 Statistical Digest of the Services Sector 一九九九年版 1999 Edition ^^^^^ m 中華人t^ 共和阈 香港特別行政區政府統計處 Census and Statistics Department Hong Kong Special Administrative Region People's Republic of China
-
Upload
khangminh22 -
Category
Documents
-
view
1 -
download
0
Transcript of 服務業統計摘要- Statistical Digest of the Services Sector

服務業統計摘要
Statistical Digest of the Services Sector
一九九九年版
1999 Edition
^^^^^
m 中華人t 共和阈
香港特別行政區政府統計處 Census and Statistics Department
Hong Kong Special Administrative Region People's Republic of China
這份刊物的 PDF 版本的文字是從印刷版掃描而成,再利用光學字符識別軟
件轉換成電子格式。由於原印刷版本已印製並保存多年,光學字符識別技
術未必能準確地識別某些文字或數字。因此,搜索或複製此 PDF 檔案內的
文字時應加以注意。 The text of this PDF publication was scanned from its printed version and then converted to electronic text using Optical Character Recognition (OCR) software. Because of the age and condition of the original printed copy, the OCR may not recognise certain characters or figures accurately. Caution should therefore be taken when searching or copying text from this PDF publication.

服務業統計摘要
Statistical Digest of the Services Sector
一九九九年版 1999 Edition
有關本刊物的査詢,請聯絡:
政府統計處經銷及服務業統計科(二)
地址:中國香港九龍紅磡蕪湖街八十三號莊士紅_廣場二十樓
莊士紅i)廣場分處
電話:(852) 2123 1038 圖文傳真:(852) 2123 1048
電子郵遞:[email protected]
Enquiries about this publication can be directed to : Distribution and Services Statistics Branch (2)
Census and Statistics Department Address: Chuang's Hunghom Plaza Sub-office, 20/F, 83 Wuhu Street,
Hung Horn, Kowloon, Hong Kong, China. Tel. No.: (852) 2123 1038 Fax. No.: (852) 2123 1048
E-mail: [email protected]
政府統計處網頁 Home Page of the Census and Statistics Department http:/ /www.info.gov.hk/censtatd/
一九九九年八月 August 1999

目錄 Contents
頁數 P a g e
緒言 Int roduct ion iv 統計表一覽 List of Tables vii 統計圖一覽 List of Char ts xi 槪論 Ove rv i ew xv 服務行業 Service Industries 1 . 航空運輸業 Ai r Transpor t Services 1 2 . 銀行業 Bank ing Services 17 3 . 電影業 F i lm Ente r ta inment Serv ices 47 4 .金融市場及基金管理業 Financial Marke t s and F u n d M a n a g e m e n t 61
Services 5 .進出口貿易業 Impor t and Expor t T rade Serv ices 91 6 . 保險業 Insurance Services 125 7 . 陸上運輸業 Land Transpor t Serv ices 149 8 . 海上運輸業 Mar i t ime Transpor t Services 173 9 . 專業服務業 Profess ional Services 195 1 0 .地產服務業 Real Esta te Services 211 11.電訊月艮矛务業 Te l ecommunica t ions Serv ices 231 1 2 .批發及零售業 Who lesa l e and Retai l Serv ices 251 服務界別 Service Domains 1 3 .電腦及有關服務 C o m p u t e r and Rela ted Serv ices 267 14.旅遊、會議及展覽服務 Tour i sm, Conven t ion and Exhib i t ion Serv ices 285
^fM Appendix 香港主要統計槪覽 S u m m a r y of K e y Statist ics o f H o n g K o n g A1 訂閱表格〔服務業統計摘要按季 Subscr ipt ion F r o m (Quar te r ly Supp lemen t to A5 補充資料� Statistical Diges t of the Serv ices Sector) 訂購表格〔政府統計處刊物� Order F o r m (Publ ica t ions o f the Census and A8
Statistics Depa r tmen t )
服務業統計摘要一九九九年 X111

緒言 Introduction 《服務業統計摘要》由政府統計處出版 ’ The Statistical Digest of the Services Sector is 就 香 港 十 四 個 主 要 服 務 行 業 / 界 別 提 供 published by the Census and Statistics Department. 最 新 的 統 計 資 料 ’ 方 便 各 界 查 閱 ” It is designed to provide a handy source of up-to-date
statistical information about fourteen major service industries/domains of Hong Kong.
出版本統計摘要的主要目的,是將至一九 The main objective of this Statistical Digest is to 九八年的十年內的統計資料’大致上依每 provide statistical data for the ten-year period up to 年年底的數字逐年顯示’並在適當之處輔 1998, in the form of yearly figures as at the year-end 以一九九九年首季白勺數字。十四 f固主要月艮 position in the main, and where appropriate 務行業 /界別將以個別章節闡述’資料會 supplemented with statistics for the first quarter of 分門別類’就每個服務行業 /界別’提供 1999. The data are organized in respect of each of 各類統計數字’以供參考對照’並輔以圖 the fourteen leading service industries/domains in a 表‘以便翻查及理角军 ° way that different types of statistics for a specific
service industry/domain are collated in a dedicated section, supported by graphical presentations, for easy reference and interpretation.
本 刊 登 載 的 統 計 資 料 主 要 來 自 政 府 統 計 The principal sources of the statistical data presented 處禾口其他政府音[^門。並且亦在適當地方弓 I in this publication are official statistics compiled by 用其他機構發表的統計數字。 the Census and Statistics Department and other
government departments. Statistics produced by other organizations are also referred to as appropriate.
本 刊 中 某 些 資 料 項 目 是 根 據 有 限 數 據 而 It should also be noted that there are data items 作出的粗略估計,在日後得到更多資料時 which are crude estimates compiled based on limited 可 能 會 作 相 當 大 的 修 訂 ° 這 些 項 目 會 以 data. They may be subject to considerable revisions 「* *」標明在統計表內。使用這些統計數 when more data become available. Such items are 字 時 應 小 心 留 意 這 點 � marked with a "**" sign in the statistical tables. In
using such statistics, users must take special care.
每章節均附有「槪念及方法」部分,詳述 Description of the scope and nature of the statistical 統計資料的範圍和性質’以及本刊內所用 data and definitions of the terms used in the 詞彙的釋義 ° publication are provided in the "Concepts and
Methods" part in each section.
iv Statistical Digest of the Services Sector 1999
使用個別統計表的數字時,讀者須注意相 When using figures from each individual table, 應 的 註 釋 ’ 以 便 了 解 在 這 十 年 間 有 關 定 readers should pay attention to the corresponding 義、涵蓋範圍、計算方法及點算規則方面 footnotes which describe as far as possible changes 的變化’以及資料的局限性。任何上述變 in the definitions, coverage, methods of calculation 化 均 可 能 令 整 段 期 間 內 的 數 列 不 能 作 全 and counting rules over the ten-year period as well as 面白勺 t b 較 ° limitations of data. Any change may render the data
series not fully comparable over the whole period.
除另有註明外’每節的「其他有關刊物」 Unless otherwise specified, the publications in 戶斤述的干IJ 物是由政府統計處編製 ° "Further References" of each section are produced by
the Census and Statistics Department.
由一九九七年七月一日開始’香港成爲中 On 1 July 1997,Hong Kong became a Special 華人民共和國的特別行政區。就本刊登載 Administrative Region of the People 's Republic of 的統計資料而言’自一九九七年七月起 ’ China. In respect of statistics in this publication, 「香港」是指香港特別行政區。 “Hong Kong" stands for the Hong Kong Special
Administrative Region with effect from July 1997.
代號 Symbols
本刊內各代號的含意如下: The following symbols are used throughout the Diges t :
- 不適用 - not applicable * 修訂數字 * revised figures * * 粗略估計數字 * * crude estimates ; 九 沒 有 數 字 N.A. not available
計 量 單 位 Units of Measurement 1 立方米 = 219.969 英加侖 1 cubic metre (cu.m_) = 219.969 imperial gallons 1 公頃 = 10 000.000 平方米 1 hectare = 10 000.000 square metres 1 公斤 = 2.205 膀 1 kilogram (kg) = 2.205 pounds
= 1.653 斤 = 1.653 catties 每小時 1 公里 = 0.540 浬 1 kilometre/hour (km/h) = 0.540 knot 1 平方米 = 10.764 平方n尺 1 square metre (sq.m.) = 10.764 square feet 1 公頓 2 204.623 榜 1 tonne (t) = 2 204.623 pounds
= 0.984 頓 = 0.984 ton
貨 幣 數 字 Monetary Figures 本刊內所有引述的貨幣數字’除特別聲明 All monetary figures quoted are in Hong Kong 外’均爲港元 °港元是香港特另 [ J 行政區的 dollars unless otherwise specified. Hong Kong 法定貨幣。 dollar is the legal tender in the Hong Kong Special
Administrative Region.
服務業統計摘要一九九九年 X111

匯率 Exchange Rate 自一九八三年十月十七日起’政府透過一 As from 17 October 1983 the Hong Kong dollar has 項有關發行紙幣的措施,將港元與美元聯 been linked to the US dollar through an arrangement 繁’由發鈔銀行以 7 .8 港元兑 1 美元的 in the note issuing mechanism permitting note 固定匯率發行紙幣。自此’港元党美元的 issuing banks to issue Hong Kong dollar notes at a 匯 率 在 外 匯 市 場 僅 有 窄 幅 變 動 。 fixed rate of HK$7.80=US$1.00. Since then, the
exchange rate of Hong Kong dollar against the US dollar in the foreign exchange market has moved only within a narrow range.
數字的進位 Rounding of Figures 由於進位原因’統計表內個別項目的數字 There may be a slight discrepancy between the sum 加 起 來 可 能 與 總 數 略 有 出 入 。 of individual items and the total as shown in the
tables owing to rounding.
vi Statistical Digest of the Services Sector 1999

統計表一覽 List of Tables 頁數 Page
1. 航空運輸業 Air Transport Services 1.1 航空運輸業的機構單位數目、就業人數�Number of Establishments and Persons Engaged, 7
業務收益指數、生產總額及增加價値 Business Receipts Index, Gross Output and Value Added of the Air Transport Industry
1.2 航空運輸服務容量的統計數字 Statistics on Capacity ofAir Transport Services 10 1.3 航機升降次數 Aircraft Movements 11 1.4 民航機的客運量 Passenger Throughput of Civil Aircraft 12 1.5 以空運進出香港的貨物及郵遞 Inward and Outward Movements of Cargo and Mail by 13
Air 1.6 航空運輸業的選定最新統計數字 Selected Up-to-date Statistics on Air Transport Services 15 2. 銀行業 Banking Services 2.1 認可機構及本港代表辦事處 Authorized Institutions and Local Representative Offices 24 2.2 銀行業的機構單位數目、就業人數、業務 Number of Establishments and Persons Engaged, 26
收益指數、生產總額及增加價値 Business Receipts Index, Gross Output and Value Added of the Banking Industry
2.3 外幣儲備及貨幣供應 Foreign Currency Reserves and Money Supply 29 2.4 認可機構的流動資金 Liquidity of Authorized Institutions 31 2.5 認可機構的盈利能力、資產質素及資本充 Profitability, Asset Quality and Capital Adequacy of 32
足 A u t h o r i z e d Institutions 2.6 所有認可機構的港元資產負債表 Hong Kong Dollar Balance Sheet of All Authorized 33
Institutions 2.7 所有認可機構的外幣資產負債表 Foreign Currency Balance Sheet of All Authorized 35
Institutions 2.8 客戶存款 Deposits from Customers 37 2.9 貸款及墊款 Loans and Advances 38 2.10 港元銀行同業拆息市場 Hong Kong Dollar Interbank Market 41 2.11 外匯市場 Foreign Exchange Market 42 2.12 銀行業的選定最新統計數字 Selected Up-to-date Statistics on Banking Services 44 3. 電影業 Film Entertainment Services 3.1 電影業的機構單位數目、就業人數、業務 Number of Establishments and Persons Engaged, 52
收益指數、生產總額及增加價値 Business Receipts Index, Gross Output and Value Added of the Film Entertainment Industry
3.2 上映電影數目、票房收入及本地及海外市 Number ofFilms Released, Box Office Takings and 55 場的電影政益 Revenue from Local and Overseas Markets
3.3 經評級的電影數目 Number ofFilms Classified 56 3.4 影帶、鐳射影碟及其他光碟的進出口貨値 Imports and Exports of Videotapes, Laser Discs and 57
Other Compact Discs 3.5 電影業的選定最新統計數字 Selected Up-to-date Statistics on Film Entertainment 58
Services 4. 金融市場及基金管理業 Financial Markets and Fund Management Services 4.1 金融市場及基金管理服務業的機構單位 Number of Establishments and Persons Engaged, 70
數目、就業人數、業務收益指數、生產總 Business Receipts Index, Gross Output and Value Added 額及增 j口ii値 of the Financial Markets and Fund Management Services
Industry 4.2 註冊團體及個人數目 Number of Registered Bodies 73 4.3 在香港聯合交易所上市的公司數目、總市 Number of Listed Companies, Market Cap+italization, 74
fg�收益率及]^?盈率 Yield and Price Earning Ratio of Stocks Listed on the Stock Exchange of Hong Kong
服務業統計摘要一九九九年 X111

統計表一覽(縯) List of Tables (ContM.) —
Page 4.4 香港聯合交易所的成交金額及賣空量 Turnover and Short Selling m the Stock Exchange of 76
Hong Kong 4.5 香港聯合交易所新證券的發行情況 New Issues m the Stock Exchange of Hong Kong 79 4.6 香港期貨交易所平均每日成交量 Average Daily Turnover in the Hong Kong Futures 80
Exchange 4.7 金銀業貿易場的黃金買賣報價及平均每 Trading Prices and Average Daily Turnover of Gold 82
日成交量 Trading in the Chinese Gold and Silver Exchange Society 4.8 港元債務市場 Hong Kong Dollar Debt Market 83 4.9 認可基金數目及資產淨値 Number and Net Asset Value of Authorized Funds 84 4.10 金融市場及基金管理業的選定最新統計 Selected Up-to-date Statistics on Financial Markets and 86
數字 Fund Management Services 5. 進出•貿易業 Import and Export Trade Services 5.1 進出口貿易業的機構單位數目、就業人 Number ofEstablishments and Persons Engaged, 99
數、業務收益指數,生產總額及增加價値 Business Receipts Index, Gross Output and Value Added of the Import and Export Trade Industry
5.2 貿易指數 Trade Index Numbers 102 5.3 香港在世界主要貿易國家的排名位置 Hong Kong's Position among Leading World Traders 104 5.4 按貨品類別劃分的進口貨値 Imports by Commodity Section 105 5.5 按貨品類別劃分的港產品出口貨値 Domestic Exports by Commodity Section 107 5.6 按貨品類別劃分的轉口貨値 Re-exports by Commodity Section 109 5.7 按選定國家/地區劃分的貿易統計數字 Trade Statistics by Selected Countries/Territories 111 5.8 涉及外發中國內地加工的菅易 Trade Involving Outward Processing in the Mainland of 114
China 5.9 有從事製造業相關活動的進出口機構及 Number of Establishments and Persons Engaged, Value 117
製造業機構的機構單位數目、就業人數�Added and Sales Revenue of Import/Export Firms with i曾力口iiiii灰if 食收益 Manufacturing-Related Functions and Manufacturing
Firms 5.10 進出口貿易業的選定最新統計數字 Selected Up-to-date Statistics on Import and Export 119
Trade Services 6. 保險業 Insurance Services 6.1 保險業的機構單位數目、就業人數、業務 Number of Establishments and Persons Engaged, 133
收益指數、生產總額及增加價値 Business Receipts Index, Gross Output and Value Added of the Insurance Industry
6.2 保險人、保險經紀、保險代理人及精算師 Number of Insurers, Insurance Brokers, Insurance 136 政目 Agents and Actuaries
6.3 長期保險業務 Long Term Insurance Business 139 6.4 一般保險業務 General Insurance Business 141 6.5 受保險安排所規管的職業退休計劃 Occupational Retirement Schemes Regulated by 144
Insurance Arrangement 6.6 香港出口信用保險局的保險業務 Insurance Business of the Hong Kong Export Oedi t 145
Insurance Corporation 6.7 保險業的選定最新統計數字 Selected Up-to-date Statistics on Insurance Services 147 7. 陸上運輸業 Land Transport Services 7.1 陸上運輸業的機構單位數目、就業人數�Number of Establishments and Persons Engaged, 154
業務收益指數、生產總額及增加價値 Business Receipts Index, Gross Output and Value Added of the Land Transport Industry
7.2 每日乘搭陸上公共交通工具的平均人次 Average Daily Public Land Transport Passenger 157 Journeys
7.3 經道路及鐵路進出香港的乘客人數 Inward and Outward Movements ofPassengers by Road 159 and by Rail
7.4 經道路及鐵路進出香港的貨物 Inward and Outward Movements of Cargo by Road and 160 by Rail
viii Statistical Digest of the Services Sector 1999

統計表一覽(總) List of Tables (ContM.) Page
7.5 進出香港的車輛 Inward and Outward Movements of Motor Vehicles 161 7.6 進出香港的火車 Inward and Outward Movements of Trains 164 7.7 牌照及道路統i十數字 Licence and Road Statistics 165 7.8 陸上運輸業的選定最新統計數字 Selected Up-to-date Statistics on Land Transport 168 Services 8. 海上運輸業 Marmme Transport Services 8.1 海上運輸業的機構單位數目、就業人數�Number of Establishments and Persons Engaged, 179
業務收益指數、生產總額及增加價値 Business Receipts Index, Gross Output and Value Added of the Maritime Transport Industry
8.2 進出香港的船隻 Inward and Outward Movements of Vessels 182 8.3 經海運及、河運進出香港的乘客人數 Inward and Outward Movements of Passengers by Ocean 183
and by River 8.4 按營辦商劃分的港內客運服務估計乘客 Estimated Passenger Journeys of Internal Passenger 183
人次 Transport by Operator 8.5 以海運及河運進出香港的貨物 Inward and Outward Movements of Cargo by Ocean and 184
by River 8.6 按貨物起卸地點及遠洋/內河船隻劃分的 Container Throughput by Cargo Hmdlmg Location by 186
貨櫃吞吐i Ocean/River Vessels 8.7 海員統計數字 Seafarers Statistics 188 8.8 註冊船隻統計數字 Statistics on Vessels Registered 189 8.9 海上運輸業的選定最新統計數字 Selected Up-to-date Statistics on Maritime Transport 190 Services 9. 専業服務業 Professional Services 9.1 專業服務業的機構單位數目、就業人數�Number of Establishments and Persons Engaged, 200
業務收益指數、生產總額及增加價値 Business Receipts Index, Gross Output and Value Added of the Professional Services Industry
9.2 法律服務 Legal Services 203 9.3 會言十月艮務 Accounting Services 205 9.4 建築及工程月艮務 Architectural and Engineering Services 207 9.5 專業服務業的選定最新統計數字 Selected Up-to-date Statistics on Professional Services 209 1 0 .地產服務業 Real Estate Services 10.1 地產業的機構單位數目、就業人數、業務 Number of Establishments and Persons Engaged, 217
收益搶敎、生產總齒及增;!J口價値 Business Receipts Index, Gross Output and Value Added of the Real Estate Industry
10.2 政府土地拍賣及批租 Disposals of Government Land 220 10.3 按樓宇類別劃分的住宅單位落成量 Completions ofDomestic Units by Type of Premises 221 10.4 按類別劃分的私人非住宅樓宇落成量 Completions of Private Non-domestic Premises by Type 222 10.5 住宅單位總存量 Stock ofDomestic Units 223 10.6 私人非住宅樓宇總存量 Stock of Private Non-domestic Premises 224 10.7 送達土地註冊處登言己的文件數目 Number of Documents Received for Registration in the 225 Land Registry 10.8 送達土地註冊處登記的文件涉及的總値 Considerations ofDocuments Received for Registration 226
in the Land Registry 10.9 地產服務業的選定最新統計數字 Selected Up-to-date Statistics on Real Estate Services 228 11. 電訊目艮務業 Telecommunications Services 11.1 電訊業的機構單位數目、就業人數、業務 Number of Establishments and Persons Engaged, 237
收益指數、生產總額及增加價値 Business Receipts Index, Gross Output and Value Added of the Telecommunications Industry
11.2 有線電話服務 Wireline Telephone Services 240 11.3 對外電訊通訊量 External Telecommunications Traffic 242
服務業統計摘要一九九九年 X111

統計表一覽(縯) List of Tables (ContM.) 頁數 Page
11.4 互聯網服務 Internet Services 244 11.5 公共流動無線電話服務 Public Mobile Radio-telephone Services 245 11.6 傳呼服務 Paging Services 246 11.7 電訊服務業的選定最新統計數字 Selected Up-to-date Statistics on Telecommunications 248 Services 1 2 .批發及零售業 Wholesale and Retail Services 12.1 批發及零售業的機構單位數目、就業人 Number of Establishments and Persons Engaged, 255
數、業務收益指數、生產總額、增加價値 Business Receipts Index, Gross Output, Value Added and 及零售業總銷貨額 Total Retail Sales of the Wholesale and Retail
Industry 12.2 零售價値指數 Value Indices of Retail Sales 258 12.3 零售量指數 Volume Indices of Retail Sales 260 12.4 食品批發 Wholesale of Food Items 263 12.5 批發及零售業的選定最新統計數字 Selected Up-to-date Statistics on Wholesale and Retail 264
Services 1 3 .電腦及有關服務 Computer and Related Services 13.1 資料處理及製表服務公司的機構單位數 Number of Establishments and Persons Engaged, Gross 274
目、就業人數、生產總額及增加價値 Output and Value Added for Data Processing and Tabulating Services Companies
13.2 辦公室器材(傢具及固定裝置除外)經銷 Number of Establishments and Persons Engaged for 277 商的機構單位數目及就業人數 Distributors of Office Machines, Appliances and
Equipment (except Furniture and Fixtures) 13.3 電腦硬件及軟件的進出口貨値 Imports and Exports of Computer Hardware and 279
Software 13.4 電腦及有關服務界別的業務收益指數 Business Receipts Index for the Computer and Related 281
Services Domain 13.5 從事資訊科技職務的就業人數 Number ofPersons Engaged in Occupations with 281
Information Technology Functions 13.6 電腦及有關服務界別的選定最新統計數 Selected Up-to-date Statistics on Computer and Related 282
字 Services Domain 14.旅遊、會議及展覽服務 Tourism, Convention and Exhibition Services 14.1 酒店及旅行社的機構單位數目、就業人數 Number ofEstablishments and Persons Engaged and 294
及業務收益指數 Business Receipts Index for Hotels and Travel Agents 14.2 訪港旅客 Visitor Arrivals 296 14.3 訪港旅客消費 Visitor Spending 298 14.4 訪港旅客平均留港時間 Average Length of Stay of Visitors 299 14.5 酒店統計數字 Hotel Statistics 300 14.6 按目的地劃分的本港居民離港人數 Hong Kong Resident Departures by Destination 303 14.7 餐館、零售商、運輸服務營辦商及其他爲 Number of Establishments and Persons Engaged for 304
訪港麥客提供服務的機構的機構單位數 Restaurants,Retailers, Transport Operators and Other 百及就業人數 Service Providers Serving Visitors
14.8 訪港旅客主要購物類別消費 Expenditure ofVisitors on Main Shopping Categories 306 14.9 在香港舉行的會議及展覽數目及出席人 Number ofEvents and Delegates of Conventions and 307
數 Exhibitions 14.10 旅遊、會議及展覽服務界別的業務收益指 Business Receipts Index for the Tourism, Convention 309
數 and Exhibition Services Domain 14.11 遊會議及展覽服務界別的選定最新統 Selected Up-to-date Statistics on Tourism, Convention 310
I十數字 and Exhibition Services Domain
x Statistical Digest of the Services Sector 1999

統計圖一覽 List of Charts 頁數 Page
1. 航空運输業 Air Transport Services 1.1 航空運輸業的機構單位數目及就業人數 Number of Establishments and Persons Engaged in 9
the Air Transport Industry 1.2 航機升降次數總計 Total Number of Aircraft Movements 11 1.3 航空貨運量及客運量 Cargo and Passenger Throughput by Air 14 1.4 航空郵遞量 Mail Throughput by Air 14 2. 銀行業 Banking Services 2.1 認、可機構及本港代表辦事處 Authorized Institutions and Local Representative 25
Offices 2.2 銀行業的機構單位數目及就業人數 Number of Establishments and Persons Engaged in 28
the Banking Industry 2.3 外幣儲備 Amount of Foreign Currency Reserves 30 2.4 存款及貸款 D印osits and Loans 40 3. 電影業 Film Entertainment Services 3.1 電影業的機構單位數目及就業人數 Number of Establishments and Persons Engaged in 54
the Film Entertainment Industry 3.2 電影收益 Films Revenue 56 4. 金融市場及基金管理業 Financial Markets and Fund Management Services 4.1 金融市場及基金管理服務業的機構單位 Number of Establishments and Persons Engaged in 72
數目 就藥人數 the Financial Markets and Fund Management Services Industry
4.2 在香港聯合交易所上市的公司總市値 Market Capitalization of Stocks Listed on the Stock 78 Exchange of Hong Kong
4.3 香港聯合交易所平均每日成交金額及恆 Average Daily Turnover in the Stock Exchange of 78 生指iij Hong Kong and Hang Seng Index
4.4 恆生指數期貨平均每日成交量 Average Daily Turnover ofHjmg Seng Index Futures 82 4.5 認可基金數目及資產淨値 Number and Net Asset Value of Authorized Funds 85 5. 進出口貿易業 Import and Export Trade Services 5.1 進出口貿易業的機構單位數目及就業人 Number of Establishments and Persons Engaged in 101
數 the Import and Export Trade Industry 5.2 按主要目的地劃分的港產品出口 Domestic Exports by Main Destination 113 5.3 按主要供應地劃分的進口 Imports by Main Supplier 113 5.4 涉及外發中國內地加工的貿易 Trade Involving Outward Processing in the Mainland 116
of China 6. 保險業 Insurance Services 6.1 保險業的機構單位數目及就業人數 Number of Establishments and Persons Engaged in 135
the Insurance Industry 6.2 保險人數目 Number of Insurers 138 6.3 保費收入 Premium Income 143 6.4 出口信用保險保單的受保出口貨値及佔 Value of Insured Exports Covered by Export Credit 147
本地整fitii 口; fik的比_ Insurance Policies and as a Percentage of Total Value of Exports of Hong Kong
服務業統計摘要一九九九年 X 1 1 1

統計圓一覽(級) List of Charts (Cont'd.) Page
7. 陸上運輸業 Land Transport Services 7.1 陸上運輸業的機構單位數目及就業人數 Number of Establishments and Persons Engaged in 156
the Land Transport Industry 7.2 每日乘搭陸上公共交通工具的平均人次 Average Daily Public Land Transport Passenger 158 Journeys 7.3 經道路及鐵路進出香港的貨物 Inward and Outward Movements ofCargo by Road 163
and by Rail 7.4 進出香港的車輛 Inward and Outward Movements of Motor Vehicles 163 7.5 領牌車輛及駕駛執照數目 Number ofVehicles Licensed and Number of 167 Driving Licences 8. 海上運輸業 Maritime Transport Services 8.1 海上運輸業的機構單位數目及就業人數 Number of Establishments and Persons Engaged in 181
the Maritime Transport Industry 8.2 以海運及河運進出香港的貨物 Inward and Outward Movements of Cargo by Ocean 185
and by River 9. 專業服務業 Professional Services 9.1 專業服務業的機構單位數目及就業人數 Number of Establishments and Persons Engaged in 202
the Professional Services Industry 9.2 律師人數 Number of Lawyers 204 9.3 專業會計自币人數 Number of Professional Accountants 206 9.4 註冊建築師人數 Number of Registered Architects 208 9.5 香港工程師學會法定會員人數 Number ofCorporate Members of the Hong Kong 208 Institution of Engineers 1 0 .地產服務業 Real Estate Services 10.1 地產業的機構單位數目及就業人數 Number of Establishments and Persons Engaged in 219
the Real Estate Industry 10.2 物業轉讓契約的數目及涉及的總値 Number and Total Considerations of Assignments of 227
Properties 11. 電訊服務業 Telecommunications Services 11.1 通訊業的機構單位數目及就業人數 Number ofEstablishments and Persons Engaged in 239
the Communications Industry 11.2 電話線數目 Number of Exchange Lines 241 11.3 公共流動無線電話及無線電傳呼服務用 Number of Public Mobile Radio-telephone and Radio 247
戶數目 Paging Services Subscribers 1 2 .批發及零售業 Wholesale and Retail Services 12.1 批發及零售業的機構單位數目及就業人 Number ofEstablishmmts and Persons Engaged in 257
數 the Wholesale and Retail Industry 12.2 零售指數 Indices of Retail Sales 262 1 3 .電腦及有關服務 Computer and Related Services 13.1 資料_理及製表服務公司的機構單位數 Number of Establishments and Persons Engaged for 276
目及就業人數 Data Processing and Tabulating Services Companies 13.2 公室器材(像具及固定裝置除外)經銷 Number ofEstablishments and Persons Engaged for 278
商的機構單位數目及就業人數 Distributors of Office Machines, Appliances and Equipment (except Furniture and Fixtures) 13.3 電腦硬件及軟件的進出口貨値 Imports and Exports ofComputer Hardware and 280
Software
xii Statistical Digest of the Services Sector 1999

統計圓一覽(縯) List of Charts (ContM.) 頁數 Page
14.旅遊、會議及展覽服務 Tourism, Convention and Exhibition Services
14.1 酒店及旅行社的機構單位數目及就業人 Number ofEstablishments and Persons Engaged for 295 數 Hotels and Travel Agents
14.2 訪港旅客消費 Visitor Spending 299 14.3 可供出租房間數目及酒店入住率 Number of Hotel Rooms Available and Hotel Room 302
Occupancy Rate 14.4 餐館、零售商、運輸服務營辦商及其他 Number ofEstablishments and Persons Engaged for 305
爲訪港旅客提供服務的機構的機構單位 Restaurants, Retailers, Transport Operators and Other 數目及就業人數 Service Providers Serving Visitors
14.5 會議的數目及出席人數 Number of Events and Delegates to Conventions 308 14.6 展覽的數目及出席人數 Number of Events and Delegates to Exhibitions 308
服務業統計摘要一九九九年 X111

槪論 Overview
在過去十年’香港經歷明顯的結構轉變 ’ Over the past decade, Hong Kong has undergone a 月艮務業的地位變得非常重要。這結構轉變 remarkable structural transformation. S ervices have 明 顯 地 反 映 在 服 務 業 於 本 地 生 產 總 値 中 gained great prominence. This structural 所佔的比重。服務業對本地生產總値的貢 transformation has already been reflected in the share 獻由一九八七年的 7 0 . 3 % 上升至九七年的 of contribution of the services sector to the Gross 85 .2% ° Domestic Product (GDP). The contribution of the
services sector to GDP increased from 70.3% in 1987 to 85.2% in 1997.
服務業包括批發、零售、進出 口貿易、飮 The services sector includes wholesale, retail and 食及酒店業;運輸、倉庫及通訊業;金融� import/export trades, restaurants and hotels; 保險、地產及商用服務業以及社區、社會 transport, storage and communications; financing, 及 f固人月艮務業 ° insurance, real estate and business services; and
community, social and personal services.
在月艮務業內的主要經濟活動中,金融、保 Among the major economic activities in services 險、地產及商用月S務業合言十在一九九七年 sector, the financing, insurance, real estate and f占本地生產總 f直的 26.5 %,而社I:發、零售� business services together contributes 26.5% of the 進 出 口 貿 易 、 飮 食 及 酒 店 業 佔 另 外 GDP in 1997,whi le wholesale, retail and 26 .1% ’ 其次是社區、社會及 f固人月艮務業 import/export trades, restaurants and hotels (17 .4%) ’ 以 及 運 輸 、 倉 庫 及 通 訊 業 accounted for another 26.1%. These were followed (9 .3%) ° 這四類行業所佔比率在一九八七 by community, social and personal services (17.4%), 至九七年間都有所增加。與此同時,製造 and transport, storage and communications (9.3%). 業的相對重要性則下降’它對本地生產總 The four service subsectors all registered increases in 値 的 貢 獻 由 八 七 年 的 2 2 % 滑 下 至 九 七 年 shares of the GDP over the period from 1987 to 的 6.5 % ’ 這反映製造業活動轉移至貿易活 1997. At the same time, the relative importance of 動’這個發展跟香港廠商在中國內地蓬勃 manufacturing has declined, as reflected by its 發展的外發加工活動有很大的關係。在這 contribution to the GDP, which went down from 些業務的帶動下’對香港的其他支援服務 22% in 1987 to only 6.5% in 1997. This reflects the 的需求’例如陸上運輸、航運、貿易融資� shifting of manufacturing activities to trading 保險和各類專業服務,亦相應大幅增加 ° activities which are much related to the growing
prominence of outward processing activities in the mainland of China. This has also generated considerable demand for other support services from Hong Kong in areas such as land transport, shipping, trade financing, insurance and various professional services.
服務業統計摘要一九九九年 X111

月艮務業亦提供了香港的主要就業機會。月 S The services sector also become our principal source 務 業 就 業 人 數 在 總 就 業 人 數 中 所 佔 的 比 of employment. The share of the services sector in 率在過去十年顯著上升’由一九八八年的 total employment has increased markedly over the 5 7 . 4 %增至九八年的 8 0 . 3 % �在九八年,就 past decade, f rom 57.4% in 1988 to 80.3% in 1998. 業人口共有3 2 1 萬人’而整個服務業共僱 In 1998, the services sector as a whole employed 用了 258萬人 ° 在就業人數增加的同時, 2.58 million persons out of the 3.21 mill ion work 服 務 業 的 機 構 單 位 數 目 亦 由 八 八 年 的 force. Along with the growth in employment , the 166 000[111;^曾至九/\年白勺23 8 OOOfMI ° number of establishments in the services sector also
increased from 166 000 in 1988 to 238 000 in 1998.
服務業對保持本港對外貿易平衡’發揮極 The services sector is a major contributor to our 大作用。在一九九七年,月 g 務輸出總額達 external trade balance. In 1997,the value of exports 2 , 9 6 0 億元’相比於八七年’每年的平均 of services reached $296 billion, representing an 增長率達 12 .3% ° 在這期間•’ 運輸一直是 average annual growth rate of 12.3% over 1987. 服務輸出組成部分中最重要的一項,在八 Throughout the period, transportation remained the 七年f占月艮務輸出總額的37.60/0 ’ 在九七年 single most important component, contributing 則爲 3 4 . 8 % ° 緊隨運輸的兩個重要組成部 37.6% and 34.8% to total exports of services in 1987 分 是 與 貿 易 相 關 的 服 務 和 旅 遊 。 在 九 七 and 1997 respectively. Trade-related services and 年 ’ 兩 者 各 f占月S 務輸出總、額 25.50/0 及 travel were the other two important components 2 4 . 4 % ° 在八七年,它們的百分比貝 I J 分別 coming after transportation, contributing 25 .5% and 爲 18 .6%及28 .5% “ 24.40/0 respectively to total exports of services in
1997. In 1987,the percentage shares were 18.6% and 28.5%.
將 十 四 個 主 要 服 務 行 業 / 界 別 納 入 本 摘 The inclusion of the 14 leading service 要’反映我們確認其對本港經濟帶來重大 industries/domains in this Digest reflects our 貢 獻 ° 事 實 上 ’ 這 些 行 業 / 界 別 合 共 佔 本 recognition of their economic contribution. They 地 生 產 總 値 一 個 相 當 大 的 比 率 � together account for the l ion 's share of the services
sector 's contribution to the GDP.
xvi Statistical Digest of the Services Sector 1999

1 航空運輸業 A Air Transport Services 槪要 Highlights 由於頻繁的貿易和旅遊業務’香港已成爲亞 Through Its busy trade and tourist activities. Hong 洲的主要航運中心 °香港國際機場是全球其 Kong has become a leading aviation hub in the region. 中一個最繁忙的機場,亦是三間國際航空公 Our Airport is one of the busiest airports in the world, 司(國泰航空公司、港龍航空公司和華民航空 and is home to three international airlines (Cathay 公司)的總音 ° Pacific Airways Limited, Hong Kong Dragon Airlines
Limited and AHK Air Hong Kong Limited).
航空運輸業包括以香港爲根據地的航空公司 The air transport industry included Hong Kong based 和直升機公司、海夕航空公司駐港辦事處 � airline and helicopter companies, local representative 航空貨運代理公司及爲航空運輸提供輔助服 offices of overseas airline companies, air cargo 務的公司 ° 一九九八年,從事航空運輸業的 forwarding companies and firms providing supporting 機構單位有 684 間,僱員人數超過 30 000 services to air transport. In 1998, there were 684 人� establishments, employing over 30 000 people, in the
air transport industry.
一九九七年,航空運輸業爲香港帶來約 245 The value added generated by the industry was about 億元的增加價値’佔本地生產總値的 2 % °在 $24.5 billion, or 2% of the Gross Domestic Product 八九年至九七年期間,較顯著的增加價値按 (GDP) of Hong Kong in 1997. During 1989 to 1997, 年增中畐於九四年(370/0)錄得。此土曾長大音分 more notable year-on-year growth in value added was 歸因於航空燃料和汽油的價格下降 ° recorded for 1994 (37%). This was largely related to
the decrease in prices of aviation fuel and gasoline.
一九九八年’航空運輸業最爲矚目的是赤獵 In 1998,the air transport industry was highlighted by 角的新香港國際機場於九八年七月正式啟 the opening of the new Hong Kong International 用“新機場總面積爲 1 2 4 8 公頃’較啟德的 Airport at Chak Lap Kok in July 1998. The new 舊機場約大 3 倍,而啟用時的每年客運及貨 airport occupied an area of 1 248 hectares, which was 運處理能力分別爲 3 500 萬人次及 300 萬公 nearly 3 times greater than the old airport at Kai Tak. 噸 ° The annual passenger and cargo handling capacity at
opening were 35 million persons and 3 million tonnes respectively.
在一九九 乂\ 年,共有 66 間航空公司爲香港提 A total of 66 airlines provided scheduled services to 供與超過 1 0 0 個城市的來往定期航班服務 ° Hong Kong from over 100 cities in 1998. Together, 他們合共提供了 151 182 班定期國際班機及 they operated 151 182 scheduled international flights 12 977 班不定期國際班機。平均每星期有 and 12 977 non-scheduled international flights. On 1 381 班 來 港 的 定 期 載 客 班 機 ’ 提 供 共 average, there were 1 381 incoming scheduled 413 441 {固機位 ° passenger flights per week, providing a total seat
capacity of 413 441.
服務業統計摘要一九九九年 1

一九九八年的航機升降次數(包括載客和載 A slight decrease of 1% in aircraft movements 貨航班)較九七年的班次輕微下降了 1% ’ 全 (including passenger and cargo flights) was recorded 年總計爲 163 223 班次。八九年至九八年的 in 1998 compared with 1997, bringing the annual total 十年期間’總航機升降次數的每年平均增長 to 163 223. Over the ten-year period from 1989 to 率爲 6 % � 1998, total aircraft movements had been increasing at
an average annual rate of 6%.
一九九八年的總客運量(包括抵港和離港)爲 Total passenger throughput (including arrivals and 2 720 萬人次’較九七年的 2 830 萬人次再下 departures) in 1998 further decreased by 4 % to 27.2 降 4 %,九八及九七年的下降’主要是受九七 million from 28.3 million in 1997. The declines in 年下半年開始的地區性金融風暴的牽連’以 1998 and 1997 were mainly due to the reduction in 致來往香港的空運需求減少所景》響 ° demand for air travel admist the contagious effect of
the regional financial turmoil as f rom the latter half of 1997.
至於航空貨運方面’ 一九九八年航空貨運站 As regards air cargo movements , about 1.6 million 處理的貨物約爲 1 6 0 萬公噸’較九七年下降 tonnes of cargo were handled in the cargo terminal in 了 9 % � 這是由於對外貿易下降’及九八年七 1998,a decrease of 9% compared to 1997. The 月至八月初新機場空運貨物處理服務中斷有 setback in external trade and the disruption in air 關 o 雖然女口It匕’這較/\九年白勺航空貨運量仍 cargo handling services at the new airport in July and 上升 123% ° early August 1998 should have also contributed.
Nevertheless, there was an increase of 123% in air cargo movements compared to 1989.
2 Statistical Digest of the Services Sector 1999

主要統計數字 Key Statistics
航空運輸業 Air Transport Industry 增加價値®
年 機構單位數目⑴ 就業人數⑴ (百萬元) 業務收益指數^’(4)
Year Number of Number of persons Value addecF) Business receipts establishments'" engaged� ($ million) i n d e x � �
(1996=100) 1989 [517] [18 587] 10,374 -1990 [545] [20 534] 11,639 -1991 555 22 631 12,855 -1992 564 24 842 14,309 -1993 603 26 793 14,584 -1994 675 28 294 19,984 -1995 697 29 881 21,499 -1996 753 32 319 24,453 100.0 1997 810 33 596 24,532 106.3 1998 684 30 381 N.A. 95.7
註釋:(1) 一九九一年及以後的數字是該年內四季的 Notes : (1) Figures for 1991 and onwards are averages of the 估計數字的平均數’而九一年以前的數字是 four quarterly estimates of the year, whereas those j旨該年三月底青況� prior to 1991 refer to the position as at end March
of the corresponding year. (2) 包括政府服務的增加價値° 一九九四年及以 (2) Including value added of government services.
後的數字包括政府收到的營運特許權費 Figures for 1994 and onwards include trading 用,因此不可與較早年的數字作嚴格比較° concessions received by government and hence are
not strictly comparable with those for earlier years. ( 3 )業務收益指數於一九九二統計年度開始編 (3) Business receipts indices were first available in the
製’但此詳細分類的指數則於九六年開始編 reference year 1992, but indices at such detailed 製� breakdown were first compiled in 1996.
(4) 由於機場管理局的成立,由一九九八年第三 (4) With the establishment of the Airport Authority, 季開始’機場的業務收益已包括在航空運輸 the business receipts from the Airport, which were 服務業的業務益 � previously excluded, are included in the business
receipts of air transport service industry as from Q3 1998.
[]一九九一年前的數字的涵蓋範圍與其後的 [ ] F i g u r e s prior to 1991 are slightly different in 略有不同,因此不^iJ將兩糸且i5!字相嚴+各比 coverage and therefore are not strictly comparable 較 ° with those for 1991 and onwards.
服務業統計摘要一九九九年 3

主要統計數字(縯) Key Statistics (Cont'd.)
進出香港的航空交通 Inward and Outward Movements by Air 貨物⑺ 郵遞
年 飛機(5> 乘 客 ( 公 噸 ) (公噸) Year Aircraf t" ' Passengers � Cargo" ' Mail ' ' '
(tonnes) (tonnes) 1989 94 300 16 203 543 730 020 21 040 1990 105 782 18 687 525 801 939 23 184 1991 109 718 19 157 839 849 786 24 521 1992 120 968 22 060 555 956 907 26 369 1993 135 092 24 420 646 1 139 090 27 732 1994 143 251 25 248 198 1 292 504 27 700 1995 150 118 27 423 744 1 457 680 27 062 1996 158 797 29 542 590 1 563 493 27 280 1997 165 154 28 317 838 1 786 487 26 779 1998 163 223 27 208 792 1 628 742 25 614
註釋:(5) 指飛機升降的總架次’包括載客及載貨班 Notes : (5) Figures refer to the total number of landings and 機� take-offs, including passenger and cargo flights.
(6) 指乘民航機抵港及離港乘客的總人次,包括 (6) Figures refer to the total number of passenger 轉機乘客’但不包括過境乘客及空勤人員° arrivals and departures of civil aircraft, including
transfers but excluding transit passengers and crew members.
(7)指航空貨物總裝卸量。 (7) Figures refer to the total tonnes of air cargo unloaded and loaded.
(8)指航空郵遞總裝卸量’包括過境郵遞。 (8) Figures refer to the total tonnes of air mail unload and loaded, including transit mail.
4 Statistical Digest of the Services Sector 1999

槪念及方法 Concepts and Methods 以客運量及貨運量計算’香港國際機場是全球其 The Hong Kong International Airport is one of the 中一個最繁忙的機場 ° busiest airports in the world in terms of passengers
and cargo throughput.
爲方便展示航空運輸服務各方面的統計數據’航 To facilitate presentation of statistical data on various 空運輸服務再分類爲(一)客運服務 ’(二)貨運服 aspects of air transport services, air transport services 務及(三)郵遞運輸服務 ° are classified into (a) passenger transport services, (b)
cargo transport services and (c) mail transport services.
言司®釋義 Definition of terms
在編製統計數字時’航空運輸業包括提供航空 For statistical compilation purpose, the air transport 客運及貨運服務、航空貨運代理服務、機場地勤 industry covers establishments rendering air 服務、機場轉運服務及營運航空貨運站的機構單 passenger and cargo transport services, air cargo 位� forwarding services, ground handling services at
airport, airport transfer services and air cargo terminal operating services.
機/孝jr位是指在單一擁有權或控制權(即單一公 An establishment is defined as an economic unit (i.e. a 司名義)下’在單一地點從事一種或主要從事一 unit engaged in the production of goods or services) 種經濟活動(即生產貨物或提供服務)的經濟單 which engages, under a single ownership or control 位。 (i.e. under a single company name), in one or
predominantly one kind of economic activity at a single physical location.
本/汝全產總渡是指一個國家或地區的所有常住 Gross Domestic Product (GDP) is a measure of the 生產單位’在一個指定的期間內’未扣除固定資 total value of production of all resident producing 本消耗的生產總f直 ° units of a country or territory in a specified period,
before deducting allowance for consumption of fixed capital.
主產總額是由收取所得的服務費計算,即客運及 Gross output is measured by the service charges 貨運收入 ° received,viz. passenger and freight revenue.
就業人數包括積極參與機構單位工作的在職東 Persons engaged in an establishment include working 主及股東;在統計日期受僱於機構單位的全職僱 proprietors and partners actively engaged in the work 員’包括長期或臨時聘用的’無論這些僱員正在 of the establishment; full-t ime employees paid by the 開工或因事假或者病假而暫時缺勤;及在統計日 establishment on the survey reference date, both 期工作三小時或以上的兼職僱員和無酬家屬幫 permanent and temporary, who are either at work or 工� on vacation or sick leave; and part-t ime employees
and unpaid family workers working three hours or more on the survey reference date.
服務業統計摘要一九九九年 5

乂會及7廣藏是生產總額減去中間投產消耗(生產過 Value added is defined as the value of gross output 程中所耗用的貨物和月艮務的價値)° less the value of intermediate consumption (the value
of goods and services used up in the course of production).
6 Statistical Digest of the Services Sector 1999

統計圓表 Statistical Tables and Charts 表 1 . 1 航空運輸業的機 _位數目、就業人數、業務收益指數、生產總額及 i t i n 價値
Table 1.1 Number of Establishments and Persons Engaged, Business Receipts Index, Gross Output and Value Added of the Air Transport Industry
百萬元(另有註明除外) $ million, unless otherwise specified 1989 1990 1991 1992 1993
機構單位數目⑴ [ 5 1 7 ] [ 5 4 5 ] 5 5 5 5 6 4 6 0 3 Number of establishments� (1.2) (5.4) (1.8) (1.6) (6.9) 就業人數⑴ [ 1 8 5 8 7 ] [ 2 0 5 3 4 ] 2 2 6 3 1 2 4 8 4 2 2 6 7 9 3 Number of persons engaged'" (12.1) (10.5) (10.2) (9.8) (7.9) 業務收益指數(1996=100) - - - - -Business receipts index(糊(1996=100) - - - -生產總額丨 4) 21,752 25,626 27,828 31,571 34,096 Gross o u t p u t � (16.8) (17.8) (8.6) (13.5) (8.0)
增加價値⑷ 10,374 11,639 12,855 14,309 14,584 Value added(4> (5.3) (12.2) (10.4) (11.3) (1.9)
在以要素成本計算的本地生產總値內所佔比率(%) 2.1 2.1 2.0 2.0 1.8 Contribution to GDP at factor cost (%) 增加價値在生產總額所佔比率 4 7 . 7 4 5 . 4 4 6 . 2 4 5 . 3 4 2 . 8 Value added as % of gross output
註釋:括號內的數字是與上年比較的變動百分率� Notes : Figures in brackets are percentage changes over the preceding year.
(1) 一九九一年及以後的數字是該年內四季的 (1) Figures for 1991 and onwards are averages of the 估計數字的平均數’而九一年以前的數字是 four quarterly estimates of the year, whereas those 指該三月底的情況 � prior to 1991 refer to the position as at end March
of the corresponding year. ( 2 )業務收益指數於一九九二統計年度開始編 (2) Business receipts indices were first available in the
製’但此詳細分類的指數則於九六年開始編 reference year 1992, but indices at such detailed 製� breakdown were first compiled in 1996.
(3) 由於機場管理局的成立’由一九九八年第三 (3) With the establishment of the Airport Authority, 季開始’機場的業務收益已包括在航空運輸 the business receipts from the Airport, which were 月 6務業的昼益 ° previously excluded, are included in the business
receipts of air transport service industry as from Q3 1998.
(4) 包括政府服務的增加價値° 一九九四年及以 (4) Including value added of government services. 後的數字包括政府收到的營運特許權費 Figures for 1994 and onwards include trading 用’因此不可與早傘的數字作嚴格比較° concessions received by government and hence
are not strictly comparable with those for earlier years.
[]一九九一年前的數字的涵蓋範圍與其後的 [ ] F i g u r e s prior to 1991 are slightly different in 略有不同’—此不亩將兩組數字作嚴格比 coverage and therefore are not strictly comparable 較� with those for 1991 and onwards.
服務業統計摘要一九九九年 7

表 1 . 1 (續) 航 空 運 輸 業 的 機 構 單 位 數 目 、 就 業 人 數 、 業 務 收 益 指 數 、 生 產 總 額 及 增 加
價 値
Table 1.1 (Cont'd.) Number of Establishments and Persons Engaged, Business Receipts Index, Gross Output and Value Added of the Air Transport Industry
百萬元(另有註明除外) $ million, unless otherwise specified
1994 1995 1996 1997 1998 機構單位數目(1) 6 7 5 6 9 7 7 5 3 8 1 0 6 8 4 Number of establishments'" (11.9) (3.3) (8.0) (7.6) (-15.6)
就業人數⑴ 2 8 2 9 4 2 9 8 8 1 3 2 3 1 9 3 3 5 9 6 3 0 3 8 1 Number of persons e n g a g e d � (5.6) (5.6) (8.2) (4.0) (-9.6) 業務收益指數(2>’(3) (1996=100) - - 100.0 106.3 95.7 Business receipts index'' ' ' ' ' (1996=100) - - - (6.3) (-10.0)
生產總額(4) 39,956 45,318 49,186 49,600 N.A. Gross o u t p u t � (17.2) (13.4) (8.5) (0.8) N.A.
增加價値⑷ 19,984 21,499 24,453 24,532 N.A. Value added'"' (37.0) (7.6) (13.7) (0.3) N.A.
在以要素成本計算的本地生產總値內所佔比率(%) 2 . 1 2 . 1 2 . 2 2 . 0 N . A . Contribution to GDP at factor cost (%) 增加價値在生產總額所佔比率 5 0 . 0 4 7 . 4 4 9 . 7 4 9 . 5 N . A . Value added as % of gross output
註釋:括號內的數字是與上年比較的變動百分率° Notes : Figures in brackets are percentage changes over the preceding year.
(1) 一九九一年及以後的數字是該年內四季的 (1) Figures for 1991 and onwards are averages of the 估計數字的平均數’而九一年以前的數字是 four quarterly estimates of the year, whereas those 指該•三月底白青況� prior to 1991 refer to the position as at end March
of the corresponding year. ( 2 )業務收益指數於一九九二統計年度開始編 (2) Business receipts indices were first available in the
製’但此詳細分類的指數則於九六年開始編 reference year 1992, but indices at such detailed 製� breakdown were first compiled in 1996.
(3) 由於機場管理局的成立’由一九九八年第三 (3) With the establishment of the Airport Authority, 季開始’機場的業務收益已包括在航空運輸 the business receipts from the Airport, which were 月15務業白勺業矛务|[益 ° previously excluded, are included in the business
receipts of air transport service industry as from Q3 1998.
(4) 包括政府服務的增加價値。一九九四年及以 (4) Including value added of government services. 後的數字包括政府收到的營運特許權費 Figures for 1994 and onwards include trading 用’因此不可與較早年的數字作嚴t各比較° concessions received by government and hence
are not strictly comparable with those for earlier years.
8 Statistical Digest of the Services Sector 1999
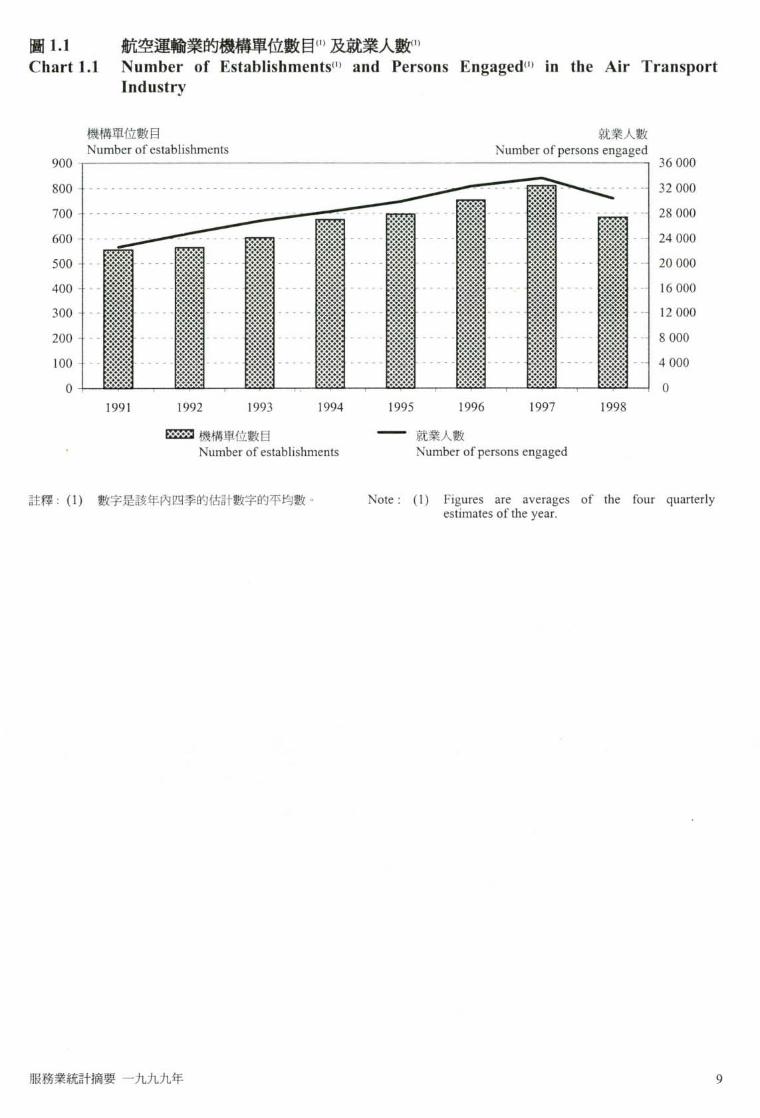
圓1.1 航空運輸業的機構單位數目⑴及就業人數⑴
Chart 1.1 Number of Establishments''' and Persons Engaged'" in the Air Transport Industry
機構單位數目 就業人數
Number of establishments Number of persons engaged 900 J - — — — — — — 3 6 000 800 32 000 700 l^Znn _ i i l l ——-- 28 000
— — m 闘 誦 _ 麵
600 險?:j :•:•:•:•:: 觀:;: 維运 鬆赛 - - 2 4 000
500 - 國 :||:| 議_ 丨纖 —圓 霧 ! 纖——-20 000
400 ——I纏 _ _ _ _ _ _ _纏 ::::::! III: !纏 一―—16 000 300 - 1111 纖_ I I I I I I I I ——議_ 議 !議 I I I … 1 2 000 200 - --_——_——K M M——M——M M 8000
::::::::::: :::::::::: ::::::::::: :::::::::: :::::::::: :燃 :::欲: :::裕: 100 - … _ 総 乡 … - 纖 珍纖 _ - :疆 纖: - - 4 000
o l _ m , W , _ , _ _ , _ _ 0 1991 1992 1993 1994 1995 1996 1997 1998 ^ ^機構單位數目 就業人數 Number of establishments Number of persons engaged
註釋:(1) 數字是該年內四季的估計數字的平均數。 Note: (1) Figures are averages of the four quarterly estimates of the year.
服務業統計摘要一九九九年 9

表 1 . 2 航 空 運 輸 服 務 容 量 的 統 計 數 字
Table 1.2 Statistics on Capacity of Air Transport Services
1989 1990 1991 1992 1993 服務香港的航空公司數目⑴ 3 9 3 9 4 3 4 7 5 2 Number of airline companies serving Hong (5.4) (0.0) (10.3) (9.3) (10.6) Kong<" 定 期 ( 2 ) 國 際 班 機 數 目 7 5 5 2 8 8 1 6 8 8 9 1 6 0 7 9 6 6 3 8 1 0 9 5 1 2 Number of scheduled''' international flights''' (14.0) (8.2) (12.1) (5.5) (13.3)
不定期⑵國際班機數目⑶ 1 4 0 7 7 1 5 1 0 0 1 4 9 0 0 1 5 5 5 6 1 4 5 0 3 Number of non-scheduled''' international flights"' (31.7) (7.3) (-1.3) (4.4) (-6.8)
來港的定期載客班機數目以每星期計) 7 2 9 8 2 1 8 7 0 1 0 1 5 1 1 0 9 Number of incoming scheduled''' passenger (10.6) (12.6) (6.0) (16.7) (9.3) flights per w e e k � 機位總數(以每星期計) 2 0 7 9 0 8 2 3 3 8 7 2 2 5 5 6 7 7 2 9 2 0 5 1 3 3 1 0 9 4 Total seat capacity per w e e k � (10.5) (12.5) (9.3) (14.2) (13.4)
1994 1995 1996 1997 1998 服 務 香 港 的 航 空 公 司 數 目 5 5 6 0 6 0 66* 66 Number of airline companies serving Hong (5.8) (9.1) (0.0) (10.0) (0.0) Kong � 定期國際班機數目 ( 3 ) 122 086 130317 137 740 147 591 151 182 Number of s chedu led� international flights� (11.5) (6.7) (5.7) (7.2) (2.4)
不 定 期 ( 2 ) 國 際 班 機 數 目 1 6 1 3 6 1 4 8 4 8 1 4 0 5 0 1 3 6 6 1 * 1 2 9 7 7 Number of non-scheduled''' international flights'" (11.3) (-8.0) (-5.4) (-2.8) (-5.0)
來港的定期 ( 2 >載客班機數目以每星期計) 1 2 0 3 1 2 2 9 1 3 3 7 1 3 8 2 1 3 8 1 Number of incoming schedu led� passenger (8.5) (2.2) (8.8) (3.4) (-0.1) flights per w e e k � 機位總數(4)(以每星期計) 3 5 8 7 0 3 3 8 3 6 4 9 4 0 9 2 2 4 4 1 9 0 6 9 4 1 3 4 4 1 Total seat capacity per week'"' (8.3) (7.0) (6.7) (2.4) (-1.3) 註釋:括號內的數字是與上年比較的變動百分率° Notes : Figures in brackets are percentage changes over the
preceding year. ( 1 ) 指該年度三月份的數字 � (1) Figures refer to the position as at March of the
corresponding year. ( 2 )定期班機包括在預先發布的時間表內的航 (2) Scheduled flights include the flights m the
班及加班機’但不包括包機及非運輸業務班 published schedule and the extra-section flights 機 ° but not include charter flights and non-revenue
flights. (3) 指截至該年三月底的十二個月內的總計。 (3) Figures refer to the total in the twelve-month
period ended March of the corresponding year. ( 4 )單指十二月份內的定期班機。 (4) Figures refer to scheduled flights in December
only.
10 Statistical Digest of the Services Sector 1999

表 1 . 3 航機升降次數“)
Table 1.3 Aircraft Movements*”
1989 1990 1991 1992 1993 升降總計 9 4 3 0 0 1 0 5 7 8 2 1 0 9 7 1 8 1 2 0 9 6 8 1 3 5 0 9 2 Total movements (8.4) (12.2) (3.7) (10.3) (11.7)
降落架次 4 7 1 4 0 5 2 8 8 6 5 4 8 6 3 6 0 4 8 3 6 7 5 4 8 Landings (8.4) (12.2) (3.7) (10.2) (11.7) 起飛架次 47 1 6 0 52 8 9 6 54 8 5 5 60 4 8 5 67 544
Take-offs (8.4) (12.2) (3.7) (10.3) (11.7)
1994 1995 1996 1997 1998 升降總計 1 4 3 2 5 1 1 5 0 1 1 8 1 5 8 7 9 7 1 6 5 1 5 4 1 6 3 2 2 3 Total movements (6.0) (4.8) (5.8) (4.0) (-1.2)
降落架次 7 1 6 0 9 7 5 0 5 3 7 9 4 0 1 8 2 5 7 3 8 1 6 1 6 Landings (6.0) (4.8) (5.8) (4.0) (-1.2) 起飛架次 7 1 6 4 2 7 5 0 6 5 7 9 3 9 6 8 2 5 8 1 8 1 6 0 7 Take-offs ^ ^ ^ ^ (-1.2)
註釋:括號內的數字是與上年比較的變動百分率� Notes ; Figures in brackets are percentage changes over the preceding year.
(1)包括載客及載貨班機 ° (1) Including passenger and cargo flights.
圖 1 . 2 航機升降次Ifcitf" Chart 1.2 Total Number of Aircraft Movements
航機升降次數 Number of aircraft movements
180 000 J -
160 000 ——
140 000 — ^ 120 000 100 000 -80 000 60 000
40 000 20 000
0 -i 1 1 1 1 1 1 1 1 1 1 1 1 1 i ‘ 1 1 1989 1990 1991 1992 1993 1994 1995 1996 1997 1998
服務業統計摘要一九九九年 11
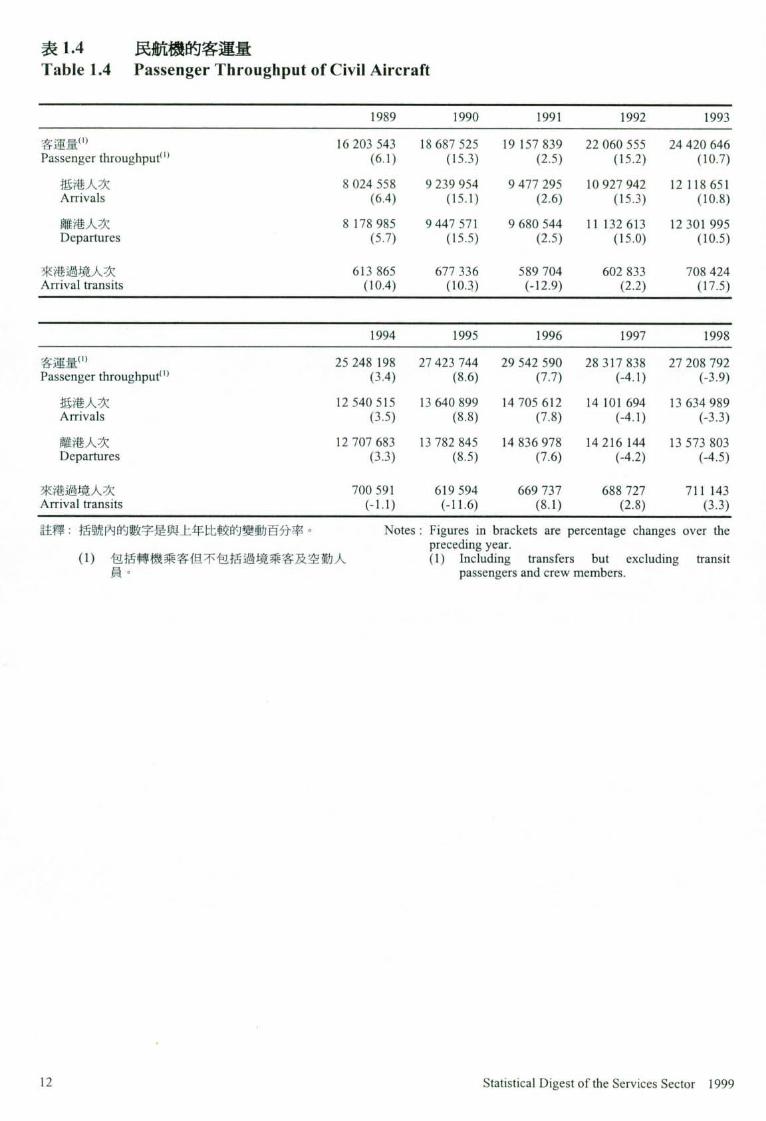
表 1 . 4 民航機的客運量
Table 1.4 Passenger Throughput of Civil Aircraft
1989 1990 1991 1992 1993 客 運 量 1 6 2 0 3 5 4 3 18 6 8 7 5 2 5 19 1 5 7 8 3 9 2 2 0 6 0 5 5 5 2 4 4 2 0 6 4 6 Passenger th roughput� (6.1) (15.3) (2.5) (15.2) (10.7)
抵港人次 8 0 2 4 5 5 8 9 2 3 9 9 5 4 9 4 7 7 2 9 5 1 0 9 2 7 9 4 2 1 2 1 1 8 6 5 1 Arrivals (6.4) (15.1) (2.6) (15.3) (10.8) 離港人次 8 1 7 8 9 8 5 9 4 4 7 5 7 1 9 6 8 0 5 4 4 1 1 1 3 2 6 1 3 1 2 3 0 1 9 9 5 Departures (5.7) (15.5) (2.5) (15.0) (10.5)
來港過境人次 6 1 3 8 6 5 6 7 7 3 3 6 5 8 9 7 0 4 6 0 2 8 3 3 7 0 8 4 2 4 Arrival transits (10.4) (10.3) (-12.9) (2.2) (17.5)
1994 1995 1996 1997 1998 客運量(“ 2 5 2 4 8 1 9 8 2 7 4 2 3 7 4 4 2 9 5 4 2 5 9 0 2 8 3 1 7 8 3 8 2 7 2 0 8 7 9 2 Passenger th roughpu t� (3.4) (8.6) (7.7) (-4.1) (-3.9)
抵港人次 1 2 5 4 0 5 1 5 1 3 6 4 0 8 9 9 1 4 7 0 5 6 1 2 1 4 1 0 1 6 9 4 1 3 6 3 4 9 8 9 Arrivals (3.5) (8.8) (7.8) (-4.1) (-3.3) 離港人次 1 2 7 0 7 6 8 3 1 3 7 8 2 8 4 5 1 4 8 3 6 9 7 8 1 4 2 1 6 1 4 4 1 3 5 7 3 8 0 3 Departures (3.3) (8.5) (7.6) (-4.2) (-4.5)
來港過境人次 7 0 0 5 9 1 6 1 9 5 9 4 6 6 9 7 3 7 6 8 8 7 2 7 7 1 1 1 4 3 Arrival transits (-1.1) (-11.6) (8.1) (2.8) (3.3) 註釋:括號內的數字是與上年比較的變動百分率� Notes : Figures in brackets are percentage changes over the
preceding year. (1) 包括轉機乘客但不包括過境乘客及空勤人 (1) Including transfers but excluding transit
貴� passengers and crew members.
12 Statistical Digest of the Services Sector 1999

表1.5 以空運進出香港的貨物及郵遞
Table 1.5 Inward and Outward Movements of Cargo and Mail by Air 公噸
Tonnes 1989 1990 1991 1992 1993
貨物 730 020 801 939 849 786 956 907 1 139 090
Cargo (5.2) (9.9) (6.0) (12.6) (19.0) 卸貨量 307 279 352 887 372 126 422 621 512 534 Unloaded (7.4) (14.8) (5.5) (13.6) (21.3) 裝貨量 422 741 449 052 477 660 534 286 626 556
Loaded (3.6) (6.2) (6.4) (11.9) (17.3)
郵遞⑴ 21 040 23 184 24 521 26 369 27 732
Mail � (14.4) (10.2) (5.8) (7.5) (5.2) 卸貨量 7 894 8 541 9 181 10 000 11 062
Unloaded (9.9) (8.2) (7.5) (8.9) (10.6) 裝貨量 13 146 14 643 15 340 16 369 16 670
Loaded (17.2) (11.4) ^ ^ 0_8)_
'mi 貨物 1 292 504 1 457 680 1 563 493 1 786 487 1 628 742
Cargo (13.5) (12.8) (7.3) (14.3) (-8.8) 卸貨量 605 782 685 450 733 907 839 872 774 544
Unloaded (18.2) (13.2) (7.1) (14.4) (-7.8) 裝貨量 686 722 772 230 829 586 946 615 854 198 Loaded (9.6) (12.5) (7.4) (14.1) (-9.8)
郵遞⑴ 27 700 27 062 27 280 26 779 25 614
Mail � (-0.1) (-2.3) (0.8) (-1.8) (-4.4) 卸貨量 10 990 10 205 10 995 11 800 11 975 Unloaded (-0.7) (-7.1) (7.7) (7.3) (1.5) 裝貨量 16 710 16 857 16 285 14 979 13 639 Loaded ^ ^ (-8.9)
註釋:括號內的數字是與上年比較的變動百分率� Notes : Figures in brackets are percentage changes over the preceding year.
(1)包括過境郵遞 ° (1) Including transit mail.
服務業統計摘要一九九九年 13

圓 1 . 3 航空貨運量 (”及客運量⑺
Chart 1.3 Cargo<" and Passenger� Throughput by Air 貨運量(公噸) 客運量 Cargo throughput (tonnes) Passenger throughput
2 000 000 _ _ _ _ _ _ — —•.…...一 — — — 4 0 000 000
1 750 000 ^ ^ 35 000 000 1 500 000 c ^ 缀——藝 鐵 - 30 000 000 1 250 000 i l l ——纖————•! — — 25 000 000
1 000 000 -J 潤 _ M M M M 20 000 000
CZ^ 闘 ::::::: ^ 総 i:::::: :欲 :総
I——_——_ -…議——_ ---議——_——藝--15 000 000 I — —讓— —國 - - - -議— —隱— — _ ———-議————M——U 10 000 000
I了_ :睡 7 細…隱…隱: 1 : � _ 1989 1990 1991 1992 1993 1994 1995 1996 1997 1998
^ 貨 物 乘客 Cargo Passengers 註釋:(1 )指航空貨物總裝卸量。 Notes: (1) Figures refer to the total tonnes of air cargo
unloaded and loaded. (2) 指乘民航機抵港及離港乘客的總人次’包括 (2) Figures refer to the total number of passenger 轉機乘客’但不包括過境乘客及空勤人員° arrivals and departures of civil aircraft, including
transfers but excluding transit passengers and crew members.
圓 1 . 4 航 空 郵 遞 量 Chart 1.4 Mail Throughput by A i r � 郵遞量(公噸) Mail throughput (tonnes)
30 000 竺丄—二 , — rvTj _ _ _ _ _ 000 1*1*1*1 t*t*t*4 •! ..
_ 燃 _ _ _ _ 纖 _ 關 維 餘 総 総 麵 魏 20 000 _ _ _ _ _
動 錄 缴 _ 総 徽 • 餘 稱 餘 織 M _ M 缴 M 総 M 饿 絲
15 000 欲 — — m — — _ — — M — — W … - M - …稱 M——— M _ 議 關 議 _ 圏 _ 國 議 國
1 � � � � … … i 5 000 - i … _ i _ _ _ _ _ -
0 _ _ , tvtvj , Ft'tya , WM Ftvya , Wfn I F蹄a , t網 F蹄坊 1989 1990 1991 1992 1993 1994 1995 1996 1997 1998
註釋:(1)指航空郵遞總裝卸量’包括過境郵遞。 Note: (1) Figures refer to the total tonnes of air mail unload and loaded, including transit mail. 14 Statistical Digest of the Services Sector 1999
表1.6 航空運輸業的選定最新統計數字
Table 1.6 Selected Up-to-date Statistics on Air Transport Services
1998 1999 第一季 第二季 第三季 第四季 第一季 ^ ^ Q3 Q4 ^
機構單位數目 769 562 645 758 845 Number of establishments 就業人數 32 876 29 720 29 023 29 905 33 744 Number of persons engaged
業務收益指數(丨996=100) 86.0 92.6 100.7 103.4* 101.6 Business receipts index (1996=100)
航機升降次數 39 382 40 070 41 934 41 837 40 669 Aircraft movements
降落架次 19 694 20 036 20 965 20 921 20 326
Landings 起飛架次 19 688 20 034 20 969 20 916 20 343
Take-offs
民航機客運量 6 405 241 6 636 801 7 165 024 7 001 726 6 797 019 Passenger throughput of civil aircraft
抵港人次 3 192 238 3 322 015 3 559 734 3 561 002 3 380 079
Arrivals 離港人次 3 213 003 3 314 786 3 605 290 3 440 724 3 416 940
Departures
來港過境人次 1 6 4 5 5 7 1 9 0 2 4 9 1 8 3 2 3 4 1 7 3 1 0 3 1 7 5 8 0 2 Arrival transits 以空運進出香港的貨物 392 903 420 519 355 233* 460 087* 407 749 Inward and outward movements of cargo by air
卸貨量(公m) 198 364 211 058 163 390* 201 732* 189 420 Unloaded (tonnes) 裝貨量(公_) 194 539 209 461 191 843* 258 355* 218 329 Loaded (tonnes)
以空運進出香港的郵遞 5 9 9 3 6 3 3 1 6 2 9 0 7 0 0 0 6 4 5 6 Inward and outward movements of mail by air
卸貨量(公_) 2 853 3 035 3 081 3 006 3 035 Unloaded (tonnes) 裝貨量(公噸) 3 140 3 296 3 209 3 994 3 421 Loaded (tonnes)
服務業統計摘要一九九九年 15
資料來源 Data Sources 表 資料來源 Table Sources 1.1 政府統計處 1.1 Census and Statistics Department 1.2 民航處; 1.2 Civil Aviation Department;
香港方孩遊協會 Hong Kong Tourist Association 1.3-1.5 民航處 1.3-1.5 Civil Aviation Department
其他有關刊物 Further References 就業及空缺統旨f(詳細統計表) Employment and Vacancies Statistics (Detailed Tables) 本地生產總値估計 Estimates of Gross Domestic Product 香港機場管理局年報’香港機場管理局編製 Hong Kong Airport Authority Annual Report, published
by the Airport Authority of Hong Kong 香港統計年干fj Hong Kong Annual Digest of Statistics 香港統計月干U Hong Kong Monthly Digest of Statistics 服務行業按季業務收益指數 Quarterly Business Receipts Indices for Service
Industries 就業、空缺及薪金總額按季統計報告 Quarterly Report of Employment, Vacancies and
Payroll Statistics 本地生產總値估言十按季幸艮告 Quarterly Report of Gross Domestic Product Estimates 運輸及有關服務按年統計調查報告 Report on Annual Survey of Transport and Related
Services 香港民航處年幸艮’民航處編製 Report on Civil Aviation in Hong Kong, published by
the Civil Aviation Department
16 Statistical Digest of the Services Sector 1999

2 銀行業
Banking Services 槪要 Highlights 香港是全球其中一個主要銀行中心’使用香 As one of the world's leading banking centres, Hong 港銀行服務的國家遍及全球,其中尤以亞太 Kong's banking services are utilized by clients 地區爲主 ° throughout the world, and more specifically in the
Asia-Pacific region.
在一九九八年底,認可機構的數目是 3 3 3 At the end of 1998, the number of authorized 間’其中包括 172 間持牌銀行、 6 0 間有限制 institutions stood at 333, comprising 172 licensed 牌照銀行及 101 間接受存款公司。當中 165 banks, 60 restricted licence banks and 101 deposit-間認可機構在香港註冊、 1 6 8 間在香港以外 taking companies. 165 of these were incorporated in 地方註冊。除總辦事處外,各認可機構合共 Hong Kong and 168 were incorporated outside Hong 經營 1 600 間分行’組成一個遍布全港的龐 Kong. In addition to the main offices, these 大網絡。 authorized institutions together operated a
comprehensive network of 1 600 local branch offices spreading across the territory.
在香港經營的海外銀行數目很多。在一九九 Hong Kong has a strong presence of foreign banks. In 八年’除前述 168 間在香港以外的地方註冊 1998, in addition to those 168 authorized institutions 的認可機構外’更有 141 間來自 30 多個國家 incorporated outside Hong Kong, there were 141 /地區的海外銀行本港代表辦事處。截至九 representative offices of foreign banks coming from 八年十二月底’全球 500 間最大銀行中的 213 over 30 countries/regions. As at end December 1998, 間,以及其中 100 間最大銀行中的 79 間’均 213 of the largest 500 banks and 79 of the 100 largest 在香港設行 “ banks in the world had a presence in Hong Kong.
一九九七年’銀行業爲香港帶來 930 億元增 The value added generated by the banking industry 加價値’佔本地生產總値的 7 . 5 % ’是八九年 amounted to $93 billion, or 7.5% of Hong Kong's 的數字的四倍以上,爲發展最迅速的行業之 Gross Domestic Product (GDP) in 1997, more than 一 ° 在九八年’從事該行業的人士爲數約 four-folds the figure in 1989. It is among the fastest 80 000 名 ° growing industries. Some 80 000 people were
engaged in the industry in 1998.
由於受地區性金融風暴以及本地證券和地產 Largely affected by the regional financial turmoil and 市場倒退的影響’一九九八年的銀行收益因 the setback of the local stock and real estate markets, 而下降。與九七年比較’九八年銀行業的總 banking receipts showed considerable decline in 收益下跌 6 % � 1998. As a result, total receipts of the banking
industry declined by 6% in 1998 compared to 1997.
服務業統計摘要一九九九年 17

一九九 / V年底’香港的夕 i•幣儲備已累積至 Hong Kong ' s foreign currency reserves cumulated to 896 億美元’名列全球第四位,按人口平均 U S $ 8 9 . 6 b i m o n b y the end of 1998, the fourth largest 計算的數字爲 13 ,169 美元。 in the world, with a per capita foreign currency
reserves o fUS$13 ,169 .
一九九八年底’總存款負債是 2 9 , 5 4 0 億元 ’ At the end of 1998,the total deposit liabilities 較九七年上升 1 1 % ’ 其中以港元爲單位的佔 amounted to $2,954 billion, increasing by 11% 5 7 % � 而 以 外 幣 爲 單 位 的 則 佔 43% ° 存款上 compared to 1997, of which 57% were denominated 升’是由於本港金融市場在九八年下半年回 in Hong Kong dollar and 43% in foreign currencies. 穩’以及存放在認可機構的公司存款所得利 The increase was both contributed by the stabilisation 息收入可免繳利得稅’因而吸引公司把境外 of the local financial markets in the later part of 1998 資金調回香港 � and the repatriation of offshore funds upon exemption
of profit tax on interest income derived f rom corporate deposits with authorized institutions.
最 優 惠 貸 款 利 率 在 一 九 九 八 年 由 年 初 的 In 1998, the best lending rate was adjusted from 10 .25% 調低至年底的 9 . 0 % ,但以全年平均 10.25% at the beginning to 9 .0% at the end of the year, 計算仍較九七年高 111 個基點。同時’九八 but still higher than that in 1997 by 111 basis points in 年的貸款及墊款總額則顯著下降 2 0 % ’主要 terms of yearly average. Meanwhile , total loans and 是因本港經濟下調及銀行對放款持審慎態 advances registered a significant decline of 20% 度� during 1998,mainly brought about by the domestic
economic downturn and the cautious stance in bank lending.
由於存款上升和 t t款及塾款下降,貸存 t匕率 As a result of a rise in deposit and a decline in loans 從一九九七年的 1 5 4 . 7 % 大幅下降至九八年 and advances, the loan-to-deposit ratio fell 的 1 1 1 . 9 % substantially to 111.9% in 1998, compared with
154.7% in 1997.
18 Statistical Digest of the Services Sector 1999

主要統計數字 Key Statistics
百萬元(另有註明除外) $ million, unless otherwise specified
銀行業 Banking Industry
年 機構單位數目⑴ 就業人數⑴ 增加價値 業務收益指數 Year Number of Number of persons Value added Business receipts
establishments � engaged � index � (1996=100) 1989 � 1 932] [67 360] 22,723** -1990 [1 929] [68 684] 29,507** -1991 1 972 72 898 44,068** -1992 1 921 72 632 54,810** 62.3 1993 1 956 74 484 64,486** 72.7 1994 1 925 78 795 71,527** 76.4 1995 1 991 80 452 81,031** 89.4 1996 1 954 79 754 89,982** 100.0 1997 1 936 83 816 93,044** 103.9 1998 1 962 80 298 N.A. 97.6
註釋:(1) 一九九一年及以後的數字是該年內四季的 Notes: (1) Figures for 1991 and onwards are averages of the 估計數字的平均數’而九一年以前的數字是 four quarterly estimates of the year, whereas those 指該年三月的情況 ° prior to 1991 refer to the position as at end March
of the corresponding year. ( 2 )業務收益指數於一九九二統計年度開始編 (2) Business receipts indices were first available in the
痴。 reference year 1992. []一九九一年前的數字的涵蓋範圍與其後的 [ ] F i g u r e s prior to 1991 are slightly different in
略有不同’因此不可將兩組數字作嚴格比 coverage, and therefore are not strictly comparable 絞� with those for 1991 and onwards.
** 數字是根據有限數據而作出的粗略估計’在 ** These are crude estimates which are compiled 曰後得到更奏資料時可能會作相當大的If based on limited data. They may be subject to 言丁 ’ —此在運用這 6 字 & ’ ? i d �心留 i這 considerable revisions when more data become 點� available. Special care should be taken when
interpreting them.
服務業統計摘要一九九九年 19

主要統計數字(糖) Key Statistics (Cont'd.)
百萬元(另有註明除外) $ million, unless otherwise specified 外匯市場平均
港元銀行同業拆息市場 每日成交量 年 貸 款 及 墊 款 客 戶 存 款 ® 平 均 每 日 成 交 量 ( 百 萬 美 元 )
Year Amount of loans and Amount of customer Average daily trading Average daily trading a d v a n c e s � deposits*^' volume of Hong Kong volume of foreign
dollar interbank exchange m a r k e t � ’ � m a r k e t � (USS million)
1989 1,271,899 1,007,658 - 48,988 1990 1,788,609 1,231,271 - -1991 2,243,752 1,374,563 - -1992 2,469,561 1,503,107 - 60,345 1993 2,856,851 1,725,975 - -1994 3,264,549 1,945,572 118,534 -1995 3,738,558 2,226,238 155,020 90,198 1996 3,914,890 2,458,256 164,744 -1997 4,121,670 2,664,467* 182,805 -1998 3,304,380 2,954,173 155,752 78,555
註釋:(3) 數字會根據認可機構的最新更改而作出每 Notes: (3) Figures are revised monthly to take account of any 月修言丁_°表內數字是在一九九九年五月底公 subsequent amendments submitted by authorised 布的統計數字“ institutions. Figures in the table refer to statistics
released at end May 1999. (4) 數字由香港金融管理局自一九九四年開始 (4) Figures were first available from the Hong Kong
提供 ° Monetary Authority in 1994. (5) 包括現声、遠期及外匯掉期交易。資料來自 (5) Including spot, outright forward and foreign
g港考融管理局三年一度的統 f調査’故數 exchange swap transactions. Only tri-yearly 字每三年公布一次 ° . figures are available because the data are obtained
from a survey conducted by the Hong Kong Monetary Authority once every three years.
20 Statistical Digest of the Services Sector 1999

槪念及方法 Concepts and Methods 香港採用銀行三級制’在這制度下’認可機構分 Hong Kong adopts a three-tier banking system under 類爲持牌銀行、有限制牌照銀行及接受存款公 which authorized institutions are classified into 司°在香港金融管理局的監管下,只有認可機構 licensed banks (LB), restricted licence banks (RLB) 才可以接受公眾人士的存款 ° and deposit-taking companies (DTC). Only
authorized institutions, which are under the regulation of the Hong Kong Monetary Authority (HKMA), are allowed to accept deposits from the public.
箱;疗可接受任何金額及期限的存款。存腐激 Licensed banks can accept deposits of any size and 牌照銀行可接受金額不少於港幣五十萬元的任 any term of maturity. On the other hand, restricted 何期限的定期存款°麥受存款公眾則可接受金額 licence banks can only accept time deposits in amount 不少於港幣十萬元而期限不少於三個月的定期 of not less than $500,000 with any term of maturity, 存款°對認可機構所定的存款利率並無任何限 while deposit-taking companies can accept t ime 制 ° deposits in amount of not less than $100,000 with a
term of maturity of at least three months only. There is no restriction on interest rates payable by all authorized institutions.
旨忍可機構主要是從事貸款及接受存款’亦同時在 The main business areas of authorized institutions are 銀行同業拆息市場及夕 f匯市場擔當重要的角 related to granting of loans and accepting of deposits. 色 ° The authorized institutions also play an active role in
the interbank money market and the foreign exchange market.
需司業釋義 Definition of terms
包括持牌銀行、有限制牌照銀行、接受存 The banking industry covers licensed banks, restricted 款公司及海夕f銀行本港代表辦事處° licence banks, deposit-taking companies and
representative offices of foreign banks.
在香港’) r j•是指銀行用合資格證券作爲抵押 In Hong Kong, the Discount Window is the facility 品訂立回購協議,向金管局借取隔夜港元資金的 through which banks can borrow Hong Kong dollar 機制� funds overnight f rom the H K M A through repurchase
agreements using eligible securities as collateral.
機/羞罩位是指在單一擁有權或控制權(即單一公 An establishment is defined as an economic unit (i.e. a 司名義)下,在單一±也點從事一種或主要從事一 unit engaged in the production of goods or services) 種經濟活動(即生產貨物或提供服務)的經濟單 which engages, under a single ownership or control 位 ° (i.e. under a single company name), in one or
predominantly one kind of economic activity at a single physical location.
服務業統計摘要一九九九年 21

由一九九零年起’办經恵才的定義並不包括結構 Foreign currency positions, as from 1990,are defined 資產及負債(包括固定資產及物業投資、海外分 to exclude structural assets and liabilities (including 行資本、海外附屬公司和有關公司之投資以及資 investment in fixed assets and premises, overseas 本貸款)° branch capital, investment in overseas subsidiaries
and related companies and loan capital).
外勞/着激存Jt是指顧客在現貨市場購買外幣,然 Foreign currency swap deposits are deposits 後存入認、可機構’但同時fJ下遠期合約,將該筆 involving customers buying foreign currencies in the 外幣「本金加利息」在存款到期時售予認可機 spot market and placing them as deposits with 構。從分析角度來看’這類掉期存款應當作港元 authorized institutions, while at the same time 定期存款 ° entering into a contract to sell such foreign currencies
(principal plus interest) forward in line with the maturity of such deposits. For most analytical purposes, they should be regarded as Hong Kong dollar time deposits.
本地生產總値是指一個國家或地區的所有常住 Gross Domestic Product (GDP) is a measure of the 生產單位’在一個指定的期間內,未扣除固定資 total value of production of all resident producing 本消耒毛白勺生產總fit ° units of a country or territory in a specified period,
before deducting allowance for consumption of fixed capital.
生產總額是以淨收利息連同其他明確地收取的 Gross output is measured by the net interest receipts, 服務費、租金收入、佣金及其他收費來計算° together with other explicit service charges, rentals,
commissions and other fees received.
港元銀行同業拆息是指渣打銀行在銀行同業市 Hong Kong Dollar Interbank Offered Rates (HIBOR) 場收市時的中間利率報價。中間利率是借入利率 refer to the middle closing rates quoted by the 和拆出禾II率的平均數 ° Standard Chartered Bank in the interbank money
market.
^ 金 歡潘叙是早期香港式的貼現窗。銀行 Liquidity adjustment facility (LAF) was an earlier 可以利用合資格證券作爲抵押品,並按照金管局 Hong Kong version of a discount window. Banks 定出的拆出息率與金管局達成回購協議’藉此借 could borrow overnight funds from the H K M A 取隔夜資金°此外’銀行也可按照拆入息率將剩 through repurchase agreements of eligible securities at 餘的隔夜資金存入金管局。流動資金調節機制於 the Offer Rate set by the HKMA. They could also 一九九八年九月七日被貼現窗取代“在貼現窗運 place surplus funds overnight with the H K M A at the 作下’香港金融管理局不再向銀行借入資金° Bid Rate. The LAF was replaced by the Discount
Window on 7 September 1998,the H K M A no longer bids surplus funds from banks.
貨幣供應定義一是指市民持有的法定紙幣和硬 Money supply definition 1 (Ml) refers to the sum of 幣加上持牌銀行的客戶活期存款 ° legal tender notes and coins held by the public plus
customers' demand deposits placed with licensed banks.
22 Statistical Digest of the Services Sector 1999

貨幣供應定義二是指貨幣供應定義一所包括的 Money supply definition 2 (M2) refers to the sum of 項目,加上持牌銀行客戶的儲蓄及定期存款’再 M l plus customers' savings and time deposits with 加上持牌銀行發行而由非認可機構持有的可轉 licensed banks plus negotiable certificates of deposits 讓存款證 ° issued by licensed banks held by non-authorized
institutions.
貨幣供應定義三是指貨幣供應定義二所包括的 Money supply definition 3 (M3) refers to the sum of 各項’加上有限制牌照銀行及接受存款公司客戶 M2 plus customer deposits with restricted licence 的存款’加上以上兩類認可機構發行而由非認可 banks and deposit-taking companies plus negotiable 機構持有的可轉讓存款證 ° certificates of deposits issued by restricted licence
banks and deposit-taking companies held by non-authorized institutions.
就業人數包括積極參與機構單位工作的在職東 Persons engaged in an establishment include working 主及股東;在統計日期受僱於機構單位的全職僱 proprietors and partners actively engaged in the work 員’包括長期或臨時聘用的’無論這些僱員正在 of the establishment; full-time employees paid by the 開工或因事假或者病假而暫時缺勤:及在統計日 establishment on the survey reference date, both 期工作三小時或以上的兼職僱員和無酬家屬幫 permanent and temporary, who are either at work or 工� on vacation or sick leave; and part-time employees
and unpaid family workers working three hours or more on the survey reference date.
智方/7•是生產總額減去中間投產消耗(生產過 Value added is defined as the value of gross output 程中所耗用的貨物和月艮務的價値)。 less the value of intermediate consumption (the value
of goods and services used up in the course of production).
服務業統計摘要一九九九年 23

統計圓表 Statistical Tables and Charts 表2.1 認可機構及本港代表辦事處 Table 2.1 Authorized Institutions and Local Representative Offices
1989 1990 1991 1992 1993 認可機構及本港代表辦事處數目 5 6 3 5 6 0 5 2 7 5 1 5 5 1 3 Number of authorized institutions and local representative offices
持牌銀行 1 6 5 1 6 8 1 6 3 1 6 4 1 7 2 Licensed banks 有限制牌照銀行 3 6 4 6 5 3 5 6 5 7 Restricted licence banks 接受存款公司 2 0 2 1 9 1 1 5 9 1 4 7 1 4 2 Deposit-taking companies 本港代表辦事處 1 6 0 1 5 5 1 5 2 1 4 8 1 4 2 Local representative offices
世界最大五百間銀行在本港設行的情況 2 0 3 2 1 3 2 0 6 2 1 1 2 1 0 Presence of world's largest 500 banks in Hong Kong
1994 1995 1996 1997 1998 認可機構及本港代表辦事處數目 537* 537 525 520 474 Number of authorized institutions and local representative offices
持牌銀行 1 8 0 1 8 5 1 8 2 1 8 0 1 7 2 Licensed banks 有限制牌照銀行 6 3 6 3 6 2 6 6 6 0 Restricted licence banks 接受存款公司 1 3 7 1 3 2 1 2 4 1 1 5 1 0 1 Deposit-taking companies 本港代表辦事處 1 5 7 1 5 7 1 5 7 1 5 9 1 4 1 Local representative offices
世界最大五百間銀行在本港設行的情況 2 3 6 2 2 8 2 1 3 2 1 5 2 1 3 Presence of world's largest 500 banks in Hong Kong
24 Statistical Digest of the Services Sector 1999

圖2.1 認可機構及本港代表辦事處 Chart 2.1 Authorized Institutions and Local Representative Offices
本港代表辦事處 本港代表辦事處
Local Local 36% representative ^ ^ ^ \ 29% r^esenta t .ve ^ ^ ^ X 持牌銀行
- ^ ^ - ^ m \ : 二
Deposit-taking licence Deposit-taking 13% Restricted companies banks companies licence
1989 1998 banks
服務業統計摘要一九九九年 2 5

表2.2 銀行業的機構單位數目、就業人數、業務收益指數、生產總額及增加價値
Table 2.2 Number of Establishments and Persons Engaged, Business Receipts Index, Gross Output and Value Added of the Banking Industry
百萬元(另有註明除外) $ million,unless otherwise specified
1989 1990 1991 1992 1993 .機構單位數目⑴ [ 1 9 3 2 ] [ 1 9 2 9 ] 1 9 7 2 1 9 2 1 1 9 5 6
Number of es tabl i shments� (0.0) (-0.2) (2.2) (-2.6) (1.8)
就業人數⑴ [ 6 7 3 6 0 ] [ 6 8 6 8 4 ] 7 2 8 9 8 7 2 6 3 2 7 4 4 8 4 Number of persons engaged"' (5.0) (2.0) (6.1) (-0.4) (2.5) 業務收益指數(2) (1996=100) - - - 62.3 72.7 Business receipts index�(1996=100) - (16.7)
生產總額 32,177** 40,309** 56,518** 68,600** 79,557** Gross output (15.0) (25.3) (40.2) (21.4) (16.0)
增加價値 22,723** 29,507** 44,068** 54,810** 64,486** Value added (13.4) (29.9) (49.3) (24.4) (17.7)
在以要素成本計算的本地生產總値所佔比率(%) 4.6** 5.3** 7.0** 7.5** 7.8** Contribution to GDP at factor cost (%) 增加價値在生產總額所佔比率 70.6** 73.2** 78.0** 19.9** 81.1** Value added as % of gross output
註釋:括號內的數字是與上年比較的變動百分率° Notes : Figures in brackets are percentage changes over the preceding year.
(1) 一九九一年及以後的數字是該年內四季的 (1) Figures for 1991 and onwards are averages of the 估計iif字的平均數’而九一年以前的數字是 four quarterly estimates of the year, whereas those
該年三月 J的'丨青況� prior to 1991 refer to the position as at end March of the corresponding year.
( 2 )業務收益指數於一九九二統計年度開始編 (2) Business receipts indices were first available in the 勒� reference year 1992.
[]一九九一年前的數字的涵蓋範圍與其後的 [ ] F i g u r e s prior to 1991 are slightly different in 略有不同’因此不可將兩,組數字作嚴格比 coverage and therefore are not strictly comparable 較� with those for 1991 and onwards.
** 數字是根據有限數據而作出的粗略估計’在 ** These are crude estimates which are compiled 日後得到更多資料時可能會作相當大的 f i f based on limited data. They may be subject to 言丁 ’因此在運用這威字時’應小心留這 considerable revisions when more data become i j ^ � available. Special care should be taken when
interpreting them.
26 Statistical Digest of the Services Sector 1999

表 2 . 2 (繽) 銀 行 業 的 機 構 單 位 數 目 、 就 業 人 數 、 業 務 收 益 指 數 、 生 產 總 額 及 增 加 價 値
Table 2.2 (Cont'd.) Number of Establishments and Persons Engaged, Business Receipts Index, Gross Output and Value Added of the Banking Industry
百萬元(另有註明除外) $ million, unless otherwise specified 1994 1995 1996 1997 1998
機構單位數目⑴ 1 925 1 991 丨954 1 936 1 962 Number of establishments� (-1.6) (3.4) (-1.9) (-0.9) (1.3) 就業人數⑴ 7 8 7 9 5 8 0 4 5 2 7 9 7 5 4 8 3 8 1 6 8 0 2 9 8 Number of persons engaged*" (5.8) (2.1) (-0.9) (5.1) (-4.2)
業務收益指數⑵(1996=100) 7 6 . 4 89 .4 100 .0 103 .9 9 7 . 6 Business receipts index�(1996=100) (5.1) (17.0) (11.9) (3.9) (-6.1)
生產總額 90,060** 102,713** 116,532** 122,334** N.A. Gross output (13.2) (14.0) (13.5) (5.0) N.A.
增加價値 71,527** 81,031** 89,982** 93,044** N.A. Value added (10.9) (13.3) (11.0) (3.4) N.A.
在以要素成本計算的本地生產總値所佔比率(%) 7.5** 8.0** 8.0** 7.5** N.A. Contribution to GDP at factor cost (%) 增加價値在生產總額所佔比率 79.4** 78.9** 77.2** 76.1** N.A. Value added as % of gross output
註釋:括號內的數字是與上年比較的變動百分率� Notes : Figures in brackets are percentage changes over the preceding year.
(1) 一九九一年及以後的數字是該年內四季的 (1) Figures for 1991 and onwards are averages of the 估計數字的平均數’而九一年以前的數字是 four quarterly estimates of the year, whereas those j旨該年三月 J^白分隋況� prior to 1991 refer to the position as at end March
of the corresponding year. ( 2 )業務收益指數於一九九二統計年度開始編 (2) Business receipts indices were first available in the
製� reference year 1992. ** 數字是根據有限數據而作出的粗略估It ’在 ** These are crude estimates which are compiled
日後得到更多資料時可能會作相當大的堵 based on limited data. They may be subject to 言丁 ’因此在運用這數字知’應小心留;i這 considerable revisions when more data become I j ^ � available. Special care should be taken when
interpreting them.
服務業統計摘要一九九九年 2 7

圖2.2 銀行業的機構單位數目⑴及就業人數⑴
Chart 2.2 Number of Establishments'" and Persons Engaged'" in the Banking Industry 機構單位數目 就業人數
Number of establishments Number of persons engaged 2 4 0 0 •"“ •"•—-..••—•>•——-.•.-•--•—.—— .. • •.• • •••••-……-— - - —”•+•• • > •••••'—• ——•••— -••••• - - 1 2 0 0 0 0
2 。 0 0 — _ 网 … _ _ _ 网 … 圍 肩 … _ 0
1 6 0 0 - … - _ > _ ——圓——_一_〜_— 80000 _ _ 瞧 _ 睡 _ 觀 國
_ _ _ _ _ _ _ _ 8 。 。 - 省 … — — r … … _ — — — • … - 4 _
4 0 0 - … 圓 - … - _ … - 隱 … - 圓 - … _ -- 20000
„ — l l l l _ J J � — . � 1991 1992 1993 1994 1995 1996 1997 1998
E ^機構單位數目 就業人數 Number of establishments Number of persons engaged
註釋:(1) 數字是該年內四季的估計數字的平均數。 Note: (1) Figures are averages of the four quarterly estimates of the year.
28 Statistical Digest of the Services Sector 1999
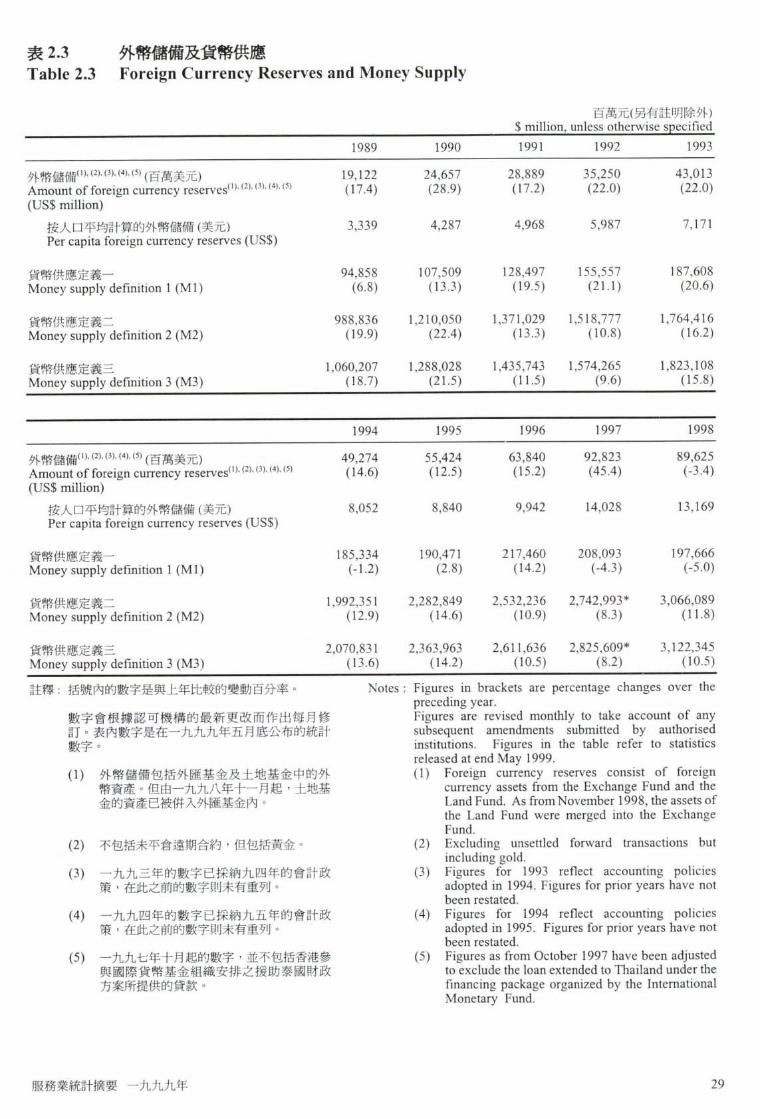
表2.3 外幣儲備及貨幣供應 Table 2.3 Foreign Currency Reserves and Money Supply
百萬元(另有註明除外) $ million, unless otherwise specified
1989 1990 1991 1992 1993 外幣儲備⑴’ (2).⑶’ (4). (5)(百萬美元) 19,122 24,657 28,889 35,250 43,013 Amount of foreign currency reserves�.(2>’ � ( 4 ) . � (17.4) (28.9) (17.2) (22.0) (22.0) (US$ million)
按人口平均計算的外幣儲備(美元) 3,339 4,287 4,968 5,987 7,171 Per capita foreign currency reserves (US$)
貨幣供應定義一 94,858 107,509 128,497 155,557 187,608
Money W p l y definition 1 (Ml) (6.8) (13.3) (19.5) (21.1) (20.6) 貨幣供應定義二 988,836 1,210,050 1,371,029 1,518,777 1,764,416
Money supply definition 2 (M2) (19.9) (22.4) (13.3) (10.8) (16.2)
貨幣供應定義三 1,060,207 1,288,028 1,435,743 1,574,265 1,823,108 Money supply definition 3 (M3) (18.7) (21.5) (11.5) ^ (15.8)
1994 1995 1996 1997 1998 外幣儲備⑴’ (
2).⑶.⑷,⑶(百萬美元) 49,274 55,424 63,840 92,823 89,625
Amount of foreign currency reserves�’ (2>’ � � ( 5 ) (14.6) (12.5) (15.2) (45.4) (-3.4) (US$ million)
按人口平均計算的外幣儲備(美元) 8,052 8,840 9,942 14,028 13,169 Per capita foreign currency reserves (US$)
貨幣供應定義一 185,334 190,471 217,460 208,093 197,666 Money supply definition 1 (Ml) (-1.2) (2.8) (14.2) (-4.3) (-5.0)
貨幣供應定義二 1,992,351 2,282,849 2,532,236 2,742,993* 3,066,089 Money supply definition 2 (M2) (12.9) (14.6) (10.9) (8.3) (11.8)
貨幣供應定義三 2,070,831 2,363,963 2,611,636 2,825,609* 3,122,345 Money supply definition 3 (M3) (13.6) (14.2) (10.5) (8.2) (10.5) 註釋:括號內的數字是與上年比較的變動百分率� Notes : Figures in brackets are percentage changes over the
preceding year. 數字會根據認可機構的最新更改而作出每月修 Figures are revised monthly to take account of any 訂。表數字是在一九九九年五月底公布的統 I t subsequent amendments submitted by authorised 6字� institutions. Figures in the table refer to statistics
released at end May 1999. (1) 外幣儘備包括外匯基金及土地基金中的外 (1) Foreign currency reserves consist of foreign
資產 ° 但i一九九八年"i•"一月起 ’ 土地基 currency assets from the Exchange Fund and the 金的資產巨被倂入外匯基金內� Land Fund. As from November 1998, the assets of
the Land Fund were merged into the Exchange Fund.
( 2 )不包括未平倉遠期合約’但包括黃金 ° (2) Excluding unsettled forward transactions but including gold.
(3) 一九九三年的數字已採納九四年的會計政 (3) Figures for 1993 reflect accounting policies 策’在此之前的數字貝IJ未有重歹IJ “ adopted in 1994. Figures for prior years have not
been restated. (4) 一九九四年的數字已採納九五年的會計政 (4) Figures for 1994 reflect accounting policies
策’在此之前的數字則未有重列� adopted in 1995. Figures for prior years have not been restated.
(5) 一九九七年十月起的數字’並不包括香港參 (5) Figures as from October 1997 have been adjusted 與國際貨幣基金組織安排之援助泰國財政 to exclude the loan extended to Thailand under the 方案戶/j•运供的貸款� financing package organized by the International
Monetary Fund.
服務業統計摘要一九九九年 29

圓 2 . 3 外幣儲備⑴’⑴⑶’⑷.
Chart 2.3 Amount of Foreign Currency Reserves⑴“辑(雜
外幣儲備(百萬美元) 按人口平均計算的外幣儲備(美元) Amount of foreign currency reserves (USS million) Per capita foreign currency reserves (USS)
1 ^ ^ ^ ^ 、、"*••*,.•…一〜、.*"•+*- _ •v-«、《*™ •••_____• .........W.-. — . 、: -w....-"-. •••••• ••••v ••••••••^•o、、、—— " - w - w • • • — ••• ^^ ^ ^
_ _
灣‘“―—攀
60,000 隱 j - j / ^ 纖 纖i 12,000 a j ^ r i i 40,000 稱 : : : : 驳 — — 総 纖 総 8,000 _ _ _ _ _ _ � … … _ — … … — _ … • 1 1 … 4 ’ � � �
1989 1990 1991 1992 1993 1994 1995 1996 1997 1998 ^ 外 幣 儲 備 按人口平均計算的外幣儲備
Amount of foreign currency reserves Per capita foreign currency reserves
註釋:數字會根攄認可機構的最新更改而作出每月修 Notes: Figures are revised monthly to take account of any 訂。表 l ^ i i j字是在一九九九年五月底公布的統計 subsequent amendments submitted by authorised ^字� institutions. Figures in the table refer to statistics
released at end May 1999. (1) 外幣儲備包括外匯基金及土地基金中的外 (1) Foreign currency reserves consist of foreign
幣資產。但 i —九九八年十一月起 ’ 土地基 currency assets from the Exchange Fund and the 金的資產已被倂入外匯基金內� Land Fund. As from November 1998, the assets of
the Land Fund were merged into the Exchange Fund.
( 2 )不包括未平倉遠期合約,但包括黃金。 (2) Excluding unsettled forward transactions but including gold.
( 3 )—九九三年的數字已採納九四年的會計政 (3) Figures for 1993 reflect accounting policies 策,在此之前的數字則未有重列 ° adopted in 1994. Figures for prior years have not
been restated. ( 4 )—九九四年的數字已採納九五年的會計政 (4) Figures for 1994 reflect accounting policies
策’在此之前的數字則未有重列� adopted in 1995. Figures for prior years have not been restated.
( 5 )—九九七年十月起的數字’並不包括香港參 (5) Figures as from October 1997 have been adjusted 與國際貨幣基金組織安排之援助泰國財政 to exclude the loan extended to Thailand under the 方案戶斤提供的貸款 ° financing package organized by the International
Monetary Fund.
30 Statistical Digest of the Services Sector 1999

表 2 . 4 認 可 機 構 的 流 動 資 金
Table 2.4 Liquidity of Authorized Institutions %
1989 1990 1991 1992 1993 流動資金⑴ Liquidity �
貸存比率 1 2 6 . 2 1 4 5 . 3 1 6 3 . 2 1 6 4 . 3 1 6 5 . 9 Loan-to-deposit ratio 港元貸存比率⑵ 1 1 6 . 5 1 1 6 . 7 1 1 9 . 8 1 1 8 . 7 1 1 1 . 5 Hong Kong dollar loan-to-deposit ratio®
1994 1995 1996 1997 1998 流動資金ti} Liquidity �
貸存比率 167.8 167.9 159.3 154.7* 111.9 Loan-to-deposit ratio 港元貸存比率⑵ 1 1 0 . 2 1 0 5 . 6 1 0 3 . 4 1 1 3 . 3 1 0 0 . 6 Hong Kong dollar loan-to-deposit r a t i o �
註釋:數字會根據認可機構的最新更改而作出每月修 Notes: Figures are revised monthly to take account of any 訂。表內數字是在一九九九年五月底公布的統計 subsequent amendments submitted by authorised g字� institutions. Figures in the table refer to statistics
released at end May 1999. (1) 所載數字僅反映香港辦事處的狀況� (1) Figures relate to Hong Kong office(s) only. ( 2 )港元存款已包括外幣掉期存款。 (2) Hong Kong dollar deposits have been adjusted to
include foreign currency swap deposits.
服務業統計摘要一九九九年 31

表2.5 認可機構的盈利能力、資產質素及資本充足比率 Table 2.5 Profitability, Asset Quality and Capital Adequacy of Authorized Institutions
1992 1993 1994 1995 1996 1997 1998 盈利能力
(丨>’
(2> Profitability � ’ (2>
淨肩、差 0.96 1.04 1.02 1.02 1.13 1.08 1.13 Net interest margin 成本與收入比率 40.5 38.5 43.0 41.8 43.0 45.9 48.4 Cost-income ratio
資產質素(2)’
(3>
Asset q u a l i t y � ’ � 壞脹準備與資產總額比率 0 . 0 7 0 . 0 6 0 . 0 4 0 . 0 5 0 . 0 9 0 . 1 3 * 0 . 4 3 Bad debt charge to total assets 準備金與貸款總額比率
(4)
As % of total loans'"' 準備金⑶ - - - 0 . 7 9 0 . 8 5 1 . 0 3 * 2 . 1 5 Provisions'^' 特定分類貸款
(6>
Classified loans'' ' 總額 - - - 0.89 1.10 1.23* 5.09 Gross 扣除特殊準備金 - - - 0.55 0.73 0.81* 3.65 Net of specific provisions 扣除所有準備金 - - - 0.10 0.24 0.20* 2.94 Net of all provisions
逾期貸款與貸款總額比率⑷ - - - 1.00 1.10 1.07* 4.10 Overdue loan''' to total l o a n s � 信用卡撇賬比率⑶ - - - - 2.3 2.1 3.1 Credit card charge-off ratio'^'
資本充足比率 Capital adequacy
股本與資產比率(9) 10.4 10.2 10.2 11.0 10.0 9.9 9.2 Equity to assets ratio'''' 資 本 充 足 比 率 - 1 7 . 0 1 7 . 4 1 7 . 5 1 7 . 8 1 7 . 5 1 8 . 6 Capital adequacy ratio''"'
註釋:⑴除另有註明外’否則所載數字僅反映香港辦 Notes : (1) Figures relate to Hong Kong office(s) only, except 事處的狀況 ° where otherwise stated.
(2) 自一九九一年起聞始採用新報告辦法’故九 (2) New reporting method has been adopted since 一年以後的數字與沒有列載於此的以前數 1991,figures after 1991 are therefore not strictly 字不可作嚴格比較� comparable with those in the previous years which
are not presented here. (3) 除壞脹準備金及信用卡撇賬比率外’所載數 (3) Figures relate to Hong Kong office(s) and in the
字反映香港辦事處及海外分行(如爲本地認 case of local authorized institutions, include 可機構)的狀況 ° overseas branches except for the bad debt charge
and credit card charge-off ratio. (4) 數字由香港金融管理局自一九九五年開始 (4) Figures were first available from Hong Kong
提供 ° Monetary Authority in 1995. ( 5 )數字是指未動用的準備金總額。 (5) Figures refer to the amount of total provisions
outstanding. (6)特定分類貸款是指被列爲「次級」、「呆滞」 (6) Classified loans are those graded as "substandard",
或「躬損」類別的貸款° "doubtful" or "loss". (7) 數字是指過期三個月以上的貸款及票據’以 (7) Figures refer to more than 3 months overdue loans
及經重組的貸款 ° and bills and rescheduled loans. ( 8 )數字是根據自一九九六年一月起就 17 間認 (8) Figures are based on a credit card survey of 17
可機構進行的信用卡業務調查結果計算° authorized institutions conducted since January 1996.
(9) 數字反映所有本地銀行的香港辦事處及海 (9) Figures refer to Hong Kong office(s) and overseas 外分行的狀況 ° branches for all local banks.
(10 )數字是指所有本地註冊機構的綜合比率。 (10) Figures refer to consolidated ratios for all locally incorporated institutions.
32 Statistical Digest of the Services Sector 1999
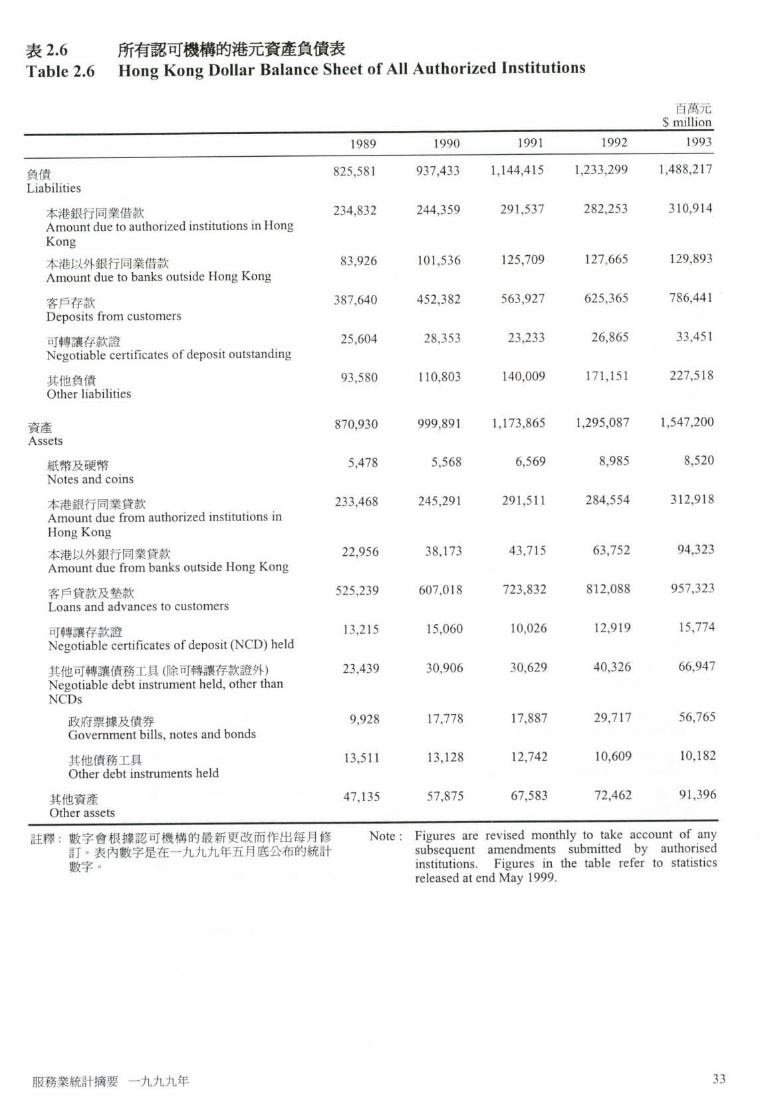
表2.6 所有認可機構的港元資產負債表 Table 2.6 Hong Kong Dollar Balance Sheet of All Authorized Institutions
百萬元 $ million
1989 1990 1991 1992 1993 負債 825,581 937,433 1,144,415 1,233,299 1,488,217
Liabilities 本港銀行同業借款 234,832 244,359 291,537 282,253 310,914 Amount due to authorized institutions in Hong Kong 本港以外銀行同業借款 83,926 101,536 125,709 127,665 129,893 Amount due to banks outside Hong Kong 客戶存款 387,640 452,382 563,927 625,365 786,441
Deposits from customers 可轉讓存款證 25,604 28,353 23,233 26,865 33,451 Negotiable certificates of deposit outstanding 其他負債 93,580 110,803 140,009 171,151 227,518
Other liabilities 資產 870,930 999,891 1,173,865 1,295,087 1,547,200
Assets 紙幣及硬幣 5,478 5,568 6,569 8,985 8,520
Notes and coins 本港銀行同業貸款 233,468 245,291 291,511 284,554 312,918
Amount due from authorized institutions in Hong Kong 本港以外銀行同業貸款 22,956 38,173 43,715 63,752 94,323
Amount due from banks outside Hong Kong 客戶貸款及墊款 525,239 607,018 723,832 812,088 957,323
Loans and advances to customers 可轉讓存款證 13,215 15,060 10,026 12,919 15,774
Negotiable certificates of deposit (NCD) held 其他可轉讓債務工具(除可轉讓存款證外) 23,439 30,906 30,629 40,326 66,947 Negotiable debt instrument held, other than NCDs
政府票據及債券 9,928 17,778 17,887 29,717 56,765
Government bills, notes and bonds 其他債務工具 13,511 13,128 12,742 10,609 10,182
Other debt instruments held 其他資產 47,135 57,875 67,583 72,462 91,396
Other assets 註釋:數字會根據認可機構的最新更改而作出每月修 Note: Figures are revised monthly to take account of any
訂。表內數字是在一九九九年五月底公布的統計 subsequent amendments submitted by authorised ‘ 字 � institutions. Figures in the table refer to statistics
released at end May 1999.
服務業統計摘要一九九九年 33

表2.6 (續) 所有認可機構的港元資產負債表 Table 2.6 (Cont'd.) Hong Kong Dollar Balance Sheet of All Authorized Institutions
百萬元 $ million
1994 1995 1996 1997 1998 負債 1,870,317 2,102,106 2,521,381 2,879,099 2,844,008 Liabilities
本港銀行同業借款 435,725 436,524 486,859 521,461 414,367 Amount due to authorized institutions in Hong Kong 本港以外銀行同業借款 174,118 201,179 234,799 289,891 231,604 Amount due to banks outside Hong Kong 客戶存款 912,398 1,121,818 1,361,574 1,495,277 1,655,845 Deposits from customers 可轉讓存款證 64,164 91,913 131,020 172,291 163,491 Negotiable certificates of deposit outstanding 其他負債 283,913 250,672 307,130 400,180 378,702 Other liabilities
資產 1,973,179 2,060,242 2,503,036 2,934,384 2,750,939 Assets
紙幣及硬幣 10,359 10,332 10,597 12,077 11,321 Notes and coins 本港銀行同業貸款 436,637 434,904 487,326 516,884 411,168 Amount due from authorized institutions in Hong Kong 本港以外銀行同業貸款 140,046 113,352 177,012 195,356 166,803 Amount due from banks outside Hong Kong 客戶貸款及墊款 U 19,377 1,237,330 1,447,844 1,742,481 1,695,039 Loans and advances to customers 可轉讓存款證 36,502 56,986 89,731 122,074 106,425 Negotiable certificates of deposit (NCD) held 其他可轉讓債務工具(除可轉讓存款證外) 124,696 86,661 139,158 187,205 202,596 Negotiable debt instrument held, other than NCDs
政府票據及債券 106,765 57,251 104,735 143,611 140,337 Government bills, notes and bonds 其他債務工具 17,931 29,410 34,423 43,594 62,260 Other debt instruments held
其他資產 105,564 120,676 151,367 158,307 157,586 Other assets
註釋:數字會根據認可機構的最新更改而作出每月修 Note: Figures are revised monthly to take account of any 訂。表內數字是在一九九九年五月底公布W統計 subsequent amendments submitted by authorised 數字� institutions. Figures in the table refer to statistics
released at end May 1999.
34 Statistical Digest of the Services Sector 1999

表2.7 所可機構的外幣資產負債表 Table 2.7 Foreign Currency Balance Sheet of Ail Authorized Institutions
百萬元 $ million
1989 1990 1991 1992 1993 負債 3,421,882 4,296,609 4,475,486 4,499,335 4,574,598 Liabilities
本港銀行同業借款 287,538 307,001 287,874 277,705 247,447 Amount due to authorized institutions in Hong Kong 本港以外銀行同業借款 2,346,088 3,037,184 3,194,089 3,176,176 3,229,117 Amount due to banks outside Hong Kong 客戶存款 620,017 778,889 810,636 877,742 939,534 Deposits from customers 可轉讓存款證 8,293 7,876 6,535 7,853 20,415 Negotiable certificates of deposit outstanding 其他負債 159,945 165,660 176,352 159,859 138,085 Other liabilities
資產 3’376,533 4,234,151 4,446,036 4,437,547 4,515,614 Assets
紙幣及硬幣⑴ - - 1,701 1,645 1,876 Notes and c o i n s � 本港銀行同業貸款 289,500 305,512 286,336 276,874 248,560 Amount due from authorized institutions in Hong Kong 本港以外銀行同業貸款 2,055,645 2,445,063 2,292,541 2,147,245 2,003,279 Amount due from banks outside Hong Kong 客戶貸款及墊款 746,660 1,181,591 1,519,920 1,657,473 1,899,528 Loans and advances to customers 可轉讓存款證 14,564 13,683 12,246 14,120 19,091 Negotiable certificates of deposit (NCD) held 其他可轉讓債務工具(除可轉讓存款證外) 163,906 177,425 247,500 258,508 265,753 Negotiable debt instrument held, other than NCDs
政府票據及債券 60,294 74,962 64,638 69,831 74,178 Government bills, notes and bonds 其他債務工具 103,613 102,462 182,863 188,677 191,575 Other debt instruments held
其他資產 106,259 110,878 85,792 81,682 77,526 Other assets
註釋:數字會根據認可機構的最新更改而作出每月修 Notes: Figures are revised monthly to take account of any 言了。表l ii;字是—九九九年五月底公布的統計 subsequent amendments submitted by authorised 數字 ° institutions. Figures in the table refer to statistics
released at end May 1999. (1)自一九九一年四月起’因申報表的項目重新 (1) Owing to re-classification of items in statistical
分類’外幣部分才開始提供� return from April 1991, foreign currency component is available since then.
服務業統計摘要一九九九年 35

表2.7 (繽) 所有認可機構的外幣資產負債表 Table 2.7 (Cont'd.) Foreign Currency Balance Sheet of All Authorized Institutions
百萬元 $ million
1994 1995 1996 1997 1998 負債 5,450,266 5,737,114 5,385,151 5,518,083* 4,409,592 Liabilities
本港銀行同業借款 275,724 299,818 281,435 251,031 207,838 Amount due to authorized institutions in Hong Kong 本港以外銀行同業借款 3,904,086 4,062,163 3,701,593 3,690,647* 2,571,870 Amount due to banks outside Hong Kong 客戶存款 1,033,175 1,104,420 1,096,682 1,169,190* 1,298,328 Deposits from customers 可轉讓存款證 36,066 40,121 48,526 47,744 45,863
Negotiable certificates of deposit outstanding 其他負憤 201,215 230,591 256,914 359,470* 285,692 Other liabilities
資產 5,347,404 5,778,978 5,403,496 5,462,798* 4,502,661 Assets
紙幣及硬幣⑴ 1,903 1,870 2,015 1,666 2,205 Notes and c o i n s � 本港銀行同業貸款 276,833 300,855 283,133 254,119 218,075 Amount due from authorized institutions in Hong Kong 本港以外銀行同業貸款 2,497,344 2,420,414 2,040,839 2,114,236 2,145,572 Amount due from banks outside Hong Kong 客戶貸款及塾款 2,145,173 2,501,228 2,467,045 2,379,189 1,609,341 Loans and advances to customers 可轉讓存款證 22,077 43,599 51,111 50,471 * 38,290
Negotiable certificates of deposit (NCD) held 其他可轉讓債務工具(除可轉讓存款證外) 308,861 383,144 416,570 447,830* 341,880 Negotiable debt instrument held, other than NCDs
政府票據及憤券 92,404 113,004 89,274 98,680 96,243 Government bills, notes and bonds 其他債務工具 216,456 270,141 327,296 349,150* 245,636 Other debt instruments held
其他資產 95,;212 127,868 142,783 215,288 147,299 Other assets
註釋:數字會根據認可機構的最新更改而作出每月修 Notes: Figures are revised monthly to take account of any 言丁。表內數字是在一九九九年五月底公布統計 subsequent amendments submitted by authorised 數字� institutions. Figures in the table refer to statistics
released at end May 1999. (1)自一九九一年四月起,因申報表的項目重新 (1) Owing to re-classification of items in statistical
分類’外幣部分才開始提供。 return from April 1991,foreign currency component is available since then.
36 Statistical Digest of the Services Sector 1999

表2.8 客戶存款
Table 2.8 Deposits from Customers 百萬元 $ million
1989 1990 1991 1992 1993 客戶存款 1,007,658 1,231,271 1,374,563 1,503,107 1,725,975 Customer deposits (19.2) (22.2) (11.6) (9.4) (14.8)
港元⑴ 450,762 520,115 604,162 684,055 858,241 Hong Kong d o l l a r � (15.5) (15.4) (16.2) (13.2) (25.5) 外幣⑵ 556,895 711,156 770,401 819,052 867,734 Foreign currency''' (22.4) (27.7) (8.3) (6.3) (5.9)
1994 1995 1996 1997 1998 客戶存款 1,945,572 2,226,238 2,458,256 2,664,467* 2,954,173 Customer deposits (12.7) (14.4) (10,4) (8.4) (10.9)
港元⑴ 1,016,203 1,171,627 1,400,077 1,537,608 1,685,134 Hong Kong d o l l a r � (18.4) (15.3) (19.5) (9.8) (9.6) 外幣 ® 929,369 1,054,612 1,058,180 1,126,858* 1,269,039 Foreign cu r r ency� (7.1) (13.5) (0.3) (6.5) (12.6)
註釋:括號內的數字是與上年比較的變動百分率� Notes : Figures in brackets are percentage changes over the preceding year.
g字會根據認可機構的最新更改而作出每月’ Figures are revised monthly to take account of any 言了。表內數字是在一九九九年五月底公布的統計 subsequent amendments submitted by authorised 數字 ° institutions. Figures in the table refer to statistics
released at end May 1999. (1)包括夕•(•幣掉期存款 ° (1) Adjusted to include foreign currency swap
deposits. (2) 不包括外幣掉期存款� (2) Adjusted to exclude foreign currency swap
deposits.
服務業統計摘要一九九九年 3 7

表2.9 貸款及墊款
Table 2.9 Loans and Advances 百萬元(另有註明除外)
$ million, unless otherwise specified 1989 1990 1991 1992 1993
最優惠利率⑴(年率) 1 0 . 5 4 1 0 . 4 6 9 . 4 1 7 . 3 2 6 . 5 0 Best lending rate。)(% per annum)
貸款及墊款總額 1,271,899 1,788,609 2,243,752 2,469,561 2,856,851 Loans & advances to all customers (32.2) (40.6) (25.4) (10.1) (15.7)
供 在 港 使 用 5 8 4 , 5 9 4 689,368 817,077 909,912 1,075,777 Foi.useinHongKong(2>,(3> (28.1) (17.9) (18.5) (11.4) (18.2)
製造業 46,268 49,315 54,532 63,731 73,720 Manufacturing (18.6) (6.6) (10.6) (16.9) (15.7) 運輸業 37,173 41,232 51,260 58,076 62,701 Transport (59.0) (10.9) (24.3) (13.3) (8.0) 建造業及物業發展 96,299 108,112 125,704 144,533 180,439 Building, construction and property (63.6) (12.3) (16.3) (15.0) (24.8) development 批發及零售業 62,663 74,641 80,627 88,152 99,405 Wholesale and retail trade (4.9) (19.1) (8.0) (9.3) (12.8) 酒店、旅舍及飮食業 13,628 14,280 15,231 17,041 15,853 Hotels, boarding house and catering (75.5) (4.8) (6.7) (11.9) (-7.0) 與財務及金融有關公司(認可機構除外) 85,157 104,730 113,798 122,833 156,748 Financing (other than authorized (60.6) (23.0) (8.7) (7.9) (27.6) institutions) 個別人士購買住宅樓宇 110,099 145,830 199,190 224,258 268,031 Professional and private individuals for (28.0) (32.5) (36.6) (12.6) (19.5) purchase of residential properties 個別人士其他用途 55,105 60,896 73,353 88,346 103,311 Professional and private individuals for (14.7) (10.5) (20.5) (20.4) (16.9) other purposes 其他 78,202 90,332 103,382 102,942 115,569 Others (-3.0) (15.5) (14.4) (-0.4) (12.3)
註釋:括號內的數字是與上年比較的變動百分率° Notes : Figures in brackets are percentage changes over the preceding year.
¥字會根據認可機構的最新更改而作出每月修 Figures are revised monthly to take account of any 言丁 °表內數字是在一九九九年五月底公布的統計 subsequent amendments submitted by authorised 數字� institutions. Figures in the table refer to statistics
released at end May 1999. (1) 是指香港 j海匯豐銀行的最優惠利率的期 (1) Best lending rate refers to the average of the rates
內平均數字� over the period quoted by the Hong Kong and Shanghai Banking Corporation Limited.
(2) 隨著新貸款、墊款及撇賬申報表於一九九四 (2) With the introduction of the new Return on Loans 年十二月推出’若干認可機構已把某些貸款 and Advances and Provisions as from December 重&分類°因此九四年以後的數字並不可跟 1994, a number of authorized institutions have 以前年度的數字作嚴格比較。上列的變動百 reclassified certain components. As a result, 分率已就重新分類作出調整 ° figures from 1994 onwards are not strictly
comparable with those of previous years. Percentage changes shown have been adjusted for
— re-classification effect. (3)不包括貿易融資貸款。 (3) Excluding loans and advances for trade financing.
38 Statistical Digest of the Services Sector 1999

表2.9 (繽) 貸款及墊款 Table 2.9 (Cont'd.) Loans and Advances
百萬元(另有註明除外) $ million, unless otherwise specified 1994 1995 1996 1997 1998
最優惠利率(')(年率) 7.26 8.95 8.52 8.83 9.94 Best lending rate�(% per annum)
貸款及墊款總額 3,264,549 3,738,558 3,914,890 4,121,670 3,304,380 Loans & advances to all customers (14.3) (14.5) (4.7) (5.3) (-19.8)
供在港使用⑵’⑶ 1,258,589 1,398,193 1,637,191 2,037,278 1,957,775 For use in Hong Kong'^' ' ' (17.0) (11.1) (17.1) (24.4) (-3.9)
製造業 85,845 100,137 107,530 110,675 94,776 Manufacturing (16.4) (16.7) (7.6) (3.5) (-14.8) 運輸業 71,813 68,992 82,860 96,208* 105,737 Transport (14.5) (-3.7) (20.1) (17.1) (6.2) 建造業及物業發展 249,112 262,199 333,032 440,296 419,116 Building, construction and property (38.1) (4.4) (26.0) (31.1) (-4.7) development 批發及零售業 137,472 166,281 176,497 205,679* 178,138 Wholesale and retail trade (38.3) (21.0) (6.2) (15.2) (-13.8) 酒店、旅舍及飮食業 19,616 20,812 26,958 36,879 40,360 Hotels, boarding house and catering (23.7) (4.1) (29.5) (36.7) (9.0) 與財務及金融有關公司(認可機構除外) 160,830 176,341 207,456 259,664 231,655 Financing (other than authorized (2.6) (14.4) (14.8) (24.6) (-14.7) institutions) 個別人士購買住宅樓宇 298,496 349,209 421,890 540,800 589,658 Professional and private individuals for (11.4) (16.9) (20.4) (28.7) (9.8) purchase of residential properties 個別人士其他用途 106,149 111,891 126,839 153,900* 143,462 Professional and private individuals for (2.7) (3.6) (14.5) (23.6) (-6.5) other purposes 其他 129,256 142,331 154,129 193,177 154,874 Others (11.8) (13.5) (11.8) (26.2) (-11.8)
註釋:括號內的數字是與上年比較的變動百分率” Notes : Figures in brackets are percentage changes over the preceding year.
P字會根據認可機構的最新更改而作出每月修 Figures are revised monthly to take account of any 言丁。表 l^ii!字是在一九九九年五月底公布統計 subsequent amendments submitted by authorised 汝字� institutions. Figures in the table refer to statistics
released at end May 1999. (1) 是指香港上海匯豐銀行的最優惠利率的期 (1) Best lending rate refers to the average of the rates
內平均數字“ over the period quoted by the Hong Kong and Shanghai Banking Corporation Limited.
(2) 隨著新貸款、墊款及撇脹申報表於一九九四 (2) With the introduction of the new Return on Loans 年十二月推出’若干認可機構已把某些貸款 and Advances and Provisions as from December 重新分類。因此九四^^以後的數字並不可跟 1994,a number of authorized institutions have 以前年度的數字作嚴格比較。上列的變動百 reclassified certain components. As a result, 分秦已就重新分類作出調整� figures from 1994 onwards are not strictly
comparable with those of previous years. Percentage changes shown have been adjusted for re-classification effect.
( 3 )不包括貿易融資貸款 ° (3) Excluding loans and advances for trade financing.
服務業統計摘要一九九九年 39

圖 2 . 4 存款及貸款
Chart 2.4 Deposits and Loans
存款/貸款(百萬元) 貸存比率(%) . . . . . . Loans / deposits ($ million) Loan-to-deposit ratio (%)
A C AAA 丨 |_ _ „.*„.,.•••. 一」一 - - • . -- - •••••• °-"••—"-•-"-'--"——' -.. - -"••—— '•"—I,",,'•• ‘ •"“ ••”•• iOLZ 4,000,000 ^ ^ ^ ^ ~ - - M 160 3 ’ _ � � — • 骨 … 責 … i V f �
戰 賺 1 i l l ::_ ’_—"�
1989 1990 1991 1992 1993 1994 1995 1996 1997 1998 • • i客戶存款 客戶貸款及墊款 貸存比率
Customer deposits Loans and advances to customers Loan-to-deposit ratio
40 Statistical Digest of the Services Sector 1999
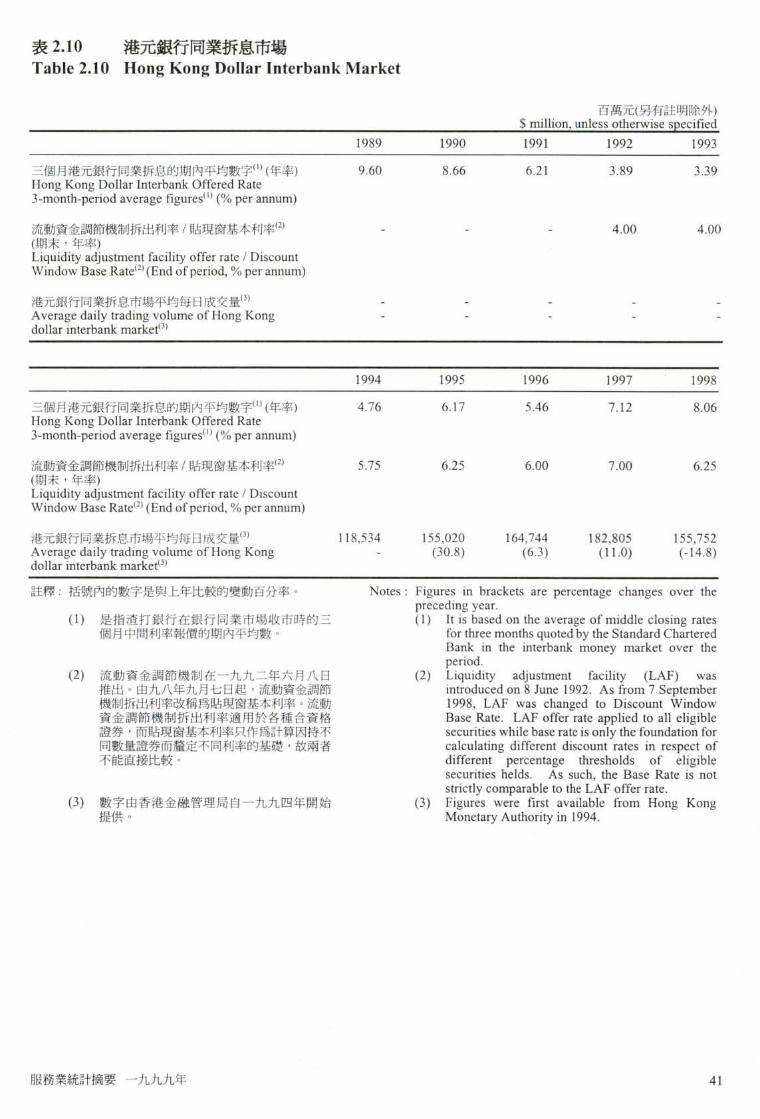
表2.10 港元銀行同業拆息市場 Table 2.10 Hong Kong Dollar Interbank Market
百萬元(另有註明除外) $ million, unless otherwise specified
1989 1990 1991 1992 1993 三個月港元銀行同業拆息的期內平均數字⑴丨年率) 9 . 6 0 8 . 6 6 6 . 2 1 3 . 8 9 3 . 3 9 Hong Kong Dollar Interbank Offered Rate 3-month-period average figures''' (% per annum)
流 動 資 金 調 節 機 制 拆 出 利 率 / 貼 現 窗 基 本 利 率 - - - 4 . 0 0 4 . 0 0 (期末’年率) Liquidity adjustment facility offer rate / Discount Window Base Rate® (End of period, % per annum) 港 元 銀 行 同 業 拆 息 市 場 平 均 每 日 成 交 量 - - - - -Average daily trading volume of Hong Kong -dollar interbank market'''
1994 1995 1996 1997 1998 三個月港元銀行同業拆息的期內平均數字⑴(年率) 4 . 7 6 6 . 1 7 5 . 4 6 7 . 1 2 8 . 0 6 Hong Kong Dollar Interbank Offered Rate 3-month-period average figures'" (% per annum)
流 動 資 金 調 節 機 制 拆 出 利 率 / 貼 現 窗 基 本 利 率 5 . 7 5 6 . 2 5 6 . 0 0 7 . 0 0 6 . 2 5 (期末’年率) Liquidity adjustment facility offer rate / Discount Window Base R a t e � ( E n d of period, % per annum) 港元銀行同業拆息市場平均每日成交量 1 1 8 , 5 3 4 155,020 164,744 182,805 155,752 Average daily trading volume of Hong Kong - (30.8) (6.3) (11.0) (-14.8) dollar interbank market*^' 註釋:括號內的數字是與上年比較的變動百分率° Notes : Figures in brackets are percentage changes over the
preceding year. (1) 是指澄打銀行在銀行同業市場收市時的三 (1) It is based on the average of middle closing rates
個月中間利率報價的期內平均數 ° for three months quoted by the Standard Chartered Bank in the interbank money market over the period.
(2) 流動資金調節機制在一九九二年六月八曰 (2) Liquidity adjustment facility (LAF) was 推出°由九八年九月七日起’流動資金調節 introduced on 8 June 1992. As from 7 September 機制拆出利率改稱爲貼現窗基本利率。流動 1998,LAF was changed to Discount Window 資金調節機制拆出利率適用於各種合資格 Base Rate. LAF offer rate applied to all eligible 證券’而貼現窗基本利率只作爲計算因持不 securities while base rate is only the foundation for 同數量證券而釐定不同利率的基礎’故兩者 calculating different discount rates in respect of 不能直接比較 ° different percentage thresholds of eligible
securities helds. As such, the Base Rate is not strictly comparable to the LAF offer rate.
(3) 數字由香港金融管理局自一九九四年開始 (3) Figures were first available from Hong Kong 提供 ° Monetary Authority in 1994.
服務業統計摘要一九九九年 4 1
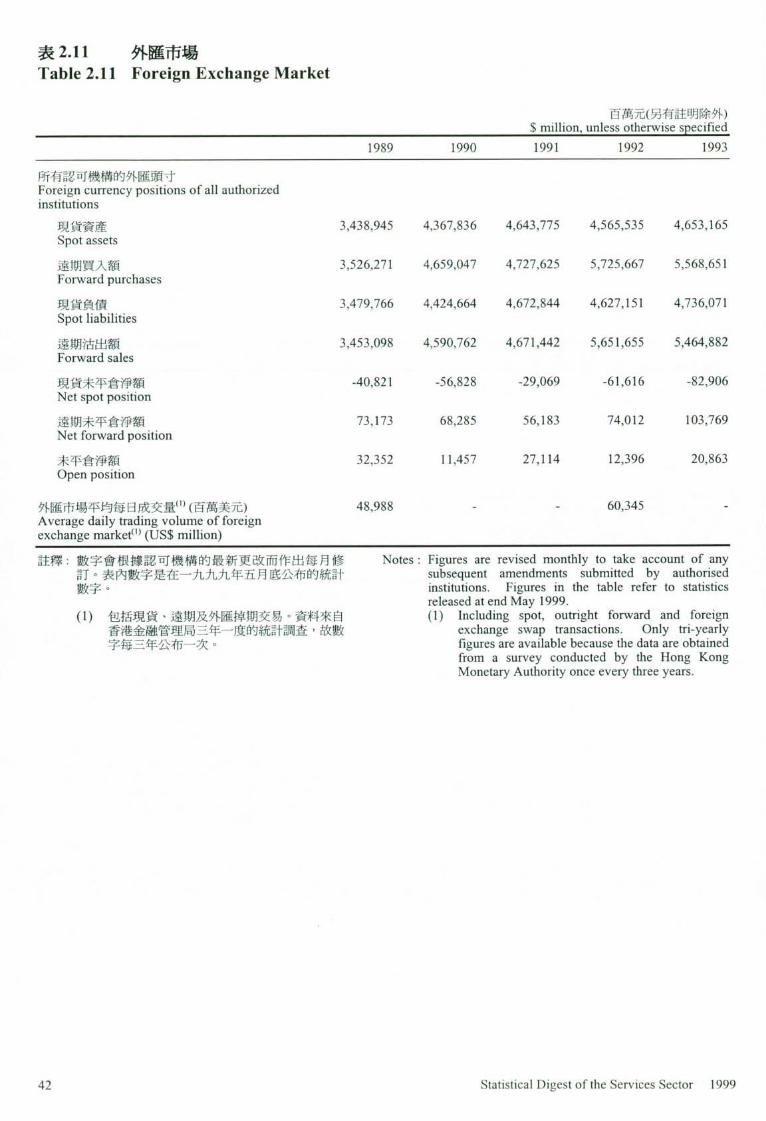
表2.11 外匯市場
Table 2.11 Foreign Exchange Market 百萬元(另有註明除外)
$ million, unless otherwise specified 1989 1990 1991 1992 1993
所有認可機構的外匯頭寸 Foreign currency positions of all authorized institutions
現貨資產 3,438,945 4,367,836 4,643,775 4,565,535 4,653,165
Spot assets 遠期買入額 3,526,271 4,659,047 4,727,625 5,725,667 5,568,651
Forward purchases 現貨負債 3,479,766 4,424,664 4,672,844 4,627,151 4,736,071
Spot liabilities 遠期沽出額 3,453,098 4,590,762 4,671,442 5,651,655 5,464,882
Forward sales 現貨未平倉淨額 -40,821 -56,828 -29,069 -61,616 -82,906 Net spot position 遠期未平倉淨額 73,173 68,285 56,183 74,012 103,769 Net forward position 未平倉淨額 32,352 11,457 27,114 12,396 20,863 Open position
外匯市場平均每日成交量⑴(百萬美元) 48,988 - - 60,345 -Average daily trading volume of foreign exchange m a r k e t � ( U S $ million) 註釋:熬字會根據認可機構的最新更改而作出每月修 Notes: Figures are revised monthly to take account of any
訂°表 1^^^字是^£一九九九年五月底公布的統計 subsequent amendments submitted by authorised ^字� institutions. Figures in the table refer to statistics
released at end May 1999. (1) 包括現貨、遠期及外匯掉期交易。資料來自 (1) Including spot, outright forward and foreign
香港金融管理局三年一度的統計調查,故數 exchange swap transactions. Only tri-yearly 字每三牵公布一次 ° figures are available because the data are obtained
from a survey conducted by the Hong Kong Monetary Authority once every three years.
42 Statistical Digest of the Services Sector 1999

表2.11 (續) 外匯市場
Table 2.11 (Cont'd.) Foreign Exchange Market 百禹元(另有註明除外)
$ million,unless otherwise specified 1994 1995 1996 1997 1998
所有認可機構的外匯頭寸 Foreign currency positions of all authorized institutions
現貨資產 5,526,334 5,972,113 5 ,692,092 5,730,666* 4,764,022 Spot assets 遠期買入額 7,266,754 7,986,637 9,310,630 9,558,005 6,796,570 Forward purchases 現貨負債 5,624,273 5,957,342 5,704,539 5,818,935 4,715,752 Spot liabilities 遠期沽出額 7,137,973 7,956,662 9,246,397 9,465,032 6,824,555 Forward sales 現貨未平倉淨額 -97,939 14,771 -12,447 -88,269* 48,270 Net spot position 遠期未平倉淨額 128,781 29,975 64,233 92,973 -27,985 Net forward position 未平倉淨額 30,842 44,746 51,786 4,704* 20,285 Open position
外匯市場平均每日成交量⑴(百萬美元) - 90,198 - - 78,555 Average daily trading volume of foreign exchange m a r k e t � ( U S S million) 註釋:數字會根據認可機構的最新更改而作出每月修 Notes: Figures are revised monthly to take account of any
言了。表!^^^字是在一九九九年五月底公布0^統計 subsequent amendments submitted by authorised ‘字 � institutions. Figures in the table refer to statistics
released at end May 1999. (1) 包括現貨、遠期及外匯掉期交易。寶料來自 � Including spot, outright forward and foreign
香港奉融管理局三年一度的統計調查’故數 exchange swap transactions. Only tri-yearly 字每三年公布一次 ° figures are available because the data are obtained
from a survey conducted by the Hong Kong Monetary Authority once every three years.
服務業統計摘要一九九九年 4 3

表2.12 銀行業的選定最新統計數字
Table 2.12 Selected Up-to-date Statistics on Banking Services 百萬元(另有註明除外)
$ million, unless otherwise specified 1998 1999
第一季 第二季 第三季 第四季 第一季 ^ Q2 Q3 Q4 ^
機構單位數目 1 9 7 2 2 0 0 7 1 9 3 9 1 9 2 9 1 9 0 3 Number of establishments 就業人數 8 1 0 6 3 8 0 5 7 2 7 9 0 5 3 8 0 5 0 4 7 8 0 0 2 Number of persons engaged
業務收益指數(1996=100) 95 .9 98 .7 94.5 101.0 96 .7 Business receipts index (1996=100)
外幣儲備(百萬美元) 96,820 96,503 88,394 89,625* 89,526 Amount of foreign currency reserves (US$ million)
貨幣供應定義一 201,921 188,212 188,737 197,666* 200,163 Money supply definition 1 (Ml ) 貨幣供應定義二 2,808,546 2,816,983 2,990,553 3,066,089* 3,075,139 Money supply definition 2 (M2)
貨幣供應定義三 2,878,831 2,878,043 3,050,095 3,122,345* 3,125,630 Money supply definition 3 (M3)
港元銀行同業拆息市場平均每日成交量 154,619 159,379 154,718 154,294 167,941 Average daily trading volume of Hong Kong dollar interbank market 客戶存款 2,713,940 2,709,438 2,875,793 2,954,173* 2,952,740 Customer deposits
港元 1,557,098 1,556,929 1,641,444 1,685,134* 1,683,499 Hong Kong dollar 外幣 1,156,842 1,152,509 1,234,349 1,269,039* 1,269,240 Foreign currency
44 Statistical Digest of the Services Sector 1999

資料來源 Data Sources 表 資料來源 Table Sources 2.1 香港金融管理局 2.1 Hong Kong Monetary Authority 2.2 政府統計處 2.2 Census and Statistics Department 2.3-2.11 香港金融管理局 2.3-2.11 Hong Kong Monetary Authority
其他有關刊物 Further References 年幸艮’香港金融管理局編製 Annual Report, published by the Hong Kong Monetary
Authority 就業及空缺統旨f(詳細統計表) Employment and Vacancies Statistics (Detailed Tables) 本地生產總値估計 Estimates of Gross Domestic Product 香港統計年干!J Hong Kong Annual Digest of Statistics 香港統計月干U Hong Kong Monthly Digest of Statistics 金融數據月報,香港金融管理局編製 Monthly Statistical Bulletin, published by the Hong
Kong Monetary Authority 季幸艮‘香港金融管理局編製 Quarteffy Bulletin, published by the Hong Kong
Monetary Authority 服務行業按季業務收益指數 Quarterly Business Receipts Indices for Service
Industries 就業、空缺及薪金總額按季統計報告 Quarterly Report of Employment, Vacancies and
Payroll Statistics 本地生產總値估言十按季報告 Quarterly Report of Gross Domestic Product Estimates 倉庫’通訊、財務’保險及商用服務按年統計 Report on Annual Survey of Storage, Communication, 調查報告 Financing, Insurance & Business Services
服務業統計摘要一九九九年 45

3 電影業
Film Entertainment Services 槪要 Highlights 香港是重要的電影製作中心 ° Hong Kong is a major film producing centre.
一九九八年’從事電影業的機構單位約有 In 1998,there were some 1 000 establishments, 1 000 間’僱用約 5 100 名員工 ° 上述機構包 employing 5 100 people, in the film entertainment 括影片處理服務公司、電影製片廠、電影製 industry. These included motion picture film 作公司、電影院及從事電影發行及影片出租 processing companies, film studios, motion picture 月艮務的機構單位� companies, cinemas, movie theatres and
establishments engaged in distribution and hiring of motion picture films.
一九九七年,電影業爲香港帶來約 1 3億元生 During 1997, the film entertainment industry 產 淨 値 或 增 加 價 値 ’ 佔 本 地 生 產 總 値 的 generated a net output or value added of about $1.3 0 .1% ° billion, or 0.1% of Hong Kong's Gross Domestic
Product (GDP).
一九九八年,共有 466 套電影在約 90 間電影 A total of 466 films were released commercially in 院上映’所得的門票收益約共 1 1億元’較九 1998 in about 90 cinemas. They generated a total of 七年減少 6% ’ 較八九年減少 1 3 % � about $1.1 billion in cinema receipts, 6% less than
1997 and 13% less than 1989.
除票房收入外’在一九九八年,透過有關影 Apart from box office takings, another $289 million of 帶 / 雷射影碟 / 電視 / 酒店 / 戲院的授權事 royalty receipts were derived from the local market in 宜’電影業在本地市場賺取了 2 .89 億元版權 1998 by granting video/laser/TV/hotel/theatrical 費收益。本地製作的電影在海外市場亦賺取 rights. Some $252 million were also earned from 約 2 .52 億元。連同票房收入’總收益合共爲 overseas markets for locally produced films. Together 16 億元。 with box office takings, they brought in receipts
totalling $1.6 billion.
部分由於消費者觀看電影的方式有所轉變 Partly affected by consumers shifting the modes of (如影帶和影碟)’電影業的總收益自一九九 film watching to videotapes and videodiscs, total 三年起已有下降趨勢 °九八年的總收益較九 receipts of the film entertainment industry had been on 七年下降 1 1 % ’ 較九二年高峰期下降達 65% a declining trend since 1993. Total receipts in 1998 之多� dropped by 11% compared with 1997 and as much as
65% compared with the peak in 1992.
一九九八年’影帶、雷射影碟及其他光碟的 In 1998, about $234 million worth of local videotapes, 港產品出口總値約爲 2 .34 億元’而入口總値 laser discs and other compact discs were exported, and 則爲 3 .53 億元。九八年的出口貨値較九七年 $353 million were imported. The value exported in 增加了 237% ;而九八年的入口貨値則較九 1998 was 237% more than that in 1997; while the 七年下降了 4 4 % � value imported in 1998 decreased by 44% compared
with 1997. 服務業統計摘要一九九九年 47

主要統計數字 Key Statistics
百萬元(另有註明除外) $ million,unless otherwise specified
電影業 Film Entertainment Industry 年 機 構 單 位 數 目 就 業 人 數 ( 1 ) 增加價値 業務收益指數
Year Number of Number of persons Value added Business receipts establishments � engaged � index'^'
(1996=100) 1989 [1 429] [8 243] 1,337** -1990 [1 612] [9 063] 961** -1991 1 023 7 025 1,217** -1992 1 057 6 428 1,351** -1993 1 155 7 090 1,380** -1994 1 301 5851 1,929** -1995 1 301 6 062 1,371** -1996 1 168 6 406 1,458** 100.0 1997 1 141 5 491 1,320** 107.3 1998 991 5 129 N.A. 100.6
註釋:(1) 一九九一年及以後的數字是該年內四季的 Notes: (1) Figures for 1991 and onwards are averages of the 估計數字的平均叙’而九一年以前白&數字是 four quarterly estimates of the year, whereas those 指該年三月 I g e ^ t f i a » prior to 1991 refer to the position as at end March
of the corresponding year. ( 2 )業務收益指數於一九九二統計年度開始編 (2) Business receipts indices were first available in the
製’但此詳細分類的指數則於九六年開始編 reference year 1992,but indices at such detailed 製� breakdown were first compiled in 1996.
[]一九九一年前的數字的涵蓋範圍與其後的 [ ] F i g u r e s prior to 1991 are slightly different in 略有不同’—此禾將兩組數字作嚴格比 coverage and therefore are not strictly comparable 較� with those for 1991 and onwards.
** 數字是根據有限數據而作出的粗略估計’在 ** These are crude estimates which are compiled 曰後得到更多資時可能會作相當大的烤 based on limited data. They may be subject to 言丁 ’因此在運用這滅字時’凑d�心留意這 considerable revisions when more data become i j ^ � available. Special care should be taken when
interpreting them.
48 Statistical Digest of the Services Sector 1999

主要統計數字(糖) Key Statistics (Cont'd.)
百萬元(另有註明除外) $ million, unless otherwise specified
年 票房收入 本地及外國電影在本地市場的收益本地電影在海外市塌的收益
Year Box office takings Revenue from local market for both Revenue from overseas market local and foreign films。) for local f i l m s �
1989 1,255 809 1,213 1990 1,404 936 1,404 1991 1,288 994 1,491 1992 1,552 1,240 1,860 1993 1,539 1,133 1,699 1994 1,384 957 1,435 1995 1,339 776 1,164 1996 1,222 467 435 1997 1,156 353 329 1998 1,088 289 252
註釋:(3 )包括來自影帶 / 雷射影碟 / 電視 / 酒店 / 戲院 Note: (3) Including royalties from video / laser / TV / hotel / 的版li費。 theatrical rights.
服務業統 i t摘要一九九九年 55

槪念及方法 Concepts and Methods 所有公開上映的電影,必須送交影視及娱樂事務 All films released to public must be submitted to the 管理處檢查。除電影預告、教育影片和文化影片 Television and Entertainment Licensing Authority for 外’所有擬在香港公開上映的電影會按電影三級 censorship. Except for film trailers, instructional 制分'級“ f i lms and cultural films, all f i lms intended for public
exhibition are classified according to the three-tier fi lm classification system in Hong Kong.
在所有經評級的電影中,作商業上映的電影祇佔 Commercially released fi lms only constitute a small 一小部分,而有關統計資料是從香港影業協會搜 proportion of all the classified f i lms and relevant 集得來’所以上映電影的數目和經評級的電影數 statistics are obtained f rom the Hong Kong, Kowloon 目有很大差別;而一套電影以不同版本多次送 & New Territories Motion Picture Industry 檢’亦是造成這差另!J白勺一f固原因� Association Limited. Thus, there are large differences
between the number of fi lms released and films classified. Multiple submissions on different versions of a single film also contribute to the differences.
§司業釋義 Definition of terms
在編製統計數字時,電影業包括影片處理服務 For statistical compilation purpose, the film 公司、電景》製片廠、電影製作公司、電影院及從 entertainment industry covers mot ion picture film 事電影發行及影片出租服務的機構單位 ° processing companies, fi lm studios, mot ion picture
companies, cinemas, movie theatres and establishments engaged in distribution and hiring of motion picture films.
潘溝罩位是宇旨在單一擁有權或控制權(艮口單一公 An establishment is defined as an economic unit (i.e. a 司名義)下’在單一地黑占從事一種或主要從事一 unit engaged in the production of goods or services) 種經濟活動(即生產貨物或提供服務)的經濟單 which engages, under a single ownership or control 位� (i.e. under a single company name), in one or
predominantly one kind of economic activity at a single physical location.
本地生產總値是指一個國家或地區的所有常住 Gross Domestic Product (GDP) is a measure of the 生產單位,在一個指定的期間內,未扣除固定資 total value of production of all resident producing 本消耗白勺生產總fit ° units of a country or territory in a specified period,
before deducting allowance for consumption of fixed capital.
生產總額主要包括機構單位提供服務所收取的 Gross output comprises mainly receipts f rom services 費用、佣金和其他服務費、轉售物品的毛利和租 rendered in the form of fees, commissions and other 金I|文入 ° service charges, margin on resale of goods and rentals
received.
5 8 Statistical Digest of the Services Sector 1999

就業人數包括積極參與機構單位工作的在職東 Persons engaged in an establishment include working 主及股東;在統計日期受僱於機構單位的全職僱 proprietors and partners actively engaged in the work 員’包括長期或臨時聘用的’無論這些僱員正在 o f t h e establishment; full-time employees paid by the 開工或因事假或者病假而暫時缺勤;及在統計日 establishment on the survey reference date, both 期工作三小時或以上的兼職僱員和無酬家屬幫 permanent and temporary, who are either at work or 工 ° on vacation or sick leave; and part-time employees
and unpaid family workers working three hours or more on the survey reference date.
•是生產總額減去中間投產消耗(生產過 Value added is defined as the value of gross output 程中所耗用的貨物和服務的價値)� less the value of intermediate consumption (the value
of goods and services used up in the course of production).
服務業統it摘要一九九九年 55

統計圖表 Statistical Tables and Charts 表 3 . 1 電 影 業 的 機 構 單 位 數 目 、 就 業 人 數 、 業 務 收 益 指 數 、 生 產 總 額 及 增 加 價 値
Table 3.1 Number of Establishments and Persons Engaged, Business Receipts Index, Gross Output and Value Added of the Film Entertainment Industry
百萬元(另有註明除外) $ million, unless otherwise specified
1989 1990 1991 1992 1993 機構單位數目⑴ [ 1 4 2 9 ] [1 6 1 2 ] 1 0 2 3 1 0 5 7 1 1 5 5 Number of establishments'" (34.9) (12.8) (-36.5) (3.3) (9.3)
就 業 人 數 [ 8 2 4 3 ] [ 9 0 6 3 ] 7 0 2 5 6 4 2 8 7 0 9 0 Number of persons e n g a g e d � (12.3) (9.9) (-22.5) (-8.5) (10.3)
業務收益指數 1 9 % = 1 0 0 ) - - - - -Business receipts index(2) (1996=100) -
生產總額 3,721** 3,458** 3,898** 4,487** 5,301** Gross output (-4.5) (-7.1) (12.7) (15.1) (18.1)
增加價値 1,337** 961** 1,217** 1,351** 1,380** Value added (-12.4) (-28.1) (26.6) (11.0) (2.1)
在以要素成本計算的本地生產總値內所佔比率(%) 0.3** 0.2** 0.2** 0.2** 0.2** Contribution to GDP at factor cost (%) 增加價値在生產總額所佔比率 35.9** 27.8** 31.2** 30.1** 26.0** Value added as % of gross output
註釋:括號內的數字是與上年比較的變動百分率� Notes : Figures in brackets are percentage changes over the preceding year.
(1) 一九九一年及以後的數字是該年內四季的 (1) Figures for 1991 and onwards are averages of the 估計數f的平均數’而九一年以前的數字是 four quarterly estimates of the year, whereas those 指該年三月底的情況� prior to 1991 refer to the position as at end March
of the corresponding year. ( 2 )業務收益指數於一九九二統計年度開始編 (2) Business receipts indices were first available in the
製‘但此詳細分類的指數則於九六年開始編 reference year 1992, but indices at such detailed 製� breakdown were first compiled in 1996.
[]一九九一年前的數字的涵蓋範圍與其後的 [ ] F i g u r e s prior to 1991 are slightly different in 略有不同‘因此不可將兩組數字作嚴格比 coverage and therefore are not strictly comparable 較� with those for 1991 and onwards.
** 數字是根據有限數據而作出的粗略估計’在 ** These are crude estimates which are compiled =日後得到更多資想時2能會作相當大的 f l ^ based on limited data. They may be subject to 言丁 ’因此在運用這數字時’應 / J�心留意這 considerable revisions when more data become 點 ° available. Special care should be taken when
interpreting them.
5 8 Statistical Digest of the Services Sector 1999

表 3 . 1 (續) 電 影 業 的 機 構 單 位 數 目 、 就 業 人 數 、 業 務 收 益 指 數 、 生 產 總 額 及
增 加 價 値
Table 3.1 (Cont'd.) Number of Establishments and Persons Engaged, Business Receipts Index, Gross Output and Value Added of the Film Entertainment Industry
百萬元(另有註明除外) $ million, unless otherwise specified
1994 1995 1996 1997 1998 機構單位數目⑴ 1 3 0 1 1 3 0 1 1 1 6 8 1 1 4 1 9 9 1 Number of establishments'" (12.6) (0.0) (-10.2) (-2.3) (-13.1) 就業人數⑴ 5 8 5 1 6 0 6 2 6 4 0 6 5 4 9 1 5 1 2 9 Number of persons engaged'" (-17.5) (3.6) (5.7) (-14.3) (-6.6)
業務收益指數⑵(1996=100) - - 100 .0 107 .3 100 .6 Business receipts index'" (1996=100) - - - (7.3) (-6.2) 生產總額 6,235** 4,853** 4,921** 4,815** N.A. Gross output (17.6) (-22.2) (1.4) (-2.2) N.A.
增加價値 1,929** 1,371** 1,458** 1,320** N.A. Value added (39.8) (-28.9) (6.3) (-9.5) N.A.
在以要素成本計算的本地生產總値內所佔比率(%) 0.2** 0.1=^* 0.1** 0.1** N.A. Contribution to GDP at factor cost (%) 增加價値在生產總額所佔比率 30.9** 28.3** 29.6** 27.4** N.A. Value added as % of gross output
註釋:括號內的數字是與上年比較的變動百分率° Notes : Figures in brackets are percentage changes over the preceding year.
(1) 一九九一年及以後的數字是該年內四季的 (1) Figures for 1991 and onwards are averages of the 估計數字的平均威’而九一年以前的數字是 four quarterly estimates of the year, whereas those +旨該年三月的情況� prior to 1991 refer to the position as at end March
of the corresponding year. (2) 業務收益指數於一九九二統計年度開始編 � Business receipts indices were first available m the
製,但此詳細分類的指數則於九六年開始編 reference year 1992,but indices at such detailed 製� breakdown were first compiled in 1996.
** 數字是根據有限數據而作出的粗略估計’在 ** These are crude estimates which are compiled 日 後 得 到 更 多 資 ; ^ 時 可 能 會 作 相 當 大 的 b a s e d on limited data. They may be subject to 17 , g i此在運用這威字時 ’ ^ /_|、'[>留意這 considerable revisions when more data become f ^ � available. Special care should be taken when
interpreting them.
服務業統 i t摘要一九九九年 55

圖 3 . 1 電影業的機構單位數卧”;SLgfc業人數<” Chart 3.1 Number of Establishments'" and Persons E n g a g e d i n the Film Entertainment
Industry
機構單位數目 就業人數 Number of establishments Number of persons engaged
1 600 8 000
1 200 — 6 000 : JzLtUJj l r 1991 1992 1993 1994 1995 1996 1997 1998
^ ^ 機構單位數目 就業人數 Number of establishments Number of persons engaged
註釋:(1) 數字是該年內四季的估ft數字的平均數。 Note: (1) Figures are averages of the four quarterly estimates of the year.
5 8 Statistical Digest of the Services Sector 1999

表 3 . 2 上 映 電 影 數 目 、 票 房 收 入 及 本 地 及 海 外 市 場 的 電 影 收 益
Table 3.2 Number of Films Released, Box Office Takings and Revenue from Local and Overseas Markets
百萬元(另有註明除外) $ million, unless otherwise specified
1989 1990 1991 1992 1993 於戲院上映的電影數目 4 6 9 4 9 6 4 5 0 4 0 9 4 8 3 Number of films released (theatrical) - (5.8) (-9.3) (-9.1) (18.1)
票房收入 1 , 2 5 5 1 , 4 0 4 1 , 2 8 8 1 , 5 5 2 1 , 5 3 9 Box office takings - (11.9) (-8.3) (20.5) (-0.8)
本地市場收益(1)(包括本地及外國電影) 8 0 9 9 3 6 9 9 4 1 , 2 4 0 1 , 1 3 3 Revenue from local m a r k e t � ( f o r both local and - (15.7) (6.2) (24.7) (-8.6) foreign films) 海外市場收益⑴(只包括本地電影) 1,213 1 , 4 0 4 1 , 4 9 1 1 , 8 6 0 1 , 6 9 9 Revenue from overseas market'" (for local films - (15.7) (6.2) (24.7) (-8.7) only)
1994 1995 1996 1997 1998 於戲院上映的電影數目 4 9 2 4 7 1 4 1 4 4 6 7 4 6 6 Number of films released (theatrical) (1.9) (-4.3) (-12.1) (12.8) (-0.2)
票房收入 1,384 1,339 1.222 1,156 1,088 Box office takings (-10.1) (-3.3) (-8.7) (-5.4) (-5.9)
本地市場收益(包括本地及外國電影) 9 5 7 7 7 6 4 6 7 3 5 3 2 8 9 Revenue from local market"' (for both local and (-15.5) (-18.9) (-39.8) (-24.4) (-18.1) foreign films) 海外市場收益(只包括本地電影) 1 , 4 3 5 1 , 1 6 4 4 3 5 3 2 9 2 5 2 Revenue from overseas m a r k e t � ( f o r local films (-15.5) (-18.9) (-62.6) (-24.4) (-23.4) only) 註釋:括號內的數字是與上年比較的變動百分率° Notes : Figures in brackets are percentage changes over the
preceding year. ( 1 ) 包括來自影帶 / 雷射影碟 / 電視 / 酒店 / 戲院 (1) Including royalties from video / laser / TV / hotel /
的版權費� theatrical rights.
服務業統 i t摘要一九九九年 5 5

圖 3 . 2 電影收益
Chart 3.2 Films Revenue
百萬元 $ million
2 - u L...I.J. .1..... . . — . . . . . — . . . . — - ��•——--- • - •• .. • - •• —'• •“—- ‘― - ‘ •••••• •;:
1,600 ~ _ n :
闕!“!^“!门議讓 隨 门 网 1,200 - 爾 - 1 ~ :::::: - ::% 一 - 裕 豕 — 総 . 1 M —酵——r-i 漏 開 I _ _ _, _ … 1-1-:JijiM
1989 1990 1991 1992 1993 1994 1995 1996 1997 1998 Q 票房收入 本地市場收益(包括本地及外國電影)口海外市場收益(只包括本地電影)
Box office takings Revenue from local market (for Revenue from overseas market both local & foreign films) (for local films only) 註釋:本地及海外市場的收益包括來自影帶/雷射影碟 / Note: Revenue from local and overseas markets include
i 視 / 酒店 / 戲 k W版權費� royalties from video/laser/TV/hotel/theatrical rights.
表 3 . 3 經評級的電影數目
Table 3.3 Number of Films Classified
1989 1990 1991 1992 1993 經評級的電影數目 1 2 0 6 1 2 9 4 1 3 3 7 1 1 9 0 1 3 9 8 Number of films classified - (7.3) (3.3) (-11.0) (17.5)
於戲院上映的電影數目 4 6 9 4 9 6 4 5 0 4 0 9 4 8 3 Number of films released (theatrical) - ^ (-9.3) (-9.1) (18.1)
i m "mi 經評級的電影數目 1 6 8 7 1 8 0 7 1 8 4 3 1 6 9 7 1 5 6 4 Number of films classified (20.7) (7.1) (2.0) (-7.9) (-7.8)
於戲院上映的電影數目 4 9 2 4 7 1 4 1 4 4 6 7 4 6 6 Number of films released (theatrical) ^ (-4.3) (-12.1) (12.8) (-0.2)
註釋:括號內的數字是與上年比較的變動百分率� Note : Figures in brackets are percentage changes over the preceding year.
5 8 Statistical Digest of the Services Sector 1999
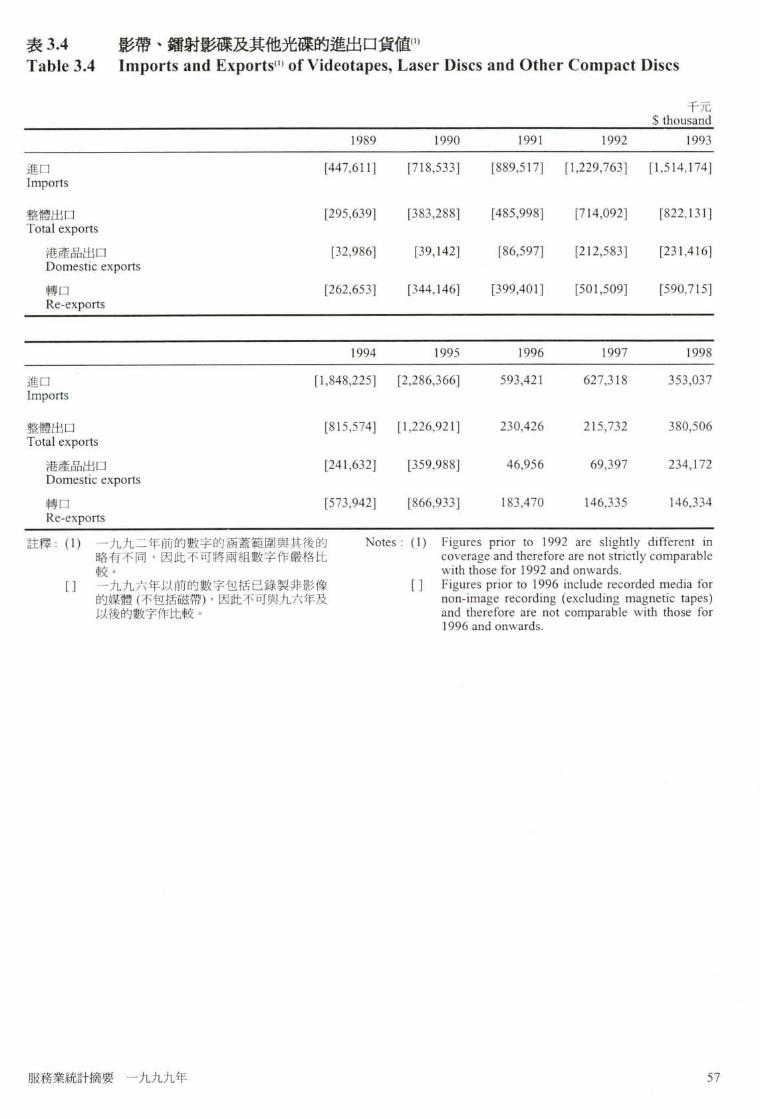
表 3 . 4 影帶、鐳射影碟及其他光碟的進出口貨値<”
Table 3.4 Imports and Exports'" of Videotapes, Laser Discs and Other Compact Discs 千元
$ thousand 1989 1990 1991 1992 1993
進口 [447,611] [718,533] [889,517] [1,229,763] [1,514,174] Imports
整體出口 [295,639] [383,288] [485,998] [714,092] [822,131] Total exports
港產品出口 [32,986] [39,142] [86,597] [212,583] [231,416] Domestic exports 轉口 [262,653] [344,146] [399,401] [501,509] [590,715] Re-exports
1994 1995 1996 1997 1998 進口 [1,848’225] [2,286,366] 593,421 627,318 353,037 Imports
整體出口 [815,574] [1,226,921] 230,426 215,732 380,506 Total exports
港產品出口 [241,632] [359,988] 46,956 69,397 234,172 Domestic exports 轉口 [573,942] [866,933] 183,470 146,335 146,334 Re-exports
註釋:(1) 一九九二年前的數字的涵蓋範圍與其後的 Notes: (1) Figures prior to 1992 are slightly different m 略有不同,因此不可將兩組數字作嚴格比 coverage and therefore are not strictly comparable 較� with those for 1992 and onwards.
[]一九九六年以前的數字包括已錄製非影像 [ ] F i g u r e s prior to 1996 include recorded media for 的媒體(不包括磁帶)’因此不可與九六年及 non-image recording (excluding magnetic tapes) 以後的叙字作比較 ° and therefore are not comparable with those for
1996 and onwards.
服務業統計摘要一九九九年 57

表 3 . 5 電影業的選定最新統計數字
Table 3.5 Selected Up-to-date Statistics on Film Entertainment Services
1998 1999 第一季 第二季 第三季 第四季 第一季 ^ Q2 Q3 Q4 Q]_
機構單位數目 9 6 3 1 0 1 1 9 8 8 1 0 0 1 1 0 4 5 Number of establishments 就業人數 5 4 3 2 5 4 5 7 4 8 8 8 4 7 3 9 4 7 5 2 Number of persons engaged 業務收益指數(1996=100) 105.6 103.6 111.2 82 .1* 84 .3 Business receipts index (1996=100)
票房收入(百萬元) 3 6 4 2 2 5 2 9 3 2 0 6 2 2 4 Box office takings ($ million)
經評級的電影數目 5 1 6 4 7 7 2 4 9 3 2 2 4 4 5 Number of films classified
影帶、鐳射影碟及其他光碟的進出口貨値(千元) Imports/exports of videotapes, laser discs and other compact discs ($ thousand)
進口 109,487 74,215 81,396 87,940 97,982 Imports 整體出口 53,777 50,873 104,511 171,345 152,392 Total exports
港產品出口 23,871 20,078 65,089 125,135 107,675 Domestic exports 轉口 29,906 30,795 39,422 46,210 44,717 Re-exports
5 8 Statistical Digest of the Services Sector 1999

資料來源 Data Sources 表 資料來源 Table Sources 3.1 政府統計處 3.1 Census and Statistics Department 3 .2 ,3 .3 香港影業協會; 3 .2 ,3 .3 Hong Kong, Kowloon & New
Territories Motion Picture Industry Association Limited ;
影視及娛樂事務管理處 Television and Entertainment Licensing Authority
3.4 政府統計處 3.4 Census and Statistics Department
其他有關刊物 Further References 年報’影視及娱樂事務管理處編製 Annual Report, published by the Television and
Entertainment Licensing Authority 就業及空缺統胃f(詳細統計表) Employment and Vacancies Statistics (Detailed Tables) 本地生產總値估言十 Estimates of Gross Domestic Product 香港統計年干U Hong Kong Annual Digest of Statistics 香港電影’香港影業協會編製 Hong Kong Films, published by the Hong Kong,
Kowloon & New Territories Motion Picture Industry Association Limited
香港統言十月干!J Hong Kong Monthly Digest of Statistics 香港貿易統計 Hong Kong Trade Statistics 服務行業按季業務收益指數 Quarterly Business Receipts Indices for Service
Industries 就業、空缺及薪金總額按季統計報告 Quarterly Report of Employment, Vacancies and
Payroll Statistics
本地生產總値估言十按季幸B告 Quarterly Report of Gross Domestic Product Estimates
服務業統it摘要一九九九年 55

4 金融市場及基金管理業
Financial Markets and Fund Management Services
槪要 Highlights 香港是公認的主要國際金融中心 °以上市公 Hong Kong is firmly established as a major 司總市値計算’ 一九九八年香港的證券市場 international financial centre. In 1998, in terms of 居全球第 i^一 位。其效率和處理風險的系統 market capitalization, Hong Kong's securities market 均符合國際公認、的標準� was the eleventh largest in the world. Its efficiency
and risk management systems are in line with internationally accepted standards.
一九九七年’金融市場及基金管理業爲香港 The financial markets and fund management industry 帶來約 2 4 9 億元的生產淨値或增加價値’佔 generated a net output or value added of about $24.9 本地生產總値的 2 % °若與八九年的數字比 billion,contributing to 2% of Hong Kong's Gross 較’其增加價値較八九年上升四倍以上’是 Domestic Product (GDP) in 1997. Compared to 1989, 過去十年 i曾長最迅速的行業之一。 the value added of the industry increased by over four
times, among the fastest growing industries during the past decade.
一九九八年’積極從事該行業的機構單位爲 In 1998, some 2 200 establishments were actively 數 2 2 0 0 間,僱用人數超過 2 4 0 0 0 名。這包 engaged in the business, employing more than 24 000 括證券公司、期貨、金銀貿易及外匯交易商 people. These included stock and share companies; / 經紀、證券、金銀貿易和期貨交易所、基 commodity futures, gold bullion and foreign exchange 金管理公司以及提供各類其他金融服務的公 brokers/dealers; stock, bullion and commodi ty 司 ° exchanges; fund management companies; and firms
providing various miscellaneous financial services.
一九九八年底,在香港聯合交易所上市的公 At the end of 1998, 680 public companies were listed 司共有 680 間’總市値爲 2 6 , 6 2 0 億元。雖然 on the Stock Exchange of Hong Kong, with a total 上市公司的數目增加了 3% ’但總市値卻較九 market capitalization of $2,662 billion. Despite an 七年減少 1 7 % � increase of 3% in the number of listed companies,
market capitalization was 17% lower than in 1997.
一九九八年間曾進行 3 2次首次公開招股’共 32 initial public offerings were made during 1998, 籌集得資金約 60 億元。除公開招股外’亦有 raising a total of about $6 billion. Besides the initial 公司透過發行認股權以及私人配售等活動籌 public offerings, funds were also tapped through 集資金。 rights issues, private placements, etc.
自一九九三年七月首間中國國有企業以發行 Since July 1993 when the first Chinese state owned H股的方式在香港聯合交易所上市後,香港 company was listed on the Exchange through issuance 作爲中國內地主要資金第集中心的角色便越 of H shares, the role of Hong Kong in being a major
服務業統it摘要一九九九年 55

趨重要。截至九八年底’在香港聯合交易所 fund-raising centre for the mainland of China had 上市的 H 股共有 41 種。 become increasingly important. By the end of 1998,
there were 41 H shares listed on the Stock Exchange of Hong Kong.
本地證券市場受地區性金融風暴影響而導致 Average daily turnover of our securities market went 成交金額顯著下跌’ 一九九八年的平均每日 down by 55% to $6.9 billion in 1998,affected by the 成交金額只有 69 億元’較九七年下降 55% ° contagious effects of the regional financial turmoil
spread.
一九九八年’恒生指數期貨交投維持活躍 ° In 1998, Hang Seng Index futures remained actively 加上恒生指數期權、港元銀行同業拆息期 traded. Together with tradings on Hang Seng Index 貨、紅籌指數期貨及恆生 100 期貨等’香港 options, HIBOR futures, Red-chip Index futures and 期貨交易所的平均每曰成交量達 3 4 5 8 1 張 ’ Hang Seng 100 Futures etc., average daily turnover in 與九七年比較增加了 5%,而與八九年比較則 the Hong Kong Futures Exchange was 34 581 i曾力口 35 倍。 contracts, went up by 5% over 1997 and increased by
35 times compared with 1989.
香港是亞洲其中一個最自由及活躍的債券市 Hong Kong is one of the most active and liberal debt 場 °在一九九八年底,港元債券的未償還總 markets in Asia. At the end of 1998,the outstanding 額爲 3,901 億元’較九七年上升 1 3 % ’ 其中 amount of the Hong Kong dollar debt securities was 包 括 9 7 5 億 元 的 外 匯 基 金 票 據 及 債 券 和 $390.1 billion, surging by 13% compared to 1997. 2 , 927 億元的私人機構發行債券 ° 外匯基金 This amount comprised $97.5 billion of Exchange 票據及債券於九八年的平均每日成交金額達 Fund Bills and Notes and $292.7 billion of private 91 億元’每日約有 9% 白勺票據在市場幸專手 ° sector issues. The average daily turnover of Exchange
Fund Bills and Notes amounted to $9.1 billion in 1998, i.e. about 9% of such papers changed hands daily.
香港在亞洲是主要的基金管理中心 °在一九 Hong Kong is the leading fund management centre in 九八年底,受認可基金公司管理的認可基金 Asia. A total of 1 526 authorized funds of net worth 的總數爲 1 526 隻’而基金淨値達 1,831 億 US$183.1 billion, representing growths of 13% and 美元,分別較九七年上升 13%及 3 8% ° 38% respectively compared to 1997,were under the
management of the authorized fund houses at the end of 1998.
5 8 Statistical Digest of the Services Sector 1999

主要統計數字 Key Statistics
百萬元(另有註明除外) $ million, unless otherwise specified
金融市場及基金管理服務業 Financial Markets and Fund Management Services Industry 年 機構單位數目•)’⑵ 就業人數⑴’<2> 增加價値<2> 業務收益指數
Year Number of Number of persons Value a d d e d � Business receipts establishments �.(2) engaged � . � index �
(1996=100) 1989 [1 516] [18 299] 4,515** -1990 [1 621] [20 754] 3,390** -1991 1 802 20 820 6,987** -1992 1 961 21 705 9,930** -1993 2 224 23 613 13,609** -1994 2 569 24 249 11,235** -1995 2 448 23 831 9,492** -1996 2 402 24 577 14,061** 100.0 1997 2 321 26 663 24,933** 165.2 1998 2 200 24 463 N.A. 93.3
註釋:(1) 一九九一年及以後的數字是該年內四季的 Notes: (1) Figures for 1991 and onwards are averages of the 估計數字的平均數’而九一年以前的數字是 four quarterly estimates of the year, whereas those j旨該年三月 白情況� prior to 1991 refer to the position as at end March
of the corresponding year. (2) 數字包括其他金融機構及金融服務’如銀行 (2) Figures included other financial institutions and
結算所、信用唔服務、指定代理/信託公司� financial services, like bank clearing house; credit 證券及股票登記或轉名服務等“ card service; nominee/trustee companies; stock and
shares registration and transfer services, etc. ( 3 )業務收益指數於一九九二統計年度開始編 (3) Business receipts indices were first available in the
製’但此詳細分類的指數則於九六年開始編 reference year 1992, but indices at such detailed 製� breakdown were first compiled in 1996.
[]一九九一年前的數字的涵蓋範圍與其後的 [ ] F i g u r e s prior to 1991 are slightly different in 略有不同’因此不可將兩組數字作嚴格比 coverage and therefore are not strictly comparable 較� with those for 1991 and onwards.
** 數字是根據有限數據而作出的粗略估計’在 ** These are crude estimates which are compiled 曰後得到更多資料時可能會作相當大的修 based on limited data. They may be subject to 言丁 ’因此在運用這數字時’應小心留;i這 considerable revisions when more data become
� available. Special care should be taken when interpreting them.
服務業統 i t摘要一九九九年 55

主要統計數字(續) Key Statistics (Cont'd.)
百萬元(另有註明除外) $ million,unless otherwise specified
金融產品的交易情況 Trading in financial products 怪生指數期貨平 香港認可基金
香港聯合交易所平 均每日成交量 金銀業貿易場的黃金買 的資產淨値^ 年 均 每 日 成 交 金 額 ( 合 約 張 數 ) 賣平均每日成交金額 (百萬美元)
Year Average daily Average daily Average daily turnover Net asset value of turnover'"' in the Stock turnover of Hang of gold trading in the authorized funds in
Exchange of Hong Kong Seng Index futures Chinese Gold and Silver Hong Kong � (contracts) Exchange Society (US$ million)
1989 1,216 959 617 -1990 1,164 952 567 25,777 1991 1,347 2013 379 28,769 1992 2,802 4 356 261 28,655 1993 4,910 9 702 277 45,494 1994 4,586 16 906 286 56,568 1995 3,347 18 407 223 82,361 1996 5,672 18 699 178 97,594 1997 15,465 26313 171 132,383 1998 6,887 28 390 114 183,092
註釋:(4) 自一九九三年起’市場成交金額數値已對遲 Notes : (4) Market turnover values since 1993 have been 幸艮及反駭交易而作出調整� adjusted for late reported and rejected sales.
(5) 指證券及期貨事務監察委員會認可的基 (5) Figures refer to funds authorized by the Securities • ’ 該會於一九八;^年五<^ 成立 ° and Futures Commission, which was established in May 1989.
5 8 Statistical Digest of the Services Sector 1999

槪念及方法 Concepts and Methods 金融市場及投資管理業的運作是由證券及期貨 Operation of the financial markets and the investment 事務監察委員會所監管’金融市場及基金管理服 management industry is regulated by the Securities 務業從業員所提供的服務包括(一)在交易所進行 and Futures Commission. Services rendered by 證券及金銀買賣和(二)基金銷售及管理� intermediaries in the financial markets and fund
management services industry are mainly related to (a) trading of securities and bullion in exchanges and (b) sales and management of funds.
香港有三間證券及金銀交易所,它們是香港聯合 There are three securities and bull ion exchanges in 交易所、香港期貨交易所和金銀業貿易場� Hong Kong, namely, The Stock Exchange of Hong
Kong, Hong Kong Futures Exchange and The Chinese Gold and Silver Exchange Society.
香港聯合交易所的業務範圍包括集資市場和交 Business of The Stock Exchange of Hong Kong covers 易市場。在此進行的證券交易包括股票、認股權 both primary stock market and secondary stock 證、債券、單位信託基金/互惠基金及股票期 market. Securities traded here include stocks, 權。一部分的上市股票亦容許賣空。恒生指數服 warrants, debts securities, unit trusts/mutual funds and 務公司製訂一系列的股票市場指數’藉以量度各 stock options. Short selling is also allowed for some 月受票於市場內的表現 ° of the listed stocks. To gauge the performance of
stocks in the market, a number of stock market indices are compiled by the Hang Seng Index Services Limited.
香港期貨交易所於一九七六年成立及於八五年 Hong Kong Futures Exchange was incorporated in 重組。現時,交易所經營多類股票指數、股票� 1976 and restructured in 1985. Currently, it operates 利率及外匯產品的期貨及期權市場 ° futures and options markets on a broad range of equity
index, stock, interest rate and foreign exchange products.
金易場經營的黃金市場’是世界最活躍黃 The Chinese Gold and Silver Exchange Society 金買賣市場之一 °在金銀業貿易場交易的黃金純 operates a gold bullion market which is among the 度爲百分之九十九’稱爲九九金°九九金是以兩 most active in the world. Gold traded through the 言十算’並以港元幸g價 ° Society is of 99 per cent fineness and is measured in
taels and quoted in Hong Kong dollars.
給予公眾人士認購的基金一定要證券及期貨事 Funds offered to public must be authorized by the 務監察委員會所認可°不給予香港公眾人士認購 Securities and Futures Commission. Funds that are 的基金貝ij不須要委員會的認可c因此’實際在香 not intended for sale to public in Hong Kong need not 港運作的基金的資產應較列載於表4 .9內的數字 be authorized. The actual asset size of funds operated 爲高’因該表的數字只包括認可基金“ in Hong Kong is therefore likely to be larger than the
figures presented in Table 4.9, which cover authorized funds only.
服務業統it摘要一九九九年 55

言司___ Definition of terms
在編製統計數字時’金融市場及基金管理業包 For statistical compilation purpose, the financial 括證券公司、期貨及金銀貿易經紀/交易商、證 markets and fund management services industry 券、金銀貿易和期貨交易所、外幣党換店、外匯 covers stock and share companies; commodity futures 經紀/交易商及基金管理公司 ° and gold bullion brokers/dealers; stock, bullion and
commodity exchanges; money changers; foreign exchange brokers/dealers and fund management companies.
所有普通股指數包括在香港聯合交易所上市的 All Ordinaries Indices (AOI) includes the ordinary 每一間公司的普通股’但不包括(一)外地公司的 shares of every company listed on the Stock Exchange 股票’而該公司的主要業務在香港以外及中國內 of Hong Kong except (a) stocks of overseas 地進行;或(二)停牌超過一年的股票;或(三)不 incorporated whose principal activities are carried on 是以港元交易的股票 ° outside Hong Kong and the mainland of China; or (b)
stocks which have been suspended for over one year; or (c) stocks which are not traded in Hong Kong dollars.
平均股息收益率等於 ylvcmgc dividend yield is equal to
Z ( 毎 股 派 息 X 發 行 股 數 ) 1 £ (Dividend per share x Number of issued shares) 收市價 X 發行股數) ° ^ (Clos ing price x Number of issued shares)
平均市盈率等於 Average price earning ratio is equal to
!:(收市價 X 發 行 股 數 ) Z(Clos ing price x Number of issued shares) 2:(每股盈禾Ij X 發 行 股 數 ) ^ ( E a r n i n g s per share x Number of issued shares)
任何人如在香港經營或顯示他是經營商品期貨 A person is required to be registered as a commodity 合約買賣白勺業務’不論作爲主事人或代理人’均 dealer if he, whether as principal or agent, carries on a 須註冊爲履品艾易腐。大部分商品交易商都是期 business in Hong Kong of trading in commodity 貨經紀°已註冊爲商品交易商的公司及合夥商行 futures contracts or holds himself out as carrying on 的主事人’如積極參與交易事務’均須註冊爲商 such a business. Most commodity dealers are futures 品交易商 ° brokers. Principals of corporations and partnerships
that are registered as commodity dealers are themselves required to be registered as commodity dealers if they are actively involved in the dealing business.
任何人在香港經營或顯示他是經營就商品期貨 A person is required to be registered as a commodity 合約買賣提供投資顧問服務的業務,均須註冊爲 trading adviser if he carries on a business in Hong 商品交易顧問。大部分商品交易顧問都是基金經 Kong of giving investment advice with respect to 理。已註冊爲商品交易顧問的公司及合夥商行的 trading in commodity futures contracts or if he holds 66 Statistical Digest of the Services Sector 1999

主事人’如積極參與投資顧問服務的業務’均須 himself out as carrying on such a business. Most 註冊爲商品交易顧問 ° commodity trading advisers are fund managers.
Principals of corporations and partnerships that are registered as commodity trading advisers are themselves required to be registered as commodity trading advisers if they are actively involved in the advising business.
合,斧夕戚iJ*是以單方向計算的合約成交數目。 Contract turnover volume is the number of contracts traded, counted on a one-way basis.
每歷盈两是由減去少數股東權益、優先股股息及 Earnings per share (EPS) is derived by dividing the 非經常性項目後的除稅後盈利除以在該財政年 consolidated profit after taxation less minority 度的力口權平均發行股數。每股盈禾U是以年率言十 interests and preference dividends and before 算’它會因應紅利及認股權的派發、股票拆細及 extraordinary items by the weighted average of 合倂而作出調整 “ number of issued shares during the corresponding
financial year. EPS is annualized and adjusted as and when bonus and rights issues, share splits and consolidations are made.
潘/岸罩位是指在單一擁有權或控制權(即單一公 An establishment is defined as an economic unit (i.e. a 司名義)下’在單一地點從事一種或主要從事一 unit engaged in the production of goods or services) 種經濟活動(即生產貨物或提供服務)的經濟單 which engages, under a single ownership or control 位 ° (i.e. under a single company name), in one or
predominantly one kind of economic activity at a single physical location.
外匯基金票據計劃監在一KhM年三 推出’是 The Exchange Fund Bills programme was introduced 一種促進本港進行金融管理的貨幣市場工具。办 in March 1990 as a money market instrument to 履基金膚券•齋下的兩年期債券在九三年五月 facilitate monetary management in Hong Kong. As 推出’三年期債券在九三年十月推出’五年期債 for the Exchange Fund Notes programme, two-year 券在九四年九月推出’七年期債券在九五年^^一 Notes were introduced in May 1993,three-year Notes 月推出’而十年期債券亦在九六年十月推出° in October 1993, five-year Notes in September 1994,
seven-year Notes in November 1995, and ten-year Notes in October 1996.
一個獲激笼;S•湖交易慮必須符合以下條件:(一) An exempt dealer must satisfy the following 主要業務不是證券交易或主要業務是在「批發� requirements : (a) its main business is something other 層面進行證券交易(一般而言’批發交易是指派 than dealing in securities or its main business is 發招股章程、安排包銷、發售政府證券、或與專 securities dealing at a "wholesale" level (in general 業投資者的主事人交易)’和(二)大部分在批發層 terms, wholesale dealing is issuing prospectuses, 面以夕i•的交易是'經認、可的證券交易所的會員或 offering underwriting arrangements to issuers, 其他認可渠道進行 ° offering government securities, or dealing with
professional investors who act as principal); and (b) the greater part of its dealing other than at a wholesale level is done through a member of a recognized stock exchange or other authorized channels.
服務業統it摘要一九九九年 55

一個獲豁免註冊投資顧問是向專業投資者或香 An exempt investment adviser is an adviser who gives 港以夕f 居民的人士提供投資意見 “ investment advice mainly to professional investors or
persons residing outside Hong Kong.
本地生產總値是指一個國家或地區的所有常住 Gross Domestic Product (GDP) is a measure of the 生產單位’在一個指定的期間內’未扣除固定資 total value of production of all resident producing 本消耒毛白勺生產總f直 ° units of a country or territory in a specified period,
before deducting allowance for consumption of fixed capital.
全產總激是以服務費、佣金、經紀費、租金收入 Gross output is measured by the service charges, 及其他收費計算。但不包括其本人帳目下的金融 commissions and brokerages, rentals received and 及其他資產買賣白勺盈躬數目� other fees received. However, any gain/loss trading in
financial and other assets on own account is excluded in estimating the gross output.
恒生指數是被最廣泛地採用的香港股票市場股 The Hang Seng Index (HSI) is the most widely quoted 票價格指數’指數於一九六九年首次公布’是一 stock price index of the Hong Kong stock market. The 個市f直力CI權指數“ index, which is a capitalization-weighted index, was
first published in 1969.
任何人在香港經營或顯示他是經營就證券提供 A person is required to be registered as an investment 投資顧問服務的業務’均須註冊爲没資愿居大 adviser if he carries on a business in Hong Kong of 部分投資顧問都是基金經理、商人銀行、或單位 giving investment advice with respect to securities or 信託顧問°已註冊爲投資顧問的公司’其董事如 holds himself out as carrying on such a business. 積極參與顧問業務’須註冊爲投資顧問。至於投 Most investment advisers are either fund managers, 資顧問合夥商行’所有普通合夥人均須註冊爲投 merchant banks, or unit trust advisers. Directors of 資顧 “ corporations that are registered as investment advisers
are themselves required to be registered as investment advisers if they are actively involved in the advising business. For investment advisers' partnerships, all general partners are required to be registered as investment advisers.
總邀是指上市公司的權益股本的市場價値。所 Market capitalization refers to the market value of 包括的上市公司是按公司的註冊地而釐定(只包 equity capital of listed companies. The inclusion of 括在香港及中國內地註冊成立的公司),和在某 listed companies is based on their places of 些情況下’根據公司的業務進行地點而定(只包 incorporation (only those incorporated in Hong Kong 括在香港進行業務的公司)°停業超過一年的公 and the mainland of China are included) and for some 司貝丨J不包括在內 ° cases, based on their places of business (only those
with business in Hong Kong are included). Those companies under suspension for over one year are not included.
5 8 Statistical Digest of the Services Sector 1999

就業人數包括積極參與機構單位工作的在職東 Persons engaged in an establishment include working 主及股東;在統計日期受僱於機構單位的全職僱 proprietors and partners actively engaged in the work 員’包括長期或臨時聘用的,無論這些僱員正在 of the establishment; full-time employees paid by the 開工或因事假或者病假而暫時缺勤;及在統計日 establishment on the survey reference date, both 期工作三小時或以上的兼職僱員和無酬家屬幫 permanent and temporary, who are either at work or 工 ° on vacation or sick leave; and part-time employees
and unpaid family workers working three hours or more on the survey reference date.
M^是銷售者沒有擁有某指定股票而對該股票 Short selling is the sale of a designated security which 作出銷售°該銷售者需要借入股票以作交收之 the seller does not own and is consummated by the 用 ° delivery of securities borrowed by or for the account
of the seller.
任{可人在香港經營或顯示他是經營言登券交易業 A person is required to be registered as a securities 務,均須註冊爲吞管券交易履。大部分證券交易商 dealer if he carries on a business in Hong Kong of 都是股票經紀“已註冊爲證券交易商的公司’其 dealing in securities or holds himself out as carrying 董事如積極參與證券交易業務’須註冊爲證券交 on such a business. Most securities dealers are 易商°至於交易合夥商行’所有普通合夥人均須 stockbrokers. Directors of corporations that are 言主冊爲言登券交易商� registered as securities dealers are themselves
required to be registered as securities dealers if they are actively involved in the dealing business. For dealing partnerships, all general partners are required to be registered as securities dealers.
香港聯合交易所的成交量及成交金額是單方向 Tmding turnover volume and value in the Stock 計算的 o Exchange of Hong Kong are counted on a one-way
basis.
潭經是生產總額減去中間投產消耗(生產過 Value added is defined as the value of gross output 程中所耗用的貨物和服務的價値)� less the value of intermediate consumption (the value
of goods and services used up in the course of production).
服務業統it摘要一九九九年 55

統計圓表 Statistical Tables and Charts 表 4 . 1 金 融 市 場 及 基 金 管 理 服 務 業 的 機 構 單 位 數 目 、 就 業 人 數 、 業 務 收 益 指 數 、 生 產 總 額 及
增 加 價 値
Table 4.1 Number of Establishments and Persons Engaged, Business Receipts Index, Gross Output and Value Added of the Financial Markets and Fund Management Services Industry
百萬元(另有註明除外) $ million, unless otherwise specified
1989 1990 1991 1992 1993 機構單位數目(')’(2> [1 5 1 6 ] [1 621] 1 802 1 961 2 2 2 4 Number of e s t a b l i s h m e n t s � ’ � (13.8) (6.9) (11.2) (8.8) (13.4)
就業人數⑴ • � [ 1 8 2 9 9 ] [ 2 0 7 5 4 ] 2 0 8 2 0 2 1 7 0 5 2 3 6 1 3 Number of persons engaged � ’ � (19.4) (13.4) (0.3) (4.3) (8.8)
業務收益指數⑶(1996=100) - - - - -Business receipts index�(1996=100) -
生產總額⑵ 9,306** 10,481** 14,828** 17,573** 23,939** Gross output' ' ' (12.8) (12.6) (41.5) (18.5) (36.2)
增加價値⑵ 4,515** 3,390** 6,987** 9,930** 13,609** Value added® (13.6) (-24.9) (106.1) (42.1) (37.0) 在以要素成本計算的本地生產總値內所佔比率(%) 0.9** 0.6** 1.1** 1.4** 1.6** Contribution to GDP at factor cost (%) 增加價値在生產總額所佔比率 48.5** 32.3** 47.1** 56.5** 56.8** Value added as % of gross output
註釋:括號內的數字是同上年比較的變動百分率� Notes : Figures in brackets are percentage changes over the preceding year.
(1) 一九九一年及以後的數字是該年內四季的 (1) Figures for 1991 and onwards are averages of the 估計數竺的平均數’而九一年以前的數字是 four quarterly estimates of the year, whereas those 指該年三月底的'1 青況� prior to 1991 refer to the position as at end March
一 一 of the corresponding year. ( 2 ) 數辛包括其他•融機構及金融服務’如 (2) Figures included other financial institutions and
銀行結算所、信用暗服務、指定代理/信 financial services, like bank clearing house; credit 託公司、證券及股票登記或轉名服務 card service; nominee/trustee companies; stock 等 ° and shares registration and transfer services, etc.
( 3 )業務收益指數於一九九二統計年度開始編 (3) Business receipts indices were first available in the 製’但此詳細分類的指數則於九六年開始編 reference year 1992,but indices at such detailed 製� breakdown were first compiled in 1996.
[]一九九一年前的數字的涵蓋範圍與其後的 [ ] F i g u r e s prior to 1991 are slightly different in 略有不同’因此不可將兩組數字作嚴格比 coverage and therefore are not strictly comparable 較 ° with those for 1991 and onwards.
** 數字是根據有限數據而作出的粗略估計’在 ** These are crude estimates which are compiled 曰 後 得 到 更 多 資 時 可 能 會 作 相 當 大 的 b a s e d on limited data. They may be subject to 言了 ’因此在運用這數字時’應小心留意這 considerable revisions when more data become 點 ° available. Special care should be taken when
interpreting them.
5 8 Statistical Digest of the Services Sector 1999

表 4 . 1 (續) 金 融 市 場 及 基 金 管 理 服 務 業 的 機 構 單 位 數 目 、 就 業 人 數 、 業 務 收 益 指 數 、 生
產 總 額 及 增 加 價 値
Table 4.1 (Cont'd.) Number of Establishments and Persons Engaged, Business Receipts Index, Gross Output and Value Added of the Financial Markets and Fund Management Services Industry
百萬元(另有註明除外) $ million, unless otherwise specified
1994 1995 1996 1997 1998 機構單位數目⑴’(2) 2 5 6 9 2 4 4 8 2 4 0 2 2 3 2 1 2 2 0 0 Number of e s t a b l i s h m e n t s � ’ � (15.5) (-4.7) (-1.9) (-3.4) (-5.2)
就業人數⑴’ (2> 2 4 2 4 9 2 3 8 3 1 2 4 5 7 7 2 6 6 6 3 2 4 4 6 3 Number of persons e n g a g e d � ’ � (2.7) (-1.7) (3.1) (8.5) (-8.3)
業務收益指數⑶(1996=100) - - 100 .0 165.2 9 3 . 3 Business receipts index�(1996=100) - - - (65.2) (-43.5)
生產總額(2) 22,790** 20,067** 26,463** 43,690** N.A. Gross o u t p u t � (-4.8) (-11.9) (31.9) (65.1) N.A.
增 加 價 値 1 1 , 2 3 5 * * 9,492** 14,061** 24,933** N.A. Value a d d e d � (-17.4) (-15.5) (48.1) (77.3) N.A.
在以要素成本計算的本地生產總値內所佔比率(%) 1.2** 0.9** 1 . 2 " 2.0** N.A. Contribution to GDP at factor cost (%) 增加價値在生產總額所佔比率 49.3** 47.3** 53.1** 57.1** N.A. Value added as % of gross output
註釋:括號內的數字是同上年比較的變動百分率� Notes : Figures in brackets are percentage changes over the preceding year.
(1) 一九九一年及以後的數字是該年內四季的 ’(1) Figures for 1991 and onwards are averages of the 估 計 K 字 的 均 & ’ 而九一年以前數字是 four quarterly estimates of the year, whereas those if 該年三月產的情況� prior to 1991 refer to the position as at end March
of the corresponding year. (2) 數字包括其他金融機構及金融服務’如銀行 (2) Figures included other financial institutions and
結算所、信用唔服務、指定代理/信託公司� financial services, like bank clearing house; credit 證券及股票登記或轉名服務等 ° card service; nominee/trustee companies; stock
and shares registration and transfer services, etc. ( 3 )業務收益指數於一九九二統計年度開始編 (3) Business receipts indices were first available in the
製’但此詳細分類的指數則於九六年開始編 reference year 1992,but indices at such detailed 製 ° breakdown were first compiled in 1996.
** 數字是根據有限數據而作出的粗略估it ’在 ** These are crude estimates which are compiled 日後得到更多資料時可能會作相當大的 I f based on limited data. They may be subject to 訂’因此 i運用這數字時’應小心留意這 considerable revisions when more data become 點� available. Special care should be taken when
interpreting them.
服務業統 i t摘要一九九九年 55

圓 4 . 1 金融市場及基金管理服務業的機構單位數目⑴⑷及就業人數丨>’⑶
Chart 4.1 Number of Establishments'" and Persons Engaged''"" in the Financial Markets and Fund Management Services Industry
機構單位數目 就業人數 ^ aoo Number of establishments — _ _ _ _ — — 一 Number of persons engaged ^^ ^^^
2 500 - - - - - 25 000
_ 一 _ _ _ _
• t _ — — — — — — - — — _ — — — 2 0 _ _ 圓 _ _ _ 誦 _ 謹
1 500 — . … - - _ . - … - … 隱 … - - _ - - - - - - 圓 … … 圓 - … 邏 - - - 1 5 000
_ 漏 _ _ _ _ _ _
1 000 ‘ … 隱 … 圓 … … 圓 議 … … 圓 … … 圓 … 1 0 0 0 0 _ _ _ _ _ _ _ _
_ 傷 _ 營 5000
_ 隱 圓 圓 _ _ _ 隱 0 I M ^ M ^ M b d M M b d o 1991 1992 1993 1994 1995 1996 1997 1998
^機構單位數目 就業人數 Number of establishments Number of persons engaged
註釋:(1) 數字是該年內四季的估計數字的平均數。 Notes: (1) Figures are averages of the four quarterly estimates of the year.
(2) 數字包括其他金融機構及金融服務’如銀行 � Figures included other financial institutions and 結算所、信用卩吉服務、指定代理/信託公司� financial services, like bank clearing house; credit 證券及股票登記运轉名IM務等� card service; nominee/trustee companies; stock
and shares registration and transfer services, etc.
5 8 Statistical Digest of the Services Sector 1999

表4.2 註冊圑體及個人數目⑴
Table 4.2 Number of Registered Bodies�
1989 1990 1991 1992 1993 註冊證券交易商數目 1 1 7 8 1 2 0 9 1 2 9 7 1 2 5 6 1 3 3 3 Number of registered securities dealers
註冊證券投資顧問數目 853 999 1 078 1 158 1 209 Number of registered securities investment advisers 註冊商品交易商數目 247 261 263 269 286 Number of registered commodities dealers
註冊商品交易顧問數目 96 112 112 108 108 Number of registered commodities trading advisers 持 牌 槓 桿 式 外 匯 買 賣 商 數 目 - - - - -Number of licensed leveraged foreign exchange traders �
獲豁免註冊交易商數目 246 259 252 244 233 Number of exempt dealers
獲豁免註冊投資顧問數目 16 21 26 29 33 Number of exempt investment advisers
1994 1995 1996 1997 1998 註冊證券交易商數目 1 438 1 658 1 830 1 850 1 958 Number of registered securities dealers
註冊證券投資顧問數目 1 3 0 2 1 4 9 8 1 6 3 2 1 6 4 8 1 7 1 0 Number of registered securities investment advisers 註冊商品交易商數目 336 381 462 475 502 Number of registered commodities dealers
註冊商品交易顧問數目 122 205 275 292 313 Number of registered commodities trading advisers 持牌槓桿式外匯買賣商數目(2) - 18 32 22 20 Number of licensed leveraged foreign exchange traders(2>
獲豁免註冊交易商數目 229 228 227 225 215 Number of exempt dealers
獲豁免註冊投資顧問數目 39 45 47 46 42 Number of exempt investment advisers 註釋:指該年度三月底的數字。 Notes: Figures refer to end March of the corresponding year.
(1) 註冊工彳 f是由證券及期貨事務¥委員會 � Registration is done with the Securities and 負責’該會於一九年五月成立。 Futures Commission, which was formally
established in May 1989. (2)在一九九五年以前’槓桿式外匯買賣商無須 (2) Registration of leveraged foreign exchange traders
註冊� was not required before 1995.
服務業統 i t摘要一九九九年 55

表 4 . 3 在 香 港 聯 合 交 易 所 上 市 的 公 司 數 目 、 總 市 値 、 收 益 率 及 市 盈 率
Table 4.3 Number of Listed Companies, Market Capitalization, Yield and Price Earning Ratio of Stocks Listed on the Stock Exchange of Hong Kong
1989 1990 1991 1992 1993 上市公司數目 2 9 8 2 9 9 3 5 7 4 1 3 4 7 7 Number of listed companies (-2.0) (0.3) (19.4) (15.7) (15.5)
中國國有企業⑴ - - _ - 6 Chinese state owned compan ie s� -a 他 298 299 357 413 471 6\hers (-2.0) (0.3) (19.4) (15.7) (14.0)
上市公司總市値(百萬元) 605,010 650,410 949,172 1,332,184 2,975,379 Total market capitalization ($ million) (4.2) (7.5) (45.9) (40.4) (123.3)
中國國有企業⑴ - 18,229 Chinese state owned compan ie s� -其他 605,010 650,410 949,172 1,332,184 2,957,150 Others (4.2) (7.5) (45.9) (40.4) (122.0) 以 總 市 値 i 十 在 世 界 的 排 名 1 4 8 6 Ranking in the world in terms of market capitalization'^'
收益率及市盈率 Yield and price earning ratio 所有普通股指數的平均股息收益率(3) ( % ) 6 . 1 5 . 3 4 . 2 4 . 1 2 . 3 Average dividend yield of AOI<" (%) 所有普通股指數的平均市盈率⑶ 1 0 . 8 9 . 9 1 3 . 0 1 3 . 1 2 1 . 6 Average price earning ratio of AOI。)
註釋:括號內的數字是與上年比較的變動百分率“ Notes : Figures in brackets are percentage changes over the preceding year.
(1) 在一九九三年七月十五日’第一間中國國有 (1) The first Chinese state owned company with H 企業以H股類別在香港聯合交易所上市° shares was listed on the Stock Exchange of Hong
Kong on 15 July 1993. (2) 排名是根據世界交易所聯會每月世界股票 (2) Ranking is based on International Federation of
市場,铳言+幸g告而言 "定 ° Stock Exchanges monthly statistics report. (3) 一九九一年以前的數據是香港指數成份股 (3) Data prior to 1991 are averages of the Hong Kong
的平均數 ° Index constituent stocks.
5 8 Statistical Digest of the Services Sector 1999

表4.3 (繽) 在香港聯合交易所上市的公司數目、總市値、收益率及市盈率
Table 4.3 (Cont'd.) Number of Listed Companies, Market Capitalization, Yield and Price Earning Ratio of Stocks Listed on the Stock Exchange of Hong Kong
1994 1995 1996 1997 1998 上市公司數目 529 542 583 658 680 Number of listed companies (10.9) (2.5) (7.6) (12.9) (3.3)
中國國有企業⑴ 15 17 23 39 41 Chinese state owned companies� (150.0) (13.3) (35.3) (69.6) (5.1) 其他 514 525 560 619 639
Others (9.1) (2.1) (6.7) (10.5) (3.2)
上市公司總市値(百萬元) 2,085,182 2,348,310 3,475,966 3,202,630 2,661,713 Total market capitalization ($ million) (-29.9) (12.6) (48.0) (-7.9) (-16.9)
中國國有企業⑴ 19,981 16,464 31,531 48,622 33,533 Chinese state owned companies'" (9.6) (-17.6) (91.5) (54.2) (-31.0) 其他 2,065,201 2,331,846 3,444,435 3,154,008 2,628,180 Others (-30.2) (12.9) (47.7) (-8.4) (-16.7) 以總市値計在世界的排名(2) 8 8 7 9 11 Ranking in the world in terms of market capitalization®
收益率及市盈率 Yield and price earning ratio 所有普通股指數的平均股息收益率(%) 4 . 1 3 . 6 2 . 9 3 . 5 3 . 7 Average dividend yield of AOI�(%)
所有普通股指數的平均市盈率⑶ 10.7 11.4 16.7 12.1 10.7 Average price earning ratio of AOI(”
註釋:括號內的數字是與上年比較的變動百分率 ° Notes : Figures in brackets are percentage changes over the preceding year.
(1) 在一九九三年七月十五曰’第一間中國國有 ’(1) The first Chinese state owned company with H 企業以H股類別在香港聯合交易所上市� shares was listed on the Stock Exchange of Hong
Kong on 15 July 1993. (2) 排名是根據世界交易所聯會每月世界股票 (2) Ranking is based on International Federation of
市場'铳言十幸艮告而雪了定 ° Stock Exchanges monthly statistics report. (3) 一九九一年以前的數據是香港指數成份股 (3) Data prior to 1991 are averages of the Hong Kong
的平均數 ° Index constituent stocks.
服務業統 i t摘要一九九九年 55

表 4 . 4 香 港 聯 合 交 易 所 的 成 交 金 額 及 賣 空 量
Table 4.4 Turnover and Short Selling in the Stock Exchange of Hong Kong 百萬元(另有註明除外)
$ million, unless otherwise specified 1989 1990 1991 1992 1993
成交總金額(�) 299,147 288,715 334,104 700,578 1,222,675 Total turnover'" (50,0) (-3.5) (15.7) (109.7) (74.5)
所有上市證券的平均每日成交金額⑴’ 1,216 1,164 1,347 2,802 4,910 Average daily t u r n o v e r � o f all listed securities (51.2) (-4.3) (15.7) (108.0) (75.2)
所有股票 1,097 1,091 1,212 2,434 4,108 All equity stocks (47.6) (-0.6) (11.1) (100.8) (68.8)
中國國有企業⑶ - - - - 1 2 5 Chinese state owned companies'^' -其他股票 1,097 1,091 1,212 2,434 3,983 Other equity stocks (47.6) (-0.5) (11.1) (100.8) (63.6)
其 他 上 市 證 券 1 1 9 7 3 1 3 5 3 6 8 5 0 7 Other listed securities'"' (94.8) (-38.3) (83.9) (172.8) (37.8)
賣空⑶ Short selling'^'
股份數目(千股) - - - - -Number of shares (thousand shares) 成交金額 - - - - -Value of transactions 賣空佔總成交金額比率(%) - - - - -Ratio of short selling to turnover (%)
註釋:括號內的數字是與上年比較的變動百分率� Notes : Figures in brackets are percentage changes over the preceding year.
(1) 自一九九三年起’市場成交金額數値已對遲 (1) Market turnover values since 1993 have been 幸B及反驳交凑而作tb調整 ° adjusted for late reported and rejected sales.
(2) 由於進位原因’所有股票與其他上市證券的 (2) The sum of average daily turnover for all equity 平每日成交金額之禾口可 * b 與戶斤證 stocks and other listed securities may not equal to 去白平均毎日成交金額不裙等 ° average daily turnover of all listed securities due to
rounding. (3) 在一九九三年七月十五曰’第一間中國國有 (3) The first Chinese state owned company with H
企業以H股類別在香港聯合交易所上市 ° shares was listed on the Stock Exchange of Hong Kong on 15 July 1993.
(4) 包括債券、單位信託基金/互惠基金、衍生認 (4) Including debts securities, unit trusts/mutual 股權證;^股;^認.股權證� funds, derivative warrants and equity warrants.
(5) 香港聯合交易所自一九九四年一月三曰起 (5) Regulated short selling was introduced by the 容許受監管的股份賣空活動� Stock Exchange of Hong Kong on 3 January 1994.
5 8 Statistical Digest of the Services Sector 1999

表 4 . 4 (續) 香 港 聯 合 交 易 所 的 成 交 金 額 及 賣 空 量
Table 4.4 (Cont'd.) Turnover and Short Selling in the Stock Exchange of Hong Kong 百萬元(另有註明除外)
$ million, unless otherwise specified 1994 1995 1996 1997 1998
成交總金額(I) 1,137,414 826,801 1,412,242 3,788,960 1,701,112 Total turnover'" (-7.0) (-27,3) (70.8) (168.3) (-55.1)
所有上市證券的平均每日成交金額⑴'(z) 4,586 3,347 5,672 15,465 6,887 Average daily t u r n o v e r � . � of all listed securities (-6.6) (-27.0) (69.5) (172,7) (-55.5)
所有股票 3,929 3,001 5,169 14,338 6,465 All equity stocks (-4.4) (-23.6) (72.3) (177.4) (-54,9)
中 國 國 有 企 業 1 3 3 6 8 1 0 0 1 , 2 1 5 2 9 8 Chinese state owned companies� (6.4) (-48.9) (47.1) (1115.0) (-75.5) 其他股票 3,796 2,933 5,069 13,123 6,167 Other equity stocks (-4.7) (-22.7) (72.9) (158,9) (-53.0)
其他上市證券(4) 436 264 502 1,127 422 Other listed securities'"' (-14.0) (-39.4) (90.2) (124.3) (-62.6)
賣空(5) Short s e l l i ng�
股份數目(千股) - 10 372 437 756 2 211 633 3 304 022 Number of shares (thousand shares) 成交金額 - 415 8,747 45,535 74,192 Value of transactions 賣空佔總成交金額比率(%) - 0,05 0.62 1.20 4.36 Ratio of short selling to turnover (%)
註釋:括號內的數字是與上年比較的變動百分率° Notes : Figures in brackets are percentage changes over the preceding year.
(1) 自一九九三年起’市場成交金額數値已對遲 (1) Market turnover values since 1993 have been 幸艮及反驳交倉而作li調麵 ° adjusted for late reported and rejected sales.
(2 )由於進位原因’所有股票與其他上市證券的 (2) The sum of average daily turnover for all equity 平均每曰成交金額之和可能與所有上市證 stocks and other listed securities may not equal to 奏的平均每曰成交金額不相等- average daily turnover of all listed securities due to
rounding. (3) 在一九九三年七月十五日’第一間中國國有 (3) The first Chinese state owned company with H
企業以H股類別:!^舍港聯合交易所上市� shares was listed on the Stock Exchange of Hong Kong on 15 July 1993.
(4) 包括債券、單位信託基金/互惠基金、衍生認 (4) Including debts securities, unit trusts/mutual 股權證A股 i認股權證 ° funds, derivative warrants and equity warrants.
(5) 香港聯合交易所自一九九四年一月三日起 (5) Regulated short selling was introduced by the 容許受監管的股份賣空、运動“ Stock Exchange of Hong Kong on 3 January 1994.
服務業統 i t摘要一九九九年 55

圖4.2 在香港聯合交易所上市的公司總市値
Chart 4.2 Market Capitalization of Stocks Listed on the Stock Exchange of Hong Kong
百萬元 $ million
^^ — • , • , I , • • • v.、..w、....— 、••_•、.、.、、•、、•_•_•••..、.•”、、..、.. •"...、-«•、." S — • • • • • • •_>•�.-.-....-�..-.”.•”_•«•_•、.••..•. ”•、"..-. . … • • • . • . M ^ ...M .VV,. - —— _ 一 .
3,500,000 3,000,000 八 /
2,500,000 / ^ ^ 2,000,000 / - j 1,500,000 J 1,000,000 —
500,000 0 -1 1 1 1 1 1 1 1 1 1989 1990 1991 1992 1993 1994 1995 1996 1997 1998
圖4.3 香港聯合交易所平均每日成交金額 (”及 ®生指數
Chart 4.3 Average Daily Turnover� in the Stock Exchange of Hong Kong and Hang Seng I n d e x �
平均每日成交金額(百萬元) 1S生指數 Average daily turnover ($ million) Hang Seng Index
16,000 -r 丄——一…:…-…-……•...…- — 一 …一——”一——一——————…一一——-……•—�16 000 1 _
14,000 灣 14 000
12,000 瞧 S ^ 12 000
10,000 ^ ^ — “ — — _ \ 10 000
8,000 !謹 8 000
6,000 - - - -讓 - - - -欄 - - 6 000 ^ ^ 鬥 门 藝 _
4,000 . — — M l ;;;:::——纖 簽 - 4 000 ,.::《 • 國 _ _ ^
2,000 潘—— W ——纖——:麟: 翻 4 機 … 2 000 R571 r r r i r r q 纪: _ _ 纖 :-;•:. 0 •絲丨,I I I I I 1 1 I 丨 1 I 1 M I i m M 0 1989 1990 1991 1992 1993 1994 1995 1996 1997 1998
1=1平均每日成交金額 丨S生指數
Average daily turnover Hang Seng Index
註釋:(1) 自一九九三年起’市場成交金額數値已對遲 Notes: (1) Market turnover values since 1993 have been 幸E及反驳交易而作出調整 ° adjusted for late reported and rejected sales.
(2)數字是該年內十二個月’每月最後一曰的收 (2) Figures are averages of the closing indices of the 市指數的平均數字 ° last day of each of the twelve months in the year.
5 8 Statistical Digest of the Services Sector 1999

表 4 . 5 香 港 聯 合 交 易 所 新 證 券 的 發 行 情 況
Table 4.5 New Issues in the Stock Exchange of Hong Kong
1989 1990 1991 1992 1993 新證券發行數目 46 77 134 213 217 Number of new issues (-49.5) (67.4) (74.0) (59.0) (1.9)
股票 14 17 60 65 68 Stocks (-66.7) (21.4) (252.9) (8.3) (4.6) S 他(" 32 60 74 148 149 Others'" (-34.7) (87.5) (23.3) (100.0) (0.7)
新證券發行金額(百萬元) 5,058 7,063* 12,668* 24,191* 206,915* Value of new issues ($ million) (101.6) (39.6) (79.4) (91.0) (755.3)
股票 3,368 3,824* 6,952* 11,982* 29,181* Stocks (158.9) (13.5) (81.8) (72.4) (143.5)
中 國 國 有 企 業 - 8,142 Chinese state owned companies'^' -其他股票 3,368 3,824* 6,952* 11,982* 21,040* Other stocks (158.9) (13.5) (81.8) (72.4) (75.6)
其他(” 1,690 3,239 5,716 12,209 177,734 Others'" (39.9) (91.6) (76.5) (113.6) (1355.8)
1994 1995 1996 1997 1998 新證券發行數目 242 179 415 597 241 Number of new issues (11.5) (-26.0) (131.8) (43.9) (-59.6)
股票 54 26 49 84 32 Stocks (-20.6) (-51.9) (88.5) (71.4) (-61.9) 其他⑴ 188 153 366 513 209 Others'" (26.2) (-18.6) (139.2) (40.2) (-59.3)
新證券發行金額(百萬元) 312,150* 121,733 178,735 294,593* 109,570 Value of new issues ($ million) (50,9) (-61.0) (46.8) (64.8) (-62.8)
股票 17,360* 8,110 31,216 81,654 5,954 Stocks (-40.5) (-53.3) (284.9) (161.6) (-92.7)
中國國有企業⑵ 9,880 2,011 6,834 32,038 2,072 Chinese state owned companies''' (21.4) (-79.6) (239.8) (368.8) (-93.5) 其他股票 7,481* 6,099 24,382 49,616 3,881 Other stocks (-64.4) (-18.5) (299.8) (103.5) (-92.2)
其他⑴ 294,790 113,623 147,519 212,939* 103,616 Others'" (65.9) (-61.5) (29.8) (44.3) (-51.3)
註釋:括號內的數字是與上年比較的變動百分率° Notes : Figures in brackets are percentage changes over the preceding year.
(1) 包括債券、單位信託基金/互惠基金、衍生認 (1) Including debts securities, unit trusts/mutual 股權證;^股本認股權證� funds, derivative warrants and equity warrants.
(2)在一九九三^^七月十五曰’第一間中國國有 (2) The first Chinese state owned company with H 企業以H股類別在香港聯合交易所上市° shares was listed on the Stock Exchange of Hong
Kong on 15 July 1993.
服務業統 i t摘要一九九九年 55

表 4 . 6 香港期貨交易所平均每日成交量 Table 4.6 Average Daily Turnover in the Hong Kong Futures Exchange
合約張數 Contracts
1989 1990 1991 1992 1993 平均每日成交量 959 952 2 013 4 356 10 887* Average daily turnover (69.7) (-0.7) (111.4) (116.4) (149.9)
恆生指數期貨 9 5 9 9 5 2 2 0 1 3 4 3 5 6 9 7 0 2 Hang Seng Index futures (69.7) (-0.7) (111.4) (116.4) (122.7) 恆生指數期權⑴ - - - 1 4 2 6 Hang Seng Index options") -股票期貨(2) - - - - -Stock futures'^' -曰 轉 期 匯 - - - - -Rolling Forex f u t u r e s � -三個月港元銀行同業拆息期貨⑷ - - - - -Three-month HIBOR futures'"' -一 個 月 港 元 銀 行 同 業 拆 息 期 貨 - - - - -One-month HIBOR f u t u r e s � -紅 第 期 貨 - - - - -Red-chip futures的 -紅簿期權(6) - - - - -Red-chip options'' ' -期交所台灣指數期貨⑺ - - - - -HKFE Taiwan Index futures"' -期交所台灣指數期權(7) - - - - -HKFE Taiwan Index options'' ' -® 生 1 0 0 期 貨 -Hang Seng 100 f u t u r e s � -恒生100期權⑶ - - - - -Hang Seng 100 options^ -
註釋:括號內的數字是與上年比較的變動百分率� Notes : Figures in brackets are percentage changes over the preceding year.
(1) 恆生指數期權於一九九三年三月五日推 (1) Hang Seng Index options were launched on 5 出� March 1993.
( 2 ) 股票期貨於一九九五年三月三 " I ^一曰推 (2) Stock futures were launched on 31 March 1995. 出。
(3) 首批日轉期匯(馬克及日圓)於一九九五年十 (3) The first batch of currency futures (DEM, JPY) 一月三日推出’而第二批日轉期匯(英鎊)則 were launched on 3 November 1995 and the 於;^六年九月 二十日推出。 second batch of currency futures (GBP) were
launched on 20 September 1996. (4) 三個月港元銀行同業拆息期貨於一九九七 (4) Three-month HIBOR futures were re-launched on
年九月二十六日再次推出。 26 September 1997. (5) 一個月港元銀行同業拆息期貨於一九九八 (5) One-month HIBOR futures were launched on 20
年十月二十日推出。 October 1998. ( 6 )紅籌期貨及期權於一九九七年九月十二曰 (6) Red-chip futures and options were launched on 12
推出� September 1997. ( 7 )期交所台灣指數期貨及期權於一九九八年 (7) HKFE Taiwan Index futures and options were
五月二十六日推出。 launched on 26 May 1998. (8) 11 生 100 期貨及期權於一九九八年九月十八 (8) Hang Seng 100 futures and options were launched
日推出� on 18 September 1998.
5 8 Statistical Digest of the Services Sector 1999

表4.6 (續) 香港期貨交易所平均每日成交量
Table 4.6 (Cont'd) Average Daily Turnover in the Hong Kong Futures Exchange 合約張數 Contracts
1994 1995 ^ ^ 1998 平均每日成交量 19 352 21 125* 23 877* 32 987* 34 581 Average daily turnover (77.8) (9.2) (13.0) (38.2) (4.8)
S 生指數期貨 1 6 9 0 6 1 8 4 0 7 1 8 6 9 9 2 6 3 1 3 2 8 3 9 0 Hang Seng Index futures (74.3) (8.9) (1.6) (40.7) (7.9) ®生指數期權⑴ 2 446 2 614 4 393 4 683 3 253
Hang Seng Index options*" (71.5) (6.9) (68.1) (6.6) (-30.5) 股票期貨⑵ - 24 0 18 17
Stock futures'^' - (-5.6) 日轉期匯⑶ - 533 757 981 70 Rolling Forex f u t u r e s � - - (42.0) (29.6) (-92.9) 三個月港元銀行同業拆息期貨⑷ - - - 1 372 2 049 Three-month HIBOR f u t u r e s � - (49.3) 一個月港元銀行同業拆息期貨(5) - - - - 88 One-month HIBOR f u t u r e s � - “ 紅赛期貨⑷ - - - 1 960 694 Red-chip futures''' - (-64.6) 紅籌期權(6) - - - 17 8
Red-chip options'®' - (-52.9) 期 交 所 台 灣 指 數 期 貨 - - - • 1 HKFE Taiwan Index futures'" - “ 期 交 所 台 灣 指 數 期 權 - - - 1 HKFE Taiwan Index options'" - ‘ 恆生100期貨⑷ 224 Hang Seng 100 futures*^' - ‘ 垣生100期權⑷ - - - - 67 Hang Seng 100 options*®* - - “ ; ^
註釋:括號內的數字是與上年比較的變動百分率“ Notes : Figures in brackets are percentage changes over the preceding year.
(1) 恆生指數期權於一九九三年三月五日推 (1) Hang Seng Index options were launched on 5 ^ � March 1993.
( 2 )股票期貨方令一九九五年三月三 i~•日推 (2) Stock futures were launched on 31 March 1995. 出-、’ 、
(3) 首批円轉期匯(馬克及曰圓)於一九九五年十 (3) The first batch of currency futures (DEM, JPY) 一月三日推出’而第二批日轉期匯(英鎊)則 were launched on 3 November 1995 and the 於 i{六年九月二十曰推 tB ° second batch of currency futures (GBP) were
� launched on 20 September 1996. (4) 三個月港元銀行同業拆息期貨於一九九七 (4) Three-month HIBOR futures were re-launched on
年九月二十六日再次推出° 26 September 1997. (5) 一個月港元銀行同業拆息期貨於一九九八 (5) One-month HIBOR futures were launched on 20
年十月二十日推出。 October 1998. ( 6 )紅簿期貨及期權於一九九七年九月十二曰 (6) Red-chip futures and options were launched on 12
j g出� Sep tember 1997. (7) 期交所台灣指數期貨及期權於一九九八年 (7) HKFE Taiwan Index futures and options were
五月二十六日 ||出。 launched on 26 May 1998. ( 8 )恆生T o o 期貨及期權於一九九八年九月十八 (8) Hang Seng 100 futures and options were launched
日推出� on 18 September 1998.
服務業統 i t摘要一九九九年 55

画 4 . 4 恒生指數期貨平均每日成交量 Chart 4.4 Average Daily Turnover of Hang Seng Index Futures
合約張數 Contracts 30 000 -1 1
25 000 ^ 1
20 000 - \ y
15 000 y
10 000
5 000
0 -l 1 1 1 1 1 1 1 1 1989 1990 1991 1992 1993 1994 1995 1996 1997 1998
表 4 . 7 金銀業貿易場的黃金買賣報價及平均每曰成交量 Table 4.7 Trading Prices and Average Daily Turnover of Gold Trading in the Chinese Gold
and Silver Exchange Society
1989 1990 1991 1992 1993 買賣報價(以每兩港元計) 3,735 3,624 3,289 3,078 3,592 Trading price ($/tael)
平均每日成交量 Average daily turnover 價値(百萬元) 6 1 7 5 6 7 3 7 9 2 6 1 2 7 7 Value ($ million) (-25.4) (-8.2) (-33.0) (-31.2) (6.1) 數量(兩) 1 7 4 3 2 7 1 5 9 2 7 1 1 0 6 6 3 1 8 2 2 4 5 8 3 5 5 6 Quantity (tael) (-14.0) (-8.6) (-33.1) (-22.9) (1.6)
1994 1995 1996 1997 1998 買賣報價(以每兩港元計) 3,533 3,569 3,409 2,670 2,652 Trading price ($/tael)
平均每日成交量 Average daily turnover 價値(百萬元) 2 8 6 2 2 3 1 7 8 1 7 1 1 1 4 Value ($ million) (3.2) (-22.0) (-20.2) (-3.7) (-33.3) 數量(兩) 8 0 8 2 7 6 3 0 9 7 4 9 8 8 8 5 6 0 5 8 4 2 1 9 4 Quantity (tael) (-3.3) (-21.9) (-20.9) (12.4) (-24.7)
註釋:括號內的數字是與上年比較的變動百分率° Note : Figures in brackets are percentage changes over the preceding year.
5 8 Statistical Digest of the Services Sector 1999

表 4 . 8 港元債務市場 Table 4.8 Hong Kong Dollar Debt Market
百萬元 $ million 1990 1991 1992 1993 1994
外匯基金票據及債券以外的港元債務工具的未償 還總額⑴ - - - - -Outstanding amount of Hong Kong dollar debt -instruments, other than Exchange Fund Bills and Notes'"
外匯基金票據及債券的未償還總額 7,540 14,040 20,340 28,060 52,340 Outstanding amount of Exchange Fund Bills and - (86.2) (44.9) (38.0) (86.5) Notes 外匯基金票據及債券以外的新發行港元債務工具⑴ - - - - -New issues of Hong Kong dollar debt -instruments, other than Exchange Fund Bills and Notes'" 外匯基金票據及債券的平均每日成交金額 1,459 4,903 7,541 14,981 22,311 Average daily turnover of Exchange Fund Bills - (236.1) (53.8) (98.7) (48.9) and Notes
1995 1996 1997 1998 外匯基金票據及債券以外的港元債務工具的未償 還總額⑴ 138,326 187,557 243,858 292,660 Outstanding amount of Hong Kong dollar debt - (35.6) (30.0) (20.0) instruments, other than Exchange Fund Bills and Notes'" 外匯基金票據及債券的未償還總額 58,730 91,850 101,650 97,450 Outstanding amount of Exchange Fund Bills and (12.2) (56.4) (10.7) (-4.1) Notes 外匯基金票據及債券以外的新發行港元債務工具⑴ 58,683 70,714 99,540 95,746 New issues of Hong Kong dollar debt - (20.5) (40.8) (-3.8) instruments, other than Exchange Fund Bills and Notes'" 外匯基金票據及債券的平均每日成交金額 17,194 16,320 16,506 9,075 Average daily turnover of Exchange Fund Bills (-22.9) (-5.1) (1.1) (-45.0) and Notes 註釋:括號內的數字是與上年比較的變動百分率° Notes : Figures in brackets are percentage changes over the
preceding year. (I) 數字由香港金融管理局自一九九五年開始 (1) Figures were first available from the Hong Kong
提供� Monetary Authority in 1995.
服務業統計摘要一九九九年 105

表4.9 認可基金⑴數目及資產 _ Table 4.9 Number and Net Asset Value of Authorized Funds�
百萬美元(另有註明除外) US$ million, unless otherwise specified
1990 1991 1992 1993 1994
認 可 單 位 信 託 及 互 惠 基 金 數 目 8 1 9 920 856 901 903 Number of authorized unit trusts and mutual - (12.3) (-7.0) (5.3) (0.2) funds �
香 港 成 立 1 5 7 139 101 76 73 Domiciled in Hong K o n g � - (-11.5) (-27.3) (-24.8) (-3.9) 香港以外地區成立 662 781 755 825 830 Domiciled outside Hong Kong - (18.0) (-3.3) (9.3) (0.6)
認可單位信託及互惠基金資產淨値 25,777 28,769 28,655 45,494 56,568 Net asset value of authorized unit trusts and - (11.6) (-0.4) (58.8) (24.3) mutual funds
香港成立 2,630 1,8!8 977 1,729 10,630 Domiciled in Hong K o n g � - (-30.9) (-46.2) (76.9) (514.9) 香港以外地區成立 23,147 26,951 27,678 43,765 45,939 Domiciled outside Hong Kong - (16.4) (2.7) (58.1) (5.0)
1995 1996 1997 1998 認 可 單 位 信 託 及 互 惠 基 金 數 目 1 007 1 219 1 356 1 526 Number of authorized unit trusts and mutual (11.5) (21.1) (11.2) (12.5) funds(2>
香港成立(3) 75 77 77 71 Domiciled in Hong Kong'" (2.7) (2.7) (0.0) (-7.8) 香港以外地區成立 932 1 142 1 279 1 455 Domiciled outside Hong Kong (12.3) (22.5) (12.0) (13.8)
認可單位信託及互惠基金資產淨値 82,361 97,594 132,383 183,092 Net asset value of authorized unit trusts and (45.6) (18.5) (35.6) (38.3) mutual funds
香 港 成 立 3 , 9 0 7 2,994 1,991 2,116 Domiciled in Hong K o n g � (-63.2) (-23.4) (-33.5) (6.3) 香港以外地區成立 78,454 94,601 130,391 180,976 Domiciled outside Hong Kong (70.8) (20.6) (37.8) (38.8)
註釋:括號內的數字是與上年比較的變動百分率“ Notes : Figures in brackets are percentage changes over the preceding year.
(1) 指證券及期貨事務監察委員會認可的基 (1) Figures refer to funds authorized by the Securities 金‘該會於一九乂V九年五月成立“ and Futures Commission, which was established in
May 1989. ( 2 ) 指該年度三月底的數字 � (2) Figures refer to end March of the corresponding
year. (3) 如個別基金的合法信託人於香港依據法律 (3) A fund IS domiciled in Hong Kong if its legal
成立’該基金便屬在香港成立“ trustee has Hong Kong as the place of legal domicile.
5 8 Statistical Digest of the Services Sector 1999

圓 4 . 5 認可基金⑴數目及資產淨値
Chart 4.5 Number and Net Asset Value of Authorized Funds�
認可基金資產淨値(百萬美元)
認可基金數目 Net asset value of authorized funds Number of authorized funds (US$ million)
1 — ' ' -' I • II .III I • •、- .、.、•——,冊—………、..…f … 、 … … … � • W — ... .V.. . . . 、•••.... . '.'.Vrt- A-N-V. —、.-...V.-. . . •‘ - ^^^^
IF] _ j / ' - 160,000
1 200 门 ― …
_ _ m y / :^ 120,000 800 一 " P ^ *瑪 人 V , . ' 一 ; >
:.. J ^ - 80,000
凝 絲: _ . 彻—• — ‘ 豪 … . . 二 — . -00
。 _ • .: ? 1 ii �
1990 1991 1992 1993 1994 1995 1996 1997 1998 [=•認可基金數目 認可基金資產淨値
Number of authorized funds^ Net asset value of authorized funds
註釋:(1) 指證券及期貨事務監察委員會認可的基 Notes: (1) Figures refer to funds authorized by the Securities 金 ° 該i;^一九八无年五角成立“ and Futures Commission, which was established in
May 1989. ( 2 )指該年度三月底的數字。 (2) Figures refer to end March of the corresponding
year.
服務業統 i t摘要一九九九年 55

表 4 . 1 0 金融市場及基金管理業的選定最新統計數字
Table 4.10 Selected Up-to-date Statistics on Financial Markets and Fund Management Services
百萬元(另有註明除外) $ million, unless otherwise specified
1998 1999 第一季 第二季 第三季 第四季 第一季 Q1 ^ Q3 Q4 ^
機構單位數目 2 247 2 211 2 233 2 107 2 282 Number of establishments
就業人數 25 286 24 690 23 868 24 009 25 584 Number of persons engaged 業務收益指數(1996=100) 92 .0 88.6 92 .2 100.3 68.6 Business receipts index (1996=100)
香港聯合交易所 The Stock Exchange of Hong Kong
上市公司數目 663 667 674 680 681 Number of listed companies
中國國有企業 4 0 4 1 4 1 4 1 4 1 Chinese state owned companies 其他 623 626 633 639 640
Others 上市公司總市値 3,224,386 2,358,298 2,150,540 2,661,713 2,772,276 Total market capitalization
中國國有企業 57,425 36,127 31,238 33,533 29,705 Chinese state owned companies 其他 3,166,961 2,322,171 2,119,302 2,628,180 2,742,571 Others 以總市値計在世界的排名 10 12 13 11 11 Ranking in the world in terms of market capitalization
收益率及市盈率 Yield and price earning ratio
所有普通股指數的平均股息收益率(%) 3.5 4.9 4.9 3.7 3.3 Average dividend yield of AOI (%) 所有普通股指數的平均市盈率 11.8 8.1 8.1 10.7 13.6 Average price earning ratio of AOI
5 8 Statistical Digest of the Services Sector 1999
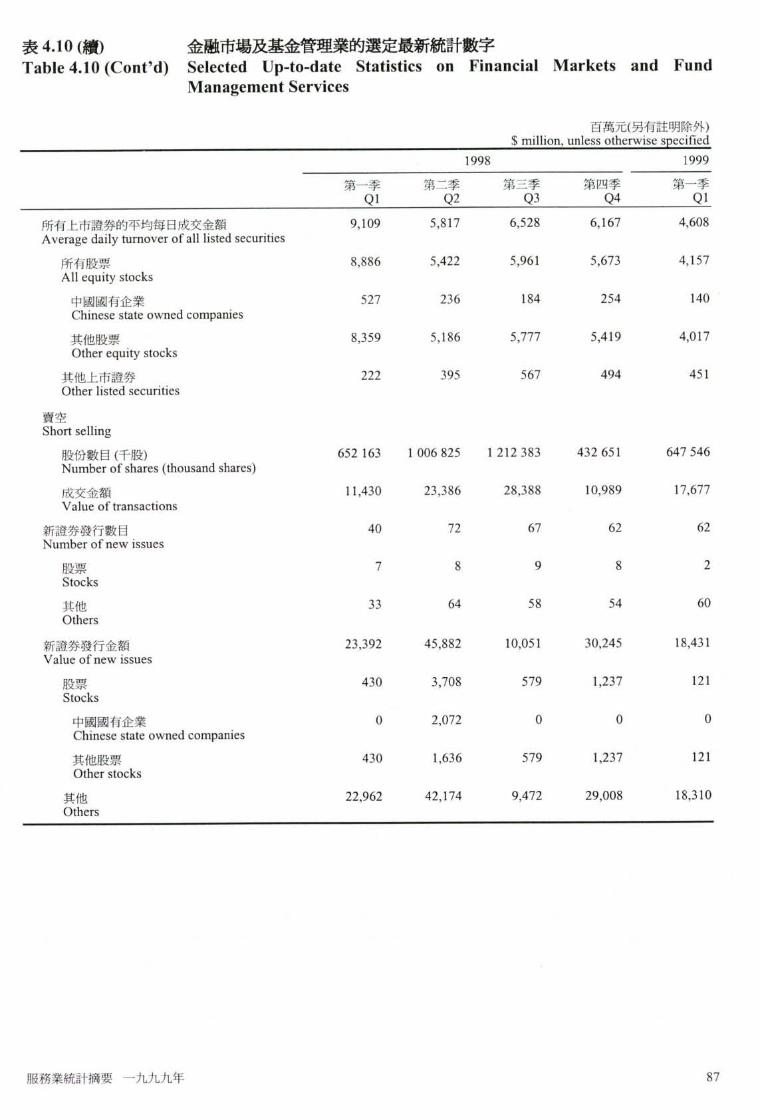
表4.10 (總) 金融市場及基金管理業的選定最新統計數字 Table 4.10 (Cont'd) Selected Up-to-date Statistics on Financial Markets and Fund
Management Services 百萬元(另有註明除外)
$ million, unless otherwise specified 1998 1999
第一季 第二季 第三季 第四季 第一季 Ql Q2 Q3 ^ ^
所有上市證券的平均每日成交金額 9,109 5,817 6,528 6,167 4,608 Average daily turnover of all listed securities
所有股票 8,886 5,422 5,961 5,673 4,157
All equity stocks 中國國有企業 527 236 184 254 140
Chinese state owned companies 其他股票 8,359 5,186 5,777 5,419 4,017
Other equity stocks 其他上市證券 222 395 567 494 451
Other listed securities 賣空 Short selling
股份數目(千股) 652 163 1 006 825 1 212 383 432 651 647 546
Number of shares (thousand shares) 成交金額 11,430 23,386 28,388 10,989 17,677
Value of transactions 新證券發行數目 40 72 67 62 62
Number of new issues 股票 7 8 9 8 2
Stocks 其他 33 64 58 54 60
Others 新證券發行金額 23,392 45,882 10,051 30,245 18,431
Value of new issues 股票 430 3,708 579 1,237 121
Stocks 中國國有企業 0 2,072 0 0 0 Chinese state owned companies 其他股票 430 1,636 579 1,237 121
Other stocks 其他 22,962 42,174 9,472 29,008 18,310
Others
服務業統 i t 摘要一九九九年 55

表4.10 (續) 金融市場及基金管理業的選定最新統計數字
Table 4.10 (Cont'd) Selected Up-to-date Statistics on Financial Markets and Fund Management Services
1998 1999 第一季 _ 第二季 第三季 第四季 第一季 ^ Q2 Q3 Q4 Q]_
香港期貨交易所 Hong Kong Futures Exchange
平均每日成交量(合約張數) Average daily turnover (contracts) 恆生指數期貨 27 216 30 692 32 178 23 164 26 188
Hang Seng Index futures ®生指數期權 3 146 3 400 3 422 3 031 3 717
Hang Seng Index options 股票期貨 14 27 13 13 14
Stock futures 曰轉期匯 108 83 66 22 24
Rolling Forex futures 三個月港元銀行同業拆息期貨 1 648 2 547 2 553 1 412 1846
Three-month HIBOR futures 一個月港元銀行同業拆息期貨 - - - 88 31 One-month HIBOR futures 紅簿期貨 1 068 771 611 330 221
Red-chip futures 紅第期權 4 3 13 14 0 Red-chip options 期交所台灣指數期貨 - 3 0 0 0 HKFE Taiwan Index futures 期交所台灣指數期權 - 2 0 0 0 HKFE Taiwan Index options 恆生 100 期貨 - - 255 219 286 Hang Seng 100 futures 恆生100期權 - 55 69 149 Hang Seng 100 options
金銀業貿易場的黃金買賣 Gold trading in the Chinese Gold and Silver Exchange Society
買賣報價(以每兩港元計) 2,764 2,721 2,694 2,652 2,588 Trading price ($/tael) 平均每日成交量 Average daily turnover
價値(百萬元) 144 137 108 69 60 Value ($ million) 數量(兩) 53 000 49 500 40 900 25 400 22 800
Quantity (tael)
5 8 Statistical Digest of the Services Sector 1999

資料來源 Data Sources 表 資料來源 Table Sources 4.1 政府統計處 4.1 Census and Statistics Department 4.2 證券及期貨事務監察委員會 4.2 The Securities and Futures Commiss ion 4 .3 -4 .5 香港聯合交易所有限公司 4 .3 -4 .5 The Stock Exchange of Hong Kong
Limited 4.6 香港期貨交易所有限公司 4.6 Hong Kong Futures Exchange Limited 4.7 金銀業貿易場 4.7 The Chinese Gold and Silver Exchange
Society 4.8 香港金融管理局 4.8 Hong Kong Monetary Authority 4.9 證券及期貨事務監察委員會 4.9 The Securities and Futures Commiss ion
其他有關刊物 Further References 年幸艮,金銀業貿易場編製 Annual Report, published by The Chinese Gold and
Silver Exchange Society 年報,香港期貨交易所有限公司編製 Amua! Report, published by Hong Kong Futures
Exchange Limited 年 幸 艮 ‘ 香 港 金 融 管 理 局 編 製 Annual Report, published by Hong Kong Monetary
Authority 年報’證券及期貨事務監察委員會編製 Annua! Report, published by The Securities and Futures
Commission 年報‘香港聯合交易所有限公司編製 Annual Report, published by The Stock Exchange of
Hong Kong Limited 就業及空缺統言備細統計表) Employment and Vacancies Statistics (Detailed Tables) 本地生產總値估計 Estimates of Gross Domestic Product 香港統計年干U Hong Kong Annual Digest of Statistics 香港統計月干fj Hong Kong Monthly Digest of Statistics 服務行業按季業務收益指數 Quarterly Business Receipts Indices for Service
Industries 就業、空缺及薪金總額按季統計報告 Quarterly Report of Employment, Vacancies and
Payroll Statistics 本地生產總値估計按季幸艮告 Quarterly Report of Gross Domestic Product Estimates 倉庫、通訊、財務、保險及商用服務按年統計 Report on Annual Survey of Storage, Communication, 調査幸艮告 Financing, Insurance & Business Services 股市資料‘香港聯合交易所有限公司編製 Stock Exchange Fact Book, published by The Stock
Exchange of Hong Kong Limited
服務業統it摘要一九九九年 55

5 進出口貿易業
Import and Export Trade Services 槪要 Highlights 作爲全球十大貿易市場之一,香港的進出口 As one of the ten largest trading economies in the 貿易業充滿活力’而且實力雄厚。一九九八 world,Hong Kong has a vibrant and strong import and 年 , 在 港 經 營 的 進 出 口 貿 易 機 構 單 位 約 export trade sector. In 1998, there were 93 000 93 000 間’僱用超過 472 000 人’其中包括 import/export trading establishments in Hong Kong, 在進出口貿易公司工作的全職僱員或兼職員 which were supported by a workforce of over 472 000 工(例如經紀),以及外發工人。 people. These people included those who worked in
the import/export firms either as full-time employees or part-time workers (such as commission agents) and the out-workers.
進出•貿易業在一九九七年的生產淨値約 The import and export trade industry produced a net 2 ,177 億元,較八九年增力口超過 190% ;其增 output of about $217.7 billion in 1997, an increase of 加價値佔九七年本地生產總値的 17.6% ° over 190% over 1989. It 's value added accounted for
17.6% of Hong Kong's Gross Domestic Product (GDP) in 1997.
一九九八年’香港處理了 27 ,770 億元的進出 In 1998,Hong Kong handled the import and export of 口 貨品’以總價値計算’較九七年減少 10% ° $2,777 billion in goods, representing a drop of 10% in 雖然大部分進口及出口皆經由進出口貿易業 total value compared to 1997. Most of the imports 處理’但有部分是由其他行業處理’例如製 and exports were handled by the import and export 造商沒有經進出口貿易公司而直接出口其產 trade industry, though some of them were handled by 品或入口原材•料“ other industries, e.g. manufacturers exporting their
products or importing raw materials directly without going through import/export firms.
一九九八年的整體出口貨値(包括港產品出 Total exports (comprising domestic exports and re-口和轉 口貨品)下跌 7%至 13,480 億元。港產 exports) in 1998 went dov/n by 7% in value terms to 品出口及車專口貨品則分別下降 11%及 7 % � $1,348 billion, while domestic exports and re-exports 出口的減少’主要是由於香港最重要的貿易 dropped by 11% and 7% respectively. The 夥伴中國內地、美國和日本的進口需求放緩 contraction in exports was mainly due to the 戶斤致 ° slowdown in import demand from the mainland of
China, the United States and Japan, which were Hong Kong 's most important trading partners.
一九九一至九八年期間’港產品出口 出現負 Over the years from 1991 to 1998,there was negative 增長(-1 8 % )’ 但轉口貨品卻有 117 % 的強勁 growth in domestic exports (-18%) but strong growth 增長;導致這現象的主因’是本地製造業的 in re-exports (117%). This was largely attributable to 生產程序遷往中國內地。由於在這安排下’ the relocation of local manufacturing activities to the 在中國內地生產的貨品大部分均會運回香 mainland of China. Because most of the goods
服務業統it摘要一九九九年 55

港,再轉口 給買家,因此港產品出 口下降 ’ produced in the mainland o f C h i n a under such kind of 而同期車專 口貨品則大幅增力口 “ arrangement were sent back to Hong Kong before they
were re-exported to the buyers, there was a decline in domestic exports but a concurrent marked increase in re-exports.
一九九八年’進 口貨品的跌幅超過出口’以 In 1998, imports of goods recorded an even sharper 價値計算減少 12 % ’ 爲 1 4, 2 90 億元。在很大 decline than exports, falling by 12% in value terms to 程度上’進 口減少的原因’是轉口表現呆滯’ $1,429 billion. To a considerable extent, the drop in 以及本地需求疲 | § ° imports was caused by the sluggish re-export
activities, associated with the weak domestic demand.
5 8 Statistical Digest of the Services Sector 1999

主要統計數字 Key Statistics
百萬元(另有註明除外) $ million, unless otherwise specified
進出口貿易業 Import and Export Industry 年 機構單位數目⑴ 就 業 人 數 增 加 價 値 業務收益指數
(2>
Year Number of Number of persons Value added Business receipts establishments � engaged � index'!)
(1996=100) 1989 [53 613] [297 936] 73,065 -1990 [59 491] [329 585] 85,593 -1991 69 066 369 723 101,999 -1992 75 244 388 195 119,806 68.3 1993 86 479 433 615 145,646 74.3 1994 104 881 512 122 162,124 84.5 1995 107 784 524 676 184,571 97.3 1996 104 076 529 478 207,128 100.0 1997 101 324 514 904 217,712 103.6 1998 92 604 472 431 N.A. 90.5
註釋:(1) 一九九一年及以後的數字是該 t內四季的 Notes : (1) Figures for 1991 and onwards are averages of the 估言十數字的平均數’而九一年以前白勺數字是 four quarterly estimates of the year, whereas those 指該年六月底的 1 青況� prior to 1991 refer to the position as at end June of
the corresponding year. ( 2 )業務收益指數於一九九二統計年度開始編 (2) Business receipts indices were first available in the
製“ reference year 1992. []一九九一年前的數字的涵蓋範圍與其後的 [ ] F i g u r e s prior to 1991 are slightly different in
略有不同’因此不可將兩組數字i乍嚴格比 coverage and therefore are not strictly comparable 較� with those for 1991 and onwards.
服務業統 i t摘要一九九九年 55

主要統計數字(續) Key Statistics (Cont'd.)
百萬元(另有註明除外) $ million, unless otherwise specified
港產品出口 年 進口貨値 進口貨値指數港產品出口貨値 貨値指數 轉口貨値 轉口貨値指數
Year Import value Value index Domestic Value index Re-export Value index for for imports export value for domestic value re-exports (1990=100) exports (1990=100)
(1990=100) 1989 562,781 87.6 224,104 99.2 346,405 83.7 1990 642,530 100.0 225,875 100.0 413,999 100.0 1991 778,982 121.2 231,045 102.3 534,841 129.2 1992 955,295 148.7 234,123 103.7 690,829 166.9 1993 1,072,597 166.9 223,027 98.7 823,224 198.8 1994 1,250,709 194.7 222,092 98.3 947,921 229.0 1995 1,491,121 232.1 231,657 102.6 1,112,470 268.7 1996 1,535,582 239.0 212,160 93.9 1,185,758 286.4 1997 1,615,090 251.4 211,410 93.6 1,244,539 300.6 1998 1,429,092 222.4 188,454 83.4 1,159,195 280.0
5 8 Statistical Digest of the Services Sector 1999

槪念及方法 Concepts and Methods 香港的對外貿易統計是根據進出口報關表上的 Hong Kong ' s external trade statistics are compiled 資料編製。《中華人民共和國香港特別行政區基 based on information contained in import/export 本法》說明,香港特別行政區爲單獨的關稅地 declarations. The Hong Kong Special Administrat ive 區°香港與中國內地之間的貿易’亦須辦理進出 Region is a separate customs territory, as stated in 口報關。有關的統計資料’亦包括在香港的對外 "The Basic Law of the Hong Kong Special 貿易統計數字內 ° Administrative Region of the People ' s Republic of
China". Import/export declaration is also required for Hong Kong ' s trade with the mainland of China, and statistics relating to this are included in Hong K o n g ' s external trade statistics.
對外貿易統計數字劃分爲(一)進口 ;(二)港產品 Statistics on external trade are classified into (a) 出口以及(三)轉口。貨値或貨量可用作量度對外 imports, (b) domestic exports and (c) re-exports. 貿易的變動。貿易業務一般是按運輸方式、貨品 External trade can be measured in terms of value or 類別及貿易夥伴國家來劃分以方便分析。近年, volume. To facilitate analysis, trade services are 涉及外發中國內地加工的貨品的貿易在香港對 usually classified according to transport mode, goods 夕 貿易總貨量中也佔一重要角色� types and country of trade partners. In recent years,
trading of goods related to outward processing in the mainland of China also played a very important role in the total volume of Hong Kong ' s external trade.
除傳統的進出口貿易公司外’ 易業亦包 In addition to traditional import and export trading 括那些營運性質由製造業轉爲貿易業的公司’及 firms, import and export trade industry also covers 從事分判製造工序予香港以外地方的進出口貿 those firms which have shifted their operational status 易公司� from manufacturing to trading, and import and export
trading firms which have been engaged in sub-contract processing arrangement in places outside Hong Kong.
不少本港製造商分判製造工序’把那些勞工密集 Many local manufacturers have been relocating their 及較低增加價値的製造工序遷移至香港以外地 labour-intensive and lower value added 方°部分製造商把涉及較高技術及較先進科技的 manufacturing processes outside Hong Kong through 生產工序保留在香港廠房進行°不少其他製造商 sub-contract processing arrangement. Some 把整個生產工序遷往香港以外地方,在香港的公 manufacturing firms retain their local operation 司則祇保留其他非生產功能’例如市場銷售、訂 processes which involve higher skill and more 單處理、材料採購、設計、產品發展、品質控制、 advanced technology. In many other cases, 包裝及後勤服務等°雖然這些香港公司會爲香港 essentially all manufacturing processes are moved to 以外的生產活動提供技術支援服務’但它們已由 places outside Hong Kong, leaving only such 生產商轉爲月艮務供應商� functions as marketing, orders processing, materials
sourcing, design, product development, quality control, packaging and logistics with the local firms. Hence the local firms have shifted f rom being manufacturers to service-providers, although they may provide technical support services to the manufacturing activities outside Hong Kong.
服務業統it摘要一九九九年 55

此外,不少傳統的進出口貿易公司在不同程度上 Besides, many traditional import/export firms also 爲香港以夕f白勺生產、?舌動提供技術支援月艮務°另一 render, to various degrees, technical support services 方面’近年本港有不少新公司成立’作爲香港以 to the production outside Hong Kong. On the other 外的新生產機構的香港基地’其經營方式與傳統 hand, quite a large number of new firms were set up in 的進出口公司不同。這等香港貿易公司和香港以 recent years to serve as a local base for new 外的生產機構的關係極爲密切’事實上很多時兩 manufacturing firms outside Hong Kong, operating in 方均由同一企業家擁有” a way somewhat different from traditional
importers/exporters. The local trading firms and the factories outside Hong Kong are highly associated — in fact, they are often owned by the same entrepreneur.
言礦釋義 Definitions of terms
厂至y岸寶激J是指貨物運抵香港時的成本價値’ C.I.F. (cost, insurance and freight) represents the 包括保險費、運費、佣金以及貨物由付運地運到 purchase price (or cost if not bought) of the goods on 本港入口 商時所需的一切費用 “ arrival in Hong Kong, including insurance, freight,
commission and all the other costs, charges and expenses incidental to the sale and delivery of the goods to Hong Kong.
港產品出口貨物爲本港天然產品或在本港經過 Domestic exports are the natural produce of Hong 製造工序’以致基本原料的形狀、性質、式樣或 Kong or the products of a manufacturing process in 效用被永久改變的產品。其貨値是以離岸價計 Hong Kong which has changed permanently the 算� shape, nature, form or utility of the basic materials
used in manufacture. Their values are recorded on f.o.b. (free-on-board) basis.
凝位是指在單一擁有權或控制權(即單一公 An establishment is defined as an economic unit (i.e. a 司名義)下,在單一地點從事一種或主要從事一 unit engaged in the production of goods or services) 種經濟活動(即生產貨物或提供服務)的經濟單 which engages, under a single ownership or control 位� (i.e. under a single company name), in one or
predominantly one kind of economic activity at a single physical location.
「離岸價値J是指貨物在裝載到離港運輸工具上 F. O.B. (free-on-board) represents the selling price (or 時,對海外進口商而言的成本價値’包括賣方利 cost if not sold) of the goods to the customer abroad, 潤、本地運輸、出口包裝、裝載費用、本地保險 including all the other costs, charges and expenses 費、文件費用(包括領事費和配額費)及本地或 accruing up to the point where the goods are loaded on 海夕•H'戈理人的佣金 ° board the exporting carrier. Other costs, charges and
expenses generally consist of seller's profit, local transportation cost, export packing costs, loading charges, local insurance charges, documentation fees (including consular fee and quota charges), and commissions payable to local or overseas agency.
5 8 Statistical Digest of the Services Sector 1999

本地生產總値是指一個國家或地區的所有常住 Gross Domestic Product (GDP) is a measure of the 生產單位’在一個指定的期間內,未扣除固定資 total value of production of all resident producing 本消耗的生產'總f直 ° units of a country or territory in a specified period,
before deducting allowance for consumption of fixed capital.
:^產激源包括從銷售貨物所賺得的毛利、租金收 Gross output consists of margin on sales of goods, 入、佣金、各類收費及其他月S務收費“銷售中所 rentals, commissions, fees and other service charges. 賺得的毛利是相等於貨物的售價和已扣除物價 The margin on sales is equal to the sales value less the 升値的貨物成本之間的差額。 cost of goods sold which is adjusted for price
appreciation.
爲在香港以外出產或製成的貨品,輸入 Imports are goods which have been produced or 香港供本地使用或轉口 ’以及再進•的香港產 manufactured in places outside the jurisdiction of 品》其貨値是以到岸價計算 ° Hong Kong and brought into Hong Kong for domestic
use or for subsequent re-export as well as Hong Kong products re-imported. Their values are recorded on c.i.f. (cost, insurance and freight) basis.
中國內地外發加工是指以合約安排介於香港及 Outward processing (OP) in the mainland of China is 中國內地所進行的生產程序。其安5#受以下的限 defined as a contractual agreement between a Hong 制:(一)其中原料或半製成品全部或部分須由香 Kong party and a party in the mainland of China to 港方面供應。(二)其中的製成品須運回香港本地 carry out production processing in the mainland, 銷售或車專口往香港以夕i•國家“ which is subject to the following conditions : (a) the
raw materials or semi-manufactures required have to be supplied wholly or partly by the Hong Kong party; and (b) the processed goods have to be returned to Hong Kong for local consumption or export to an overseas country.
就業人數包括積極參與機構單位工作的在職東 Persons engaged in an establishment include working 主及股東;在統計日期受僱於機構單位的全職僱 proprietors and partners actively engaged in the work 員’包括長期或臨時聘用的’無論這些僱員正在 o f t h e establishment; full-time employees paid by the 開工或因事假或者病假而暫時缺勤;及在統計日 establishment on the survey reference date, both 期工作三小時或以上的兼職僱員和無酬家屬幫 permanent and temporary, who are either at work or 工� on vacation or sick leave; and part-time employees
and unpaid family workers working three hours or more on the survey reference date.
轉口貨品是指輸出曾經自外地輸入本港的貨 Re-exports are products which have previously been 品’而這些貨品在本港並未經過導致其形狀、性 imported into Hong Kong and which are re-exported 質、式樣或效用永久改變的工序。其貨値是以離 without having undergone in Hong Kong a 岸價計算 ° manufacturing process which has changed
permanently the shape, nature, form or utility of the product. Their values are recorded on f.o.b. (free-on-board) basis.
服務業統it摘要一九九九年 55

貨量指數的計算方法是首先計算各個市場中個 Quantum indices are obtained by first deflating trade 別貨品項目的平減價格貨値’而整體貨品的平減 values at the sub-class-country level by their 價格貨値是由個別貨品項目的平減價格貨値相 corresponding unit value indices to derive the deflated 加而得來。貨量指數則根據各項貨品的平減價格 values. Deflated values for higher levels of 貨値與基期比較而計算出來 ° aggregation are then obtained by summing up the
deflated values of the components. The quantum indices based on changes in the deflated values with respect to the base period can then be derived.
分判製造工序予中國內地的活動是指香港機構 Sub-contract processing arrangement in the mainland 與中國內地機構根據合約安排將生產工序由香 of China (SPAC) is defined as a contractual agreement 港分判予中國內地進行,不論生產所需的原料或 between a party in Hong Kong and a party in the 半製成品是否由港方提供,或有關製成品是否運 mainland of China whereby the Hong Kong party 返香港 ° places an order with the party in the mainland of
China to cany out production processing in the mainland, regardless of whether the raw materials or semi-manufactures required are supplied by the Hong Kong party, or the processed goods are returned to Hong Kong.
I易罩位當搭潜激的計算方法’首先是根據貿易 The trade unit value index is obtained by first 統計所得的貨品單位價格及進出口價格調查所 computing the price relative (based on unit values and 得的貨品實際價格,計算出計算期與上年度的貨 product specification price data) in the current period 品價格對比’再用上年度的貿易貨値作爲權數 ’ over that in the previous year, and then using the trade 將計算期的各項貨品價格對比合成指數 ° values in the previous year as weights to aggregate the
price relatives of different commodity items.
J"會力/7•是生產總額減去中間投產消耗(生產過 Value added is defined as the value of gross output 程中所耗用的貨物和服務的價値 ) less the value of intermediate consumption (the value
of goods and services used up in the course of production).
5 8 Statistical Digest of the Services Sector 1999

統計圓表 Statistical Tables and Charts 表 5 . 1 進出口貿易業的機構單位數目、就業人數、業務收益指數、生產總額及增加價値
Table 5.1 Number ofEstablishments and Persons Engaged, Business Receipts Index, Gross Output and Value Added of the Import and Export Trade Industry
百萬元(另有註明除外) $ million, unless otherwise specified
1989 1990 1991 1992 1993 機構單位數目(I) [53 613] [59 4 9 1 ] 69 0 6 6 75 2 4 4 86 4 7 9 Number of establishments'" (12.6) (11.0) (16.1) (8.9) (14.9)
就業人數⑴ [ 2 9 7 9 3 6 ] [ 3 2 9 5 8 5 ] 3 6 9 7 2 3 3 8 8 1 9 5 4 3 3 6 1 5 Number of persons engaged'" (9.6) (10.6) (12.2) (5.0) (11.7) 業務收益指數(2>( 19% = 1 0 0 ) - - - 68 .3 74 .3 Business receipts index''' (1996 = 100) - (8.8) 生產總額 152,438 191,868 219,840 218,811 271,157 Gross output (18.5) (25.9) (14.6) (-0.5) (23.9) 增加價値 73,065 85,593 101,999 119,806 145,646
Value added (11.4) (17.1) (19.2) (17.5) (21.6) 在以要素成本計算的本地生產總値內所佔比率(%) 1 4 . 6 1 5 . 3 1 6 . 2 1 6 . 4 1 7 . 5 Contribution to GDP at factor cost (%) 增加價値在生產總額所佔比率 4 7 . 9 4 4 . 6 4 6 . 4 5 4 . 8 5 3 . 7 Value added as % of gross output
註釋:括號內的數字是同上年比較的變動百分率� Notes : Figures in brackets are percentage changes over the preceding year.
(1) 一九九一年及以後的數字是該年內四季的 i l ) Figures for 1991 and onwards are averages of the 估計數字的平均數’而九一年以前的數字是 four quarterly estimates of the year, whereas those j:旨該年六月 J白务丨青況� prior to 1991 refer to the position as at end June of
the corresponding year. ( 2 )業務收益指數於一九九二統計年度開始編 (2) Business receipts indices were first available in the
^ » reference year 1992. []一九九一年前的數字的涵蓋範圍與其後的 [ ] F i g u r e s prior to 1991 are slightly different in
略有不同’因此不可將兩組數字作嚴格比 coverage and therefore are not strictly comparable 較� with those for 1991 and onwards.
服務業統 i t摘要一九九九年 55

表 5 . 1 (續) 進出口貿易業的機構單位數目、就業人數、業務收益指數、生產總額及增加
價値 Table 5.1 (Cont'd.) Number of Establishments and Persons Engaged, Business Receipts
Index, Gross Output and Value Added of the Import and Export Trade Industry
百萬元(另有註明除外) $ million, unless otherwise specified
1 9 ^ 1996 1997 1998 機構單位數目⑴ 1 0 4 8 8 1 1 0 7 7 8 4 1 0 4 0 7 6 1 0 1 3 2 4 9 2 6 0 4 Number of establishments� (21.3) (2.8) (-3.4) (-2.6) (-8.6)
就業人數⑴ 5 1 2 1 2 2 5 2 4 6 7 6 5 2 9 4 7 8 5 1 4 9 0 4 4 7 2 4 3 1 Number of persons engaged'" (18.1) (2.5) (0.9) (-2.8) (-8.2)
業務收益指數 1996= 100) 84.5 97.3 100.0 103.6 90.5 Business receipts index''' (1996 = 100) (13.7) (15.1) (2.7) (3.6) (-12.6)
生產總額 306,607 335,198 366,585 392,794 N.A. Gross output (13.1) (9.3) (9.4) (7.1) N.A.
增加價値 162,124 184,571 207,128 217,712 N.A. Value added (11.3) (13.8) (12.2) (5.1) N.A.
在以要素成本計算的本地生產總値內所佔比率(%) 1 7 . 1 1 8 . 2 1 8 . 3 1 7 . 6 N . A . Contribution to GDP at factor cost (%) 增加價値在生產總額所佔比率 5 2 . 9 5 5 . 1 5 6 . 5 5 5 . 4 N . A . Value added as % of gross output
註釋:括號內的數字是同上年比較的變動百分率� Notes : Figures in brackets are percentage changes over the preceding year.
(1) 一^九一年及以後的數字是該年內四季的 (1) Figures for 1991 and onwards are averages of the 估計數字的平均數’而九一年以前的數字是 four quarterly estimates of the year, whereas those 指該年六月底的情況” prior to 1991 refer to the position as at end June of
the corresponding year. ( 2 )業務收益指數於一九九二統計年度開始編 (2) Business receipts indices were first available in the
製� reference year 1992.
5 8 Statistical Digest of the Services Sector 1999

圖 5 . 1 進出口貿易業的機構單位數目<”及就業人數">
Chart 5.1 Number of Establishments'" and Persons Engaged� in the Import and Export Trade Industry
機構單位數目 就業人數 Number of establishments Number of persons engaged
120 000 600 000
1。。_ … 圓 树 5 。 。 _
60 000 … _ ——_ • — — _ • — — • — — _ ——_ - - 300 000
40 000 - … 議 關 — — 議 圓 ^ 圓 國 議 —200000
20 000 一-瞧 ^ X ^ ^ ——^ ^ 謹 - - 1 0 0 0 0 0
。丨 _ M M M : _ _ M M1� 1991 1992 1993 1994 1995 1996 1997 1998
^ 機 構 單 位 數 目 就業人數 Number of establishments Number of persons engaged 註釋:(1) 數字是該年內四季的估計數字的平均數° Note: (1) Figures are averages of the four quarterly
estimates of the year.
服務業統 i t摘要一九九九年 55

表 5 . 2 貿易指數 Table 5.2 Trade Index Numbers
(1990= 100) 1989 1990 1991 1992 1993
進口 Imports
貨値指數 8 7 . 6 1 0 0 . 0 1 2 1 . 2 1 4 8 . 7 1 6 6 . 9 Value index 單位價格指數 9 7 . 6 1 0 0 . 0 1 0 1 . 9 1 0 2 . 1 1 0 1 . 5 Unit value index 貨量指數⑴ 8 9 . 7 1 0 0 . 0 1 1 9 . 0 1 4 5 . 5 1 6 4 . 1 Quantum index*"
港產品出口 Domestic exports
貨値指數 9 9 . 2 1 0 0 . 0 1 0 2 . 3 1 0 3 . 7 9 8 . 7 Value index 單位價格指數 9 8 . 7 1 0 0 . 0 1 0 1 . 9 1 0 2 . 9 1 0 3 . 2 Unit value index 貨量指數0) 1 0 0 . 5 1 0 0 . 0 1 0 0 . 5 1 0 0 . 6 9 6 . 1 Quantum i n d e x �
轉口 Re-exports
貨値指數 8 3 . 7 1 0 0 . 0 1 2 9 . 2 1 6 6 . 9 1 9 8 . 8 Value index 單位價格指數 9 7 . 1 1 0 0 . 0 1 0 2 . 2 1 0 3 . 0 1 0 2 . 4 Unit value index 貨量指數 8 6 . 2 1 0 0 . 0 1 2 6 . 6 1 6 2 . 4 1 9 4 . 3 Quantum i n d e x �
註釋:(1)從一九九一年起的貨量指數’因採用 了新方 Note : (1) Quantum indices for 1991 onwards are not strictly 法編製’故不能與該年以前的數字作嚴格比 comparable with those for earlier years due to 較” adoption of a new method for compilation of
quantum indices.
5 8 Statistical Digest of the Services Sector 1999

表 5 . 2 (總) 貿易指數 Table 5.2 (Cont'd.) Trade Index Numbers
(1990= 100) 1994 1995 1996 1997 1998
進口 Imports
貨値指數 194.7 232.1 239.0 251.4 222.4 V^alue index 單位價格指數 1 0 4 . 3 1 0 9 . 5 1 0 8 . 1 1 0 5 . 6 1 0 0 . 4 Unit value index 貨量指數(') 187.1 212.8 222.0 238.0 221.1 Quantum i n d e x �
港產品出口 Domestic exports
貨値指數 9 8 . 3 1 0 2 . 6 9 3 . 9 9 3 . 6 8 3 . 4 Value index 單位價格指數 1 0 4 . 8 1 0 7 . 3 1 0 7 . 6 1 0 5 . 1 1 0 2 . 1 Unit value index 貨量指數⑴ 9 3 . 9 9 5 . 7 8 7 . 7 8 9 . 6 8 2 . 5 Quantum index'''
轉口 Re-exports
貨値指數 229.0 268.7 286.4 300.6 280.0 Value index 單位價格指數 1 0 3 . 9 1 0 7 . 5 1 0 7 . 0 1 0 5 . 4 1 0 1 . 3 Unit value index 貨量指數(” 221.2 252.9 271.9 290.5 279.7 Quantum i n d e x �
註釋:(1)從一九九一年起的貨量指數’因採用了新方 Note : (1) Quantum indices for 1991 onwards are not strictly 法編製’故不能與該年以前的數字作嚴格比 comparable with those for earlier years due to 較� adoption of a new method for compilation of
quantum indices.
服務業統 i t摘要一九九九年 55

表5.3 香港在世界主要貿易國家的排名位置 Table 5.3 Hong Kong's Position among Leading World Traders
1989 1990 1991 1992 1993
進口 11* 12* 10 10 7*
Imports
出口 11* 11* 10 10 8
Exports %
總計 11* 11* 10 10 8 Total trade
1994 1995 1996 1997 1998
進口 7* 7 7 6 8 Imports
出口 8 9 9* 9 10 Exports
總計 8 8 7* 8 9 Total trade 註釋:上表所列的排名位置是以「世界貿易組織」的資 Note : The ranking of the above table is based on the data
料數據爲根據’因此可能有別於根據其他來源的 released by the "World Trade Organization (WTO)". It 貿統言十數字而言丁定的扫转名 ° may therefore be different from the ranking based on external trade statistics published by other sources.
5 8 Statistical Digest of the Services Sector 1999

表5.4 按貨品類別<”劃分的進口貨値 Table 5.4 Imports by Commodity Section'"
百萬元 $ million 1989 1990 1991 1992 1993
進口 562,781 642,530 778,982 [778,982] 955,295 1,072,597
Imports (12.8) (14.2) (21.2) - (22.6) (12.3) 食物及活動物 32,922 35,588 39,984 [39,496] 43,469 43,235 Food and live animals (5.2) (8.1) (12.4) - (10.1) (-0.5) 飲料及煙草 9,836 13,611 16,093 [16,152] 19,203 18,108 Beverages and tobacco (28.5) (38.4) (18.2) - (18.9) (-5.7) 除燃料外的非食用未加工材料 17,632 15,701 18,859 [19,718] 20,450 18,926 Cnide materials inedible, except fuels (3.5) (-11.0) (20.1) - (3.7) (-7.5) 礦物燃料、滑潤劑及有關物質 13,482 15,654 16,407 [16,331] 18,930 19,493 Mineral fuels, lubricants and related materials (41.6) (16.1) (4.8) - (15.9) (3.0) 動物及植物油、脂肪及蠟 1,041 1,236 1,205 [1,228] 1,133 1,244 Animal and vegetable oil, fats and waxes (32,5) (18.8) (-2.5) - (-7.7) (9.8) 未列入其他分類的化學品及有關產品 43,627 47,802 60,151 [60,806] 67,627 66,836 Chemicals and related products, not elsewhere (-2.3) (9.6) (25.8) - (11.2) (-1.2) classified 主要以材料分類的製成品 145,879 158,293 185,532 [182,443] 207,778 220,253 Manufactured goods classified chiefly by (10.7) (8.5) (17.2) - (13.9) (6.0) materials 機械及運输設備 156,204 179,383 227,045 [227,440] 307,002 377,482 Machinery and transport equipment (8.7) (14.8) (26.6) - (35.0) (23.0) 雜項製成品 139,358 172,376 210,681 [212,468] 265,599 303,058 Miscellaneous manufactured articles (26.7) (23.7) (22.2) - (25.0) (14.1) 未列入其他分類的貨品及交易 2,801 2,887 3,023 [2,899] 4,103 3,961 Commodities and transactions, not elsewhere (17.7) (3.1) (4.7) - (41.5) (-3.5) classified
註釋:括號內的數字是同上年比較的變動百分率� Notes : Figures in brackets are percentage changes over the preceding year.
( 1 )自一九九二年一月起’標準國際貿易分類第 (1) The Standard International Trade Classification 三次修訂版(簡稱分類第三版)’取代了分類 Revision 3 (SITC R3) has been adopted m place of 第二版’作爲貿易統計貨品分類的依據。爲 the Revision 2 (SITC R2) for the classification of 方便與九二年及以後的統計數字作比較.九 trade statistics by commodity as from January 一年的數字已按分類第三版重新編製,並載 1992. Statistics for 1991 have been recompiled in 歹ij於方括號內 ° terms of SITC R3 and are presented in square
brackets in this table to facilitate comparison with the statistics from 1992 onwards.
服務業統計摘要一九九九年 105

表5.4 (繽) 按貨品類別(”劃分的進口貨値
Table 5.4 (Cont'd.) Imports by Commodity Section'" 百萬元 $ million
1994 1995 1996 1997 1998 進口 1’250,709 1,491,121 1,535,582 1,615,090 1,429,092
Imports (16.6) (19.2) (3.0) (5.2) (-11.5) 食物及活動物 50,776 58,195 61,972 65,993 57,483 Food and live animals (17.4) (14.6) (6.5) (6.5) (-12.9) 飲料及煙草 19,178 18,995 18,844 15,697 12,028
Beverages and tobacco (5.9) (-1.0) (-0.8) (-16.7) (-23.4) 除燃料外的非食用未加工材料 23,816 32,398 31,429 30,515 24,601 Crude materials inedible, except fuels (25.8) (36.0) (-3.0) (-2.9) (-19.4) 礦物燃料、滑潤劑及有關物質 24,378 28,660 34,644 31,803 24,795 Mineral fuels, lubricants and related materials (25.1) (17.6) (20.9) (-8.2) (-22.0) 動物及植物油、脂肪及蠟 3,007 4,253 4,435 7,583 8,128 Animal and vegetable oil, fats and waxes (141.8) (41.4) (4.3) (71.0) (7.2) 未列入其他分類的化學品及有關產品 84,122 111,777 105,461 104,598 91,219
Chemicals and related products, not elsewhere (25.9) (32.9) (-5.7) (-0.8) (-12.8) classified 主要以材料分類的製成品 259,536 305,588 308,694 311,903 264,148
Manufactured goods classified chiefly by (17.8) (17.7) (1.0) (1.0) (-15.3) materials 機械及運輸設備 443,633 553,915 568,856 623,665 562,814
Machinery and transport equipment (17.5) (24.9) (2.7) (9.6) (-9.8) 雜項製成品 337,549 372,394 394,582 416,788 378,286
Miscellaneous manufactured articles (11.4) (10.3) (6.0) (5.6) (-9.2) 未列入其他分類的貨品及交易 4,714 4,946 6,665 6,545 5,589 Commodities and transactions, not elsewhere (19.0) (4.9) (34.8) (-1.8) (-14.6) classified
註釋:括號內的數字是同上年比較的變動百分率� Notes : Figures in brackets are percentage changes over the preceding year.
( 1 )自一九九二年一月起’標準國際貿易分類第 (1) The Standard International Trade Classification 三次修訂版(簡稱分類第三版)’取代了分類 Revision 3 (SITC R3) has been adopted in place of 第二版’作爲貿易統計貨品分類的依據°爲 the Revision 2 (SITC R2) for the classification of 方便與九二年及以後的統計數字作比較’九 trade statistics by commodity as from January 一年的數字已按分類第三版重新編製’並載 1992. Statistics for 1991 have been recompiled in 歹IJJ方括號內� terms of SITC R3 and are presented in square
brackets in this table to facilitate comparison with the statistics from 1992 onwards.
110 Statistical Digest of the Services Sector 1999

表5.5 按貨品類別 <”劃分的港產品出口貨値 Table 5.5 Domestic Exports by Commodity Section'"
百萬元 $ million
1989 1990 1991 1992 1993 港產品出口 224,104 225,875 231,045 [231,045] 234,123 223,027 Domestic exports (3.0) (0.8) (2.3) - (1.3) (-4.7)
食物及活動物 2,097 2,341 2,563 [2,530] 2,640 2,498 Food and live animals (4.0) (11.7) (9.5) - (4.4) (-5.4) 飮料及煙草 2,340 3,350 2,990 [2,990] 3,016 2,897 Beverages and tobacco (12.2) (43.2) (-10.8) - (0.9) (-4.0) 除燃料外的非食用未加工材料 2,356 2,155 1,950 [1,958] 1,919 1,674 Crude materials inedible, except fuels (6.7) (-8.5) (-9.5) - (-2.0) (-12.7) 礦物燃料、滑潤劑及有關物質 669 780 1,289 [1,277] 2,091 1,941 Mineral fuels, lubricants and related materials (28.4) (16.7) (65.3) - (63.7) (-7.2) 動物及植物油、脂肪及獵 97 84 55 [76] 113 113 Animal and vegetable oil, fats and waxes (36.9) (-13.6) (-33.8) - (48.1) (0.3) 未列入其他分類的化學品及有關產品 5,347 6,651 7,454 [7,482] 7,686 7,765 Chemicals and related products, not elsewhere (27.1) (24.4) (12.1) - (2.7) (1.0) classified 主要以材料分類的製成品 26,996 26,695 28,064 [27,859] 28,316 28,009 Manufactured goods classified chiefly by (4.5) (-1.1) (5.1) - (1.6) (-1.1) materials 機械及運輸設備 56,235 56,124 59,541 [59,550] 61,437 61,697 Machinery and transport equipment (2.1) (-0.2) (6.1) - (3.2) (0.4) 雜項製成品 125,180 124,806 123,697 [123,883] 122,526 112,342 Miscellaneous manufactured articles (1.7) (-0.3) (-0,9) - (-1.1) (-8.3) 未列入其他分類的貨品及交易 2,786 2,890 3,441 [3,440] 4,381 4,090 Commodities and transactions, not elsewhere (10.6) (3.7) (19.1) - (27.3) (-6.6) classified
註釋:括號內的數字是同上年比較的變動百分率° Notes : Figures in brackets are percentage changes over the preceding year.
(1)自一九九二年一月起’標準國際貿易分類第 (1) The Standard International Trade Classification 三次修訂版(簡稱分類第三版)’取代了分類 Revision 3 (SITC R3) has been adopted in place of 第二版’作爲貿易統計貨品分類的依據°爲 the Revision 2 (SITC R2) for the classification of 方便與九二年及以後的統計數字作比較’九 trade statistics by commodity as from January 一年的數字已按分類第三版重新編製’並載 1992. Statistics for 1991 have been recompiled in 列於方运金內 ° terms of SITC R3 and are presented in square
brackets in this table to facilitate comparison with the statistics from 1992 onwards.
服務業統計摘要一九九九年 105

表5.5 (續) 按貨品類别”劃分的港產品出口貨値 Table 5.5 (Cont'd.) Domestic Exports by Commodity Section�
百萬元 $ million
1994 1995 1996 1997 1998
港產品出口 222,092 231,657 212,160 211,410 188,454 Domestic exports (-0.4) (4.3) (-8.4) (-0.4) (-10.9)
食物及活動物 2,883 2,934 3,087 3,430 1,870 Food and live animals (15.4) (1,7) (5.2) (11.1) (-45.5) 飮料及煙草 2,968 2,878 2,689 2,549 1,590 Beverages and tobacco (2.5) (-3.0) (-6.6) (-5.2) (-37.6) 除燃料外的非食用未加工材料 1,818 2,429 2,014 1,806 1,481 Crude materials inedible, except fuels (8.6) (33.7) (-17.1) (-10.3) (-18.0) 礦物燃料、滑潤劑及有關物質 834 731 327 873 613 Mineral fuels, lubricants and related materials (-57.0) (-12.4) (-55.2) (166.7) (-29.8) 動物及植物油、脂肪及獵 128 247 138 182 122 Animal and vegetable oil, fats and waxes (13.4) (93.2) (-44.1) (31.5) (-32.7) 未列入其他分類的化學品及有關產品 8,418 9,178 8,691 8,077 6,753 Chemicals and related products, not elsewhere (8.4) (9.0) (-5.3) (-7.1) (-16.4) classified 主要以材料分類的製成品 26,455 25,711 24,538 22,350 18,164 Manufactured goods classified chiefly by (-5.6) (-2.8) (-4.6) (-8.9) (-18.7) materials 機械及運輸設備 62,211 68,149 59,360 58,707 46,471 Machinery and transport equipment (0.8) (9.6) (-12.9) (-1.1) (-20.8) 雜項製成品 112,472 115,304 107,193 109,749 108,770 Miscellaneous manufactured articles (0.1) (2.5) (-7.0) (2.4) (-0.9) 未列入其他分類的貨品及交易 3,906 4,097 4,121 3,687 2,621 Commodities and transactions, not elsewhere (-4.5) (4.9) (0.6) (-10.5) (-28.9) classified
註釋:括號內的數字是同上年比較的變動百分率 ° Notes : Figures in brackets are percentage changes over the preceding year.
( 1 )自一九九二年一月起’標準國際貿易分類第 (1) The Standard International Trade Classification 三次修訂版(簡稱分類第三版)’取代了分類 Revision 3 (SITC R3) has been adopted in place of 第二版’作爲貿易統計貨品分類的依據。爲 the Revision 2 (SITC R2) for the classification of 方便與九二年及以後的統計數字作比較’九 trade statistics by commodity as from January 一年的數字巳按分類第三版重新編製’並載 1992. Statistics for 1991 have been recompiled in 歹IJ於方括號內” terms of SITC R3 and are presented in square
brackets in this table to facilitate comparison with the statistics from 1992 onwards.
110 Statistical Digest of the Services Sector 1999

表5.6 按貨品類別⑴劃分的轉口貨値 Table 5.6 Re-exports by Commodity Section'"
百萬元 $ million 1989 1990 1991 1992 1993
轉口 346,405 413,999 534,841 [534,841] 690,829 823,224 Re-exports (25.8) (19.5) (29.2) - (29.2) (19.2)
食物及活動物 11,370 11,423 12,904 [12,529] 13,656 13,172 Food and live animals (2.2) (0.5) (13.0) - (9.0) (-3.5) 飮料及煙草 4,840 8,166 10,726 [10,733] 12,999 12,600 Beverages and tobacco (31.2) (68.7) (31.4) - (21.1) (-3.1) 除燃料外的非食用未加工材料 12,684 9,956 12,746 [13,160] 13,792 13,111 Crude materials inedible, except fuels (2.3) (-21.5) (28.0) - (4.8) (-4.9) 礦物燃料、滑潤劑及有關物質 3,553 3,391 4,412 [4,377] 5,442 7,550 Mineral fuels, lubricants and related materials (111.8) (-4.6) (30.1) - (24.3) (38.8) 動物及植物油、脂肪及蠟 436 555 482 [489] 529 559 Animal and vegetable oil, fats and waxes (61.2) (27.3) (-13.1) - (8.2) (5.7) 未列入其他分類的化學品及有關產品 24,506 27,175 37,653 [38,026] 43,860 45,330 Chemicals and related products, not elsewhere (-0.6) (10.9) (38.6) - (15.3) (3.4) classified 主要以材料分類的製成品 76,427 87,639 107,784 [105,499] 129,123 143,321 Manufactured goods classified chiefly by (23.1) (14.7) (23.0) - (22.4) (11.0) materials 機械及運輸設備 92,960 108,801 137,056 [137,255] 191,624 258,455 Machinery and transport equipment (20.1) (17.0) (26.0) - (39.6) (34.9) 雜項製成品 118,479 155,653 209,609 [211,329] 277,427 326,656 Miscellaneous manufactured articles (46,0) (31.4) (34.7) - (31.3) (17.7) 未列入其他分類的貨品及交易 1,151 1,242 1,468 [1,444] 2,378 2,469 Commodities and transactions, not elsewhere (23.2) (7.9) (18.3) - (64.6) (3.9) classified
註釋:括號內的數字是同上年比較的變動百分率� Notes : Figures in brackets are percentage changes over the preceding year.
(1)自一九九二年一月起’標準國際貿易分類第 (1) The Standard International Trade Classification 三次修訂版(簡稱分類第三版)’取代了分類 Revision 3 (SITC R3) has been adopted in place of 第二版’作爲貿易統計貨品分類的依據。爲 the Revision 2 (SITC R2) for the classification of 方便與九二年及以後的統計數字作比較’九 trade statistics by commodity as from January 一年的數字已按分類第三版重新編製’並載 1992. Statistics for 1991 have been recompiled in 歹ij於方括號內 ° terms of SITC R3 and are presented in square
brackets in this table to facilitate comparison with the statistics from 1992 onwards.
服務業統計摘要一九九九年 105

表5.6 (續) 按貨品類別⑴劃分的轉口貨値 Table 5.6 (Cont'd.) Re-exports by Commodity Section�
百萬元 $ million 1994 1995 1996 1997 1998
轉口 947,921 1,112,470 1,185,758 1,244,539 1,159,195
Re-exports (15.2) (17.4) (6.6) (5.0) (-6.9) 食物及活動物 15,980 18,280 21,277 20,923 18,078 Food and live animals (21.3) (14.4) (16.4) (-1.7) (-13.6) 飮料及煙草 14,234 13,174 14,131 10,387 8,017 Beverages and tobacco (13.0) (-7.5) (7.3) (-26.5) (-22.8) 除燃料外的非食用未加工材料 15,677 21,792 20,382 21,112 19,112 Crude materials inedible, except fuels (19.6) (39.0) (-6.5) (3.6) (-9.5) 礦物燃料、滑潤劑及有關物質 8,468 12,212 15,124 15,869 9,503 Mineral fuels, lubricants and related materials (12.2) (44.2) (23.9) (4.9) (-40.1) 動物及植物油、脂肪及蠟 1,873 2,311 2,224 2,998 3,232 Animal and vegetable oil, fats and waxes (235.2) (23.4) (-3.8) (34.8) (7.8) 未列入其他分類的化學品及有關產品 56,731 74,524 74,143 74,046 66,565 Chemicals and related products, not elsewhere (25.2) (31.4) (-0.5) (-0.1) (-10.1) classified 主要以材料分類的製成品 165,653 196,959 208,518 215,918 197,442 Manufactured goods classified chiefly by (15.6) (18.9) (5.9) (3.6) (-8.6) materials 機械及運輸設備 304,789 367,077 391,071 419,976 407,400 Machinery and transport equipment (17.9) (20.4) (6.5) (7.4) (-3.0) 雜項製成品 361,579 402,831 434,522 459,074 426,262 Miscellaneous manufactured articles (10.7) (11.4) (7.9) (5.7) (-7.1) 未列入其他分類的貨品及交易 2,936 3,309 4,368 4,237 3,584 Commodities and transactions, not elsewhere (18.9) (12.7) (32.0) (-3.0) (-15.4) classified
註釋:括號內的數字是同上年比較的變動百分率 ° Notes : Figures in brackets are percentage changes over the preceding year.
( 1 )自一九九二年一月起’標準國際貿易分類第 (1) The Standard International Trade Classification 三次修訂版(簡稱分類第三版)’取代了分類 Revision 3 (SITC R3) has been adopted in place of 第二版’作爲貿易統計貨品分類的依據。爲 the Revision 2 (SITC R2) for the classification of 方便與九二年及以後的統計數字作比較’九 trade statistics by commodity as from January 一年的數字已按分類第三版重新編製’並載 1992. Statistics for 1991 have been recompiled in 歹IJ方令方括號內 ° terms of SITC R3 and are presented in square
brackets in this table to facilitate comparison with the statistics from 1992 onwards.
110 Statistical Digest of the Services Sector 1999

表5.7 按選定國家/地蓝劃分的貿易統計數字 Table 5.7 Trade Statistics by Selected Countries/Territories
百萬元 $ million
1989 1990 1991 1992 1993 按主要供應地劃分的進口貨値 Imports by main supplier
中國內地 196,676 236,134 293,356 354,348 402,161
The mainland of China (26.4) (20.1) (24.2) (20.8) (13.5) 日本 93,202 103,362 127,402 166,191 178,034
Japan (0.2) (10.9) (23.3) (30.4) (7.1) 美國 46,234 51,788 58,837 70,594 79,419
U.S.A. (11.8) (12.0) (13.6) (20.0) (12.5) 台灣 51,587 58,084 74,591 87,019 93,968
Taiwan (16.3) (12.6) (28.4) (16.7) (8.0)
按主要目的地劃分的港產品出口貨値 Domestic exports by main destination
中國內地 43,272 47,470 54,404 61,959 63,367
The mainland of China (13.7) (9.7) (14.6) (13.9) (2.3) 美國 72,162 66,370 62,870 64,600 60,292
U.S.A. (-1.0) (-8.0) (-5.3) (2.8) (-6.7) 英國 14,638 13,496 13,706 12,541 10,771
U.K. (-5.7) (-7.8) (1.6) (-8.5) (-14.1) 德國 15,757 17,991 19,318 15,956 13,969
Germany (-3.0) (14.2) (7.4) (-17.4) (-12.5)
按主要來源地劃分的轉口貨値 Re-exports by main origin
中國內地 188,271 240,410 315,689 403,782 474,007
The mainland of China (43.1) (27.7) (31.3) (27.9) (17.4) 日本 38,998 42,280 57,215 84,966 109,949
Japan (3.4) (8.4) (35.3) (48.5) (29.4) 台灣 26,960 30,283 41,693 54,442 64,649
Taiwan (27.1) (12.3) (37.7) (30.6) (18.7) 美國 22,325 24,490 26,591 32,113 37,424
U.S.A. (16.6) (9.7) (8.6) (20.8) (16.5)
按主要目的地劃分的轉口貨値 Re-exports by main destination
中國內地 103,492 110,908 153,318 212,105 274,561
The mainland of China (9.1) (7.2) (38.2) (38.3) (29.4) 美國 72,033 87,752 110,802 148,500 180,349
U.S.A. (45.6) (21.8) (26.3) (34.0) (21.4) 日本 22,268 24,376 29,574 37,465 44,156
Japan (27.8) (9.5) (21.3; (26.7) (17.9) 英國 8,918 12,107 14,663 20,591 24,536
U.K. (38.9) (35.7) (21.1) (40.4) (19.2) 註釋:括號內的數字是同上年比較的變動百分率� Note : Figures in brackets are percentage changes over the
preceding year.
服務業統計摘要一九九九年 105

表5.7 (續) 按選定國家/地®劃分的貿易統計數字 Table 5.7 (Cont'd.) Trade Statistics by Selected Countries/Territories
百萬元 $ million 1994 1995 1996 1997 1998
按主要供應地劃分的進口貨値 Imports by main supplier 中國內地 470,876 539,480 570,442 608,372 580,614 The mainland of China (17.1) (14.6) (5.7) (6.6) (-4.6) 日本 195,036 221,254 208,239 221,646 179.947
Japan (9.6) (13.4) (-5.9) (6.4) (-18.8) 美國 89,343 115,078 121,058 125,381 106,537
U.S.A. (12.5) (28.8) (5.2) (3.6) (-15.0) 台灣 107,310 129,266 123,202 124,547 104,075
Taiwan (14.2) (20.5) (-4.7) (1.1) (-16.4)
按主要目的地劃分的港產品出口貨値 Domestic exports by main destination 中國內地 61,009 63,555 61,620 63,867 56,066
The mainland of China (-3.7) (4.2) (-3.0) (3.6) (-12.2) 美國 61,419 61,250 53,860 55,073 54,842
U.S.A. (1.9) (-0.3) (-12.1) (2.3) (-0.4) 英國 10,292 10,941 10,597 10,723 10,058 U.K. (-4.4) (6.3) (-3.1) (1.2) (-6.2) 德國 12,811 12,178 11,388 10,321 9,805 Germany (-8.3) (-4.9) (-6.5) (-9.4) (-5.0)
按主要來源地劃分的轉口貨値 Re-exports by main origin 中國內地 545,831 636,392 683,514 723,416 691,219
The mainland of China (15.2) (16.6) (7.4) (5.8) (-4.5) 日本 121,936 130,511 129,292 133,825 123,879 Japan (10.9) (7.0) (-0.9) (3.5) (-7.4) 台灣 72,060 83,307 82,177 83,341 71,782 Taiwan (11.5) (15.6) (-1.4) (1.4) (-13.9) 美國 43,678 55,636 62,192 62,633 54,530 U.S.A. (16.7) (27.4) (11.8) (0.7) (-12.9)
按主要目的地劃分的轉口貨値 Re-exports by main destination 中國內地 322,835 384,043 417,752 443,878 407,366 The mainland of China (17.6) (19.0) (8.8) (6.3) (-8.2) 美國 210,077 230,997 242,342 261,372 259,856 U.S.A. (16.5) (10.0) (4.9) (7.9) (-0.6) 日本 54,745 70,081 80,154 77,724 64,194 Japan (24.0) (28.0) (14.4) (-3.0) (-17.4) 英國 27,318 32,257 35,991 39,066 42,259 U.K. (11.3) (18.1) (11.6) (8.5) (8.2)
註釋:括號內的數字是同上年比較的變動百分率 ° Note : Figures in brackets are percentage changes over the preceding year.
5 8 Statistical Digest of the Services Sector 1999
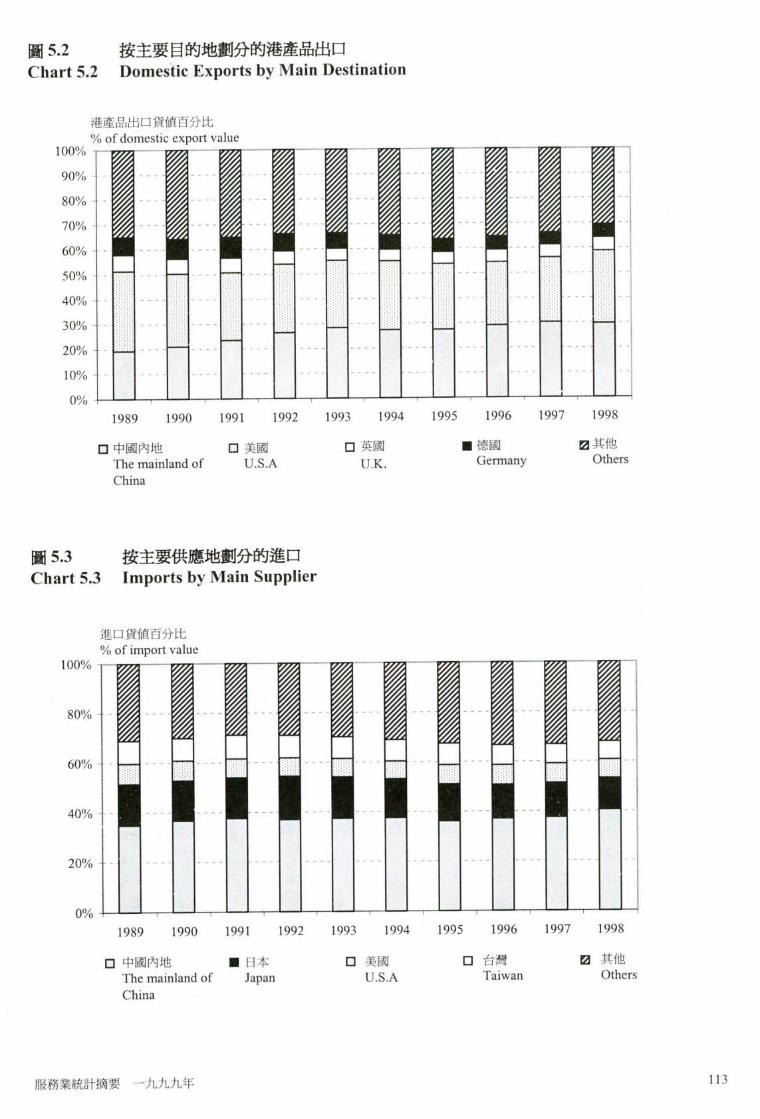
圖 5 . 2 按主要目的地劃分的港產品出口
Chart 5.2 Domestic Exports by Main Destination
港產品出口貨値百分比
% of domestic export value
: � _ 1 1 1 i I i i r I Boo/o I I i I i I i I _ 邏丨 - I I I I 60% H - . 囲 H ® - _ [jj - • ® ^ — - - " T " � 5 0 % - - 霜 — — — - —
4 0 % 一- . ;.;;;:: ::::::: ::: . . : . . . . . . .
3 0 % - - —— ——H … _ . 遍 … - - 黑 - - _ 这 — — � - - - � ..::
2 0 % - - 塵 — — 緑 — — — - - - - - - - - - - - … - … - … 1 0 % - - - - - - - - - - - . - - - - - - … … 丨
0% 4 — 1 r — I ~ 1 — 1 — ‘ _ L - r - i L - t - J ~ L — r — ' ~ ‘ ― i — ' ~ ' — T - ^ ~ ~ ‘ ― r — ' ~ ‘ ― f
1989 1990 1991 1992 1993 1994 1995 1996 1997 1998 •中國內地 • 美 國 • 英 國 • 德 國 0 其 他
The mainland of U.S.A U.K. Germany Others China
圖 5 . 3 按主要供應地劃分的進口 Chart 5.3 Imports by Main Supplier
進口貨値百分比
% of import value n r w 1 1 1 1 1 I f 1 ! 8。% # t _ _ _ _ _ _ w _; 6 0 % …忘 • - — - — - … 一 T — “ “ • “ —
2 0 % - - - ;
j
1989 1990 1991 1992 1993 1994 1995 1996 1997 1998 口中國內地 • 日 本 • 美 國 • 台 灣 0 其 他
The mainland of Japan U.S.A Taiwan Others China
服務業統 i t 摘要一九九九年 55

表5.8 涉及外發中國內地加工的貿易(”’
(2>
Table 5.8 Trade Involving Outward Processing in the Mainland of C h i n a � ’ �
百萬元(另有註明除外) $ million, unless otherwise specified
1 9 ^ ^ ^ 1992 1993 涉及外發加工貿易的估計貨値 Estimated value of outward processing trade
輸往中國內地的港產出口貨品 31,962 36,418 40,369 44,271 45,141 Domestic exports to the mainland of China - (13.9) (10.8) (9.7) (2.0) 輸往中國內地的轉口貨品 44,906 55,496 73,562 97,368 115,037 Re-exports to the mainland of China - (23.6) (32.6) (32.4) (18.1) 由中國內地進口的貨品 113,581 145,103 197,384 254,013 295,203 Imports from the mainland of China - (27.8) (36.0) (28.7) (16.2) 原產地爲中國內地經本港輸往其他地方的轉口 貨品 - - 221,450 299,833 364,536 Re-exports of the mainland of China origin to - - - (35.4) (21.6) other places
涉及外發加工貿易的估計比率(%) Estimated proportion of outward processing trade (%) 輸往中國內地的港產出口貨品 76.0 79.0 76.5 74.3 74.0 Domestic exports to the mainland of China 輸往中國內地的轉口貨品 43.6 50.3 48.2 46.2 42.1 Re-exports to the mainland of China 由中國內地進口的貨品 58.1 61.8 67.6 72.1 73.8 Imports from the mainland of China 原產地爲中國內地經本港輸往其他地方的轉口 - - 74.1 78.3 80.8 貨品 Re-exports of the mainland of China origin to other places
註釋:括號內的數字是同上年比較的變動百分率° Notes : Figures in brackets are percentage changes over the preceding year.
(1) 貨値不包括無須按貨品分類的貨品和交 (1) The value excludes commodities and transactions 易“ not classified according to kind.
(2) 有關外發中國內地加工的貿易統計數字於 (2) Trade statistics related to outward processing in 一九八九年開始編製’而原產地爲中國內地 the mainland of China were first available in 1989 的轉口貿易統計數字則於九一年開始編 and statistics on re-exports of origin from the 製 ° mainland of China were first available in 1991.
5 8 Statistical Digest of the Services Sector 1999

表 5 . 8 (繽) 涉及外發中國內地加工的貿易<_ Table 5.8 (Cont'd.) Trade Involving Outward Processing in the Mainland of China'"
百萬元(另有註明除外) $ million, unless otherwise specified
1994 1995 1996 1997 1998 涉及外發加工貿易的估計貨値 Estimated value of outward processing trade
輸往中國內地的港產出口貨品 41,959 43,890 43,089 47,078 42,184 Domestic exports to the mainland of China (-7.0) (4.6) (-1.8) (9.3) (-10.4) 輸往中國內地的轉口貨品 139,221 173,722 179,235 197,809 179,089 Re-exports to the mainland of China (21.0) (24.8) (3.2) (10.4) (-9.5) 由中國內地進口的貨品 354,912 399,567 452,890 491,142 477,743 Imports from the mainland of China (20.2) (12.6) (13.3) (8.4) (-2.7) 原產地爲中國內地經本港輸往其他地方的轉口 貨品 422,544 492,461 552,822 595,511 559,726 Re-exports of the mainland of China origin to (15.9) (16.5) (12.3) (7.7) (-6.0) other places
涉及外發加工貿易的估計比率(%) Estimated proportion of outward processing trade (%)
輸往中國內地的港產出口貨品 7 1 . 4 7 1 . 4 7 2 . 8 7 6 . 1 7 7 . 4 Domestic exports to the mainland of China 輸往中國內地的轉口貨品 4 3 . 3 4 5 . 4 4 3 . 2 4 4 . 7 4 4 . 1 Re-exports to the mainland of China 由中國內地進口的貨品 7 5 . 9 7 4 . 4 7 9 . 9 8 1 . 2 8 2 . 7 Imports from the mainland of China 原產地爲中國內地經本港輸往其他地方的帱口 8 2 . 0 8 2 . 2 8 6 . 0 8 8 . 4 8 7 . 6
貝nn Re-exports of the mainland of China origin to other places
註釋:括號內的數字是同上年比較的變動百分率� Notes : Figures in brackets are percentage changes over the preceding year.
(1) 貨値不包括無須按貨品分類的貨品和交 (1) The value excludes commodities and transactions 易� not classified according to kind.
(2) 有關外發中國內地加工的貿易統計數字於 (2) Trade statistics related to outward processing in —九八九年開始編製,而原產地爲中國內地 the mainland of China were first available in 1989 的轉口貿易統計數字則於九一年開始編 and statistics on re-exports of origin from the 製� mainland of China were first available in 1991.
服務業統計摘要一九九九年 115

圖 5 . 4 涉及外發中國內地加工的貿易⑴ Chart 5.4 Trade Involving Outward Processing in the Mainland of China�
百萬元 $ million
1 , 4 0 0 , 0 0 0 一""" • — > — — — — — . - … . - . . . . ..,,,.. ,,,„.,,....,..
鬥 i 1,200,000 ^ ^ ^ ^ I
鬥 ,
400,000 — _ _ •
m m m m m m r n m 200,000 - … ^ ^ ^ ^ ^ ^ ^ ^ 國 -
ol m I 1 , 1 I 1 , I , 1 , 1 , 1 1991 1992 1993 1994 1995 1996 1997 1998
S原產地爲中國內地經本港 0由中國內地進口的貨 •輸往中國內地的轉口 13輸往中國內地的港
輸往其他地方的轉口貨品 品 貨品 產出口貨品
Re-exports of the Imports from the Re-exports to the Domestic exports to mainland of China origin mainland of China mainland of China the mainland of to other places China
註釋:(1) 貨値不包括無須按貨品分類的貨品和交 Note : (1) The value excludes commodities and transactions 易“ not classified according to kind.
116 Statistical Digest of the Services Sector 1999

表 5 . 9 有從事製造業相關活動的進出口機構及製造業機構的機構單位數目、就業人數、增加
價値及鐘收益 Table 5.9 Number of Establishments and Persons Engaged, Value Added and Sales
Revenue of Import/Export Firms with Manufacturing-Related Functions and Manufacturing Firms
十億元(另有註明除外) $ billion, unless otherwise specified 1989 1990 1991 1992
有從事製造業相關活動的進出口機構<i)’<2)
Import/export firms with manufacturing-related functions � ’ (2)
機構單位數目 - - - 1 2 5 8 0 Number of establishments -就業人數(千人) - - - 7 3 . 1 Number of persons engaged (thousands) -增加價値 - - - 1 7 . 9 Value added -銷貨收益⑶ - - - 1 9 7 . 0 Sales revenue� -
製造業機構 Manufacturing firms 機構單位數目 5 2 4 8 0 5 1 8 2 0 4 3 8 9 0 4 1 7 1 0 Number of establishments (1.6) (-1.2) (-15.3) (-5.0) 就業人數(千人) 829.7 762.6 651.4 592.4 Number of persons engaged (thousands) (-6.3) (-8.1) (-14.6) (-9.1) 增加價値 8 9 . 6 9 2 . 2 9 2 . 7 9 7 . 4 Value added (7.8) (2.9) (0.5) (5.1) 銷 貨 收 益 3 3 8 . 2 343.7 344.5 352.0 Sales r e v e n u e � ^ ^ ^ (2.2)
註釋:括號內的數字是同上年比較的變動百分率° Notes : Figures in brackets are percentage changes over the preceding year.
(1) 數字是指有從事分判製造工序予中國內地 (1) Figures refer to import/export firms engaged in 及提供技術支援的進出口機構� sub-contract processing arrangement in the
mainland of China (SPAC) and providing technical support services.
(2)數字於一九九二統計年度開始編製� � Figures were first available in the reference year 1992.
(3) 銷貨收益包括銷售自行生產的貨物和轉售 (3) Sales revenue includes revenue from selling of 從外界購買的貨物所得收益。此外’有關貨 goods produced in-house and those purchased 物包括本地產品及透過分判製造工序予中 from external parties. Also, it covers goods 國內地生產的產品 ° produced from local production and production in
the mainland of China through SPAC.
服務業統 i十摘要一九九九年 12 7

表 5 . 9 (繽) 有從事製造業相關活動的進出口機構及製造業機構的機_位數目、就業人
數、增加價値及纖收益 Table 5.9 (Cont'd.) Number of Establishments and Persons Engaged, Value Added and
Sales Revenue of Import/Export Firms with Manufacturing-Related Functions and Manufacturing Firms
十億元(另有註明除外) $ billion, unless otherwise specified 1993 1994 1995 1996 1997
有從事製造業相關活動的進出口機構⑴ Import/export firms with manufacturing-related functions � ’ �
機構單位數目 1 7 8 7 0 2 0 4 9 0 2 4 8 6 0 2 5 5 3 0 2 5 9 8 0 Number of establishments (42.1) (14.7) (21.3) (2.7) (1.8) 就業人數(千人) 1 0 7 . 0 1 4 0 . 4 1 4 8 . 4 1 4 3 . 7 1 4 6 . 4 Number of persons engaged (thousands) (46.4) (31.2) (5.7) (-3.2) (1.9) 增加價値 2 8 . 7 3 8 . 0 5 2 . 0 5 4 . 7 6 8 . 8 Value added (60.3) (32.4) (36.7) (5.3) (25.7) 銷貨收益(3) 263.0 390.0 489.4 496.1 592.4 Sales r e v e n u e � (33.5) (48.3) (25.5) (1.4) (19.4)
製造業機構 Manufacturing firms 機構單位數目 3 4 3 8 0 3 1 9 9 0 2 7 6 0 0 2 5 8 6 0 2 4 9 3 0 Number of establishments (-17.6) (-7.0) (-13.7) (-6.3) (-3.6) 就業人數(千人) 504.9 433.7 368.0 327.5 290.0 Number of persons engaged (thousands) (-14.8) (-14.1) (-15.1) (-11.0) (-11.5) 增加價値 9 1 . 2 8 6 . 5 8 4 . 4 8 2 . 4 8 0 . 0 Value added (-6.5) (-5.1) (-2.4) (-2.4) (-2.9) 銷 貨 收 益 3 3 8 . 1 330.1 326.4 312.1 293.4 Sales revenue'" (-3.9) (-2.4) (-1.1) (-4.4) (-6.0)
註釋:括號內的數字是同上年比較的變動百分率� Notes : Figures in brackets are percentage changes over the preceding year.
(1) 數字是指有從事分判製造工序予中國內地 (1) Figures refer to import/export firms engaged in 及提供技術支援的進出口機構� sub-contract processing arrangement in the
mainland of China (SPAC) and providing technical support services.
(2)數字於一九九二統ft年度開始編製。 (2) Figures were first available in the reference year 1992.
(3) 銷貨收益包括銷售自行生產的貨物和轉售 (3) Sales revenue includes revenue from selling of 從外界購買的貨物所得收益。此外’有關貨 goods produced in-house and those purchased 物包括本地產品及透過分判製造工序予中 from external parties. Also, it covers goods 國內地生產的產品 ° produced from local production and production in
the mainland of China through SPAC.
118 Statistical Digest of the Services Sector 1999

表5.10 進出口貿易業的選定最新統計數字
Table 5.10 Selected Up-to-date Statistics on Import and Export Trade Services 1998 1999
第一季 第二季 第三季 第四季 第一季 Ql Q2 Q3 Q4 Ql_ 機構單位數目 94 287 94 977 95 298 85 852 98 031
Number of establishments 就業人數 488 112 479 417 469 654 452 539 491 856
Number of persons engaged
業務收益指數(1996=100) 87.3 90.9 94.6 89.3 69.5
Business receipts index 0996=100) 貿易指數-進口(1990=100)
Trade index numbers - imports (1990=100) 貨値指數 213.9 236.9 223.1 215.8 184.3
Value index 單位價格指數 102.2 100.8 99.6 99.1 98.5
Unit value index 貨量指數 208.4 235.0 222.9 218.1 187.1
Quantum index
貿易指數-港產品出口(1990=100) Trade index numbers - domestic exports (1990=100)
貨値指數 73.3 87.4 91.7 81.4 64.3
Value index 單位價格指數 102.7 102.0 102.2 101.5 100.0
Unit value index 貨量指數 72.4 86.3 89.7 81.6 65.8
Quantum index 貿易指數-轉口(1990=100) Trade index numbers - re-exports (1990=100)
貨値指數 260.5 286.5 290.4 282.6 238.4
Value index 單位價格指數 103.2 102.0 100.4 99.8 98.5
Unit value index 貨量指數 256.8 285.3 289.2 287.6 246.2
Quantum index
服務業統計摘要一九九九年 119
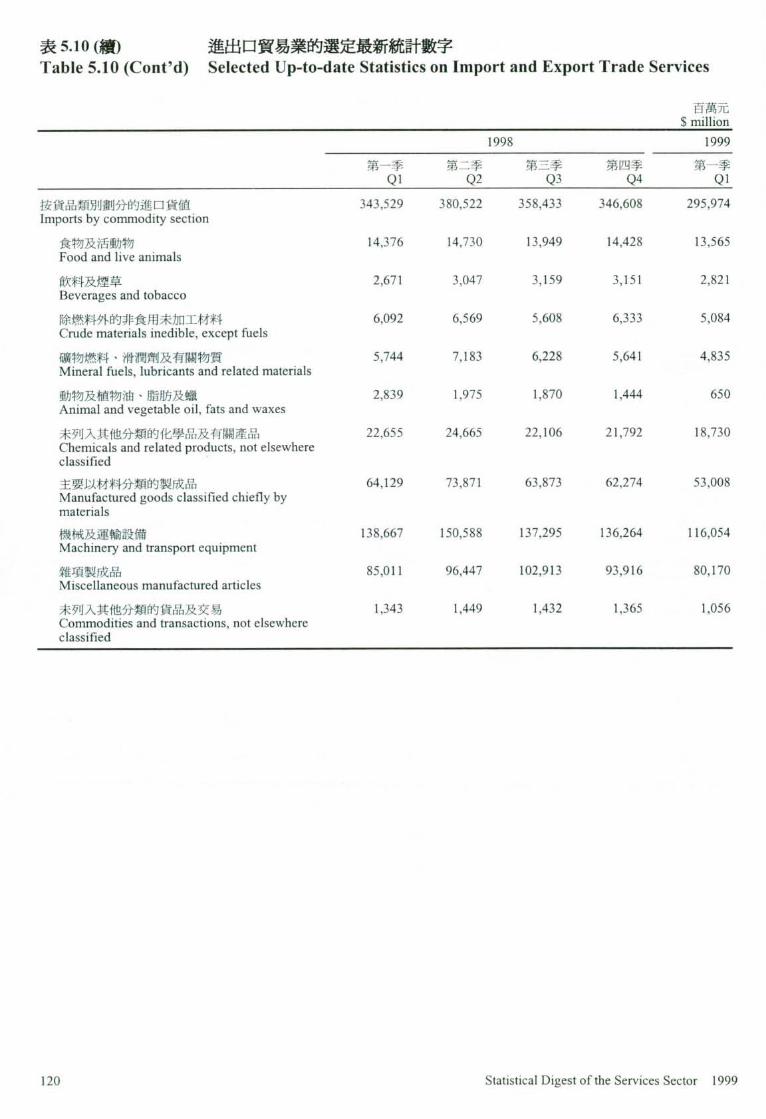
表5.10 (續) 進出口貿易業的選定最新統計數字 Table 5.10 (Cont'd) Selected Up-to-date Statistics on Import and Export Trade Services
百萬元 $ million 1998 1999
第一季 第二季 第三季 第四季 第一季 ^ Q2 Q3 Q4 Ql_ 按貨品類別劃分的進口貨値 343,529 380,522 358,433 346,608 295,974 Imports by commodity section
食物及活動物 14,376 14,730 13,949 14,428 13,565
Food and live animals 飲料及煙草 2,671 3,047 3,159 3,151 2,821
Beverages and tobacco 除燃料外的非食用未加工材料 6,092 6,569 5,608 6,333 5,084 Crude materials inedible, except fuels 礦物燃料、滑潤劑及有關物質 5,744 7,183 6,228 5,641 4,835 Mineral fuels, lubricants and related materials 動物及植物油、脂肪及蠟 2,839 1,975 1,870 1,444 650 Animal and vegetable oil, fats and waxes 未列入其他分類的化學品及有關產品 22,655 24,665 22,106 21,792 18,730 Chemicals and related products, not elsewhere classified 主要以材料分類的製成品 64,129 73,871 63,873 62,274 53,008 Manufactured goods classified chiefly by materials 機械及運輸設備 138,667 150,588 137,295 136,264 116,054 Machinery and transport equipment 雜項製成品 85,011 96,447 102,913 93,916 80,170 Miscellaneous manufactured articles 未列入其他分類的貨品及交易 1,343 1,449 1,432 1,365 1,056 Commodities and transactions, not elsewhere classified
120 Statistical Digest of the Services Sector 1999

表5.10 (續) 進出口貿易業的選定最新統計數字 Table 5.10 (Cont'd) Selected Up-to-date Statistics on Import and Export Trade Services
百萬元 $ million
1998 1999 第一季 第二季 第三季 第四季 第一季
Ql Q2 Q3 Q4 Q]_ 按貨品類別劃分的港產品出口貨値 41,368 49,326 51,805 45,955 36,327 Domestic exports by commodity section
食物及活動物 514 469 443 443 367
Food and live animals 飮料及煙草 485 483 376 246 215
Beverages and tobacco 除燃料外的非食用未加工材料 391 392 317 381 337 Crude materials inedible, except fuels 礦物燃料、滑潤劑及有關物質 115 141 189 169 119 Mineral fuels, lubricants and related materials 動物及植物油、脂肪及蠟 38 32 26 27 70 Animal and vegetable oil, fats and waxes 未列入其他分類的化學品及有關產品 1,666 1,912 1,659 1,516 1,262 Chemicals and related products, not elsewhere classified 主要以材料分類的製成品 4,196 5,132 4,612 4,224 3,503 Manufactured goods classified chiefly by materials 機械及運輸設備 11,948 12,314 11,485 10,723 9,025
Machinery and transport equipment 雜項製成品 21,406 27,778 32,028 27,558 20,985
Miscellaneous manufactured articles 未列入其他分類的貨品及交易 609 673 669 668 445 Commodities and transactions, not elsewhere classified
服務業統計摘要一九九九年 12 1

表5.10 (續) 進出口貿易業的選定最新統計數字 Table 5.10 (Cont'd) Selected Up-to-date Statistics on Import and Export Trade Services
百萬元 $ million
1998 1999 第一季 第二季 第三季 第四季 第一季 Ql Q2 Q3 Q4 ^
按貨品類別劃分的轉口貨値 269,596 296,514 300,548 292,537 246,728 Re-exports by commodity section
食物及活動物 4,331 4,530 4,555 4,663 4,150 Food and live animals 飮料及煙草 2,189 2,048 1,948 1,832 1,901 Beverages and tobacco 除燃料外的非食用未加工材料 4,789 5,125 4,327 4,872 4,055 Crude materials inedible, except fuels 礦物燃料、滑潤劑及有關物質 3,389 3,315 1,474 1,325 1,105 Mineral fuels, lubricants and related materials 動物及植物油、脂肪及獵 1,280 718 527 708 488 Animal and vegetable oil, fats and waxes 未列入其他分類的化學品及有關產品 16,229 17,788 16,076 16,472 13,989 Chemicals and related products, not elsewhere classified 主要以材料分類的製成品 45,162 54,640 48,849 48,791 39,115 Manufactured goods classified chiefly by materials 機械及運輸設備 97,322 102,009 101,434 106,635 92,509 Machinery and transport equipment 雜項製成品 94,098 105,411 120,444 106,308 88,724 Miscellaneous manufactured articles 未列入其他分類的貨品及交易 807 931 916 930 691 Commodities and transactions not elsewhere classified
120 Statistical Digest of the Services Sector 1999

表5.10 (續) 進出口貿易業的選定最新統計數字 Table 5.10 (Cont'd) Selected Up-to-date Statistics on Import and Export Trade Services
百萬元 $ million 1998 1999
第一季 第二季 第三季 第四季 第一季 ^ Q2 Q3 Q4 ^ 按主要供應地劃分的進口貨値 Imports by main supplier
中國內地 127,077 丨47,875 158,384 147,278 122,534
The mainland of China 日本 47,081 48,751 42,753 41,362 35,354
Japan 美國 26,685 29,335 24,885 25,633 22,175
U.S.A. 台灣 25,466 27,791 25,313 25,505 21,651
Taiwan
按主要目的地劃分的港產品出口貨値 Domestic exports by main destination 中國內地 12,428 15,963 14,761 12,914 10,123
The mainland of China 美國 10,825 13,747 16,716 13,555 10,181
U.S.A. 英國 2,192 2,333 2,942 2,591 2,062
U.K. 德國 2,071 2,336 2,770 2,627 1,968
Germany
按主要來源地劃分的轉口貨値 Re-exports by main origin 中國內地 154,567 171,872 188,142 176,639 146,424
The mainland of China 日本 30,372 32,315 30,227 30,965 26,205
Japan 台灣 17,092 19,222 17,445 18,023 14,716
Taiwan 美國 13,560 13,851 13,081 14,038 13,300
U.S.A.
按主要目的地劃分的轉口貨値 Re-exports by main destination 中國內地 98,268 110,435 98,401 100,262 84,645 The mainland of China 美國 55,565 65,456 73,082 65,753 52,644
U.S.A. 曰本 16,233 15,139 16,203 16,619 15,245
Japan 英國 8,404 10,168 12,098 11,590 8,479 U.K.
服務業統計摘要一九九九年 121

資料來源 Data Sources 表 資料來源 Table Sources 5.1 - 5.2 政府統言十處 5.1 - 5.2 Census and Statistics Department 5.3 世界貿易組織 5.3 World Trade Organization 5 . 4 - 5 . 9 政府,統言十處 5 . 4 -5 .9 Census and Statistics Department
其他有關刊物 Further References 香港對外貿易回顧 Annual Review of Hong Kong External Trade 就業及空缺統胃f(詳細統計表) Employment and Vacancies Statistics (Detailed Tables) 本地生產總値估計 Estimates of Gross Domestic Product 對外貿易數字 External Trade Figures 香港統計年刊 Hong Kong Annual Digest of Statistics 香港對外貿易 Hong Kong External Trade 香港統言十月干(J Hong Kong Monthly Digest of Statistics 香港貿易指數 Hong Kong Trade Index Numbers 香港貿易統計 Hong Kong Trade Statistics 服務行業按季業務收益指數 Quarterly Business Receipts Indices for Service
Industries 就業、空缺及薪金總額按季統計報告 Quarterly Report of Employment, Vacancies and
Payroll Statistics 本地生產總値估計按季報告 Quarterly Report of Gross Domestic Product Estimates 批發、零售、進•與出•貿易、食肆及酒店按 Report on Annual Survey of Wholesale, Retail & Import 年統計調查報告 & Export Trades, Restaurants & Hotels
118 Statistical Digest of the Services Sector 1999

6 保險業
Insurance Services 槪要 Highlights 作爲亞洲的一個主要保險中心,在香港的 Being a leading insurance centre in Asia, Hong Kong 獲授權保險公司的數目爲區內之冠。在一 has the highest number of authorized insurance 九 九 八 年 底 ’ 香 港 有 2 0 9 名 獲 授 權 保 險 companies in the region. At the end of 1998, we 人,其中 29 名是再保險人。香港並有 330 had 209 authorized insurers of which 29 were 名 獲 授 權 保 險 經 紀 和 約 4 2 6 0 0名獲委任 reinsurers. There were also 330 authorized 保險代理人 ° insurance brokers and about 42 600 appointed
insurance agents in Hong Kong.
保險業於一九九七年的生產淨値達 10 8 億 The net output of the insurance industry amounted to 元’佔該年本地生產總値的 0.9% ° about $10.8 billion in 1997, or O.90/0 of Hong Kong's
Gross Domestic Product (GDP) in the year.
一九九八年共有超過 5 500 間保險機構單 Altogettier, over 5 500 insurance establishments 位在港經營’僱用約 25 000 人 ° 這些機 were run in 1998,employing about 25 000 persons. 構包括人壽保險人、一般保險人、保險代 These included life insurers, general insurers, 理人及保險經紀’以及爲保險人提供支援 insurance agents and brokers as well as various 月艮務的各類機構 ° miscellaneous companies providing supporting
services to insurers.
一九九八年底’香港有!9 5 名合資格精算 At the end of 1998, Hong Kong had 195 qualified
師’較上一年顯著力口 60% ° actuaries, representing a very substantial increase of 60% over a year before.
雖然面對亞洲金融風暴’來自長期保險業 Despite the Asian financial turmoil, premium income 務和一般保險業務的保費收入’由一九九 (for long term insurance business and general 六年的 463 億元增加至九七年的 520 億 insurance business) increased by 12% from $46.3 元,上升 1 2 % 。九一年至九七年間的每年 billion in 1996 to $52.0 billion in 1997. The 平均增長率爲 1 5 % � average annual growth rate between 1991 and 1997
was 15%.
一九九七年底’有效的長期保險保單數目 At the end of 1997, the number of long term 超過 3 60 萬張,而長期保險業務在九七年 insurance polices in force exceeded 3.6 million. In 持續增長’保單保費較九六年增加 1 7 % 至 terms of office premium, long term insurance 325 億 元 。 此 外 ’ 一般保險業務的毛保費 business in 1997 record a growth of 17% compared 亦錄得 5% 的溫和增長至 195 億元。 to 1996, accounting to $32.5 billion. Besides, the
general insurance business also registered a mild growth of 5% in gross premiums to $19.5 billion.
服務業統 i十摘要一九九九年 127

一九九八年底’由保險公司管理的職業退 At the end of 1998,some 10 500 occupational 休計劃約有 10 500 項’受保僱員人數爲 retirement schemes covering 320 000 employees or 320 000 名’佔就業人口的 10%。在九五 10% of the employed population were under the 年’只有 7 500 個類似的計畫U ’ 爲 241 000 management of insurance companies. In 1995, 名僱員提供退休保險’佔當時就業人口的 there were only about 7 500 such schemes, 9% “ providing retirement insurance to 241 000
employees or 9% of the then employed population.
香港出口信用保險局(信保局)於一九六六 Established by statute in 1966, the Hong Kong 年依法成立’爲香港貨物和服務出口商提 Export Credit Insurance Corporation (the 供多項保險服務。信保局在一九九八年的 Corporation) provides a wide range of insurance 承保總額達 215 億元’較九七年增力口 7% ’ facilities to Hong Kong exporters of goods and 較八九年 i曾加 101% ° 保費淨收入亦分別 services. The Corporation's total insured business 錄得 6%和 79%的增長。在九八年’接近 in 1998 reached $21.5 billion, representing an 1.5 %的整體出口貨値由該局承保。 increase of 7% over 1997 and 101 % over 1989. Net
premium income also showed respective increase of 6% and 79%. In 1998, almost 1.5% of Hong Kong's total exports in value terms were insured by the Corporation.
118 Statistical Digest of the Services Sector 1999

主要統計數字 Key Statistics
百萬元(另有註明除外) $ million, unless otherwise specified
保險業 Insurance Industry 年 機搆單位數目(1) 就 業 人 數 增 加 價 値 業務收益指數
(2>
Year Number of Number of persons Value added Business receipts establishments^" engaged � index® (1996=100) 1989 [3 562] [14 937] 4,269 -1990 [4 238] [18 230] 4,555 -1991 4 704 18 945 5,418 -1992 4 665 19 909 6,609 55.9 1993 4 985 19 793 9,201 66.6 1994 4 975 20 271 11,868 82.1 1995 4 852 22 260 11,824 93.3 1996 5 231 24 866 11,104 100.0 1997 5 578 22 898 10,764 110.8 1998 5 555 24 746 N.A. 115.9
註釋:(1) 一九九一年及以後的數字是該年內四季的 Notes : (1) Figures for 1991 and onwards are averages of the 估計數字的平均數’而九一年以前的數字是 four quarterly estimates of the year, whereas those it該年三月壳白切青況 ° prior to 1991 refer to the position as at end March
of the corresponding year. ( 2 )業務收益指數於一九九二統計年度開始編 (2) Business receipts indices were first available in the
幽� reference year 1992. []一九九一年前的數字的涵蓋範圍與其後的 [ ] F i g u r e s prior to 1991 are slightly different in
略有不同’因此不可將兩組數字作嚴格比 coverage and therefore are not strictly comparable 較� with those for 1991 and onwards.
服務業統i十摘要一九九九年 1 2 7

主要統計數字(糖) Key Statistics (Cont'd.)
百萬元(另有註明除外) $ million, unless otherwise specified 保費收入
Premium Income
年 長期保險業務的保單保費^ 一般保險業務的毛保費<3>’(4> 出口信用保單的保費淨收入
Year Of f i ce p remiums f rom long Gross premiums from general Net premium income of export term insurance business ' ' ' insurance b u s i n e s s � , � credit p o l i c i e s �
1989 - - 48 1990 - - 51 1991 10,765 11,246 60 1992 13,027 14,182 68 1993 15,490 17,082 69 1994 19,478 19,737 72 1995 23,738 20,087 73 1996 27,765 18,508* 75 1997 32,525 19,483 81 1998 N.A. N.A. 86
註釋:(3) 數字由保險業監理處自一九九一年開始提 Notes: (3) Figures are obtained from the Office of the 供 ° Commissioner of Insurance and were first
available in 1991. ( 4 )不包括香港出口信用保險局的保費 ° (4) Not including premiums of export credit policies
of the Hong Kong Export Credit Insurance Corporation.
(5) 指截至該年三月底的十二個月內的總計。 (5) Figures refer to the total in the twelve-month period ended March of the corresponding year.
118 Statistical Digest of the Services Sector 1999

槪念及方法 Concepts and Methods 深 /務分爲一般保險和長期保險業務。一般 Insurance services are classified into general 保險業務包括意外及健康、汽車、貨運、資產損 insurance and long term insurance. For general 壞、一般法律責任和出口信用保險六大類°長期 insurance, there are six main classes of businesses, 保險的主要業務則包括個人人壽、團體人壽、退 including accident and health, motor vehicle, goods 休計劃、年金及永久健康業務 ° in transit, property damage, general liability and
export credit insurance. For long term insurance, the main classes of businesses are individual life, group life, retirement scheme, annuity and permanent health.
保險公司條例規定’保險人在香港提供保險服 Insurers providing insurance services in Hong Kong 務必須獲取保險業監督之授權。爲確保保險人能 must obtain authorization from the Insurance 提供足夠的保障及保險服務予大眾及適當地處 Authority according to Insurance Companies 理其業務’保險人必須達到實繳股本、償付準備 Ordinance (ICO). To ensure that the insurers are 金、董事及控權人須爲合適和適當人選及有足夠 able to provide an adequate level of security and 再保險安排等要求 °保險經紀及保險代理人必 services to the insuring public and manage its affairs 須根據保險公司條例的有關條文分別獲取授權 properly,the insurers must meet the requirements on 或委任。任何人士均不得同時身兼獲授權保險經 paid-up capital, solvency margin, fitness and 糸己及獲委任保險代理人 ° propemess of directors and controllers and adequacy
of reinsurance arrangements. Insurance brokers and insurance agents must obtain authorization or appointment respectively in accordance with the relevant provisions of the ICO. A person is prohibited from holding himself out as an authorized insurance broker and an appointed insurance agent at the same time.
香港出口信用保險局(信保局)根據法例於一九 The Hong Kong Export Credit Insurance Corporation 六六年成立’由香港特別行政區政府全資擁有° (the Corporation) provides export credit insurance 信保局爲香港貨物和服務的出口商’在放賬予海 serWce in Hong Kong. The Corporation is 外買家時提供出口信用保險服務 ° established by statute in 1966 and its capital is
wholly-owned by the Government of the Hong Kong Special Administrative Region to provide insurance services to Hong Kong exporters of goods and services trading on credit terms with overseas buyers.
職業退休計劃業務是由職業退休計劃條例所規 Occupational retirement scheme business is 管’除獲得豁免的計劃外,所有其他計劃必須註 governed by the Occupational Retirement Schemes 冊°所有計劃均由保險安排規管或受信託管限” Ordinance (ORSO) and must be registered unless it is
exempted under ORSO. The schemes can either be regulated by insurance arrangement or governed by trusts.
服務業統 i十摘要一九九九年 127

詞彙釋義 Definition of terms
在編製統計數字時’保險業包括從事一般及長 For statistical compilation purpose, the insurance 期保險業務的保險人、保險代理及經紀及其他保 industry covers insurers carrying on general and long 險月S務機構單位。 term business, insurance agents and brokers as well
as other insurance service establishments.
供款數額就退休計劃業務而言,指僱員及僱主 —ount of contributions, in relation to retirement 向計畫II基金提供的款額 ° schemes business, means the amounts contributed by
the employees and employers to the scheme funds.
機構單位是指在單一擁有權或控制權(即單一 An establishment is defined as an economic unit (i.e. 公司名義)下’在單一地點從事一種或主要從事 a unit engaged in the production of goods or services) 一種經濟活動(即生產貨物或提供服務)的經濟 which engages, under a single ownership or control 單位� (i.e. under a single company name), in one or
predominantly one kind of economic activity at a single physical location.
已償付申索毛額指在扣除從再保險人及其他方 Gross claims paid is the amount paid by an insurer in 面收回的款項前’保險人支付以供全部或部分了 full or partial settlement of : (i) claims, including 結以下項目的款額: ( i )申索’包括計入超過一 claims relating to business accounted for over a 個財政年度的業務所涉及的申索;及 ( i i )保險人 longer period than a financial year; and (ii) expenses 招致(不論是透過其職員的僱用或由於其他原因) (such as legal, medical, surveying or engineering 的開支(例如法律、•療、測量或工程方面的費 costs) which are incurred by the insurer, whether 用),並直接是爲了結個別申索所引致’不論該 through the employment of its own staff or 等個別申索是否爲上述所提及者“ otherwise,and are directly attributable to the
settlement of individual claims, whether or not the individual claims in question are those mentioned above, before deduction of recoveries from reinsurers and other parties.
須付的佣金毛額就保險人的任f可財政年度而 Gross commission payable, in relation to a financial 言’指在該年度內已言己錄爲就保險合約的開始、 year of an insurer, means the amounts, whether or not 修訂或續保而須付予中介人或分出者的款額’不 paid during that year, which are recorded during that 論該款額是否已在該年度內支付“ year as due to intermediaries and cedants in respect
. of the inception, amendment or renewal of contracts of insurance.
本地生產總値是指一個國家或地區的所有常住 Gross Domestic Product (GDP) is a measure of the 生產單位’在一個指定的期間內’未扣除固定資 total value of production of all resident producing 本消耗白勺生產總f直 ° units of a country or territory in a specified period,
before deducting allowance for consumption of fixed capital.
生產總額人壽保險公司的生產總額等於經營費 Gross output of life insurance companies is imputed 用和僱員報酬的總和° 一般保險公司則包括扣去 by the sum of operating expenses and compensation 賠償淨額的保留備用保險費淨値和投資金融資 of employees. For general insurance companies, the 118 Statistical Digest of the Services Sector 1999

產所得的收入’以及從代理人或其他服務(包括 net retained premiums less net claims paid, plus 分保佣金)所得的收入和租金收入。至於保險代 income from investments of financial assets, and 理人、經紀及專爲提供專業保險服務的公司的生 receipts from agency or other services rendered and 產總額,則包括服務收費、管理費及佣金� rentals received are included in their gross output.
For insurance agents, brokers and other specialist firms rendering professional services, their gross output is measured by their service receipts, fees and commissions.
毛保費就保險人的任何財政年度而言’指(i)已 Gross premiums in relation to a financial year of an 扣除保單中指明的折扣’或已扣除因風險的終止 insurer means (i) premiums after deduction of 或減少風險而作出的退款’但尙未扣除保險人分 discounts specified in policies or refunds of 出的再保險保費及其須付的佣金的保費;及 (11) premiums made in respect of any termination or 包括保險人根據所接受的再保險合約而可收取 reduction of risks but before deduction of premiums 的保費 ° for reinsurance ceded and of commissions payable by
the insurer; and (ii) includes premiums receivable by the insurer under reinsurance contracts accepted by the insurer.
保險代理人指顯示自己是一名或以上保險人的 Insurance agent is a person who holds himself out to 代理人或分代理人而在香港或從香港就保險合 advise on or arrange contracts of insurance in or from 約提供意見或安排該等合約的人° Hong Kong as an agent or subagent of one or more
insurers.
保險經紀指作爲保單持有人或潛在保單持有人 Inmrance broker is a person who carries on the 的代理人’在香港或從香港經營洽談或安排保險 business of negotiating or arranging contracts of 合約的業務的人’或經營就有關保險的事宜提供 insurance in or from Hong Kong as the agent of the 意見的業務的人 ° policy holder or potential policy holder or advising
them on matters related to insurance.
己 赏 • 指 扣 除 從 再 保 險 人 及 其 他 方 面 Net claims paid is the gross claims paid after 文回的款項後的已償付申索額 ° deduction of recoveries from reinsurers and other
parties.
淨保費就保險人的任何財政年度而言’指從毛 Net premium, in relation to a financial year of an 保費中扣除分出再保險保費後的淨額。 insurer, means the net amount after deduction from
the gross premiums of premiums for reinsurance ceded.
保單保費就保險人的任何財政年度而言’指(i) Office premiums, in relation to a financial year of an 如屬整付保費保單,保單持有人在該財政年度內 insurer,means (i) for policies with single mode of 所支付的保費;或 ( 1 1 )如屬定期繳付保費保單’ payment, the premiums paid by the policy holders 保單持有人在保單估値日期所結算的整年保費 during the financial year; or (ii) for policies with 或在該財政年度內所支付的彈性保費° regular mode of payment, the annualized premiums
of the policies as at the valuation date or the flexible premium paid by the policy holders during the financial year.
服務業統 i十摘要一九九九年 127

就業人數包括積極參與機構單位工作的在職東 Persons engaged in an establishment includes 主及股東;在統計曰期受僱於機構單位的全職僱 working proprietors and partners actively engaged in 員’包括長期或臨時聘用的’無論這些僱員正在 the work of the establishment; full-time employees 開工或因事假或者病假而暫時缺勤;及在統計日 paid by the establishment on the survey reference 期工作三小時或以上的兼職僱員和無酬家屬幫 date, both permanent and temporary, who are either 工� at work or on vacation or sick leave; and part-time
employees and unpaid family workers working three hours or more on the survey reference date.
儲備金是未滿期保費’未過期風險準備金及未 Technical reserves is the total of unearned premiums, 決申索準備金(包括已招致但未報賠申索準備金) unexpired risks provision and outstanding claims 的'總禾口 ° provision (including incurred but not reported
provision).
增加價値是生產總額減去中間投產消耗(生產 Value added is defined as the value of gross output 過程中所耗用的貨物和月艮務的價値)。 less the value of intermediate consumption (the value
of goods and services used up in the course of production).
118 Statistical Digest of the Services Sector 1999

統計圃表 Statistical Tables and Charts 表6.1 保險業的機構單位數目、就業人數、業務收益指數、生產總額及增加價値 Table 6.1 Number of Establishments and Persons Engaged, Business Receipts Index,
Gross Output and Value Added of the Insurance Industry 百萬元(另有註明除外) $ million, unless otherwise specified
1989 1990 1991 1992 1993 機構單位數目(1) [ 3 5 6 2 ] [ 4 2 3 8 ] 4 7 0 4 4 6 6 5 4 9 8 5 Number of establishments'" (23.4) (19.0) (11.0) (-0.8) (6.9) 就業人數⑴ [ 1 4 9 3 7 ] [ 1 8 2 3 0 ] 1 8 9 4 5 1 9 9 0 9 1 9 7 9 3 Number of persons engaged'" (15.7) (22.0) (3.9) (5.1) (-0.6)
業務收益指數(2) (1996=100) - - - 55.9 66.6 Business receipts mdex(2) (1996=100) - (19.1)
生產總額 6,166 6,910 8,224 9,806 12,764 Gross output (20.8) (12.1) (19.0) (19.2) (30.2)
增加價値 4,269 4,555 5,418 6,609 9,201 Value added (19.9) (6.7) (18.9) (22.0) (39.2)
在以要素成本計算的本地生產總値內所佔比率(%) 0 . 9 0 . 8 0 . 9 0 . 9 1 . 1 Contribution to GDP at factor cost (%) 增加價値在生產總額所佔比率 6 9 . 2 6 5 . 9 6 5 . 9 6 7 . 4 7 2 . 1 Value added as % of gross output
註釋:括號內的數字是與上年比較的變動百分率� Notes : Figures in brackets are percentage changes over the preceding year.
(1) 一九九一年及以後的數字是該年內四季的 (1) Figures for 1991 and onwards are averages of the 估計數字的平均數’而九一年以前的數字是 four quarterly estimates of the year, whereas 指該牟三月底的情況’ those prior to 1991 refer to the position as at end
March of the corresponding year. ( 2 )業務收益指數於一九九二統計年度開始編 (2) Business receipts indices were first available in
製� the reference year 1992. []一九九一年前的數字的涵蓋範圍與其後的 [ ] F i g u r e s prior to 1991 are slightly different in
略有不同’因此不可將兩組數字作嚴格比 coverage and therefore are not strictly 較 ° comparable with those for 1991 and onwards.
服務業統 i十摘要一九九九年 127

表6.1 (繽) 保險業的機構單位數目、就業人數、業務收益指數、生產總額及增加價値 Table 6.1 (Cont'd.) Number of Establishments and Persons Engaged, Business Receipts
Index, Gross Output and Value Added ofthe Insurance Industry 百萬元(另有註明除外)
$ million, unless otherwise specified 1994 1995 1996 1997 1998
機構單位數目⑴ 4 9 7 5 4 8 5 2 5 2 3 1 5 5 7 8 5 5 5 5 Number of es tabl i shments� (-0.2) (-2.5) (7.8) (6.6) (-0.4)
就 業 人 數 2 0 2 7 1 2 2 2 6 0 2 4 8 6 6 2 2 8 9 8 2 4 7 4 6 Number of persons e n g a g e d � (2.4) (9.8) (11.7) (-7.9) (8.1) 業務收益指數(1996=100) 82.1 93.3 100.0 110.8 115.9 Business receipts index�(1996=100) (23.3) (13.6) (7.2) (10.8) (4.6)
生產總額 16,106 16,601 16,166 16,348 N.A. Gross output (26.2) (3.1) (-2.6) (1.1) N.A.
增加價値 11,868 11,824 11,104 10,764 N.A. Value added (29.0) (-0.4) (-6.1) (-3.1) N.A.
在以要素成本計算的本地生產總値內所佔比率(%) 1 . 2 1 . 2 1 . 0 0 . 9 N . A . Contribution to GDP at factor cost (%) 增加價値在生產總額所佔比率 7 3 . 7 7 1 . 2 6 8 . 7 6 5 . 8 N . A . Value added as % of gross output
註釋:括號內的數字是與上年比較的變動百分率° Notes : Figures in brackets are percentage changes over the preceding year.
(1) 一九九一年及以後的數字是該年內四季的 (1) Figures for 1991 and onwards are averages o f t h e 估言十數字的举均叙,而九一年以前的數字是 four quarterly estimates of the year, whereas i®該年三月 青況 ° those prior to 1991 refer to the position as at end
March of the corresponding year. ( 2 )業務收益指數於一九九二統計年度開始編 (2) Business receipts indices were first available in
製 ° the reference year 1992.
134 Statistical Digest of the Services Sector 1999

圓6.1 保險業的機構單位數目<”及就業人數<”
Chart 6.1 Number of Establishments'" and Persons Engaged") in the Insurance Industry
機構單位數目 就業 A數 Number of establishments Number of persons engaged
6 000 1 30 000
mm 5 000 cmx mm - - - _ - … 二 纖 ! - - - 25 000
• 普 g _ 厕
3 000 - - - 隱 圓 圓 議 — — • — — 隱 _ 隱 - … 1 5 000
• … … • … — — — — — — — — — — — — 急 … 暴 … 屨 ― … 麗 一 。
: ― t t l i t t l J — r 1991 1992 1993 1994 1995 1996 1997 1998
_ 機 構 單 位 數 目 就業人數 Number of establishments Number of persons engaged
註釋:(1) 數字是該年內四季的估計數字的平均數� Note : (1) Figures are averages of the four quarterly estimates of the year.
服務業統計摘要一九九九年 135

表6.2 保險人、保險經紀、保險代理人及精算師數目 Table 6.2 Number of Insurers, Insurance Brokers, Insurance Agents and Actuaries
1991 1992 1993 1994 獲授權保險人數目⑴ 2 4 0 2 3 3 2 2 9 229 Number of authorized insurers'" • - (-2.9) (-1.7) (0.0)
長期業務 4 0 4 0 4 0 4 1 Long term business only - (0.0) (0.0) (2.5) 一般業務 1 7 7 1 7 3 1 7 0 1 6 9 General business only - (-2.3) (-1.7) (-0.6) 綜合業務 2 3 2 0 1 9 1 9 Composite business - (-13.0) (-5.0) (0.0)
只 獲 授 權 經 營 再 保 險 業 務 的 保 險 人 數 目 3 0 Number of insurers authorized to carry on -reinsurance business only®
獲 授 權 保 險 經 紀 數 目 - - - -Number of authorized insurance b r o k e r s � -
獲 委 任 保 險 代 理 人 數 目 - - - -Number of appointed insurance a g e n t s � -
個人代理人 - - - -Individual agents -公司代理人 - - - -Corporate agents -
精算師人數⑷ - - 64 81 Number of actuaries*"*) - - “ {Ib.b) 註釋:括號內的數字是與上年比較的變動百分率� Notes : Figures in brackets are percentage changes over the
preceding year. ( 1 )數字由保險業監理處自一九九一年開始提 (1) Figures were first available from the Office of the
供� Commissioner of Insurance in 1991. (2) i:字由保險業監理處自一九九四年開始提 (2) Figures were first available from the Office of the
供� Commissioner of Insurance in 1994. (3) 二九九五年前’保險經紀及保險代理人無須 (3) Registration of insurance brokers and agents was
註冊� not required before 1995. (4) 數字由香港精算學會自一九九三年開始提 (4) Figures were first available from the Actuarial
供� Society of Hong Kong in 1993.
136 Statistical Digest of the Services Sector 1999

表6.2 (續) 保險人、保險經紀、保險代理人及精算師數目
Table 6.2 (Cont'd) Number of Insurers, Insurance Brokers, Insurance Agents and Actuaries
1995 1996 1997 1998 獲授權保險人數目(I) 223 223 215 209 Number of authorized insurers'" (-2.6) (0.0) (-3.6) (-2.8)
長期業務 42 46 45 45 Long term business only (2.4) (9.5) (-2.2) (0.0) 一般業務 161 158 151 146 General business only (-4.7) (-1.9) (-4.4) (-3.3) 綜合業務 20 19 19 18 Composite business (5.3) (-5.0) (0.0) (-5.3)
只 獲 授 權 經 營 再 保 險 業 務 的 保 險 人 數 目 3 1 29 29 29 Number of insurers authorized to carry on (3.3) (-6.5) (0.0) (0.0) reinsurance business only(2)
獲 授 權 保 險 經 紀 數 目 2 9 5 317 320 330 Number of authorized insurance b roke r s� - (7.5) (0.9) (3.1)
獲 委 任 保 險 代 理 人 數 目 2 8 919 31 473 34 812 42 647 Number of appointed insurance a g e n t s � - (8.8) (10.6) (22.5)
個人代理人 25 540 28 085 31 241 39 223 Individual agents - (10.0) (11.2) (25.5) 公司代理人 3 379 3 388 3 571 3 424 Corporate agents - (0.3) (5,4) (-4.1)
精算師人數⑷ 91 108 122 195 Number of ac tuar ies� (12.3) (18.7) (13.0) (59.8) 註釋:括號內的數字是與上年比較的變動百分率� Notes : Figures in brackets are percentage changes over the
preceding year. ( 1 ) 數字由保險業監理處自一九九一年開始提 (1) Figures were first available from the Office of the
供� Commissioner of Insurance in 1991. (2) 數字由保險業監理處自一九九四年開始提 (2) Figures were first available from the Office of the
供 ° Commissioner of Insurance in 1994. (3) 一九九五年前’保險經紀及保險代理人無須 (3) Registration of insurance brokers and agents was
註冊� not required before 1995. (4) 數字由香港精算學會自一九九三年開始提 (4) Figures were first available from the Actuarial
供� Society of Hong Kong in 1993.
服務業統計摘要一九九九年 1 3 7
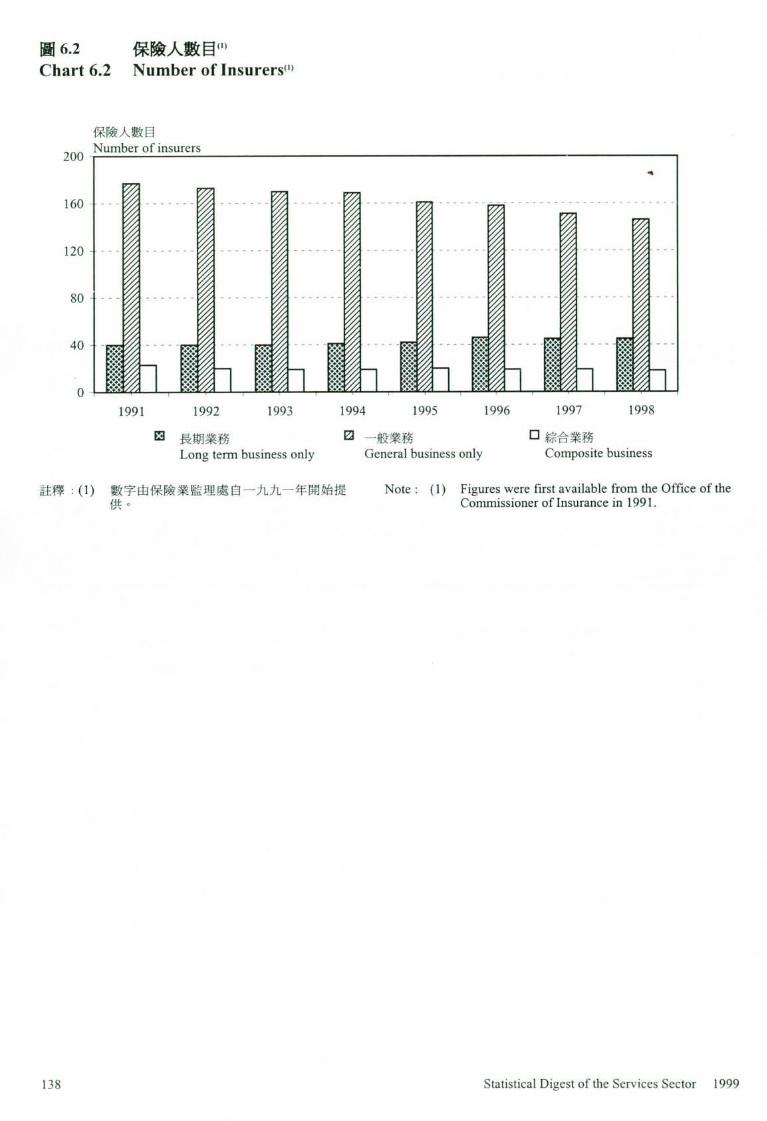
圓6.2 保險人數目⑴
Chart 6.2 Number of Insurers�
保險人數目
200 Number of insurers
160 隱 隱 _ 陽 圆 吻
.0-4....I…………I……I--I……I…•…隱… 如 … . . . . …
: : j | i j l i i t i t J l i M i J t 1991 1992 1993 1994 1995 1996 1997 1998
E 長 期 業 務 0 —般業務 •綜合業務
Long term business only General business only Composite business
註釋:⑴數字由保險業監理處自一九九一年開始提 Note: (1) Figures were first available from the Office of the 供 ° Commissioner of Insurance in 1991.
138 Statistical Digest of the Services Sector 1999
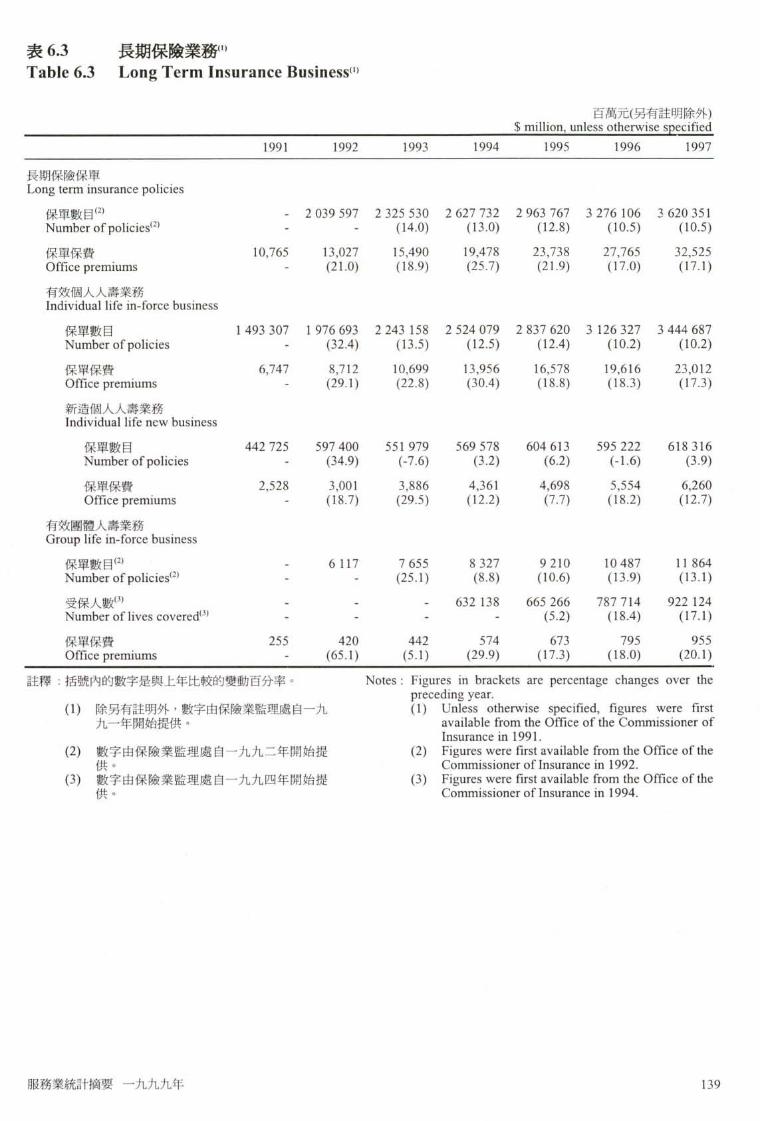
表6.3 長期保險業務 Table 6.3 Long Term Insurance Business�
百萬元(另有註明除外) $ million, unless otherwise specified 1991 1992 1993 1994 1995 1996 1997
長期保險保單 Long term insurance policies 保單數目(2) - 2 039 597 2 325 530 2 627 732 2 963 767 3 276 106 3 620 351 Number of policies � - - (14.0) (13.0) (12.8) (10.5) (10.5) 保單保費 10,765 13,027 15,490 19,478 23,738 27,765 32,525 Office premiums - (21.0) (18.9) (25.7) (21.9) (17.0) (17.1) 有效個人人壽業務 Individual life in-force business
保單數目 1 493 307 1 976 693 2 243 158 2 524 079 2 837 620 3 126 327 3 444 687 Number of policies - (32.4) (13.5) (12.5) (12.4) (10.2) (10.2) 保單保費 6,747 8,712 10,699 13,956 16,578 19,616 23,012 Office premiums - (29.1) (22.8) (30.4) (18.8) (18.3) (17.3) 新造個人人壽業務 Individual life new business
保單數目 442 725 597 400 551 979 569 578 604 613 595 222 618 316 Number of policies - (34.9) (-7.6) (3.2) (6.2) (-1.6) (3.9) 保單保費 2,528 3,001 3,886 4,361 4,698 5,554 6,260 Office premiums - (18.7) (29.5) (12.2) (7.7) (18.2) (12.7)
有效團體人壽業務 Group life in-force business 保單數目(2) - 6 117 7 655 8 327 9 210 10 487 11 864 Number of policies � - - (25.1) (8.8) (10.6) (13.9) (13.1) 受 保 人 數 - - 632 138 665 266 787 714 922 124 Number of lives c o v e r e d � - (5.2) (18.4) (17.1) 保單保費 255 420 442 574 673 795 955 Office premiums - (65.1) (5.1) (29.9) (17.3) (18.0) (20.1)
註釋:括號內的數字是與上年比較的變動百分率° Notes : Figures in brackets are percentage changes over the preceding year.
(1) 除另有註明外’數字由保險業監理處自一九 (1) Unless otherwise specified, figures were first 九一年開$台提供� available from the Office of the Commissioner of
Insurance in 1991. ( 2 )數字由保險業監理處自一九九二年開始提 (2) Figures were first available from the Office of the
供 ° Commissioner of Insurance in 1992. (3) 數字由保險業監理處自一九九四年開始提 (3) Figures were first available from the Office of the
供� Commissioner of Insurance in 1994.
服務業統計摘要一九九九年 139

表 6 . 3 (續) 長期保險業務⑴
Table 6.3 (Cont'd.) Long Term Insurance Business�
百萬元(另有註明除外) $ million, unless otherwise specified
1991 1992 1993 1994 1995 1996 1997 退休計劃業務
(4)
Retirement scheme business'"' 保單數目 <5) 5 9 4 9 6 2 7 1 9 0 4 6 1 1 0 5 7 1 2 2 6 2 1 3 5 4 9 1 2 9 4 0 Number of po l i c i e s� - (5.4) (44.3) (22.2) (10.9) (10.5) (9.1) 受保人數⑶.(5) - - - 4 1 4 2 7 9 4 2 2 0 3 6 4 5 8 9 5 3 4 2 0 0 9 6 Number of lives - (1.9) (8.7) (6.3) covered(3)’(5) 供款 3,735 3,847 4,292 4,867 6,370 7,248 8,454 Contributions - (3.0) (11.6) (13.4) (30.9) (13.8) (16.6)
年金業務 Annuity business
保單數目 1 4 1 1 4 0 1 6 1 2 1 5 2 5 8 2 6 9 2 6 6 Number of policies - (-0.7) (15.0) (33.5) (20.0) (4.3) (-1.1) 保單保費 1 . 1 3 , 9 0 . 4 1 . 8 2 7 . 3 2 . 0 2 . 5 Office premiums - (254.5) (-89.7) (350.0) (1416.7) (-92.7) (25.0)
永久健康業務 Permanent health business 保單數目 4 2 6 4 0 5 0 3 7 6 6 5 5 1 0 8 4 0 5 4 1 0 4 4 1 7 1 2 5 4 7 4 1 5 0 5 9 4 Number of policies - (18.1) (30.0) (28.3) (24.2) (20.2) (20.0) 保單保費 2 8 4 4 5 7 7 9 9 0 1 0 5 1 0 3 Office premiums - (59.6) (30.3) (38.6) (13.2) (16.6) (-2.0)
註釋:括號內的數字是與上年比較的變動百分率° Notes : Figures in brackets are percentage changes over the preceding year.
(1) 除另有註明外’數字由保險業監理處自一九 (1) Unless otherwise specified, figures were first ;一開 $台提供 � available from the Office of the Commissioner of
Insurance in 1991. (3) 數字由保險業監理處自一九九四年開始提 (3) Figures were first available from the Office of the
供“ Commissioner of Insurance in 1994. (4) 只包括受保險安排所規管的退休計劃° (4) Including only the part of retirement schemes
managed by insurance arrangement. (5) 一九九七年的數字是根據新的分類基礎而 (5) Figures for 1997 are derived from a new basis of
制定’在新基礎下九六年的保單數目及受保 classification, and the corresponding figures for 人數分別爲 11 865 及 395 272 ’ 而*關百 1996 under the new basis are 11 865 for number 分率反映了新基礎下的增減率 ° of policies and 395 272 for number of lives
covered respectively. The percentage figures reflect the percentage changes under the new basis.
140 Statistical Digest of the Services Sector 1999

表6.4 —般保險業務⑴ Table 6.4 General Insurance Business�
百萬元(另有註明除外) $ million, unless otherwise specified
1991 1992 1993 1994 1995 1996 1997 毛保費 11,246 14,182 17,082 19,737 20,087 18,508* 19,483
Gross premiums - (26.1) (20.5) (15.5) (1.8) (-7.9) (5.3) 直接業務 8,511 10,988 12,826 14,828 15,249 14,250 15,058
Direct business - (29.1) (16.7) (15.6) (2.8) (-6.5) (5.7) 分入再保險業務 2,736 3,194 4,256 4,909 4,838 4,258* 4,425 Reinsurance inward business - (16.7) (33.3) (15.3) (-1.4) (-12.0) (3.9)
儲備金 6,182 7,796 9,685 12,225 14,461 14,890* 16,234
Technical reserves - (26.1) (24.2) (26.2) (18.3) (3.0) (9.0) 直接業務 4,137 5,589 6,727 8,538 9,660 10,167* 10,894
Direct business - (35.1) (20.4) (26.9) (13.1) (5.2) (7.2) 分入再保險業務 2,045 2,207 2,958 3,687 4,802 4,723* 5,341 Reinsurance inward business - (7.9) (34.0) (24.6) (30.2) (-1.6) (13.1)
須付的佣金 3,352 4,161 4,529 4,860 5,212 4,723* 4,981 Commissions payable - (24.1) (8.8) (7.3) (7.3) (-9.4) (5.5)
直接業務 2,500 3,230 3,292 3,493 3,893 3,545 3,801
Direct business - (29.2) (1.9) (6.1) (11.5) (-8.9) (7.2) 分入再保險業務 852 931 1,237 1,367 1,319 1,178* 1,180 Reinsurance inward business - (9.3) (32.8) (10.5) (-3.5) (-10.7) (0.2)
已償付申索毛額 5,355 6,220 7,419 7,224 7,796 8,459* 9,360 Gross claims paid - (16.1) (19.3) (-2.6) (7.9) (8.5) (10.7)
直接業務 3,732 4,289 5,010 4,855 5,725 6,335 7,172
Direct business - (14.9) (16.8) (-3.1) (17.9) (10.6) (13.2) 分入再保險業務 1,624 1,931 2,409 2,369 2,071 2,124* 2,188 Reinsurance inward business - (19.0) (24.7) (-1.7) (-12.6) (2.6) ^
註釋:括號內的數字是與上年比較的變動百分率� Notes : Figures in brackets are percentage changes over the preceding year.
(1)數字由保險業監理處自一九九一年開始提 (1) Figures were first available from the Office of the 供� Commissioner of Insurance in 1991.
服務業統計摘要一九九九年 141
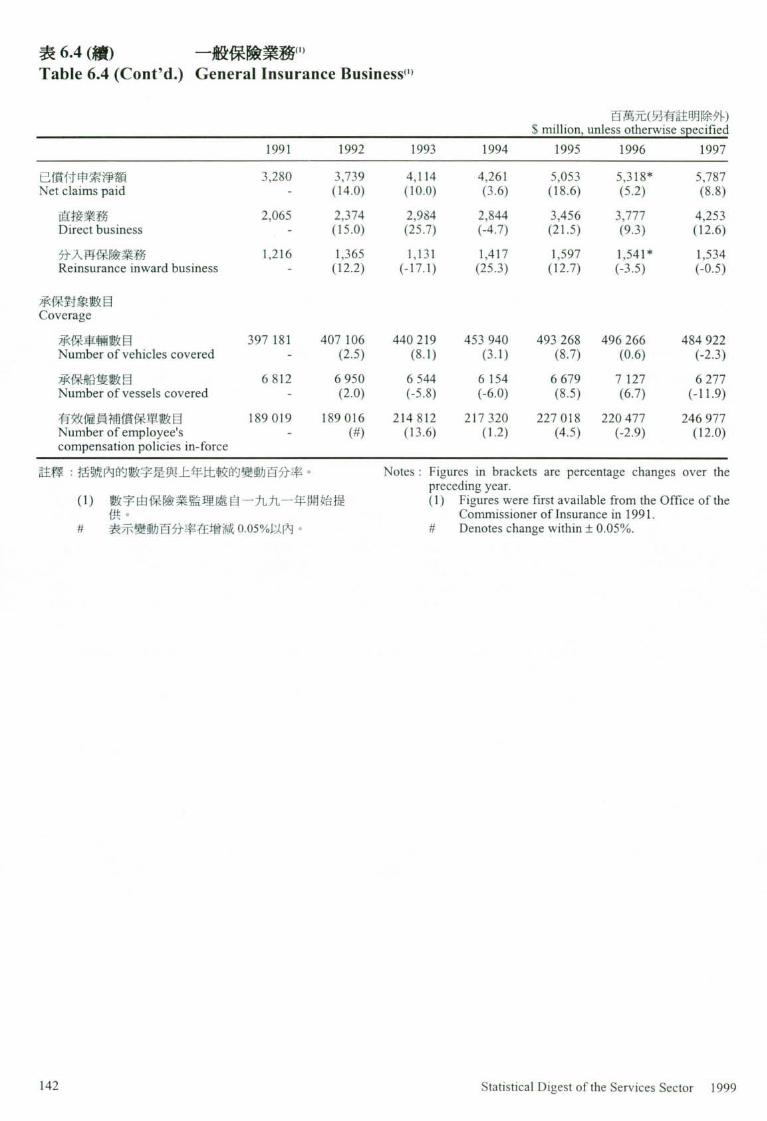
表 6 . 4 (繽) 一般保險業務<” Table 6.4 (Cont'd.) General Insurance Business�
百萬元(另有註明除外) $ million, unless otherwise specified 1991 1992 1993 1994 1995 1996 1997
已償付申索淨額 3,280 3,739 4,114 4,261 5,053 5,318* 5,787 Net claims paid - (14.0) (10.0) (3.6) (18.6) (5.2) (8.8)
直接業務 2,065 2,374 2,984 2,844 3,456 3,777 4,253 Direct business - (15.0) (25.7) (-4.7) (21.5) (9.3) (12.6) 分入再保險業務 1,216 1,365 1,131 1,417 1,597 1,541* 1,534 Reinsurance inward business - (12.2) (-17.1) (25.3) (12.7) (-3.5) (-0.5)
承保對象數目 Coverage 承保車輔數目 3 9 7 1 8 1 4 0 7 1 0 6 4 4 0 2 1 9 4 5 3 9 4 0 4 9 3 2 6 8 4 9 6 2 6 6 4 8 4 9 2 2 Number of vehicles covered - (2.5) (8.1) (3.1) (8.7) (0.6) (-2.3) 承保船隻數目 6 8 1 2 6 9 5 0 6 5 4 4 6 1 5 4 6 6 7 9 7 1 2 7 6 2 7 7 Number of vessels covered - (2.0) (-5.8) (-6.0) (8.5) (6.7) (-11.9) 有效僱員補償保單數目 1 8 9 0 1 9 1 8 9 0 1 6 2 1 4 8 1 2 2 1 7 3 2 0 2 2 7 0 1 8 2 2 0 4 7 7 2 4 6 9 7 7 Number of employee's - (#) (13.6) (1.2) (4.5) (-2.9) (12.0) compensation policies in-force
註釋:括號內的數字是與上年比較的變動百分率° Notes : Figures in brackets are percentage changes over the preceding year.
( 1 )數字由保險業監理處自一九九一年開始提 (1) Figures were first available from the Office of the 供 ° Commissioner of Insurance in 1991.
# —示變動百分率在增減 0.05%以內” # Denotes change within ± 0.05%.
142 Statistical Digest of the Services Sector 1999

圓 6 . 3 保費收入⑴ Chart 6.3 Premium Income�
百萬元 $ million
60,000 n
50,000 ^ ^
40,000 ^ ^ ^ ^ ^ ^ ^ ^
30,000 - - - - ^ ^ ^ ^ ^ ^
20,000 - ^ - ^ ^ ^ ^ 巡
1 {),()()()
0 ‘ — — —
1991 1992 1993 1994 1995 1996 1997
口長期保險的保單保費 H —般保險的毛保費 Office premiums of long term insurance Gross premiums of general insurance
註釋:(1 )數字由保險業監理處自一九九一年開始提 Note: (1) Figures were first available from the Office of the 供 o Commissioner of Insurance in 1991.
服務業統 i十摘要一九九九年 1 4 3

表 6 . 5 受保險安排所規管的職業退休計劃(”
Table 6.5 Occupational Retirement Schemes Regulated by Insurance Arrangement'"
1995 1996 1997 1998 受保險安排所規管的計劃數目 7 4 8 5 8 9 8 9 9 9 1 1 1 0 4 5 2 Number of schemes regulated by insurance - (20.1) (10.3) (5.5) arrangement
獲豁免的計劃數目 1 4 6 2 3 9 2 5 6 2 5 4 Number of exempted schemes - (63.7) (7.1) (-0.8) 巳註冊的計劃數目 7 3 3 9 8 7 5 0 9 6 5 5 1 0 1 9 8 Number of registered schemes - (19.2) (10.3) (5.6)
受保險安排所規管及已註冊的ft劃成員數目 241 000 289 000* 305 000 320 000 Number of members covered by registered - (19.9) (5.6) (4.8) schemes regulated by insurance arrangement
佔就業人口比率 9 1 0 1 0 1 0 As % of employed population
註釋:括號內的數字是與上年比較的變動百分率� Notes : Figures in brackets are percentage changes over the preceding year.
(1) 職業退休計劃條例於一九九三年十月十五 (1) The Occupational Retirement Schemes Ordinance 曰開始運作。在條例正式實行之前,現有計 came into operation on 15 October 1993. There 劃的僱主可於爲期兩年的過渡期內申請註 was a two-year transitional period for employers 冊诚豁免°過渡期於;^五年+月十五日完 of schemes which already existed prior to the 糸吉� commencement of the ordinance to apply for
registration or exemption. The transitional period ended on 15 October 1995.
144 Statistical Digest of the Services Sector 1999

表6.6 香港出口信用保險局的保險業務
Table 6.6 Insurance Business of the Hong Kong Export Credit Insurance Corporation 百萬元(另有註明除外)
$ million, unless otherwise specified 1989 1990 1991 1992 1993
出口信用保險保單數目⑴ 1 798 1 849 1 951 2 013 1 995
Number of export credit insurance po l i c i es� (6.6) (2.8) (5.5) (3.2) (-0.9)
出口信用保險服務的保費淨收入⑴ 4 8 5 1 6 0 6 8 6 9 Net premium income of export credit insurance (13.8) (6.9) (17.7) (12.4) (1.3) se rv ices� 受保出口貨値⑴ 10,730 11,748 13,827 15,111 15,652
Insured exports'" (15.2) (9.5) (17.7) (9.3) (3.6) 成衣及紡織品 3,520 3,596 4 657 5 002 5 241
Clothing and textiles (9.6) (2.2) (29.5) (7.4) (4.8) 玩具 1,122 1,431 1,576 1,747 1,982
Toys (20.9) (27.5) (10.1) (10.9) (13.5) 塑膠、金屬和皮革製品 923 1,070 1,288 1,246 1,691
Plastic, metallic and leather goods (16.2) (15.9) (20.4) (-3.3) (35.7) 電子產品 984 1,222 1,458 1,384 1,179
Electronics (8.1) (24.2) (19.3) (-5.1) (-14.8) 其他 4,181 4,429 4,848 5,732 5,559
Others (20.5) (5.9) (9.5) (18.2) (-3.0) 實付賠償⑴ 22 25 31 39 35
Cash claims payments'" (-29.6) (12.4) (24.8) (25.1) (-11.9)
受保出口貨値佔本地整體出口貨値比率 1_9 1-8 1_8 1-6 Insured exports as a % of total value of exports of Hong Kong 註釋:括號內的數字是與上年比較的變動百分率 ° Notes : Figures in brackets are percentage changes over the
preceding year. (1) 指截至該年三月底的十二個月內的總計。 (1) Figures refer to the total in the twelve-month
period ended March of the corresponding year.
服務業統計摘要一九九九年 145

表6.6 (纊) 香港出口信用保險局的保險業務
Table 6.6 (Cont'd.) Insurance Business of the Hong Kong Export Credit Insurance Corporation
百萬元(另有註明除外) $ million, unless otherwise specified 1994 1995 1996 1997 1998
出口信用保險保單數目⑴ 2 0 7 1 2 0 6 8 2 1 0 8 2 3 5 4 2 0 4 3 Number of export credit insurance policies'" (3.8) (-0.1) (1.9) (11.7) (-13.2)
出口信用保險服務的保費淨收入⑴ 7 2 7 3 7 5 8 1 8 6 Net premium income of export credit insurance (4.3) (1.4) (2.9) (8.9) (6.2) s e rv i ce s� 受保出口貨値⑴ 15,631 16,674 17,612 20,113 21,549 Insured e x p o r t s � (-0.1) (6.7) (5.6) (14.2) (7.1)
成衣及紡織品 5,121 5,210 5,573 5,860 5,478 Clothing and textiles (-2.3) (1.7) (7.0) (5.1) (-6.5) 玩具 1,816 1,847 1,879 2,394 2,669 Toys (-8.4) (1.7) (1.7) (27.4) (11.5) 塑膠、金屬和皮革製品 1,675 1,820 2,121 2,238 2,377 Plastic, metallic and leather goods (-0.9) (8.7) (16.5) (5.5) (6.2) 電子產品 1 , 1 4 0 1 , 0 4 5 1 , 2 6 2 1 , 7 1 7 1 , 5 2 5 Electronics (-3.3) (-8.3) (20.8) (36.1) (-11.2) 其他 5,879 6,752 6,777 7,904 9,500 Others (5.8) (14.8) (0.4) (16.6) (20.2)
實付賠償⑴ 5 1 4 3 4 5 7 1 6 2 Cash claims p a y m e n t s � (48.0) (-17,1) (5.8) (57.0) (-12,6)
受保出口貨値佔本地整體出口貨値比率 1 . 3 1 . 2 1 . 3 1 . 4 1 . 5 Insured exports as a % of total value of exports of Hong Kong 註釋:括號內的數字是與上年比較的變動百分率 ‘ Notes : Figures in brackets are percentage changes over the
preceding year. (1) 指截至該年三月底的十二個月內的總計。 (1) Figures refer to the total in the twelve-month
period ended March of the corresponding year.
146 Statistical Digest of the Services Sector 1999

圓 6 . 4 出口信用保險保單的受保出口貨値<”及佔本地整體出口貨値的比率 Chart 6.4 Value of Insured Exports'" Covered by Export Credit Insurance Policies and as
a Percentage of Total Value of Exports of Hong Kong
受保出口貨値佔本
地整體出口貨丨直比率
受保出 口貨値(百萬元) Insured exports as a % of total Value of insured exports ($ million) value of exports of Hong Kong
30,000 n 3.0
25,000 2.5
20,000 ^ ' - ' ' ' 2.0
15,000 ^ . , ^ • ‘ ‘ ' • • • • •^ •C . .^ - - 1-5
10,000 1.0
5,000 0.5
0 ! I I I ! 1 ! 1 1 I 0.0 1989 1990 1991 1992 1993 1994 1995 1996 1997 1998
- - • 受 保 出 口 貨 値 受保出口貨値佔本
Value of insured exports 地整體出口貨値比率
Insured exports as a % of total value of exports of Hong Kong
註釋:(1) 指截至該年三月底的十二個月內的總計。 Note: (1) Figures refer to the total in the twelve-month period ended March of the corresponding year.
表 6 . 7 保險業的選定最新統計數字 Table 6.7 Selected Up-to-date Statistics on Insurance Services
1998 1 999 第一季 第二季 第三季 第四季 第一季 ^ Q2 ^ ^ ^
機構單位數目 5 2 0 5 5 3 6 3 5 8 1 7 5 8 3 4 6 2 2 0 Number of establishments 就業人數 2 2 4 9 1 2 6 0 4 7 2 6 4 5 1 2 3 9 9 4 2 4 1 7 2 Number of persons engaged
業務收益指數(1996=100) 109.6 120.8 109.4 123.8* 124.2 Business receipts index (1996=100)
服務業統計摘要一九九九年 147

資料來源 Data Sources 表 資料來源 Table Sources 6.1 政府'統言十處 6.1 Census and Statistics Department 6.2 香港精算學會; 6.2 Actuarial Society of Hong Kong ;
保險業監理處 Office of the Commissioner of Insurance
6.3-6.4 保險業監理處 6.3-6.4 Office of the Commissioner of Insurance
6.5 職業退休計劃註冊處 6.5 Office of the Registrar of Occupational Retirement Schemes
6.6 香港出口信用保險局 6.6 Hong Kong Export Credit Insurance Corporation
其他有關刊物 Further References 年報,香港出口信用保險局編製 Amual Report, published by the Hong Kong Export
Credit Insurance Corporation 年報‘香港保險業監理處及職業退休計劃註冊 Annual Report, published by the Office of the 處編製 Commissioner of Insurance and the Registrar of
Occupational Retirement Schemes Hong Kong 就業及空缺統胃f(詳細統計表) Employment and Vacancies Statistics (Detailed
Tables) 本地生產總値估計 Estimates of Gross Domestic Product 服務行業按季業務收益指數 Quarterly Business Receipts Indices for Service
Industries 就業、空缺及薪金總額按季統計報告 Quarterly Report of Employment, Vacancies and
Payroll Statistics 本地生產總値估計按季報告 Quarterly Report of Gross Domestic Product Estimates 香港統計年干fJ Hong Kong Annual Digest of Statistics 香港統計月刊 Hong Kong Monthly Digest of Statistics 倉庫、通訊、財務、保險及商用服務按年統計 Report on Annual Survey of Storage, Communication, 調查幸艮告 Financing, Insurance & Business Services
118 Statistical Digest of the Services Sector 1999

^ 陸上運輸業 / Land Transport Services
槪要 Highlights 香港的陸上運輸服務方便快捷、四通八達’ Hong Kong's land transport services are efficient, 而且十分安全 ° 一 九 九 年 ’ P幸上運輸工具 geographically comprehensive and safe. They served 每日載客超過 1 000 萬人次。 more than 10 million passenger journeys a day in
1998. 一九九七年’來自陸上運輸業的增加價値約 T h e land t ranspor t indus t ry gene ra t ed a b o u t $30 .4 304 億元,佔該年本地生產總値的 2.5%。一 billion value added in 1997,or 2.5% of Hong Kong's 九九八年’提供主要陸上運輸服務的機構單 Gross Domestic Product (GDP) in the year. In 1998, 位共有 294 間’包括提供公共巴士服務、電 there were a total of 294 establishments providing the 車及鐵路運輸服務、停車場服務和汽車隧道 main land transport services. These included 月艮務的公司,估計在九八年內從事主要陸上 companies providing motor bus services, tramway 運輸行業的人士約有 38 000 名 ° and railway services, car park services and vehicular
tunnel services. It was estimated that some 38 000 people were involved in providing main land transport services in 1998.
陸上公共交通工具是香港市民最普遍使用 Public land transport is the most popular mode of 的“在一九九乂\年的每天 ’ transport in Hong Kong. Every day in 1998, 一六間主要巴士公司合共提供超過 600 條 - t h e six main bus companies together carried 3.9
路線’載客 390 萬人次; million passenger journeys on a network of over 600 routes;
—地下鐵路’包括一九九八年敗用的機場快 - t h e Mass Transit Railway, including the Airport 綫及東涌錢’共有 923 個車卡’載客超過 Express and the Tung Chung Line opened in 1998, 220 萬人次; operated a fleet of 923 rail cars, handled over 2.2
million passenger journeys;
一九廣鐵路 (東鐵 )有 351 個車卡’鐵路長 34 - the Kowloon-Canton Railway (East Rail) carried 公里’載客超過 737 000 人次; over 737 000 passenger journeys with a fleet of
351 cars along a 34-kilometre railway;
一九廣鐵路(輕鐵)有 l ! 9 個車卡’載客 - t h e Kowloon-Canton Railway (Light Rail) 314 000 人次; handled 314 000 boardings with a fleet of 119
cars; — 1 6 1 輛電車行走港島北岸全長 16.8 公里 - t h e electric trams served 254 500 boardings with
的雙程路軌,載客 254 500 人次; 161 trams along its 16.8-kilometre double track, which runs along the northern shore of Hong Kong Island;
服務業統 i十摘要一九九九年 127
—公共小巴共 4 300 架’每架最多可載 16 - a fleet of 4 300 public light buses, each with a 人‘載客近 180 萬人次; maximum passenger capacity of 16, carried over
almost 1.8 million passenger journeys;
一 共 18 000 架的士 ’ 載客 130 萬車程;及 - a t o t a l o f 18 000 taxis served 1.3 million passenger trips; and
一山頂纜車直達海拔 3 7 3 米的山頂,途經的 - t h e Peak Tramways, climbing 373 metres on 地點’有些斜度達 1 比 2 ’載客超過 9 100 gradients as steep as one-in-two, carried 9 100 人次,大音 分是觀光的遊客 ° passenger trips, mostly for sightseers.
一九九八年,香港與中國內地的陸上過境交 In 1998,cross-border land traffic between Hong Kong 通持續錄得增長’客運量增加 19% ’ 而汽車 and the mainland of China registered a continued 流量增加 3 % � 每日經各個出入境管制站過境 growth of 19% in passenger traffic and 3% in 的人數約 21 1 000 人’而平均每曰經過三個 vehicular traffic. Every day, some 211 000 people 邊境通道的車輛共 26 800 架次’其中 87% crossed the border at various control points. The three 是貨運車輛’反映香港與中國內地日益密切 road crossing points together handled an average of 的聯繁。爲方便陸上過境交通’羅湖及落馬 26 800 vehicles a day. Goods vehicles accounted for 洲管制站於九八年十月起延長開放時間 ° 87% of the traffic, reflecting the ever closer links with
the mainland of China. To facilitate the cross-border land traffic, the opening hours of control points at Lowu and Lok Ma Chau were extended as from October 1998.
鐵路運輸在香港與中國內地之間的客運和貨 Railways continued to play an important role in 運交通方面仍擔當重要的角色。一九九八 carrying passenger and freight traffic between Hong 年’乘火車過境的旅客有 6 700 萬人次。由 Kong and the mainland of China. In 1998, some 67 中國內地進口的貨物共 324 000 公噸、牲畜 million passengers crossed the border by rail. A total 130 萬頭;由香港出口 往中國內地的貨物共 of 324 000 tonnes of goods and 1.3 million heads of 138 000 公噸 ° livestock were imported from, and 138 000 tonnes of
goods exported to, the mainland of China.
香港擁有全世界最繁忙的道路,在一九九八 Hong Kong has the busiest roads in the world, 年年底’路面行車密度爲每公里 268 架。政 registering a vehicle density of 268 vehicles per 府於九八年興建了 3 4公里可行車的道路’反 kilometre of road at the end of 1998. Reflecting 映政府一直致力改善路面車輛的流動1青況 ° government's continued efforts in improving 九八年年底’按每百名人口計算的可行車道 vehicular flows on roads, 34 kilometres of new 路長度爲 27 .4 米’較八九年多 7% ° trafficable roads were made available in 1998. Length
of trafficable roads per 100 population averaged to 27.4 metres at the end of 1998,7% more than in 1989.
118 Statistical Digest of the Services Sector 1999

主要統計數字 Key Statistics
陸上運輸業 Land Transport Industry 機構單位數目 就業人數 就業人數
(不包括的士、公共小巴(不包括的士、公共小巴(包括的士、公共小巴及增加價値 業務收益
年 及貨運車輛的營運者及貨運車輛的營運者貨運車輛的營運 ) (2>’ <
3) (百萬元) 指數
(4> Year Number of Number of Number of Value added Business establishments persons engaged persons engaged ($ million) receipts (not including operators (not including (including operators of index� of taxis, public light operators of taxis, taxis, public light buses (1996=100) buses and goods public light buses and and goods v e h i c l e s ) ® . �
vehicles)。) goods vehicles)。)
1989 [100] [22 946] - 12,908 -1990 [123] [24 266] - 15,517 -1991 144 25 013 116 300 17,147 -1992 132 26 140 126 400 20,861 -1993 153 27 300 131 900 22,937 -1994 184 28 977 141 200 25,897 -1995 230 31 459 135 800 27,616 -1996 253 32 687 140 100 29,679 100.0 1997 267 34 797 146 700* 30,372 106.0 1998 294 37 783 157 400 N.A. 108.3
註釋:(1) 一九九一年及以後的數字是該年內四季的 Notes: (1) Figures for 1991-1997 are averages of the four 估計數字的平均數’而九一年以前的數字是 quarterly estimates of the year, whereas those prior 指該年三月底的情況 ° to 1991 refer to the position as at end March of the
corresponding year. ( 2 )數字是該年內四季的估計數字的平均數。 (2) Figures are averages of the four quarterly estimates
of the year. ( 3 )爲包括的士、公共小巴及貨運車輛的營運者 (3) Specially estimated to take into account operators
而編製的特別估計數字’在曰後得到更多資 of taxis,public light buses and goods vehicles. The 料時可能會作出修訂 ° figures are subject to revisions later on as more data
become available. (4) 業務收益指數於一九九二統計年度開始編 (4) Business receipts were first available in the
製’但此詳細分類的指數則於九六年開始編 reference year 1992, but indices at such detailed 製 ° breakdown were first compiled in 1996.
[]一九九一年前的數字的涵蓋範圍與其後的 [ ] F i g u r e s prior to 1991 are slightly different in 略 有 不 同 ’ — 此 不 亩 將 兩 組 數 字 b 嚴 c o v e r a g e and therefore are not strictly comparable 較° with those for 1991 and onwards.
服務業統 i十摘要一九九九年 127

主要統計數字(總) Key Statistics (Cont'd.)
千人(另有註明除外) Thousands, unless otherwise specified
進出香港的道路及鐵路交通 每日乘搭陸上公共交通工具的平均人次 Inward and Outward Movements Average Daily Public Land Transport Passenger Journeys by Road and by Rail 貨物(6M7)
年 乘 客 ( 千 公 _ ) 巴士 鐵 路 公 共 小 巴 的 士 屋 ®巴士 Year Passengers� Cargo⑷’(了) Buses''' Railways'" Public light Taxis Residential (thousand tonnes) buses""' coaches 1989 28 939 - 3 572 2 887 1 744 1 220 30 1990 31 615 14 629* 3 504 3 025 1 743 1 237 45 1991 35 903 19 479* 3 490 3 082 1 724 1 249 64 1992 40 413 24 460* 3 475 3 198 1 726 1 267 71 1993 43 275 30 193* 3 452 3 349 1 737 1 274 86 1994 45 925 34 062* 3 513 3 485 1 777 1 275 90 1995 49 853 35 603* 3 605 3 523 1 745 1 293 94 1996 54 897 36 098* 3 754 3 558 1 769 1 293 106 1997 64 917 37 119* 3 900 3 582 1 776 1 298 111 1998 77 027 36 614* 3 912 3 500 1 755 1 307 108
註釋:(5) 指抵港及離港乘客的總人次’但不包括被拒 Notes : (5) Figures refer to the total number of passenger 入境者及司機。由一九九零年開始軍部人員 arrivals and departures, but excluding refused 亦不包括在內 ° landing passengers and drivers. Servicemen are
also excluded starting from 1990. (6) 道路運輸的數字是根據自一九九九年開始 (6) Figures for cargo movements by road are
採用的新估言十方法編製� compiled based on a new estimation method, which has been adopted as from 1999.
(7) 指貨物總裝卸量’但不包括鐵路運輸的牲 (7) Figures refer to the total tonnes of cargo 畜� discharged and loaded, but excluding livestock
by rail. (8)包括九巴、中巴(至一九九八年八月三"I""一 日 (8) Including Kowloon Motor Bus, China Motor Bus
止)、新大嶼山巴士、城巴、龍運巴士、新巴 (up to 31 August 1998),New Lantao Bus, (九八年九月一曰開始)及九廣鐵路巴士 ° Citybus,Long Win Bus, New World First Bus
(from 1 September 1998) and Kowloon-Canton Railway Bus.
(9) 包括地下鐵路、九廣鐵路(東鐵及輕鐵)、香 (9) Including Mass Transit Railway, Kowloon-港電車及山頂纜車� Canton Railway (East Rail and Light Rail),
Hongkong Tramways and Peak Tramways. ( 1 0 )包括綠色專線小巴。 (10) Including Green Minibus.
152 Statistical Digest of the Services Sector 1999
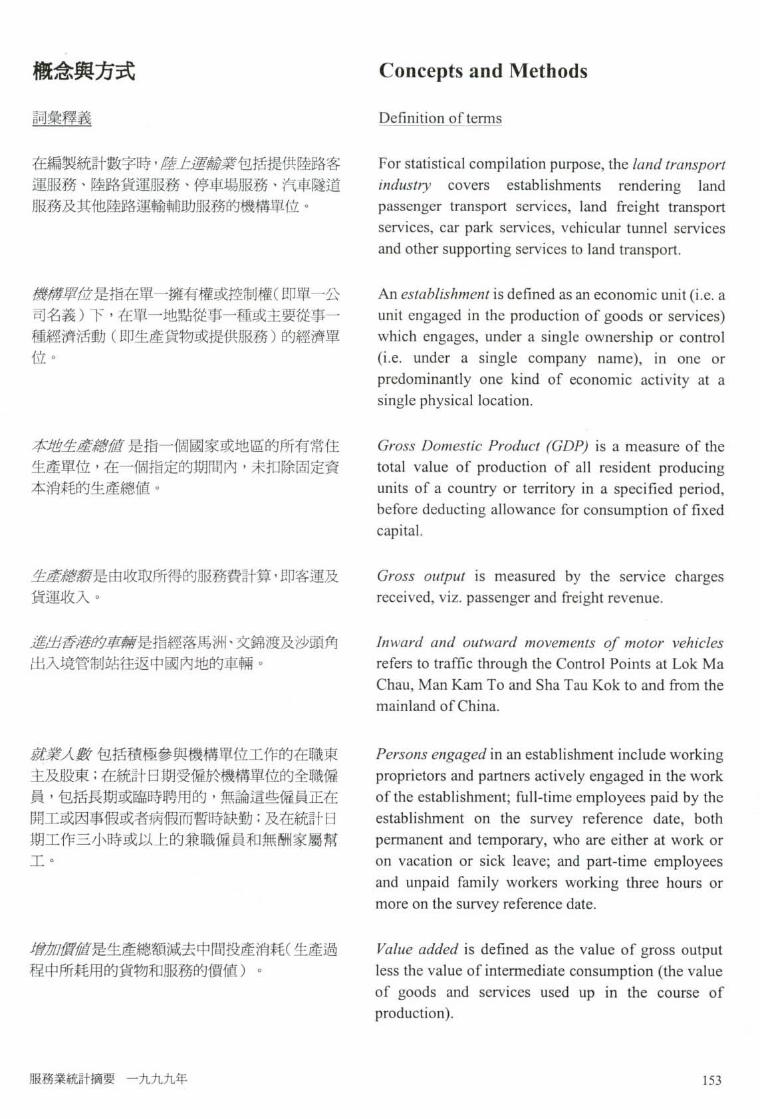
槪念與方式 Concepts and Methods 言司!ft釋義 Definition of terms
在編製統計數字時,磨丄違«包括提供陸路客 For statistical compilation purpose, the land transport 運服務、陸路貨運服務、停車場服務、汽車隧道 industry covers establishments rendering land 服務及其他陸路運輸輔助服務的機構單位° passenger transport services, land freight transport
services, car park services, vehicular tunnel services and other supporting services to land transport.
潘溝罩位是指在單一擁有權或控制權(即單一公 An establishment is defined as an economic unit (i.e. a 司名義)下’在單一地點從事一種或主要從事一 unit engaged in the production of goods or services) 種經濟活動(即生產貨物或提供服務)的經濟單 which engages, under a single ownership or control 位 ° (i.e. under a single company name), in one or
predominantly one kind of economic activity at a single physical location.
本地生產總値是指一個國家或地區的所有常住 Gross Domestic Product (GDP) is a measure of the 生產單位’在一個指定的期間內,未扣除固定資 total value of production of all resident producing 本消耗白勺生產總f直 ° units of a country or territory in a specified period,
before deducting allowance for consumption of fixed capital.
重產總蘇是由收取所得的服務費計算,即客運及 Gross output is measured by the service charges 貨運收入 ° received, viz. passenger and freight revenue.
違4^2^/香港/^虞蘇是指經落馬洲、文錦渡及沙頭角 Inward and outward movements of motor vehicles 出入境管制站往返中國內地的車輛 ° refers to traffic through the Control Points at Lok Ma
Chau, Man Kam To and Sha Tau Kok to and from the mainland of China.
就業人數包括積極參與機構單位工作的在職東 Persons engaged in an establishment include working 主及股東:在統計曰期受僱於機構單位的全職僱 proprietors and partners actively engaged in the work 員’包括長期或臨時聘用的,無論這些僱員正在 of the establishment; full-time employees paid by the 開工或因事假或者病假而暫時缺勤;及在統計日 establishment on the survey reference date, both 期工作三小時或以上的兼職僱員和無酬家屬幫 permanent and temporary, who are either at work or 工� on vacation or sick leave; and part-time employees
and unpaid family workers working three hours or more on the survey reference date.
會方/7•是生產總額減去中間投產消耗(生產過 Value added is defined as the value of gross output 程中所耗用的貨物和服務的價値)。 less the value of intermediate consumption (the value
of goods and services used up in the course of production).
服務業統 i十摘要一九九九年 127

統計圖表 Statistical Tables and Charts 表 7 . 1 陸上運輸業的機構單位數目、就業人數、業務收益指數、生產總額及增加價値 Table 7.1 Number of Establishments and Persons Engaged, Business Receipts Index, Gross
Output and Value Added of the Land Transport Industry 百萬元(另有註明除外)
$ million, unless otherwise specified 1989 1990 1991 1992 1993
機構單位數目(不包括的士、公共小巴及貨運車輛 的營運者)(” [ 1 0 0 ] [ 1 2 3 ] 1 4 4 1 3 2 153 Number of establishments (not including (23.5) (23.0) (17.1) (-8.3) (15.9) operators of taxis, public light buses and goods veh ic le s )� 就業人數(不包括的士、公共小巴及貨運車輛的營 運者)� [22 946] [24 266] 25 013 26 140 27 300 Number of persons engaged (not including (-1.2) (5.8) (3.1) (4.5) (4.4) operators of taxis, public light buses and goods veh ic le s )� 就業人數(包括的士、公共小巴及貨運車輛的營運 者)(2>’(3) - - 116 300 126 400 131 900
Number of persons engaged (including operators - - - (8.7) (4.4) of taxis, public light buses and goods vehicles)'^'-"' 業務收益指數(4) (1996=100) - - - - -Business receipts index'"* (1996=100) -
生產總額 20,711 25,872 29,149 34,427 40,166 Gross output (11.3) (24.9) (12.7) (18.1) (16.7)
增加價値 12,908 15,517 17,147 20,861 22,937 Value added (14.5) (20.2) (10.5) (21.7) (10.0)
在以要素成本計算的本地生產總値內所佔比率(%) 2 . 6 2 . 8 2 . 7 2 . 8 2 . 8 Contribution to GDP at factor cost (%) 增加價値在生產總額所佔比率 6 2 . 3 6 0 . 0 5 8 . 8 6 0 . 6 5 7 . 1 Value added as % of gross output
註釋:括號內的數字是與上年比較的變動百分率° Notes : Figures in brackets are percentage changes over the preceding year.
(1) 一九九一年及以後的數字是該年內四季的 (1) Figures for 1991 and onwards are averages of the 估計is(字的平均汝’而 A —年以前數字是 four quarterly estimates of the year, whereas those 指該年三月底的情況� prior to 1991 refer to the position as at end March
of the corresponding year. (2) 數字是該年內四季的估計數字的平均數° (2) Figures are averages of the four quarterly
estimates of the year. ( 3 )爲包括的士、公共小巴及貨運車輛的營運者 (3) Specially estimated to take into account operators
而編製的特別估計數字,在日後得到更多資 of taxis, public light buses and goods vehicles. 料時可gg會作出修言丁 ° The figures are subject to revisions later on as
more data become available, (4) 業務收益指數於一九九二統計年度開始編 (4) Business receipts were first available in the
製’但此詳細分類的指數則於九六年開始編 reference year 1992, but indices at such detailed 製 ° breakdown were first compiled in 1996.
[ ]一九九一年前的數字的涵蓋範圍與其後的 [ ] F i g u r e s prior to 1991 are slightly different in 略有不同’因此不可將兩組數字作嚴格比 coverage and therefore are not strictly comparable 較� with those for 1991 and onwards.
118 Statistical Digest of the Services Sector 1999

表 7 . 1 (繽) 陸上運輸業的機構單位數目、就業人數、業務收益指數、生產總額及增加價値
Table 7.1 (Cont'd.) Number of Establishments and Persons Engaged, Business Receipts Index, Gross Output and Value Added of the Land Transport Industry
百萬元(另有註明除外) $ million, unless otherwise specified
1994 1995 1996 1997 1998 機構單位數目(不包括的士、公共小巴及貨運車輛 的營運者)(” 184 230 253 267 294 Number of establishments (not including (20.3) (25.0) (10.0) (5.5) (10.1) operators of taxis, public light buses and goods vehic les )� 就業人數(不包括的士、公共小巴及貨運車輛的營 運者)� 28 977 31 459 32 687 34 797 37 783 Number of persons engaged (not including (6.1) (8.6) (3.9) (6.5) (8.6) operators of taxis, public light buses and goods vehic les )�
就業人數(包括的士、公共小巴及貨運車輛的營運 者)� . � 141 200 135 800 140 100 146 700* 157 400 Number of persons engaged (including operators (7.1) (-3.8) (3.2) (4.7) (7.3) of taxis, public light buses and goods vehicles)®,� 業務收益指數(4) (1996=100) - - 100.0 106.0 .108.3 Business receipts index") (1996=100) - - - (6.0) ' (2.1)
生產總額 43,710 47,745 50,750 51,670 N.A. Gross output (8.8) (9.2) (6.3) (1.8) N.A.
增加價値 25,897 27,616 29,679 30,372 N.A. Value added (12.9) (6.6) (7.5) (2.3) N.A.
在以要素成本計算的本地生產總値內所佔比率(%) 2 . 7 2 . 7 2 . 6 2 . 5 N . A . Contribution to GDP at factor cost (%) 增加價値在生產總額所佔比率 5 9 . 2 5 7 . 8 5 8 . 5 5 8 . 8 N . A . Value added as % of gross output
註釋:括號內的數字是與上年比較的變動百分率° Notes : Figures in brackets are percentage changes over the preceding year.
(1) 一九九一年及以後的數字是該年內四季的 (1) Figures for 1991 and onwards are averages of the 估計數字的平均數’而九一年以前的數字是 four quarterly estimates of the year, whereas those 指該牵三月底的情況 ° prior to 1991 refer to the position as at end March
of the corresponding year. (2) 數字是該年內四季的估計數字的平均數。 (2) Figures are averages of the four quarterly
estimates of the year. (3)爲包括的士、公共小巴及貨運車輛的營運者 (3) Specially estimated to take into account operators
而編製的特別估計數字’在日後得到更多資 of taxis, public light buses and goods vehicles. 料時可能會作出修訂� The figures are subject to revisions later on as
more data become available. (4) 業務收益指數於一九九二統計年度開始編 (4) Business receipts were first available in the
製’但此詳細分類的指數則於九六年開始編 reference year 1992, but indices at such detailed 製� breakdown were first compiled in 1996.
服務業統 f t摘要一九九九年 1 5 5

圓 7 . 1 陸上運輸業的機構單位數目⑴.⑴及就業人數”.口> Chart 7.1 Number of Establishments"),� and Persons Engaged")’ (:)in the Land Transport
Industry
機構單位數目 就業人數 Number of establishments Number of persons engaged 320 - -| 40 000
240 : - 灣 n i l I I I ! - -- 30 000 200 :::::::::: I::::::;:: !鍾 I 藥 - - - 2 5 000
國 _ 圓 圓 議 I r ^ l 1 —— — — — — — — — — — — — — - ^ — — — — — — — — — — — — — — - - - - - - • — — — — - — — — — — — —- / 1 I f I I If I
1 2 。 … 闘 … - - 闕 - … 暑 … - - - - - - _
8 � - - • … 骨 … i - _----- - 會 -
: 一 _ 』 一 1 1 1 _ 直 : 。 。 1991 1992 1993 1994 1995 1996 1997 1998
^ 機構單位數目 就業人數 Number of establishments Number of persons engaged
註釋:(1) 數字是該年內四季的估ft數字的平均數。 Notes: (1) Figures are averages of the four quarterly estimates of the year.
( 2 )不包括的士、公共小巴及貨運車輛的營運 (2) Not including operators of taxis, public light buses 者� and goods vehicles.
15 6 Statistical Digest of the Services Sector 1999

表7.2 每日乘搭陸上公共交通工具的平均人次
Table 7.2 Average Daily Public Land Transport Passenger Journeys 千人 Thousands
1989 1990 1991 1992 1993 人次總計 9 4 5 3 9 5 5 4 9 6 0 9 9 7 3 7 9 8 9 8 Total passenger journeys (2.3) (1.1) (0.6) (1.3) (1.7)
巴士(i> 3 572 3 504 3 4 9 0 3 4 7 5 3 4 5 2 Buses � (-7.5) (-1.9) (-0.4) (-0.4) (-0.7) 鐵路(2> 2 887 3 025 3 082 3 198 3 349
Railways® (13.0) (4.8) (1.9) (3.8) (4.7) 公共小巴 W 1 7 4 4 1 7 4 3 1 7 2 4 1 7 2 6 1 7 3 7 Public light b u s e s � (10.1) (-0.1) (-1.1) (0.1) (0.6) 的士 1 220 1 237 1 249 1 267 1 274 Taxis (0.3) (1.4) (1.0) (1.4) (0.6) 屋 ® 巴士 30 45 64 71 86 Residential coaches (36.4) (50.0) (42.2) (10.9) (21.1)
1994 1995 1996 1997 1998 人次總計 1 0 1 4 0 1 0 2 6 0 1 0 4 8 0 1 0 6 6 7 1 0 5 8 2 Total passenger journeys (2.4) (1.2) (2.1) (1.8) (-0.8)
巴士⑴ 3 513 3 605 3 754 3 900 3 912 Buses'" (1.8) (2.6) (4.1) (3.9) (0.3) 鐵路® 3 485 3 523 3 558 3 582 3 500
Railways® (4.1) (1.1) (1.0) (0.7) (-2.3) 公共小巴(3) 1 7 7 7 1 7 4 5 1 7 6 9 1 7 7 6 1 7 5 5 Public light b u s e s � (2.3) (-1.8) (1.4) (0.4) (-1.2) 的士 1 275 1 293 1 293 1 298 1 307
Taxis (0.1) (1.4) (#) (0.4) (0.7) 屋 105 巴士 90 94 106 111 108 Residential coaches (4.7) (4.4) (12.8) (4.7) (-2.7)
註釋:括號內的數字是與上年比較的變動百分率° Notes : Figures in brackets are percentage changes over the preceding year.
(1) 包括九巴、中巴(至一九九八年八月三十一曰 (1) Including Kowloon Motor Bus, China Motor Bus 止)、新大嶼山巴士、城巴、龍運巴士、新巴 (up to 31 August 1998), New Lantao Bus, Citybus, (九八年九月一曰開始汲九廣鐵路巴士 ° Long Win Bus, New World First Bus (from 1
September 1998) and Kowloon-Canton Railway Bus.
(2) 包括地下鐵路、九廣鐵路(東鐵及輕鐵)、香 (2) Including Mass Transit Railway, Kowloon-港電車及山頂纜車� Canton Railway (East Rail and Light Rail),
Hongkong Tramways and Peak Tramways. ( 3 ) 包括綠色專線小巴。 (3) Including Green Minibus. # 表示變動百分率在增減0 .05%以內。 # Denotes change within ± 0.05%.
服務業統計摘要一九九九年 157

圓 7 . 2 每日乘搭陸上公共交通工具的平均人次
Chart 7.2 Average Daily Public Land Transport Passenger Journeys
每曰平均人次(千人) Average daily passenger journeys (thousands) 12 000
10 000 - - — - - — — r ^ ^ ^ — ^ ^ ^ ^ ^ ^
Q I I I � i KooX i Rwga i PxWl i KsXXfl i pftft^ 1989 1990 1991 1992 1993 1994 1995 1996 1997 1998
S 巴 士 ⑴ • 鐵路(2) • 公共小巴⑶ 口 的 士 • 屋郝巴士
B u s e s � Ra i lways� Public light buses"' Taxis Residential coaches
註釋:(1)包括九巴、中巴(至一九九八年八月三"I""一 日 Notes : (1) Including Kowloon Motor Bus, China Motor Bus 止)、新大嶼山巴士、城巴、龍運巴士、新巴 (up to 31 August 1998),New Lantao Bus, Citybus, (九八年九月一曰開始汲九廣鐵路巴士 ° Long Win Bus, New World First Bus (from 1
September 1998) and Kowloon-Canton Railway Corporation Bus.
(2) 包括地下鐵路、九廣鐵路(東鐵及輕鐵)、香 (2) Including Mass Transit Railway, Kowloon-港電車及山頂纜車 Canton Railway (East Rail and Light Rail),
Hongkong Tramways and Peak Tramways. ( 3 ) 包括綠色專線小巴 � (3) Including Green Minibus.
158 Statistical Digest of the Services Sector 1999

表7.3 經 • 及 鐵 出 香 港 的 乘 客 人 數 Table 7.3 Inward and Outward Movements of Passengers by Road and by Rail
千人 Thousands 1989 1990 1991 1992 1993
乘客總 f t � 28 939 31 615 35 903 40 413 43 275 Total movements of passengers'" (-8.1) (9.2) (13.6) (12.6) (7.1)
抵港 14 659 16018 18 167 20 452 21 937 Arrivals (-8.4) (9.3) (13.4) (12.6) (7.3) 離港 14 280 15 597 17 737 19 960 21 338 Departures (-7.8) (9.2) (13.7) (12.5) (6.9)
1994 1995 1996 1997 1998 乘客總計⑴ 4 5 9 2 5 4 9 8 5 3 5 4 8 9 7 6 4 9 1 7 7 7 0 2 7 Total movements of passengers'" (6.1) (8.6) (10.1) (18.3) (18.7)
抵港 23 197 25 150 27 618 32 598 38 603 Arrivals (5.7) (8.4) (9.8) (18.0) (18.4) 離港 22 728 24 703 27 280 32 319 38 425 Departures (6.5) (8.7) (10.4) (18.5) (18.9)
註釋:括號內的數字是與上年比較的變動百分率° Notes : Figures in brackets are percentage changes over the preceding year.
(1)不包括被拒入境者及司機。由一九九零年開 ‘(1) Excluding refused landing passengers and drivers. 始軍部人員亦不包括在內 ° Servicemen are also excluded starting from 1990.
服務業統計摘要一九九九年 159

表7.4 經•及鐵路進出香港的貨物 Table 7.4 Inward and Outward Movements of Cargo by Road and by Rail
千公噸 Thousand tonnes 1989 1990 1991 1992 1993
卸下 - 8 137* 10 464* 13 995* 14 865*
Discharged - - (28.6) (33.7) (6.2) 道路運輸⑴ - 6 287* 8 721* 12 452* 13 618* By r o a d � - - (38.7) (42.8) (9.4) 鐵路運輸(2) 1 7 4 5 1 8 5 0 1 7 4 3 1 5 4 3 1 2 4 7 Byrail(2) (0.9) (6.0) (-5.8) (-11.5) (-19.2)
裝上 - 6 492* 9 015* 10 465* 15 328*
Loaded - - (38.9) (16.1) (46.5) 道路運輸⑴ - 6 125* 8 676* 10 096* 14 963* By r o a d � - - (41.7) (16.4) (48.2) 鐵 路 運 輸 4 5 3 * 367 339 369 365 By rail(2) (-6.4) (-19.0) ^ (-1.1)
1994 1995 1996 1997 1998 卸下 16 349* 17 195* 18 027* 18 870* 18 789
Discharged (10.0) (5.2) (4.8) (4.7) (-0.4) 道路運輸(1) 15 203* 16 198* 17 343* 18 333* 18 465 By r o a d � (11.6) (6.5) (7.1) (5.7) (0.7) 鐵路運輸(2) 1 146 997 684 537 324 By rail® (-8.1) (-13.0) (-31.4) (-21.5) (-39.7)
裝上 17 713* 18 408* 18 072* 18 250* 17 826
Loaded (15.6) (3.9) (-1.8) (1.0) (-2.3) 道路運輸⑴ 17 368* 18 092* 17 817* 18 075* 17 688 By r o a d � (16.1) (4.2) (-1.5) (1.5) (-2.1) 鐵 路 運 輸 3 4 5 316 255 175 138
By rail(2) (-8.4) (-19.3) (-31.4) (-21.1) 註釋:括號內的數字是與上年比較的變動百分率 ° Notes : Figures in brackets are percentage changes over the
preceding year. (1) 一九九零年及以後的數字是根據自九九年 (1) Figures for 1990 and onwards are compiled based
開始採用的新估計方法編製 ° on a new estimation method, which has been adopted as from 1999.
( 2 )不包括牲畜。 (2) Excluding livestock.
160 Statistical Digest of the Services Sector 1999
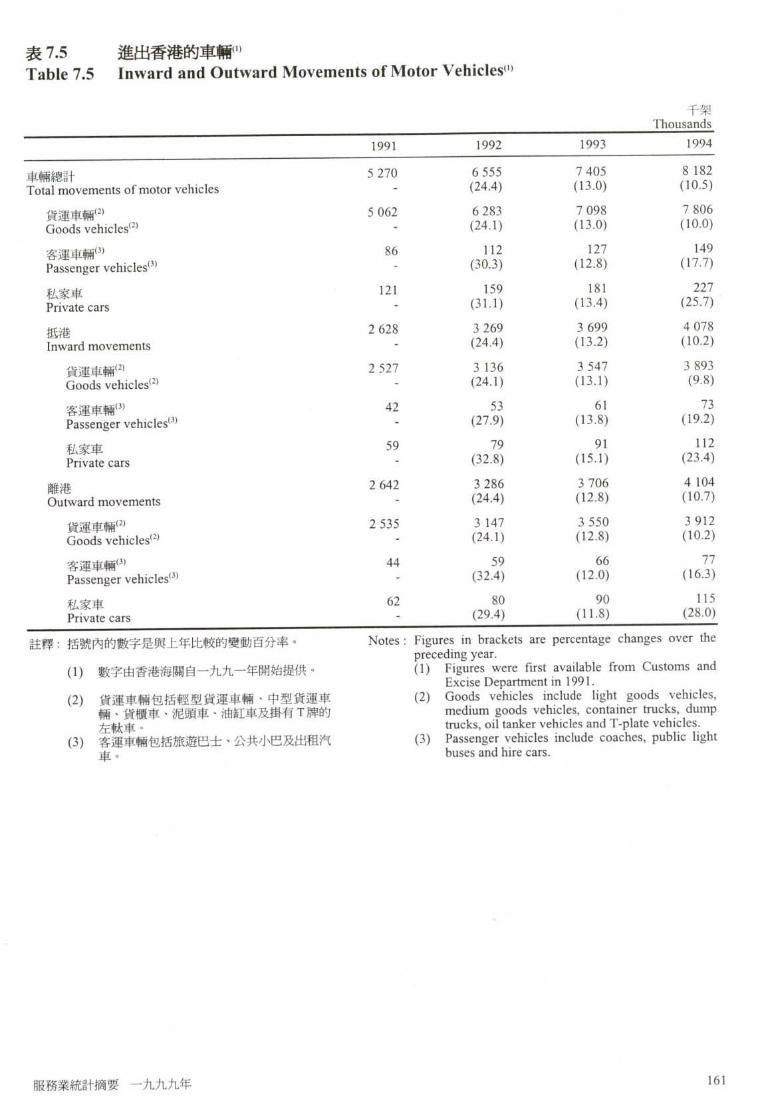
表 7 . 5 進出香港的車輛⑴
Table 7.5 Inward and Outward Movements of Motor Vehicles�
千架 Thousands 1991 1992 1993 1994
車 輛 總 計 “ “ ^ ^ ^ ^
Total movements of motor vehicles - (24.4) (川 省渾蚩輔(2) 5 062 6 283 7 098 7 806
GooS7ehicles<^> - (24.1) (13.0) (10.0) 客渾車輛⑶ 86 112 127 149
Passenger vehicles*" - (30.3) (12.8) (17.7) 私家蚩 121 159 181 227
Private cars - (31.1) (13.4) (25.7) 抵港 1 628 3 269 3 699 4 078 Inward movements - (24.4) (13.2) (10.2)
tt渾蚩輛(2> 2 527 3 136 3 547 3 893
5oods vehicles'^* - (24.1) (13.1) (9.8) 客 運 車 輛 4 2 5 3 6 1 7 3 Passenger vehicles''' - (27.9) (13.8) (19.2) 私家車 59 79 91 112
PnvaTecars - (32.8) (15.1) (23.4) 離港 2 642 3 286 3 706 4 104 Outward movements - (24.4) (12.8) (10.7)
貨渾車輛(2) 2 535 3 147 3 550 3 912
S S r ? e h i c l e s � - (24.1) (12.8) (10.2) 客運車 44 59 66 77
Passenger veh ic le s� - (32.4) (12.0) (16.3) 私家車 62 80 90 115
rriVaTe cars - ^ ^ (28.0) 註釋:括號內的數字是與上年比較的變動百分率� Notes : Figures in brackets are percentage changes over the
preceding year. (1) 數字由香港海關自一九九一年開始提供。 � Figures were first available from Customs and
Excise Department in 1991. (2) 貨運車輛包括輕型貨運車輛、中型貨運車 (2) Goods vehicles include light goods vehicles,
輛、貨櫃車、泥頭車、油缸 i及掛有 T 牌的 medium goods vehicles, container trucks, dump 左駄車 � trucks, oil tanker vehicles and T-plate vehicles.
( 3 )客運車輛包括旅遊巴士、公共小巴及出租汽 (3) Passenger vehicles include coaches, public light 車� buses and hire cars.
服務業統訂摘要一九九九年 161

表7.5 (縯) 進出香港的車輛⑴ Table 7.5 (Cont'd) Inward and Outward Movements of Motor Vehicles'"
千架 Thousands 1 9 ^ 1997 1998
車輛總計 8 4 6 9 8 9 0 3 9 5 0 9 9 7 7 1 Total movements of motor vehicles (3.5) (5.1) (6.8) (2.8) 貨 運 車 輛 7 9 9 9 8 1 9 3 8 5 4 3 8 5 4 5 Goods vehicles® (2.5) (2.4) (4.3) (#) 客運車輛⑶ 1 8 4 2 1 0 2 9 9 3 5 1 Passenger v e h i c l e s � (23.1) (14.5) (42.0) (17.7) 私家車 286 499 667 875 Private cars (25.9) (74.8) (33.6) (31.1) 抵港 4 228 4 450 4 758 4 879 Inward movements (3.7) (5.2) (6.9) (2.6)
貨運車輛 . 3 9 9 7 4 0 9 7 4 2 7 8 4 2 6 8 Goods v e h i c l e s � (2.7) (2.5) (4.4) (-0.2) 客 運 車 牺 9 0 105 148 175
Passenger v e h i c l e s � (24.5) (16.1) (41.4) (18.5) 私家車 141 248 332 436 Private cars (25.8) (75.8) (34.0) (31.2)
離港 4 240 4 453 4 751 4 892 Outward movements (3.3) (5.0) (6.7) (3.0)
貨運車輛® 4 0 0 2 4 0 9 6 4 2 6 6 4 2 7 7 Goods vehicles(2) (2.3) (2.3) (4.1) (0.3) 客運車輔 9 3 1 0 5 1 5 1 1 7 6 Passenger vehicles'^' (21.8) (12.9) (42.8) (16.9) 私家車 145 252 335 439 Private cars (25.9) (73.8) (33.2) (31.0)
註釋:括號內的數字是與上年比較的變動百分率° Notes : Figures in brackets are percentage changes over the preceding year.
( 1 )數字由香港海關自一九九一年開始提供。 (1) Figures were first available from Customs and _ Excise Department in 1991.
(2) 貨運車輛包括輕型貨運車輛、中型貨運車 (2) Goods vehicles include light goods vehicles, 輛、貨櫃車、泥頭車、油缸車及掛有T牌的 medium goods vehicles, container trucks, dump 左駄車 ° trucks, oil tanker vehicles and T-plate vehicles.
(3) 客運車輛包括旅遊巴士、公共小巴及出租汽 (3) Passenger vehicles include coaches, public light 車_ buses and hire cars.
# 表示變動百分率在增減0 .05%以內。 # Denotes change within 士 0.05%.
162 Statistical Digest of the Services Sector 1999

圆7.3 經鶴及鐵路⑴進出香港的貨物 Chart 7.3 Inward and Outward Movements of Cargo by Road and by Rail
千公噸
20 000 Thousand tonnes ,
l i i i i i 1990 1991 1992 1993 1994 1995 1996 1997 1998
• 卸 下 0 裝 上
Discharged Loaded 註釋:(1)不包括鐵路運輸的牲畜。 Note: (1) Excluding livestock by rail.
圓7.4 進出香港的車輛⑴
Chart 7.4 Inward and Outward Movements of Motor Vehicles�
車麵數目(千架)
10 000
9 000 M M • •
7 000 ^ ^ - - - - - - " 8 ^ ^
_ _ _ _
1991 1992 1993 1994 1995 1996 1997 1998 B 貨運車輛⑵ • 客 運 車 輛 _ 私 家 車
Goods veh ic l e s� Passenger veh ic les� Private cars 註釋:(1)數字由香港海關自一九九一年開始提供。 Notes: (1) Figures were first available from Customs and
Excise Department in 1991. (2) 貨運車輛包括輕型貨運車輛、中型貨運車 (2) Goods vehicles include light goods vehicles,
輛、貨&車、泥頭車、油缸:i及掛有 T 牌的 medium goods vehicles, container trucks, dump 左駄車� trucks, oil tanker vehicles and T-plate vehicles.
(3) 客運車輛包括旅遊巴士、公共小巴及出租汽 � Passenger vehicles include coaches, public light 車� buses and hire cars.
服務業統計摘要一九九九年 163

表 7 . 6 進出香港的火車 Table 7.6 Inward and Outward Movements of Trains
1989 1990 1991 1992 1993 貨運火車(載有貨物車卡) 9 7 3 1 7 9 5 4 2 5 9 1 6 7 1 8 7 4 9 0 7 7 2 8 1 Cargo trains (number of laden wagons) (-4.2) (-1.9) (-3.9) (-4.6) (-11.7)
抵港 75 074 77 176 74 029 67 496 56 986 Arrivals (-2.4) (2.8) (-4.1) (-8.8) (-15.6) 離港 22 243 18 249 17 642 19 994 20 295 Departures (-9.7) (-18.0) (-3.3) (13.3) (1.5)
客運火車(班次) 3 0 7 6 3 1 9 0 3 2 4 0 3 3 0 8 3 9 4 6 Passenger trains (numbers) (-3.7) (3.7) (1.6) (2.1) (19.3)
1994 1995 1996 1997 1998 貨運火車(載有貨物車卡) 6 9 4 0 3 6 0 8 0 3 4 7 3 5 6 3 8 9 4 2 3 1 9 4 6 Cargo trains (number of laden wagons) (-10.2) (-12.4) (-22.1) (-17.8) (-18.0)
抵港 51 612 45 978 33 673 27 858 22 923 Arrivals (-9.4) (-10.9) (-26.8) (-17.3) (-17.7) 離港 17 791 14 825 13 683 11 084 9 023 Departures (-12.3) (-16.7) (-7.7) (-19.0) (-18.6)
客運火車(班次) 3 9 4 0 3 7 3 6 3 7 5 5 4 2 1 6 4 7 5 2 Passenger trains (numbers) (-0.2) (-5.2) (12.3) (12.7) 註釋:括號內的數字是與上年比較的變動百分率“ Note : Figures in brackets are percentage changes over the
preceding year.
164 Statistical Digest of the Services Sector 1999

表7.7 牌照及•統計數字 Table 7.7 Licence and Road Statistics
1989 1990 1991 1992 1993
牌照 Licences 領牌車輛數目 345 385 370 160 386 904 414 638 439 719 Number of vehicles licensed (9.2) (7.2) (4.5) (7.2) (6.0)
電單車(包括機動三輪車) 15 561 16 628 17 777 18 678 19 219 Motorcycles (including motor tricycles) (11.5) (6.9) (6.9) (5.1) (2.9) 私家車 180 184 197 852 212 017 237 035 259 874 Private cars (12.2) (9.8) (7.2) (11.8) (9.6) 的士 17 014 17 060 17 308 17 537 17 639
Taxis (1.2) (0.3) (1.5) (1.3) (0.6) 公共巴士 6 951 7 309 7 617 7 903 8 194
Public buses (5.9) (5.2) (4.2) (3.8) (3.7) 私家巴士 141 180 197 231 263 Private buses (6.8) (27.7) (9.4) (17.3) (13.9) 公共小巴 4 340 4 336 4 336 4 336 4 327
Public light buses (#) (-0.1) (0.0) (0.0) (-0.2) 私家小巴 • 2 421 2 410 2 384 2 348 2 387 Private light buses (0.5) (-0.5) (-1.1) (-1.5) (1.7) 貨運車輛 112 209 117 533 117 823 119 556 120415 Goods vehicles (6.9) (4.7) (0.2) (1.5) (0.7) 特別用途車輛 154 212 238 234 246 Special purpose vehicles (36.3) (37,7) (12.3) (-1.7) (5.1) 政府車輛⑴ 6410 6 640 7 207 6 780 7 155
Government veh ic les� (-0.8) (3.6) (8,5) (-5.9) (5.5) 駕験執照數目 2 397403 2 463 524 2 510 649 2 653 558 2 855 417 Number of driving licences (4.2) (2.8) (1.9) (5.7) (7.6)
道路 Roads 可行車的道路長度(米) 1 4 6 4 6 5 5 1 4 8 4 2 2 7 1 5 2 8 8 3 3 1 5 5 9 1 8 6 1 6 2 5 1 5 5 Length of trafficable roads (metres) (2.1) (1.3) (3.0) (2.0) (4,2) 按每百名人口許算的可行車道路長度(米) 25.6 25.8 26.3 26.5 27.1 Length of trafficable roads per 100 population (1.1) (0.9) (1.9) (0.7) (2.3) (metres)
註釋:括號內的數字是與上年比較的變動百分率 ° Notes : Figures in brackets are percentage changes over the preceding year.
(1)不包括軍用車輛。 h ) Excluding military vehicles. # 表示變動百分率在增減0.05%以內� # Denotes change within ± 0.05%.
服務業統計摘要一九九九年 165

表7.7 (输) 脾照; S i m統計數字 Table 7.7 (Cont'd.) Licence and Road Statistics
1994 1995 1996 1997 1998 牌照 Licences
領牌車輛數目 462 410 466 068 475 115 500 228 500 673 Number of vehicles licensed (5.2) (0.8) (1.9) (5.3) (0.1)
電單車(包括機動三輪車) 2 0 3 9 9 2 1 0 3 1 2 2 6 5 0 2 3 5 1 1 2 3 3 4 3 Motorcycles (including motor tricycles) (6.1) (3.1) (7.7) (3.8) (-0.7) 私家車 279 420 285 467 293 381 314 833 318 137
Private cars (7.5) (2.2) (2.8) (7.3) (1.0) 的士 17 856 17 841 17 789 17 918 18 053
Taxis (1.2) (-0.1) (-0.3) (0.7) (0.8) 公共巴士 8 650 9 178 9 931 10 659 11 396
Public buses (5.6) (6.1) (8.2) (7.3) (6.9) 私家巴士 278 313 359 404 423 Private buses (5.7) (12.6) (14.7) (12.5) (4.7) 公共小巴 4 322 4 328 4 313 4 335 4 343 Public light buses (-0.1) (0.1) (-0.3) (0.5) (0.2) 私家小巴 2 426 2 422 * 2 303 2 230 2 158 Private light buses (1.6) (-0.2) (-4.9) (-3.2) (-3.2) 貨運車輛 121 325 117 928 116 791 118 279 115 051
Goods vehicles (0.8) (-2.8) (-1.0) (1.3) (-2.7) 特別用途車輛 2 5 6 2 7 7 3 1 6 3 7 0 4 0 6 Special purpose vehicles (4.1) (8.2) (14.1) (17.1) (9.7) 政府車輛⑴ 7 478 7 283 7 282 7 689 7 363 Government v e h i c l e s � (4.5) (-2.6) (#) (5.6) (-4.2)
駕駛執照數目 2 9 5 2 0 7 8 3 0 2 4 5 2 8 3 0 9 3 7 2 5 3 2 1 0 8 6 1 3 4 0 6 2 3 2 Number of driving licences (3.4) (2.5) (2.3) (3.8) (6.1)
道路 Roads 可行車的道路長度(米) 1 660 713 1 716 910 1 743 190 1 831 356 1 865 068 Length of trafficable roads (metres) (2.2) (3.4) (1.5) (5.1) (1.8) 按每百名人口計算的可行車道路長度(米) 2 7 . 1 2 7 . 4 2 7 . 1 2 7 . 7 2 7 . 4 Length of trafficable roads per 100 population (0.2) (0.9) (-0.9) (1.9) (-1.1) (metres)
註釋:括號內的數字是與上年比較的變動百分率� Notes : Figures in brackets are percentage changes over the preceding year.
(1)不包括軍用車輛。 (1) Excluding military vehicles. # 表示變動百分率在增減0.05%以內� # Denotes change within ± 0.05%.
166 Statistical Digest of the Services Sector 1999

圓 7 . 5 輛⑴及駕駐執照數目
Chart 7.5 Number of Vehicles Licensed'" and Number of Driving Licences
領牌車麵數目 駕駛執照數目 Number of vehicles licensed Number of driving licences
700 000 -] 3 500 000
600 000 一 一 - 3 000 000
500 000 _- OT^ p r o - - 2 500 000 网 网 闕 纖 M
400 000 ——^^ -::::::::——:::::::————::::::: 從——::::::;--2 000 000
300000 i 1 i i i i i 1 1 i 1500000 纖 総 纖 蘇 麵 纖 _ 觀 _ 鐵
200000 M M M M M M … - 纖…講 - l O O O O O O M M 教 M 繊 M i缀 講 M M 酵 榻 激 M :※: M M M :総 M
100 000 麵 … 纖 • … 鬆 … - … 纖 戀 … - 5 0 0 0 0 0
_ _ 議 議 議 圏 _ 議 _ 画 0 t'H;! _ f > » i _ _ I _ ^ _ I _ _ _ I _ _ i S m _ I _ _ _ I _ _ E & d _ I _ ^ _ I _ _ _ 0
1989 1990 1991 1992 1993 1994 1995 1996 1997 1998 _ 領 牌 車 輛 駕駐執照
Vehicles licensed Driving licences
註釋:(1)不包括軍用車輛。 Note: (1) Excluding military vehicles.
服務業統 i t摘要一九九九年 1 6 7

表 7 . 8 陸上運輸業的選定最新統計數字
Table 7.8 Selected Up-to-date Statistics on Land Transport Services 1998 1999
第一季 第二季 第三季 第四季 第一季 ^ Q2 Q3 Q4 ^ 機構單位數目(不包括的士、公共小巴及貨運車輛的 2 7 3 2 8 6 3 0 5 3 1 1 3 4 2 營運者) Number of establishments (not including operators of taxis, public light buses and goods vehicles) 就業人數(不包括的士、公共小巴及貨運車輛的營運 3 6 0 0 6 3 7 7 4 7 3 7 8 6 9 3 9 5 0 9 3 9 2 2 5 者) Number of persons engaged (not including operators of taxis, public light buses and goods vehicles) 就業人數(包括的士、公共小巴及貨運車輛的營運者) 149 900* 155 000* 163 700* 161 100* 155 300 Number of persons engaged (including operators of taxis, public light buses and goods vehicles) 業務收益指數(1996=100) 103.4 105.8 110.6 113.3* 99.1 Business receipts index (1996=100)
每曰乘搭陸上公共交通工具的平均人次(千人) Average daily public land transport passenger journeys (thousands)
巴士 3 881 3 843 3 890 4 035 4 025 Buses 鐵路 3 500* 3 390 3 536 3 574* 3 527 Railways 公共小巴 1 7 5 9 1 7 5 3 1 7 5 7 1 7 5 0 1 7 3 4 Public light buses 的士 1 304 1 306 1 308 1 310 1 310 Taxis 屋 ® 巴士 106 110* 108* 107 108 Residential coaches
168 Statistical Digest of the Services Sector 1999

表7.8 (總) 陸上運輸業的選定最新統計數字 Table 7.8 (Cont'd) Selected Up-to-date Statistics on Land Transport Services
1998 1999 第一季 第二季 第三季 第四季 第一季
^ 02 Q3 Q4 ^ 經道路及鐵路進出香港的乘客人數(千人) 17 231 18 676 19 873 21 248 21 142 Inward and outward movements of passengers by road and by rail (thousands)
抵港 8 665 9 359 9 938 10 641 10 620 Arrivals 離港 8 566 9 317 9 935 10 607 10 522 Departures
經道路及鐵路進出香港的貨物(千公«) 8 077 9 501 9 927 9 108 8 292 Inward and outward movements of cargo by road and by rail (thousand tonnes)
卸下 4 078 4 672 5 338 4 700 4 279 Discharged
道路運輸 3 995 4 587 5 260 4 622 4 223 By road 鐵路運輸 83 85 78 78 56 By rail
裝上 3 999 4 830 4 589 4 408 4 013 Loaded
道路運輸 3 968 4 797 4 556 4 367 3 965 By road 鐵路運輸 31 32 33 41 48 By rail
進出香港的貨運車_ (千架) 1 891 2 184 2 321 2 148 1 928 Inward and outward movements of goods vehicles (thousands)
抵港 945 1 091 1 159 1 074 963 Inward movements 離港 947 1 093 1 163 1 074 966 Outward movements
進出香港的火車 Inward and outward movements of trains
貨運火車(載有貨物車卡) 7 466 8 311 8 136 8 033 7 593 Cargo trains (number of laden wagons)
抵港 5 368 5 879 5 905 5 771 5 272 Arrivals 離港 2 098 2 432 2 231 2 262 2 321 Departures
客運火車(班次) 1 240 1 252 1 104 1 156 1 118 Passenger trains (numbers)
服務業統計摘要一九九九年 169

表7.8 (續) 陸上運輸業的選定最新統計數字
Table 7.8 (Cont'd) Selected Up-to-date Statistics on Land Transport Services 1998 1999
第一季 第二季 第三季 第四季 第一季 Ql Q2 Q3 Q4 ^
領牌車輛數目 5 0 0 9 1 0 5 0 2 9 9 4 5 0 1 9 2 8 5 0 0 6 7 3 4 9 9 3 9 9 Number of vehicles licensed
電單車(包括機動三輪車) 2 3 2 8 1 2 3 3 2 9 2 3 2 9 3 2 3 3 4 3 2 3 5 4 9 Motorcycles (including motor tricycles) 私家車 316 062 318 350 318 227 318 137 317 580
Private cars 的士 17 946 17 983 17 997 18 053 18 030
Taxis 公共巴士 10721 11 039 11 313 11 396 11 487
Public buses 私家巴士 425 424 435 423 420
Private buses 公共小巴 4 3 3 8 4 3 4 0 4 3 3 6 4 3 4 3 4 3 3 6 Public light buses 私家小巴 2 2 3 0 2 2 2 2 2 1 6 5 2 1 5 8 2 1 4 3 Private light buses 貨運車輛 1 1 7 9 7 2 1 1 7 4 9 9 1 1 6 2 9 2 1 1 5 0 5 1 1 1 4 1 1 6 Goods vehicles 特別用途車輛 3 8 8 4 0 2 3 9 9 4 0 6 4 0 9 Special purpose vehicles 政府車輛 7 547 7 406 7 471 7 363 7 329
Government vehicles
可行車的道路長度(米) 1 837 803 1 848 660 1 851 164 1 865 068 1 868 979
Length of trafficable roads (metres)
170 Statistical Digest of the Services Sector 1999

資料來源 Data Sources 表 資料來源 Table Sources 7.1 政府統計處 7.1 Census and Statistics Department 7.2 運輸署 7.2 Transport Department 7.3 入境事務處 7.3 Immigration Department 7.4 香港海關; 7.4 Customs and Excise Department;
九廣鐵路公司 Kowloon Canton Railway Corporation
7.5 香港海關 7.5 Customs and Excise Department 7.6 九廣鐵路公司 7.6 Kowloon Canton Railway
Corporation 7.7 運輸署; 7.7 Transport Department;
路政署 Highways Department
其他有關刊物 Further References 運輸資料年報’運輸署編製 Annual Transport Digest, published by the Transport
Department 就業及空缺統旨f(詳細統計表) Employment and Vacancies Statistics (Detailed Tables) 本地生產總値估計 Estimates of Gross Domestic Product 香港統計年干U Hong Kong Annual Digest of Statistics 香、港編十月刊 Hong Kong Monthly Digest of Statistics 服務行業按季業務收益指數 Quarterly Business Receipts Indices/or Service
Industries 就業、空缺及薪金總額按季統計報告 Quarterly Report of Employment, Vacancies and
Payroll Statistics 本地生產總値估計按季報告 Quarterly Report of Gross Domestic Product Estimates 運輸及有關服務按年統計調查報告 Report on Annual Survey of Transport and Related
Services
服務業統 i十摘要一九九九年 127

8 海上運輸業
Maritime Transport Services 槪要 Highlights 香 港 擁 有 全 世 界 其 中 一 個 最 繁 忙 和 最 有 Hong Kong is served by one of the world's busiest 效率白勺港口。一九九七年’來自海上運輸 and most efficient ports. The maritime transport 業的增加價値約爲 2 2 5 億元’佔本地生產 industry generated about $22.5 billion of value 總値的 1.8% ° added, or 1.8% of Hong Kong's Gross Domestic
Product (GDP) in 1997.
海上運輸業包括船務代理;遠洋輪船 / 港 The maritime transport industry included ship agents; 澳船隻船東及營運者;港海渡輪及其他港 owners and operators of sea-going vessels/Hong 內海上運輸服務的營運者;經營貨櫃業的 Kong-Macau vessels; operators of harbour ferries and 公司;提供海上貨運代理服務及其他海上 miscellaneous inland water transport services; 運輸輔助月 S 務的公司。一九九八年’從事 companies in the container business; and companies 主要海上運輸業(不包括躉船 / 駭船、船 providing sea cargo forwarding services and other 上起卸服務)的機構單位約有
4 6 0 0 間’人 supporting services to water transport. In 1998, 數達 41 000 名。 there were a total of about 4 600 establishments and
some 41 000 people engaged in the main maritime transport services (not included barges/lighters, stevedoring services).
一 九 九 八 年 ’ 進 出 香 港 的 船 隻 流 量 爲 In 1998, the port registered a total of 463 000 inward 463 000 航次’較九七年輕微下降 1 % �雖 and outward vessel movements, representing a 然多種船隻流量皆下跌’但佔過半數流量 slight decrease of 1 % compared to 1997. Despite 的 內 河 貨 船 仍 上 升 1 % ’反映香港與中國 the drops in most types of vessel movements, river 內地南音P 緊密的'經濟聯繫 ° cargo vessels (accounting for over half of the
movements) still grew by 1%, reflecting the strong economic linkages between Hong Kong and the southern part of the mainland of China.
事實上,河運是過去數年間發展最快的海 In fact, river trade has become the fastest growing 上運輸模式 ° 一九八九至九八年間’河運 maritime transport mode over the past few years. 貨物流量上升 3 倍多’而經河運的貨櫃吞 River cargo movements rose by over 3 times from 吐 量 則 上 升 近 3 0 倍 。 爲 應 付 曰 益 增 加 的 1989 to 1998 and container throughput by river 需求,屯門的內河貨運碼頭於九八年十月 surged by nearly 30 times during the same period. 開始第一階段的運作 ° To cope with the increasing demand, the River Trade
Terminal at Tuen Mun commenced its first phase of operation in October 1998,
至於港內客運月昆務方面,一九九八年小輪 On internal passenger transport, ferry service was 載客量爲 6 270 萬人次,較九七年減少 provided to 62.7 million passengers in 1998, 12% 1 2 %,較八九年減少 46% ° 過去十年小輪 less than in 1997 and 46% less than in 1989. The 服務業統 i十摘要一九九九年 127

乘客人次持續下降白勺主要原因’是政府大 continual drop in ferry passenger journeys over the 規 模 地 擴 展 陸 上 運 輸 網 絡 ° past decade was largely a result of the extensive
expansion of land transport networks.
一九九乂乂年’港 口處理白勺貨運量爲 1.67 A total of 167 million tonnes of cargo and 14.6 億 公 _ ’ 而貨才匱吞吐量則爲 1 460 萬個標 million T.E.U. containers were handled by the ports 準 貨 櫃 單 位 ’ 分 別 較 九 七 年 的 數 字 下 跌 in 1998. These represented an 1 % decline and 1 % lo/o及上升 1% ° 由於對外貿易減少及對遠 rise compared to the figures in 1997 respectively. 洋輪船服務的需求轉弱’貨物流量及貨櫃 The moderation in cargo movements and container 吞吐量於一九九 年放緩 ° throughput in 1998 was due to the setback in external
trade and the weakened demand for services of ocean-going vessels.
118 Statistical Digest of the Services Sector 1999

主要統計數字 Key Statistics
海上運輸業 Maritime Transport Industry 機構單位數目 就業人數 就業人數
(不包括躉船/駭船 (不包括躉船/駭船 (包括躉船/駭船營 營運者及船上貨物起營運者及船上貨物 運者及船上貨物起 增加價値 業務收益
年 卸 服 務 提 供 者 起 卸 服 務 提 供 者 ) 卸 服 務 提 供 者 ) <2> ’ <
3) (百萬元) 指數
(4)
Year Number of Number of Number of Value added Business establishments persons engaged persons engaged ($ million) receipts (not including (not including (including operators of index'"*' operators of barges/ operators of barges/ barges/lighters and (1996=100) lighters and lighters and stevedoring services stevedoring services stevedoring services providers)�’� providers)� providers)�
1989 [2 115] [28 104] - 9,239 -1990 [2 530] [31 081] - 11,476 -1991 2 709 32 424 50 800 13,016 -1992 3 220 35 610 54 700 14,962 -1993 3 746 39 779 62 200 17,584 -1994 4 203 41 893 68 100 19,680 -1995 4 380 43 313 66 700 21,339 -1996 4 672 44 259 68 800 21,453 100.0 1997 4 796 45 550 75 000* 22,486 105.1 1998 4 570 40 527 76 400 N.A. 100.0
註釋:(1) 一九九一年及以後的數字是該年內四季的 Notes : (1) Figures for 1991 and onwards are averages of the 估言十數字的平均數,而九一年以前的數字是 four quarterly estimates of the year, whereas j旨該年三月無的情況� those prior to 1991 refer to the position as at end
March of the corresponding year. (2) 爲包括蔓船/駭船營運者及船上貨物起卸服 (2) Specially estimated to take into account operators
務提供者而編製的特別估計數字’在日後得 of barges/lighters and stevedoring services 到更多S料時可能會作出修訂” providers. The figures are subject to revisions
later on as more data become available. (3) 數字是該年內四季的估計數字的平均數。 (3) Figures are averages of the four quarterly
estimates of the year. ( 4 )業務收益指數於一九九二統計年度開始編 (4) Business receipts indices were first available in
製,但此詳細分類的指數則於九六年開始編 the reference year 1992, but indices at such 製� detailed breakdown were first compiled in 1996.
[]一九九一年前的數字的涵蓋範圍與其後的 [ ] F i g u r e s prior to 1991 are slightly different in 略有不同’因此不可將兩組數字作嚴格比 coverage and therefore are not strictly 較� comparable with those for 1991 and onwards.
服務業統 i十摘要一九九九年 127

主要統計數字(續) Key Statistics (Cont'd.)
進出香港的海運及河運交通 Inward and Outward Movements by Ocean and by River 貨物(5),W
年 遠洋輪船^’(6> 內河客輪(
5) 內河貨船^’卩 乘 客 ( 千 公 噸 ) Year Ocean vessels'''''®' River passenger River cargo Passengers'®* Cargo'''''''
ferries � vessels*')’� (thousand tonnes) 1989 38 140* 88 130* 100 630 15 642 950 73 681 1990 40 870* 96 620 108 400 17 220 360 75 296 1991 45 350* 98 780 114 160 18 219 397 87 592 1992 51 700* 106 000 141 050 19 525 542 101 599
[57 420]* [106 000] [135 330] [102 780] 1993 66 780* 111 680 152 770 20 091 892 118 137 1994 74 350* 126 370 183 330 20 918 585 141 025 1995 83 480* 128 970 218 050 20 866 011 155 907 1996 83 540* 130 530 224 200 21 333 932 157 300 1997 88 970* 132 440* 245 430* 18 804 891 169 229 1998 83 610 130 000 249 020 17 915 680 167 170
註釋:(5) 自一九九三年開始’海運的定義已修訂爲於 Notes : (5) Starting from 1993, ocean has been redefined to 內河航限以外操作的船隻運輸’而河運則修 refer to transport by all vessels operating beyond 訂爲於內河航限以內操作的船隻運輸。遠洋 the river trade limits whereas river has been 輪船及內河船隻的定義也修訂爲根據所停 redefined to refer to transport by all vessels 靠港口是否已超越內河航限“爲方便比較 ’ operating exclusively within the river trade limits. 爸新定義編製的九二年 i{[字於方括號內展 Ocean vessels and river vessels have been 示 ° redefined according to whether or not their ports
of call are beyond the river trade limits. To facilitate comparison, figures for 1992 compiled according to the new definition are presented in square brackets.
(6) 由今期開始’遠洋輪船的數字已採用由海事 (6) Starting from this issue, ocean vessel statistics 處編製的船隻統計數字。由於所包括的船隻 compiled by the Marine Department have been 種類有所不同’數字不能與早期所刊登的數 adopted. Due to difference in coverage, the 字直接比較 � figures are not strictly comparable with those
published in the earlier issues. (7) 「內河貨船丄在上期(服務業統計摘要》內 (7) "River cargo vessels" was referred to as "river
稱爲「內河商船」� trading vessels" in the previous issue of Statistical Digest of the Services Sector.
(8) 指抵港及離港乘客的總人次,但不包括被拒 (8) Figures refer to the total number of passenger 入境者及乘坐巡迴郵船之旅客°由一九九零 arrivals and departures, but excluding refused 年開始軍部人員亦不包括在內 ° landing passengers and cruise passengers.
Servicemen are also excluded starting from 1990. (9) 指貨物總裝卸量’但不包括過境貨物 ° (9) Figures refer to the total tonnes of cargo
discharged and loaded, but not including transit cargo.
118 Statistical Digest of the Services Sector 1999

槪念及方法 Concepts and Methods 香港是亞洲區一個重要的港口 ’在世界貿易中亦 Hong Kong is an important port in Asia and plays a 是一個舉足輕重的角色。港口運輸可分爲海運及 significant role in world trading. Port traffic are 河運°河運的活動範圍局限於船舶及港口管制條 classified into ocean traffic and river traffic. River 例內訂明的內河航限’而海運則在此範圍以外° traffic is those performed within the river trade limits
while ocean traffic is the otherwise. The river trade limits are defined in the Shipping and Port Control Ordinance.
詞彙釋義 Definition of terms
在編製統計數字時’海上運輸業包括提供遠洋 For statistical compilation purpose, maritime 及沿岸海上運輸服務和提供港內海上運輸服務 transport industry covers establishments rendering 的機構單位’從事海上貨運代理、貨櫃裝卸/租 ocean and coastal water transport services as well as 賃服務、營運貨櫃碼頭及其他海上運輸輔助服務 those providing inland water transport services. 的機構單位亦包括在內� Establishments engaged in sea cargo forwarding
services, containers haulage/leasing services, container terminal operation as well as other supporting services to water transport are also included.
卸貨量包括進口貨物及抵港的轉運貨物° Cargo discharged includes imports and inward transhipment.
裝貨量包括出口貨物(包括港產品出口及轉口 Cargo loaded includes exports (including domestic 貨物)及離港的轉運貨物 ° exports and re-exports) and outward transhipment.
機構單位是指在單一擁有權或控制權(即單一 An establishment is defined as an economic unit (i.e. 公司名義)下,在單一地點從事一種或主要從事 a unit engaged in the production of goods or services) 一種經濟活動(即生產貨物或提供服務)的經濟 which engages, under a single ownership or control 單位� (i.e. under a single company name), in one or
predominantly one kind of economic activity at a single physical location.
本地生產總値是指一個國家或地區的所有常住 Gross Domestic Product (GDP) is a measure of the 生產單位’在一個指定的期間內’未扣除固定資 total value of production of all resident producing 本消耗0勺生產,總f直 ° units of a country or territory in a specified period,
before deducting allowance for consumption of fixed capital.
生產總額是由收取所得的服務費計算’即客運 Gross output is measured by the service charges 及貨運收入°在外地註冊的輪船’其香港船東的 received,viz. passenger and freight revenue. The 生產額貝[J可倉b不計算在此數字內“ output of Hong Kong shipowner whose vessels are
registered abroad may not be accounted for in the estimates.
服務業統 i十摘要一九九九年 127

持牌渡輪服務是根據渡輪服務條例發出牌照經 Licensed ferry service is any ferry service (other than 營的任何渡輪服務(香港油蔴地小輪及天星小輪 the Hong Kong and Yaumati Ferry and the Star 的渡輪月昆務除夕 1-) ° Ferry) operated under a licence granted under the
Ferries Ordinance.
自一九九三年開始’遠洋輪船的定義已修訂爲 Starting from 1993, ocean vessels have been 於內、河航限以夕f操作的船隻 ° redefined as all vessels operating beyond the river
trade limits.
•^業乂教包括積極參與機構單位工作的在職東 Persons engaged in an establishment include 主及股東;在統計日期受僱於機構單位的全職僱 working proprietors and partners actively engaged in 員’包括長期或臨時聘用的’無論這些僱員正在 the work of the establishment; full-time employees 開工或因事假或者病假而暫時缺勤;及在統計曰 paid by the establishment on the survey reference 期工作三小時或以上的兼職僱員和無酬家屬幫 date, both permanent and temporary, who are either 工� at work or on vacation or sick leave; and part-time
employees and unpaid family workers working three hours or more on the survey reference date.
內河航限已於船舶及港口管制條例淸楚訂明° River trade limits are defined in the Shipping and 內河航限是指香港鄰近水域’ 一般指香港與珠 Port Control Ordinance. The river trade limits 江、大鵬灣及澳門,及其他在廣東和廣西與香港 means the waters in the vicinity of Hong Kong, 鄰近水域相連的內陸水域。內河貿易與其他海上 which broadly includes the Pearl River, Mirs Bay and 運輸貿易的分別是以內河航限爲根據” Macau, and other inland waters in Guangdong and
Guangxi which are accessible from waters in the vicinity of Hong Kong. The distinction between river trade and other waterbome trade is based on the river trade limits.
自一九九三年開始’內河輪船的定義已修訂爲 Starting from 1993, river vessels have been redefined 於內、河航限以內操作的船隻“ as all vessels operating exclusively within the river
trade limits.
二十n尺標準貨櫃單位是以二十n尺X八卩尺X八卩尺的 T.E.U. refers to Twenty-foot Equivalent Unit (based 標準貨櫃爲根據 ° on a standardized container size of 20 feet x 8 feet x
8 feet) .
增加價値是生產總額減去中間投產消耗(生產 Value added is defined as the value of gross output 過程中所耗用的貨物和服務的價値) ° less the value of intermediate consumption (the value
of goods and services used up in the course of production).
118 Statistical Digest of the Services Sector 1999

統計圃表 Statistical Tables and Charts 表11.1 電訊業的機構單位數目、就業人數、業務收益指數、生產總額及增加價値 Table 11.1 Number of Establishments and Persons Engaged, Business Receipts Index, Gross
Output and Value Added of the T e l e c o m m u n i c a t i o n s Industry 百萬元(另有註明除外)
$ million,unless otherwise specified 1989 1990 1991 1992 1993
機構單位數目(不包括墓船/駭船營運者及船上貨 物起卸服務提供者)(" [ 2 1 1 5 ] [ 2 5 3 0 ] 2 7 0 9 3 2 2 0 3 7 4 6 Number of establishments (not including (21.1) (19.6) (7.1) (18.9) (16.3) operators of barges/lighters and stevedoring services providers)。)
就業人數(不包括蔓船/駭船營運者及船上貨物起 卸服務提供者)(” [28 104] [31081] 32 424 35 610 39 779 Number of persons engaged (not including (14.3) (10.6) (4.3) (9.8) (11.7) operators of barges/lighters and stevedoring services providers)''* 就業人數(包括蕃船/較船營運者及船上貨物起卸 服務提供者)(2M3> - - 50 8 0 0 54 7 0 0 62 2 0 0 Number of persons engaged (including operators - (7.7) (13.7) of barges/lighters and stevedoring services providers)®’ � 業務收益指數⑷(1996=100) - - - - -Business receipts index(4> (1996=100) - - - - -
生產總額 25,906 30,551 28,096 33,737 37,270 Gross output (12.5) (17.9) (-8.0) (20.0) (10.5) 增加價値 9,239 11,476 13,016 14,962 17,584 Value added (9.2) (24.2) (13.4) (15.0) (17.5)
在以要素成本計算的本地生產總値內所佔比率(%) 1.9 2.1 2.1 2.0 2.1 Contribution to GDP at factor cost (%) 增加價値在生產總額所佔比率 3 5 . 7 3 7 . 6 4 6 . 3 4 4 . 3 4 7 . 2 Value added as % of gross output
註釋:括號內的數字是與上年比較的變動百分率� Notes : Figures in brackets are percentage changes over the preceding year.
(1) 一九九一年及以後的數字是該年內四季的 (1) Figures for 1991 and onwards are averages of the 估計數字的平均數’而九一年以前的數字是 four quarterly estimates of the year, whereas j旨該年三月的,jf 況 ° those prior to 1991 refer to the position as at end
March of the corresponding year. (2) 爲包括靈船/較船營運者及船上貨物起卸服 (2) Specially estimated to take into account operators
務提供者而編製的特別估計數字’在日後得 of barges/lighters and stevedoring services 到更多資料時可能會作出修訂 ° providers. The figures are subject to revisions
later on as more data become available. (3) 數字是該年內四季的估計數字的平均數。 (3) Figures are averages of the four quarterly
estimates of the year. ( 4 ) 業務收益指數於一九九二統計年度開始編 (4) Business receipts indices were first available in
製’但此詳細分類的指數則於九六年開始編 the reference year 1992, but indices at such 製� detailed breakdown were first compiled in 1996.
[ ]一九九一年前的數字的涵蓋範圍與其後的 [ ] F i g u r e s prior to 1991 are slightly different in 略有不同’因此不可將兩組數字作嚴格比 coverage and therefore are not strictly 較� comparable with those for 1991 and onwards.
服務業統計摘要一九九九年 8

表8.1 (續) 海上運輸業的機構單位數目、就業人數、業務收益指數、生產總額及增加
價値 Table 8.1 (Cont'd.) Number of Establishments and Persons Engaged, Business Receipts
Index, Gross Output and Value Added of the Maritime Transport Industry
百萬元(另有註明除外) $ million, unless otherwise specified
1994 1995 1996 1997 1998 機構單位數目(不包括憂船/駭船營運者及船上貨 物起卸服務提供者)� 4 2 0 3 4 3 8 0 4 6 7 2 4 7 9 6 4 5 7 0 Number of establishments (not including (12.2) (4.2) (6.7) (2.7) (-4.7) operators of barges/lighters and stevedoring services p r o v i d e r s ) � 就業人數(不包括蔓船/驳船營運者及船上貨物起 卸服務提供者)� 4 1 8 9 3 4 3 3 1 3 4 4 2 5 9 4 5 5 5 0 4 0 5 2 7 Number of persons engaged (not including (5.3) (3.4) (2.2) (2.9) (-11.0) operators of barges/lighters and stevedoring services p r o v i d e r s ) � 就業人數(包括蹇船/駭船營運者及船上貨物起卸 服務提供者)(2)’(3) 68 100 66 700 68 800 75 000* 76 400 Number of persons engaged (including operators (9.5) (-2.1) (3.1) (9.0) (1.9) of barges/lighters and stevedoring services providers)济� 業務收益指數⑷(1996=100) - - 100.0 105.1 100.0 Business receipts index'"' (1996=100) - - - (5.1) (-4.9)
生產總額 41,782 43,854 44,388 46,220 N.A. Gross output (12.1) (5.0) (1.2) (4.1) N.A.
增加價値 19,680 21,339 21,453 22,486 N.A. Value added (11.9) (8.4) (0.5) (4.8) N.A.
在以要素成本計算的本地生產總値內所佔比率(%) 2 . 1 2 . 1 1 . 9 1 . 8 N . A . Contribution to GDP at factor cost (%) 增加價値在生產總額所佔比率 4 7 . 1 4 8 . 7 4 8 . 3 4 8 . 6 N . A . Value added as % of gross output
註釋:括號內的數字是與上年比較的變動百分率 ° Notes : Figures in brackets are percentage changes over the preceding year.
(1) 一九九一年及以後的數字是該年內四季的 (1) Figures for 1991 and onwards are averages of the 估計數的平均數’而九一年以前的數字是 four quarterly estimates of the year, whereas 指該年三月底的情況 “ those prior to 1991 refer to the position as at end
March of the corresponding year. (2) 爲包括躉船/数船營運者及船上貨物起卸服 (2) Specially estimated to take into account operators
務提供者而編製的特別估計數字’在日後得 of barges/lighters and stevedoring services 到更多資料時可能會作出修訂。 providers. The figures are subject to revisions
later on as more data become available. (3) 數字是該年內四季的估計數字的平均數。 (3) Figures are averages of the four quarterly
estimates of the year. ( 4 ) 業務收益指數於一九九二統計年度開始編 (4) Business receipts indices were first available in
製’但此詳細分類的指數則於九六年開始編 the reference year 1992, but indices at such 製� detailed breakdown were first compiled in 1996.
118 Statistical Digest of the Services Sector 1999

圓8.1 海上運輸業的機構單位數目<”•<=>及就業人數<”’<2> Chart 8.1 Number of Establishments'" and Persons Engaged� 口)in the Maritime
Transport Industry
機構單位數目 就業人數
Number o f establishments Number o f persons engaged 6 000 r n 60 000
5 000 50 000
[HT!! RW^ _ 4 000 l>>>>\ X X fc … - 4 0 000
_ _ _ _
1 _ — ― ― 1 — 1 ……•…暴』…———— — —— — —— — — � — l l l l l l l _ � � 1991 1992 1993 1994 1995 1996 1997 1998
^ 機 構 單 位 數 目 就業人數
Number of establishments Number of persons engaged
註釋:(1) 數字是該年內四季的估計數字的平均數 ° Notes : (1) Figures are averages of the four quarterly estimates of the year.
(2) 不包括躉船/較船營運者及船上貨物起卸服 (2) Not including operators of barges/lighters and 務提供者 ° stevedoring services providers.
服務業統計摘要一九九九年 181

表8.2 進出香港的船隻⑴ Table 8.2 Inward and Outward Movements of Vessels�
1989 1990 1991 1992 1993 遠洋輪船 38 140* 40 870* 45 350* 51 700* [57 420]* 66 780* Ocean vessels (11.4) (7.1) (11.0) (14.0) - (16.3)
內河客輪往/來自珠江口岸 17 680* 23 520 25 620 28 700 [28 700] 36 550 River passenger ferries to/from Pearl River Ports (-1.5) (33.0) (9.0) (12.0) - (27.3)
內河客輪往/來自澳門 7 0 4 5 0 7 3 1 0 0 7 3 1 6 0 7 7 3 0 0 [ 7 7 3 0 0 ] 7 5 1 3 0 River passenger ferries to/from Macau (5.5) (3.8) (0.1) (5.7) - (-2.8)
內河貨船(2) 1 0 0 6 3 0 1 0 8 4 0 0 1 1 4 1 6 0 141 0 5 0 [ 1 3 5 3 3 0 ] 1 5 2 7 7 0 River cargo v e s s e l s � (-4.2) (7.7) (5.3) (23.6) - (12.9)
1994 1995 1996 1997 1998 遠洋輪船 74 350* 83 480* 83 540* 88 970* 83 610 Ocean vessels (11.3) (12.3) (0.1) (6.5) (-6.0)
內河客輪往/來自珠江口岸 4 2 3 3 0 4 6 0 1 0 4 7 6 8 0 5 1 2 6 0 5 0 5 7 0 River passenger ferries to/from Pearl River Ports (15.8) (8.7) (3.6) (7.5) (-1.3)
內河客輪往/來自澳門 8 4 0 4 0 8 2 9 6 0 8 2 8 5 0 8 1 1 8 0 * 7 9 4 3 0 River passenger ferries to/from Macau (11.9) (-1.3) (-0.1) (-2.0) (-2.2) 內 河 貨 船 1 8 3 330 218 050 224 200 245 430* 249 020 River cargo v e s s e l s � (20.0) (18.9) (2.8) (9.5) (1.5) 註釋:括號內的數字是與上年比較的變動百分率� Notes : Figures in brackets are percentage changes over the
preceding year. 由今期開始’遠洋輪船的數字已採用由海事處編 Starting from this issue, ocean vessel statistics 製的船隻統計數字。由於所包括的船隻種類有所 compiled by the Marine Department have been 不同’數字不能與早期所刊登的數字直接比較� adopted. Due to difference in coverage, the figures
are not strictly comparable with those published in the earlier issues.
( 1 )自一九九三年開始’遠洋輪船及內河船隻的 (1) Starting from 1993, ocean vessels and river 定義已作修言了 ’是根據所停靠港口是否已超 vessels have been redefined according to whether 越內河航限°爲方便比較丄按新定義編製的 or not their ports of call are beyond the river trade 九二年數字於方括號內展示� limits. To facilitate comparison, figures for
1992 compiled according to the new definition are presented in square brackets.
(2) 「內河貨船丄在上期《服務業統計摘要》內 (2) "River cargo vessels" was referred to as "river 稱爲「內河商船 J � trading vessels" in the previous issue of Statistical
Digest of the Services Sector.
182 Statistical Digest of the Services Sector 1999

表8.3 經海運及河運進出香港的乘客人數 Table 8.3 Inward and Outward Movements of Passengers by Ocean and by River
1989 1990 1991 1992 1993 乘客總計⑴ 15 6 4 2 9 5 0 17 2 2 0 3 6 0 1 8 2 1 9 397 1 9 5 2 5 5 4 2 2 0 0 9 1 8 9 2 Total movements of passengers � (2.4) (10.1) (5.8) (7.2) (2.9)
抵港 7 710 295 8 501 669 8 984 255 9 621 457 9 887 845
Arrivals (3.4) (10.3) (5.7) (7.1) (2.8) 離港 7 932 655 8 718 691 9 235 142 9 904 085 10 204 047 Departures ^ ^ ^ ( 7 ^
1994 1995 1996 1997 1998 乘客總計⑴ 20 918 585 20 866 011 21 333 932 18 804 891 17 915 680 Total movements of passengers^" (4.1) (-0.3) (2.2) (-11.9) (-4.7)
抵港 10 340 426 10 313 688 10 583 499 9 318 066 8 832 247
Arrivals (4.6) (-0.3) (2.6) (-12.0) (-5.2) 離港 10 578 159 10 552 323 10 750 433 9 486 825 9 083 433 Departures (1.9) (-11.8) (-4.3)
註釋:括號內的數字是與上年比較的變動百分率 ° Notes : Figures in brackets are percentage changes over the preceding year.
(1) 不包括被拒入境者及乘坐巡迴郵船之旅 � Excluding refused landing passengers and cruise 客“—九九零牵開始軍部人員亦不包括在 passengers. Servicemen are also excluded 內� starting from 1990.
表8.4 按營辦商劃分的港內客運服務估計乘客人次 Table 8.4 Estimated Passenger Journeys of Internal Passenger Transport by Operator
千人 Thousands 1989 1990 1991 1992 1993
估計乘客人次 116 953 99 932 95 079 88 582 85 763 Estimated passenger journeys N.A. (-14.6) (-4.9) (-6.8) (-3.2)
油蔴地小輪⑴ 70 531 55 202 50 960 44 368 41 135 Hongkong and Yaumati F e r r y � (-6.8) (-21.7) (-7.7) (-12.9) (-7.3) 天星小輪 39 808 37 907 36 602 35 844 35 723
Star Ferry (-4.6) (-4.8) (-3.4) (-2.1) (-0.3) 持 牌 渡 輪 6 614 6 823 7 517 8 370 8 905 Licensed ferries'^' (11.6) ^ (10.2) (11.3) ^
1994 1995 1996 1997 1998 估計乘客人次 85 686 81 112 78 323 71 580 62 740 Estimated passenger journeys (-0.1) (-5.3) (-3.4) (-8.6) (-12.3)
油蔴地小輪(1) 40 169 36916 34 213 29 990 22 756 Hongkong and Yaumati Ferry'" (-2.3) (-8.1) (-7.3) (-12.3) (-24.1) 天星小輪 36 161 34 950 35 225 32 477 30 025
Star Ferry (1.2) (-3.3) (0.8) (-7.8) (-7.5) 持牌渡輪(2) 9 356 9 246 8 885 9 113 9 959
Licensed f e r r i e s � ^ (2£) ^ 註釋:括號內的數字是與上年比較的變動百分率“ Notes : Figures in brackets are percentage changes over the
preceding year. (1) 包括汽車渡輪所運載汽車的估計乘客數 (1) Including estimated number of passengers in
目� vehicles carried by vehicular ferry services. (2) 「持牌渡輪」在上期《服務業統計摘要》內 (2) "Licensed ferries" was referred to as "minor
稱运「/j�型渡輪 J � ferries" in the previous issue of Statistical Digest of the Services Sector.
服務業統計摘要一九九九年 183

表8.5 以海運及河運進出香港的貨物<”’<2> Table 8.5 Inward and Outward Movements of C a r g o � ’ � by Ocean and by River
千公 _ Thousand tonnes
1989 1990 1991 1992 1993 卸下 51 269 52 268 59 621 70415 [70 550] 80 009
Discharged (2.0) (1.9) (14.1) (18.1) - (13.4) 海運 45 792 46 242 52 899 58 423 [58 923] 68 226
By ocean (3.5) (1.0) (14.4) (10.4) - (15.8) 河運 5 477 6 026 6 722 11 992 [11 627] 11783
By river (-8.9) (10.0) (11.6) (78.4) - (1.3) 裝上 22 412 23 028 27 971 31 184 [32 230] 38 128
Loaded (6.1) (2.7) (21.5) (11.5) - (18.3) 海運 18 863 19 766 23 546 25 799 [24 524] 27 873 By ocean (10.6) (4.8) (19.1) (9.6) - (13.7) 河運 3 549 3 262 4 425 5 385 [7 706] 10 255 By river (-12.6) (-8.1) (35.7) (21.7) - (33.1)
1994 1995 1996 1997 1998 卸下 92 844 101 771 100 929 107 513 106 851
Discharged (16.0) (9.6) (-0.8) (6.5) (-0.6) 海運 76 672 87 048 86 694 91 950 90 104
By ocean (12.4) (13.5) (-0.4) (6.1) (-2.0) 河運 16 172 14 723 14 235 15 563 16 747
By river (37.2) (-9.0) (-3.3) (9.3) (7.6) 裝上 48 181 54 136 56 371 61 716 60 319
Loaded (26.4) (12.4) (4.1) (9.5) (-2.3) 海運 34 274 40 127 39 145 41 351 37 378 By ocean (23.0) (17.1) (-2.4) (5.6) (-9.6) 河運 13 907 14 009 17 226 20 365 22 941 By river (35.6) ^ (23.0) (18.2) (12.7)
註釋:括號內的數字是與上年比較的變動百分率 ° Notes : Figures in brackets are percentage changes over the preceding year.
( 1 )自一九九三年開始’海運的定義已修訂爲於 � Starting from 1993, ocean has been redefined to 內河航限以外操作的船隻運輸’而河運則修 refer to transport by all vessels operating beyond 訂爲於內河航限以內操作的船隻運輸。爲方 the river trade limits whereas river has been 便比較二按新定義編製的九二年數字於方括 redefined to refer to transport by all vessels 號內展示 ° operating exclusively within the river trade limits.
To facilitate comparison, figures for 1992 compiled according to the new definition are presented in square brackets.
( 2 ) 不 包 括 過 境 貨 物 ° (2) Not including transit cargo.
184 Statistical Digest of the Services Sector 1999

圓8.2 以海運及河運進出香港的貨物⑴’⑶ Chart 8.2 Inward and Outward Movements of Cargo(”’ � by Ocean and by River
千公噸
Thousand tonnes 140 000 1
120 000 i
100 000 —
80 000 j
60 000
40 000 , _ - - - M
20 000 ;
Q i I 1 I I I I
1992 1993 1994 1995 1996 1997 1998 海運 - - - 河 運 By ocean By river
註釋:(1 )自一九九三年開始’海運的定義已修訂爲於 Notes : (1) Starting from 1993,ocean has been redefined to 內河航限以外操作的船隻運輸’而河運則修 refer to transport by all vessels operating beyond 訂爲於內河航限以內操作的船隻運輸°爲方 the river trade limits whereas river has been 便比較丄按新定義編製的九二年數字於方括 redefined to refer to transport by all vessels 號內展示 ° operating exclusively within the river trade limits.
To facilitate comparison, figures for 1992 compiled according to the new definition are presented in square brackets.
( 2 )不包括過境貨物 ° (2) Not including transit cargo.
服務業統計摘要一九九九年 185

表8.6 按貨物起卸地點及遠洋/內河船隻劃分的貨概吞吐量">’ Table 8.6 Container Throughput*'' by Cargo Handling Location by Ocean/River Vessels
千個廿呢標準貨櫃單位 Thousand T.E.U.s
1989 1990 1991 1992 1993 貨櫃吞吐量 4 4 6 4 5 1 0 1 6 1 6 2 7 9 7 2 9 2 0 4 Container throughput (10.7) (14.3) (20.8) (29.4) (15.5)
貨櫃碼頭⑶ 3 3 1 7 3 8 3 1 4 5 1 4 5 0 7 9 5 7 9 7 Container terminals'^' (10.5) (15.5) (17.8) (12.5) (14.1)
由船卸下 1 6 0 1 1 8 3 0 2 1 6 1 2 4 2 8 2 7 5 0 Discharged (9.3) (14.3) (18.1) (12.4) (13.2) 裝上船 1 716 2 001 2 353 2 651 3 047 Loaded (11.6) (16.6) (17.6) (12.6) (15.0)
貨櫃碼頭以外 1 1 4 7 1 2 6 9 1 6 4 8 2 8 9 3 3 4 0 8 Other than container terminals (11.2) (10.7) (29.8) (75.6) (17.8)
經遠洋輪船 1 0 6 7 1 1 9 8 1 5 7 3 2 4 6 1 2 7 9 7 By ocean vessels (12.4) (12.3) (31.3) (56.4) (13.7)
由船卸下 5 7 5 6 6 3 8 6 1 1 2 8 4 1 5 0 3 Discharged (10.1) (15.4) (29.8) (49.1) (17.1) 裝上船 492 535 712 1 178 1 294
Loaded (15.2) (8.7) (33.0) (65.4) (9.9) 經內河船隻 7 9 7 1 7 4 4 3 2 6 1 0 By river vessels (-2.5) (-10.6) (4.8) (480.6) (41.3)
由船卸下 4 6 3 7 3 7 2 2 0 3 1 4 Discharged (12.3) (-18.9) (-0.6) (489.8) (42.7) 裝上船 33 33 37 212 297 Loaded (-17.7) ^ (11.0) (471.3) (39.9)
註釋:括號內的數字是與上年比較的變動百分率 ° Notes : Figures in brackets are percentage changes over the preceding year.
由今期開始’此表的陳示方法已作出修訂 ° The presentation of this table has been revised as from this issue.
(1) 由一九九八年開始’ 一系列新的貨櫃吞吐量 (1) Starting from 1998,a new series of container 數字已經開始編製。爲方便比較’按新系列 throughput has been compiled. To facilitate 編製的九七年數字於方括號內展示 ° comparison, figures for 1997 compiled according
to the new series are presented in square brackets. ( 2 )數字包括載貨及空貨櫃 ° (2) Figures include laden and empty containers. (3) 數字已包括小部分經內河船隻在貨櫃碼頭 (3') Figures include a small proportion of containers
起 命 的 貨 � handled by river vessels at the container terminals.
118 Statistical Digest of the Services Sector 1999

表8.6 (維) 按貨物起卸地點及遠洋輪船/內河船隻劃分的貨榧吞吐量(”’ Table 8.6 (Cont'd.) Container T h r o u g h p u t � � by Cargo Handling Location by Ocean/River Vessels 千個廿呢標準貨櫃單位 Thousand T.E.U.s
1994 1995 1996 1997 1998 貨櫃吞吐量 1 1 0 5 0 1 2 5 5 0 1 3 4 6 0 1 4 5 6 7 [ 1 4 3 8 6 ] 1 4 5 8 2 Container throughput (20.1) (13.6) (7.3) (8.2) - (1_4) 貨櫃碼頭⑶ 7 2 7 8 8 2 5 6 8 6 8 6 9 4 9 0 [ 9 5 6 4 ] 9 5 5 5 Container t e rmina l s� (25.6) (13.4) (5.2) (9.3) - (-0.1)
由船卸下 3 3 9 7 3 9 0 4 4 1 4 7 4 5 6 4 [ 4 5 5 5 ] 4 6 4 6 Discharged (23.5) (14.9) (6.2) (10.1) - (2.0) 裝上船 3 881 4 352 4 539 4 926 [5 009] 4 909
Loaded (27.4) (12.1) (4.3) (8.5) - (-2.0)
貨櫃碼頭以外 3 7 7 2 4 2 9 4 4 7 7 4 5 0 7 8 [ 4 8 2 2 ] 5 0 2 7 Other than container terminals (10.7) (13.8) (11.2) (6.4) - (4.2)
經遠洋輪船 2 8 3 9 2 9 3 0 3 0 4 5 3 1 5 6 [ 2 9 0 0 ] 2 6 4 1 By ocean vessels (1.5) (3.2) (4.0) (3.6) - (-8.9)
由船卸下 1 5 9 5 1 6 1 2 1 6 2 5 1 6 3 2 [ 1 5 8 4 ] 1 4 5 8 Discharged (6.1) (1.1) (0.8) (0.4) - (-7.9) 裝上船 1 244 1 317 1 420 1 523 [1 316] 1183
Loaded (-3.9) (5.9) (7.8) (7.2) - (-10.2) 經內河船隻 9 3 3 1 3 6 4 1 7 2 9 1 9 2 2 [ 1 9 2 2 ] 2 3 8 6 By river vessels (52.8) (46.3) (26.7) (11.2) - (24.1)
由船卸下 4 7 7 6 9 8 8 8 1 9 8 4 [ 9 8 4 ] 1 1 8 0 Discharged (52.1) (46.4) (26.2) (11.8) - (19.9) 裝上船 456 666 848 938 [938] 1 206 Loaded (53.6) (46.1) (27.3) (10.6) - (28.6)
註釋:括號內的數字是與上年比較的變動百分率“ Notes : Figures in brackets are percentage changes over the preceding year.
由今期開始’此表的陳示方法已作出修訂� The presentation of this table has been revised as from this issue.
(1) 由一九九八年開始,一系列新的貨櫃吞吐量 (1) Starting from 1998, a new series of container 數字已經開始編製°爲方便比較’按新系列 throughput has been compiled. To facilitate 編製的九七年數字於方括號內展示“ comparison, figures for 1997 compiled according
to the new series are presented in square brackets. (2 )數字包括載貨及空貨櫃。 (2) Figures include laden and empty containers. (3) 數字已包括小部分經內河船隻在貨櫃碼頭 丨3) Figures include a small proportion of containers
起命的貨<^� handled by river vessels at the container terminals.
服務業統計摘要一九九九年 187

表 8 . 7 海員統計數字 Table 8.7 Seafarers Statistics
1989 1990 1991 1992 1993 在商船海員管理處登記僱用本港海員的船公司數目 5 5 5 7 5 4 5 3 5 0 Number of shipping companies listed with (-1.8) (3.6) (-5.3) (-1.9) (-5.7) Mercantile Marine Office to employ Hong Kong seafarers 登記海員數目 Number of seafarers registered
根據《商船(海員招募)條例》 6 9 1 2 2 6 6 9 3 6 6 5 7 0 5 6 4 7 3 4 6 3 9 7 9 Under "Merchant Shipping (Recruiting of (-3.2) (-3.2) (-1.8) (-1.5) (-1.2) Seamen) Ordinance" 根據《商船(海員)條例》 - - - - -Under "Merchant Shipping (Seafarers) -Ordinance"
僱用海員數目 5 3 0 7 4 1 9 6 3 3 4 0 2 3 3 3 1 7 5 2 Number of seafarers employed (-19.2) (-20.9) (-20.4) (-30.1) (-24.9)
1994 1995 1996 1997 1998 在商船海員管理處登記僱用本港海員的船公司數目 4 5 2 9 2 5 2 6 2 5 Number of shipping companies listed with (-10.0) (-35.6) (-13.8) (4.0) (-3.8) Mercantile Marine Office to employ Hong Kong seafarers
登記海員數目 Number of seafarers registered 根據《商船(海員招募)條例》 6 3 9 8 1 6 4 0 1 6 6 3 3 7 2 - -Under "Merchant Shipping (Recruiting of (#) (0.1) (-1.0) - -Seamen) Ordinance" 根據《商船(海員)條例》 - - 8 8 3 3 1 1 9 3 4 1 4 Under "Merchant Shipping (Seafarers) - - - (253.2) (9.5) Ordinance"
僱用海員數目 1 3 8 3 9 4 5 6 1 6 1 2 4 4 1 2 9 6 Number of seafarers employed (-21.1) (-31.7) (-34.8) (101.9) (4.2) 註釋:括號內的數字是與上年比較的變動百分率 ” Notes : Figures in brackets are percentage changes over the
preceding year.
# 表示變動百分率在增減0.05%以內� # Denotes change within 土 0.05%.
18 8 Statistical Digest of the Services Sector 1999

表8.8 註 _隻統計數字 Table 8.8 Statistics on Vessels Registered
1989 1990 1991 1992 1993 香港註冊船舶的淨_位 4 0 3 4 8 1 0 3 9 4 1 5 6 0 3 9 2 3 2 1 4 4 3 9 8 5 6 2 4 6 0 8 3 3 2 Net tonnage of ships registered in Hong Kong (-1.2) (-2.3) (-0.5) (12.1) (4.8)
香港註冊小輪及渡輪船隻數目 6 8 1 6 7 1 6 7 8 7 5 5 8 6 2 Number of launches and ferry vessels registered (3.5) (-1.5) (1.0) (11.4) (14.2) in Hong Kong
1994 1995 1996 1997 1998 香港註冊船舶的淨噸位 4 6 0 1 4 8 3 5 0 9 7 7 2 0 4 5 2 7 0 4 9 3 2 1 5 2 3 1 3 5 3 1 1 9 9 Net tonnage of ships registered in Hong Kong (-0.1) (10.8) (-11.2) (-29.0) (9.8)
香港註冊小輪及渡輪船隻數目 8 0 6 7 9 3 7 8 1 7 7 9 6 6 8 Number of launches and ferry vessels registered (-6.5) (-1.6) (-1.5) (-0.3) (-14.2) in Hong Kong 註釋:括號內的數字是與上年比較的變動百分率 ° Note : Figures in brackets are percentage changes over the
preceding year.
服務業統計摘要一九九九年 1 8 9
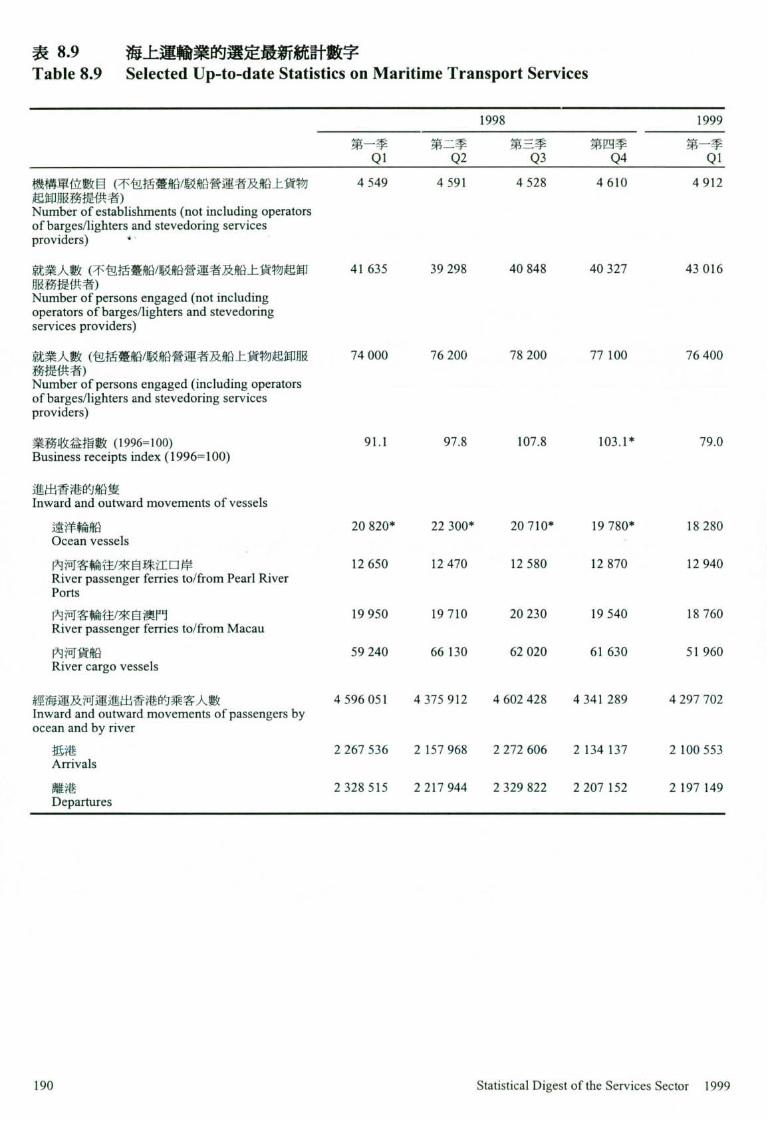
表 8 . 9 海上運输業的選定最新統計數字
Table 8.9 Selected Up-to-date Statistics on Maritime Transport Services
1998 1999 第一季 第二季 第三季 第四季 第一季 ^ Q2 Q3 Q4 ^
機構單位數目(不包括蹇船船營運者及船上貨物 4 5 4 9 4 5 9 1 4 5 2 8 4 6 1 0 4 9 1 2 起卸服務提供者)
Number of establishments (not including operators of barges/lighters and stevedoring services providers) ‘ 就業人數(不包括蕃船/駭船營運者及船上貨物起卸 41 635 39298 40 848 40327 43 016 服務提供者)
Number of persons engaged (not including operators of barges/lighters and stevedoring services providers) 就業人數(包括楚船/較船營運者及船上貨物起卸服 7 4 0 0 0 7 6 2 0 0 7 8 2 0 0 7 7 1 0 0 7 6 4 0 0 務提供者)
Number of persons engaged (including operators of barges/lighters and stevedoring services providers) 業務收益指數(1996=100) 91.1 97.8 107.8 103.1* 79.0 Business receipts index (1996=100)
進出香港的船隻 Inward and outward movements of vessels
遠洋輪船 20 820* 22 300* 20 710* 19 780* 18 280 Ocean vessels 內河客輪往/來自珠江口岸 1 2 6 5 0 1 2 4 7 0 1 2 5 8 0 1 2 8 7 0 1 2 9 4 0 River passenger ferries to/from Pearl River Ports 內河客輪往/來自澳門 1 9 9 5 0 1 9 7 1 0 2 0 2 3 0 1 9 5 4 0 1 8 7 6 0 River passenger ferries to/from Macau 內.河貨船 5 9 2 4 0 6 6 1 3 0 6 2 0 2 0 6 1 6 3 0 5 1 9 6 0 River cargo vessels
經海運及河運進出香港的乘客人數 4 5 9 6 0 5 1 4 3 7 5 9 1 2 4 6 0 2 4 2 8 4 3 4 1 2 8 9 4 2 9 7 7 0 2 Inward and outward movements of passengers by ocean and by river
抵港 2 267 536 2 157 968 2 272 606 2 134 137 2 100 553 Arrivals 離港 2 328 515 2 217 944 2 329 822 2 207 152 2 197 149
Departures
201 Statistical Digest of the Services Sector 1999

表8.9 (續) 海上運输業的選定最新統計數字 Table 8.9 (Cont'd) Selected Up-to-date Statistics on Maritime Transport Services
1998 1999 第一季 第二季 第三季 第四季 第一季 Ql Q2 Q3 Q4 Q]_
按營辦商劃分的港內客運服務估計乘客人次(千人) 1 5 7 7 6 1 5 4 8 0 1 5 4 9 3 1 5 9 8 9 1 4 5 3 6 Estimated passenger journeys of internal passenger transport by operator (thousands)
油蘇地小輪 6 0 3 8 5 9 0 3 5 5 6 5 5 2 4 9 4 6 5 9 Hongkong and Yaumati Ferry 天星小輪 7 4 3 7 7 3 8 5 7 2 6 8 7 9 3 6 7 2 2 3 Star Ferry 持牌渡輪 2 3 0 1 2 1 9 3 2 6 6 0 2 8 0 4 2 6 5 4 Licensed ferries
以海運及河運進出香港的貨物(千公噸) 41 570 44 746* 41 079* 39 775 36 811 Inward and outward movements of cargo by ocean and by river (thousand tonnes)
卸下 25 973 28 515* 26 824* 25 539 23 865
Discharged 海運 21 752 24 321 21 971 22 060 20 396
By ocean 河運 4 221 4 194* 4 853* 3 479 3 469
By river 裝上 15 597 16 231* 14 255 14 236 12 946
Loaded 海運 9 201 9711 9 450 9015 8 070
By ocean 河運 6 396 6 520* 4 804 5 221 4 876
By river
服務業統計摘要一九九九年 191

表8.9 (樓) 海上運輸業的選定最新統計數字 Table 8.9 (Cont'd) Selected Up-to-date Statistics on Maritime Transport Services
1998 1999 第一季 第二季 第三季 第四季 第一季 ^ Q2 Q3 Q4 Q1
按貨物起卸地點及遠洋/內河船隻劃分的貨植吞吐量 3 3 4 3 3 6 7 1 3 9 0 6 3 6 6 1 3 2 6 4 (千個廿D尺標準貨櫃單位) Container throughput by cargo handling location by ocean/river vessels (thousand T.E.Us) 貨櫃碼頭 2 189 2 349 2 575 2 443 2 184 Container terminals
由船卸下 1 0 6 2 1 1 4 6 1 2 3 5 1 2 0 3 1 0 7 0 Discharged 裝上船 1 127 1 203 1 339 1 240 1 114 Loaded
貨櫃碼頭以外 1 1 5 4 1 3 2 2 1 3 3 2 1 2 1 8 1 0 8 1 Other than container terminals
經遠洋輪船 6 1 7 6 8 8 6 7 5 6 6 0 5 5 0 By ocean vessels
由船卸下 3 3 9 3 7 8 3 6 8 3 7 3 3 0 5 Discharged 裝上船 278 311 307 287 245 Loaded
經內河船隻 5 3 7 6 3 4 6 5 6 5 5 9 5 3 1 By river vessels
由船卸下 2 4 9 2 9 7 3 6 1 2 7 3 2 6 2 Discharged 裝上船 288 337 295 286 269 Loaded
192 Statistical Digest of the Services Sector 1999

資料來源 Data Sources 表 資料來源 Table Sources 8.1 政府統計處 8.1 Census and Statistics Department 8.2 海事處 8.2 Marine Department 8.3 入境事務處 8.3 Immigration Department 8.4 運輸署 8.4 Transport Department 8.5 政府統計處 8.5 Census and Statistics Department 8.6-8.8 海事處 8.6-8.8 Marine Department
其他有關刊物 Further References 運輸資料年幸艮’運輸署編製 Annual Transport Digest, published by the Transport
Department 就業及空缺統it(詳細統計表) Employment and Vacancies Statistics (Detailed
Tables) 本地生產總値估計 Estimates of Gross Domestic Product 香港統計年干'J Hong Kong Annual Digest of Statistics 香港統計月刊 Hong Kong Monthly Digest of Statistics 香港港口統計月刊’海事處編製 Hong Kong Port Statistics, published by the Marine
Department 服務行業按季業務收益指數 Quarterly Business Receipts Indices for Service
Industries 就業、空缺及薪金總額按季統計報告 Quarterly Report of Employment, Vacancies and
Payroll Statistics 本地生產總丨直估計按季報告 Quarterly Report of Gross Domestic Product Estimates 運輸及有關服務按年統計調查報告 Report on Annual Survey of Transport and Related
Services 海事處統計年報’海事處編製 Statistical Tables, published by the Marine Department
?• f t
服務業統 i十摘要一九九九年 127

9 專業服務業
Professional Services 槪要 Highlights 香港商業運作暢順’並發展成爲地區服務中 Hong Kong's excellent professional services underpin ' L �’ 實有賴卓越的專業月艮務 ° the smooth operation of the business sector and Hong
Kong's development into a regional services hub.
一九九七年’專業服務業爲本港帶來約 338 The professional services industry generated about 億元的增加價値’佔本地生產總値的 2.7% : $33.8 billion of value added, or 2.7% of Hong Kong's 於九八年爲超過 80 000 人提供職位 ° Gross Domestic Product (GDP), in 1997 and provided
jobs for over 80 000 people in 1998.
一九九八年’本港約有 9 100 間專業服務機 In 1998, there were about 9 100 professional service 構單位’包括 1 300 間會計及核數公司 � establishments, including 1 300 accounting and 1 500 間簿記公司 � 1 100 間律師行和大律 auditing firms, 1 500 book-keeping firms, 1 100 師行、 2 400 間建築、測量及工程公司以及 solicitor and barrister firms, 2 400 architectural, 2 800 間管理顧問公司。 surveying and engineering firms and 2 800
management consultant firms.
由於金融及地產市場在一九九八年放緩而對 Owing to the setback in demand for professional 專業服務的需求下降’專業服務機構單位的 services from the slackened financial and real estate 數目較九七年下降 9%。同時’機場核心計畫U market in 1998, the number of professional services 竣工亦可能與建築、測量及工程公司的數目 establishments dropped by 9% compared to 1997. 下降有關。 The completion of the Airport Core Programme might
have also contributed to the drop in number of architectural, surveying and engineering firms.
撇除短期的波動,專業服務業於過去數年的 Setting aside the short term volatility, the 發展甚爲顯著 ° 一九九一年至九八年間,機 development of professional services industry over 構單位數目及就業人數分別上升 59%及 50% the past decade was quite remarkable. Number of
establishments and persons engaged surged by 59% and 50% respectively during the period of 1991 to 1998.
此外’愈來愈多專業人士在港發展’在一九 In addition, more and more professional personnels 八九年至九八年的十年間’註冊專業人士的 are developing their careers in Hong Kong. In the ten 總數增加至兩倍以上 °其中專業會計師的數 years between 1989 and 1998,the total number of 目’自九三年起每年 i曾加超過 10% ’ 是:t曾長 registered professionals had become more than 率最高的專業月艮務 ° double, with professional accountants increasing at
the fastest rate by over 10% per year since 1993.
服務業統 i十摘要一九九九年 127

主要統計數字 Key Statistics
專業服務業 Professional Services Industry 增加價値
年 機構單位數目⑴ 就業人數⑴ (百萬元) 業務收益指數 Year Number of Number of persons Value added Business receipts establishments� engaged� ($ million) index® (1996=100)
1989 [4 302] [44 143] 12,487** -1990 [5 053] [48 903] 13,530** -1991 5 713 53 512 15,853** -1992 6 574 58 622 17,560** -1993 7 194 60 776 19,127** -1994 8 956 69 904 23,753** -1995 9 250 74 604 25,032** -1996 9 199 78 022 28,818** 100.0 1997 10 003 85 744 33,754** 112.7 1998 9 058 80 031 N.A. 103.2
註釋:(1) 一九九一年及以後的數字是該年內四季的 Notes : (1) Figures for 1991 and onwards are averages of the 估計數空的平均數’而九一年以前的數字是 four quarterly estimates of the year, whereas those 指該年三月底的情況� prior to 1991 refer to the position as at end March
of the corresponding year. ( 2 ) 業務收益指數於一九九二統計年度開始編 (2) Business receipts indices were first available in the
製’但此詳細分類的指數則於九六年開始編 reference year 1992, but indices at such detailed 製 ° breakdown were first compiled in 1996.
[ ]一九九一年前的數字的涵蓋範圍與其後的 [ ] F i g u r e s prior to 1991 are slightly different in 略有不同’因此不可將兩組數字作嚴格比 coverage and therefore are not strictly comparable 較� with those for 1991 and onwards.
** 數字是根據有限數據而作出的粗略估計’在 ** These are crude estimates which are compiled 日後得到更多資;^時可能會作相當大的修 based on limited data. They may be subject to 言丁 ’因此在運用這數字時’應小心留意這 considerable revisions when more data become 點 ° available. Special care should be taken when
interpreting them.
196 Statistical Digest of the Services Sector 1999
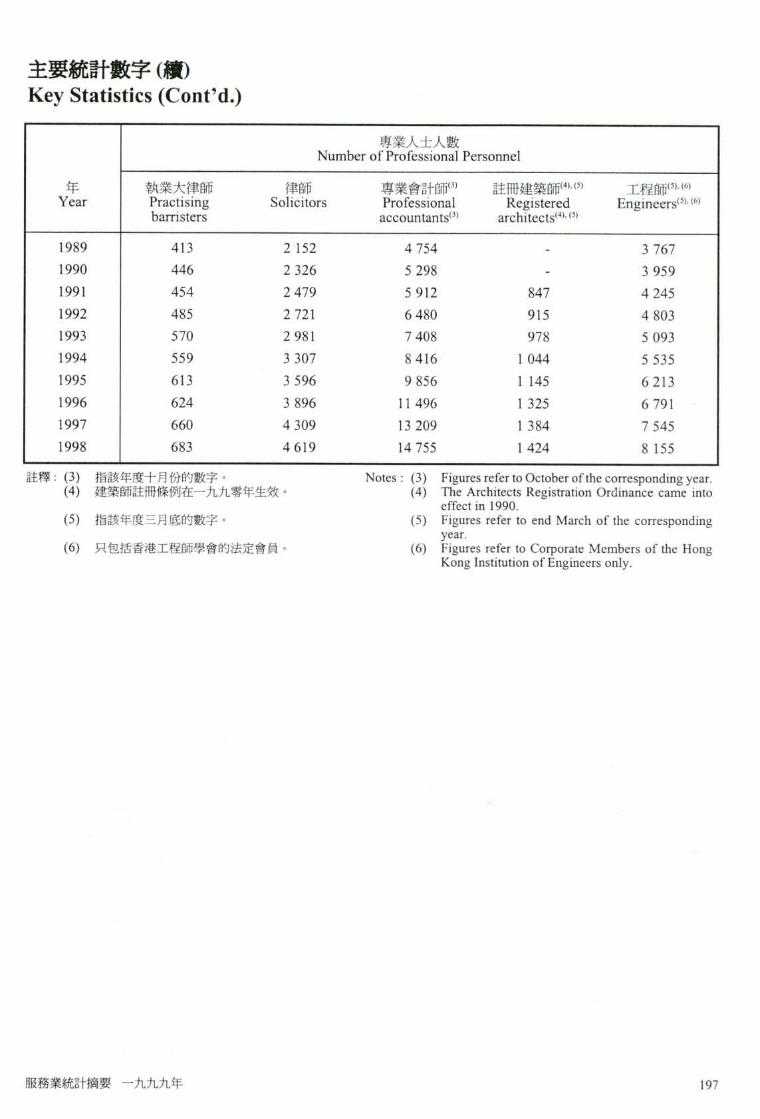
主要統計數字(纊) Key Statistics (Cont'd.)
專業人士人數 Number of Professional Personnel 年 執業大律師 律師 專業會計師註冊建築師< 4 > ’ < 5 > 工程師(SMS� Year Practising Solicitors Professional Registered Engineers � . � barristers accountants � architects � ’ �
1989 413 2 152 4 754 - 3 767 1990 446 2 326 5 298 - 3 959 1991 454 2 479 5 912 847 4 245 1992 485 2 721 6 480 915 4 803 1993 570 2 981 7 408 978 5 093 1994 559 3 307 8416 1 044 5 535 1995 613 3 596 9 856 1 145 6213 1996 624 3 896 11 496 1 325 6 791 1997 660 4 309 13 209 1 384 7 545 1998 683 4619 14 755 1 424 8 155
註釋:(3)指該年度十月份的數字。 Notes: (3) Figures refer to October ofthe corresponding year. ( 4 )建築師註冊條例在一九九零年生效 ° (4) The Architects Registration Ordinance came into
effect in 1990. ( 5 )指該年度三月底的數字 ° (5) Figures refer to end March of the corresponding
year. (6 )只包括香港工程師學會的法定會員“ (6) Figures refer to Corporate Members of the Hong
Kong Institution of Engineers only.
服務業統i十摘要一九九九年 127

槪念及方法 Concepts and Methods 自一九九零年開始’所有達築厥必須根據建築 All architects must register with the Hong Kong 師註冊條例規定’向香港建築師學會註冊° Institute of Architects under the Architects
Registration Ordinance starting from 1990.
香港工程師學會是一個爲工程激而設的組織。 The Hong Kong Institution of Engineers is an 然而,香港並沒有法例規定,工程師必須向學會 organization for engineers. However, it is not a legal 註冊°因此’執業的工程師確實人數應較本刊列 requirement for engineers to register with the 載白勺數字爲多� Institution. Thus, the actual number of practising
engineers should be larger than the number presented here.
律師可分爲大律師及律師’並根據法律執業者 comprise barristers and solicitors which are 條例註冊。大律師受香港大律師公會監管’而律 registered under the Legal Practitioners Ordinance. 師則由香港律師會管制 ° Barristers are monitored by the Hong Kong Bar
Association while solicitors are regulated by the Law Society of Hong Kong.
所有執業的專業會計師都必須根據專業會計師 All practising professional accountants must register 條例規定’向香港會計師公會註冊 ° with the Hong Kong Society of Accountants under the
Professional Accountants Ordinance.
言司業釋義 Definition of terms
在編製統計數字時’專業服務業包括提供法 For statistical compilation purpose, the professional 律、會計、核數、簿記、建築、測量及工程服務 services industry covers establishments rendering 和商業管理及顧問服務的機構單位� legal, accounting, auditing, bookkeeping,
architectural, surveying and engineering services as well as those engaged in business management and consultancy services.
潘/專罩位是指在單一擁有權或控制權(即單一公 An establishment is defined as an economic unit (i.e. a 司名義)下’在單一地點從事一種或主要從事一 unit engaged in the production of goods or services) 種經濟活動(即生產貨物或提供服務)的經濟單 which engages, under a single ownership or control 位 ° (i.e. under a single company name), in one or
predominantly one kind of economic activity at a single physical location.
生產總額包括機構單位提供服務所獲取的服務 Gross output comprises mainly receipts from services 費用’佣金及其他收入 “ rendered in the form of fees, commissions and other
service charges.
本地生產總値是指一個國家或地區的所有常住 Gross Domestic Product (GDP) is a measure of the 生產單位’在一個指定的期間內’未扣除固定資 total value of production of all resident producing
units of a country or territory in a specified period, 118 Statistical Digest of the Services Sector 1999

本消耗的生產總値 ° before deducting allowance for consumption of fixed capital.
就業人數包括積極參與機構單位工作的在職東 Persons engaged in an establishment include working 主及股東;在統計曰期受僱於機構單位的全職僱 proprietors and partners actively engaged in the work 員’包括長期或臨時聘用的’無論這些僱員正在 of the establishment; full-time employees paid by the 開工或因事假或者病假而暫時缺勤;及在統計日 establishment on the survey reference date, both 期工作三小時或以上的兼職僱員和無酬家屬幫 permanent and temporary, who are either at work or 工� on vacation or sick leave; and part-time employees
and unpaid family workers working three hours or more on the survey reference date.
乂#力/7潭經是生產總額減去中間投產消耗(生產過 Value added is defined as the value of gross output 程中所耗用的貨物和服務的價値 ) ° less the value of intermediate consumption (the value
of goods and services used up in the course of production).
服務業統 i十摘要一九九九年 127

統計圓表 Statistical Tables and Charts 表 9 . 1 專業服務業的機構單位數目、就業人數、業務收益指數、生產總額及增加價値 Table 9.1 Number of Establishments and Persons Engaged, Business Receipts Index, Gross
Output and Value Added of the Professional Services Industry 百萬元(另有註明除外)
$ million, unless otherwise specified 1989 1990 1991 1992 1993
機構單位數目⑴ [ 4 3 0 2 ] [ 5 0 5 3 ] 5 7 1 3 6 5 7 4 7 1 9 4 Number of es tabl ishments� (21.3) (17.5) (13.1) (15.1) (9.4)
就業人數⑴ [ 4 4 1 4 3 ] [ 4 8 9 0 3 ] 5 3 5 1 2 5 8 6 2 2 6 0 7 7 6 Number of persons engaged � (13.2) (10.8) (9.4) (9.5) (3.7) 業務收益指數⑵(1996=100) - - - - -Business receipts index�(1996=100) -
生產總額 17,659** 20,390** 23,034** 26,835** 28,850**
Gross output (8.6) (15.5) (13.0) (16.5) (7.5)
增加價値 12,487** 13,530** 15,853** 17,560** 19,127** Value added (14.6) (8.4) (17.2) (10.8) (8.9)
在以要素成本計算的本地生產總値內所佔比率(%) 2.5** 2.4** 2.5** 2.4** 2.3** Contribution to GDP at factor cost (%) 增加價値在生產總額所佔比率 70.7** 66.4** 68.8** 65.4** 66.3** Value added as % of gross output
註釋:括號內的數字是與上年比較的變動百分率 “ Notes : Figures in brackets are percentage changes over the preceding year.
(1) 一九九一年及以後的數字是該年內四季的 (1) Figures for 1991 and onwards are averages of the 估計數字的平均數’而九一年以前的數字是 four quarterly estimates of the year, whereas those J旨該年三月底的,f青況� prior to 1991 refer to the position as at end March
of the corresponding year. ( 2 ) 業務收益指數於一九九二統計年度開始編 (2) Business receipts indices were first available in the
製’但此詳細分類的指數則於九六年開始編 reference year 1992, but indices at such detailed 製� breakdown were first compiled in 1996.
[ ]一九九一年前的數字的涵蓋範圍與其後的 [ ] F i g u r e s prior to 1991 are slightly different in 略有不同’—此禾 T ^ J將兩組數字作嚴格比 coverage and therefore are not strictly comparable 較 ° with those for 1991 and onwards.
** 數字是根據有限數據而作出的粗略估計’在 ** These are crude estimates which are compiled 曰後得到更多資料時可能會作相當大的修 based on limited data. They may be subject to 言了,此在運用這威字 S f ’ 應小心留意這 considerable revisions when more data become i i ° available. Special care should be taken when
interpreting them.
200 Statistical Digest of the Services Sector 1999

表 9 . 1 (總) 專業服務業的機位數目、就業人數、業務收益指數、生產總額及增加價値
Table 9.1 (Cont'd.) Number of Establishments and Persons Engaged, Business Receipts Index, Gross Output and Value Added of the Professional Services Industry
百萬元(另有註明除外) $ million, unless otherwise specified
1994 1995 1996 1997 1998 機構單位數目⑴ 8 9 5 6 9 2 5 0 9 1 9 9 1 0 0 0 3 9 0 5 8 Number of establishments� (24.5) (3.3) (-0.6) (8.7) (-9.4)
就業人數⑴ 6 9 9 0 4 7 4 6 0 4 7 8 0 2 2 8 5 7 4 4 8 0 0 3 1 Number of persons e n g a g e d � (15.0) (6.7) (4.6) (9.9) (-6.7)
業務收益指數(1996=100) - - 100.0 112.7 103.2 Business receipts index<2> (1996=100) - - - (12.7) (-8.4)
生產總額 37,035** 38,952** 43,998** 49,716** N.A. Gross output (28.4) (5.2) (13.0) (13.0) N.A.
增加價値 23,753** 25,032** 28,818** 33,754** N.A. Value added (24.2) (5.4) (15.1) (17.1) N.A.
在以要素成本 i t算的本地生產總値內所佔比率(%) 2.5** 2.5** 2.5** 2.1** N.A. Contribution to GDP at factor cost (%) 增加價値在生產總額所佔比率 64.1** 64.3** 65.5** 67.9** N.A. Value added as % of gross output
註釋:括號內的數字是與上年比較的變動百分率° Notes : Figures in brackets are percentage changes over the preceding year.
(1) 一九九一年及以後的數字是該年內四季的 (1) Figures for 1991 and onwards are averages of the 估言十數字的平均數’而九一年以前的數字是 four quarterly estimates of the year, whereas those 指該年三月底白青況� prior to 1991 refer to the position as at end March
of the corresponding year. ( 2 ) 業務收益指數於一九九二統計年度開始編 (2) Business receipts indices were first available in the
製’但此詳細分類的指數則於九六年開始編 reference year 1992, but indices at such detailed 製 ° breakdown were first compiled in 1996.
** 數字是根據有限數據而作出的粗略估計,在 ** These are crude estimates which are compiled 曰後得到更多資f;[時可能會作相當大的修 based on limited data. They may be subject to 言了 ’因此在運用這數字時’應小心留意這 considerable revisions when more data become 點 ° available. Special care should be taken when
interpreting them.
服務業統 i十摘要一九九九年 127

圓 9 . 1 専業服務業的機 _位數目⑴•業人數” Chart 9.1 Number of Establishments� and Persons Engaged� in the Professional Services
Industry
機構單位數目 就業人數 Number of establishments Number of persons engaged
12 000 r 120 000
10 000 100 000
网 闕 關 _ 闕
8000 W 1 — 8 0 0 0 0
H _ _ 隱 _ _ _ _
4。。。…—•…圓…,—————•…r…斷…會―-2。。。…議……_ ---- _ 1 - - _ -一_--…_ -----_ --…圓…2。。。。
0 M M M , M . M M , M , M I 0 1991 1992 1993 1994 1995 1996 1997 1998 ^ 機 構 單 位 數 目 就業人數 Number of establishments Number of persons engaged
註釋:(1) 數字是該年內四季的估計數字的平均數° Note: (1) Figures are averages of the four quarterly estimates of the year.
118 Statistical Digest of the Services Sector 1999

表9.2 法律服務
Table 9.2 Legal Services
1989 1990 1991 1992 1993 律師人數 2 565 2 772 2 933 3 206 3 551 Number of lawyers (6.3) (8.1) (5.8) (9.3) (10.8)
執業大律師 413 446 454 485 570 Practising barristers (-0.5) (8.0) (1.8) (6.8) (17.5) 律師 2 152 2 326 2 479 2 721 2 981 Solicitors (7.7) (8.1) (6.6) (9.8) (9.6)
提供法律服務的機構單位數目G)’(2> [ 7 4 7 ] [ 7 7 7 ] - 9 1 1 -Number of establishments rendering legal (3.3) (4.0) -services � ’ �
大律師 [353] [357] - 406 -Barristers (2.6) (1.1) - - -律師 [394] [420] - 505 -Solicitors (4.0) (6.6) - - -
在本地法院審理的案件數目 621 077 631 956 634 248 668 531 726 163 Number of cases heard in local courts (-2.2) (1.8) (0.4) (5.4) (8.6)
1994 1995 1996 1997 1998 律師人數 3 866 4 209 4 520 4 969 5 302 Number of lawyers (8.9) (8.9) (7.4) (9.9) (6.7)
執業大律師 559 613 624 660 683 Practising barristers (-1.9) (9.7) (1.8) (5.8) (3.5) 律師 3 307 3 596 3 896 4 309 4 619 Solicitors (10.9) (8.7) (8.3) (10.6) (7.2)
提供法律服務的機構單位數目(i>’(2> 9 7 2 1 0 4 0 1 0 4 1 1 1 6 2 1 1 4 1 Number of establishments rendering legal - (7.0) (0.1) (11.6) (-1.8) s e r v i c e s � ’ �
大律師 426 468 455 468 469 Barristers - (9.9) (-2.8) (2.9) (0.2) 律師 546 572 586 694 672 Solicitors - (4.8) (2.4) (18.4) (-3.2)
在本地法院審理的案件數目 761 411 741 983 791 830 934 299 967 694 Number of cases heard in local courts (4.9) (-2.6) (6.7) (18.0) (3.6) 註釋:括號內的數字是與上年比較的變動百分率� Notes : Figures in brackets are percentage changes over the
preceding year. (1)指該年度三月底的數字。 (1) Figures refer to end March of the corresponding
year. (2) 數字來自就業及—按季統計調李。由於在 (2) Figures based on the Quarterly Survey of
一九九一年及九三年並沒有進行有關統計 Employment and Vacancies. Data were not 調査’所以沒有該兩年的數字� available in 1991 and 1993 because the survey
concerned was not conducted in those years. [ ]一九九一年前的數字的涵蓋範圍與其後的 [ ] F i g u r e s prior to 1991 are slightly different in
略有不同’因此不可將兩組數字作嚴格比 coverage and therefore are not strictly comparable 較 ° with those for 1991 and onwards.
服務業統計摘要一九九九年 203

圓 9 . 2 律師人數
Chart 9.2 Number of Lawyers
律師人數
5 000 Number of lawyers 4 500 H 4 000 3 500 ^ 3 000 “ 1 2 000
1 500 1 000
JUU “ m- m- " - • - — -0 "1 1 1 1 1 1 1 1 1 1989 1990 1991 1992 1993 1994 1995 1996 1997 1998
律師 - - - 執 業 大 律 師
Solicitors Practising barristers
204 Statistical Digest of the Services Sector 1999
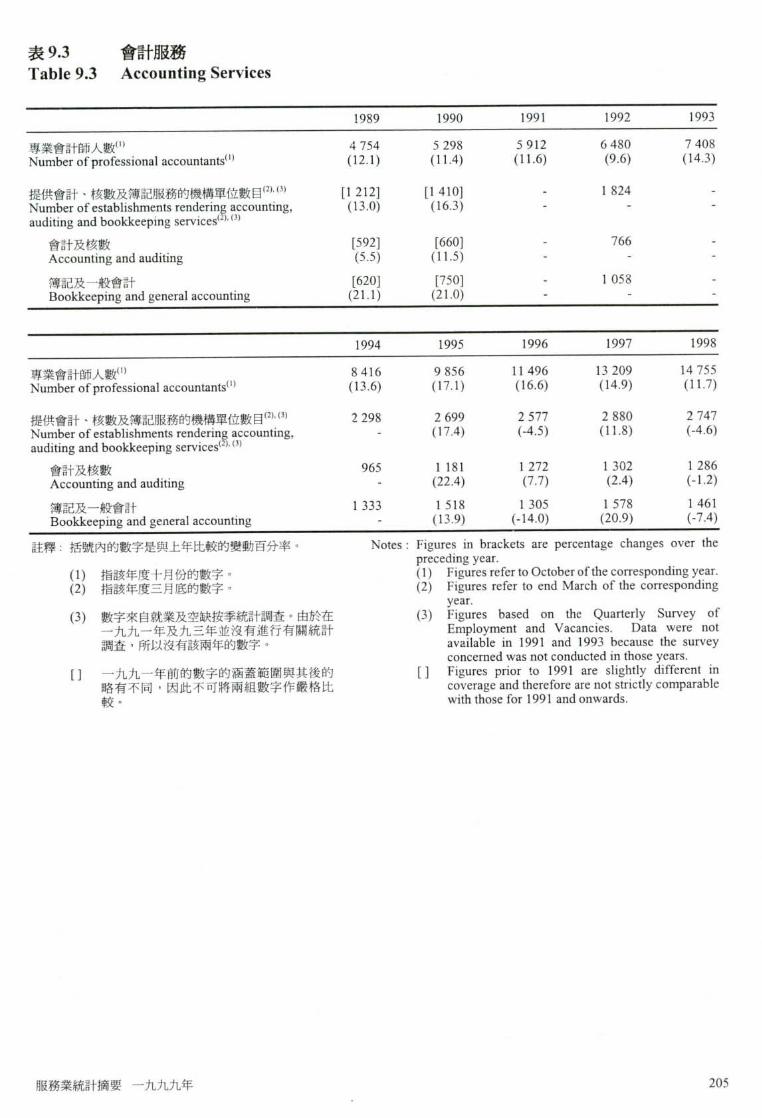
表9.3 會計服務 Table 9.3 Accounting Services
1989 1990 1991 1992 1993 專業會計師人數⑴ 4 7 5 4 5 2 9 8 5 9 1 2 6 4 8 0 7 4 0 8 Number of professional accountants� (12.1) (11.4) (11.6) (9.6) (14.3)
提供會計、核數及簿記服務的機構單位數目 ( 2 ) ’ ( 3 ) [1212] [1410] - 1 824 -Number of establishments rendering accounting, (13.0) (16.3) - - -auditing and bookkeeping s e r v i c e s � ’ �
會計及核數 [ 5 9 2 ] [ 6 6 0 ] - 7 6 6 -Accounting and auditing (5.5) (11.5) - - -簿記及一般會許 [ 6 2 0 ] [ 7 5 0 ] - 1 0 5 8 -Bookkeeping and general accounting (21.1) (21.0) - - "
1994 1995 1996 1997 1998 專業會I十師人數⑴ 8 4 1 6 9 8 5 6 1 1 4 9 6 1 3 2 0 9 1 4 7 5 5 Number of professional accountants'" (13.6) (17.1) (16.6) (14.9) (11.7)
提供會計、核數及簿記服務的機構單位數目®’⑶ 2 298 2 699 2 577 2 880 2 747 Number of establishments rendering accounting, - (17.4) (-4.5) (11.8) (-4.6) auditing and bookkeeping services^’ �
會計及核數 9 6 5 1 1 8 1 1 2 7 2 1 3 0 2 1 2 8 6 Accounting and auditing - (22.4) (7.7) (2.4) (-1_2) 簿記及一般會計 1 3 3 3 1 5 1 8 1 3 0 5 1 5 7 8 1 4 6 1 Bookkeeping and general accounting - (13.9) (-14.0) (20.9) (-7.4)
註釋:括號內的數字是與上年比較的變動百分率� Notes : Figures in brackets are percentage changes over the preceding year.
(1) t旨該年度十月份的數字 ° (1) Figures refer to October of the corresponding year. ( 2 ) 指 該 年 度 三 月 的 數 字 ° (2) Figures refer to end March of the corresponding
year. (3) 數字來自就業及空缺按季統計調査。由於在 (3) Figures based on the Quarterly Survey of
一九九一年及九三年並沒有進行有關統計 Employment and Vacancies. Data were not 調查’所以丨会有該兩年的數字 ° available in 1991 and 1993 because the survey
concerned was not conducted in those years. [ ]一九九一年前的數字的涵蓋範圍與其後的 [ ] F i g u r e s prior to 1991 are slightly different in
略有不同’因此不可將兩組數字作嚴格比 coverage and therefore are not strictly comparable 較� with those for 1991 and onwards.
服務業統計摘要一九九九年 205
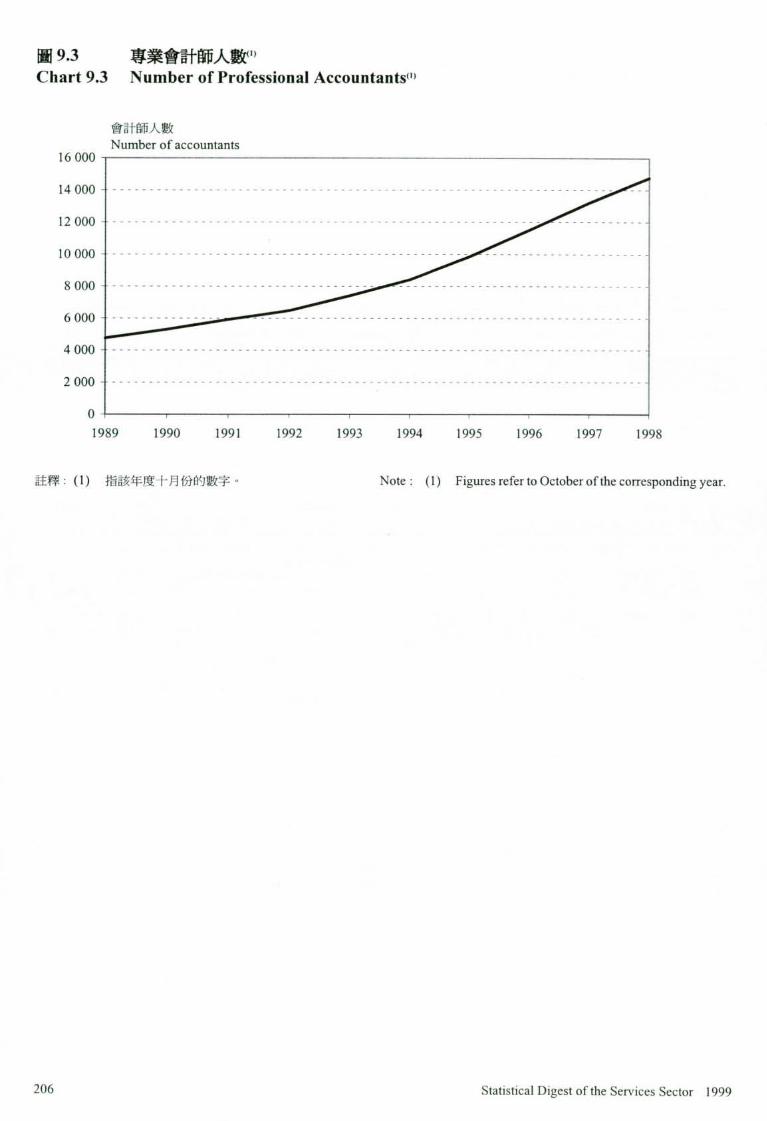
圓 9 . 3 專業會計師人數” Chart 9.3 Number of Professional Accountants'"
會計師人數
Number o f accountants
16 000 "I — — —
14 000
12 ()()() ^ ^ ^
10 000
8 000 ^ —
6 000 . ^ ^ ― 一
4 000
2 000
0 I I I ' ' ' ' I I I i I I I I'‘
1989 1990 1991 1992 1993 1994 1995 1996 1997 1998
註釋:(1)指該年度十月份的數字。 Note: (1) Figures refer to October of the corresponding year.
206 Statistical Digest of the Services Sector 1999

表 9 . 4 建築及工程服務 Table 9.4 Architectural and Engineering Services
1989 1990 1991 1992 1993 註 冊 建 築 師 人 數 ⑴ - - 8 4 7 9 1 5 9 7 8 Number of registered architects�’ (2) - - - (8.0) (6.9)
香 港 工 程 師 學 會 法 定 會 員 人 數 3 7 6 7 3 9 5 9 4 2 4 5 4 8 0 3 5 0 9 3 Number of Corporate Members of the Hong Kong (3.6) (5.1) (7.2) (13.1) (6.0) Institution of Engineers'^' 提供建築、測量及工程服務的機構單位數目 ( 2>’ ( 3 ) [ 1 2 2 8 ] [ 1 3 4 2 ] 1 3 9 6 1 6 6 3 1 7 7 7 Number of establishments rendering (16.1) (9.3) (4.0) (19.1) (6.9) architectural, surveying and engineering services'^' '�
1994 1995 1996 1997 1998 註冊建築師人數⑴’ (2> 1 0 4 4 1 1 4 5 1 3 2 5 1 3 8 4 1 4 2 4 Number of registered architects�’® (6.7) (9.7) (15.7) (4.5) (2.9)
香港工程師學會法定會員人數⑵ 5 5 3 5 6 2 1 3 6 7 9 1 7 5 4 5 8 1 5 5 Number of Corporate Members of the Hong Kong (8.7) (12.2) (9.3) (11.1) (8.1) Institution of Engineers'^' 提供建築、測量及工程服務的機構單位數目( 2 )•� 2 1 8 7 2 3 4 8 2 5 0 1 2 5 9 1 2 3 6 3 Number of establishments rendering (23.1) (7.4) (6.5) (3.6) (-8.8) architectural, surveying and engineering services®.� 註釋:括號內的數字是與上年比較的變動百分率° Notes : Figures in brackets are percentage changes over the
preceding year. ( 1 )建築師註冊條例在一九九零年生效。 (1) The Architects Registration Ordinance came into
effect in 1990. ( 2 )指該年度三月底的數字。 (2) Figures refer to end March of the corresponding year. ( 3 )數字來自就業及空缺按季統計調査。 (3) Figures based on the Quarterly Survey of
Employment and Vacancies. []一九九一年前的數字的涵蓋範圍與其後的 [ ] F i g u r e s prior to 1991 are slightly different in
略有不同’ _此禾亩將兩組數字作嚴格比 coverage and therefore are not strictly comparable 較� with those for 1991 and onwards.
服務業統計摘要一九九九年 2 0 7

圓 9 . 4 註冊建築師人數 Chart 9.4 Number of Registered Archi tec t s� ’�
建築師人數 Number of architects
1 400 一
1 200 1 000 ^ ‘
800
600 400
200
0 "7 1 ! r"" .".._-1 1 [ 1991 1992 1993 1994 1995 1996 1997 1998
註釋:(1)建築師註冊條例在一九九零年生效。 Notes: (1) The Architects Registration Ordinance came into effect in 1990.
( 2 )指該年度三月底的數字。 (2) Figures refer to end March of the corresponding year.
圓 9 . 5 香港工程師學會法定會員人數” Chart 9.5 Number of Corporate Members of the Hong Kong Institution of Engineers'"
工程師人數 Number of engineers
9 000 J - — —— 8 000 7 000 — 6 000
5 000 4 000 - 一 ‘
3 000 2 000 1 000
0 I I I [ i t I I 1989 1990 1991 1992 1993 1994 1995 1996 1997 1998
註釋:( 1 )指該年度三月底的數字� Note : (1) Figures refer to end March of the corresponding year.
208 Statistical Digest of the Services Sector 1999

表 9 . 5 專業服務業的選定最新統計數字 Table 9.5 Selected Up-to-date Statistics on Professional Services
1998 1999 第一季 第二季 第三季 第四季 第一季 Q\ ^ ^ Q4 Q]_
機構單位數目 8 9 5 6 8 7 9 9 9 3 4 3 9 1 3 5 9 5 7 8 Number of establishments 就業人數 7 7 3 1 5 8 0 2 6 3 8 3 6 5 6 7 8 8 8 8 7 3 3 0 6 Number of persons engaged 業務收益指數(1996=100) 103.5 108.1 103.7 97.6* 89.5 Business receipts index (1996=100)
專業會計師人數 1 3 7 7 1 1 4 1 1 6 1 4 4 3 5 1 5 1 9 0 1 5 2 4 7 Number of professional accountants
服務業統計摘要一九九九年 209
資料來源 Data Sources 表 資料來源 Table Sources 9.1 政府,統If•處 9.1 Census and Statistics Department 9.2 香港大律師公會; 9.2 Hong Kong Bar Association ;
司法機構; Judiciary ;
香港律師會; The Law Society of Hong Kong ;
政府統計處 Census and Statistics Department 9.3 香港會計師公會; 9.3 Hong Kong Society of Accountants ;
政府統言十處 Census and Statistics Department 9.4 香港建築師學會; 9.4 The Hong Kong Institute of Architects ;
香港工程師學會; Hong Kong Institution of Engineers ;
政府統計處 Census and Statistics Department
其他有關刊物 Further References 就業及空缺統言f(詳細統計表) Employment and Vacancies Statistics (Detailed Tables) 本地生產總値估言十 Estimates of Gross Domestic Product 香港統計年干!J Hong Kong Annual Digest of Statistics 司法機構,司法機構編製 Hong Kong Judiciary Reports, published by the
Judiciary 香港統計月刊 Hong Kong Monthly Digest of Statistics 司法機構統計數字’司法機構編製 Judiciary Statistics, published by the Judiciary 服務行業按季業務收益指數 Quarterly Business Receipts Indices for Service
Industries 就業、空缺及薪金總額按季統計報告 Quarterly Report of Employment, Vacancies and
Payroll Statistics
本地生產總値估計按季報告 Quarterly Report of Gross Domestic Product Estimates
118 Statistical Digest of the Services Sector 1999

1 f\地產服務業 A “ Real Estate Services 槪要 Highlights 一九九七年’來自地產服務業的增加價値約 Value added generated by the real estate services 爲 1,350 億 元 ’ 佔 該 年 本 地 生 產 總 値 的 industry in 1997 was about $ 135 billion, contributing 1 0 . 9 % � 在九八年從事地產業的機構單位約 to 10.9% of Hong Kong's Gross Domestic Product 12000 間,從業人數約 7 8 0 0 0 人。從事地產 (GDP) in that year. Some 12 000 establishments with 業的包括地產代理商、提供地產發展、租賃 78 000 people were engaged in rendering real estate 及保養管理服務的機構單位 � services in 1998. Establishments engaged in real
estate industry included real estate agencies and those providing real estate development, leasing and maintenance management services.
在住宅單位供應方面,一九九八年有 22 000 On the supply side of domestic units, there were 個新落成的私人住宅單位’較九七年上升 22 000 private domestic units completed in 1998, 2 2 % � 至於公營房屋方面,香港房屋委員會 representing an increase of 22% compared to 1997. In 及香港房屋協會在九八年共興建了 18 000 the public sector, the Hong Kong Housing Authority 個租住單位“此外’它們透過各種房屋計劃 ’ and Hong Kong Housing Society built 18 000 rental 共提供了 16 000 個新出售單位 ° flats in 1998. In addition, they provided 16 000 new
flats for sales under various housing schemes.
私人寫字樓在一九九八年的供應量亦顯著上 Private offices supply also surged considerably by 升 62% 至 737 000 平方米 ° 62% to 737 000 square meters in 1998.
受到亞洲區內金融風暴的衝擊’香港物業市 1998 was a year of correction for the property market 場在一九九八年隨著整體經濟收縮而調整� amidst contraction of the economy as the regional 年內售價及租金均全面下降。成交量亦從九 financial crisis took its toll. Prices and rents fell 七年白勺高水平大ifig回落°物業交易白勺數目禾口 across the board during the year. Market activity also 價値均較九七年顯著下降’交易總數減少 dwindled from the high level in 1997. The number 46% ’ '總f直貝(J減少 61% ° and considerations of property transactions decreased
significantly by 46% in total number of transactions and 61% in total value when compared with 1997.
爲了穩定物業市場,政府於一九九八年五 The Government announced various measures in 月、六月及九月分別公布一系列措施’包括 May, June and September 1998 respectively with a 放寬若干打擊炒樓的限制、暫停公開拍賣或 view to stabilising the property market. These 招標承投土地’以及增加首次置業貸款計劃 included relaxation of certain anti-speculation 禾口自置居戶斤貸款言十畫U名額°隨著區內金融市 measures, suspension of all land sale by public auction 服務業統計摘要 一九九九年 211

場趨向穩定及本地利率多番下調’物業市場 or tender, increasing allocations for the Home Starter 的成交量於九乂\年底從低位反弓單� Loan Scheme and the Home Purchase Loan Scheme.
Upon the stabilisation in the regional financial markets and successive cuts in local interest rates, the property market activity rebounded from the trough towards the end of 1998.
118 Statistical Digest of the Services Sector 1999
主要統計數字 Key Statistics
百萬元(另有註明除外) $ million, unless otherwise specified 地產業 Real Estate Industry
年 機構單位數目(i)’(2> 就業人數(|)’(2> 增加價値 業務收益指數
Year Number of Number of persons Value added Business receipts establishments � ’ � engaged � ’ � index � (1996=100) 1989 [6 314] [38 918] 45,354 -1990 [7 001] [41 047] 54,068 -1991 9 250 51 528 60,181 -1992 10 636 56 488 75,558 -1993 10 968 61 793 91,581 -1994 13 030 67 437 117,698 -1995 12 741 70 523 100,480 -1996 12411 73 985 115,326* 100.0 1997 12 972 81 959 134,995 113.8 1998 11 615 77 748 N.A. 86.4
註釋:(1) 一九九一年及以後的數字是該年內四季的 Notes: (1) Figures for 1991 and onwards are averages of the 估計數字的平均數’而九一年以前的數字是 four quarterly estimates of the year, whereas those ‘旨該年三月去的 1 青況 ° prior to 1991 refer to the position as at end March
of the corresponding year. (2) 數字包括從事物業擁有及轉售的機構單 (2) Figures include establishments engaged in
位� property holding and resale. ( 3 ) 業務收益指數於一九九二統計年度開始編 (3) Business receipts indices were first available in the
製’但此詳細分類的指數則於九六年開始編 reference year 1992,but indices at such detailed 製� breakdown were first compiled in 1996.
[ ]一九九一年前的數字的涵蓋範圍與其後的 [ ] F i g u r e s prior to 1991 are slightly different in 略有不同’因此不可將兩組數字作嚴格比 coverage and therefore are not strictly comparable 較� with those for 1991 and onwards.
服務業統計摘要 一九九九年 213

主要統計數字(縯) Key Statistics (Cont'd.)
百萬元(另有註明除外) $ million, unless otherwise specified
私人住宅單位總存量^ 私人寫字樓總存量 年 物 業 轉 讓 契 約 總 値 ( 單 位 數 目 ) (千平方米) Year Considerations of Stock of private domestic units''' Stock of private of f ices� assignments of properties� (number of units) (thousand sq. m.)
1989 130,018 725 640 4 897 1990 129,947 752 846 5 085 1991 268,087 781 326 5 542 1992 354,289 805 073 6 099 1993 408,493 832 607 6 391 1994 478,887 866 009 6 850 1995 359,131 892 800 7 136 1996 450,518 923 187 7 147 1997 884,158 942 217* 7 889* 1998 372,663 963 256 8 634
註釋:(4) 一九九一年前的統計數字只限於送達市區 Notes : (4) Statistics prior to 1991 cover only land documents 土地註冊處登記的土地文件’由九一年開 received for registration in the Urban Land 始’統計數字亦包括送達八個新界土地註冊 Registry, while those from 1991 onwards cover 處登言己的土地文件 ° also land documents received for registration in
the eight New Territories Land Registries. (5) 總存量已經調整’以配合差餉估價紀錄 ‘ (5) Stock has been adjusted in order to reconcile it
with the rating record.
118 Statistical Digest of the Services Sector 1999

槪念及方法 Concepts and Methods 詞彙釋義 Definition of terms
在編製統計數字時’激產万/^«包括提供地產發 For statistical compilation purpose, the real estate 展、租賃、保養管理、經紀及代理服務的機構單 services industry covers establishments rendering real 位� estate development, leasing, maintenance
management, brokerage and agency services.
樓宇買賣合約是指就將來出售或購買物業所訂 Agreements for sale and purchase refer to agreements 的協議’該物業可以是一幢正在興建的樓宇或已 for future sale or purchase of property which may be a 落成的樓宇 ° building under construction or a completed building.
樓宇歸蒸类矜是指訂明不可分割業權(即樓宇單 Assignmmts of building units refer to documents 位)串專讓的文件 ° which effect the transfer of ownership of property of
undivided shares of a lot, i.e. building units.
凝溝罩位是指在單一擁有權或控制權(即單一公 An establishment is defined as an economic unit (i.e. a 司名義)下’在單一地點從事一種或主要從事一 unit engaged in the production of goods or services) 種經濟活動(即生產貨物或提供服務)的經濟單 which engages, under a single ownership or control 位。 (i.e. under a single company name), in one or
predominantly one kind of economic activity at a single physical location.
商業樓宇包括零售業樓宇及其他設計或改建作 Commercia! premises include retail premises and 商業用途的樓宇’但不包括專作寫字樓用途的樓 other premises designed or adapted for commercial 宇’亦不包括車位� use, with the exception to purpose-built offices. Car
parking space is excluded.
住宅單位是指設有專用廚房和浴室(及/或廁 Domestic units are defined as independent dwellings 所 )的獨立居住單位� with separate cooking facilities and bathroom (and/or
lavatory).
住宅單位的樓厥添濱即該單位的「實用面積」“ Floor area for a domestic unit is its 'saleable area'. 「實用面積J是指單位獨佔的樓面面積,包括露 ‘Saleable area ’ is defined as the floor area exclusively 台及走廊’但不包括樓梯、升降機槽、渠管、大 allocated to the unit including balconies and 堂及公用廁所等公用地方“量度「實用面積」時’ verandahs but excluding common areas such as stairs, 是從圍繞該單位的外牆向外的一面或該單位與 lift shafts, pipe ducts, lobbies and communal toilets. It 田比連單位的共用牆的中間點量起計。窗台、天 is measured from the outside of the exterior enclosing 井、花園、庭院、平台、車位等地方貝丨J不包括在 walls of the unit and the middle of the party walls 內� between two units. Bay windows, yards, gardens,
terraces, flat roofs, carports and the like are excluded from the area.
非住宅樓宇的添覆是指其•內咅臓面面積 A ’ Floor area for non-domestic accommodation is its 量度範圍是有關單位牆壁(或與 f t連單位的共用 ‘internal floor area'. 'Internalfloor area ‘ is defined as 服務業統計摘要 一九九九年 215

}|嗇)圍繞的全音 面積 ° the area of all enclosed space of the unit measured to the internal face of enclosing external and/or party walls.
本地生產總値是指一個國家或地區的所有常住 Gross Domestic Product (GDP) is a measure of the 生產單位,在一個指定的期間內’未扣除固定資 total value of production of all resident producing 本消耗的生產總値 ° units of a country or territory in a specified period,
before deducting allowance for consumption of fixed capital.
地產發展商的生產總額包括物業發展毛利、服 Gross output of the real estate developers comprises 務收費’以及佣金和租金收入等°從事地產租 the margin on property development, service charges, 賃、經紀及管理服務的公司的生產總額’相等於 commissions and rentals received, etc. For firms 其收入’其中包括出租其公司所擁有的物業的租 engaged in real estate leasing, brokerage and 金收入、物業買賣中賺得的佣金’以及地產管理 management services, their gross output corresponds 費及其他月艮務的收益 ° to their receipts which comprise rental received from
leased properties owned by these companies, commissions earned in respect of property transactions, real estate management fees and other service receipts.
,就業乂敦包括積極參與機構單位工作的在職東 Number of persons engaged in an establishment 主及股東;在統計日期受僱於機構單位的全職僱 include working proprietors and partners actively 員’包括長期或臨時聘用的’無論這些僱員正在 engaged in the work of the establishment; full-time 開工或因事假或者病假而暫時缺勤;及在統計日 employees paid by the establishment on the survey 期工作三小時或以上的兼職僱員和無酬家屬幫 reference date, both permanent and temporary, who 工� are either at work or on vacation or sick leave; and
part-time employees and unpaid family workers working three hours or more on the survey reference date.
寫字樓包括商用樓宇內的物業’但不包括綜合 Offices comprise premises situated in buildings 用途樓宇內的非住宅用途單位 ° designed for commercial/business purposes.
Excluded are non-domestic floors in composite buildings.
貨會包括設計或改建作倉庫或冷藏庫的樓宇及 Storage premises comprise premises designed or 其附屬寫字樓’並包括位於貨櫃碼頭區內的樓 adapted for use as godowns or cold stores and include 宇� ancillary offices. Premises located within container
terminals are included.
智力 / 7«是生產總額減去中間投產消耗(生產過 Va/we added is defined as the value of gross output 程中所耗用的貨物和服務的價値 ) ° less the value of intermediate consumption (the value
of goods and services used up in the course of production).
118 Statistical Digest of the Services Sector 1999

統計圓表 Statistical Tables and Charts 表10.1 地產業的機構單位數目、就業人數、業務收益指數、生產總額及增加價値 Table 10.1 Number of Establishments and Persons Engaged, Business Receipts Index, Gross
Output and Value Added of the Real Estate Industry 百萬元(另有註明除外)
$ million, unless otherwise specified 1989 1990 1991 1992 1993
機構單位數目⑴ . � [ 6 3 1 4 ] [ 7 0 0 1 ] 9 2 5 0 1 0 6 3 6 1 0 9 6 8 Number of establishments�.(2> (23.3) (10.9) (32.1) (15.0) (3.1)
就業人數⑴,(2) [38 9 1 8 ] [41 0 4 7 ] 5 1 5 2 8 5 6 4 8 8 6 1 7 9 3 Number of persons engaged � . (2) (15.6) (5.5) (25.5) (9.6) (9.4)
業務收益指數⑶(1996=丨00) - - - - -Business receipts index�(1996 = 100) -
生產總額 54,459 64,521 72,335 89,666 107,646 Gross output (24.0) (18.5) (12.1) (24.0) (20.1)
增加價値 45,354 54,068 60,181 75,558 91,581
Value added (23.2) (19.2) (11.3) (25.6) (21.2) 在以要素成本計算的本地生產總値內所佔比率(%) 9 . 1 9 . 7 9 . 5 1 0 . 3 1 1 . 0 Contribution to GDP at factor cost (%) 增加價値在生產總額所佔比率 8 3 . 3 8 3 . 8 8 3 . 2 8 4 . 3 8 5 . 1 Value added as % of gross output
註釋:括號內的數字是與上年比較的變動百分率° Notes : Figures in brackets are percentage changes over the preceding year.
(1) 一九九一年及以後的數字是該年內四季的 (1) Figures for 1991 and onwards are averages of the 估計數字的平均數’而九一年以前的數字是 four quarterly estimates of the year, whereas those j:旨該年三月盛的情況� prior to 1991 refer to the position as at end March
of the corresponding year. (2) 數字包括從事物業擁有及轉售的機構單 (2) Figures include establishments engaged in
位 ° property holding and resale. ( 3 ) 業務收益指數於一九九二統計年度開始編 (3) Business receipts indices were first available in the
製’但此詳細分類的指數則於九六年開始編 reference year 1992, but indices at such detailed 製� breakdown were first compiled in 1996.
[ ]一九九一年前的數字的涵蓋範圍與其後的 [ ] F i g u r e s prior to 1991 are slightly different in 略有不同’—此不亩將兩組數字作嚴格 t l: coverage and therefore are not strictly comparable 較� with those for 1991 and onwards.
服務業統計摘要 一九九九年 2 1 7

表 1 0 . 1 (糖) 地產業的機_位數目、就業人數、業務收益指數、生產總額及增加價値
Table 10.1 (Cont'd.) Number of Establishments and Persons Engaged, Business Receipts Index, Gross Output and Value Added of the Real Estate Industry
百萬元(另有註明除外) $ million, unless otherwise specified
1994 1995 1996 1997 1998 機構單位數目(”’<2> 13 030 12 741 12411 12 972 11 615
Number of e s t a b l i s h m e n t s � � (18.8) (-2.2) (-2.6) (4.5) (-10.5)
就業人數⑴.(2) 67 437 70 523 73 985 81 959 77 748
Number of persons engaged � ’ (9.1) (4.6) (4.9) (10.8) (-5.1) 業務收益指數⑶(1996=100) - - 100.0 113.8 86.4
Business receipts index�(1996 = 100) - - - (13.8) (-24.1)
生產總額 139,499 122,742 140,167* 165,425 N.A. Gross output (29.6) (-12.0) (14.2) (18.0) N.A.
增加價値 117,698 100,480 115,326* 134,995 N.A. Value added (28.5) (-14.6) (14.8) (17.1) N.A.
在以要素成本計算的本地生產總値內所佔比率(%) 1 2 . 4 9 . 9 1 0 . 2 1 0 . 9 N . A . Contribution to GDP at factor cost (%) 增加價値在生產總額所佔比率 8 4 . 4 8 1 . 9 8 2 . 3 8 1 . 6 N . A . Value added as % of gross output
註釋:括號內的數字是與上年比較的變動百分率 ° Notes : Figures in brackets are percentage changes over the preceding year.
(1) 一九九一年及以後的數字是該年內四季的 (1) Figures for 1991 and onwards are averages of the 估計 i s(字的举均& ’ 而九一年以前W數字是 four quarterly estimates of the year, whereas those 旨該年三月的 ‘ I青況 ° prior to 1991 refer to the position as at end March
of the corresponding year. (2) 數字包括從事物業擁有及轉售的機構單 (2) Figures include establishments engaged in
位� property holding and resale. ( 3 ) 業務收益指數於一九九二統計年度開始編 (3) Business receipts indices were first available in the
製’但此詳細分類的指數則於九六年開始編 reference year 1992, but indices at such detailed 製� breakdown were first compiled in 1996.
218 Statistical Digest of the Services Sector 1999

圓10.1 地產業的機_位數目⑴’<2>及就業人數⑴口 >
Chart 10.1 Number of Establishments'" and Persons Engaged") in the Real Estate Industry
機構單位數目 就業人數
Number of establishments Number of persons engaged 14 000 140 000
^ ^
1 2 0 0 0 i 纖 _ _ 讓 ! 【-,,,•” — 1 2 0 0 0 0
_ 闕 _ 漏 • _ 闘 10000 ^ ^ m m - - - - - m — — m m l o o o o o 闕 • 糕 漏 _ 麗 • 讓
« _ 漏 • 騰 瞧 騰 漏 一 _ 觀 onnno … • … … • … ― — _ — … _ 一 _ 一 _ _ 圓 …
6 000 - - - W ——•——_ _ ——_ 一 60000
» 一 _ _ _ _ _ _ _ 楊 。 - - - _ -- _ - … 画 … _ . … … _ … — _ 4 。 _
騰 議 騰 _ 漏 _ _ _ 2 0 0 0 - - - 謹 — — ^ ^ — — m 騰 - M — — m m 2 0 0 0 0
隱 瞧 _ _ _ _ _ _
0 { ? 燃 H _ , _ M m _ , _ m m _ _ , _ _ , _ _ f ; 燃 H _ , _ ^ ^ _ , _ _ m m _ , _ m m _ o 1991 1992 1993 1994 1995 1996 1997 1998
— 機 構 單 位 數 目 一 — 就 業 人 數
Number of establishments Number of persons engaged
註釋:(1) 數字是該年內四季的估計數字的平均數° Notes : (1) Figures are averages of the four quarterly estimates of the year.
(2) 數字包括從事物業擁有及轉售的機構單 (2) Figures include establishments engaged in 位� property holding and resale.
服務業統計摘要 一九九九年 219

表10.2 政府土地拍賣及批租 Table 10.2 Disposals of Government Land
1989 1990 1991 1992 1993 公開拍賣/投標 Public auction/tender
面積(平方米) 262 763 159 189 270 682 229 166 207 943 Area (sq. m.) (-45.1) (-39.4) (70.0) (-15.3) (-9.3) 地價⑴(百萬元) 12,292 3,264 10,116 9,954 17,234 Premium�($ million) (61.3) (-73.4) (209.9) (-1.6) (73.1)
私人協約方式批地 Private treaty grant 面積(平方米) 855 744 170 464 916 961 236 475 363 474
Area (sq. m.) (163.4) (-80.1) (437.9) (-74.2) (53.7)
甲種/乙種換地權益書投標 Letter A/B tender 面積(平方米) 72 345 37 042 51 595 18 408 85 515
Area (sq. m.) (9.9) (-48.8) (39.3) (-64.3) (364.6) 地價⑴(百萬元) 5 6 0 2 1 7 4 6 2 1 6 8 7 4 0 Premium'" ($ million) (73.3) (-61.3) (112.8) (-63.5) (339.1)
1994 1995 1996 1997 1998 公開拍賣/投標 Public auction/tender
面積(平方米) 168 481 247 389 892 913 302 200 318 199
Area (sq. m.) (-19.0) (46.8) (260.9) (-66.2) (5.3) 地價<”(百萬元) 15,783 18,642 17,775 42,893 15,073 Premium'" ($ million) (-8.4) (18.1) (-4.6) (141.3) (-64.9)
私人協約方式批地 Private treaty grant 面積(平方米) 7 0 0 2 6 7 1 3 5 1 2 8 8 8 6 6 4 7 5 8 1 1 9 2 9 2 8 1 3 8 4 6 2 9 Area (sq. m.) (92.7) (1829.7) (-95.1) (79.5) (16.1)
甲種/乙種換地權益書投標 Letter A/B tender 面積(平方米) 4 1 5 2 0 0 1 0 2 0 0 0 Area (sq. m.) (-51.4) -地價⑴(百萬元) 103 0 4 0 0 P r e m i u m � ( $ million) (-86.0) -
註釋:括號內的數字是與上年比較的變動百分率 ° Notes : Figures in brackets are percentage changes over the preceding year.
(1) 「地價」在上期(服務業統計摘要》內稱爲 (1) "Premium" was referred to as "realized premium" 「已徵收的土地補價� � in the previous issue of Statistical Digest of the
Services Sector.
220 Statistical Digest of the Services Sector 1999

表10.3 按樓宇類別劃分的住宅單位落成量 Table 10.3 Completions of Domestic Units by Type of Premises
單位數目 Number of units
1989 1990 1991 1992 1993 所有住宅單位 89 175 83 915 83 813 64 553 66 057
All domestic units (45.4) (-5.9) (-0.1) (-23.0) (2.3) 公營⑴ Public'"
租住單位(2) 40 368 34 915 34 773 22 307 22 424
Rental flats(2> (92.3) (-13.5) (-0.4) (-35.8) (0.5) 補助出售單位⑶ 11 872 19 600 15 612 15 026 15 960
Subsidized sale flats'^' (120.7) (65.1) (-20.3) (-3.8) (6.2) 市區改善it劃⑷ 4 5 0 0 4 8 9 9 8 0 Urban Improvement Scheme'"' (-7.2) - - (1979.2) -
私人 36 485 29 400 33 380 26 222 27 673
Private (5.8) (-19.4) (13.5) (-21.4)
1994 1995 ^ ^ 1998 所有住宅單位 79 659 51 219 56 631 50 997 56 791
All domestic units (20.6) (-35.7) (10.6) (-9.9) (11.4) 公營 Public"'
租住單位(2) 20 274 24 440 14 828 15 917 18 295
Rental flats(2> (-9.6) (20.5) (-39.3) (7.3) (14.9) 補助出售單位⑶ 25 143 4 004 21 480 16 878 15 318
Subsidized sale flats'^' (57.5) (-84.1) (436.5) (-21.4) (-9.2) 市區改善計劃⑷ 69 154 448 0 900
Urban Improvement S c h e m e � - (123.2) (190.9) - -私人 34 173 22 621 19 875 18 202 22 278
Private (23.5) (-33.8) (-12.1) (-8.4) (22.4) 註釋:括號內的數字是與上年比較的變動百分率° Notes : Figures in brackets are percentage changes over the
preceding year. (1) 指截至該年三月底的十二個月內的總計。 (1) Figures refer to the total in the twelve-month
period ended March of the corresponding year. (2) 包括香港房屋委員會及香港房屋協會提供 (2) Figures refer to public rental flats provided by the
的租住單位,其中由香港房屋委員會提供的 Hong Kong Housing Authority and the Hong 中 i專房 i單位亦&括4內 ° Kong Housing Society, including interim housing
flats of the Hong Kong Housing Authority. (3) 包括香港房屋委員會提供的居者有其屋計 (3) Including subsidized sale flats provided by the
劃、私人機構參建居屋計劃及中等入息家庭 Hong Kong Housing Authority under the Home 房屋計劃’和香港房屋協會提供的住宅發售 Ownership Scheme, Private Sector Participation 言"[•劃及永11�階層住屋言+劃下的補助出售單 Scheme and Middle Income Housing Scheme; and 位� the Hong Kong Housing Society under the Flat-
For-Sale Scheme and Sandwich Class Housing Scheme.
(4) 包括香港房屋協會提供的市區改善計劃單 � Including flats provided by the Hong Kong 位� Housing Society under the Urban Improvement
Scheme.
服務業統計摘要 一九九九年 221

表 1 0 . 4 按類別劃分的私人非住宅樓宇落成量 Table 10.4 Completions of Private Non-domestic Premises by Type
千平方米 Thousand sq. m.
1989 1990 1991 1992 1993 所有私人非住宅樓宇 1 5 8 9 1 2 9 1 1 7 9 2 1 8 0 8 1 1 4 8 All private non-domestic premises (-20.9) (-18.7) (38.8) (0.9) (-36.5)
寫字樓 269 200 459 565 413 Offices (8.9) (-25.6) (129.0) (23.1) (-26.9) 商業樓宇 1 9 7 2 3 9 2 0 5 1 6 5 2 7 3 Commercial premises (-17.3) (21.4) (-14.4) (-19.4) (65.5) 廠房⑴ 1 061 737 590 604 359
Factories � (-14.9) (-30.6) (-19.9) (2.4) (-40.7) 貨倉 61 115 538 474 103 Storage premises (-77.8) (88.2) (368.2) (-11.9) (-78.3)
1994 1995 1996 1997 1998 所有私人非住宅樓宇 1 3 1 2 1 0 6 1 8 8 0 1 1 2 4 1 4 1 7 All private non-domestic premises (14.3) (-19.1) (-17.1) (27.7) (26.1)
寫字樓 502 355 269 456 737 Offices (21.6) (-29.4) (-24.2) (69.5) (61.6) 商業樓宇 2 4 0 2 0 7 1 2 1 2 4 9 2 0 8 Commercial premises (-12.2) (-13.8) (-41.6) (105.8) (-16.5) 廠房(” 368 452 408 329 348 Factories*" (2.5) (22.9) (-9.7) (-19.4) (5.8) 貨倉 203 49 83 90 124 Storage premises (97.0) (-76.1) (70.7) ^ (37.8)
註釋:括號內的數字是與上年比較的變動百分率 ° Notes : Figures in brackets are percentage changes over the preceding year.
(1) 包括分層工廠大廈、工業/寫字樓綜合樓宇 (1) Including flatted factories, industrial/office 及專業廠房� premises and specialized factories.
222 Statistical Digest of the Services Sector 1999

表10.5 住宅單磁存量
Table 10.5 Stock of Domestic Units 單位數目
Number of units 1989 1990 1991 1992 1993
所有住宅單位 1 4 4 3 7 2 0 1 5 2 0 9 7 2 1 5 8 0 4 5 5 1 6 3 5 1 8 6 1 6 6 8 6 8 1 All domestic units (5.1) (5.4) (3.9) (3.5) (2.0)
公營(】> Public � 租住單位(2) 620 733 650 804 666 719 679 647 672 208
Rental flats(2> (4.2) (4.8) (2.4) (1.9) (-1.1) 補助出售單位⑶ 9 4 8 9 9 1 1 4 8 7 4 1 2 9 9 6 2 1 4 7 0 2 0 1 6 0 4 2 0 Subsidized sale flats� (13.7) (21.0) (13.1) (13.1) (9.1) 市區改善計劃⑷ 2 4 4 8 2 4 4 8 2 4 4 8 3 4 4 6 3 4 4 6 Urban Improvement Scheme'^' (22.5) (0.0) (0.0) (40.8) (0.0)
私 人 7 2 5 640 752 846 781 326 805 073 832 607
Private'^' (4.9) ^
1994 1995 1996 1997 1998 所有住宅單位 1 7 3 0 1 5 9 1 7 7 7 1 3 1 1 8 3 0 8 3 0 1 8 6 8 8 4 6 1 9 1 5 5 7 9 All domestic units (3.7) (2.7) (3.0) (2.1) (2.5)
公營⑴ Public � 租住單位⑵ 6 7 9 2 1 9 6 8 9 3 4 4 6 9 3 8 8 4 6 9 9 1 1 9 7 0 4 9 6 3 Rental flats(2> (1.0) (1.5) (0.7) (0.8) (0.8) 補助出售單位⑶ 1 8 1 4 1 6 1 9 1 3 1 8 2 0 9 6 4 2 2 2 3 3 9 3 2 4 2 2 9 0 Subsidized sale flats'^' (13.1) (5.5) (9.6) (6.6) (8.5) 市區改善計劃⑷ 3 5 1 5 3 6 6 9 4 1 1 7 4 1 1 7 5 0 7 0 Urban Improvement Scheme'^' (2.0) (4.4) (12.2) (0.0) (23.1)
私人(5> 866 009 892 800 923 187 942 217* 963 256
Private'^' ^ ^ ^ ^ ^ 註釋:括號內的數字是與上年比較的變動百分率° Notes : Figures in brackets are percentage changes over the
preceding year. (1 )指截至該年三月底的數字。 ’(1) Figures refer to end of March of the corresponding
year. (2) 包括香港房屋委員會及香港房屋協會提供 (2) Figures refer to public rental flats provided by the
的租住單位’其中由香港房屋委員會提供的 Hcmg Kong Housing Authority and the Hong 中 單 位 亦 运 括 在 內 “ Kong Housing Society, including interim housing
flats of the Hong Kong Housing Authority. (3) 包括香港房屋委員會提供的居者有其屋計 (3) Including subsidized sale flats provided by the
劃、私人機構參建居屋計劃及中等入息家庭 Hong Kong Housing Authority under the Home 房屋計劃’和香港房屋協會提供的住宅發售 Ownership Scheme, Private Sector Participation 計劃及夾心階層住屋計劃下的補助出售單 Scheme and Middle Income Housing Scheme; and 位� the Hong Kong Housing Society under the Flat-
For-Sale Scheme and Sandwich Class Housing Scheme.
(4) 包括香港房屋協會提供的市區改善計劃單 (4) Including flats provided by the Hong Kong 位� Housing Society under the Urban Improvement
Scheme. (5) 總存量已經調整’以配合差餉估價紀錄° (5) Stock has been adjusted in order to reconcile it
with the rating record.
服務業統計摘要 一九九九年 223

表10.6 私人非住宅樓宇總存量 Table 10.6 Stock of Private Non-domestic Premises
千平方米 Thousand sq. m.
1989 1990 1991 1992 1993 所有私人非住宅樓宇⑴ 3 3 1 1 0 3 4 3 6 4 3 5 9 2 4 3 7 5 4 1 3 8 0 2 2 All private non-domestic premises'" (4.1) (3.8) (4.5) (4.5) (1.3)
寫字樓 4 897 5 085 5 542 6 099 6 391
Offices (5.1) (3.8) (9.0) (10.1) (4.8) 商業樓宇 7 118 7 400 7 586 7 695 7 859
Commercial premises (2.0) (4.0) (2.5) (1.4) (2.1) 廠 房 1 9 009 19 585 20 039 20 523 20 564
Fac to r i e s� (5.1) (3.0) (2.3) (2.4) (0.2) 貨倉 2 086 2 294 2 756 3 224 3 208
Storage premises (-0.1) (10.0) (20.2) (17.0) (-0.5)
1994 1995 1996 1997 1998 所有私人非住宅樓宇⑴ 38 519 39 130 39 932 40 923* 42 209 All private non-domestic p r e m i s e s � (1.3) (1.6) (2.0) (2.5) (3.1)
寫字樓 6 850 7 136 7 147 7 889* 8 634
Offices (7.2) (4.2) (0.2) (10.4) (9.4) 商業樓宇 7 992 8 219 8 310 8 565* 8 751 Commercial premises (1.7) (2.8) (1.1) (3.1) (2.2) 廠 房 2 0 495 20 605 20 995 21 171* 21 423
Fac to r i e s� (-0.3) (0.5) (1.9) • (0.8) (1.2) 貨倉 3 183 3 170 3 210 3 298* 3 401
Storage premises (-0.8) (-0.4) (1.3) (2.7) ^ i l 註釋:括號內的數字是與上年比較的變動百分率� Notes : Figures in brackets are percentage changes over the
preceding year. (1) 總存量已經調整’以配合差飽估價紀錄。 (1) Stock has been adjusted in order to reconcile it
with the rating record. (2) 包括分層工廠大廈、工業/寫字樓綜合樓宇 (2) Including flatted factories, industrial/office
及專 _廠房 ° premises and specialized factories.
224 Statistical Digest of the Services Sector 1999

表10.7 ㈣土地註冊處登記的文件⑴數目 Table 10.7 Number of Documents ‘ Received for Registration in the Land Registry
1989 1990 1991 ^ 1993 買賣合約數目 6 1 8 9 6 6 9 6 1 9 1 8 0 9 6 4 1 3 9 9 2 7 1 3 6 9 1 5 Number of agreements for sale and purchase (-8.0) (12.5) (159.9) (-22.7) (-2.2)
地 I经 531 364 4 263 4 666 3 855 Land (-32.5) (-31.5) (1071.2) (9.5) (-17.4) 樓宇單位 61 365 69 255 176 701 135 261 133 060
Bmldmg units (-7.7) (12.9) (155.1) (-23.5) (-1.6) 物業轉讓契約數目 8 8 4 3 6 9 1 5 2 9 1 8 9 7 0 1 1 6 8 1 6 9 1 5 9 5 1 8 Number of assignments of properties (-3.3) (3.5) (107.3) (-11.4) (-5.1)
抽 p 760 441 6 704 10 249 8 017 Land (-23.4) (-42.0) (1420.2) (52.9) (-21.8) 樓节單位 87 676 91 088 182 997 157 920 151 501
Building units (-3.1) (3.9) (100.9) (-13.7) (-4.1)
1994 1995 1996 1997 1998 買賣合約數目 118 481 100 171 150715 210 594 113 569 Number of agreements for sale and purchase (-13.5) (-15.5) (50.5) (39.7) (-46.1)
拙段 3 589 2 522 3 292 5 133 2 080
Land (-6.9) (-29.7) (30.5) (55.9) (-59.5) 樓丰單位 114 892 97 649 147 423 205 461 111 489
Building units (-13.7) (-15.0) (51.0) (39.4) (-45.7) 物業轉讓契約數目 1 4 5 3 4 1 1 1 8 6 8 1 1 6 5 7 5 1 2 3 1 8 7 0 1 4 2 3 4 4 Number of assignments of properties (-8.9) (-18.3) (39.7) (39.9) (-38.6)
抽段 7 465 6 469 6 231 10 959 7 350
Land (-6.9) (-13.3) (-3.7) (75.9) (-32.9) 樓丰里位 137 876 112 212 159 520 220 911 134 994
Building units (-9.0) (-18.6) (42.2) (38.5) (-38.9) 註釋:括號內的數字是與上年比較的變動百分率� Notes : Figures in brackets are percentage changes over the
preceding year. (1) 一九九一年前的統計數字只限於送達市區 (1) Statistics prior to 1991 cover only land documents
土地註冊處登記的土地文件’由九一年開 received for registration in the Urban Land 始’統計數字亦包括送達八個新界土地註冊 Registry, while those from 1991 onwards cover 處登言己土;^女件 ° also land documents received for registration in
" the eight New Territories Land Registries.
服務業統計摘要 一九九九年 225

表10.8 ㈣土地註冊處登記的文件 <”涉及的總値 Table 10.8 Considerations of Documents'" Received for Registration in the Land Registry
百萬元 $ million
1989 1990 1991 1992 1993 買賣合約總値 110,009 108,370 318,538 385,384 424,329 Total considerations of agreements for sale and (3.4) (-1.5) (193.9) (21.0) (10.1) purchase
地段 20,309 10,356 33,296 62,884 75,378 Land (-23.2) (-49.0) (221.5) (88.9) (19.9) 樓宇單位 89,700 98,014 285,242 322,501 348,951 Building units (12.1) (9.3) (191.0) (13.1) (8.2)
物業轉讓契約總値 130,018 129,947 268,087 354,289 408,493 Total considerations of assignments of properties (16.6) (-0.1) (106.3) (32.2) (15.3)
地段 31,176 21,420 41,072 58,225 81,791 Land (-3.8) (-31.3) (91.7) (41.8) (40.5) 樓宇單位 98,842 108,527 227,015 296,064 326,702 Building units (25.0) (9.8) (109.2) (30.4) (10.3)
1994 1995 1996 1997 1998 買賣合約總値 505,496 283,226 517,767 937,806 364,612 Total considerations of agreements for sale and (19.1) (-44.0) (82.8) (81.1) (-61.1) purchase
地段 81,548 17,412 43,107 69,787 23,706 Land (8.2) (-78.6) (147.6) (61.9) (-66.0) 樓宇單位 423,948 265,814 474,660 868,019 340,906 Building units (21.5) (-37.3) (78.6) (82.9) (-60.7)
物業轉讓契約總値 478,887 359,131 450,518 884,158 372,663 Total considerations of assignments of properties (17.2) (-25.0) (25.4) (96.3) (-57.9)
地段 80,977 49,656 38,098 93,750 24,311 Land (-1.0) (-38.7) (-23.3) (146.1) (-74.1) 樓宇單位 397,910 309,475 412,420 790,408 348,352 Building units (21.8) (-22.2) (33.3) (91.7) (-55.9)
註釋:括號內的數字是與上年比較的變動百分率� Notes : Figures in brackets are percentage changes over the preceding year.
(1) 一九九一年前的統計數字只限於送達市區 (1) Statistics prior to 1991 cover only land documents 土地註冊處登記的土地文件’由九一年開 received for registration in the Urban Land 始’ @計數字亦包括送達八個新界土地註冊 Registry, while those from 1991 onwards cover 處登•己的土地文件 ° also land documents received for registration in
the eight New Territories Land Registries.
118 Statistical Digest of the Services Sector 1999

圓10.2 物業轉讓契約⑴的數目及涉及的總値 Chart 10.2 Number and Total Considerations of Assignments'" of Properties
契約數目 總値(百萬元)
Number of assignments Total considerations ($ million) 250 000 -r � 1 , 0 0 0 , 0 0 0
_ 200 000 -J 敎 800,000
_ / 讓 \ M / 激 \ : 欲 闹 — _ / 激 \
150 000 M M M 纖 / _ 二--— 600,000
— • … j j j ^ l 1 � 零 一 | _ p z | I J I I I I —
j j i i j j j j j j — . � 1989 1990 1991 1992 1993 1994 1995 1996 1997 1998
E ^ 契約數目 總値 Number of assignments Total considerations
註釋:(1) 一九九一年前的統計數字只限於送達市區 Note: (1) Statistics prior to 1991 cover only land documents 土地註冊處登記的土地文件’由九一年開 received for registration in the Urban Land 始,統計數字亦包括送達八個新界土地註冊 Registry, while those from 1991 onwards cover 處登言己土地女件� also land documents received for registration in
the eight New Territories Land Registries.
服務業統計摘要 一九九九年 2 2 7

表 8 . 9 海上運输業的選定最新統計數字
Table 8.9 Selected Up-to-date Statistics on Maritime Transport Services
1998 1999 第一季 第二季 第三季 第四季 第一季 ^ Q2 Q3 ^ ^
機構單位數目 1 1 7 4 3 1 1 8 2 4 1 1 6 7 6 1 1 2 1 7 1 1 5 5 8 Number of establishments 就業人數 7 6 5 2 6 7 7 8 4 6 7 8 8 2 4 7 7 7 9 5 8 0 3 8 3 Number of persons engaged
業務收益指數(1996= 100) 81.5 87.8 80.9 95.3* 70.8 Business receipts index (1996 = 100)
政府土地拍賣及批租 Disposals of government land 公開拍賣/投標
(” Public auction/tender�
面積(平方米) 1 2 3 2 3 0 8 1 5 2 5 1 1 3 4 4 4 0 0 Area (sq. m.) 地價(百萬元) 4,988 7,574 2,511 0 0 Premium ($ million)
私人協約方式批地 Private treaty grant 面積(平方米) 737 918* 545 461* 4 556* 96 694* 538 021 Area (sq. m.)
註釋:(1) 政府於一九九八年六月公布暫停一公開 Note: (1) In June 1998, the Government announced 賣 &招標承投土地’直金九; ^年三月爲 suspension of all land sales by public auction or
止 ° tender until March 1999.
228 Statistical Digest of the Services Sector 1999

表10.9 (續) 地產服務業的選定最新統計數字 Table 10.9 (Cont'd) Selected Up-to-date Statistics on Real Estate Services
1998 1999 第一季 第二季 第三季 第四季 第一季 ^ ^ Q3 ^ Qj_
買賣合約數目 2 5 8 8 8 3 0 5 0 1 1 8 9 2 2 3 8 2 5 8 2 8 5 4 5 Number of agreements for sale and purchase
地段 658 553 410 459 454
Land 樓宇單位 2 5 2 3 0 2 9 9 4 8 1 8 5 1 2 3 7 7 9 9 2 8 0 9 1 Building units
買賣合約總値(百萬元) 98,058 99,807 59,089 107,658 71,238 Total considerations of agreements for sale and purchase ($ million)
地段 5,063 8,835 7,041 2,767 5,090
Land 樓宇單位 92,995 90,972 52,048 104,891 66,148 Building units
物業轉讓契約數目 28 526 40 785 38 088 34 945 37 433
Number of assignments of properties 地段 2 469 2 102 1 613 1 166 1 250
Land 樓宇單位 2 6 0 5 7 3 8 6 8 3 3 6 4 7 5 3 3 7 7 9 3 6 1 8 3 Building units
物業轉讓契約總値(百萬元) 95,278 111,787 83,732 81,866 93,939 Total considerations of assignments of properties ($ million)
地段 7,486 8,115 3,230 5,480 14,253 Land 樓宇單位 87,792 103,672 80,502 76,386 79,686 Building units
服務業統計摘要 一九九九年 2 2 9

資料來源 Data Sources 表 資料來源 Table Sources 10.1 政府,統言十處 10.1 Census and Statistics Department 10.2 地政總署 10.2 Lands Department 10.3-10.6 香港房屋委員會; 10.3-10.6 Hong Kong Housing Authority;
差倉向物業估價署 Rating and Valuation Department 10.7-10.8 土地註冊處 10.7-10.8 Land Registry
其他有關刊物 Further References 年報’香港房屋協會編製 Annual Report, published by the Hong Kong Housing
Society 年報 ’ 土地發展公司編製 Annual Report, published by the Land Development
Corporation 就業及空缺統胃f(詳細統計表) Employment and Vacancies Statistics (Detailed Tables) 本地生產總値估計 Estimates of Gross Domestic Product 香港統計年干!J Hong Kong Annual Digest of Statistics 香港統言十月干U Hong Kong Monthly Digest of Statistics 香港物業檢討報告’差倉向物業估價署編製 Hong Kong Property Review, published by the Rating
and Valuation Department 香港社會及經濟趨勢 Hong Kong Social and Economic Trends 屋宇署資料月報,屋宇署編製 Monthly Digest - Buildings Department, published by
the Buildings Department 屋宇建築、建造及地產按年統計調査報告 Report on Annual Survey of Building, Construction &
Real Estate Sectors 建造工程完成量按季統計調查 Report on the Quarterly Survey of Construction Output 服務行業按季業務收益指數 Quarterly Business Receipts Indices for Service
Industries 就業、空缺及薪金總額按季統計報告 Quarterly Report of Employment, Vacancies and
Payroll Statistics 本地生產總彳直估計按季報告 Quarterly Report of Gross Domestic Product Estimates 工務專干IJ ’ 政府總部工務局編製 Works Digest, published by the Works Bureau,
Government Secretariat
118 Statistical Digest of the Services Sector 1999

n電訊服務業
Telecommunications Services 槪要 Highlights 香港擁有全球其中一個最完善的電訊基建 ’ Hong Kong has one of the world's most sophisticated 並作爲亞太區的通訊樞紐 °隨著技術不斷改 telecommunications infrastructure and serves as the 進和引入更多競爭’電訊服務業近年發展迅 communications hub for Asia-Pacific region. Along 速� with the continuous development in technology
and introduction of more competition, the telecommunications services industry had undergone rapid expansion in the recent years.
一九九七年’來自電訊業的增加價値約爲 The telecommunications industry generated about 245 億元’較九六年輕微增加 1 % ’ 佔該年本 $24.5 billion value added in 1997,contributing to 2% 地生產總値的2 % »在一九九八年’提供固定 of the Gross Domestic Product (GDP) of Hong Kong 和流動電話服務、無線電傳呼服務、互聯網 in that year and representing a slight growth of 1% 服 務 以 及 其 他 通 訊 服 務 的 機 構 單 位 共 有 over 1996. In 1998, there were 930 establishments 930 間’合共爲 3 6 0 0 0 人提供職位。 rendering fixed and mobile telephone services, radio
paging services, internet services and other communications services, which provided jobs for some 36 000 people.
一九九八年’四間本地固定電話網絡營辦商 In 1998, there were four local fixed telephone network 提供超過 370 萬條電話線,較九七年增加 operators providing services to over 3.7 million 2 % �九八年的人均電話密度爲每百名人口有 telephone lines, 2% more than that in 1997. The 55 條電話線’爲亞洲最高之列 � telephone density in 1998 stood at 55 exchange lines
per 100 population, among the highest in Asia.
除本地電話服務外’用戶可透過本地固網營 Apart from local telephone services, external 辦商及其他網絡營辦商(例如流動電話服務 telephone services are accessible by customers 營辦商),獲提供對外電話服務°在一九九八 through local fixed network operators and other 年 ’ 共 錄 得 17.2 億 分 鐘 由 本 港 撥 出 及 network operators such as mobile phone service 19.6 億分鐘由外地撥入的通訊量 � operators. In 1998,a total of 1 720 million minutes of
outgoing traffic and 1 960 million minutes of incoming traffic were recorded.
近年’逐步開放市場成爲電訊業發展的重要 In recent years, progressive liberalization became an 趨勢。在一九九八年’較爲矚目的是香港國 important trend in the development of the 際電訊提早交回對夕 f服務的專營牌照’這爲 telecommunications industry. In 1998,this trend was 日後引進更多對外服務及設施爲本的競爭作 highlighted by the Hong Kong Telecom International 好準備。同時,隨著凍結增發固定電訊網絡 surrendering its exclusive licence for external services
服務業統 i十摘要一九九九年 127
服務牌照的三年期限於九八年六月屆滿’固 earlier than the scheduled expiry date. This paved the 定電訊服務市場已作好準備再進一步開放。 way for external service- and facilities-based
competition in the coming years. Also with the expiry of the three-year moratorium on the issue of further fixed telecommunications network services licences in June 1998, the market for fixed telecommunications services was poised to open up further.
無線通訊方面’由於、流動電言舌營辦商減價及 On wireless services, mobile telephone business 積極推廣’流動電話業務於一九九八年進一 showed a further sharp expansion in 1998,under the 步顯著增長“截至九八年底’流動電話用戶 price cuts and intensive promotion put up by the 數目較一年前激增 370/0 至 2 8 5 8 0 0 0。每百 operators. At the end of 1998,the number of mobile 名人口中便有 4 2個是流動電話用戶’使香港 phone subscriber surged by 37% over a year earlier to 成爲全球最普遍使用該項服務的地區之一 ° 2 858 000. In every 100 population, there were on
average 42 mobile phone service subscribers, making Hong Kong one of the places with the highest penetration of this service in the world.
流動電話服務的普及化’導致無線電傳呼服 The increasing popularity of mobile telephone 務的市場萎縮。無線電傳呼服務用戶的數目 services had, nevertheless, led to shrinkage in the 自一九九五年開始呈現下降趨勢 °九八年 market of radio paging service. The number of radio 底,共 572 000 個客戶使用由 29 間營辦商提 paging service subscribers had shown a decreasing 供的無線電傳呼服務’與九四年底高峰期的 trend since 1995. At the end of 1998,572 000 1 3 5 6 0 0 0 f固客戶 t匕較’下降達 580/0° cus tomers subscr ibed to r ad io p a g i n g serv ices
provided by 29 operators, a 58% drop from the high level of 1 356 000 at the end of 1994.
邁向資訊紀元’互聯網的使用量於一九九八 Moving towards the information era,the internet 年第四季較九七年同期上升 132%,而全年 usage surged by 132% in the fourth quarter of 1998, 使用量則達 5 4 億分鐘 °截至九八年底’香港 compared to the same period in 1997, and amounted 有 133 間持牌的互聯網服務公司》此外’隨 to 5.4 billion minutes in the year of 1998. As at the 著互動電視服務於九八年正式推出’香港成 end of 1998, Hong Kong had 133 licensed Internet 爲全球最先提供這類電訊服務的地方 � Service Providers (ISP). Besides, following the
official launching of the interactive TV service in 1998, Hong Kong became the first place with such telecommunications services available in the world.
118 Statistical Digest of the Services Sector 1999

主要統計數字 Key Statistics
電訊業 Telecommunications Industry 機構單位數目⑴ 就業人數⑴ 增加價値<
3> 業務收益
年 (通訊業(2)) (通訊業<2>) (百萬元) 指數 Year Number of Number of persons Value added� Business receipts establishments� engaged� ($ million) index� (Communications (Communications (1996=100) industry®) industry ⑵)
1989 [321] [23 410] - -1990 [428] [25 929] - -1991 495 25 877 - -1992 547 29 194 - -1993 561 30 813 - -1994 724 33 662 - -1995 818 35 237 - -1996 922 38 677 24,367 100.0 1997 977 36 621 24,524 119.4 1998 934 36 060 N.A. 115.5
註釋:(1) 一九九一年及以後的數字是該年內四季的 Notes: (1) Figures for 1991 and onwards are averages o f the 估計數字的平均數’而九一年以前的數字是 four quarterly estimates of the year, whereas those 指該年三月底的 1 青況 ° prior to 1991 refer to the position as at end March
of the corresponding year. (2) 通訊業’除包括電訊業外’更包括提供速遞 (2) Communications industry covers, in addition to
和信差服務及其他通訊服務的機構單位° the telecommunications industry therein, establishments rendering courier and messenger services and miscellaneous communications services.
(3) 電訊業的增加價値於一九九六統計年度開 (3) Value added of the telecommunications industry 始編製 ° was first available in the reference year 1996.
( 4 ) 業務收益指數於一九九二統評年度開始編 (4) Business receipts indices were first available in the 製’但此詳細分類的指數則於九六年開始編 reference year 1992, but indices at such detailed 製 ° breakdown were first compiled in 1996.
[ ]一九九一年前的數字的涵蓋範圍與其後的 [ ] F i g u r e s prior to 1991 are slightly different in 略有不同’因此不可將兩組數字作嚴格比 coverage and therefore are not strictly comparable 較� with those for 1991 and onwards.
服務業統計摘要一九九九年 233

主要統計數字(縯) Key Statistics (Cont'd.)
有線服務 無線服務 Wireline Services Wireless Services 公共流動赃
線電話服 i 無線電傳呼服 電 話 線 數 目 對 外 電 話 通 訊 量 互 聯 網 使 用 量 用 戶 數 目 務 用 ; ^ 數 目
年 (千) (百萬分鐘) (千分鐘) (千) (千) Year Number of External telephone Internet usage'®' Number of public Number of radio exchange l i ne s� traffic volume (thousand minutes) mobile radio- paging service (thousands) (million minutes) telephone service subscribers'" subscribers''' (thousands) (thousands)
1989 2 305 1 057 - 89 594 1990 2 447 1 307 - 134 711 1991 2 596 1 609 - 190 881 1992 2 778 2 032 - 233 1 046 1993 2 956 2 519 - 291 1 244 1994 3 114 2 956 - 432 1 356 1995 3 254 3 209 - 688 1 324 1996 3 402 3 582 - 1 211 1 090 1997 3 624 3 859 1 245 962 2 086 933 1998 3 708 3 676 5 359 015 2 858 572
註釋:(5) 包括直通內線式電話線、圖文傳真線及電文 Notes : (5) Including Direct Dialing In lines. Facsimile lines 線路的直撥服務。 and Datel lines.
(6) 數字由電訊管理局自一九九七年八月開始 (6) Figures were first available from the Office of the 提供’不包括透過私人租用線路接駭上網的 Telecommunications Authority in August 1997. 客戶� Not including customer access via leased circuits.
(7) 包括個人通訊服務的用戶。 (7) Including PCS subscribers. (8) 一九九五年前的數字是以另一種方法編 (8) Figures before 1995 were compiled using a
製� different approach.
118 Statistical Digest of the Services Sector 1999

槪念及方法 Concepts and Methods 雹新//g^主要可分爲有線服務及無線服務。提供 Telecommunications services are mainly classified 這兩種服務的供應商必須持有電訊管理局所發 into wireline services and wireless services. Service 白勺牌p裔 ° providers of both classes must be licensed by the
Office of the Telecommunication Authority (OFT A).
有線服務包话(一)本地電話服務,(二)對外 Wireline services cover � local telephone services, 電話服務’(三)互聯網服務’及(四)專用電 (b) external telephone services, (c) internet services, 報及電幸S月艮務� and (d) telex and telegram services.
至於,無線万皮務,主要有兩類業務,分別是公共流 As for wireless services, public mobile radio-動無線電話服務及無線電傳呼服務 ° telephone services and radio paging services are the
two main streams of businesses.
言司彙釋義 Definition of terms
在編製統計數字時’霤•包括提供固定及流動 For statistical compilation purpose, the 電話、電報、無線電傳呼、互聯網及其它電訊服 telecommunications industry covers establishments 務的機構 ° rendering fixed and mobile telephone services,
telegraph services, radio paging services, internet services and miscellaneous telecommunications services.
凝/岸單位是指在單一擁有權或控制權(即單一公 An establishment is defined as an economic unit (i.e. a 司名義)下’在單一地點從事一種或主要從事一 unit engaged in the production of goods or services) 種經濟活動(即生產貨物或提供服務)的經濟單 which engages, under a single ownership or control 位。 (i.e. under a single company name), in one or
predominantly one kind of economic activity at a single physical location.
本地生產總値是指一個國家或地區的所有常住 Gross Domestic Product (GDP) is a measure of the 生產單位’在一個指定的期間內,未扣除固定資 total value of production of all resident producing 本消耗的生產總f直“ units of a country or territory in a specified period,
before deducting allowance for consumption of fixed capital.
生產總額一般以服務收費計算,包括電話服務 Gross output is measured generally by service charges 中出租電話機的收入,無,線傳呼服務中從銷售傳 received, including rentals received for letting 呼機所得的毛利,以及提供服務而收取其他的費 telephone sets in the case of telephone services, 用及佣金 ° margins from sales of radio paging machines in the
case of radio paging services, and other fees and commissions received for services rendered.
服務業統 i十摘要一九九九年 127

個人通訊服務是一種在 1.7/1.8 吉赫頻段操作的 Personal Communications Services (PCS) is a kind of 數碼式流動電話網絡’其特點是成本低而可爲大 digital mobile telephone networks which operates in 量客戶提供月艮務 ° the 1.7/1.8 GHz band, generally characterised by low
cost and the ability to serve a very large number of customers.
就業人數包括積極參與機構單位工作的在職東 P隱ns engaged in an establishment include working 主及股東;在統計日期受僱於機構單位的全職僱 proprietors and partners actively engaged in the work 員’包括長期或臨時聘用的’無論這些僱員正在 of the establishment; full-time employees paid by the 開工或因事假或者病假而暫時缺勤丨及在統計日 establishment on the survey reference date, both 期工作三小時或以上的兼職僱員和無酬家屬幫 permanent and temporary, who are either at work or 工� on vacation or sick leave; and part-time employees
and unpaid family workers working three hours or more on the survey reference date.
么人关流愈奔凝霍蔵万厳是由採用數碼及模擬式 Public Mobile Radio-telephone Services (PMRS) is 系統的蜂嵩式流動電話營辦商所提供的流動電 the most commonly used mobile telephone services 話服務’現時最爲普及°公共流動無線電話服務 provided by licensed cellular phone operators using 在上期《服務業統計摘要》內稱爲「蜂窩式流動 both digital and analogue systems. PMRS was 電言舌月g務」� referred to as "cellular telephone services" in the
previous issue of Statistical Digest of the Services Sector.
公共發射站(第二代無線電話)服務是一種單 Telepoint (CT2) is a kind of one-way call-out mobile 向打出的流動電話服務� telephone services.
/會方/7•是生產總額減去中間投產消耗(生產過 Value added is defined as the value of gross output 程中所耗用的貨物和月昆務的價{直)� less the value of intermediate consumption (the value
of goods and services used up in the course of production).
118 Statistical Digest of the Services Sector 1999

統計圃表 Statistical Tables and Charts 表11.1 電訊業的機構單位數目、就業人數、業務收益指數、生產總額及增加價値 Table 11.1 Number of Establishments and Persons Engaged, Business Receipts Index, Gross
Output and Value Added of the Telecommunications Industry 百萬元(另有註明除外)
$ million, unless otherwise specified 1989 1990 1991 1992 1993
機構單位數目⑴(通訊業⑵) [ 3 2 1 ] [ 4 2 8 ] 4 9 5 5 4 7 5 6 1 Number of establishments*" (40.2) (33.3) (15.7) (10.5) (2.6) (Communications industry®) 就 業 人 數 ⑴ ( 通 訊 業 [ 2 3 4 1 0 ] [ 2 5 9 2 9 ] 2 5 8 7 7 29 1 9 4 3 0 8 1 3 Number of persons engaged*" (11.5) (10.8) (-0.2) (12.8) (5.5) (Communications industry'^') 業務收益指數⑶(1996=100) - - - - -Business receipts index''> (1996=100) -
生 產 總 額 - - - - -Gross o u t p u t � -
增 加 價 値 - - - - -Value added'"' -
在以要素成本計算的本地生產總値內所佔比率(%) - - - - -Contribution to GDP at factor cost (%) 增加價値在生產總額所佔比率 - - - - -Value added as % of gross output
生產總額(通訊業⑵) 14,985 17,972 22,370 26,996 34,766 Gross output (Communications industry''') (18.8) (19.9) (24.5) (20.7) (28.8)
增加價値(通訊業 9,344 11,222 13,990 16,936 19,625 Value added (Communications industry''') (18.1) (20.1) (24.7) (21.1) (15.9)
在以要素成本計算的本地生產總値內所佔比率(%) 1 . 9 2 . 0 2 . 2 2 . 3 2 . 4 Contribution to GDP at factor cost (%) 增加價値在生產總額所佔比率 6 2 . 4 6 2 . 4 6 2 . 5 6 2 . 7 5 6 . 4 Value added as % of gross output
註釋:括號內的數字是與上年比較的變動百分率 ° Notes : Figures in brackets are percentage changes over the preceding year.
(1) 一九九一年及以後的數字是該年內四季的 ’(1) Figures for 1991 and onwards are averages of the 估計數字的平均數’而九一年以前的數字是 four quarterly estimates of the year, whereas those 去旨該年三月情況 � prior to 1991 refer to the position as at end March
of the corresponding year. (2) 通訊業’除包括電訊業外’更包括提供速遞 (2) Communications industry covers, in addition to
和信差服務及其他通訊服務的機構單位� the telecommunications industry therein, establishments rendering courier and messenger services and miscellaneous communications services.
( 3 ) 業務收益指數於一九九二統計年度開始編 (3) Business receipts indices were first available in the 製’但此詳細分類的指數則於九六年開始編 reference year 1992, but indices at such detailed
� breakdown were first compiled in 1996. (4) 電訊業的生產總額及增加價値於一九九六 (4) Gross output and value added of the
統言十年度開始編製� telecommunications industry were first available in the reference year 1996.
[ ]一九九一年前的數字的涵蓋範圍與其後的 [ ] F i g u r e s prior to 1991 are slightly different in 略有不同’白此禾將兩組數字作嚴格比 coverage and therefore are not strictly comparable 較� with those for 1991 and onwards.
服務業統計摘要一九九九年 2 3 7

表 1 1 . 1 (續) 電訊業的機_位數目、就業人數、mmimmwL、生產總額及^t^n價値 Table 11.1 (Cont'd.) Number of Establishments and Persons Engaged, Business Receipts
Index, Gross Output and Value Added of the Telecommunications Industry
百萬元(另有註明除外) $ million, unless otherwise specified
1994 1995 1996 1997 1998 機 構 單 位 數 目 ⑴ ( 通 訊 業 7 2 4 818 922 977 934 Number of es tabl i shments� (29.1) (13.0) (12.7) (6.0) (-4.4) (Communications industry'^') 就業人數⑴(通訊業) 33 662 35 237 38 677 36 621 36 060 Number of persons e n g a g e d � (9.2) (4.7) (9.8) (-5.3) (-1.5) (Communications indus t ry^) 業務收益指數(3) (1996= 100) - - 100.0 119.4 115.5 Business receipts index�(1996=100) - - - (19.4) (-3.3)
生產總額(4) - - 4 6 1 3 2 5 2 7 1 7 N . A . Gross o u t p u t � - - - (14.3) N.A.
增加價値⑷ - - 2 4 3 6 7 2 4 5 2 4 N . A . Value a d d e d � - - - (0.6) N.A.
在以要素成本計算的本地生產總値內所佔比率(%) - - 2 . 2 2 . 0 N . A . Contribution to GDP at factor cost (%) 增加價値在生產總額所佔比率 - - 5 2 . 8 4 6 . 5 N . A . Value added as % of gross output
生產總額(通訊業(2)) 39,515 45,753 55,713 63,417 N.A. Gross output (Communications industry^") (13.7) (15.8) (21.8) (13.8) N.A.
增加價値(通訊業(2)) 22,136 26,438 29,893 30,389 N.A. Value added (Communications industry®) (12.8) (19.4) (13.1) (1.7) N.A.
在以要素成本計算的本地生產總値內所佔比率(%) 2 . 3 2 . 6 2 . 6 2 . 5 N . A . Contribution to GDP at factor cost (%) 增加價値在生產總額所佔比率 5 6 . 0 5 7 . 8 5 3 . 7 4 7 . 9 N . A . Value added as % of gross output
註釋:括號內的數字是與上年比較的變動百分率� Notes : Figures in brackets are percentage changes over the preceding year.
(1) 一九九一年及以後的數字是該年內四季的 (1) Figures for 1991 and onwards are averages of the 估言十數字的举均數’而九一年以前的數字是 four quarterly estimates of the year, whereas those Jfi該年三月底的 1 青況� prior to 1991 refer to the position as at end March
of the corresponding year. (2) 通訊業’除包括電訊業外’更包括提供速遞 (2) Communications industry covers, in addition to
和信差服務及其他通訊服務的機構單位 ° the telecommunications industry therein, establishments rendering courier and messenger services and miscellaneous communications services.
( 3 ) 業務收益指數於一九九二統計年度開始編 (3) Business receipts indices were first available in the 製’但此詳細分類的指數則於九六年開始編 reference year 1992, but indices at such detailed 製� breakdown were first compiled in 1996.
(4) 電訊業的生產總額及增加價値於一九九六 (4) Gross output and value added of the 統計年度開始編製 ° telecommunications industry were first available
in the reference year 1996.
118 Statistical Digest of the Services Sector 1999

圓11.1 通訊業的機_位數目⑶及就業人數 Chart 11.1 Number of Establishments� and Persons Engaged''' in the
Communications Industry'"
機構單位數目 就業人數 Number of establishments Number of persons engaged
1 000 丁 50 000 900 资:※ 錄簽 pjlj兹—— 45 000 800 隱 讓 - 4 0 000
700 35 000 一 纖 纖 鬆 編
600 ;::^ _ * * B B 30000 ::::::::: ::::::::: 效:::: iWt'J 騰: - - I • • • • • • •
ym 麵 霧 纖 纖 纖 騰 纖
… 圓 … - - 圓 - … - 議 _ - - - - - — 1 � _ 100 W — — _ — — _ — — _ _ — — 隱 — — _ — — _ -- 5 000 ol m I m W , m , _ W _ 1 o
1991 1992 1993 1994 1995 1996 1997 1998 機構單位數目 就業人數 Number of establishments Number of persons engaged
註釋:(1) 通訊業’除包括電訊業外’更包括提供速遞 Notes ; (1) Communications industry covers, in addition to 和信差服務及其他通訊服務的機構單位° the telecommunications industry therein,
establishments rendering courier and messenger services and miscellaneous communications services.
(2) 數字是該年內四季的估計數字的平均數。 (2) Figures are averages of the four quarterly estimates of the year.
服務業統計摘要一九九九年 239
表11.2 有線電話服務
Table 11.2 Wireline Telephone Services
1989 1990 1991 1992 1993 電話線數目⑴(千) 2 305 2 447 2 596 2 778 2 956 Number of exchange lines'" (thousands) (7.0) (6.2) (6.1) (7.0) (6.4)
商用電話線(千) 7 5 0 8 2 1 9 0 0 1 0 1 8 1 1 2 1 Business lines (thousands) (12.3) (9.5) (9.6) (13.0) (10.1) 住宅電話線(千) 1 554 1 626 1 696 1 760 1 835 Residential lines (thousands) (4.6) (4.6) (4.3) (3.8) (4.2) 按每百名人口計算的電話線數目 40.2 42.5 44.6 47.2 49.3 Number of exchange lines per 100 population
電話數目(2)(千) 3 105 3 280 3 455 3 649 3 854 Number of telephone sets�(thousands) (7.4) (5.6) (5.4) (5.6) (5.6)
按每百名人口計算的電話數目 54.2 57.0 59.4 62.0 64.3 Number of telephone sets per 100 population
固定電話網絡營辦商數目 1 1 1 1 1 Number of fixed telephone network operators
1994 1995 1996 1997 1998 電話線數目(i>(千) 3 1 1 4 3 2 5 4 3 4 0 2 3 6 2 4 3 7 0 8 Number of exchange lines�(thousands) (5.3) (4.5) (4.5) (6.5) (2.3)
商用電話線(千) 1 206 1 288 1 374 1 526 1 549 Business lines (thousands) (7.6) (6.8) (6.7) (11.1) (1.5) 住宅電話線(千) 1 9 0 8 1 9 6 6 2 0 2 8 2 0 9 8 2 1 5 9 Residential lines (thousands) (4.0) (3.1) (3.1) (3.5) (2.9) 按每百名人口計算的電話線數目 5 0 . 9 5 1 . 9 5 3 . 0 5 4 . 8 5 4 . 5 Number of exchange lines per 100 population
電話數目(2)(千) 4 050 4 234 4 446 4 685 4 763 Number of telephone sets�(thousands) (5.1) (4.5) (5.0) (5.4) (1,7)
按每百名人口計算的電話數目 66.2 67.5 69.2 70.8 70.0 Number of telephone sets per 100 population
固定電話網絡營辦商數目 1 4 4 4 4 Number of fixed telephone network operators 註釋:括號內的數字是與上年比較的變動百分率° Notes : Figures in brackets are percentage changes over the
preceding year. (1) 包括直通內線式電話線、圖文傳真線及電文 � Including Direct Dialing In lines, Facsimile lines
線路的直撥服務� and Datel lines. ( 2 )估計數字� (2) Estimated figures.
240 Statistical Digest of the Services Sector 1999

圓11.2 電話線數目⑴ Chart 11.2 Number of Exchange Lines'"
電話線數目(千) 按每百名人口計算的電話線數目 Number of exchange lines (thousands) Number of exchange lines per 100 population
6 000 T 60 5 000 50
4 000 - — 40
I f I I : • • : J J i i J L L l l l :
1989 1990 1991 1992 1993 1994 1995 1996 1997 1998 H 住 宅 電 話 線 _ 商 用 電 話 線 按每百名人口計算的電話線數目
Residential lines Business lines Number of exchange lines per 100 population
註釋:(1)包括直通內線式電話線、圖文傳真線及電文 Note: (1) Including Direct Dialing In lines, Facsimile lines 線路的直撥服務� and Datel lines.
服務業統計摘要一九九九年 241

表11.3 對外電訊通訊量 Table 11.3 External Telecommunications Traffic
1992 1993 對外電話總通訊量(百萬分鐘) 1 056.7 1 307.4 1 609.0 2 032.2 2 518.9 Total external telephone traffic volume (30.6) (23.7) (23.1) (26.3) (23.9) (million minutes)
撥出總數 546.6 694.5 866.6 1 079.1 1 319.0 Total outgoing (32.8) (27.1) (24.8) (24.5) (22.2)
由接線生接駭的撥出 4 9 . 1 4 7 . 6 5 3 . 9 7 1 . 4 8 6 . 3 Operator assisted outgoing (4.5) (-3.1) (13.2) (32.5) (20.9) 直通國際電話撥出 409.0 534.4 677.5 847.1 1 042.1 IDD outgoing (34.5) (30.7) (26.8) (25.0) (23.0) 圓文傳真及數據撥出 8 8 . 6 1 1 2 . 5 1 3 5 . 3 1 6 0 . 6 1 9 0 . 7 Facsimile and data outgoing (46.0) (27.0) (20.3) (18.7) (18.7)
撥入總數⑴ 510.1 612.9 742.4 953.1 1 199.8 Total i n c o m i n g � (28.2) (20.2) (21.1) (28.4) (25.9)
對外專用電報總通訊量(千分鐘) 6 7 4 3 1 5 7 9 8 2 5 0 9 9 9 4 2 7 6 3 3 8 9 1 4 Total external telex traffic volume'^' (-18.3) (-14.0) (-12.0) (-16.1) (-9.0) (thousand minutes) 對外電報總通訊量(千分鐘) 1 1 5 7 8 0 0 5 9 5 4 5 8 3 3 2 Total external telegram traffic v o l u m e � (-23.9) (-30.9) (-25.6) (-23.0) (-27.5) (thousand minutes) 國 際 電 話 卡 服 務 商 數 目 1 Number of international calling card service -providers'"' 註釋:括號內的數字是與上年比較的變動百分率� Notes : Figures in brackets are percentage changes over the
_ preceding year. ( 1 ) 估計數字 - � Estimated figures. ( 2 )不包括轉發的專用電報� (2) Not including telex refile traffic. (3) 不包括船舶與陸地之間的通訊。 (3) Not including ship/shore traffic. (4)國際電話卡服務於一九九三年推出� (4) International calling card service was launched in
1993.
242 Statistical Digest of the Services Sector 1999

表11.3 (續) 對外電訊通訊量 Table 11.3 (Cont'd.) External Telecommunications Traffic
1994 1995 1996 1997 1998 對外電話總通訊量(百萬分鐘) 2 955.7 3 209.1 3 582.1 3 858.7 3 676.1 Total external telephone traffic volume (17.3) (8.6) (11.6) (7.7) (-4.7) (million minutes)
撥出總數 1 537.7 1 668.3 1 737.5 1 738.2 1 718.5 Total outgoing (16.6) (8.5) (4.1) (#) (-1.1)
由接線生接驳的撥出 87.9 75.4 55.5 41.3 29.8 Operator assisted outgoing (1.9) (-14.2) (-26.4) (-25.6) (-27.8) 直通國際電話撥出 1 230.6 1 362.0 1 477.4 1 526.1 1 475.9 IDD outgoing (18.1) (10.7) (8.5) (3.3) (-3.3) 圖文傳真及數據撥出 219.3 230.9 204.6 170.8 212.8 Facsimile and data outgoing (15.0) (5.3) (-11.4) (-16.5) (24.6)
撥入總數⑴ 1 418.0 1 540.8 1 844.6 2 120.5 1 957.6 Total incoming"' (18.2) (8.7) (19.7) (15.0) (-7.7)
對外專用電報總通訊量(千分鐘) 34 711 32 036 27 289 17 376* 11 877 Total external telex traffic volume''' (-10.8) (-7.7) (-14.8) (-36.3) (-31.6) (thousand minutes) 對外電報總通訊量 <、千分鐘) 2 3 1 1 6 5 1 2 1 8 6 * 5 7 Total external telegram traffic volume'" (-30.4) (-28.6) (-26.7) (-28.9) (-33.7) (thousand minutes) 國際電話卡服務商數目⑷ 7 8 2 0 3 1 4 4 Number of international calling card service (600.0) (14.3) (150.0) (55.0) (41.9) providers'"' 註釋:括號內的數字是與上年比較的變動百分率” Notes : Figures in brackets are percentage changes over the
preceding year. ( 1 ) 估計數字。 (1) Estimated figures. ( 2 )不包括轉發的專用電報 ° (2) Not including telex refile traffic. (3) 不包括船舶與陸地之間的通訊。 (3) Not including ship/shore traffic. ( 4 )國際電話卡服務於一九九三年推出� International calling card service was launched in
1993.
# 表示變動百分率在增減0 . 0 5 %以內� # Denotes change within ± 0,05%.
服務業統計摘要一九九九年 243

表 1 1 . 4 互聯網服務 Table 11.4 Internet Services
1989 1990 1991 1992 1993 持牌互聯網服務供應商數目⑴ - - - -Number of licensed Internet service providers*'' -
互聯網使用量(千分鐘) - - - - -Internet usage*:) (thousand minutes) -
^ ^ 1997 1998 持牌互聯網服務供應商數目⑴ 3 * 5 6 * 9 4 1 2 4 1 3 3 Number of licensed Internet service providers'" (200.0) (1766.7) (67.9) (31.9) (7.3)
互聯網使用量(千分鐘) - - - 1 2 4 5 9 6 2 5 3 5 9 0 1 5 Internet usage® (thousand minutes) - (330.1) 註釋:括號內的數字是與上年比較的變動百分率° Notes : Figures in brackets are percentage changes over the
preceding year. (1) 互聯網服務牌照於一九九三年正式發出。 (1) Internet service licence was formally issued in
1993. (2) 數字由電訊管理局自一九九七年八月開始 (2) Figures were first available from the Office of the
提供’不包括透過私人租用線路接較上網的 Telecommunications Authority in August 1997. 客戶� Not including customer access via leased circuits.
244 Statistical Digest of the Services Sector 1999

表11.5 公共流動無線電話服務 Table 11.5 Public Mobile Radio-telephone Services
1989 1990 1991 1992 1993 公共流動無線電話服務用戶數目千) 89 134 190 233 291 Number of public mobile radio-telephone service (73.9) (50.1) (41.6) (23.0) (24.7) subscribers�(thousands)
按每百名人口計算的公共流動無線電話服務用 1 . 6 2 . 3 3 . 3 4 . 0 4 . 8 戶數目 Number of public mobile radio-telephone service subscribers per 100 population
第二代無線電話用戶數目(2>(千) - - - 37 125 Number of CT2 subscribers''' (thousands) - (233.7)
公共流動無線電話服務營辦商 3 3 3 3 4 Number of PMRS operators
個 人 通 訊 服 務 營 辦 商 - - - - -Number of PCS opera tors�
1994 1995 1996 1997 1998 公共流動無線電話服務用戶數目⑴(千) 432 688 1 211 2 086 2 858 Number of public mobile radio-telephone service (48.5) (59.2) (76.1) (72.3) (37.0) subscribers�(thousands)
按每百名人口計算的公共流動無線電話服務用 7 . 1 1 1 . 0 1 8 . 9 3 1 . 5 4 2 . 0 戶數目 Number of public mobile radio-telephone service subscribers per 100 population
第二代無線電話用戶數目千) 1 7 9 1 0 9 - - -Number of CT2 subscribers�(thousands) (43.0) (-38.8) - - -
公共流動無線電話服務營辦商 4 4 4 4 3 Number of PMRS operators
個 人 通 訊 服 務 營 辦 商 6 6 6 Number of PCS opera tors� 註釋:括號內的數字是與上年比較的變動百分率° Notes : Figures in brackets are percentage changes over the
preceding year. ( 1 )包括個人通訊服務的用戶。 � I n c l u d i n g PCS subscribers. (2 )第二代無線電話服務於一九九二年推出’於 (2) CT2 service was launched in 1992 and ceased in
九六年中終止� mid-19%. (3) 個人通訊服務牌照於一九九六年九月三十 (3) PCS licences were first issued on 30 September
日首次發出。 1996.
服務業統計摘要一九九九年 245

表11.6 傳呼服務
Table 11.6 Paging Services
1989 1990 1991 1992 1993 無線電傳呼服務牌照數目 - - - - -Number of radio paging service licences
無線電傳呼服務頻道數目 - - - - -Number of radio paging service channels
無線電傳呼服務用戶數目(i)(千) 5 9 4 7 1 1 8 8 1 1 0 4 6 1 2 4 4 Number of radio paging service subscribers'" (22.1) (19.7) (23.8) (18.8) (18.9) (thousands)
按每百名人口計算的無線電傳呼服務用戶數目 1 0 . 4 1 2 . 4 1 5 . 1 1 7 . 8 2 0 . 7 Number of radio paging service subscribers per 100 population
1994 1995 1996 1997 1998 無線電傳呼服務牌照數目 - - 3 2 3 0 2 9 Number of radio paging service licences
無線電傳呼服務頻道數目 - - 7 3 8 1 7 9 Number of radio paging service channels
無線電傳呼服務用戶數目⑴(千) 1 3 5 6 1 3 2 4 1 0 9 0 9 3 3 5 7 2 Number of radio paging service subscribers'" (9.0) (-2.4) (-17.7) (-14.4) (-38.7) (thousands)
按毎百名人口計算的無線電傳呼服務用戶數目 2 2 . 2 2 1 . 1 1 7 . 0 1 4 . 1 8 . 4 Number of radio paging service subscribers per 100 population
註釋:括號內的數字是與上年比較的變動百分率° Notes : Figures in brackets are percentage changes over the preceding year.
(1) 一九九五年前的數字是以另一種方法編 (1) Figures before 1995 were compiled using a 製 ° different approach.
246 Statistical Digest of the Services Sector 1999
圓 1 1 . 3 公共流動無線電話及無線電傳呼服務用戶數目
Chart 11.3 Number of Public Mobile Radio-telephone and Radio Paging Services Subscribers
用戶數目(千) Number of subscribers (thousands)
^ ^ ^ ^ ^ ^ ^ — - — .一 •+ .一 . , — — — — — — — — — — ‘ — . — — ~ — - ‘ - - - ~ - — ~ — — — — — — — •“
2 500 / / 2 000 y
1 500 / -
1 000 , - - - ' " - - .
500
0 口 I 1 1 — I 1 1 1 1989 1990 1991 1992 1993 1994 1995 1996 1997 1998
公共流動無線電話服務⑴ •‘ - 無線電傳呼服務
Public mobile radio-telephone s e rv i ce� Radio paging service^)
註釋:(1) 包括個人通訊服務的用戶。 Notes: (1) Including PCS subscribers. (2) 一九九五年前的數字是以另一種方法編 (2) Figures before 1995 were compiled using a
製� different approach.
服務業統計摘要一九九九年 243

表12.5 批發及零售業的選定最新統計數字 Table 12.5 Selected Up-to-date Statistics on Wholesale and Retail Services
1998 1999 第一季 第二季 第三季 第四季 第一季 ^ ^ ^ Q4 ^
機構單位數目(通訊業) 947 935 949 903 997 Number of establishments (Communications industry) 就業人數(通訊業) 36 806 40 742 34 165 32 525 35 491 Number of persons engaged (Communications industry) 業務收益指數(1996=100) 119.1 114.0 116.7 112.3 92.6 Business receipts index (1996=100)
電話線數目(千) 3 6 4 7 3 6 6 6 3 6 8 2 3 7 0 8 3 7 2 9 Number of exchange lines (thousands)
商用電話線 1 535 1 540 1 539 1 549 1 561 Business lines 住宅電話線 2 112 2 126 2 144 2 159 2 168 Residential lines
電話數目(千) 4 7 1 0 4 7 2 9 4 7 4 1 4 7 6 3 4 7 8 3 Number of telephone sets (thousands) 公共流動無線電話服務用戶數目(千) 2 2 3 0 2 4 1 1 2 5 8 4 2 8 5 8 3 1 7 4 Number of public mobile radio-telephone service subscribers (thousands) 無線電傳呼服務用戶數目(千) 8 4 4 7 7 0 6 6 2 5 7 2 4 8 2 Number of radio paging service subscribers (thousands) 互聯網使用量(千分鐘) 941 464 1 153 132 1 425 842 1 838 577 2 117 102 Internet usage (thousand minutes)
248 Statistical Digest of the Services Sector 1999

資料來源 Data Sources 表 資料來源 Table Sources 11.1 政府統計處 11.1 Census and Statistics Department 11.2- 11.6 電訊管理局 11.2 - 11.6 Office of the Telecommunications
Authority
其他有關刊物 Further References 就業及空缺統_羊細統計表) Employment and Vacancies Statistics (Detailed Tables) 本地生產總値估計 Estimates of Gross Domestic Product 香港統計年干丨J Hong Kong Annual Digest of Statistics 香港統計月刊 Hong Kong Monthly Digest of Statistics 就業、空缺及薪金總額按季統計報告 Quarterly Report of Employment, Vacancies and
Payroll Statistics 本地生產總値估計按季報告 Quarterly Report of Gross Domestic Product Estimates 倉庫、通訊、財務、保險及商用服務按年統計 Report on Annual Survey of Storage, Communication, 調查報告 Financing, Insurance & Business Services 服務行業按季業務收益指數 Report on Quarterly Business Receipts Indices for
Service Industries 電訊管理局營運基金報告書’電訊管理局編製 Office of the Telecommunications Authority Trading
Fund Report, published by the Office of the Telecommunications Authority
服務業統計摘要一九九九年 243

1,批發及零售業 X ^ Wholesale and Retail Services 槪要 Highlights 就機構單位數目及僱用人數而言’批發及零 The wholesale and retail industry is one of the biggest 售業是香港最大的月艮務行業之一。一九九八 service industries in terms of number of 年’從事主要批發及零售業務(不包括零售攤 establishments and employment. In 1998,there were 檔及小販)的機構約 66 600 間,就業人數約 about 66 600 business undertakings in the main 270 000 名。 wholesale and retail services (not include retail
pitches and hawkers), employing some 270 000 people.
一九九七年’來自批發及零售業的增加價値 The wholesale and retail industry generated about 約 526 億元’佔本地生產總値的 4.3% ° $52.6 billion value added in 1997, or 4.3% of Hong
Kong's Gross Domestic Product (GDP).
在年內疲弱的本地消費意欲影響下’零售業 Affected by the weak local spending sentiment, retail 在一九九八年大幅放緩。消費意欲因資產價 business in 1998 greatly slackened. The sentiment 格大跌’就業前景不明朗和利率高企等因素 was much dampened by factors like the sharp fall in 而大幅下降 °加上來港遊客減少’零售業銷 asset prices, increased job uncertainty and high 貨額以價f直及數量計均較九七年減少17% ” interest rate. Coupled with the setback in inbound
tourism, retail sales was 17% less than 1997, in both value and volume terms.
各類貨品中’耐用品和食品以外的非耐用品 Among various types of commodities, sales of durable 的銷售皆錄得雙位數字的跌幅,其中以汽 goods and non-durable goods other than food all 車、衣物及鞋類和百貨公司的銷售下降更爲 registered double-digit declines. Downturns in sales 明顯,顯示消費者在購買非必需品時一般較 of motor vehicles, clothing and footwear, and 受經濟情況的變動影響 ° department stores were more significant, as consumer
spending on non-necessities was generally more sensitive to changes in economic climate.
與批發業合倂計算’ 一九九八年批發及零售 Together with wholesale industry, total receipts of the 業的總收益較九七年下降 16% ° wholesale and retail industry in 1998 was 16% lower
than in 1997.
服務業統計摘要一九九九年 243

主要統計數字 Key Statistics
百萬元(另有註明除外) $ million, unless otherwise specified
批發及零售業 Wholesale and Retail Industry 機構單位數目 就業人數 就業人數
(不包括零售攤檔 (不包括零售攤檔 (包括零售攤檔
'(街市攤檔除外) (街市攤檔除外) (街市攤檔除外) 業務收益
年 及小販)⑴ 及 小 販 及 小 販 产 ’ 增加價値 指數 Year Number of Number of Number of Value added Business establishments persons engaged persons engaged receipts (not including retail (not including retail (including retail index� pitches (other than pitches (other than pitches (other than (1996=100) market stalls) and market stalls) and market stalls) and hawkers)'" hawkers)� hawkers)(2)’ � 1989 [64 061] [249 324] 259 200 27,141 -1990 [67 610] [264 703] 268 100 29,614 -1991 70 219 277 872 282 200 34,097 -1992 70 900 280 382 284 100 38,615 74.1 1993 69 231 278 010 282 000 42,803 82.0 1994 70 169 284 770 286 600 47,800 92.2 1995 69 000 276 375 280 200 46,982 96.1 1996 70 329 285 823 294 300 52,268 100.0 1997 69 414 289 183 303 000 52,641 102.6 1998 66 583 269 852 291 200 N.A. 86.0
註釋:(1) 一九九一年及以後的數字是該年內四季的 Notes: (1) Figures for 1991 and onwards are averages of the 估言十^^字的举均叙’而九一年以前的數字是 four quarterly estimates of the year, whereas those _旨該 ^ ^六月分 i f 況 � prior to 1991 refer to the position as at end June of
the corresponding year. (2) 數字是該年內四季的估計數字的平均數。 (2) Figures are averages of the four quarterly
estimates of the year. (3) 爲包括零售攤檔(街市攤檔除外)及小販而編 (3) Specially estimated to take into account retail
製的特別估言十數字 ° pitches (other than market stalls) and hawkers. ( 4 ) 業務收益指數於一九九二統計年度開始編 (4) Business receipts indices were first available in the
製 ° reference year 1992. [ ]一九九一年前的數字的涵蓋範圍與其後的 [ ] F i g u r e s prior to 1991 are slightly different in
略有不同’因此不可將兩組數字作嚴格比 coverage and therefore are not strictly comparable 較� with those for 1991 and onwards.
252 Statistical Digest of the Services Sector 1999

主要統計數字(績) Key Statistics (Cont'd.)
百萬元(另有註明除外) $ million, unless otherwise specified
零售業銷貨額 Retail Sales 價値指數 數量指數
年 總銷貨額 (九四年十月至九五年九月=100) (九四年十月至九五年九月=100)
Year Total sales Value index Volume index (Oct 94-Sep 95=100) (Oct 94-Sep 95=100)
1989 107,524 51.6 71.8
1990 115,365 55.4 72.2
1991 135,388 65.0 79.7
1992 159,498 76.5 89.3
1993 179,783 86.3 95.5
1994 201,150 96.5 101.1
1995 210,560 101.1 99.7
1996 223,920 107.5 101.3
1997 234,857 112.7 102.4
1998 195,675 93.9 85.3
服務業統計摘要一九九九年 2 4 3

槪念及方法 Concepts and Methods 言司業釋義 Definitions of terms
潘/辜罩位是指在單一擁有權或控制權(即單一公 An establishment is defined as an economic unit (i.e. a 司名義)下’在單一地點從事一種或主要從事一 unit engaged in the production of goods or services) 種經濟活動(即生產貨物或提供服務)的經濟單 which engages, under a single ownership or control 位� (i.e. under a single company name), in one or
predominantly one kind of economic activity at a single physical location.
本地生產總値是指一個國家或地區的所有常住 Gross Domestic Product (GDP) is a measure of the 生產單位’在一個指定的期間內’未扣除固定資 total value of production of all resident producing 本消耒毛的生產總値 ° units of a country or territory in a specified period,
before deducting allowance for consumption of fixed capital.
圣產 I額包括從銷售貨物所賺得的毛利、租金收 Gross output consists of margin on sales of goods, 入、佣金、各類收費及其他服務收費。銷售中所 rentals, commissions, fees and other service charges. 賺得的毛利是相等於貨物的售價和已扣除物價 The margin on sales is equal to the sales value less the 升f直的貨物成本之間的差額 ° cost of goods sold which is adjusted for price
appreciation.
就業人數包括積極參與機構單位工作的在職東 Persons engaged in an establishment include working 主及股東;在統計日期受僱於機構單位的全職僱 proprietors and partners actively engaged in the work 員’包括長期或臨時聘用的,無論這些僱員正在 of the establishment; full-time employees paid by the 開工或因事假或者病假而暫時缺勤;及在統計日 establishment on the survey reference date, both 期工作三小時或以上的兼職僱員和無酬家屬幫 permanent and temporary, who are either at work or 工� on vacation or sick leave; and part-time employees
and unpaid family workers working three hours or more on the survey reference date.
智力是生產總額減去中間投產消耗(生產過 Value added is defined as the value of gross output 程中所耗用的貨物和月艮務的價値 )° less the value of intermediate consumption (the value
of goods and services used up in the course of production).
零售價値指數是就整個零售行業及各主要零售 The value index of retail sales, which is compiled for 商類別而編製,以量度零售商的收益在價値方面 the entire retail industry as well as for each major type 白勺變動 ° of retail outlets, measures the change in receipts of
retail outlets in value terms.
零售量指數則是以價値指數再用一個特別編製 The volume index of retail sales, which is obtained by 的平減指數調整後得出,以量度零售商收益的實 deflating the value index by a specially constructed 質變動。數量指數亦即反映扣除貨品的物價變動 index, measures the change in receipts of retail outlets 後的零售價f直變動 ° in real terms. That is, the volume index reflects
changes in retail sales value with the effect of price movements of commodities sold discounted.
242 Statistical Digest of the Services Sector 1999

統計画表 Statistical Tables and Charts 表12.1 批發及零售業的機構單位數目、就業人數、業務收益指數、生產總額、增加價値及零
售 業 總 _ 額
Table 12.1 Number of Establishments and Persons Engaged, Business Receipts Index, Gross Output, Value Added and Total Retail Sales of the Wholesale and Retail Industry
百萬元(另有註明除外) $ million, unless otherwise specified
1989 1990 1991 1992 1993 機構單位數目(不包括零售攤檔(街市攤檔除外)及 小販)0> [64 061] [67 610] 70 219 70 9 0 0 69 231 Number of establishments (not including retail (0.1) (5.5) (3.9) (1.0) (-2.4) pitches (other than market stalls) and h a w k e r s ) � 就業人數(不包括零售攤檔(街市攤檔除外)及小 販)� [249 324] [264 703] 277 872 280 382 278 010 Number of persons engaged (not including retail (1.5) (6.2) (5.0) (0.9) (-0.8) pitches (other than market stalls) and h a w k e r s ) � 就業人數(包括零售攤檔(街市攤檔除外)及小 販)(2).(3> 259 200 268 100 282 200 284 100 282 000 Number of persons engaged (including retail (#) (3.4) (5.3) (0.7) (-0.7) pitches (other than market stalls) and hawkers)®’ � 業務收益指數(4>( 1996 =100) - - - 7 4 . 1 8 2 . 0 Business receipts index'"' (1996=100) - (10.7)
生產總額 51,820 59,463 69,837 74,369 84,988 Gross output (16.7) (14.7) (17.4) (6.5) (14.3) 增加價値 27,141 29,614 34,097 38,615 42,803 Value added (11.9) (9.1) (15.1) (13.3) (10.8)
在以要素成本計算的本地生產總値內所佔比率(%) 5 . 4 5 . 3 5 . 4 5 . 3 5 . 2 Contribution to GDP at factor cost (%) 增加價値在生產總額所佔比率 5 2 . 4 4 9 . 8 4 8 . 8 5 1 . 9 5 0 . 4 Value added as % of gross output
零售業總銷貨額 107,524 115,365 135,388 159,498 179,783 Total retail sales (7.3) (17.4) (17.8) (12.7) 註釋:括號內的數字是與上年比較的變動百分率� Notes : Figures in brackets are percentage changes over the
preceding year. (1) 一九九一年及以後的數字是該年內四季的 h ) Figures for 1991 and onwards are averages of the
估計數字的平均數’而九一年以前的數字是 four quarterly estimates of the year, whereas those j旨該年六月白如青況� prior to 1991 refer to the position as at end June of
the corresponding year. (2) 數字是該年內四季的估計數字的平均數。 (2) Figures are averages of the four quarterly
estimates of the year. (3) 爲包括零售攤檔(街市攤檔除外)及小販而編 (3) Specially estimated to take into account retail
製的特SU估言十數字 ° pitches (other than market stalls) and hawkers. ( 4 )業務收益指數於一九九二統計年度開始編 (4) Business receipts indices were first available in the
製� reference year 1992. []一九九一年前的數字的涵蓋範圍與其後的 [ ] F i g u r e s prior to 1991 are slightly different in
略有不同’因此不%將兩'組數字作嚴格比 coverage and therefore are not strictly comparable 較 ° with those for 1991 and onwards.
# 表示變動百分率在增減0.05%以內° # Denotes change within ± 0.05%.
服務業統計摘要一九九九年 243

表12.1 (縯) 批發及零售業的機構單位數目、就業人數、業務收益指數、生產總額、增
加價値及零售業總纖額 Table 12.1 (Cont'd.) Number of Establishments and Persons Engaged, Business Receipts
Index, Gross Output, Value Added and Total Retail Sales of the Wholesale and Retail Industry
百萬元(另有註明除外) $ million, unless otherwise specified
1994 1995 1996 1997 1998 機構單位數目(不包括零售攤檔(街市攤檔除外)及 小 販 7 0 169 69 000 70 329 69 414 66 583 Number of establishments (not including retail (1.4) (-1.7) (1.9) (-1.3) (-4.1) pitches (other than market stalls) and hawkers )� 就業人數(不包括零售攤檔(街市攤檔除外)及小 販)(1) 284 770 276 375 285 823 289 183 269 852
Number of persons engaged (not including retail (2.4) (-2.9) (3.4) (1.2) (-6.7) pitches (other than market stalls) and hawkers)。)
就業人數(包括零售攤檔(街市攤檔除外)及小 販)(2>’(3> 286 6 0 0 2 8 0 2 0 0 2 9 4 3 0 0 3 0 3 0 0 0 2 9 1 2 0 0 Number of persons engaged (including retail (1.6) (-2.2) (5.0) (3.0) (-3.9) pitches (other than market stalls) and h a w k e r s ) � . � 業務收益指數(4) (1996= 100) 92.2 96.1 100.0 102.6 86.0 Business receipts index(4> (1996=100) (12.4) (4.2) (4.0) (2.6) (-16.2) 生產總額 96,026 97,958 106,982 112,373 N.A. Gross output (13.0) (2.0) (9.2) (5.0) N.A.
增加價値 47,800 46,982 52,268 52,641 N.A. Value added (11.7) (-1.7) (11.3) (0.7) N.A.
.在以要素成本計算的本地生產總値內所佔比率(%) 5 . 0 4 . 6 4 . 6 4 . 3 N . A . Contribution to GDP at factor cost (%) 增加價値在生產總額所佔比率 4 9 . 8 4 8 . 0 4 8 . 9 4 6 . 8 N . A . Value added as % of gross output
零售業總銷貨額 201,150 210,560 223,920 234,857 195,675 Total retail sales ^ ^ (4.9) (-16.7) 註釋:括號內的數字是與上年比較的變動百分率° Notes : Figures in brackets are percentage changes over the
preceding year. (1) 一九九一年及以後的數字是該年內四季的 � Figures for 1991 and onwards are averages of the
估計數字的平均數’而九一年以前的數字是 four quarterly estimates of the year, whereas those 指該年六月•的情況� prior to 1991 refer to the position as at end June of
the corresponding year. (2) 數字是該年內四季的估計數字的平均數- (2) Figures are averages of the four quarterly
estimates of the year. (3) 爲包括零售攤檔(街市攤檔除外)及小販而編 (3) Specially estimated to take into account retail
製的特別估言十數字� pitches (other than market stalls) and hawkers. ( 4 )業務收益指數於一九九二統計年度開始編 (4) Business receipts indices were first available in the
製� reference year 1992.
242 Statistical Digest of the Services Sector 1999

圓12.1 批發及零售業的機構單位數目(”.<2>及就業人數(糊 Chart 12.1 Number of Es tab l i shments�� and Persons E n g a g e d � � in the Wholesale and
Retail Industry
機構單位數目 就業人數
80 000 Number of establishments—— —— ^ ^ ^ ^ ^ ^
— n i l I I — _ … I I I I I I … - _ — . 0 0 0 0 - - i - - l .. • ... I 圓 _ 穩
丄 I J J J J J J J — � 1991 1992 1993 1994 1995 1996 1997 1998
^ 機 構 單 位 數 目 就業人數 Number of establishments Number of persons engaged 註釋:(1) 數字是該年內四季的估許數字的平均數。 Notes: (1) Figures are averages of the four quarterly
estimates of the year. ( 2 )不包括零售攤檔(街市攤檔除外)及小販� � N o t including retail pitches (other than market
stalls) and hawkers.
服務業統計摘要一九九九年 257
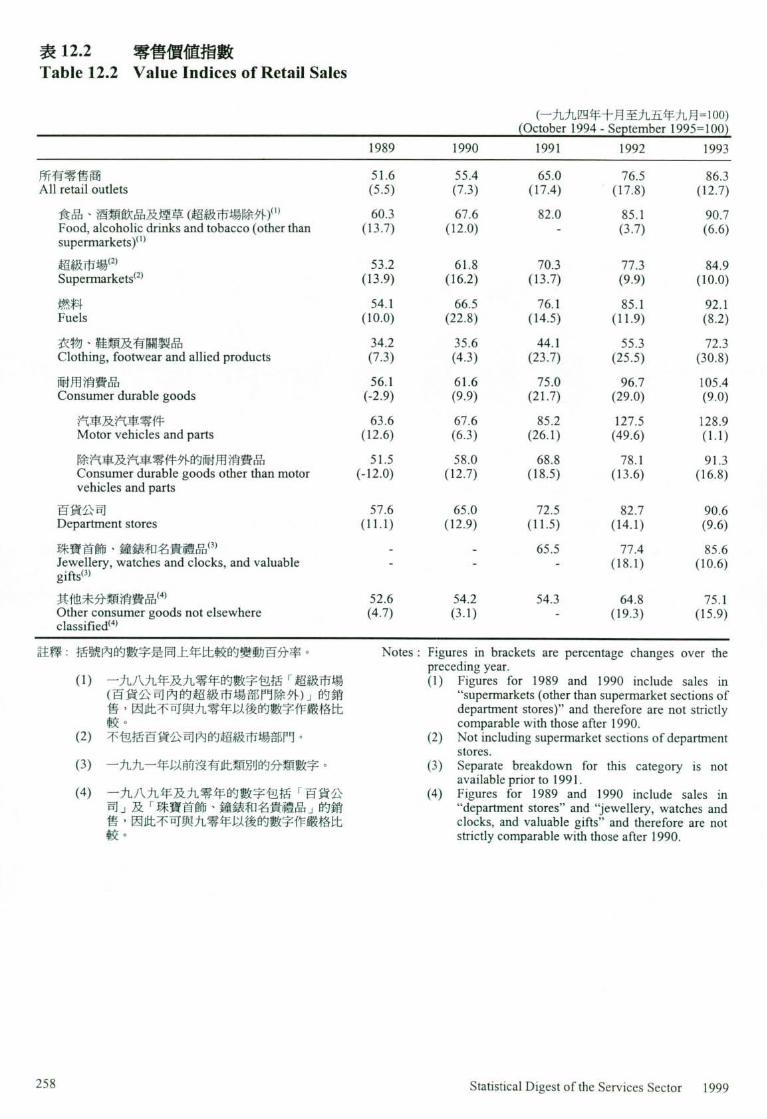
表12.2 零售價値指數
Table 12.2 Value Indices of Retail Sales (一九九四年十月至九五年九月=100)
(October 1994 - September 1995=100) 1989 1990 1991 1992 1993
所有零售商 5 1 . 6 5 5 . 4 6 5 . 0 7 6 . 5 8 6 . 3 All retail outlets (5.5) (7.3) (17.4) (17.8) (12.7)
食品、酒類飮品及煙草(超級市場除外)(i) 6 0 . 3 6 7 . 6 8 2 . 0 8 5 . 1 9 0 . 7 Food, alcoholic drinks and tobacco (other than (13.7) (12.0) - (3.7) (6.6) supermarkets)� 超級市場⑵ 5 3 . 2 6 1 . 8 7 0 . 3 7 7 . 3 8 4 . 9 Supermarkets''' (13.9) (16.2) (13.7) (9.9) (10.0) 燃料 54.1 66.5 76.1 85.1 92.1 Fuels (10.0) (22.8) (14.5) (11.9) (8.2) 衣物、鞋類及有關製品 3 4 . 2 3 5 . 6 4 4 . 1 5 5 . 3 7 2 . 3 Clothing, footwear and allied products (7.3) (4.3) (23.7) (25.5) (30.8) 耐用消費品 5 6 . 1 6 1 . 6 7 5 . 0 9 6 . 7 1 0 5 . 4 Consumer durable goods (-2.9) (9.9) (21.7) (29.0) (9.0)
汽車及汽車零件 6 3 . 6 6 7 . 6 8 5 . 2 1 2 7 . 5 1 2 8 . 9 Motor vehicles and parts (12.6) (6.3) (26.1) (49.6) (1.1) 除汽車及汽車零件外的耐用消費品 5 1 . 5 5 8 . 0 6 8 . 8 7 8 . 1 9 1 . 3 Consumer durable goods other than motor (-12.0) (12.7) (18.5) (13.6) (16.8) vehicles and parts
百貨公司 5 7 . 6 6 5 . 0 7 2 . 5 8 2 . 7 9 0 . 6 Department stores (11.1) (12.9) (11.5) (14.1) (9.6) 珠寶首飾、鐘錶和名貴禮品(3) - - 6 5 . 5 7 7 . 4 8 5 . 6 Jewellery, watches and clocks, and valuable - - - (18.1) (10.6) gifts*'' 其 他 未 分 類 消 費 品 5 2 . 6 5 4 . 2 5 4 . 3 6 4 . 8 7 5 . 1 Other consumer goods not elsewhere (4.7) (3.1) - (19.3) (15.9) classified'"'
註釋:括號內的數字是同上年比較的變動百分率� Notes : Figures in brackets are percentage changes over the preceding year.
(1) 一九八九年及九零年的數字包括「超級市場 (1) Figures for 1989 and 1990 include sales in (百貨公司內的超級市場部門除外)」的銷 "supermarkets (other than supermarket sections of 售’因此不可與九零年以後的數字作嚴格比 department stores)" and therefore are not strictly 較 ° comparable with those after 1990.
( 2 )不包括百貨公司內的超級市場部門。 (2) Not including supermarket sections of department stores.
(3) 一九九一年以前沒有此類別的分類數字。 (3) Separate breakdown for this category is not available prior to 1991.
(4) 一九八九年及九零年的數字包括「百貨公 (4) Figures for 1989 and 1990 include sales in 司」及「珠寶首飾、鐘錶和名貴禮品」的銷 “department stores" and "jewellery, watches and 售’因此不可與九零年以後的數字作嚴格比 clocks,and valuable gifts" and therefore are not 較 ° strictly comparable with those after 1990.
258 Statistical Digest of the Services Sector 1999
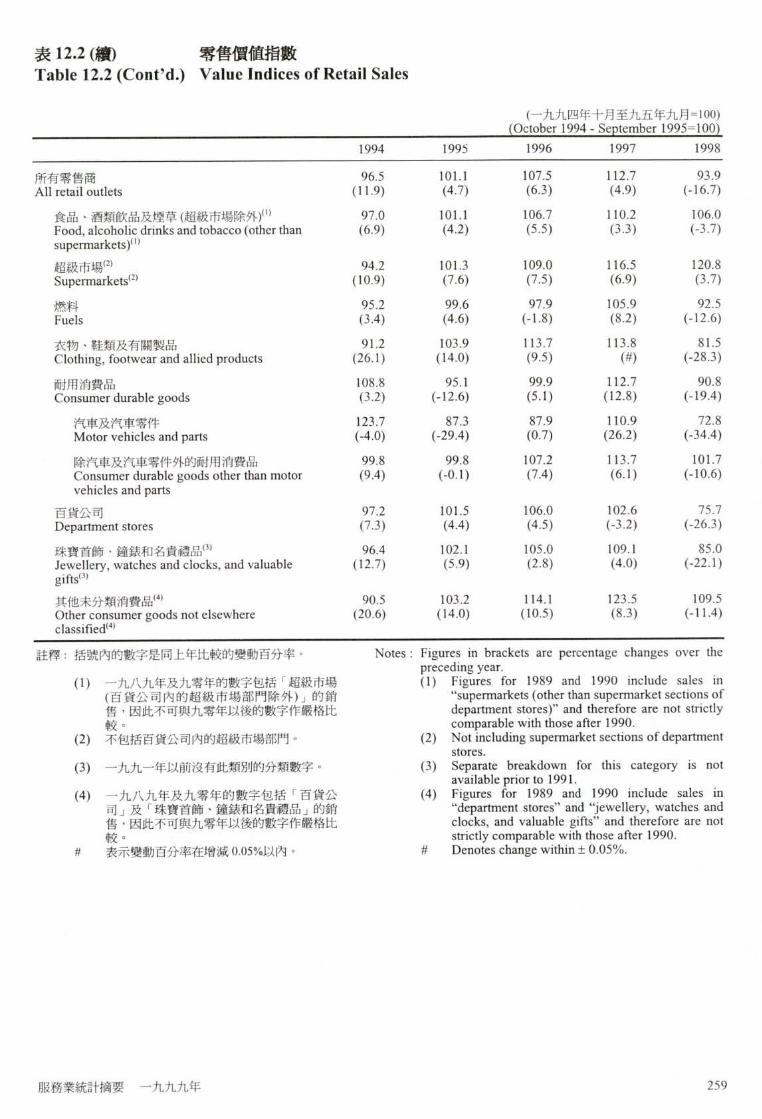
表12.2 (績) 零售價値指數
Table 12.2 (Cont'd.) Value Indices of Retail Sales (一九九四年十月至九五年九月=100)
(October 1994 - September 1995=100) 1994 1995 1996 1997 1998
所有零售商 96.5 101.1 107.5 112.7 93.9
All retail outlets (11.9) (4.7) (6.3) (4.9) (-16.7) 食品、酒類飮品及煙草(超級市場除外)⑴ 97.0 101.1 106.7 110.2 106.0 Food, alcoholic drinks and tobacco (other than (6.9) (4.2) (5.5) (3.3) (-3.7) supermarkets)� 超級市場(2) 94.2 101.3 109.0 116.5 120.8
Supermarkets'^* (10.9) (7.6) (7.5) (6.9) (3.7) 燃料 95.2 99.6 97.9 105.9 92.5
Fuels (3.4) (4.6) (-1.8) (8.2) (-12.6) 衣物、鞋類及有關製品 91.2 103.9 113.7 113.8 81.5 Clothing, footwear and allied products (26.1) (14.0) (9.5) (#) (-28.3) 耐用消費品 108.8 95.1 99.9 112.7 90.8 Consumer durable goods (3.2) (-12.6) (5.1) (12.8) (-19.4)
汽車及汽車零件 123.7 87.3 87.9 110.9 72.8
Motor vehicles and parts (-4.0) (-29.4) (0.7) (26.2) (-34.4) 除汽車及汽車零件外的耐用消費品 99.8 99.8 107.2 113.7 101.7 Consumer durable goods other than motor (9.4) (-0,1) (7.4) (6.1) (-10.6) vehicles and parts
百貨公司 97.2 101.5 106.0 102.6 75.7
Department stores (7.3) (4.4) (4.5) (-3.2) (-26.3) 珠 寶 首 飾 、 鐘 錶 和 名 貴 禮 品 9 6 . 4 102.1 105.0 109.1 85.0 Jewellery, watches and clocks, and valuable (12.7) (5.9) (2.8) (4.0) (-22.1) gifts � 其他未分類消費品 <4) 90.5 103.2 114.1 123.5 109.5 Other consumer goods not elsewhere (20.6) (14.0) (10.5) (8.3) (-11.4) classified �
註釋:括號內的數字是同上年比較的變動百分率“ Notes : Figures in brackets are percentage changes over the preceding year.
(1) 一九八九年及九零年的數字包括「超級市場 (1) Figures for 1989 and 1990 include sales in (百貨公司內的超級市場部門除外)」的銷 ‘‘supermarkets (other than supermarket sections of 售’ i g此禾命與九%年以後的數字作嚴格比 department stores)" and therefore are not strictly 較� comparable with those after 1990.
( 2 )不包括百貨公司內的超級市場部門。 (2) Not including supermarket sections of department stores.
(3) 一九九一年以前沒有此類別的分類數字。 (3) Separate breakdown for this category is not available prior to 1991.
(4) 一九八九年及九零年的數字包括「百貨公 � Figures for 1989 and 1990 include sales in 司」及「珠寶首飾、鐘錶和名貴禮品」的銷 ‘‘department stores" and "jewellery, watches and 售’因此不可與九零年以後的數字作嚴格比 clocks, and valuable gifts" and therefore are not 較� strictly comparable with those after 1990.
# 表示變動百分率在增減0.05%以內。 # Denotes change within 土 0.05%.
服務業統許摘要一九九九年 261

表12.3 零售量指數
Table 12.3 Volume Indices of Retail Sales (一九九四年十月至九五年九月=100)
(October 1994 - September 1995=100) 1989 1990 1993 1992 1993
所有零售商 7 1 . 8 7 2 . 2 7 9 . 7 8 9 . 3 9 5 . 5 All retail outlets (-1.2) (0.6) (10.4) (12.1) (6.9)
食品、酒類飮品及煙草(超級市場除外)� 9 0 . 4 9 5 . 0 1 0 1 . 3 9 8 . 5 9 9 . 6 Food, alcoholic drinks and tobacco (other than (3.7) (5.0) - (-2.8) (1.1) supermarkets)*'' 超級市場(2) 8 4 . 4 8 9 . 4 9 2 . 1 9 3 . 7 9 6 . 2 Supermarkets � (2.8) (5.9) (3.1) (1.7) (2.7) 燃料 91.3 92.4 94.2 98.6 102.0 Fuels (2.4) (1.3) (2.0) (4.7) (3.4) 衣物、鞋類及有關製品 5 4 . 9 5 3 . 1 6 1 . 2 6 9 . 9 8 4 . 5 Clothing, footwear and allied products (-2.2) (-3.2) (15.2) (14.2) (20.9) 耐用消費品 7 1 . 7 7 5 . 3 8 6 . 7 1 0 7 . 6 1 1 2 . 8 Consumer durable goods (-8.1) (5.0) (15.1) (24.1) (4.8)
汽車及汽車零件 9 9 . 2 9 8 . 0 1 1 2 . 6 1 5 9 . 1 1 4 8 . 6 Motor vehicles and parts (5.7) (-1.2) (14.9) (41.2) (-6.6) 除汽車及汽車零件外的耐用消費品 5 9 . 4 6 4 . 9 7 4 . 7 8 3 . 8 9 6 . 2 Consumer durable goods other than motor (-14.8) (9.2) (15.1) (12.2) (14.8) vehicles and parts
百貨公司 87.6 92.0 96.2 101.0 103.4 Department stores (1.9) (5.1) (4.6) (4.9) (2.4) 珠寶首飾、鐘錶和名貴禮品⑶ - - 6 9 . 7 8 5 . 5 9 2 . 0 Jewellery, watches and clocks, and valuable - - - (22.7) (7.6) gifts � 其 他 未 分 類 消 費 品 6 8 . 6 6 6 . 8 6 6 . 5 7 3 . 5 8 0 . 9 Other consumer goods not elsewhere (-0.9) (-2.7) - (10.5) (10.2) classified �
註釋:括號內的數字是同上年比較的變動百分率� Notes : Figures in brackets are percentage changes over the preceding year.
(1) 一九八九年及九零年的數字包括「超級市場 (1) Figures for 1989 and 1990 include sales in (百貨公司內的超級市場部門除外)」的銷 “supermarkets (other than supermarket sections of 售’因此不可與九零年以後的數字作嚴格比 department stores)" and therefore are not strictly 較 ° comparable with those after 1990.
( 2 )不包括百貨公司內的超級市場部門。 (2) Not including supermarket sections of department stores.
(3) 一九九一年以前沒有此類別的分類數字 ° (3) Separate breakdown for this category is not available prior to 1991.
(4) 一九八九年及九零年的數字包括「百貨公 (4) Figures for 1989 and 1990 include sales in 司」及「珠寶首飾、鐘錶和名貴禮品」的銷 "department stores" and "jewellery, watches and 售’因此不可與九零年以後的數字作嚴格比 clocks, and valuable gifts" and therefore are not 較� strictly comparable with those after 1990.
258 Statistical Digest of the Services Sector 1999

表12.3 (續) 零售量指數
Table 12.3 (Cont'd.) Volume Indices of Retail Sales (一九九四年十月至九五年九月=100)
(October 1994 - September 1995=100) 1994 1995 1996 1997 1998
所有零售商 1 0 1 . 1 9 9 . 7 1 0 1 . 3 1 0 2 . 4 8 5 . 3 All retail outlets (5.8) (-1.4) (1.6) (1.1) (-16.7)
食品、酒類飮品及煙草(超級市場除外)� 1 0 2 . 1 9 9 . 8 1 0 2 . 1 1 0 3 . 8 1 0 0 . 3 Food, alcoholic drinks and tobacco (other than (2.5) (-2.2) (2.3) (1.6) (-3.3) supermarkets)� 超 級 市 場 9 9 . 7 99.4 100.6 100.3 97.8 Supermarkets � (3.7) (-0.3) (1.1) (-0.2) (-2.5) 燃料 100.5 98.0 89.9 91.2 80.2 Fuels (-1.5) (-2.5) (-8.2) (1.4) (-12.1) 衣物、鞋類及有關製品 9 7 . 9 1 0 2 . 0 1 0 3 . 1 9 5 . 3 6 8 . 8 Clothing, footwear and allied products (15.8) (4.2) (1.1) (-7.6) (-28.0) 耐用消費品 1 1 2 . 3 9 4 . 4 9 8 . 5 1 1 0 . 6 9 1 . 4 Consumer durable goods (-0.4) (-15.9) (4.3) (12.3) (-17.4)
汽車及汽車零件 1 3 1 . 9 8 6 . 8 8 7 . 1 1 1 0 . 0 7 7 . 9 Motor vehicles and parts (-11.3) (-34.2) (0.3) (26.4) (-29.2) 除汽車及汽車零件外的耐用消費品 1 0 2 . 8 9 9 . 1 1 0 5 . 4 1 1 0 . 9 9 9 . 5 Consumer durable goods other than motor (6.8) (-3.6) (6.4) (5.2) (-10.3) vehicles and parts
百貨公司 103.7 100.0 98.5 89.4 65.4 Department stores (0.3) (-3.6) (-1.5) (-9.3) (-26.9) 珠寶首飾、鐘錶和名貴禮品⑶ 9 7 . 9 1 0 1 . 2 1 0 1 . 3 1 0 7 . 3 8 9 . 3 Jewellery, watches and clocks, and valuable (6.3) (3.4) (0.1) (5.9) (-16.8) gifts � 其他未分類消費品 9 3 . 8 1 0 1 . 8 1 0 7 . 3 1 1 0 . 2 9 3 . 4 Other consumer goods not elsewhere (15.9) (8.5) (5.5) (2.7) (-15.2) classified �
註釋:括號內的數字是同上年比較的變動百分率° Notes : Figures in brackets are percentage changes over the preceding year.
(1) 一九八九年及九零年的數字包括「超級市場 (1) Figures for 1989 and 1990 include sales in (百貨公司內的超級市場部門除外)」的銷 "supermarkets (other than supermarket sections of 售’因此不可與九零年以後的數字丨^^嚴格比 d e p a _ e n t stores)" and therefore are not strictly 較 ° comparable with those after 1990.
( 2 )不包括百貨公司內的超級市場部門。 (2) Not including supermarket sections of department stores.
(3) 一九九一年以前沒有此類別的分類數字。 (3) Separate breakdown for this category is not available prior to 1991.
(4) 一九八九年及九零年的數字包括「百貨公 (4) Figures for 1989 and 1990 include sales m 司」及「珠寶首飾、鐘錶和名貴禮品」的銷 “department stores" and "jewellery, watches and 售’因此不可與九零年以後的數字作嚴格比 clocks, and valuable gifts" and therefore are not 較� strictly comparable with those after 1990.
服務業統許摘要一九九九年 261

圓12.2 零售指數
Chart 12.2 Indices of Retail Sales
指數 (一九九四年十月至九五年九月=100)
1 州 Index (October 1994 - September 1995=100)
100 • ^ ^ ^ • —•— - -•-、
80 “ _ 、 • • • _ — ^ ^ ^ ^
60 ^ —
40
20
0 H 1 1 1 1 1 1 1 I 1989 1990 1991 1992 1993 1994 1995 1996 1997 1998
價値指數 - - - 數 量 指 數 Value index Volume index
262 Statistical Digest of the Services Sector 1999

表12.4 食品批發 Table 12.4 Wholesale of Food Items
牲畜⑴(頭) 3 516 030 3 386 420 3 232 140 3 093 060 2 871 040
Live animals'" (heads) (-5.2) (-3.7) (-4.6) (-4.3) (-7.2) 米<2>(公噸) 406 580 374 070 391 640 400 160 372 720
Rice(2> (tonnes) (11.8) (-8.0) (4.7) (2.2) (-6.8)
鮮活、凍鮮或冷藏魚類(公噸) 1 4 8 7 9 0 1 7 2 7 3 0 1 9 5 1 4 0 1 9 1 1 3 0 1 8 1 0 7 0 Live, chilled and frozen fish�(tonnes) (-3.6) (16.1) (13.0) (-2.1) (-5.3)
新鮮蔬菜(4)(公_) 372 890 387 500 376 530 397 750 409 770 Fresh vegetables") (tonnes) (7.9) (3.9) (-2.8) (5.6) (3.0)
家禽⑶(公_) 96 880 96 070 87 220 89 280 84 590 Poultry�( tonnes) M (-5.3)
1994 1995 1996 1997 1998 牲畜⑴(頭) 2 850 340 2 722 500 2 619 168 2 494 556 2 426 284
Live animals"' (heads) (-0.7) (-4.5) (-3.8) (-4.7) (-2.7) 米(2)(公 _ ) 358 070 357 500 370 550 348 580 323 840
Rice(2> (tonnes) (-3.9) (-0.1) (3.7) (-5.9) (-7.1)
鮮活、凍鮮或冷藏魚類公_) 173 210 170 100 172 020 167 200* 160 520 Live, chilled and frozen fish�(tonnes) (-4.3) (-1.8) (1.1) (-2.8) (-4.0) 新鮮蔬菜⑷(公噸) 4 8 6 3 9 0 5 0 5 0 9 0 5 2 6 9 4 0 5 2 2 3 3 0 5 5 2 5 9 0 Fresh vegetables'^' (tonnes) (18.7) (3.8) (4.3) (-0.9) (5.8)
家禽<5)(公_) 78 860 79 150 76 510 69 830 62 380 Poultry�( tonnes) ^ (-3.3) (-8.7) (-10.7) 註釋:括號內的數字是同上年比較的變動百分率� Notes : Figures in brackets are percentage changes over
preceding year. (1) 包括經由市區及郊區屠房屠宰的生猪、牛及 (1) Figures include live pigs, cows and sheep
羊� slaughtered in both urban and rural abattoirs. ( 2 )指全港的總供應量’包括出口及轉口數字。 (2) Figures refer to total supply in Hong Kong, i.e.
including export and re-export. ( 3 )指全港的淨供應量’即本地生產加上入口 (3) Figures refer to net supply in Hong Kong, i.e. local
量’再減去出 口及車專口 的數字 ° production plus total import, excluding export and re-export.
(4) 數字指漁農處管理的食品批發市場的銷售 (4) These figures are the market throughput of 量’包括長沙灣副食品批發市場、西區副食 wholesale food markets administered by 品批發市場、北區臨時農產品批發市場及蔬 Agriculture and Fisheries Department, including 菜統營處長沙灣蔬菜批發市場。 Cheung Sha Wan Wholesale Food Market,
Western Wholesale Food Market, North District Temporary Wholesale Market for Agricultural Products and V.M.O. Cheung Sha Wan Vegetable Market.
(5) 家禽主要經由長沙灣臨時家禽批發市場及 (5) Live poultry are sold through two main markets : 西區副食品批發市場的家禽市場批銷’後者 Cheung Sha Wan Temporary Wholesale Poultry 於一九九四年三月起取代西區臨時家禽批 Market and Poultry Market at Western Wholesale 發市場� Food Market. The latter reprovisioned Western
Temporary Wholesale Poultry Market in March 1994.
服務業統計摘要一九九九年 263

表12.5 批發及零售業的選定最新統計數字 Table 12.5 Selected Up-to-date Statistics on Wholesale and Retail Services
1998 1999 第一季 第二季 第三季 第四季 第一季 QJ Q2 Q3 Q4 Q ^
機構單位數目(不包括零售攤檔(街市攤檔除外)及小 68 453 65 850 67 227 64 803 69 242
販) Number of establishments (not including retail pitches (other than market stalls) and hawkers) 就業人數(不包括零售攤檔(街市攤檔除外)及小販) 282 085 265 296 271 295 260 730 269 856 Number of persons engaged (not including retail pitches (other than market stalls) and hawkers) 就業人數(包括零售擬檔(街市攤檔除外)及小販) 301 500 285 100 291 100 287000 287300 Number of persons engaged (including retail pitches (other than market stalls) and hawkers) 業務收益指數(1996= 100) 91.2 85.9 84.5 82.4 76.3
Business receipts index (1996=100)
零售業總銷貨額(百萬元) 50,947 48,326 48,851 47,551 43,949
Total retail sales ($ million) 零售價値指數(九四年十月至九五年九月=丨00) 97.8 92.8 93.8 91.3 84.4
Value index of total retail sales (Oct 94 - Sep 95=100)
食品、酒類飮品及煙草(超級市場除外) 101.7 1 0 5 . 3 1 0 6 . 6 1 1 0 . 6 1 0 6 . 7 Food, alcoholic drinks and tobacco (other than supermarkets) 超級市場 118.1 120.1 126.3 118.8 117.2
Supermarkets 燃料 95.9 99.4 93.1 81.7 76.7
Fuels 衣物、鞋類及有關製品 91.6 81.3 75.5 77.7 72.7 Clothing, footwear and allied products 耐用消費品 95.1 93.4 89.3 85.4 74.3 Consumer durable goods
汽車及汽車零件 86.5 78.8 68.6 57.4 49.1 Motor vehicles and parts 除汽車及汽車零件外的耐用消費品 100.3 102.3 101.8 102.3 89.5 Consumer durable goods other than motor vehicles and parts
百貨公司 83.1 72.2 73.3 74.0 67.4
Department stores 珠寶首飾、鐘銀和名貴禮品 9 6 . 0 81.9 77.8 8 4 . 4 7 7 . 2 Jewellery, watches and clocks, and valuable gifts 其他未分類消費品 106.4 104.7 120.8 105.9 96.2 Other consumer goods not elsewhere classified
248 Statistical Digest of the Services Sector 1999
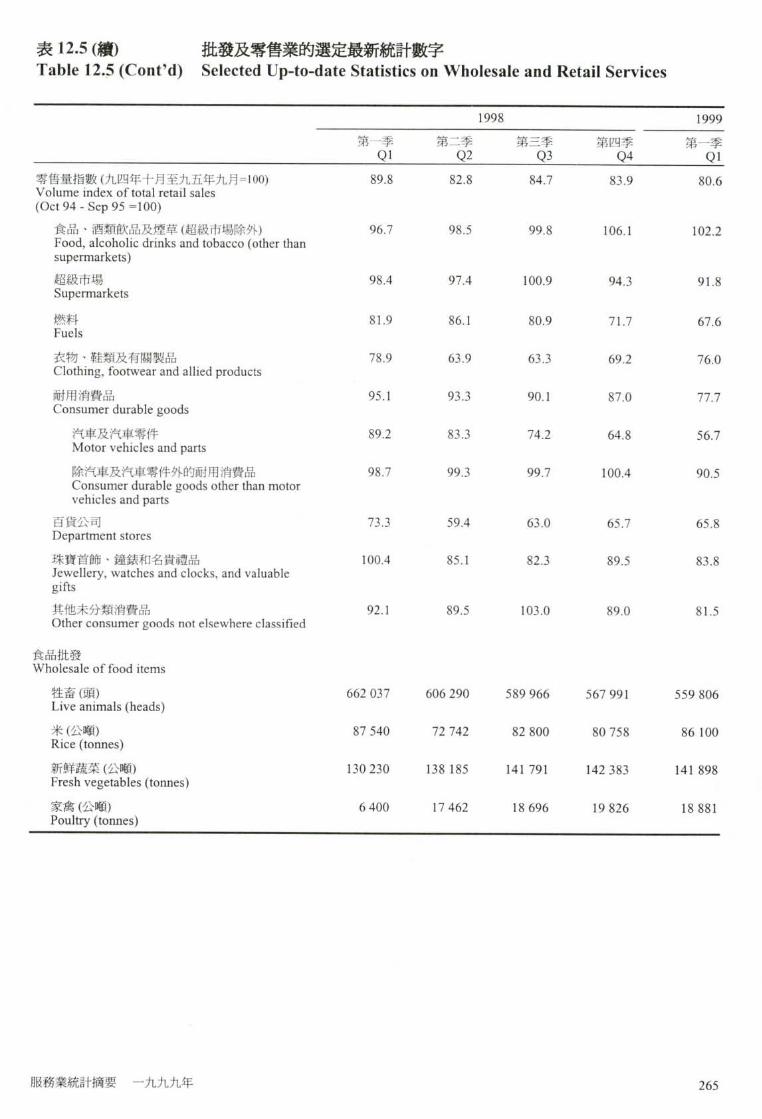
表12.5 (繽) 批發及零售業的選定最新統計數字 Table 12.5 (Cont'd) Selected Up-to-date Statistics on Wholesale and Retail Services
1998 1999 第一季 第二季 第三季 第四季 第一季 Ql Q2 Q3 Q4 Ql_
零售量指數(九四年十月至九五年九月=100) 89.8 82.8 84.7 83.9 80.6 Volume index of total retail sales (Oct 94 - Sep 95 =100)
食品、酒類飮品及煙草(超級市場除外) 9 6 . 7 98.5 99.8 1 0 6 . 1 1 0 2 . 2 Food, alcoholic drinks and tobacco (other than supermarkets) 超級市場 98.4 97.4 100.9 94.3 91.8 Supermarkets 燃料 81.9 86.1 80.9 71.7 67.6 Fuels 衣物、鞋類及有關製品 78.9 63.9 63.3 69.2 76.0 Clothing, footwear and allied products 耐用消費品 95.1 93.3 90.1 87.0 77.7 Consumer durable goods
汽車及汽車零件 89.2 83.3 74.2 64.8 56.7 Motor vehicles and parts 除汽車及汽車零件外的耐用消費品 98.7 99.3 99.7 100.4 90.5 Consumer durable goods other than motor vehicles and parts
百貨公司 73.3 59.4 63.0 65.7 65.8 Department stores 珠寶首飾、鐘錶和名貴禮品 1 0 0 . 4 8 5 . 1 82.3 8 9 . 5 83.8 Jewellery, watches and clocks, and valuable gifts 其他未分類消費品 92.1 89.5 103.0 89.0 81.5 Other consumer goods not elsewhere classified
食品批發 Wholesale of food items
牲畜(頭) 662 037 606 290 589 966 567 991 559 806 Live animals (heads) 米(公噸) 87 540 72 742 82 800 80 758 86 100 Rice (tonnes) 新鮮蔬菜(公顺) 1 3 0 2 3 0 1 3 8 1 8 5 1 4 1 7 9 1 1 4 2 3 8 3 1 4 1 8 9 8 Fresh vegetables (tonnes) 家禽(公噸) 6 400 17 462 18 696 19 826 18 881 Poultry (tonnes)
服務業統計摘要一九九九年 265

資料來源 Data Sources 表 資料來源 Table Sources 12.1. - 12.3 政府統計處 12.1 -12.3 Census and Statistics Department 12.4 漁農處 12.4 Agriculture and Fisheries Department
其他有關刊物 Further References 就業及空缺統旨f(詳細統計表) Employment and Vacancies Statistics (Detailed Tables) 本地生產總値估計 Estimates of Gross Domestic Product 香港統計年干fJ Hong Kong Annual Digest of Statistics 香港統計月刊 Hong Kong Monthly Digest of Statistics 服務行業按季業務收益指數 Quarterly Business Receipts Indices for Service
Industries 就業、空缺及薪金總額按季統計報告 Quarterly Report of Employment, Vacancies and
Payroll Statistics 本地生產總値估計按季報告 Quarterly Report of Gross Domestic Product Estimates 批發、零售、進口與出口貿易、食肆及酒店按 Report on Annual Survey of Wholesale, Retail and 年統計調查報告 Import and Export Trades, Restaurants and Hotels 零售業銷貨額按月統計調查報告 Report on Monthly Survey of Retail Sales
242 Statistical Digest of the Services Sector 1999

11電腦及有關服務 X Computer and Related Services 槪要 Highlights 隨著使用電腦及資訊科技日趨普及’電腦及 Following the trend of increasing popularity in the use 有關服務界別在本地經濟所擔當的角色愈來 of computer and information technology, computer 愈重要 °近期政府及私人機構均積極推廣資 and related services domain has played a more and 訊科技白勺發展禾口應用。 more important role in the local economy. Recently,
the Government and the private sector have both shown great initiative in promoting the development and application of information technology.
資料處理及製表服務業是與電腦及有關服務 Among others, data processing and tabulating services 界別有密切關 f系的行業之一 ° 在一九九八 industry is one of the industries closely related to the 年’大約有 1 800 機構單位及 12 800 人從事 computer and related services domain. In 1998, there 資料處理及製表服務業 °事實上,與九一年 were about 1 800 establishments and 12 800 persons 比較’機構單位數目上升 88% ’ 而就業人數 engaged in the data processing and tabulating services 則上升 122% ° 在經濟方面的貢獻’這行業 industry. Indeed, these represented a 88% increase in 在九七年爲本港帶來 4 0億元的增加價値’佔 number of establishments and 122% increase in 該年本地生產總値的 0.3% ” persons engaged compared with 1991. In terms of
economic contribution, this industry generated $4 billion value added in 1997, which accounted for 0.3% of Gross Domestic Product (GDP) in the year.
此外’香港是外國公司與中國內地或亞洲其 Besides, Hong Kong is a major intermediary centre 他國家之間的電腦硬件及軟件貿易的主要中 for the trading of computer hardware and software 轉站。有關電腦產品的貿易活動貨値在過去 between foreign firms and the mainland of China or 十年間顯著增長。在一九九八年’電腦硬件 other Asian countries. The value of trading activities 及軟件的進口貨値達到 445 億元’較八九年 related to computer products grew remarkably in the ( 5 4 億元)增加了七倍;其整體出口貨値(包 past decade. In 1998, imports of computer hardware 括港產品出口及轉口)則爲 293 億元’較八 and software reached $44.5 billion, seven times 九年的 72 億元上升了三倍� greater than the figure ($5.4 billion) in 1989; the
corresponding total exports (including domestic exports and re-exports) reached $29.3 billion, representing an increase of three times compared with the $7.2 billion figure in 1989. •
除與電腦及有關服務界別有密切關係的行業 Apart from industries closely related to the computer 外,其他行業的機構單位及各政府部門亦僱 and related services domain, establishments in other 用相當數目的員工從事資訊科技職務以協助 industries and government departments also
服務業統計摘要一九九九年 243
日常運作。據職業訓練局的一項統計調查顯 employed a considerable number of persons in 示,在一九九乂\年初’在本港從事資訊科技 occupations with information technology functions to 職務的僱員有 4 5 0 0 0 人 ° 與九一年比較’大 support their daily operations. According to a survey 約有 46%白勺±曾長� conducted by the Vocational Training Council, there
were 45 000 information technology employees in Hong Kong at the beginning of 1998. Compared to 1991, this represented a 46% increase over the years.
%
242 Statistical Digest of the Services Sector 1999
電腦及有關服務界別的涵蓋範圍 Coverage of Computer and Related Services Domain 就編製及分析統計數字的角度而言’「電腦 In the context of statistical compilation and analysis, 及有關服務」並非一個服務「行業」’而是 “computer and related services" is not regarded as a ——{固「月g務界另ij�� service "industry". Instead, it is a "service domain".
服務界別有別於服務行業,它包括由不同行 A service domain differs from a service industry in 業所從事而與一個主題相關的’經濟活動部 that a domain comprises those parts of economic 分。提供電腦及有關服務的機構單位分別來 activities straddling different industries but are 自不同f亍業’大致可分爲下歹!J兩糸且: somehow related to a common purpose.
Establishments involved in the provision of computer and related services straddle a number of industries and can broadly be classified into the following two groups :
I. 業務與這個界別有密切關係的機構單 I. Establishments closely related to the domain : 位:
資料處理及製表服務公司 Data processing and tabulating services companies
I I . 部分業務與這個界別有關的機構單位: n . Establishments partly related to the domain : 辦公室器材(像具及固定裝置除外)的經 Distributors of office machines, appliances and 銷商--在這組別內’只有那些電腦器材 equipment (except furniture and f i x t u r e s ) -的批發商、零售商及進口商與出口商是 within this group, only those wholesalers, 禾口 這界另!l有關 ° retailers and importers/exporters of computer
equipment are related to the domain
有關服務界別定義的詳情’請參閱「槪念及 For more details on the definition of a service domain, 方法」分的介 '紹段落 � please refer to the introductory paragraphs in the
section "Concepts and Methods".
服務業統計摘要一九九九年 243

主要統計數字 Key Statistics I . 颜處理及製表服務公司
Data Processing and Tabulating Services Companies 年 機構單位數目⑴ 就業人數<1> 增加價値(百萬元) Year Number of establishments"' Number of persons engaged� Value added ($ million)
1989 [465] [3 027] 1,032** 1990 [668] [4 457] 1,109** 1991 978 5 756 1,491** 1992 1 139 6 606 1,459** 1993 1 189 7 005 1,641** 1994 1 490 7 934 2,093** 1995 1 550 8 728 2,826** 1996 1 610 9 494 3,088** 1997 1 723 9 738 3,984** 1998 1 834 12 775 N.A.
註釋:(1) 一九九一年及以後的數字是該年內四季 Notes: (1) Figures for 1991 and onwards are averages of 的估計數字的 f均數’而九一年以前的 the four quarterly estimates of the year, 數字是指該年三月底的1青況° whereas those prior to 1991 refer to the
position as at end March of the corresponding year.
[ ]一九九一年前的數字的涵蓋範圍與其後 [ ] F i g u r e s prior to 1991 are slightly different in 的略有不同’因此不可將兩組數字作嚴 coverage and therefore are not strictly 格t匕較� comparable with those for 1991 and onwards.
** 數字是根據有限數據而作出的粗略估 ** These are crude estimates which are compiled 計’在曰後得到更多資料時可能會作相 based on limited data. They may be subject to 當大的修口 ’因此在運用這數字時’應 considerable revisions when more data become 、々‘Ci�留意這點 ° available. Special care should be taken when
interpreting them.
252 Statistical Digest of the Services Sector 1999

I I . 辦公室器材(像具及固定裝置除外)經銷商 Distributors of Office Machines, Appliances and Equipment (except Furniture and Fixtures)
百萬元(另有註明除外) $ million, unless otherwise specified
r 電腦產品的進出口貨値
Imports and Exports of Computer 機 搆 單 位 數 目 ⑴ ⑶ 就業人數⑴,(2)’⑶ Products⑷ Number of Number of persons
年 establishments(丨),(2>.� engaged�.⑵’⑶ 進口 整體出口⑶
Year Imports Total exports� 1989 [1 616] [15 120] 5,362 7,217 1990 [1 959] [17 862] 7,236 7,811 1991 2 555 19 874 8,654 9,306 1992 2 973 21 702 13,386 10,576 1993 - - 14,243 10,027 1994 3 637 26 335 18,048 11,121 1995 3 794 27 758 23,216 14,794 1996 3 985 29 771 36,522 23,962 1997 3 797 32 941 45,051 26,438 1998 3 188 22 510 44,527 29,330
註釋:(1) 一九九四年及以後的數字是指「進出口 Notes: (1) Figures for 1994 and onwards refer to total 商」(在十二月底的數目)和「批發商及零 number of importers/exporters (as at end 售商」(在六月底的數目)的總計。而九四 December); and retailers and wholesalers (as 年以前的數字是指該年度六月底的總 at end June). Figures prior to 1994 refer to 言十� those as at end June of the corresponding year.
(2) fe字除包括電腦器材經銷商外’亦包括 (2) In addition to distributors of computer 從事其他辦公室器材(像具及固定裝置除 equipment, the figures cover also 外)批發、零售及進出口貿易的機構單位 establishments and persons engaged m 數目及就業人數。此外’ 一九九一年前 wholesaling, retailing and importing / 的數字更包括從事像具及固定裝置批發 exporting of other office machines, appliances 的機構單位數目及就業人數� and equipment (except furniture and fixtures).
Moreover, figures prior to 1991 include also those engaged in wholesaling of furniture and fixtures.
( 3 )由於在一九九三年並沒有進行有關統計 (3) Figure was not available in 1993 because the 調 i ’ 所以、沒有該年的數字 ° survey concerned was not conducted in that
year. (4)包括電腦硬件及軟件 ° (4) Including computer hardware and software. ( 5 ) 包括港產品出口及轉口。 (5) Including domestic exports and re-exports. [ ]一九九一年前的數字的涵蓋範圍與其後 [ ] F i g u r e s prior to 1991 are slightly different in
的略有不同’因此不可將兩組數字作嚴 coverage and therefore are not strictly 格比° comparable with those for 1991 and onwards.
III.整個電腦及有關服務界別 The Entire Computer and Related Services Domain
年 業務收益指數⑴(1996=100) Year Business receipts index�(1996=100) 1996 100.0
1997 110.5 1998
註釋:( 1 )開始編製’但此詳細分類的指數則於九 N o t e : ( l ) Business receipts indices were first available in 六 年 編 製 ° the reference year 1992,but indices at such
detailed breakdown were first compiled in 1996.
服務業統計摘要一九九九年 243

槪念及方法 Concepts and Methods 就編製及分析統計數字的角度而言’電腦及有關 In the context of statistical compilation and analysis, 月昆務並寻—一f固月S務行業‘而是一個月S矛务界另!J ° computer and related services is not regarded as a
service industry but a service domain.
I務界 J ! /有別於服務行業’它包括由不同行業所 A service domain differs from a service industry in 從事而與一個主題相關的經濟活動部分° 一個與 that a domain comprises those parts of economic 某服務界別關係密切的行業內的所有機構單位 activities straddling different industries but are 都可能與該服務界別有關。但在另外一些情況 somehow related to a common purpose. It may 下’只有部分的機構單位或甚至只是部分機構單 include all activities carried out by all establishments 位的部分經濟活動’是與該界別有關的 ° in a service industry that is closely related to the
domain. In some other cases, however, only a portion of the establishments in an industry or even only part of the establishments' activities is related to the domain.
霍/房龙存厥務包含一系列的服務’包括電腦器 Computer and related services involve a range of 材經銷商提供的銷售、安裝及維修服務’以及資 services, including selling, installation and 料處理’製表及軟件發展服務等°因此’與電腦 maintenance services rendered by distributors of 及存 J T 万界级有關的機構單位會分別來自不 computer equipment as well as data processing, 同的行業,如辦公室器材批發、零售及進出口貿 tabulating and software development services, etc. 易’以及資料處理和製表服務°由於行業內的機 Hence, establishments related to the computer and 構單位只有部分業務與界別有關’而要確定這部 related services domain straddle a number of 分的大小極之困難,因此並沒有整個界別的機構 industries such as wholesale, retail and import/export 單位數目、就業人數、業務收益和增加價値的準 of office equipment and data processing and 確估計數字 ° tabulating services. As only a portion of the activities
carried out by the establishments in these industries are related to the domain and it is extremely difficult to ascertain the size of this portion, there are no accurate estimates of the total number of establishments, persons engaged, business receipts and value added for the entire domain.
編製電腦及有關服務界別的業務收益指數時 ’ To compile business receipts index for the computer 有關的業務收益數據是分別從提供資料處理及 and related services domain, business receipts data are 製表服務的機構單位,及主要從事電腦器材買賣 collected from establishments rendering data 白勺經銷商搜集得來“ processing and tabulation services and distributors
who mainly deal in computer equipment.
言司_禾翠義 Definition of terms
潘/凑罩位是指在單一擁有權或控制權(即單一公 An establishment is defined as an economic unit (i.e. a 司名義)下’在單一地點從事一種或主要從事一 unit engaged in the production of goods or services)
242 Statistical Digest of the Services Sector 1999

種經濟活動(即生產貨物或提供服務)的經濟單 which engages, under a single ownership or control 位 ° (i.e. under a single company name), in one or
predominantly one kind of economic activity at a single physical location.
本地生產總値是指一個國家或地區的所有常住 Gross Domestic Product (GDP) is a measure of the 生產單位’在一個指定的期間內’未扣除固定資 total value of production of all resident producing 本消耒毛的生產總値 ° units of a country or territory in a specified period,
before deducting allowance for consumption of fixed capital.
生產總額包括按機構單位提供服務所收取的費 Gross output comprises mainly receipts from services 用、佣金及其他4交入’串專售貨物的毛利及租金4文 rendered in the form of fees, commissions and other 入 ° service charges, margin on resale of goods and rentals
received.
就業人數包括積極參與機構單位工作的在職東 Persons engaged in an establishment include working 主及股東;在統計日期受僱於機構單位的全職僱 proprietors and partners actively engaged in the work 員’包括長期或臨時聘用的’無論這些僱員正在 of the establishment; full-time employees paid by the 開工或因事假或者病假而暫時缺勤;及在統計日 establishment on the survey reference date, both 期工作三小時或以上的兼職僱員和無酬家屬幫 permanent and temporary, who are either at work or 工 ° on vacation or sick leave; and part-time employees
and unpaid family workers working three hours or more on the survey reference date.
硬 / f /^资易斑,/•激字包括自動資料處理機 Trade statistics on computer hardware includes 及其部件、磁性或光學閱讀器、將資料以代碼形 imports and exports of automatic data processing 式轉錄到資料媒體的機器及處理這些資料的機 machines and units thereof, magnetic or optical 器的入口及出口貨f直 ° 因此’ 一些與電腦硬件無 readers, machines for transcribing data onto data 關的辦公室資料處理機械亦包括在內� media in coded form and machines for processing
such data. Thus, some office data processing machines, which are not computer hardware, may also be included.
電腦軟件的貿易統計數字包�fi^银昔束錄製其 Trade statistics on computer software includes 他信息的唱片、錄音帶及其他媒體;供製造唱片 imports and exports of records, tapes and other 的原模及主片’但不包括攝影及電影攝影用品的 recorded media for sound or other similarly recorded 入口 及出口 貨値 ° phenomena, including matrices and masters for the
production of records, but excluding products of photographic and cinematographic goods.
智力/7赏激是生產總額減去中間投產消耗(生產過 Value added is defined as the value of gross output 程中所耗用的貨物和服務的價値 ) ° less the value of intermediate consumption (the value
of goods and services used up in the course of production).
服務業統計摘要一九九九年 243

統計圓表
Statistical Tables and Charts 第一部分:資料處理及製表服務公司 Part I : Data Processing and Tabulating Services Companies 表 1 3 . 1 _處理及製表服吣司的機_位數目、就業人數、生產總額及JfJ卩價値 Table 13.1 Number of Establishments and Persons Engaged, Gross Output and Value
Added for Data Processing and Tabulating Services Companies 百萬元(另有註明除外) $ million, unless otherwise specified
1989 1990 1991 1992 1993 機構單位數目⑴ [465] [668] 978 丨139 1 189 Number of establishments� (49.5) (43.7) (46.4) (16.5) (4.4)
就業人數⑴ [ 3 0 2 7 ] [ 4 4 5 7 ] 5 7 5 6 6 6 0 6 7 0 0 5 Number of persons e n g a g e d � (28.7) (47.2) (29.1) (14.8) (6.0) 生產總額 1,923** 1,731** 2,482** 2,292** 2,663** Gross output (88.0) (-10.0) (43.4) (-7.7) (16.2)
增加價値 1,032** 1,109** 1,491** 1,459** 1,641** Value added (58.0) (7.5) (34.4) (-2.1) (12.5)
在以要素成本計算的本地生產總値內所佔比率(%) 0.2** 0.2** 0.2** 0.2** 0.2** Contribution to GDP at factor cost (%) 增加價値在生產總額所佔比率 53.7** 64.1** 60.1** 63.7** 61.6** Value added as % of gross output
註釋:括號內的數字是與上年比較的變動百分率° Notes : Figures in brackets are percentage changes over the preceding year.
(1) 一九九一年及以後的數字是該年內四季的 h ) Figures for 1991 and onwards are averages of the 估計iit字的伞i^i ’ 而九一年以前 W數字是 four quarterly estimates of the year, whereas those 指該年三月底的‘I青況� prior to 1991 refer to the position as at end March
of the corresponding year. [ ]一九九一年前的數字的涵蓋範圍與其後的 [ ] F i g u r e s prior to 1991 are slightly different in
略有不同,因此不亩將兩組數字作嚴格比 coverage and therefore are not strictly comparable 較� with those for 1991 and onwards.
** 數字是根據有限數據而作出的粗略估 i t ,在 ** These are crude estimates which are compiled B後得到更多資;^時可能會作相當大的 0 based on limited data. They may be subject to 訂 ’ H 此 在 運 用 這 ^ 字 # ’ ffi小心留S這 considerable revisions when more data become 點 ° available. Special care should be taken when
interpreting them.
242 Statistical Digest of the Services Sector 1999

表 1 3 . 1 (繽) •處理及製表服務公司的機構單位數目、就業人數、生產總額及增加價値 Table 13.1 (Cont'd.) Number of Establishments and Persons Engaged, Gross Output and
Value Added for Data Processing and Tabulating Services Companies 百萬元(另有註明除外)
$ million, unless otherwise specified 1994 1995 1996 1997 1998
機構單位數目⑴ 1 4 9 0 1 5 5 0 1 6 1 0 1 7 2 3 1 8 3 4 Number of establishments'" (25.3) (4.0) (3.9) (7.0) (6.4)
就業人數⑴ 7 9 3 4 8 7 2 8 9 4 9 4 9 7 3 8 1 2 7 7 5 Number of persons engaged'" (13.3) (10.0) (8.8) (2.6) (31.2) 生產總額 3,253** 4,344** 5,174** 7,012** N.A. Gross output (22.2) (33.5) (19.1) (35.5) N.A.
增加價値 2,093** 2,826** 3,088** 3,984** N.A. Value added (27.5) (35.0) (9.3) (29.0) N.A.
在以要素成本計算的本地生產總値內所佔比率(%) 0.2** 0.3** 0.3** 0.3** N.A. Contribution to GDP at factor cost (%) 增加價値在生產總額所佔比率 64.3** 65.1** 59.7** 56.8** N.A. Value added as % of gross output
註釋:括號內的數字是與上年比較的變動百分率° Notes : Figures in brackets are percentage changes over the preceding year.
(1) 一九九一年及以後的數字是該年內四季的 (丨)Figures for 1991 and onwards are averages of the 估計數字的平均數’而九一年以前的數字是 four quarterly estimates of the year, whereas those 指該年三月底的情況 ° prior to 1991 refer to the position as at end March
of the corresponding year. ** 數字是根據有限數據而作出的粗略估計’在 ** These are crude estimates which are compiled
日後得到更多資料時可能會作相當大的If based on limited data. They may be subject to 言丁 ’因此在蓮用這數字時’應小心留意這 considerable revisions when more data become 點 ° available. Special care should be taken when
interpreting them.
服務業統計摘要一九九九年 243

圖 1 3 . 1 資料處理及製表服務公司的機講位數目<”及就業人數” Chart 13.1 Number of Establishments'" and Persons Engaged� for Data Processing and
Tabulating Services Companies
機構單位數目 就業人數
Number of establishments Number of persons engaged 2 000 1 — — " - ^ - - j 14 000
H圓 12 000
"。。 — _ 圓 _ - … 邏
•-…••圓一讓―——————— — — —_ — — -6。。。
4 � � — … i — J . … — i — … I —— _ … … 1 1 / 4 � � �
� — u j j j j j j — r 1991 1992 1993 1994 1995 1996 1997 1998
^ 機 構 單 位 數 目 就業人數 Number of establishments Number of persons engaged 註釋:(1) 數字是該年內四季的估計數字的平均數。 Note: (1) Figures are averages of the four quarterly
estimates of the year.
242 Statistical Digest of the Services Sector 1999

第二部分:辦公室器材(傢具及固定裝置除外)經銷商 Part II : Distributors of Office Machines, Appliances and Equipment
(except Furniture and Fixtures) 表 1 3 . 2 辦公室器材(像具及固定裝置除外)經銷商的機_位數目⑴’⑴’⑶及就業人數⑴,⑵. Table 13.2 Number of E s t a b l i s h m e n t s � � <3> and Persons Engaged'" for Distributors of
Office Machines, Appliances and Equipment (except Furniture and Fixtures)
1989 1990 1991 1992 1993 機構單位數目 [1616] [1 959] 2 555 2 973 -Number of establishments (23.5) (21.2) (30.4) (16.4) -
就業人數 [ 1 5 1 2 0 ] [ 1 7 8 6 2 ] 1 9 8 7 4 2 1 7 0 2 -Number of persons engaged (4.0) (18.1) (11.3) (9.2) -
1994 1995 1996 1997 1998 機構單位數目 3 6 3 7 3 7 9 4 3 9 8 5 3 7 9 7 3 1 8 8 Number of establishments - (4.3) (5.0) (-4.7) (-16.0)
就業人數 2 6 3 3 5 2 7 7 5 8 2 9 7 7 1 3 2 9 4 1 2 2 5 1 0 Number of persons engaged - (5.4) (7.3) (10.6) (-31.7) 註釋:括號內的數字是與上年比較的變動百分率° Notes : Figures in brackets are percentage changes over the
preceding year. (1) 一九九四年及以後的數字是指一「進出口」奇」 (1) Figures for 1994 and onwards refer to total number
(在十二月底的數目)和「批發商及零售商� of importers/exporters (as at end December); and (在六月底的數目)的總計°而九四年以前的 retailers and wholesalers (as at end June). Figures 數字是指該年度六月底的總計� prior to 1994 refer to those as at end June of the
corresponding year. (2) 數字除包括電腦器材經銷商外’亦包括從事 (2) In addition to distributors of computer equipment,
其他辦公室器材(像具及固定裝置除外)批 the figures cover also establishments and persons 發、零售及進出口貿易的機透單位數目及就 engaged in wholesaling, retailing and 業人數°此外’ 一九九一年前的數字更包括 importing/exporting of other office machines, 從事像具及固定裝置批發的機構單位數目 appliances and equipment (except furniture and 及就業人數 ° fixtures). Moreover, figures prior to 1991 include
also those engaged in wholesaling of furniture and fixtures.
( 3 ) 由於在一九九 _三年並進行有關統計調 (3) Figure was not available in 1993 because the 査’戶斤以t受有該年白勺數字 ° survey concerned was not conducted in that year.
[]一九九一年前的數字的涵蓋範圍與其後的 [ ] F i g u r e s prior to 1991 are slightly different in 略有不同’因此不可將兩組數字作嚴格比 coverage and therefore are not strictly comparable 較 ° with those for 1991 and onwards.
服務業統計摘要一九九九年 243

圃 1 3 . 2 辦公室器材(傢具及固定裝置除外)經銷商的機_位數目⑴⑵及就業人數丨 >,⑴ Chart 13.2 Number of Establishments'" and Persons Engaged") for Distributors of Office
Machines, Appliances and Equipment (except Furniture and Fixtures)
機構單位數目 就業人數 Number of establishments Number of persons engaged
4 500 45 000
4 000 K*X*X*X*3 40 000
通 - … ^H 圓 … 35 000
2 5 0 0 — … _ • 圓 - - 25 000
f:謹 :賺餘
譯 — m — — m — — m — — 國 — … 誦 1 5 0 0 - - … 圓 圓 圓 麵 國 … - - 1 5 000 1 0 0 0 - … 誦 — — • — — 國 — — 國 — — 圓 - … - 1 0 0 0 0 ^ ^ mm^ ^ ^ ^ ^ 5 0 0 - - - 删 誦 圓 議 隱 … - 5 000 o J _ _ m m _ _ , _ _ _ w m 4 _ , _ ^ m _ _ , _ ^ ^ _ , _ ^ ^ o 1994 1995 1996 1997 1998
^ 機 構 單 位 數 目 就業人數 Number of establishments Number of persons engaged
註釋:(1) 數字是指「進出口辱」(在十二月底的數目) Notes: (1) Figures refer to total number of 和_「批發商及零售商」(在六月底的數目)的 importers/exporters (as at end December); and 總計“ retailers and wholesalers (as at end June).
(2) 數字除包括電腦器材經銷商外’亦包括從事 (2) In addition to distributors of computer equipment, 其他辦公室器材(傢具及固定裝置除外)批 the figures cover also establishments and persons 發、零售及進出口貿易的機構單位數目及就 engaged in wholesaling, retailing and importing/ 業人數 ° exporting of other office machines, appliances and
equipment (except furniture and fixtures).
242 Statistical Digest of the Services Sector 1999

表13.3 電腦硬件及軟件的進出口貨値
Table 13.3 Imports and Exports of Computer Hardware and Software 百萬元 $ million
1989 1990 1991 1992 1993 電腦硬件 Computer hardware
進口 4,853 6,473 7,708 12,115 12,661
Imports (6.9) (33.4) (19.1) (57.2) (4.5) 整體出口 6,824 7,366 8,721 9,749 9,100
Total exports (4,0) (7.9) (18.4) (11.8) (-6.7) 港產品出口 3,949 3,660 3,821 3,370 1,476 Domestic exports (6.1) (-7.3) (4.4) (-11.8) (-56.2) 轉口 2,875 3,706 4,900 6,379 7,624
Re-exports (1.3) (28.9) (32.2) (30.2) (19.5)
電腦軟件 Computer software 進口 508 763 945 1,271 1,582
Imports (31.0) (50.1) (23.9) (34.4) (24.5) 整體出口 393 445 586 827 927
Total exports (5.4) (13.3) (31.5) (41.2) (12.1) 港產品出口 100 87 153 280 300 Domestic exports (-12.5) (-12.7) (76.1) (82.9) (7.2) 轉口 294 358 432 547 626
Re-exports (13.3) (22.1) (20.6) (26.5) (14.5)
1994 1995 1996 1997 1998 電腦硬件 Computer hardware
進口 16,145 20,883 34,505 42,792 42,960
Imports (27.5) (29.3) (65.2) (24.0) (0.4) 整體出口 10,228 13,504 22,634 25,206 28,031
Total exports (12.4) (32.0) (67.6) (11.4) (11.2) 港產品出口 1,372 1,508 504 424 366 Domestic exports (-7.1) (9.9) (-66.6) (-16.0) (-13.5) 轉口 8,855 11,996 22,129 24,783 27,665
Re-exports (16.2) (35.5) (84.5) (12.0) (11.6)
電腦軟件 Computer software 進口 1,903 2,333 2,017 2,259 1,567
Imports (20.2) (22.6) (-13.6) (12.0) (-30.6) 整體出口 893 1,289 1,329 1,232 1,299 Total exports (-3.6) (44.4) (3.0) (-7.3) (5.4)
港產品出口 280 401 384 450 602 Domestic exports (-6.7) (43.0) (-4.1) (17.0) (33.8) 轉口 613 889 944 782 697
Re-exports (45.0) (6.2) (-17.1) (-10.9) 註釋:括號內的數字是與上年比較的變動百分率 ’ Note : Figures in brackets are percentage changes over the
preceding year.
服務業統計摘要一九九九年 279

圓13.3 電腦硬件及軟件的進出口貨値 Chart 13.3 Imports and Exports of Computer Hardware and Software
百萬元
50 000 $ million
40,000 隱 - _
, � ’ � : m A m l l i i l I t 1989 1990 1991 1992 1993 1994 1995 1996 1997 1998
• 進 口 E整體出口⑴
Imports Total expor t s�
註釋:(1) 包括港產品出口及轉口。 Note: (1) Including domestic exports and re-exports.
242 Statistical Digest of the Services Sector 1999
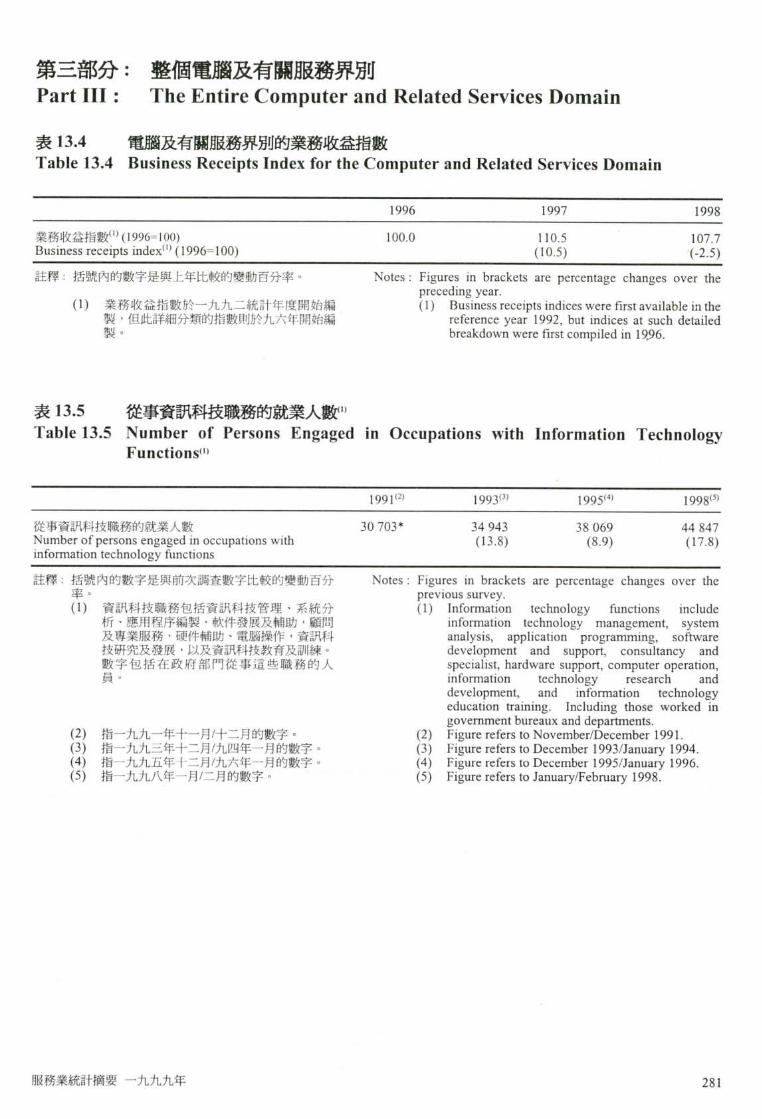
第三部分:整個電腦及有關服務界別
Part III : The Entire Computer and Related Services Domain 表 1 3 . 4 電腦及有關服務界別的業務收益指數 Table 13.4 Business Receipts Index for the Computer and Related Services Domain
^ 1998 業務收益指數⑴(1996=100) 100.0 110.5 107.7 Business receipts index�(1996=100) (10.5) (-2.5) 註釋:括號內的數字是與上年比較的變動百分率° Notes : Figures in brackets are percentage changes over the
preceding year. ( 1 )業務收益指數於一九九二統計年度開始編 (1) Business receipts indices were first available in the
製’但此詳細分類的指數則於九六年開始編 reference year 1992,but indices at such detailed 製 ° breakdown were first compiled in 19.96.
表 1 3 . 5 從事資訊科技職務的就業人數”
Table 13.5 Number of Persons Engaged in Occupations with Information Technology Functions �
1991<2> 1993''' 1 9 9 5 � 1 9 9 8 � 從事資訊科技職務的就業人數 30 703* 34 943 38 069 44 847 Number of persons engaged in occupations with (13.8) (8.9) (17.8) information technology functions 註釋:括號內的數字是與前次調查數字比較的變動百分 Notes : Figures in brackets are percentage changes over the
率 ° previous survey. (1) 資訊科技職務包括資訊科技管理、系統分 (1) Information technology functions include
析、應用程序編製、軟件發展及輔助’顧問 information technology management, system 及專業服務’硬件輔助、電腦操作’資訊科 analysis, application programming, software 技研究及發展,以及資訊科技_教育及訓練� development and support, consultancy and 數字包括在政府部門從事這些職務的人 specialist, hardware support, computer operation, 員 ° information technology research and
development, and information technology education training. Including those worked in government bureaux and departments.
( 2 )指一九九一年 i^一月/十二月的數字� (2) Figure refers to November/December 1991. ( 3 )指一九九三年十二月/九四年一月的數字� (3) Figure refers to December 1993/January 1994. ( 4 )指一九九五年十二月/九六年一月的數字� (4) Figure refers to December 1995/January 1996. ( 5 )指一九九八年一月/二月的數字。 (5) Figure refers to January/February 1998.
服務業統計摘要一九九九年 243

表 1 3 . 6 電腦及有關服務界別的選定最新統計數字 Table 13.6 Selected Up-to-date Statistics on Computer and Related Services Domain
1998 1999 第一季 第二季 第三季 第四季 第一季
Q1 ^ Q3 ^ ^ 機構單位數目(資料處理及製表服務公司) 1 8 0 0 1 7 9 1 1 8 5 8 1 8 8 5 2 1 1 3 Number of establishments (data processing and tabulating services companies) 就業人數(資料處理及製表服務公司) 1 2 4 6 4 1 2 5 9 0 1 4 7 8 6 H 2 6 1 1 3 0 5 0 Number of persons engaged (data processing and tabulating services companies) 業務收益指數(1996=100) 103.1 106.9 109.5 111.4* 96.7
Business receipts index (1996=100)
電腦產品的進出口貨値(百萬元) Imports and exports of computer products ($ million) 電腦硬件 Computer hardware 進口 9,619 10,766 10,771 11,805 8,608
Imports 整體出口 6,156 5,371 6,832 9,672 7,726 Total exports
港產品出口 80 63 93 130 189
Domestic exports 轉口 6,077 5,308 6,739 9,542 7,537 Re-exports
電腦軟件 Computer software 進口 405 421 384 357 399
Imports 整體出口 229 258 320 491 397
Total exports 港產品出口 104 86 130 282 218
Domestic exports 轉口 125 173 190 209 179
Re-exports
242 Statistical Digest of the Services Sector 1999
資料來源 Data Sources 表 資料來源 Table Sources 13.1 - 13.4 政府統計處 13.1-13.4 Census and Statistics Department 13.5 職業訓練局 13.5 Vocational Training Council
其他有關刊物 Further References 就業及空缺統言f(詳細統計表) Employment and Vacancies Statistics (Detailed Tables) 本地生產總値估計 Estimates of Gross Domestic Product 香港統計年干U Hong Kong Annual Digest of Statistics 香港統計月刊 Hong Kong Monthly Digest of Statistics 香港貿易統計 Hong Kong Trade Statistics 資訊科技業人力調査報告’職業訓練局編製 M a n p o w e r Survey Report, Information Technology
Sector, published by the Vocational Training Council 服務行業按季業務收益指數 Quarterly Business Receipts Indices for Service
Industries 就業、空缺及薪金總額按季統計報告 Quarterly Report of Employment, Vacancies and
Payroll Statistics 本地生產總値估計按季報告 Quarterly Report of Gross Domestic Product Estimates
服務業統計摘要一九九九年 243

^ .旅遊、會議及展覽服務 I 4 Tourism, Convention and Exhibition Services 槪要 Highlights 香 港 持 續 爲 亞 洲 其 中 一 個 最 受 歡 迎 的 旅 Hong Kong continues to be one of the most popular 遊地點,也是舉行國際會議和展覽的熱門 tourist and visitor destinations in Asia and a favourite 地方 ° location for hosting international conventions and
exhibitions.
在一九九八年’約有 49 000 人受僱直接 In 1998, some 49 000 people were employed in jobs 向方S客/遊客提供月昆矛务,另有 259 000 人 dedicated to serving visitors/tourists, and another 則 受 僱 於 那 些 有 相 當 比 例 的 顧 客 爲 旅 客 259 000 in businesses which may have a / 遊 客 的 機 構 � considerable proportion of their customers being
visitors/tourists.
一九九八年’訪港旅客消費達 53 1 億元, Receipts from visitors totalled $53.1 billion in 1998, 與八九年比較 ’ i曾力口了 4 8 % ° 九八年訪港 up by 48% when compared with 1989. The number 旅客人數達 960 萬’較八九年的人數多 of incoming visitors reached 9.6 million in 1998, 60% ° 訪 港 旅 客 主 要 來 自 中 國 內 地 和 台 60% more than that in 1989. The mainland of 灣’分別佔九八年訪港旅客人數的 2 7 %和 China and Taiwan are now the two largest sources of 1 9 % � 自 九 四 年 起 ’ 中 國 內 地 已 成 爲 最 重 visitors, accounting for 27% and 19% respectively of 要的訪港旅客來源地 ° the total number of visitors to Hong Kong in 1998.
As from 1994’ the mainland of China has become the most important source of visitors.
一 九 九 八 年 的 旅 客 消 費 較 九 七 年 減 少 了 Compared to 1997, receipts from visitors in 1998 24% ’ 訪港旅客人數亦較九七年的 1 040 shrank by 24%. The number of visitor arrivals also 萬 人 下 降 8 % � 訪 港 旅 客 人 數 下 降 主 要 是 fell,by 8% from 10.4 million in 1997. The decline 由 於 很 多 亞 洲 國 家 受 區 內 經 濟 衰 退 及 貨 in visitor arrivals was mainly attributable to 幣 吃 値 影 響 ’ 以 致 對 旅 遊 的 需 求 顯 著 減 markedly reduced travel demand in many Asian 少 ° economics, amidst the economic setback and
currency depreciation in the region.
按每人平均計算’一九九八年每名旅客在 On a per capita basis, visitor spending also showed a 港的消費亦下跌 18%至 5,544 元 ° 訪港旅 decUne,byanaverageof 18%to$5,544 in 1998. A 客 縮 短 逗 留 時 間 及 旅 遊 業 有 關 的 服 務 收 shorter length of stay by visitors to Hong Kong and 費普遍下調等因素’是導致人均消費疲弱 the general reduction in the prices of tourism-related 白勺主要原因� services were the key reasons behind the lacklustre
per capita spending.
服務業統計摘要一九九九年 243

過去數年來’訪港旅客的平均在港逗留時 The average length of stay of visitors to Hong Kong 間持續下降。一九九八年旅客平均逗留時 has slipped over the years. In 1998, the average 間爲 3.4 晚’較九五年、九六年及九七年 length of stay was 3.4 nights, compared with 3.9 的 3.9 晚、3.7 晚及 3.6 晚爲低。 nights, 3.7 nights and 3.6 nights in 1995,1996 and
1997 respectively.
按消費模式分析’購物消費仍然佔訪港旅 Analysed by expenditure pattern, expenditure on 客總消費的最大咅 分“一九九;^\年’平均 shopping continued to account for the largest share of 每名旅客在香港的購物消費爲 2,700 元 ’ total visitor spending in Hong Kong. A visitor on 佔 他 們 在 港 期 間 總 支 出 的 4 9 % �酒店脹單 average spent $2,700 on shopping in Hong Kong, or 和膳食分別佔 28%和 13o/o ° 490/0 of his total expenditure here in 1998. Hotel
bills and meals took up another 28% and 13%.
爲鼓勵旅客來港’政府於一九九八年中實 In a move to boost visitor arrivals, the Government 行多項方便旅客的措施‘包括簡化台灣旅 implemented several facilitation measures in mid-客到港旅遊的入境手續’增加中國內地居 1998, which include simplifying the entry 民 來 港 旅 遊 的 名 額 等 ° 部 分 由 於 上 述 措 requirements for Taiwanese visitors to Hong Kong, 施’旅遊服務的情況在九八年下半年有明 expanding the quota for residents in the mainland of 顯改善。 China to visit Hong Kong for sight-seeing, etc.
Partly contributed to these, the tourism showed significant recovery in the second half of 1998.
香 港 的 酒 店 在 一 九 九 八 年 每 日 平 均 提 供 Hotels in Hong Kong provided a daily average of 32 000 個房間。雖然訪港旅客人數下降, 32 000 guest rooms in 1998. Despite the decline in 九 乂\ 年白勺酒店入住率維持在 76% ‘與九七 visitor arrivals, hotel room occupancy rate stabilised 年相同。 at 76% in 1998,unchanged from the level in 1997.
一 九 九 八 年 ’ 本 港 居 民 的 離 境 人 次 爲 In 1998, the number of departures made by Hong 4 760 萬’較九七年:t曾力口 14% ° 中國內地 Kong residents totalled to 47.6 million, 14% more 仍然是本港居民的主要夕 f 遊地點 ° than 1997. The mainland of China continued to be
the predominant destination.
一九九八年’超過 170 個會議和 50 個展 Over 170 conventions and 50 exhibitions with 覽在香港舉行’並獲國際參與 °每項活動 international participation were held in Hong Kong in 的 平 均 出 席 人 數 分 別 爲 200 名和 3 100 1998. The average number of delegates for each 名 ° event were about 200 and 3 100 respectively.
242 Statistical Digest of the Services Sector 1999

旅遊、會議及展覽服務界別的 Coverage of Tourism, Convention 齒蓋範圍 and Exhibition Services Domain 就編製及分析統計數字的角度而言’「旅 In the context of statistical compilation and analysis, 遊、會議及展覽月 S 務」並非一個月昆務「行 "tourism, convention and exhibition services" is not 業」’而是一個「月艮務界別」 ° regarded as a service "industry". Instead, it is a
"service domain".
月 S務界別有別於服務行業’它包括由不同 A service domain differs from a service industry in 行 業 所 從 事 而 與 一 個 主 題 相 關 的 經 濟 活 that a domain comprises those parts of economic 動部分。提供旅遊、會議及展覽服務的機 activities straddling different industries but are 構單位涉及多種不同的經濟活動,大致可 somehow related to a common purpose. 分爲下歹IJ 三糸且: Establishments involved in the provision of tourism
related services and convention and exhibition services fall into a wide range of economic activities, which can broadly be classified into the following three groups :
I. 業 務 與 旅 遊 界 別 有 密 切 關 係 的 機 構 I. Establishments closely related to the tourism 單位: domain :
酒店及旅行社 Hotels and travel agents
I I . 部 分 業 務 與 旅 遊 界 別 有 關 的 機 構 單 n . Establishments partly related to the tourism 位: domain : 餐館、零售商、運輸服務營辦商及其 Restaurants, retailers, transport operators and 他爲訪港旅客提供服務的機構 other service providers serving visitors
I I I . 業 務 與 會 議 及 展 覽 服 務 界 gij 有密切 III. Establishments closely related to convention and 關係的機構單位 • exhibition services domain : 會議及展覽主辦機構 Convention and exhibition organizers
有關服務界別定義的詳情’請參閱「槪念 For more details on the definition of a service 及 方 法 」 音 分 的 介 紹 段 落 � domain, please refer to the introductory paragraphs in
the section "Concepts and Methods".
服務業統計摘要一九九九年 243

主要統計數字 Key Statistics I . 酒店及旅行社 Hotels and Travel Agents
本港居民 訪 港 旅 客 人 數 離 港 人 數
年 機搆單位數目⑴ 就業人數⑴ 業 務 收 益 指 數 ( 千 人 ) (千人) Year Number of Number of Business Visitor a r r iva l s� •� Hong Kong establishments''' persons engaged'" receipts index< ' (thousands) resident (1996=100) departures (thousands)
1989 [3 073] [49 838] - 5 985 21 941 1990 [3 198] [51 514] - 6 581 23 838 1991 3 358 54 820 - 6 795 26319 1992 3 291 55 128 - 8 011 28 945 1993 3 022 57 613 - 8 938 30 660 1994 3 261 57 835 - 9 331 32 587 1995 3 189 56 777 - 10 200 34 443 1996 3 215 57 972 100.0 11 703 37 140 1997 3 596 58 155 90.7 10 406 41 605 1998 2 635 49 089 55.4 9 575 47 594
註釋:(1) 數字是指「酒店及旅舍」(在六月底的數 Notes : (1) Figures refer to total number of hotels and 目)和「旅行社及票務代理」(在三月底的 boarding houses (as at end June); and travel 數目)的總計 ° agents and airline ticket agents (as at end
March). ( 2 )業務收益指數於一九九二統計年度開始 (2) Business receipts indices were first available
編製,但此詳細分類的指數則於九六年 m the reference year 1992,but indices at 開始編製� such detailed breakdown were first compiled
in 1996. (3) 包括來自中國內地的過境旅客及海員。 (3) Including transients and seamen from the
mainland of China. (4 )由一九九五年"1""一月九日起’數字包括 (4) Since 9 November 1995, Macanese arrivals
從澳門來港的澳門訪港旅客� from Macau included. []一九九一年前的數字的涵蓋範圍與其後 [ ] F i g u r e s prior to 1991 are slightly different in
的略有不同’因此不可將兩組數字作嚴 coverage and therefore are not strictly 格比較 ° comparable with those for 1991 and
onwards.
252 Statistical Digest of the Services Sector 1999

11. 餐館、零售商、運輸服務營辦商及其他爲訪港旅客提供服務的機構
Restaurants, Retailers, Transport Operators and Other Service Providers Serving Visitors
百萬元(另有註明除外) $ million, unless otherwise specified
訪港旅客消費
年 機構單位數目(l>“2>’<3) •⑷ 就 業 人 ( 酒 店 賬 單 除 外 )
Year Number of Number of persons Visitor spending�.(*•) e s t a b l i s h m e n t s � . . � e n g a g e d ' " ' ( e x c l u d i n g hotel bills) 1989 [25 889] [242 565] 24,564 1990 [27 412] [258 573] 26,496 1991 - - 27,642 1992 30 506 282 524 33,769 1993 - - 42,338 1994 30 122 282 582 44,892 1995 28 550 274 216 51,528 1996 29 876 280 142 56,904 1997 29 579 284 808 48,710 1998 27 739 258 544 38,222
註釋:(1) 數字是指「零售商及餐館」(在六月底的 Notes : (1) Figures refer to total number of retailers and 數和「遊樂場」(無三角®的數目)的 restaurants (as at end June); and amusement 總計 ° parks (as at end March).
( 2 )包括衣物及鞋類、攝影器材、電器、古 (2) Including establishments engaged in retail of 玩、玻璃製品、禮品及紀念品、珠寶首 clothing and footwear, cameras and 飾、旅行袋、鐘錶、化粧品和百貨公司 photographic equipment, electrical goods, 等零售機構單位’以及飮食場所和遊樂 antiques, glassware, gifts and souvenirs, 場’所有這些行業的機構單位數目及就 jewellery and travel goods, watches and 業人數’不論爲訪港旅客服務與否’都 cosmetics; department stores; eating and 包括在內 � drinking places; and amusement parks.
The total number of establishments and persons engaged in these industries are presented here, irrespective of whether establishments are serving tourists or not.
( 3 )由於運輸服務營辦商 (以的士爲主 )的詳 (3) Not including transport operators (mainly 細分類數字沒有提供’因此不包括在 taxis) because estimates for such detailed 內� breakdown are not available.
( 4 )由於在一九九一年及九三年並沒有進行 (4) Figures were not available m 1991 and 1993 有關統計調查’所以沒有該兩年的數 because the survey concerned were not 字 o conducted in those years.
(5) 以訪港旅客的消費總計’再扣除酒店賬 (5) Approximated by visitors' total local 單計算 � spending less that covered by hotel bills.
(6) 一九九三年以前的數字不包括來自中國 (6) Figures before 1993 exclude spending of 內地訪港旅客的消費’因此不可與九三 visitors from the mainland of China, and 年及以後&^數字丨^^嚴格比叙 ° therefore are not strictly comparable with
those for 1993 and onwards. [ ]一九九一年前的數字的涵蓋範圍與其後 [ ] F i g u r e s prior to 1991 are slightly different in
的略有不同’因此不可將兩組數字作嚴 coverage and therefore are not strictly 比is ° comparable with those for 1991 and
onwards.
服務業統計摘要一九九九年 243

III.會議及展覽主辦機構 Convention and Exhibition Organizers
年 在香港舉行的會議及展覽數目⑴ Year Total number of conventions and exhibitions h e l d � 1989 317 1990 272 1991 302 1992 315 1993 348 1994 241 1995 331 1996 353 1997 355 1998 233
註釋:(1) 統計數字是以香港旅遊協會已知資料爲 Note : (1) Statistics are based on information known to 根據,不包括祇有香港代表出席的本地 the Hong Kong Tourist Association and do 會議或展覽 ° not include events attended only by Hong
Kong delegates.
IV.整個旅遊、會議及展覽服務界別 The Entire Tourism, Convention and Exhibition Services Domain
年 業務收益指數⑴(1996=100) Year Business receipts index�(1996=100) 1996 100.0 1997 88.2 1998 63.1
註釋:(1)業務收益指數於一九九二統計年度開始 Note: (1) Business receipts indices were first available 編製’但此詳細分類的指數則於九六年 in the reference year 1992, but indices at such 開女台編製� detailed breakdown were first compiled in
1996.
242 Statistical Digest of the Services Sector 1999

槪念及方法 Concepts and Methods 就編製及分析統計數字的角度而言’旅遊服務並 In the context of statistical compilation and analysis, 非一個月艮務行業’而是一個月艮務界別 ° tourism is not regarded as a service industry but a
service domain.
服務界別有別於服務行業’它包括由不同行業 A service domain differs from a service industry in 所從事而與一個主題相關的經濟活動部分° 一個 that a domain comprises those parts of economic 與某服務界別關係密切的行業內的所有機構單 activities straddling different industries but are 位都可能與該服務界別有關。但在另外一些情況 somehow related to a common purpose. It may 下’只有部分的機構單位或甚至只是部分機構單 include all activities carried out by all establishments 位的部分經濟活動’是與該界別有關的° in a service industry that is closely related to the
domain. In some other cases, however, only a portion of the establishments in an industry or even only part of the establishments' activities is related to the domain.
提供旅遊有關服務的機構單位’涉及極多元化 Establishments involved in the provision of tourism 的,經濟活動’包括空運業、酒店業、食肆、水路 related services fall into a wide range of economic 運輸業、陸路運輸業、零售業及其他有關服務行 activities, straddling the air transport, hotels, 業“可是’這些機構單位的經濟活動’亦並非全 restaurants, water transport, land transport, retail and 部與旅遊服務有關°與旅遊服務有密切聯繁的行 many other related service industries. Yet not all 業’如旅行社和酒店’機構單位的所有業務活 activities carried out by establishments in these 動’實際上是與旅遊服務有關的。至於其他的行 industries are related to tourism. For those 業(例如零售、食肆及的士營辦商)’其中只有小 industries that are very closely related to tourism 部分的機構單位提供旅遊有關服務’而這部分亦 such as travel agents and hotels, practically all 祇佔整體的一小部分’因爲此等機構單位同時爲 activities carried out by the establishments involved 遊客及本地顧客提供服務。很多時’旅遊服務佔 are related to tourism. In other cases (such as retail, 一個行業的業務活動的比重是很難掌握’因此’ restaurants and taxi operators), only a relatively 並沒有該等比重的正式估計數字°所以,也沒有 minor portion of the establishments provide tourism 機構單位數目、就業人數、業務收益及增加價値 related services and such services may account for a 的準確估計數字以計算旅遊界別的重要性。 small portion of the total activities of those
establishments as they serve both visitors and local customers concurrently. Since it is extremely difficult in most cases to ascertain what proportion of the total activities of an industry is attributable to tourism, no official estimates are available for such proportions. There is therefore no accurate estimate of the prominence of the tourism domain, measured in terms of number of establishments, persons engaged, business receipts and value added.
計算在旅遊、會議及展覽服務界別中’旅遊服務 To compile business receipts index for the tourism 部分的業務收益指數,統計處會利用多個資料來 component in the tourism, convention and exhibition 源。首先’對於那些主要以旅客爲服務對象的行 services domain, multiple data sources are used. 業(包括旅行社、票務代理及酒店)’會直接從有 For industries which primarily serve visitors
服務業統計摘要一九九九年 243

關機構單位搜集業務收益數據。至於其他同時爲 (including travel agents, air ticket agents and hotels), 大量本港居民提供服務的行業(例如酒樓食肆� business receipts data are collected directly from 零售店及運輸服務營辦商)’如採用該等行業的 establishments in the industries concerned. As for 總體收益數據’則會大幅高估與旅遊服務有關的 other industries which also serve a good number of 業務收益,但有關商號的經營者多不能提供有關 local residents (such as restaurants, retailers and 的收益細分資料°所以’有關資料需直接從旅客 transport operators), using the total receipts data of 而非從服務提供者捜集°現時,香港旅遊協會定 the entire industries will substantially over-estimate 期進行一個訪港旅客問卷調查捜集該等資料“ the tourism-related receipts, but the operators of the
businesses often cannot provide the relevant receipts breakdown. Therefore, such data have to be collected from the visitors instead of the service providers. Those data are currently collected by the Hong Kong Tourist Association (HKTA) through a regular Visitors Survey.
言 司 D e f i n i t i o n of terms
機構單位是指在單一擁有權或控制權(即單一 An establishment is defined as an economic unit (i.e. 公司名義)下,在單一地點從事一種或主要從事 a unit engaged in the production of goods or services) 一種經濟活動(即生產貨物或提供服務)的經濟 which engages, under a single ownership or control 單位 ° (i.e. under a single company name), in one or
predominantly one kind of economic activity at a single physical location.
酒店入住率是根據每日可供出租房間數目編 Hotel room occupancy rate is compiled based on 製’但不包括正在進行維修或翻新的房間� daily number of rooms available for sale only.
Rooms under repair or being refurbished are excluded.
就業人數包括積極參與機構單位工作的在職東 Number of persons engaged in an establishment 主及股東;在統計曰期受僱於機構單位的全職僱 include working proprietors and partners actively 員’包括長期或臨時聘用的’無論這些僱員正在 engaged in the work of the establishment; full-time 開工或因事假或者病假而暫時缺勤;及在統計日 employees paid by the establishment on the survey 期工作三小時或以上的兼職僱員和無酬家屬幫 reference date, both permanent and temporary, who X ° are either at work or on vacation or sick leave; and
part-time employees and unpaid family workers working three hours or more on the survey reference date.
242 Statistical Digest of the Services Sector 1999

香港齊店分齋激度’是由香港旅遊協會根據一些 The Hong Kong Hotel Classification System is 數量性和質量性的指標來訂定酒店類別°這些質 maintained by HKTA according to a combination of 量性指標包括坐落地點、設施等等因素;至於數 quantitative and qualitative indicators. The 量性指標則包括房租水平和員工/房數比例。每年 qualitative indicators include such factors as location, 年初’香港旅遊協會會按需要修訂酒店分類表。 facilities,etc., while the quantitative indicators
include room tariff level and staff/room ratio. The list will be revised as necessary at the beginning of each year.
訪港旅客是指經辦理出入境手續抵港的非香港 Visitor arrivals refer to arrivals by all non-Hong 居民 ° Kong residents through immigration formalities.
服務業統計摘要一九九九年 243

統計圃表 Statistical Tables and Charts 第一部分:酒店及旅行社 Part I : Hotels and Travel Agents 表 1 4 . 1 酒店及旅行社的機構單位數目、就業人數及業務收益指數 Table 14.1 Number of Establishments and Persons Engaged and Business Receipts Index
for Hotels and Travel Agents
1989 1990 1991 1992 1993 機構單位數目⑴ [ 3 0 7 3 ] [ 3 1 9 8 ] 3 3 5 8 3 2 9 1 3 0 2 2 Number of establishments� (12.2) (4.1) (5.0) (-2.0) (-8.2)
就業人數(” [ 4 9 8 3 8 ] [ 5 1 5 1 4 ] 5 4 8 2 0 5 5 1 2 8 5 7 6 1 3 Number of persons engaged'" (10.7) (3.4) (6.4) (0.6) (4.5)
業務收益指數(2>( 1996= 100) - - - - -Business receipts index*^' (1996 = 100) - - - - -
1 9 ^ ^ 19% 1997 1998 機構單位數目⑴ 3 2 6 1 3 1 8 9 3 2 1 5 3 5 9 6 2 6 3 5 Number of establishments� (7.9) (-2.2) (0.8) (11.9) (-26.7)
就業人數⑴ 5 7 8 3 5 5 6 111 5 7 9 7 2 5 8 1 5 5 4 9 0 8 9 Number of persons e n g a g e d � (0.4) (-1.8) (2.1) (0.3) (-15.6)
業務收益指數(2) (1996= 100) - - 100.0 90.7 55.4 Business receipts index'^* (1996 = 100) - - - (-9.3) (-38.9) 註釋:括號內的數字是與上年比較的變動百分率 ° Notes : Figures in brackets are percentage changes over the
preceding year. (1) 數字是增「酒店及旅舍」(在六月底的數目) (1) Figures refer to total number of hotels and
和� | g行社及票務代理」(在三月底的數目) boarding houses (as at end June); and travel 的總計 ° agents and airline ticket agents (as at end March).
( 2 ) 業務收益指數於一九九二統計年度開始編 (2) Business receipts indices were first available in 製’但此詳細分類的指數則於九六年開始編 the reference year 1992, but indices at such 製� detailed breakdown were first compiled in 1996.
[ ]一九九一年前的數字的涵蓋範圍與其後的 [ ] F i g u r e s prior to 1991 are slightly different in 略有不同’因此不可將兩組數字作嚴格比 coverage and therefore are not strictly 較� comparable with those for 1991 and onwards.
242 Statistical Digest of the Services Sector 1999

圓 1 4 . 1 酒店及旅行社的機構單位數目⑴及就業人數<”
Chart 14.1 Number of Establishments� and Persons Engaged� for Hotels and Travel Agents
機構單位數目 就業人數 Number of establishments Number of persons engaged
4 000 1 80 000 3 500 降 辨 70 000
_ — — — — — • — — — — _ — 60 000
通 … _ — … 議 - - 50000
2 _ … … - _ - _ . _ - - 靨 - - - 删
1500— … - _ - - … … 隱 … • … - - • … 3 。 。 0 0
1。。。…隱一 _ -一 - _一 _ …圓…-_.- -- —
5 � : : _ t t t t t t t _ —:�• 1991 1992 1993 1994 1995 1996 1997 1998
— 機 構 單 位 數 目 — 就 業 人 數 Number of establishments Number of persons engaged 註釋:(1) 數字是指「酒店及旅舍」(在六月底的數目) Note: (1) Figures refer to total number of hotels and
和「旅行社及票務代理」(在三月底的數目) boarding houses (as at end June); and travel 的總計� agents and airline ticket agents (as at end March).
服務業統計摘要一九九九年 243

表 1 4 . 2 訪港旅客 Table 14.2 Visitor Arrivals
1989 1990 1991 1992 1993 訪港旅客人數⑴’ 千人) 5 985 6 581 6 795 8 011 8 938 Number of visitor arrivals�’�(thousands) (-3.0) (10.0) (3.3) (17.9) (11.6)
訪港旅客訪港目的(%) Visitor arrivals by purpose of visit* ' (%) 度假 56 55 59 56 54 Vacation 商務/會議 25 25 23 28 31 Business/meetings 探訪親友 3 3 4 5 5 Visiting friends/relatives 途經香港 14 15 11 9 9 En route 其他目的 2 2 3 2 2 Other purposes
訪港旅客所使用交通模式⑴’(2> (%)
Visitor arrivals by mode of transport�• 口)(%) 空 77.2 75.7 72.7 70.1 68.0 By air 陸 17.4 18.7 20.9 22.9 24.6 By land
海 5.4 5.6 6.5 7.0 7.4 By sea
註釋:括號內的數字是與上年比較的變動百分率° Notes : Figures in brackets are percentage changes over the preceding year.
(1) 包括來自中國內地的過境旅客及海員。 (1) Including transients and seamen from the mainland of China.
( 2 )由一九九五年 " I^一月九日起’數字包括從澳 (2) Since 9 November 1995,Macanese arrivals from 門來港的澳門訪港旅客” Macau included.
(3) 一九九三年以前的數字不包括來自中國內 (3) Figures before 1993 exclude visitors from the 地的訪港旅客•因此不可與九三年及以後的 mainland of China, and therefore are not strictly 數字作嚴格t匕較” comparable with those for 1993 and onwards.
296 Statistical Digest of the Services Sector 1999

表14.2 (續) 訪港旅客 Table 14.2 (Cont'd.) Visitor Arrivals
^ ^ 1997 1998
訪港旅客人數(i>,(2>(千人) 9 3 3 1 1 0 2 0 0 1 1 7 0 3 1 0 4 0 6 9 5 7 5 Number of visitor arrivals�’ (thousands) (4.4) (9.3) (14.7) (-11.1) (-8.0)
訪港旅客訪港目的(%) Visitor arrivals by purpose of visit�(%)
度假 58 55 58 61 49 Vacation 商務/會議 2 9 3 0 2 9 2 6 3 2 Business/meetings 探訪親友 5 5 6 7 9 Visiting friends/relatives 途經香港 6 8 5 5 8 En route 其他目的 2 2 1 2 1 Other purposes
訪港旅客所使用交通模式⑴’ (%) Visitor arrivals by mode of transport'"' (%)
空 67.5 66.9 64.4 60.9 58.2 By air 陸 23.2 22.8 21.9 24.7 27.5 By land
海 9.3 10.3 13.8 14,4 14.3 By sea
註釋:括號內的數字是與上年比較的變動百分率� Notes : Figures in brackets are percentage changes over the preceding year.
(1) 包括來自中國內地的過境旅客及海員° (1) Including transients and seamen from the mainland of China.
(2)由一九九五年"I"一月九曰起’數字包括從澳 (2) Since 9 November 1995, Macanese arrivals from 門來港的澳門訪港旅客� Macau included.
(3) 一九九三年以前的數字不包括來自中國內 (3) Figures before 1993 exclude visitors from the 地的訪港旅客’因此不可與九三年及以後的 mainland of China, and therefore are not strictly 數字作嚴格比較� comparable with those for 1993 and onwards.
服務業統計摘要一九九九年 291

表14.3 訪港旅客消費⑴ Table 14.3 Visitor Spending*"
百萬元(另有註明除外) $ million, unless otherwise specified
1989 1990 1991 1992 1993 訪港旅客消費總許 35,843 37,978 38,301 46,699 58,303 Total visitor spending (10.3) (6.0) (0.8) (21.9) -
酒店賬單 11,279 11,482 10,659 12,930 15,966
Hotel bills (21.3) (1.8) (-7.2) (21.3) -觀光 672 810 916 1,011 1,585
Tours (-14.4) (20.5) (13.0) (10.3) -宜他消費 23,891 25,686 26,726 32,758 40,753
Other spending (6.6) (7.5) (4.0) (22.6) -購物 18,148 19,361 20,079 24,802 29,609
Shopping (3.4) (6.7) (3.7) (23.5) -酒店外瞎食 3,429 4,092 4,114 5,085 7,380
Meals outside hotels (17.2) (19.3) (0.5) (23.6) -娛樂 831 839 769 748 1,174
Entertainment (16.8) (1.0) (-8.3) (-2.7) -雜項 1,483 1,394 1,763 2,124 2,590
Miscellaneous (21.2) (-6.1) (26.5) (20.4) -
訪港旅客每人平均消費(元) 6,686 6,401 6,349 6,684 6,684 Per capita visitor spending ($) (15.0) (-4.3) (-0.8) ^ ^
1994 1995 1996 1997 1998 訪港旅客消費總計 62,512 72,940 82,462 69,946 53,079 Total visitor spending (7.2) (16.7) (13.1) (-15.2) (-24.1)
酒店脹單 17,620 21,412 25,558 21,236 14,857
Hotel bills (10.4) (21.5) (19.4) (-16.9) (-30.0) 觀光 1,805 2,139 2,682 2,031 1,779
Tours (13.9) (18.5) (25.4) (-24.3) (-12.4) 甘他消費 43,087 49,389 54,222 46,679 36,443
Other spending (5.7) (14.6) (9.8) (-13.9) (-21.9) 購物 32,452 37,068 40,850 34,416 26,023
Shopping (9.6) (14.2) (10.2) (-15.8) (-24.4) 酒店外瞎食 7,550 8,354 9,152 8,339 6,715 Meals outside hotels (2.3) (10.6) (9.6) (-8.9) (-19.5) 娛樂 993 1,512 1,343 1,064 990
Entertainment (-15.5) (52.3) (-11.2) (-20.8) (-7.0) 雜項 2,093 2,455 2,876 2,860 2,715 Miscellaneous (-19.2) (17.3) (17.2) (-0.6) (-5.1)
訪港旅客每人平均消費(元) 6,699 7,151 7,046 6,722 5,544 Per capita visitor spending ($) ^ ^ (-1.5) (-4.6) (-17.5) 註釋:括號內的數字是與上年比較的變動百分率° Notes : Figures in brackets are percentage changes over the
preceding year. (1) 一九九三年以前的數字不包括來自中國內 (1) Figures before 1993 exclude spending of visitors
地訪港旅客的消費’因此不可與九三年及以 from the mainland of China, and therefore are not 後 的 數 字 作 嚴 較 � strictly comparable with those for 1993 and
onwards.
298 Statistical Digest of the Services Sector 1999

圓 1 4 . 2 訪港旅客消費⑴ Chart 14.2 Visitor Spending "
訪港旅客消費(百萬元) 訪港旅客每人平均消費(元) Visitor spending ($ million) Per capita visitor spending ($)
100,000 10,000
90,000 9,000 80,000 8,000 70,000 _ _ _ _ . • - - - 7,000 60,000 6,000
50,000 —— 5,000 40,000 - … … - - — 4 , 0 0 0 30,000 ^ ^ ^ • 3,000
1989 1990 1991 1992 1993 1994 1995 1996 1997 1998 ••••訪港旅客酒店張單及観光消費 I : I訪港旅客其他消費
• Visitor spending on hotel bills and tours Other visitor spending 訪港旅客消費總計 - - -訪港旅客每人平均消費 Total visitor spending Per capita visitor spending
註釋:(1) 一九九三年以前的數字不包括來自中國內 Note: (1) Figures before 1993 exclude spending of visitors 地訪港旅客的消費’因此不可與九三年及以 from the mainland of China, and therefore are not 後的數字作嚴格比較� strictly comparable with those for 1993 and
onwards.
表�4 .4 訪港旅客平均留港時間
Table 14.4 Average Length of Stay of Visitors 晚
Nights 1989 1990 1991 1992 1993
平均留港時間⑴ 3 . 4 3 . 3 3 . 4 3 . 4 3 . 8 Average length of s t a y �
1994 1995 1996 1997 1998 平均留港時間⑴ 3 . 9 3 . 9 3 . 7 3 . 6 3 . 4 Average length of stay''' 註釋:(1) 一九九三年以前的數字不包括來自中國內 Note: (1) Figures before 1993 exclude visitors from the
地的訪港旅客’因此不可與九三年及以後的 mainland of China, and therefore are not strictly 數字fl嚴格比較 ° comparable with those for 1993 and onwards.
服務業統計摘要一九九九年 243

表14.5 酒店統計數字 Table 14.5 Hotel Statistics
1989 1990 1991 1992 1993 平均每日可供出租房間數目(I) 2 4 3 2 4 2 6 0 6 9 2 8 6 4 1 3 1 6 5 8 3 2 5 4 2 Average number of rooms available for sale per (16.1) (7.2) (9.9) (10.5) (2.8) d a y �
甲級高價酒店 7 342 8 617 9 340 9 490 9 668
High tariff A hotels (34.6) (17.4) (8.4) (1.6) (1.9) 乙級高價酒店 1 2 1 1 7 1 2 4 3 9 1 2 9 0 5 1 3 0 3 9 1 2 5 4 1 High tariff B hotels (6.5) (2.7) (3.7) (1.0) (-3.8) 中價酒店 3 938 4 088 5 368 7 949 9 066
Medium tariff hotels (23.7) (3.8) (31.3) (48.1) (14.1) 旅舍及賓館 927 925 1 028 1 180 1 267 Hostels and guest houses (-1.7) (-0.2) (11.1) (14.8) (7.4)
平均每日實際入住房間數目(2) 19 310 20 495 21 599 26 098 28 294 Average number of rooms occupied per d a y � (0.6) (6.1) (5.4) (20.8) (8.4)
甲級高價酒店 5 6 2 9 6 3 6 7 6 7 3 8 7 3 5 6 7 7 8 1 High tariff A hotels (16.0) (13.1) (5.8) (9.2) (5.8) 乙級高價酒店 9 8 4 1 1 0 2 4 0 1 0 0 9 4 1 1 2 7 0 1 1 3 4 7 High tariff B hotels (-6.4) (4.1) (-1.4) (11.7) (0.7) 中價酒店 3 043 3 094 4 006 6 509 8 057
Medium tariff hotels (2.7) (1.7) (29.5) (62.5) (23.8) 旅舍及賓館 191 794 761 963 1 109 Hostels and guest houses (-7.4) (-0.4) (-4.2) (26.5) (15.2)
酒店入住率(%) 79 79 75 82 87 Hotel room occupancy rate (%) (-14.1) (#) (-5.1) (9.3) (6.1)
甲級高價酒店 7 7 7 4 7 2 7 8 8 0 High tariff A hotels (-13.5) (-3.9) (-2.7) (8.3) (2.6) 乙級高價酒店 81 82 78 86 90 High tariff B hotels (-12.0) (1.2) (-4.9) (10.3) (4.7) 中價酒店 77 76 75 82 89 Medium tariff hotels (-17.2) (-1.3) (-1.3) (9.3) (8.5) 旅舍及賓館 86 86 74 82 88 Hostels and guest houses (-5.5) (#) (-14.0) (10.8) (7.3)
註釋:括號內的數字是與上年比較的變動百分率 “ Notes : Figures in brackets are percentage changes over the preceding year.
(1) 所有數據來自香港旅遊協會每年六月及十 � Data are obtained from the bi-annual Hotel 二月進行的會員酒店問卷調查°於此期間可 Survey conducted by the Hong Kong Tourist 供出租房間數目如有變動已相應作出調 Association in June and December each year 整 ° among member hotels, hostels and guest houses.
Adjustments have been made to reflect changes in number of rooms available in interim period.
(2) 入住數字來自香港旅遊協會按月進行的會 (2) Occupancy figures are obtained from monthly 員酒运問卷調查 ° returns of member hotels, hostels and guest
houses of the Hong Kong Tourist Association. # 表示變動百分率在增減0.05%以內° # Denotes change within ±0.05%.
300 Statistical Digest of the Services Sector 1999

表 1 4 . 5 (繽) 酒店統計數字 Table 14.5 (Cont'd.) Hotel Statistics
1994 1995 1996 1997 1998 平均每日可供出租房間數目(i> 3 2 5 2 3 3 2 0 8 3 3 2 4 7 4 3 2 1 9 8 3 2 4 1 2 Average number of rooms available for sale per (-0.1) (-1.4) (1.2) (-0.8) (0.7) d a y �
甲級高價酒店 1 0 6 7 7 1 0 0 6 6 9 7 1 0 9 5 3 2 9 2 9 4 High tariff A hotels (10.4) (-5.7) (-3.5) (-1.8) (-2.5) 乙級高價酒店 11 606 11 704 12 137 12 212 12 646 High tariff B hotels (-7.5) (0.8) (3.7) (0.6) (3.5) 中價酒店 8 973 9 043 9 130 8 740 8 736 Medium tariff hotels (-1.0) (0.8) (1.0) (-4.3) (#) 旅舍及賓館 1 2 6 7 1 2 7 0 1 4 9 7 1 7 1 4 1 7 3 6 Hostels and guest houses (#) (0.2) (17.9) (14.5) (1.2)
平 均 每 日 實 際 入 住 房 間 數 目 2 7 6 3 0 2 7 2 0 8 2 8 6 4 5 2 4 5 3 6 2 4 5 0 9 Average number of rooms occupied per day® (-2.3) (-1.5) (5.3) (-14.3) (-0.1)
甲級高價酒店 8 742 8 156 8 343 7 132 6 500 High tariff A hotels (12.4) (-6.7) (2.3) (-14.5) (-8.9) 乙級高價酒店 1 0 1 8 5 1 0 3 6 6 1 1 0 1 4 9 7 7 6 1 0 2 6 9 High tariff B hotels (-10.2) (1.8) (6.3) (-11.2) (5.0) 中價酒店 7 602 7 600 8 014 6 326 6 549 Medium tariff hotels (-5.6) (#) (5.5) (-21.1) (3.5) 旅舍及賓館 1 101 1 086 1 274 1 302 1 191 Hostels and guest houses (-0.7) (-1.4) (17.3) (2,2) (-8.5)
酒店入住率(%) 85 85 88 76 76 Hotel room occupancy rate (%) (-2.3) (#) (3.5) (-13.6) (#)
甲級高價酒店 82 81 86 75 70 High tariff A hotels (2.5) (-1.2) (6.2) (-12.8) (-6.7) 乙級高價酒店 88 89 91 80 81 High tariff B hotels (-2.2) (1.1) (2.2) (-12.1) (1.3) 中價酒店 85 84 88 72 75 Medium tariff hotels (-4.5) (-1.2) (4.8) (-18.2) (4.2) 旅舍及賓館 87 86 85 76 69 Hostels and guest houses (-1.1) (-1.1) (-1.2) (-10.6) (-9.2)
註釋:括號內的數字是與上年比較的變動百分率° Notes ; Figures in brackets are percentage changes over the preceding year.
(1) 所有數據來自香港旅遊協會每年六月及十 � Data are obtained from the bi-annual Hotel 二月進行的會員酒店問卷調査。於此期間可 Survey conducted by the Hong Kong Tourist 供出租房間數目如有變動已相應作出調 Association in June and December each year 整‘ among member hotels, hostels and guest houses.
Adjustments have been made to reflect changes in number of rooms available in interim period.
(2) 入住數字來自香港旅遊協會按月進行的會 (2) Occupancy figures are obtained from monthly 員酒店問卷調查 ° returns of member hotels, hostels and guest
houses of the Hong Kong Tourist Association. # 表示變動百分率在增減0 05%以內。 # Denotes change within ±0.05%.
服務業統計摘要一九九九年 301

圓14.3 可供出租房間數目⑴及酒店入住率
Chart 14.3 Number of Hotel Rooms Available� and Hotel Room Occupancy Rate
平均每日可供出租房間數目
Average number of rooms 酒店入住率(%) available for sale per day Hotel room occupancy rate (%)
50 000 100
45 000 -_ : - 90
40 000 80
35 000 70
Ann H H PPHI • • JMH <11 IIIII1 - • — — — — — — — — — — — — — — — — — — — — — — — — - - — — — — — - — — — - — - - - - — - — — — — — — - - —- f^i I
25 000 - 圖 … - ---- …一 —— ---50
20 000 — 麵 — 一 — — ~ ~ — — — 一 - 40
15 000 - - - 30
10 000 - - rrry- — _ 一 TTTZ 777} 忽 5555 7777 >777: 而…20
I • • • : • : 1989 1990 1 991 1992 1993 1994 1995 1996 1997 1998
^ 甲 級 高 價 酒 店 1=1乙級高價酒店 EIID中價酒店 High tariff A hotels High tariff B hotels Medium tariff hotels 旅舍及賓館 各類酒店、旅舍及賓館的酒店入住率(%)
Hostels and guest houses Hotel room occupancy rate of all categories (%)
註釋:n) 所有數據來自香港旅遊協會每年六月及十 Note: (1) Data are obtained from the bi-annual Hotel 二月進行的會員酒店問卷調查。於此期間可 Survey conducted by the Hong Kong Tourist 供出租房間數目如有變動已相應作出調 Association in June and December each year 整� among member hotels, hostels and guest houses.
Adjustments have been made to reflect changes in number of rooms available in interim period.
242 Statistical Digest of the Services Sector 1999
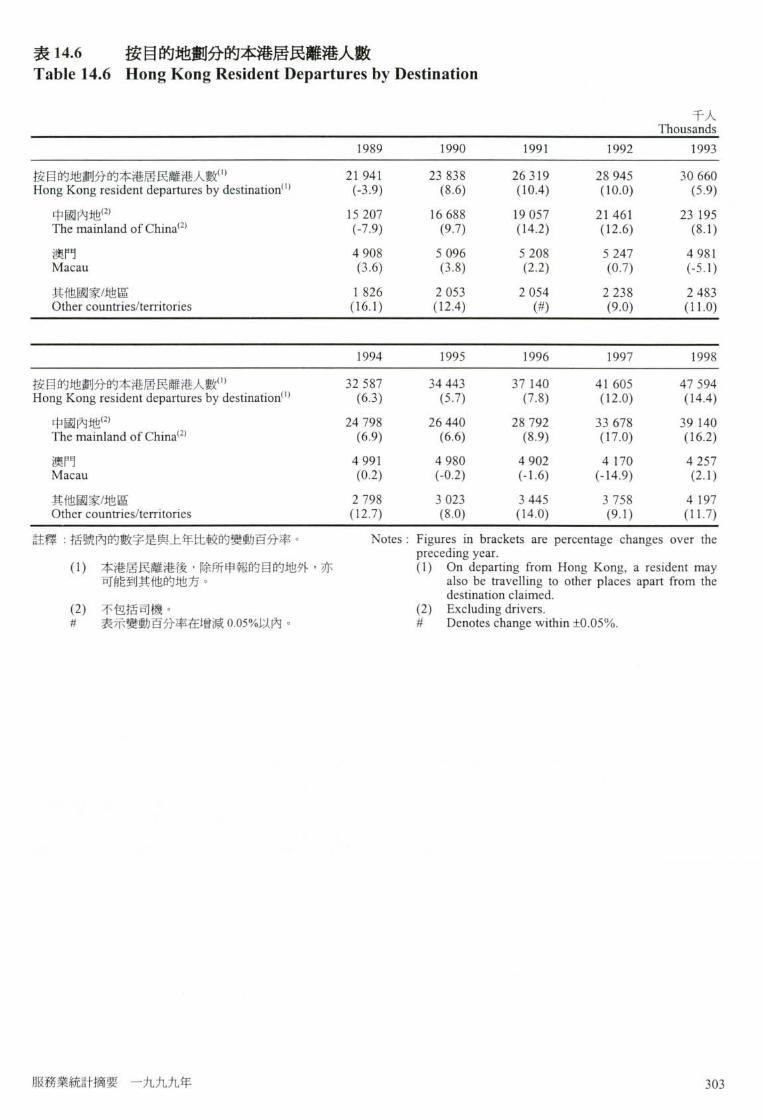
表 1 4 . 6 按目的地劃分的本港居民離港人數
Table 14.6 Hong Kong Resident Departures by Destination 千人
Thousands 1989 1990 1991 1992 1993
按目的地劃分的本港居民離港人數⑴ 2 1 9 4 1 2 3 8 3 8 2 6 3 1 9 2 8 9 4 5 3 0 6 6 0 Hong Kong resident departures by destination"' (-3.9) (8.6) (10.4) (10.0) (5.9)
中國內地(2) 15 207 16 688 19 057 21 461 23 195 The mainland of China''' (-7.9) (9.7) (14.2) (12.6) (8.1) 澳門 4 908 5 096 5 208 5 247 4 981 Macau (3.6) (3.8) (2.2) (0.7) (-5.1) 其他國家/地區 1 8 2 6 2 0 5 3 2 0 5 4 2 2 3 8 2 4 8 3 Other countries/territories (16.1) (12.4) (#) (9.0) (11.0)
1994 1995 1996 1997 1998 按目的地劃分的本港居民離港人數⑴ 32 587 34 443 37 140 41 605 47 594 Hong Kong resident departures by destination''' (6.3) (5.7) (7.8) (12.0) (14.4)
中國內地⑵ 2 4 7 9 8 2 6 4 4 0 2 8 7 9 2 3 3 6 7 8 3 9 1 4 0 The mainland of China<2) (6.9) (6.6) (8.9) (17.0) (16.2) 澳門 4 991 4 980 4 902 4 170 4 257 Macau (0.2) (-0.2) (-1.6) (-14.9) (2.1) 其他國家/地區 2 7 9 8 3 0 2 3 3 4 4 5 3 7 5 8 4 1 9 7 Other countries/territories (12.7) (8.0) (14.0) (9.1) (11.7)
註釋:括號內的數字是與上年比較的變動百分率° Notes : Figures in brackets are percentage changes over the preceding year.
(1) 本港居民離港後’除所申報的目的地外’亦 (1) On departing from Hong Kong, a resident may 可會g到其他的地方� also be travelling to other places apart from the
destination claimed. ( 2 )不包括司機。 (2) Excluding drivers. # 表示變動百分率在增減0.05%以內》 # Denotes change within ±0.05%.
服務業統計摘要一九九九年 3 0 3
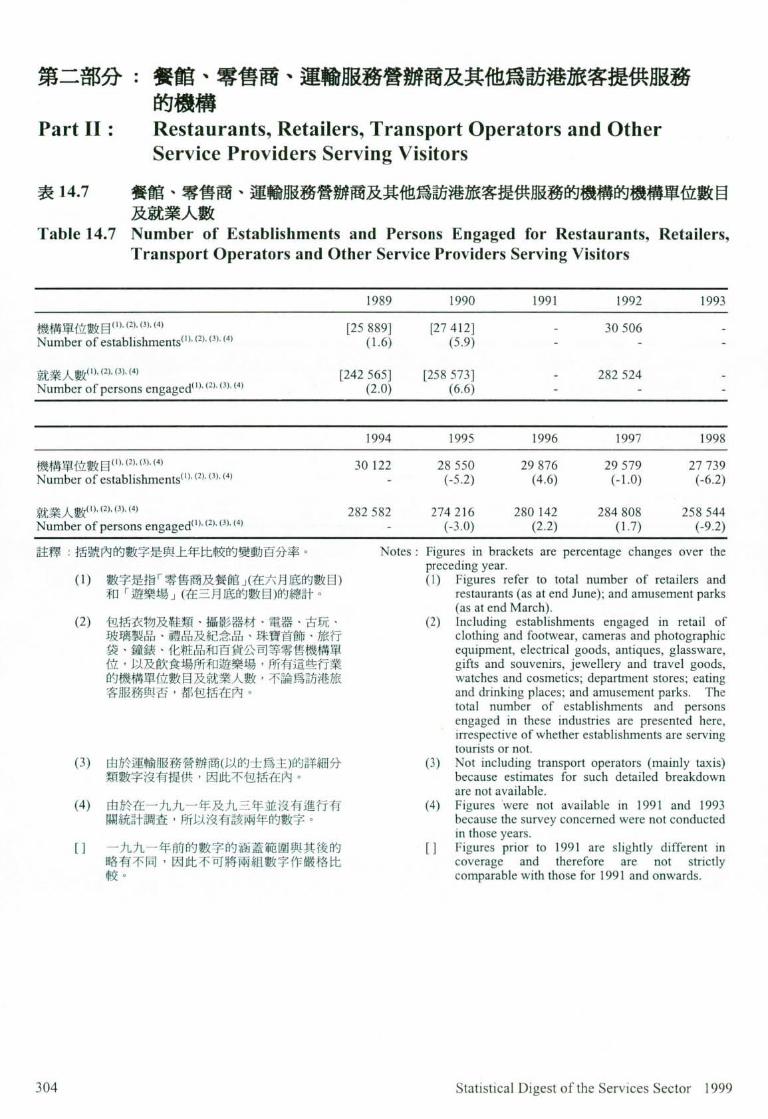
第二部分:餐館、零售商、運輸服務營辦商及其他爲訪港旅客提供服務 的機構
Part II : Restaurants, Retailers, Transport Operators and Other Service Providers Serving Visitors
表 1 4 . 7 餐館、零售商、運輸服務營辦商及其他爲訪港旅客提供服務的機構的機構單位數目 及就業人數
Table 14.7 Number of Establishments and Persons Engaged for Restaurants, Retailers, Transport Operators and Other Service Providers Serving Visitors
1989 1990 1991 1992 1993 機構單位數目⑴’ ( 2 ) . � ’ � [25 889] [27 412] - 30 506 -Number of establishments�.(2)’ � , � (1.6) (5.9) - - -
就業人數⑴ . � , � . � [ 242 5 6 5 ] [258 5 7 3 ] - 2 8 2 5 2 4 -Number of persons engaged(丨),�,�.� (2.0) (6.6) - - -
1994 1995 1996 1997 1998 機構單位數目⑴’ (2)•�.(4) 30 122 28 550 29 876 29 579 27 739 Number of establishments�.�’(3>’<4) - (-5.2) (4.6) (-1.0) (-6.2)
就業人數⑴'(z)’ (3)’ � 2 8 2 5 8 2 2 7 4 2 1 6 2 8 0 142 2 8 4 8 0 8 2 5 8 5 4 4 Number of persons engaged � ’ � ’ � ’ � - (-3.0) (2.2) (1.7) (-9.2) 註釋:括號內的數字是與上年比較的變動百分率� Notes : Figures in brackets are percentage changes over the
preceding year. (1) 數字是指「零售商及餐館」(在六月底的數目) (1) Figures refer to total number of retailers and
和「遊樂場」(在三月底的數目)的總 if� restaurants (as at end June); and amusement parks (as at end March).
( 2 )包括衣物及鞋類、攝影器材、電器、古玩二 (2) Including establishments engaged in retail of 玻璃製品、禮品及紀念品、珠寶首飾、旅行 clothing and footwear, cameras and photographic 袋、鐘錶、化被品和百貨公司等零售機構單 equipment, electrical goods, antiques, glassware, 位’以及飮食場所和遊樂場’所有這些行業 gifts and souvenirs, jewellery and travel goods, 的機構單位數目及就業人數’不論爲訪港旅 watches and cosmetics; department stores; eating 客月艮務與否‘都包括在內� and drinking places; and amusement parks. The
total number of establishments and persons engaged in these industries are presented here, irrespective of whether establishments are serving tourists or not.
( 3 )由於運輸服務營辦商(以的士爲主)的詳細分 (3) Not including transport operators (mainly taxis) 類數字沒有提供‘因此不包括在內 ” because estimates for such detailed breakdown
are not available. (4) 由於在一九九一年及九三年並沒有進行有 (4) Figures were not available in 1991 and 1993
關統計調査’戶斤以沒有該兩年的數字° because the survey concerned were not conducted in those years.
[ ]一九九一年前的數字的涵蓋範圍與其後的 [ ] F i g u r e s prior to 1991 are slightly different in 略有不同’因此不可將兩組數字作嚴格比 coverage and therefore are not strictly 較� comparable with those for 1991 and onwards.
242 Statistical Digest of the Services Sector 1999
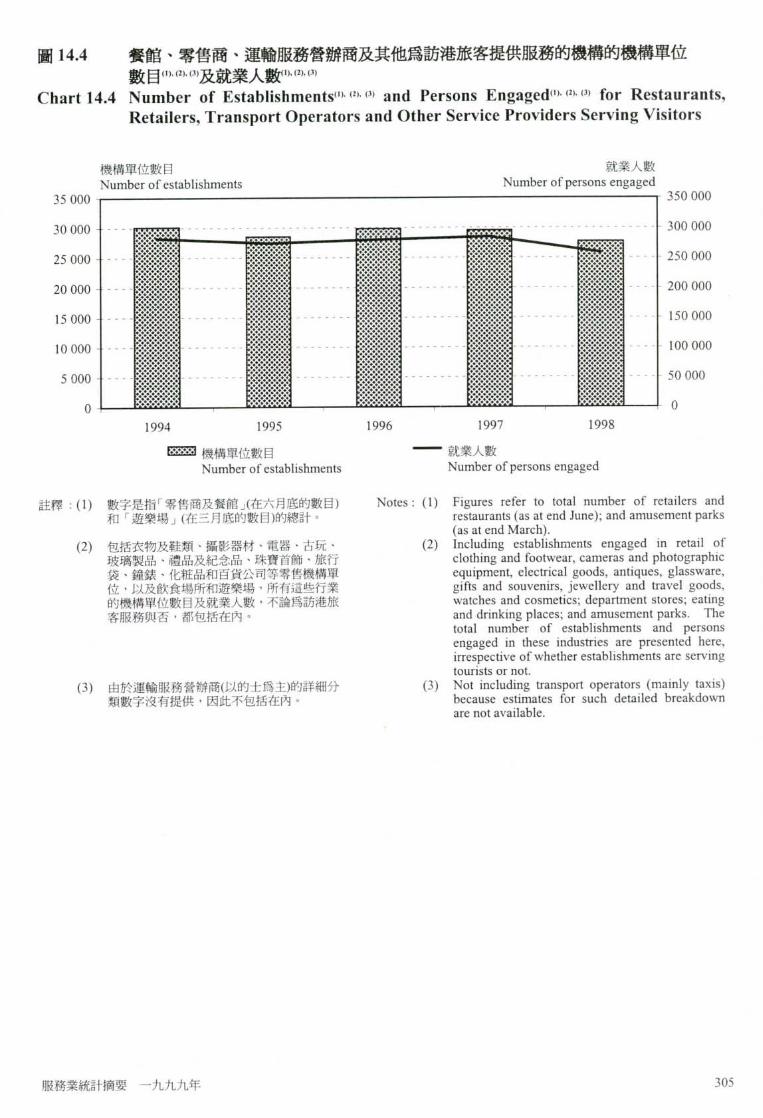
圖 1 4 . 4 餐館、零售商、運輸服務營辦商及其他爲訪港旅客提供服務的機構的機構單位 數目⑴’⑶.⑶及就業人數⑴,⑷’
Chart 14.4 Number of Establishments'" � and Persons Engaged"'� w for Restaurants, Retailers, Transport Operators and Other Service Providers Serving Visitors
機構單位數目 就業人數 Number of establishments Number of persons engaged
35 000 1 350 000 30 000 p g g ^ - - ^ ^ ^ rftVtY;^^ … 300 000
… 漏 陽 - — 圓 — — 圓 …
— • … _ _ - �
— _ — • — 1994 1995 1996 1997 1998
_ 機 構 單 位 數 目 — 就 業 人 數 Number of establishments Number of persons engaged
註釋:(1) 數字是指「零售商及餐館」(在六月底的數目) Notes: (1) Figures refer to total number of retailers and 和「遊樂場」(在三月底的數目)的總ft� restaurants (as at end June); and amusement parks
(as at end March). (2 )包括衣物及鞋類、攝影器材、電器、古玩、 (2) Including establishments engaged in retail of
玻璃製品、禮品及紀念品、珠寶首飾、旅行 clothing and footwear, cameras and photographic 袋、鐘錶、化彼品和百貨公司等零售機構單 equipment, electrical goods, antiques, glassware, 位’以及飲食場所和遊樂場’所有這些行業 gifts and souvenirs, jewellery and travel goods, 的機構單位數目及就業人數’不論爲訪港旅 watches and cosmetics; department stores; eating 客 i s i ^與否’都运括在內 ° and drinking places; and amusement parks. The
一� total number of establishments and persons engaged in these industries are presented here, irrespective of whether establishments are serving tourists or not.
(3)由於運輸服務營辦商(以的士爲主)的詳細分 (3) Not including transport operators (mainly taxis) 類 i i f字沒供’因此不包括在內 ° because estimates for such detailed breakdown
are not available.
服務業統計摘要一九九九年 243

表14.8 訪港旅客(”主要購物類別消費 Table 14.8 Expenditure of Visitors'" on Main Shopping Categories
百萬元 $ million
1989 1990 1991 1992 1993 購物消費總計 18,148 19,361 20,079 24,802 29,609 Total expenditure on shopping (3.4) (6.7) (3.7) (23.5) -
衣服 4,377 5,500 5,837 8,379 9,905 Garments (0.9) (25.7) (6.1) (43.5) -首飾 3,026 2,923 2,962 3,627 5,709 Jewellery (2.6) (-3.4) (1.3) (22.5) -皮具 2,394 2,547 2,489 3,470 4,020 Leather goods (10.3) (6.4) (-2.3) (39.4) -其他 8,352 8,391 8,791 9,326 9,975 Others (3.2) (0.5) (4.8) (6.1) -
1994 1995 1996 1997 1998 購物消費總計 32,452 37,068 40,850 34,416 26,023 Total expenditure on shopping (9.6) (14.2) (10.2) (-15.8) (-24.4)
衣服 10,821 12,886 14,058 11,700 8,652 Garments (9.2) (19.1) (9.1) (-16.8) (-26.1) 首飾 6,934 6,966 7,926 7,836 6,429 Jewellery (21.5) (0.5) (13.8) (-1.1) (-18.0) 皮具 4,654 5,498 6,922 4,334 2,787 Leather goods (15.8) (18.1) (25.9) (-37.4) (-35.7) 其他 10,043 11,718 11,944 10,546 8,155 Others ^ (16.7) (1.9) (-11.7) (-22.7)
註釋:括號內的數字是與上年比較的變動百分率“ Notes : Figures in brackets are percentage changes over the preceding year.
(1) 一九九三年以前的數字不包括來自中國內 (1) Figures before 1993 exclude spending of visitors 地訪港旅客的消費’因此不可與九三年及以 from the mainland of China, and therefore are not 後的數字作嚴格比較” strictly comparable with those for 1993 and
onwards.
306 Statistical Digest of the Services Sector 1999

第三部分:會議及展覽主辦機構 Part III : Convention and Exhibition Organizers 表14.9 在香港舉行的會議及展覽數目及出席人數
(”
Table 14.9 Number of Events and Delegates of Conventions and Exhibitions�
1989 1990 1991 1992 1993 會議 Conventions
會議數目 221 195 245 257 301
Number of conventions (-0.9) (-11.8) (25.6) (4.9) (17.1) 出席人數 30 439 24 602 42 127 64 311 65 627
Number of delegates (-18.0) (-19.2) (71.2) (52.7) (2.0) 每項會議的平均出席人數 138 126 172 250 218 Average number of delegates per convention (-17.4) (-8.7) (36.5) (45.3) (-12.8)
展覽 Exhibitions 展覽數目 96 77 57 58 47 Number of exhibitions (31.5) (-19.8) (-26.0) (1.8) (-19.0) 出席人數 85 329 97 051 94 851 111 丨 19 137071
Number of delegates (34.5) (13.7) (-2.3) (17.2) (23.4) 每項展覽的平均出席人數 889 1 260 1 664 1 916 2 916 Average number of delegates per exhibition ^ (41.8) (32.0) (15.1) (52.2)
1994 1995 1996 1997 1998 會議 Conventions
會議數目 182 268 294 291 176
Number of conventions (-39.5) (47.3) (9.7) (-1.0) (-39.5) 出席人數 36 575 69 009 57 042 76 651 35 926
Number of delegates (-44.3) (88.7) (-17.3) (34.4) (-53.1) 每項會議的平均出席人數 2 0 1 2 5 7 1 9 4 2 6 3 2 0 4 Average number of delegates per convention (-7.8) (27.9) (-24.5) (35.6) (-22.4)
展覽 Exhibitions 展覽數目 59 63 59 64 57 Number of exhibitions (25.5) (6.8) (-6.3) (8.5) (-10.9) 出席人數 170 998 170 010 176 771 193 086 174 815
Number of delegates (24.8) (-0.6) (4.0) (9.2) (-9.5) 每項展覽的平均出席人數 2 8 9 8 2 6 9 9 2 9 9 6 3 0 1 7 3 0 6 7 Average number of delegates per exhibition (-0.6) (-6.9) ( H O) (0.7) (1.7)
註釋:括號內的數字是與上年比較的變動百分率° Notes : Figures in brackets are percentage changes over the preceding year.
(1) 統 i十數字是以香港旅遊協會已知資料爲根 (1) Statistics are based on information known to the 據’不包括祇有香港代表出席的本地會議或 Hong Kong Tourist Association and do not 展覽� include events attended only by Hong Kong
delegates.
服務業統計摘要一九九九年 243

圖 H . 5 會議的數目及出席人數 Chart 14.5 Number of Events and Delegates to Conventions
會議數目 每項會議的平均出席人數 Number of conventions Average number of delegates per convention
350 350
• _ mm 30。
250 _ — 250
2 0 0 - 誦 — … … _ - 、 議 — 200
- f c l - ^ l • • • r • 150 100- • ― … _ … - _ _ 100
: _ t t t l ± t t u — t : 1989 1990 1991 1992 1993 1994 1995 1996 1997 1998
^ 會 議 數 目 每項會議的平均出席人數 Number of conventions Average number of delegates per convention 註釋:統計數字是以香港旅遊協會已知資料爲根據’不 Note : Statistics are based on information known to the Hong
包括祇有香港代表出席的本地會議或展覽° Kong Tourist Association and do not include events attended only by Hong Kong delegates.
圖 1 4 . 6 展覽的數目及出席人數 Chart 14.6 Number of Events and Delegates to Exhibitions
展覽數目 每項展覽的平均出席人數 140 Number of exhibitions Average number of delegates per exhibition 3 郷
120 ----3 000
100 / 2 500
8 0 - . - - - - - - - - - - - - - - - - - - - - - - - - - - - - - - - - - - - - - - - - - - - - - - - - - - - - - - - - - - - - - - - - - - - - - - - - -- 2 0 0 0
_ 國 ^ ^ ^ ^ 6 0 … 燃 —— 陶 — — 國 - … 剩 — — ^ 1 500 - • • • # 1 20 « « « « 1 « i i i i 500 J • _ 隱 W _ _ M 驪 M M l ,
1989 1990 1991 1992 1993 1994 1995 1996 1997 1998
^ 展 覽 數 目 每項展覽的平均出席人數 Number of exhibitions Average number of delegates per exhibition
註釋:統計數字是以香港旅遊協會已知資料爲根據’不 Note : Statistics are based on information known to the Hong 包括祇有香港代表出席的本地會議或展覽� Kong Tourist Association and do not include events
attended only by Hong Kong delegates.
242 Statistical Digest of the Services Sector 1999

第四部分:整個旅遊、會議及展覽服務界別 Part IV : The Entire Tourism, Convention and Exhibition Services
Domain 表14.10 旅遊、會議及展覽服務界別的業務收益指數
Table 14.10 Business Receipts Index for the Tourism, Convention and Exhibition Services Domain
1996 1997 1998 業務收益指數⑴(1996=100) 100,0 88.2 63.1 Business receipts index�(1996=100) (-11.8) (-28.5) 註釋:括號內的數字是與上年比較的變動百分率° Notes : Figures in brackets are percentage changes over the
preceding year. ( 1 )業務收益指數於一九九二統計年度開始編 (1) Business receipts indices were first available in
製’但此詳細分類的指數則於九六年開始編 the reference year 1992,but indices at such 製� detailed breakdown were first compiled in 1996.
服務業統計摘要一九九九年 243

表14.11 旅遊、會議及展覽服務界別的選定最新統計數字
Table 14.11 Selected Up-to-date Statistics on Tourism, Convention and Exhibition Services Domain
1998 1999 第一季 第二季 第三季 第四季 第一季
^ Q2 ^ ^ Ql_ 業務收益指數(1996=丨00) 61.9 62.1 61.4 66.9* 61.7 Business receipts index (1996=100)
訪港旅客人數(千人) 2 180 2 345 2 426 2 624 2 471 Number of visitor arrivals (thousands)
訪港旅客所使用交通模式(%) Visitor arrivals by mode of transport (%) 空 58.5 58.6 56.4 59.2 57.6 By air 陸 26.5 27.2 28.6 27.5 28.7 By land 海 15.0 14.2 15.0 13.3 13.7 By sea
訪港旅客平均留港時間(晚) 3 . 6 3 . 3 3 . 4 3 . 3 3 . 2 Average length of stay (nights)
酒店入住率(%) 6 9 . 6 7 4 . 5 7 6 . 6 8 1 . 4 7 8 . 0 Hotel room occupancy rate (%)
甲級高價酒店 6 6 . 0 6 9 . 2 6 8 . 0 7 6 . 2 7 3 . 9 High tariff A hotels 乙級高價酒店 7 5 . 6 8 0 . 1 8 2 . 1 8 6 . 9 8 3 . 0 High tariff B hotels 中價酒店 67.4 73.3 78.4 80.2 77.5 Medium tariff hotels 旅舍及賓館 57.7 68.4 72.1 76.2 66.1 Hostels and guest houses
按目的地劃分的本港居民離港人數(千人) 1 1 0 4 1 1 1 5 4 6 1 2 3 5 9 1 2 6 4 8 1 2 6 1 8 Hong Kong resident departures by destination (thousands)
中國內地 8 821 9 544 10031 10 744 10 613 The mainland of China 澳門 I 152 998 1 133 975 980 Macau 其他國家 / 地區 1 0 6 8 1 0 0 4 1 1 9 5 9 3 0 1 0 2 4 Other countries/territories
242 Statistical Digest of the Services Sector 1999

資料來源 Data Sources 表 資料來源 Table Sources 14.1 政府糸充言十處 14.1 Census and Statistics Department 14.2 - 14.5 香港旅遊協會 14.2-14.5 Hong Kong Tourist Association 14.6 入境事務處 14.6 Immigration Department 14.7 政府'統言十處 14.7 Census and Statistics Department 14.8 - 14.9 香港旅遊協會 14.8 - 14.9 Hong Kong Tourist Association 14.10 政府,統言十處 14.10 Census and Statistics Department
其他有關刊物 Further References 香港旅遊業統計’香港旅遊協會編製 力Statistical Review of Tourism, published by the Hong
Kong Tourist Association 航空公司使用統計’香港旅遊協會編製 Airline Statistics, published by the Hong Kong Tourist
Association 香港未來會議及展覽目錄’香港旅遊協會編製 Coming Conference and Exhibition in Hong Kong,
published by the Hong Kong Tourist Association 港人外遊統計’香港旅遊協會編製 Departures by Hong Kong Residents, published by the
Hong Kong Tourist Association 就業及空缺統旨f(詳細統計表) Employment and Vacancies Statistics (Detailed
Tables) 本地生產總値估計 Estimates of Gross Domestic Product 香港統計年干(J Hong Kong Annual Digest of Statistics 香港酒店業務統計,香港旅遊協會編製 Hong Kong Hotel Industry, published by the Hong
Kong Tourist Association 香港統言十月干fj Hong Kong Monthly Digest of Statistics 酒店入住率報告,香港旅遊協會編製 Hotel Room Occupancy Report, published by the Hong
Kong Tourist Association 酒店供應情況’香港旅遊協會編製 Hotel Supply Situation, published by the Hong Kong
Tourist Association 服務行業按季業務收益指數 Quarterly Business Receipts Indices for Service
Industries 就業、空缺及薪金總額按季統計報告 Quarterly Report of Employment, Vacancies and
Payroll Statistics 本地生產總値估旨f按季報告 Quarterly Report of Gross Domestic Product Estimates 批發、零售、進口與出口貿易、食肆及酒店按 Report on Annual Survey of Wholesale, Retail &
服務業統計摘要一九九九年 243
年糸充計調查幸艮告 Import & Export Trades, Restaurants & Hotels 食肆的收入及購貨額按季統計調查報告 Report of Quarterly Survey of Restaurants Receipts
and Purchases 香港旅遊業—統計槪覽’香港旅遊協會編製 Tourism in Hong Kong The Figures, published by the
Hong Kong Tourist Association 旅遊業收益統計,香港旅遊協會編製 Tourism Receipts, published by the Hong Kong Tourist
Association 訪港旅客統計’香港旅遊協會編製 Visitor Arrival Statistics, published by the Hong Kong
Tourist Association 訪港旅客分析報告’香港旅遊協會編製 Visitor Profile Report, published by the Hong Kong
Tourist Association
242 Statistical Digest of the Services Sector 1999

隱
Appendix 香港主要統計槪覽 Summary of Key Statistics of Hong Kong (Cont'd.)
1989 1990 199] 1992 1993 1994 丨 995 1996 1997 1998
人口及生命斬牛
Population and Vital Events 年中人丨]估計 5 686 200 5 704 500 5 752 000 5 800 500 5 901 000 6 035 400 6 156 100 6 311 000 6 502 100 6 687 200
Mid-year population estimate 粗出生率(按每千名人口 i十算 > 12.3 1 2 . 0 1 2 . 0 1 2 . 3 1 2 . 0 1 1 . 9 1 1 . 2 1 0 . 1 9 . 1 7 . 9 Crude birth rate (per 1 000 population) 粗死 l l ; 申 - ( 按 海 下 名 人 门 計 5 . 1 5 .2 5 . 0 5 . 3 5 .2 5 . 0 5.1 5 .1 4 . 9 4 . 8 Crude death rate (per 1 000 population)
勞1:
Labour 勞勛人口(千人) 2 752.8 2 748.1 2 804.1 2 792.3 2 856.4 2 929.0 3 000.7 3 093.8 3 216.0 3 358.6
Labour force (thousands) 努勋人口參與率(%) 63.7 63.2 63.5 62.4 62.3 62.0 62.0 61.8 61.8 62.0
Labour force participation rate (%) 失業率(%) 1.1 1.3 1.8 2.0 2.0 1.9 3.2 2.8 2.2 4.7
Unemployment rate (%) 就業不足率(%> 0.8 0.9 1.6 2.1 1.6 1.4 2.1 1.7 1.2 2.5
Underemployment rate (%) 就業人數
Number of persons engaged in (i) 製造業 791 519 715 597 629 170 565 137 483 628 423 015 375 766 325 068 288 887 245 457
Manufacturing ( i i ) 批發、零代、進出[-1 贸结、 7 7 4 0 2 0 8 2 9 5 9 1 8 7 1 8 5 0 9 1 4 8 3 1 9 4 8 8 8 1 1 0 2 1 8 9 0 1 0 1 8 1 9 8 1 0 5 6 1 3 6 1 0 0 3 0 7 2 9 1 3 0 7 0
飲食及洒庙業
Wholesale, retail and import/export trades, restaurants and hotels
( i i i ) 運輸、愈庫及通訊業 1 2 6 0 3 6 1 3 2 7 9 2 1 3 4 0 8 8 1 4 5 6 6 1 1 5 4 1 2 5 1 6 4 1 9 8 1 7 2 1 7 4 1 8 1 5 1 6 1 7 8 1 0 4 1 6 8 6 1 9 Transport, storage and communications
( i v ) 金融、保險、地產及商用服 2 5 4 7 9 2 2 7 5 6 2 1 2 9 5 8 6 6 3 1 4 5 3 2 3 3 8 0 9 3 3 6 9 5 9 4 3 7 8 2 4 4 3 9 5 9 0 3 4 1 0 9 7 9 3 9 0 4 5 4 務突 Financing, insurance real estate and business services
:^質工資指數(一九九二年九月=100) 97.6 100.1 99.8 100.0 102.4 103.1 101.6 102.8 104.5 104.4
Real wage index (September 1992=100)
對外ff结 External Trade
港鹿品出U (白'萬元) 224,104 225,875 231,045 234,123 223,027 222,092 231,657 212,160 211,410 188,454 Domestic exports ($ million) 轉口(百萬元) 346,405 413,999 534,841 690,829 823,224 947,921 1,112,470 1,185,758 1,244,539 1,159,195
Re-exports ($ million) 進[J (茵萬元) 562,781 642,530 778,982 955,295 丨,072,597 丨’250,709 1’491’121 1,535,582 1,615,090 1,429,092 Imports ($ million) f / IM口格比率指數(1990=100 ) 9 9 . 7 1 0 0 . 0 1 0 0 . 7 1 0 1 . 4 1 0 1 . 6 1 0 0 . 3 9 8 . 7 9 9 . 7 1 0 0 . 4 1 0 1 . 6 Terms of trade index (1990=100)
服 務 業 統 計 摘 要 一 九 九 九 年 A3
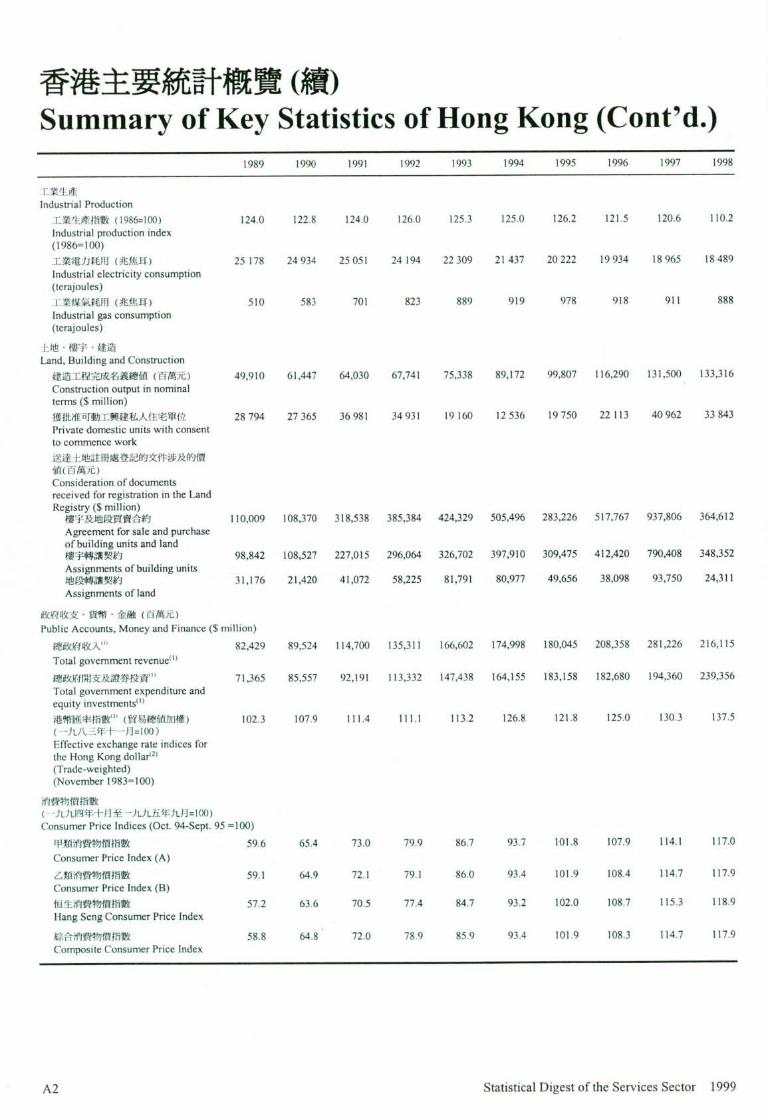
香港主要統計槪覽(續) Summary of Key Statistics of Hong Kong (Cont'd.)
1989 1990 1991 1992 1993 1994 1995 1996 1997 1998
1:業也產
Industrial Production I:業生库指數(1986=100) 1 2 4 . 0 122 .8 124 .0 126 .0 125 .3 125 .0 126 .2 121 .5 1 2 0 . 6 110 .2
Industrial production index (1986=丨00)
r.業電力耗用(兆焦耳) 25 178 24 934 25 051 24 194 22 309 21 437 20 222 19934 18 965 18 489 Industrial electricity consumption (terajoules)
業煤氣耗用(兆焦耳) 510 583 701 823 889 919 978 918 911 888
Industrial gas consumption (terajoules)
f:地•樓宇、建造 Land, Building and Construction
建造工程完成名義總侦(百萬元) 49,910 61,447 64,030 67.741 75,338 89,172 99,807 116,290 131,500 133,316
Construction output in nominal terms ($ million) 獲批准可動工興建私人住宅單位 2 8 7 9 4 2 7 3 6 5 3 6 9 8 1 3 4 9 3 1 1 9 1 6 0 1 2 5 3 6 1 9 7 5 0 2 2 1 1 3 4 0 9 6 2 3 3 8 4 3 Private domestic units with consent to commence work 送達上地註冊處登記的文件涉及的惯
値(百萬元)
Consideration of documents received for registration in the Land Registry ($ million)
樓宇及地段買賣合約 110,009 108,370 318,538 385,384 424,329 505.496 283,226 517,767 937,806 364,612
Agreement for sale and purchase of building units and 丨and 樓卞轉讓契約 98,842 108,527 227,015 296,064 326,702 397,910 309,475 412,420 790,408 348,352
Assignments of building units 地段轉讓突約 31,176 21,420 41,072 58,225 81,791 80,977 49,656 38,098 93,750 24,311
Assignments of land 政府收支、貨幣、金融(酉萬元)
Public Accounts, Money and Finance ($ million) 總政府收入⑴ 82,429 89,524 114,700 135,311 166,602 174,998 180,045 208,358 281,226 216,115
Total government r e v e n u e � 總政府閲支及證券投資⑴ 71,365 85,557 92,191 113,332 147,438 164,155 183,158 182,680 194,360 239,356
Total government expenditure and equity i n v e s t m e n t s � 港幣_率指數'2’(贸易總値加權) 102.3 107.9 111.4 111.1 113.2 126.8 121.8 125.0 130.3 137.5
(-九八三年十―月=丨00)
Effect ive exchange rate indices for the Hong Kong dollar】) (Trade-weighted) (November 1983=100)
消費物丨?1指數
(一九九四年十 n至一九九五年九月 = 1 0 0 ) Consumer Price Indices (Oct. 94-Sept. 95 =100)
甲類消費物 f n 指數 5 9 . 6 6 5 . 4 7 3 . 0 7 9 . 9 8 6 . 7 9 3 . 7 1 0 1 . 8 1 0 7 . 9 1 1 4 . 1 1 1 7 . 0 Consumer Price Index (A) 乙烦消费物價指數 59.1 64.9 72.1 79.1 86.0 93.4 101.9 108.4 114.7 117.9
Consumer Price Index (B) 恒生消贤物衍指數 57.2 63.6 70.5 77.4 84.7 93.2 102.0 108.7 115.3 118.9
Hang Seng Consumer Price Index 綜合消费物愤指數 58.8 64.8 ‘ 72.0 78.9 85.9 93.4 101.9 108.3 114.7 117.9
Composi te Consumer Price Index
A2 Statistical Digest of the Services Sector 1999
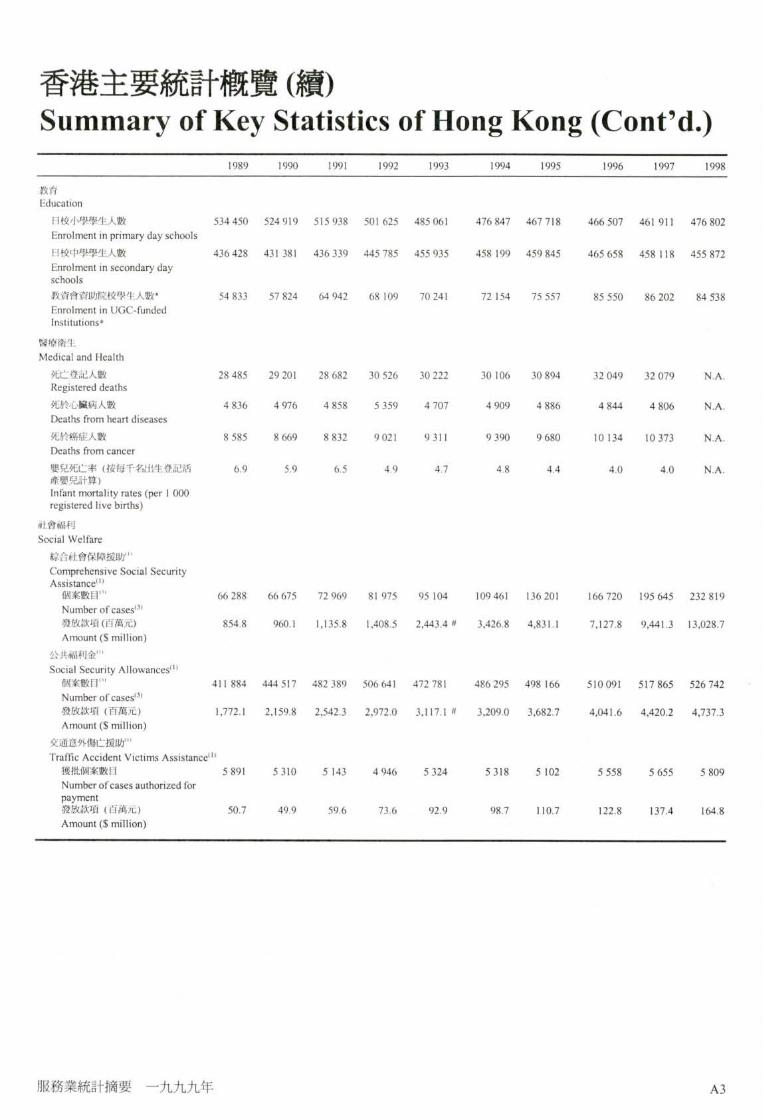
香港主要統計槪覽(續) Summary of Key Statistics of Hong Kong (Cont'd.)
1989 1990 1991 1992 1993 1994 1995 19% 1997 1998
教ff Education
tl 校/j�岛,冬學兔人數 534 450 524 919 515 938 501 625 485061 476 847 467 718 466 507 461 911 476 802 Enrolment in primary day schools 旧校中學學生人數 436428 431 381 436 339 445 785 455 935 458 199 459 845 465 658 458 118 455 872 Enrolment in secondary day schools 教 科 助 院 校 〒 生 人 數 * 5 4 8 3 3 5 7 8 2 4 6 4 9 4 2 6 8 1 0 9 7 0 2 4 1 7 2 1 5 4 7 5 5 5 7 8 5 5 5 0 8 6 2 0 2 8 4 5 3 8 Enrolment in UGC-funded Institutions*
醫療衛生
Medical and Health 死亡登記人數 2 8 4 8 5 2 9 2 0 1 2 8 6 8 2 3 0 5 2 6 3 0 2 2 2 3 0 1 0 6 3 0 8 9 4 3 2 0 4 9 3 2 0 7 9 N . A . Registered deaths 死於心躲病人數 4 8 3 6 4 9 7 6 4 8 5 8 5 3 5 9 4 7 0 7 4 9 0 9 4 8 8 6 4 8 4 4 4 8 0 6 N . A . Deaths from heart diseases 死於癌症人數 8 5 8 5 8 6 6 9 8 8 3 2 9 0 2 1 9 3 1 1 9 3 9 0 9 6 8 0 1 0 1 3 4 1 0 3 7 3 N . A . Deaths from cancer 嬰兒死亡率(按每千名出生登記活 6 . 9 5 . 9 6 . 5 4 . 9 4 . 7 4 . 8 4 . 4 4 . 0 4 . 0 N . A . 產嬰兒計算)
Infant mortality rates (per 1 000 registered live births)
社矜福利
Social Welfare 社會保障援助…
Comprehensive Social Security Assistance �
個案數目"” 66 288 66675 72 969 81 975 95 104 109 461 136 201 166 720 195 645 232 819 Number of c a s e s � 發放款項〔百萬元) 854.8 960.1 1,135.8 1,408.5 2,443.4 # 3,426.8 4,831.1 7,127.8 9,441.3 13,028.7 Amount ($ million)
公共iPU金⑴ Social Security A l l o w a n c e s �
個案數 4 1 1 8 8 4 444 517 482 389 506641 472 781 486 295 498 166 510 091 517 865 526 742
Number of c a s e s � 發放款項(百萬元) 1,772.1 2,159.8 2,542.3 2,972.0 3,117.1 # 3,209.0 3,682.7 4,041.6 4,420.2 4,737.3 Amount ($ million)
交通;it外似亡援助⑴ Traffic Accident Victims A s s i s t a n c e �
獲批個案數目 5 891 5 310 5 143 4 946 5 324 5 3 1 8 5 102 5 558 5 655 5 809
Number of cases authorized for payment 發放款項(百萬元) 5 0 . 7 4 9 . 9 5 9 . 6 7 3 . 6 9 2 . 9 9 8 . 7 1 1 0 . 7 1 2 2 . 8 1 3 7 . 4 1 6 4 . 8 Amount ($ million)
服務業統計摘要一九九九年 A 3

香港主要統計槪覽(續) Summary of Key Statistics of Hong Kong (Cont'd.)
1989 1990 1991 1992 1993 1994 1995 1996 1997 1998
治安
Law and Order 舉報罪案合計 81 808 88 300 88 659 84 056 82 564 87 804 91 886 79 050 67 367 71 962
Overall reported crime 暴力罪案總計 17 350 18 820 19 558 18 567 17 454 17 232 17 087 !5 191 13 749 14 682
Total violent crime 被捕人數總計 43 684 44 013 44 059 41 780 45 042 49 784 53 098 47 157 41 714 40 422
Total persons arrested 本 地 産 總 値
Gross Domestic Product (GDP) 以固定(一九九零年 > 市丨計??
At constant (1990) market prices 本地生產總値開支佔計按年 + 2 . 6 + 3 . 4 + 5 . 1 + 6 . 3 + 6 . 1 + 5 . 4 + 3 . 9 + 4 . 5 + 5 . 3 @ - 5 . 1 率 ( % )
Expenditure-based GDP Annual growth rate (%) 本地少產總値(酉萬元) 563,368 582,549 612,016 650,347 690,223 727,506 755,832 789,753 831,319(^ 788,677@
G D P ($ million) 按人 UI 平均社算的本地生库 99,076 102,121 106,401 112,119 116,967 120,540 122,778 125,139 127,854® 117,938@ 總値(元) Per capita GDP ($)
以當時市簡計算
At current market prices 本地生產總値開支估計按年增畏 +15.1 +11.2 +14.8 +16.6 +15.2 +12.6 +6.6 +10.7 + 丨 2 . 8 @ -4.1 @
率(。/。)
Expenditure-based GDP Annual growth rate (%) 本地生產總恤 a'imyt) 523,861 582,549 668,512 779,335 897,463 1,010,885 1,077,145 1,191,890 1,344,104@ 1,;289,192(
GDP ($ mill ion) 按人口平均計 I?的本地牛.産 92,128 102,121 116,223 134,357 丨 52,087 丨 67,49;3 174,972 丨 88,859 206,718 @ 192,785 幼 總値(元)
Per capita G D P ($) 本地生產總値生產估計(百萬元) 524,326 589,060 667,837 780,897 883,447 1,006,458 1,069,089 1,192,656 1 ,341,184© N.A. Production-based GDP ($ mill ion)
本地)i纟民生産總値
Gross National Product (GNP) 以當時市價計算本地丨I批々屯産總侦 N.A. N.A. N.A. N.A. 910,708 丨,022,925 1,097,656 1,192,078 1,354,576 N.A. (百f萬元)
GNP at currcnt market prices ($ mill ion) 按人 U 平 措 I - 1 ?的本地居民生產 N.A. N.A. N.A. N.A. 1M,331 169,488 178,304 188,889 208,329 @ N.A.
總firt iJt) Per capita G N P ($) 對外耍素收益流動淨侦總,丨丨_ N.A. N.A. N.A. N.A. 13,245 丨2,040 20,51 丨 188 10,475 @ N.A. (西萬元)
Total Net External Factor Income f lows ($ million)
註釋: ( 1 ) 數字是以把應的財政年度爲根據。例如一九九六‘平的數代 Notes : (1) Figures are for the corresponding financial year. For example, —九九六至九七財政年度數字� figures for 1996 would represent the figures for financial year
1996/97. (2) 數卞是范昨丨或現鈔收市中問兑換價年内平均數。 (2) Figures are based on average of the closing middle market
telegraphic transfer rates or notes rates for the year. ( 3 )於財政年度終結 l i � W K j數'?: “ (3) Figures are as at end of the financial year. * 數字只liifS教資 资助丨深?VAJ,生人數� * Figures refer to students of UGC - funded programmes only.
‘九九六年及以後的數字也估^^港教行,院“該舉院因一九 Figures from 1996 onwards include those for the Hong Kong 九六年七月一日起成爲人爭教資助委待資助院校。 Institute of Education, which came under the aegis of the
University Grants Committee (UGC) with effect from 1 July 19%.
林 杭一九九四年四月 ‘f;]至fi丨丨所發放的款柏。 # 丨nclude the payments for the period f rom 1 April to 5 April 1994.
@ 數卞在 H 後 作 出 修 � @ Figures are subject to revisions later on.
A2 Statistical Digest of the Services Sector 1999

《服務業統計摘要按季補充資料》 Quarterly Supplement to
Statistical Digest of the Services Sector
•務按蠻料摘要: 、服務業統計摘要按季補充資米提供在邊
Quarterly Supplement to 務業一統計摘動內刊載的香港十四個主要服
Statistical Digest of the Services Sector 務行業/界別的一些最新按季統計數字。
本刊同時刊載專題文章,分析有關服務行業/
m ' ^ m 界別的統計數字,以及闡述有關的統計方
I^mHI ® d^M The Quarterly Supplement to Statistical 1 w , IeeI i ^ S l ' j I Digest of the Services Sector p r o v i d e s
‘ s o m e up-to-date quarterly statistics on the s j i ^ g 14 major service industries/domains of
B j a ^ ^ r n i ^ ^ ^ l Hong Kong presented in the Statistical •yl^plww JPf^'.b Digest of the Services Sector.
The publication also contains feature v ^ articles that analyse statistics of interest
and present methodological materials of """"HHSE"''" relevance to the service industries/domains.
ms-
一九九九年系列現可訂閱 1999 Series available for subscription now 有關本干IJ 物的查詢 ’ i f 耳雜絡• Enquiries on this publication can be directed to : 政府統 i t 處 Distribution and Services Statistics Branch (2) 莊 士紅磡廣場分處 Census and Statistics Department 經銷及服務業統計科(二) Chuang's Hunghom Plaza Sub-office 香港九龍紅磡蕪湖街八十三號 20/F,83 Wuhu Street, Hung Horn, 莊士紅磡廣場二十樓 Kowloon,Hong Kong. 電話:(852) 2123 1038 Tel. No.: (852)2123 1038 傳真:(852) 2123 1048 Fax. No.: (852)2123 1048
! ^
A5

訂閱表格 服務業統計摘要按季補充資料(一九九九年期刊)
致:政府統計處經銷及服務業統計科(二)
香港九龍紅磡藤湖街八十三號莊士紅磡廣場二十樓
莊士紅磡廣場分處
(電話:(852) 2123 1038 傳真:(852) 2123 1048)
(港元)
刊期 刊物出版曰期 每 本 售 價 太 每 , 节 計 « 言 L 本地郵費 (a) (b) (a) X (b)
一九九九年第二季 一九九九年 ^ ^一月 56.0 9.0 65.0 (J68009902B0) 一九九九年第三季 二零零零年二月 56.0 9,0 65.0
(J68009903B0) 一九九九年第四季 二零零零年五月 56.0 9.0 65.0
(J68009904B0) 合計:
本人現附上支票 * (編號: ) 港 幣 元’購買上述刊物。(註:支票應予劃線,
並註明支付「香港特別行政區政府」。 )
訂戶資料
姓名: 地址:
職銜: Z^^^ZIZ^I^^Z^ZZZ! 部門: z^^^m^zzzi^i^zz 機構名稱: 電話: 傳真:
日期:
機構主要從事業_別: • 進 出 口 貿 易 業 口 建 造 業 口金融、保險及地產業
• 製 造 業 口商用服務業 • 教 育 機 構
•社區、社會及個人服務業 口其他’請註明
讀者類別(可選多項):
• 經 理 • 分 析 員 、 研 究 員 •市場、推廣部人員
• 教 師 、 大 專 院 校 講 師 • 學 生 口其他’請註明
訂戶類別:
• 機 構 口 私 人
你是否願意收到本處推廣其他刊物的資料?
• 是 • 否
*外地訂購人士暫時無須附上支票’所需郵費將於收到訂購要求後另行通知》
你在表格上所提供的資料,只會用作辦理書刊訂購事宜,不會向任何和訂購無關的人士透露。如欲査看或更改所塡
報的資料’請與政府統計處的資料管理人員聯絡。地址-•香港灣仔港灣道十二號灣仔政府大樓二十一樓。
A6

/ y j ^ ^ o X Subscription Form f f ^ ^ a ) ) Quarterly Supplement to Statistical Digest of the Services Sector
(1999 Issues) To: Distribution and Services Statistics Branch (2)
Census and Statistics Department Chuang's Hunghom Plaza Sub-office, 20/F, 83 Wuhu Street, Hung Horn, Kowloon, Hong Kong (Tel. No.: (852) 2123 1038 Fax. No.: (852) 2123 1048) (HK$)
^ , , , , Price per Local Total price No. of copies Total amount Issue To be published copy postage (a) (b) (a) x (b) Second Quarter 1999 November 1999 56.0 9.0 65.0 (J68009902B0) Third Quarter 1999 February 2000 56.0 9.0 65.0 (J68Q09903BQ) Fourth Quarter 1999 May 2000 56.0 9.0 65.0 (J68Q09904BQ) ^ | | ^ |
TOTAL :
I enclose a cheque* (No. ) of HK$ for the payment of the above order. (Cheque should be crossed and made payable to ‘The Government of the Hong Kong Special Administrative Region'.) Subscriber's information Name : Address : Title of Pos t : Department : Name of Organization : Tel. No.: Fax. No.:
Date : Major type of business of organization :
• Import/export trades • Construction • Financing, insurance and real estate • Manufacturing • Business services • Educational institution • Community, social and personal services • Others, please specify
Type of readers (more than one choice allowed): • Manager • Analyst / researcher • Marketing / promotional personnel • Teaching staff / lecturer • Student • Others, please specify —
Type of subscriber : • Organization • Individual
Do you want to receive promotional materials of other publications of this department? • Yes • No
* For mailings to addressed outside Hong Kong, please do not send in a cheque now. The required postage will be advised upon receipt of order.
The information provided herein will only be used for processing your order of publications and will not be disclosed to parties which are not involved in the subscription of these publications. You may seek access to or correction of the information by addressing your request to the Data Controlling Officer, Census and Statistics Department, 21/F, Wanchai Tower, 12 Harbour Road, Wan Chai, Hong Kong.
A7

訂購表格 致香港花園道 請註明
美利大廈4樓 售價 刊期(月份/季/ 政府新聞處 期號及年份) 刊物銷售小組 本地 T 合計 電話:(852) 2842 8844或2842 8845 郵費 所需的 傳真:(8
52) 2
598 7
48
2 每本 ⑴及⑵ 合計 由 至 期 數 總計
(港元)(港元)(港元) (港元) (b) ( a ) x ( b )
1 . •月干 九九九年期刊) 6 2 i ) 1 8 . 0 8 0 . 0 / 9 9 1 2 / 9 9
2 .香港經濟趨勢(一九九九年期刊) 14_0 3.0 17.0 /99 24/99 (半月干lj)(J410099 BO)
3 .香港統計年刊(一九九八年版) 5 6 _ 0 1 6 . 4 7 2 . 4 - -(J47019800B0)
4.香港社會及經濟趨勢(一九九七年版)66.0 16.4 82.4 “ “ (雙年刊)(J57299700B0)
5 .
6 .
7.
8.
9.
10.
11.
本人現附上支票(編號 J ) 港 幣 元’購買上述刊物。
(註:支票應予劃線,並註明支付「香港特別行政區政府」。)
姓名: 職銜:
機構名稱: 地址:
電話: 傳真:
曰期:
註:⑴外地訂購人士暫時毋須附上支票’所需郵費將於收到訂購要求後另行通知。 .
<2>訂購超過一本相同名稱的年刊或非定期刊物,請向政府新聞處查詢所需本地郵費。 電話:(852) 2842 8844 或 2842 8845。
你在表格上所提供的資料,只會月作辦理書刊訂購事宜,不會向任何和訂購無關的人士透露。如欲查看或更改所塡報的資料’“
請與政府新聞處刊物銷售小組聯絡。地址•香港花園道美利大廈4樓。
A8

Order Form To : Publications Sales Section, Please indicate
Information Services Department, Price Month/Quarter/ 4/F, Murray Building, Issue no. and Year Total Garden Road, Local no.of Hong Kong. Per postage issue(s) Total Tel. : (852) 2842 8844 or 2842 8845 copy (i) Total From To required amount Fax. : (852) 2598 7482 (HK$) (HK$) (HK$) (HK$)
! (b) (a) X (b)
:1. Hong Kong Monthly Digest of Statistics 62.0 18.0 80.0 199 12/99 1999 issues (J470099 BO)
i 2. Hong Kong Economic Trends 1999 issues 14.0 3.0 17.0 199 24/99 (half-monthly) (J410099 BO)
3. Hong Kong Annual Digest of Statistics 56.0 16.4 72.4 - -1998 edition (J47O198O0B0)
I 4. Hong Kong Social and Economic Trends 66.0 16.4 82.4 " " 1997 edition (biennial) (J57299700BO)
5 .
6 .
I 7.
8.
9.
10.
‘ 1 1 .
:
I enclose a cheque (No. ) of HK$ for the payment of the above I order. (Note : Please have the cheque crossed and made payable to 'The Government of the Hong Kong
Special Administrative Region'.) ^ Name : Title of post:
Name of organization : Address : I Tel. No. : Fax No. : i Date :
Notes: (1) For mailings to addresses outside Hong Kong, please do not send in a cheque now. The required postage will , be advised upon receipt of order.
.;•‘ (2) For an order of more than one copy of an annual or ad hoc publication with the same title ’ please consult the y« Information Services Department about the required local postage. Telephone number : (852) 2842 8844 or 2842 8845.
T h e i n f o r m a t i o n p r o v i d e d here in wil l on ly be used fo r p r o c e s s i n g y o u r o rde r of pub l i ca t i ons and wil l not b e d i s c l o s e d to par t i es w h i c h are no t i n v o l v e d in the subsc r ip t ion of these pub l ica t ions . Y o u m a y seek access to or cor rec t ion o f t he i n f o r m a t i o n by a d d r e s s i n g your request to the Publications Sales Section, Information Services Department, 4/F, Murray Building, Garden Road, Hong Kong.
A9

政府統計處刊物 Publications of the Census and Statistics Department ^ 售 價 不 包 括 售 價 連 本 地
郵費 (港元)郵費 (港元) Price Not Price Including Including
Postage Local 刊物名fl? T i t l e o f P u b l i c a t i o n 語文 Language (HK$) ostage(HK$) 审斯刊物 Regular 半月刊 Half-monthly 金} 4經濟趨勢 Hong Kong Economic Trends 中英文 Bilingual 14.0 17.0 月刊 !Monthly 善 ib 統計月干丨J Hong Kong Monthly Digest of Statistics 中英文 Bilingual 62.0 80.0 香港^夕!^貿^ Hong Kong External Trade 中英文 Bilingual 68.0 86.0 香港留 ^ S i文 Hong Kong Trade Index Numbers 中英文 Bilingual 10.0 13.0 —九) L九年香港貿易統計: Hong Kong Trade Statistics 1999: 進口 Imports 中英文 Bilingual 丨 70.0 194.0 港產品出口及轉口 Domestic Exports and Re-exports 中英文 Bilingual 170.0 200.0
消費物價手旨數月幸- Monthly Report on the Consumer Price Index 中英文 Bilingual 22.0 26.5 手頭言f 單 按 月 計 調 查 Monthly Survey of Orders-on-hand 中英文 Bilingual 6.0 9.0 零售—銷貨額—月东 i計調查報告 Report on Monthly Survey of Retail Sales 中英文 Bilingual 3.0 5.5 季刊 Quarterly 食肆的收入及購貨額按季統計調查 Report on Quarterly Survey of Restaurant Receipts 中英文 Bilingual 3.0 5.5 幸-告 and Purchases
月 g務行業按季業務收益指數 Quarterly Business Receipts Indices for Service Industries 中英文 Bilingual 7.0 10.0 工嘉生圭按季指金 Quarterly Index of Industrial Production 中英文 Bilingual 6.0 10.0 紡織業生產全季統計數字 Quarterly Textile Production Statistics 中英文 Bilingual 3.0 5.5 —造工禾呈完成金台充言十調查幸艮告• Report on the Quarterly Survey of Construction Output 中英文 Bilingual 10.0 14.0 建築地盤就業及空缺金‘統計 _告 Quarterly Report of Employment and Vacancies at 中英文 Bilingual 14.0 18.0
Construction Sites 就業、空缺及薪金總額按季統計報告 Quarterly Report of Employment , Vacancies 中英文 Bilingual 20.0 24.5
and Payroll Statistics 綜合住戶統計調查按季統計報告 Quarterly Report on General Household Survey 中英文 Bilingual 26.0 35.0 香港能源統計 Hong K^ong Energy Statistics 中英文 Bilingual 16.0 19.0 香港船矛磁言 + Hong Kong Shipping Statistics 中英文 Bilingual 48.0 57.0 本地生產_、?直估計按季報告 Quarterly Report of Gross Domestic Product Estimates 中英文 Bilingual 12.0 15.5 製造業按_生產—賈格杀旨數 Quarterly Producer Price Indices for Manufacturing 中英文 Bilingual 4.0 7.0
Industries 服務業統計摘要按季補充資料 Quarterly Supplement to Statistical Digest of the Services 中英文 Bilingual 48.0 56.2
Sector 半年刊 Half-yearly 工•統計半年度報告 Half-yearly Report of Wage Statistics 中英文 Bilingual 20.0 24.5 業 務 展 年 計 調 查 報 告 Report on Half-yearly Business Prospects Survey 中英文 Bilingual 10.0 13.0 年刊 Yearly 一九九八年香港貿易統計: Hong Kong Trade Statistics 1998:
周年附干IJ ’ 按國轰及:^品劃分 Annual Supplement, Country by Commodity 進口 Imports 中英文 Bilingual 230.0 258.0 港產品出口及轉口 Domestic Exports and Re-exports 中英文 Bilingual 230.0 277.0
就業及空缺統計(詳細統計表): Employment & Vacancies Statistics (Detailed Tables): 甲系歹ij (月艮務業) Series A (Services Sectors) 中英文 Bilingual 64.0 72.2 乙系歹丨J ( M M 、零售、飮食及酒店業) Series B (Wholesale & Retail Trades’ Restaurants 中英文 Bilingual 28.0 32,2
& Hotels) 丙系歹丨J (工業) Series C (Industrial Sectors) 中英文 Bilingual 70.0 86.4 丁系歹丨](進 l i口貿易業) Series D (Import/Export Trades) 中英文 Bilingual 22.0 25,5
香港統計年刊一九 k 八年版 Hoiig Kong Annual Digest of Statistics 1998 Edition 中英文 Bilingual 56.0 72.4 —九九八年薪金及僱員福利統計報告 1998 Report of Salaries and Employee Benefits Statistics : 中英文 Bilingual 20.0 24.2
— 經 理 與 專 業 僱 員 Managerial and Professional Employees (高層管逼 A 員除外) (Excluding Top Management)
—九九八年消 #物價指數年報 Annual Report on the Consumer Price Index 1998 中英文 Bilingual 50.0 58.2 — 九 九 八 對 外 貿 易 回 顧 Annual Review of Hong Kong External Trade 1998 中英文 Bilingual 40.0 48.2 香港能源ij^計(一:^:^八年年•丨J) Hong Kong Energy Statistics Annual Report (1998 Edition)中英文 Bilingual 22.0 25.8 —九九七年工業生產按年統計調查報告 Report on 1997 Annual Survey of Industrial Production 中英文 Bilingual 36.0 44.2 —九九七卓批! k、零售、進口與出口貿 Report on 1997 Annual Survey of Wholesale, Retail & 中英文 Bilingual 38.0 46.2
易、食肆及酒店按年統計調查報告 Import & Export Trades, Restaurants & Hotels — A九七年•庫、通訊’財務、保險及 Report on 1997 Annual Survey of Storage, Communication,中英文 Bilingual 32.0 36.2
商用服務按年統計調査報告 Financing, Insurance & Business Services —九九七年運輸及有關服務按年統計調 Report on 1997 Annual Survey of Transport & Related 中英文 Bilingual 22.0 25.8 查報告 Services
一九九七年屋宇建築、建造及地產業按 Report on 1997 Annual Survey of Building, Construction 中英文 Bilingual 26.0 29.8 年統計調查報告 & Real Estate Sectors
—九九七年香港非製造業的外來投資 External Investments in Hong Kong's Non-manufacturing 中英文 Bilingual 26.0 29.8 Sectors, 1997 統計發展槪要(一九九九年版) An Outline of Statistical Development (1999 Edition) 中英文 Bilingual 28.0 36.2 本地生產總値估計’一九六一年至一九九八年 Estimates of Gross Domestic Product 1961 to 1998 中文 Chinese 60.0 68.2 本地生產總値估計’一九六一年至一九九八年 Estimates of Gross Domestic Product 1961 to 1998 英文 English 60.0 68.2 —九九八年按區議會分區劃分的人口及住戶 Population and Household Statistics Analysed by District 中英文 Bilingual 20.0 23.5 統計資料 Board District 1998
服務業統計摘要 Statistical Digest of the Services Sector 中英文 Bilingual 52.0 68.4 雙年刊 Biennial 香港社會及經濟趨勢(一九九七年版) Hong Kong Social and Economic Trends (1997 E d i t i o n )中英文 Bilingual ^
A l O

政府統計處刊物(續) Publications of the Census and Statistics Department (Cont'd.)
售 價 不 包 括 售 價 連 本 地
郵費 (港元)郵費 (港元)
Price Not Price Including Including
Postage Local 刊物名Wf T i t l e o f P u b l i c a t i o n 語文 Langiiaj^c (IIK$) ostage(HK$) 非 宙 斯 刊 物 N o n - r e f i i i l a r 一九九六年中期人口統計 Population By-census
簡要報告 Summary Results 中文 Chinese ]4 .0 18.2 簡要報告 Summary Results 英文 English 14.0 18.2 統計圖解 Graphic Guide 中英文 Bilingual 35.0 43.2 主要統計表 Main Tables 中英文 Bilingual 68.0 84.4 主要報告 Main Report 中文 Chinese 51.0 67.4 主要報告 Main Report 英文 English 51.0 67.4 有關各規劃統計小區的統計表: Tables for Tertiary Planning Units :
按年齡及性別劃分的人口數目 Population by Age and Sex 中英文 Bilingual 15.0 19.2 按屋宇單位類型劃分的屋宇單位� Quarters, Households and Population by Type 中英文 BUingual 16.0 20.2
住戶及人•數目 of Quarters 有關各區議會分區及選區的統言十表: Tables for District Board Districts and Consti tuency Areas:
按年齡及性別劃分的人口數目 Population by Age and Sex 中英文 Bilingual 22.0 30.2 按屋宇單位類型劃分的屋宇單位� QuarU rs,丨 louseholds and Population by Type 中英文 Bilingual 20.0 28.2
住戶及人•數目 o fQuar te r s 規劃統計小區統計表的附件— Boundary Maps Complementary to Tables for Tertiary 中英文 Bilingual 144.0 152.2
區域分舆地圖 Planning Units 區議會分區及選區統計表的附件— Boundary Maps Complementary to Tables for District 中英文 Bilingual 88.0 116.0
i域芬界地圖 Board Districts and Constituency Areas 有關各區議會分區的基本統計表 Basic Tables for District Board Districts 中英文 Bilingual 19.0 27.2 有關各規劃統計小區的基本統計表 Basic Tables for Tertiary Planning Units 舍港無 Hong Kong Island 中英文 Bilingual 28.0 36.2 九龍 Kowloon 丰英文 Bilingual 29.0 37.2 新界 New Territories 中英文 Bilingual 43.0 59.4
香港人口生命表:1991-2016 丨丨oiig Kong Life Tables 1991-2016 中英文 Bilingual 16.0 19.8 香港人口推算:1997-2016 Hong Kong Population Projections 1997-2016 中英文 Bilingual 20.0 23.8 香港人口趨勢:1981-1996 Demographic Trends in Hong Kong 1981-1996 中英文 Bilingual 40.0 56.4 香港貿易統計分類表一九九二年版’按標準 Hong Kong Trade Statistics Classification 中文 Chinese 84.0 92.2
國際貿易分類法(第三次修訂版)編製 (S.I.T.C., Rev. 3) 1992 Edition 香港貿易統計分類表一九九二年版’按標準 Hong Kong Trade Statistics Classification 英文 English 84.0 88.2
國際貿易分類法(第三次修訂版)編製 (S.I.T.C., Rev. 3) 1992 Kdilion 香港進出口貨物分類表(協調制度) 丨丨ong Kong Imports and Hxports Classification List 中文 Chinese 72.0 88.4
—九九六年版 (Harmonized System) 1996 Edition 香港進出口貨物分類表(協調制度) 丨丨ong Kong Imports and Exports Classification List 英文 English 72.0 88.4
—;^^九六年版 (I larmonized System) 1996 Edition 香港貨物名稱及編號協調制度手冊 丨丨ong Kong Harmonized Commodity Description and 中文 Chinese 10.0 13.8
—九九二年^^ Coding System Handbook 1992 Edition 香港貨物名稱及編號協調制度手冊 Hong Kong Harmonized Commodity Description and 英文 English 10.0 13.8
—九九二年版 Coding System Handbook 1992 Edition 香港標準行業分類(第一冊) 丨丨ong Kong Standard Industrial Classification (Volume 1 ) 中 文 Chinese 135.0 151.4 香港標準行業分類(第一冊) n o n g Kong Standard Industrial Classification (Volume 1 ) 英 文 &iglish 135.0 163.0 香港標準行業分類(第二冊) 丨丨ong Kong Standard Industrial Classification (Volume 2 ) 中 文 Chinese 68.0 84.4 香港標準行業分類(第二冊) 丨丨ong Kong Standard Industrial Classification {Volume 2 ) 英 文 English 48.0 56.2 —九九四至九五年住戶開支統計調查 1994/95 Household Expenditure Survey and the Rebasing 中英文 Bilingual 30.0 38.2
及重訂消費物價指數基期 of the Consumer Price Indices 從綜合住戶統計調查搜集所得的社會 Social Data Collected via the General Household Survey:
資料••專題報告書第二十二號 Special Topics Report No. 22 中英文 Bilingual 30.0 38.2 —九九四在香港發生的罪案及其事主 (’mne and Its Victims in丨long Kong 1994 中文 Chinese 54.0 62.2 —九九四在香港發生的罪案及其事主 Crime and Its Victims in Hong Kong 1994 英文 English 54.0 62.2 1削似口後或彳了修訂D外地哪彻降於收到,丨I購求後Wfr迎知“
存關購口上列刊物的丧詢’請致Vli政府新問處刊物銷彳f丨小組2842 8844或2842 8845 “ Prices are subject to revision. Postage for external mailings will be advised upon receipt of orders. For enquiries concerning purchase of the above publications, please call Publications Sales Section of Infomiation Services Department at 2842 8844 or 2842 8845.
A l l

政府統計處刊物(續)
Publications of the Census and Statistics Department (Cont'd.)
雷 子 刊 物 Electronic Publications 語文 Language 定期刊物 Rtimiar 月刊 Month ly
香港對外貿易唯讀光碟(每月最新統計數字) Hong Kong External Trade CD-ROM (Monthly Updates) 英文 English
年刊 Year ly 香港對外貿易唯讚光碟(周年版) Hong Kong External Trade CD-ROM (Annual Edition) 英文 English 以上兩套光碟由黃關有限公司生產及銷售� The above two sets of CD-ROM are produced and marketed by 查詢及言丁購‘請直接致電該公司 Huang Kwan & Associates Ltd. For enquiries and purchase, (電話 - 2 8 1 1 0 0 7 9 ) � please contact the company direct on 2811 0079. 非 H?期刊物 Non-regular —九九六年中期人•統計 1996 Population By-census 英文 English
統計表唯讚光碟 - t a b on CD-ROM (包括 3 2 4個有關本港人•的社會及經濟 (Contains 324 statistical tables on a broad range of socio-economic 特徵白勺統言十表�) characteristics of the population of Hong ICong.)
地圖唯讀光碟 -MAP on CD-ROM (包括一套數碼化的香港地圖’用以將「統 (Contains digital maps of Hong Kong for geographical presentation of 計表唯 i賫光碟」內的統計數據作地域顯示用� ) statistical data contained in the ”TAB on CD-ROM".)
關於購買以上兩套光碟事宜’請電 2716 8 0 4 9 � Please call 2716 8049 for matters relating to the purchase of the above two sets of CD-ROM.
S U P E R M A P Hong Kong 1996 SUPERMAP Hong Kong 1996 英文 English 由黃關有限公司生產及銷售的唯讀光碟,將 CD-ROM produced and marketed by Huang Kwan & Associates Ltd. —九九六年中期人口統計結果和數碼化地圖 T丨le product bundles the 1996 Population By-census results and the 整合連接’並酉己以特製的應用程式‘大大地 digital maps in an integrated manner. Tailor-made utilities are included 方便使用者檢索及運用數據’以進行地域顯 to greatly facilitate users in retrieving and using the data to perform 示禾口分析 ° 查詢及言丁購‘言靑直接致電言亥公司 geographical presentation and analysis. For enquiries and purchase, (電話 : 2 8 1 1 0079) “ please contact the company direct on 2811 0079.
A 1 2

政府統計處刊物(續) Publications ofthe Census and Statistics Department (Cont'd.)
査詢電話
Enquiry Telephone
免费刊物 Free Publ icat ions 語文 Language Number
月刊 Monthly 僱用於政府建築工程的工人每日平均 Average Daily Wages of Workers Engaged in 中英文 Bilingual 2582 4641 工資 Government Building and Construction Projects
特選建築材料的平均批發價 Average Wholesale Prices of Selected Building 中文 Chinese 2805 6404 Materials 特選建築材料的平均批發價 Average Wholesale Prices of Selected Building 英文 English 2805 6404 Materials 政府合約的工資及材料成本指數 Index Numbers o f the Costs of Labour and Selected 中英文 Bilingual 2805 6404 Materials used in Government Contracts 公營建築工程的工資及材料成本指數 Index Numbers of the Costs of Labour and Materials 中英文 Bilingual 2805 6404 used in Public Sector Construction Projects 對外貿易數字 External Trade Figures 中英文 Bilingual 2582 4915 季刊 Quarterly 按產品所 P 工業劃分的本港製造業產品 Domestic Exports of Manufactured Goods Classified 中英文 Bilingual 2805 6643
出•統計婁女字 by Industrial Origin 年刊 Yearly —九九九年編訂香港統計數字一覽 丨丨ong Kong in Figures, 1999 Edition 中文 Chinese 2582 5073 —九九九年編訂香港統計數字一覽 Hong Kong in Figures, 1999 Edition 英文 English 2582 5073
(如欲索取以上免費刊物‘言靑致電有關的查詢電話“) (Please call the corresponding enquiry telephone numbers if you want to have copies of the above free publications.)
A13

圓_圓||||||||||丨| J 6 8 0 1 9 9 0 0 B 0
$64


![2013~] 完全二線式照明遙控系統](https://static.fdokumen.com/doc/165x107/63225b4a28c445989105bce1/2013--1677438647.jpg)