레이저 스캐닝 및 빌딩 정보 모델링을 활용한 비접촉식 프리 ...
175
박사 학위논문 Ph. D. Dissertation 레이저 스캐닝 및 빌딩 정보 모델링을 활용한 비접촉식 프리캐스트 콘크리트부재 품질평가 Noncontact Quality Assessment of Precast Concrete Elements using 3D Laser Scanning and Building Information Modeling 김 민 구 (金 珉 玖 Kim, Min-Koo) 건설 및 환경공학과 Department of Civil and Environmental Engineering KAIST 2015
-
Upload
khangminh22 -
Category
Documents
-
view
3 -
download
0
Transcript of 레이저 스캐닝 및 빌딩 정보 모델링을 활용한 비접촉식 프리 ...

박사 학위논문 Ph. D. Dissertation
레이저 스캐닝 및 빌딩 정보 모델링을 활용한 비접촉식
프리캐스트 콘크리트부재 품질평가
Noncontact Quality Assessment of Precast Concrete Elements using
3D Laser Scanning and Building Information Modeling
김 민 구 (金 珉 玖 Kim, Min-Koo)
건설 및 환경공학과
Department of Civil and Environmental Engineering
KAIST
2015

레이저 스캐닝 및 빌딩 정보 모델링을 활용한 비접촉식
프리캐스트 콘크리트부재 품질평가
Noncontact Quality Assessment of Precast Concrete Elements using
3D Laser Scanning and Building Information Modeling


Noncontact Quality Assessment of Precast Concrete Elements using
3D Laser Scanning and Building Information Modeling
Advisor : Professor Hoon Sohn
Co-advisor : Professor Chih-Chen Chang
By
Min-Koo Kim
Department of Civil and Environmental Engineering
KAIST
A dissertation submitted to the faculty of KAIST in partial fulfillment of the
requirements for the degree of Doctor of Philosophy in the Department of Civil
and Environmental Engineering. The study was conducted in accordance with
Code of Research Ethics1.
2014. 11. 28
Approved by
Professor Hoon Sohn
[Major Advisor]
1Declaration of Ethical Conduct in Research: I, as a graduate student of KAIST, hereby declare that I have not
committed any acts that may damage the credibility of my research. These include, but are not limited to:
falsification, thesis written by someone else, distortion of research findings or plagiarism. I affirm that my
thesis contains honest conclusions based on my own careful research under the guidance of my thesis advisor.


레이저 스캐닝 및 빌딩 정보 모델링을 활용한 비접촉식
프리캐스트 콘크리트부재 품질평가
김 민 구
위 논문은 한국과학기술원 박사학위논문으로
학위논문심사위원회에서 심사 통과하였음.
2014 년 11 월 28 일
심사 위원장 손 훈 (인)
심 사 위 원 Chih-Chen Chang
심 사 위 원 명 현 (인)
심 사 위 원 심 창 수 (인)
심 사 위 원 Lambros Katafygiotis
심 사 위 원 Jack C. P. Cheng


i
DCE
20105289
김 민 구. Kim, Min-Koo. Noncontact Quality Assessment of Precast Concrete Elements
using 3D Laser Scanning and Building Information Modeling. 레이저 스캐닝 및 빌딩
정보 모델링을 활용한 비접촉식 프리캐스트 콘크리트부재 품질평가. Department
of Civil and Environmental Engineering. 2015. 148 p. Advisor Prof. Sohn, Hoon, Co-
Advisor Prof. Chang, Chih-Chen Text in English
ABSTRACT
As precast concrete based rapid construction becomes more commonplace and standardized in
the construction industry, checking the conformity of dimensional and surface qualities of precast concrete
elements to the specified tolerances has become ever more important to prevent construction failures.
Moreover, as BIM gains popularity due to increasing demand for information technology (IT) in the
construction industry, autonomous and intelligent QA techniques that are interoperable with BIM and a
systematic data storage and delivery system for dimensional and surface QA of precast concrete elements
is urgently needed. The current method for dimensional and surface QA of precast concrete element relies
largely on manual inspection and contact-type measurement devices, which are time consuming and costly.
To overcome the limitations of the current precast concrete QA method, this study aims to develop
intelligent precast concrete QA techniques based on 3D laser scanning and BIM technology. There are four
research cores investigated in this study, which are (1) dimensional and surface QA techniques, (2) BIM
based QA data storage and management framework (3) scan parameter optimization for accurate QA and
(4) validation through field tests.
Two QA techniques are developed in this study. Firstly, a non-contact measurement technique
that automatically measures and assessed the dimensional qualities of precast concrete elements is
developed using a 3D laser scanner. A robust edge extraction algorithm, which is able to extract only the
scan points within the edges of a target precast concrete element, is developed based on a unique
characteristic of scan points captured from the laser scanner. Moreover, to increase the dimensional
estimation accuracy, a compensation model is employed to account for the dimension losses caused by the
mixed pixel problem of laser scanners. Experimental tests on a lab scale specimen as well as lab scale
actual precast concrete elements are performed to validate the effectiveness of the proposed technique.
Secondly, a surface QA technique that simultaneously localizes and quantifies surface defects on precast
concrete surfaces is developed. Defect sensitive features, which have complementary properties to each
other, are developed and combined for improved localization and quantification of surface defects on
precast concrete elements. A defect classifier is also developed to automatically determine whether the
investigated surface region is damaged, where the defect and its size is located. To validate the robustness
of the proposed surface QA technique, numerical simulations and experiments are conducted.

ii
For data storage and management for QA of precast concrete elements, a BIM-based data storage
and management framework is proposed. The framework aims to answer four essential questions for
precast concrete QAs, which are (1) what the inspection checklists should be; (2) what the quality
inspection procedure should be employed; (3) which kind of laser scanner is appropriate and which scan
parameters are optimal for the intended quality inspection; and (4) how the inspection data should be
stored and delivered. The feasibility of the proposed framework for dimensional and surface QA of precast
concrete elements is investigated through case studies where dimensional errors and surface defects within
lab-scale precast slabs are detected and those QA data are systematically stored and managed with help of
BIM.
In scan parameter optimization, a method of selecting optimal scan parameters of a laser scanner
is proposed to ensure that the proposed dimensional QA technique provides satisfactory accuracy. It was
found in the experimental results of the previous study that dimensional estimation accuracy is largely
influenced by scan parameters, especially in the incident angle between the laser scanner and target object.
Hence, to find optimal scan parameters for dimensional QA, a simulation model that estimates the laser
beam position of the laser scanner is developed by constructing the geometric position of the laser beam
and contaminating the measurement noise of the laser beam into the mathematical laser beam position.
Comparison tests with experiments are conducted to validate the laser beam model, and parametric studies
with different scan parameters are implemented based the developed model to find optimal scan
parameters.
Finally, this research validates the effectiveness of the proposed QA techniques and the data
storage and management system through field tests. In the field test, two types of full-scale precast
concrete slabs with complex geometries are scanned in a precast concrete factory and dimensional QA
checklists including dimension and positions are inspected. The challenges encountered during the data
analysis of the full-scale test are discussed and addressed. In addition, a comparison test with the
conventional deviation analysis is conducted and the robustness of the developed dimensional QA
technique is demonstrated. Furthermore, a cloud-BIM web-service is employed to investigate the potential
of the proposed data storage and management system for QA of precast concrete elements.
Keywords: 3D laser scanning, building information modeling (BIM), dimensional quality assessment,
precast concrete element, surface quality assessment

iii
TABLE OF CONTENTS ABSTRACT ............................................................................................................................................ i
TABLE OF CONTENTS ..................................................................................................................... iii
LIST OF TABLES ............................................................................................................................... vii
LIST OF FIGURES ............................................................................................................................. ix
1 INTRODUCTION ......................................................................................................................... 1
1.1 Research Background .............................................................................................................. 1
Precast concrete element based rapid construction .................................................. 1 1.1.1
Quality assessment of precast concrete elements ..................................................... 2 1.1.2
1.2 Literature Review .................................................................................................................... 3
Non-contact sensing based quality assessment ........................................................ 3 1.2.1
Data storage and delivery for quality assessment .................................................... 5 1.2.2
1.3 Research Objectives and Scope ............................................................................................... 7
1.4 Research Means ....................................................................................................................... 9
3D laser scanning technology .................................................................................. 9 1.4.1
Building information modeling (BIM) ................................................................... 11 1.4.2
1.5 Organization .......................................................................................................................... 13
2 QUALITY ASSESSMENT TECHNIQUE I: DIMENSONAL ESTIMATION ..................... 15
2.1 Chapter Introduction .............................................................................................................. 15
2.2 Related Work ......................................................................................................................... 16
Surface reconstruction using point cloud data ....................................................... 16 2.2.1
Three-dimensional edge detection ......................................................................... 16 2.2.2
Object recognition and classification based on point cloud data ........................... 17 2.2.3
Laser scanning-based quality inspection of concrete structures ............................ 17 2.2.4
2.3 Development of an Automated Dimensional Quality Assessment Technique ....................... 18
Data acquisition ...................................................................................................... 19 2.3.1
Data pre-processing ................................................................................................ 19 2.3.2
Edge and corner extraction ..................................................................................... 23 2.3.3
Compensation for edge dimension loss .................................................................. 26 2.3.4
Dimension estimation & quality assessment .......................................................... 28 2.3.5
2.4 Dimensional Assessment Test of a Laboratory Specimen ..................................................... 29
Description of test and laboratory specimen .......................................................... 29 2.4.1
Laboratory experiment results ................................................................................ 30 2.4.2
2.5 Application to Actual Precast Concrete Panel ....................................................................... 38
Test configuration ................................................................................................... 38 2.5.1
Experimental results ............................................................................................... 39 2.5.2
2.6 Chapter Summary .................................................................................................................. 42

iv
3 QUALITY ASSESSMENT TECHNIQUE II: SURFACE DEFECT ESTIMATION ........... 43
3.1 Chapter Introduction .............................................................................................................. 43
3.2 Related Work ......................................................................................................................... 44
Vision camera-based surface quality inspection .................................................... 44 3.2.1
Laser scanning-based surface quality inspection ................................................... 45 3.2.2
3.3 Surface Defect Quality Assessment Technique for Precast Concrete Elements .................... 45
Coordinate transformation ..................................................................................... 46 3.3.1
Defect-sensitive features ........................................................................................ 48 3.3.2
Defect identification and quantification procedures .............................................. 51 3.3.3
3.4 Numerical Simulation ............................................................................................................ 54
Numerical setup ..................................................................................................... 54 3.4.1
Simulation results ................................................................................................... 54 3.4.2
3.5 Laboratory Experiments ........................................................................................................ 57
Laboratory specimen test configuration ................................................................. 57 3.5.1
Laboratory Test Results .......................................................................................... 58 3.5.2
3.6 Actual Concrete Panel Test .................................................................................................... 62
3.7 Discussion.............................................................................................................................. 64
3.8 Chapter Summary .................................................................................................................. 65
4 BIM-BASED QUALITY ASSESSMENT SYSTEM OF PRECAST CONCRETE
ELEMENTS ........................................................................................................................................ 67
4.1 Chapter Introduction .............................................................................................................. 67
4.2 Related Work ......................................................................................................................... 67
4.3 Development of a Framework for Dimensional and Surface QA of Precast Concrete
Elements .......................................................................................................................................... 69
Inspection checklists .............................................................................................. 70 4.3.1
BIM and laser scanning based quality assessment procedure ................................ 71 4.3.2
Selection of optimal scanner and scan location ..................................................... 72 4.3.3
Data storage and delivery method .......................................................................... 76 4.3.4
4.4 Case Studies........................................................................................................................... 78
Selection of inspection checklists and laser scanner .............................................. 78 4.4.1
Test specimens ....................................................................................................... 80 4.4.2
Data analysis .......................................................................................................... 81 4.4.3
Test results and data storage and delivery .............................................................. 83 4.4.4
4.5 Chapter Summary .................................................................................................................. 87
5 OPTIMAL SCAN PARAMETER SELECTION FOR ENHANCED QUALITY
ASSESSMENT .................................................................................................................................... 89
5.1 Chapter Introduction .............................................................................................................. 89
5.2 Research Background ............................................................................................................ 90
Measurement error sources of laser scanners ......................................................... 90 5.2.1
Signal deterioration with scanning geometry ......................................................... 91 5.2.2
5.3 Laser Beam Simulation Model .............................................................................................. 94

v
Position modeling .................................................................................................. 94 5.3.1
Measurement noise modeling ................................................................................ 95 5.3.2
5.4 Validation of the Laser Beam Model ..................................................................................... 99
5.5 Selection of Optimal Scan Parameter .................................................................................. 100
5.6 Chapter Summary ................................................................................................................ 104
6 APPLICATION TO FULL-SCALE PRECAST CONCRETE ELEMENTS ...................... 105
6.1 Chapter Introduction ............................................................................................................ 105
6.2 Full-scale Application of Dimensional Quality Assessment Technique .............................. 106
Test configuration ................................................................................................. 106 6.2.1
Improved coordinate transformation algorithm ................................................... 108 6.2.2
Improved edge and corner extraction algorithm .................................................. 113 6.2.3
Field test results ................................................................................................... 115 6.2.4
6.3 Cloud-BIM based Inspection Data Storage and Management............................................. 121
Introduction of loud-BIM for QA of precast concrete element ............................ 121 6.3.1
System architecture of the proposed cloud-BIM .................................................. 122 6.3.2
Data matching method ......................................................................................... 123 6.3.3
Extension of IFC file for the inspection QA data ................................................. 125 6.3.4
Data matching and IFC extension result .............................................................. 125 6.3.5
6.4 Chapter Summary ................................................................................................................ 128
7 CONCLUSION .......................................................................................................................... 129
7.1 Summary of the Work .......................................................................................................... 129
7.2 Uniqueness of the Work....................................................................................................... 131
7.3 Future Work ......................................................................................................................... 132
REFERENCES .................................................................................................................................. 135
SUMMARY (IN KOREAN) ............................................................................................................. 145
ACKNOWLEDGEMENT ................................................................................................................ 147
CURRICULUM VITAE ................................................................................................................... 149

vi

vii
LIST OF TABLES
Table 1.1 Comparison of technical specifications of 3D measurement sensors. ................................ 10
Table 2.1 Dimension estimation fomula with dimensional compensation ......................................... 28
Table 2.2 Experiment scenario - laser scanning parameters ............................................................... 29
Table 2.3 Average dimension estimation error of the three target objects, the panel and two
rectangular holes, with varying scan parameters ................................................................................ 32
Table 2.4 Average position estimation error of the two rectangular holes with varying scan parameters
............................................................................................................................................................ 32
Table 2.5 Squareness estimation error of the panel with varying scan parameters ............................ 33
Table 2.6 Dimension estimation error of precast concrete panels I & II and their six shear pockets. 40
Table 2.7 Position estimation error of the six shear pockets for precast concrete panels I&II. .......... 41
Table 2.8 Squareness estimation error of precast concrete panels I&II. ............................................ 41
Table 2.9 Manual inspection error of precast concrete panels I & II and their six shear pockets ...... 42
Table 3.1 Summary of defect localization and quantification results (simulation) ............................ 56
Table 3.2 Experiment scenario - laser scanning parameters ............................................................... 58
Table 3.3 Summary of defect localization and quantification results (laboratory test) ...................... 59
Table 3.4 Defect localization results (concrete panel test) ................................................................. 63
Table 3.5 Defect volume loss estimation results (concrete panel test) ............................................... 64
Table 4.1 Inspection checklists for precast concrete elements ........................................................... 70
Table 4.2 Specifications of commercial 3D laser scanners ................................................................ 79
Table 4.3 Dimensional estimation results from precast panel I .......................................................... 84
Table 4.4 Surface defect characterization results from precast panel II ............................................. 85
Table 5.1 Validation of the proposed laser beam model with varying scan parameters ................... 100
Table 5.2 Dimensional estimation results with varying scan parameters for the simulation............ 101
Table 6.1 Specifications of the tested scan parameter and precast slab............................................ 108
Table 6.2 Dimensional estimation results compared with the blueprint for precast slab type I ........ 117
Table 6.3 Dimensional estimation results compared with manual measurement for precast slab type I
........................................................................................................................................................... 117
Table 6.4 Dimensional estimation results compared with the blueprint for precast slab type II ....... 119
Table 6.5 Dimensional estimation results compared with manual measurement for precast slab type II
........................................................................................................................................................... 119
Table 6.6 Dimensional estimation comparison with conventional deviation analysis for precast slab
type I ................................................................................................................................................. 120

viii
Table 6.7 Comprison of time required for the DQA of precast slab type I among three different
methods ............................................................................................................................................. 120
Table 6.8 Properties of the proposed IFC property set “QualityAssessment” .................................. 125

ix
LIST OF FIGURES
Figure 1.1 Utilization of precast concrete elements in the construction industry: (a) Bulidings; (b)
Bridges .................................................................................................................................................. 2
Figure 1.2 Working principles of 3D laser scanners: (a) Time-of-flight scanners; (b) Phase-shift
scanners ................................................................................................................................................. 9
Figure 1.3 Conceptual diagram of Building Information Modeling (BIM) ........................................ 11
Figure 2.1 Dimensional quality assessment of precast concrete elements: (a) Dimensions; (b)
Squareness; (c) Straightness; (d) Flatness. .......................................................................................... 15
Figure 2.2 The proposed precast concrete dimensional QA technique: (a) Schematic of overall system
configuration; (b) Dimensional QA procedures .................................................................................. 18
Figure 2.3 Coordinate transformation from a laser scanner to the target object: (a) Laser scanner
coordinate system; (b) Object coordinate system ............................................................................... 19
Figure 2.4 Autonomous determination of three corner points of the target object from a range image:
(a) The initial range image of a target specimen; (b) Edge and corner detection in the binary image
using the Canny edge detector and the Hough transform; (c) Determination of three points near the
corner of the target object. .................................................................................................................. 20
Figure 2.5 Three pixel point selection algorithm for the automated coordinate transformation ........ 20
Figure 2.6 Elimination of unnecessary scan points and dimensional reduction: (a) Removal of scan
points outside the target object with margins; (b) Dimensional reduction through projection of the
filtered points onto a fitted plane. ....................................................................................................... 22
Figure 2.7 Vector-sum algorithm for a scan (reference) point inside the target object: (a)
Determination of eight nearest neighboring points around the reference point; (b) Vector
representation from the reference point to each the eight nearest neighboring points; (c) Vector-sum of
the eight vectors (the magnitude of vector-sum is zero). .................................................................... 23
Figure 2.8 Vector-sum algorithm for a scan (reference) point along the edge of the target object: (a)
Determination of eight nearest neighboring points around the reference point; (b) Vector
representation from the reference point to each of the eight nearest neighboring points; (c) Vector-sum
of the eight vectors (the magnitude of vector sum is 5 times of the spacing interval). ....................... 24
Figure 2.9 Removal of non-edge points from edge candidate points: (a) A set of edge candidate points
identified by the Vector-sum algorithm; (b) If the reference point is indeed on the edge of the target
object, the distance from the reference point to the 8th closest neighboring point should be about four
times of the spacing interval; (c) For a non-edge reference point, the neighboring points are sparsely
scattered and the distance from the reference point to the 8th closest point would be much longer. . 25
Figure 2.10 Mixed-pixel phenomenon: (a) The mixed-pixel phenomenon typically occurs at the
boundaries of an object where the laser beam is split into two and reflected from two discontinuous
surfaces; (b) An example of mixed-pixels from laser scanning data. ................................................. 26
Figure 2.11 Dimensional loss compensation model (Tang et al. 2009) ............................................. 26
Figure 2.12 Laboratory test configuration and specimen: (a) Test set-up; (b) Dimensions of the
laboratory test specimen ..................................................................................................................... 29

x
Figure 2.13 Edge and corner points extraction results (scanning parameters of 8 m scan distance, 0°
incident angle, and 0.009° angular resolution): (a) Scan points projected onto a fitted plane; (b) Edge
points extraction using the Vector-sum algorithm; (c) Removal of the non-edge points; (d) Corner
detection. ............................................................................................................................................. 31
Figure 2.14 Effects of scan parameters on dimension and position estimations: (a), (b) and (c)
investigate effects of distance, incident angle and angular resolution on dimensions of three targets,
respectively. (d), (e) and (f) investigate effects of distance, incident angle and angular resolution on
positions of two rectangular holes, respectively. ................................................................................ 34
Figure 2.15 Edge point extraction results with a large incident angle: (a) With scan parameters
(distance 8 m, incident angle 0° and angular resolution 0.018°); (b) With incident angle of 45°. ...... 35
Figure 2.16 Scanning with increasing incident angle: (a) Distortion of the beam spot from a circle to
an ellipse shape and increase of the scan spacing are occurred as incident angle increases; (b) The
right side of the two shear pockets contains the scan points of the side regions of the objects. ......... 36
Figure 2.17 The effect of angular resolution on edge point extraction (at 4 m distance and with 15°
incident angle): (a) 0.009° angular resolution, and (b) 0.036° angular resolution ............................. 37
Figure 2.18 Experimental setup and dimensions of precast concrete panels: (a) Test configuration; (b)
Dimension specifications. ................................................................................................................... 38
Figure 2.19 Edge and corner extraction results on: (a) Precast concrete panel I; (b) Precast concrete
panel II (obtained with angular resolution of 0.009°) ......................................................................... 39
Figure 3.1 Surface quality assessment of precast concrete elements: (a) Spallings; (b) Warping and
fissuring .............................................................................................................................................. 43
Figure 3.2 Overview of the proposed precast concrete spalling defect detection technique: (a) Laser
scanner configuration for precast concrete surface scanning; (b) Procedures for the proposed defect
localization and quantification ............................................................................................................ 46
Figure 3.3 Determination of three points of the target object from a range image for coordinate
transformation: (a) The initial range image of a target specimen within a ROI; (b) Edge and corner
detection using the canny edge detection and Hough transform in a binary image; (c) Determination of
three points near the corners of the target object ................................................................................ 46
Figure 3.4 Three point selection algorithm for automated coordinate transformation ....................... 47
Figure 3.5 Definitions of defect sensitive features: (a) Overview of scan points lying on a concrete
surface (b) Definition of the angle deviation from the reference direction in the x-z plane view; (c)
Definition of the distance deviation from the globally fitted plane in the x-z plane view .................. 48
Figure 3.6 Procedures for concrete surface defect identification ....................................................... 52
Figure 3.7 Configuration of numerical simulation model: (a) Two types of spalling defects: Concave-
shape defect with a maximum deviation of 2 mm (damage I) from the surface, and flat-top defect with
a uniform 2 mm deviation (damage II); (b) Cross-section view of the concave and flat-top defects in
x-z plane .............................................................................................................................................. 54
Figure 3.8 Defect localization results (numerical simulation): (a) Angle deviation from the reference
direction (DI1); (b) Distance deviation from the globally fitted plane (DI2); (c) Combination of two
defect indices (DI);(d) Defect classification (the red lines indicate the boundaries of the actual defect
areas, and the regions with white color are the detected defect regions) ............................................ 55

xi
Figure 3.9 Definition of recall and precision ratios used for the evaluation of defect localization
performance. Recall ratio represents the ratio of the correctly detected defect area (B) to the actual
defect area (B+C), and the precision ratio denotes the rate of the correctly detected defect area (B) to
the estimated defect area (A+B) ......................................................................................................... 56
Figure 3.10 Laboratory test configuration and test specimen: (a) Test configuration; (b) Dimensions
of the specimen and induced defects ................................................................................................... 57
Figure 3.11 Defect localization results (laboratory test with 8 m scan distance, 0.009° angular
resolution, and 0° incident angle): (a) Angle deviation from the reference direction (DI1); (b) Distance
deviation from the globally fitted plane (DI2); (c) Combination of two damage features (DI); (d)
Defect classification (the red lines indicate the boundaries of the actual defect area, and the regions
with white color are the detected defect regions) ............................................................................... 58
Figure 3.12 The effects of the scan parameters on defect localization: (a) Reference scan parameters
(8 m distance, 0° incident angle, and 0.009° angular resolution); (b) 12 m distance; (c) 30° incident
angle; (d) 0.018° angular resolution .................................................................................................... 60
Figure 3.13 The effects of scan distance, angular resolution and incident angle on scan spacing: (a)
The number of scan points within each subdivision decreases with a longer scan distance or coarser
angular resolution; (b) With an increasing incident angle, subdivisions located at the defect edges may
not have any scan points ..................................................................................................................... 61
Figure 3.14 Test set-up and actual concrete panel: (a) Test configuration; (b) Dimensions of the
specimen and induced defects ............................................................................................................. 62
Figure 3.15 Defect localization results (concrete panel test): (a) Angle deviation from the reference
direction (DI1); (b) Distance deviation from the globally fitted plane (DI2); (c) Combination of two
defect indices (DI); (d) Defect classification (the red lines indicate the boundaries of the actual defect
areas, and the regions with white color are the detected defect regions) ............................................ 63
Figure 4.1 Overview of National BIM Strandard (NBIMS) .............................................................. 68
Figure 4.2 Overview of the proposed precast concrete quality assessment system combined with BIM
and laser scanning: (a) Configuration for 3D laser scanning of a precast concrete element; (b) Two
major modules within the proposed inspection system in relation to BIM ......................................... 69
Figure 4.3 Proposed BIM and laser scanning based precast concrete quality assessment procedure 71
Figure 4.4 Criteria for optimal selection of a laser scanner for precast concrete quality inspection . 73
Figure 4.5 A mathematical model for the determination of the subdivision size, which is necessary for
optimal detection of defects within a precast concrete element .......................................................... 74
Figure 4.6 Schematic diagram of data storage and delivery for dimensional and surface quality
assessment of precast concrete elements ............................................................................................ 76
Figure 4.7 IFC based entity relationship model for the precast concrete element quality inspection 77
Figure 4.8 Test specimens for the dimensional estimation and surface defect characterization: (a) A
photo and dimensions of the precast panel I used for dimensional estimation test; (b) A photo and
defect dimensions of the precast panel II used for surface defect characterization test ...................... 80
Figure 4.9 Results of edge and corner point extraction as part of dimensional estimation (obtained by
scanning precast panel I with angular resolution of 0.009°) ............................................................... 83

xii
Figure 4.10 Characterization results of surface defects on precast panel II (obtained with angular
resolution of 0.009°): (a) Visualization of unified defect index (DI); (b) Defect classification result
(the red lines indicate the boundaries of the actual defect areas, and the regions with white color are
the detected defect regions)................................................................................................................. 83
Figure 4.11 IFC representation of dimensional estimation results of precast panel I: (a) Hierarchical
structure of IFC entities and attributes; (b) 3D BIM model of precast panel I with dimensional
inspection results; (c) IFC data tree for the dimensional inspection results ........................................ 86
Figure 4.12 IFC representation of surface defect characterization results of precast panel II: (a)
Hierarchical structure of IFC entities and attributes; (b) 3D BIM model of precast panel II with defect
characterization results; (c) IFC data tree for the defect characterization results ............................... 87
Figure 5.1 Schematic illustration of different surface scattering models (Rees 2001) ....................... 91
Figure 5.2 Schematic description of the energy distribution of a laser beam with different incident
angle: (a) With a perpendicular laser beam (𝛼 = 0); (b) With an incident angle 𝛼 to the normal N of a
planar surface placed at a distance d. .................................................................................................. 92
Figure 5.3 Geometric model for the position of a laser beam on the surface of an object ................. 94
Figure 5.4 Procedures for the proposed measurement noise modeling .............................................. 95
Figure 5.5 Test set-up for collection of base scan sets for measurement noise modeling .................. 97
Figure 5.6 Measurement noises with increasing scan distance and incident angles .......................... 98
Figure 5.7 Comparison of edge extraction performance between the proposed laser beam model and
the experiment resultsin in cases of incidence angle 0° and 30°: (a) Simulation and (b) Experiment 99
Figure 5.8 Tested virtual precast slab specimen for selection of optimal scan parameters .............. 100
Figure 5.9 Visualization of the dimension estimation result of the simulation test: (a) Dimension error
plot in 3D; (b) Dimension error plot in 2D; and (c) Classfication result of optimal scan parameter 101
Figure 5.10 Classification of optimal scan parameter in the two feature domain ............................ 103
Figure 6.1 Test configuration of the full-scale dimensional QA: (a) Test set-up; (b) Top view of the
inspected precast slabs ...................................................................................................................... 106
Figure 6.2 Blueprint (top view) of the precast slab type I and II ..................................................... 106
Figure 6.3 The range image of precast slab type I ........................................................................... 109
Figure 6.4 Removal of background scan points: (a) Selection of a threshold for data cleansing; (b)
Data cleansing result ......................................................................................................................... 109
Figure 6.5 Four corner pixel extraction of a range image: (a) Generation of a range image; (b) Edge
detection; (c) Line extraction using Hough transform and (d) Corner detection ............................... 110
Figure 6.6 Finding of an ideal left-side direction of the slab for coordinate transformation: (a) Ideal
coordinate system; (b) Example of an abnormal slab with a manufacturing error (red dotted line); (c)
Coordinate transformation result with a biased left-side direction AD of the slab; (d) Finding of an
ideal left-side direction AD by best matching .................................................................................... 111
Figure 6.7 Pseudo code for finding the ideal left-side direction AD of the slab ............................... 112
Figure 6.8 Varying incident angle according to different positions of the precast slab .................... 113

xiii
Figure 6.9 Effect of external attachments on edge extractions: (a) A photo of steel bar for lifting; (b)
The edge extraction result containing scan points of the steel bars ................................................... 114
Figure 6.10 Near-field non-edge point removal based on the RANSAC algorithm ......................... 114
Figure 6.11 Data processing results of the precast slab type I .......................................................... 115
Figure 6.12 Dimensional estimation results compared with blueprint for precast slab type I: (a)
dimension; (b) position ...................................................................................................................... 116
Figure 6.13 Dimensional estimation results compared with manual measurement for precast slab type
I: (a) dimension; (b) position ............................................................................................................. 116
Figure 6.14 Dimensional estimation results compared with blueprint for precast slab type II: (a)
Dimension; (b) Position ..................................................................................................................... 118
Figure 6.15 Dimensional estimation results compared with manual measurement for precast slab type
II: (a) Dimension; (b) Position ........................................................................................................... 118
Figure 6.16 Deviation analysis between the design model and as-built model of precast slab type I120
Figure 6.17 System architecture of the proposed cloud-BIM based data storage and management for
precast concrete QA .......................................................................................................................... 122
Figure 6.18 Data matching method between the QA results and the design BIM model for precast slab
I ......................................................................................................................................................... 123
Figure 6.19 Data matching result between as-design and as-built geometries for both precast slab type
I & II ................................................................................................................................................. 126
Figure 6.20 Property set and its properties for precast concrete QA shown in IFC viewer ............. 127
Figure 6.21 Screen-shot of the user interface of the cloud-BIM system for precast concrete QA ... 128

xiv

Chapter 1.Introduction
1
1 INTRODUCTION
1.1 Research Background
Precast concrete element based rapid construction 1.1.1
The construction industry is typically characterized by labor intensity technology, hard labor
conditions, low productivity, and high risks (Kazaz and Ulubeyli 2008). According to the UNEP
(UNEP Report 2002), these problematic conditions mainly result from the slow integration of
technological advances and industrialization principles such as computer-aided construction,
automation, standardization and modularization. Precast concrete element based construction is one
construction method that uses the principles of industrialization in the construction process. Over the
last few decades, precast concrete elements have become a popular component for construction
projects such as low- and mid-rise apartments, office buildings and bridges (Figure 1.1). According to
a survey (Arditi et al. 2000), they are employed all over the globe, especially in many European
countries including the United Kingdom, Netherlands and Italy. It was reported that the market share
of precast concrete element based construction across the European Union (EU) is between 20-25%,
and is 40-50% in northern European countries (YEMAR Report 2006).
Precast (also known as ‘prefabricated’) literally means that structural concrete components
such as slabs and columns are standardized and manufactured in a certain facility by casting concrete
in a mold or “form”. It is then cured in a controlled environment and transported to the construction
site for assembly (Allen 2009). Utilizing precast concrete elements offers potential advantages over
conventional cast-in-place concrete components, which can be summarized as follows: (1) Reduced
time and labor cost - compared to site-cast (or in-situ) construction, precast concrete elements offer
faster production, lower cost, and more efficient assembly of elements since they provide an
opportunity to complete tasks in parallel (Sack et al. 2004; Yee 2001; Pheng and Chuan 2001; Bilsmas
et al. 2006). It was reported that when in-situ concrete casting panels were replaced with prefabricated
elements, 70 % of construction time and 43 % of labor costs could be saved (Wong et al. 2003; Jaillon
et al. 2009); (2) Improved work zone safety - construction sites often require workers to operate at
high elevations or in potentially risky situations. Since the production process of precast concrete
elements is performed on ground level, conditions throughout the project is safer; (3) Minimized
traffic disruption during the construction of bridges - in contrast with cast-in-place concrete bridge

Chapter 1.Introduction
2
(a) (b)
construction that causes significant traffic disruption due to numerous and sequential on-site
construction procedures such as concrete cast and curing processes, precast concrete elements allows
For the moving of those construction procedures away from the construction site and traffic ; (4)
Increased constructability - since concrete components are mass produced in well-controlled
environments, they offer consistent mechanical properties, resulting in an increase of constructability
for a construction project; and (5) Reduced environmental impacts - the use of precast concrete
components also leads to a much cleaner and safer construction environment since fewer materials are
wasted during the production and erection processes of precast products for a construction project
(Tam et al. 2007).
Quality assessment of precast concrete elements 1.1.2
Despite the various benefits of precast concrete element based rapid construction, the use of
precast concrete elements, however, could suffer from unexpected construction delays and system
failures if the dimensional and surface qualities of precast concrete elements are not assessed properly.
For instance, construction delays and additional costs for repair or replacement are unavoidable when
there are serious dimensional mismatches or volumetric surface defects on precast concrete elements
(GDT Report 2011). Research conducted by the Construction Industry Institute (CII) revealed that the
average cost of rework caused by construction defects is 5% of total construction costs (Construction
Industry Institute Report 2005). Mills et al. (2009) also indicated defect costs accounted for 4% of the
contract value of new residential construction. According to a study (Love and Li 2000) that examined
the causes of rework, systematic quality assessment (QA) and found that management for
construction components during the design and construction phases are important in reducing or
Figure 1.1 Utilization of precast concrete elements in the construction industry: (a) Bulidings; (b) Bridges

Chapter 1.Introduction
3
eliminating rework in projects. As a result, a systematic dimensional and surface QA for precast
concrete elements at an early stage of construction process is essential for the successful and timely
completion of a construction project.
Currently, the quality of precast concrete panels is evaluated manually assessed by certified
inspectors. The inspectors rely on contact-type devices such as measuring tapes and straightedges for
QA of precast concrete elements (Latimer et al. 2002), and follow guidelines such as the quality
management system from the International Organization for Standardization (ISO-9001 2008) or the
tolerance manual for precast and prestressed concrete from the Precast Concrete Institute (PCI 2000).
One of the main inspection objectives is to scrutinize dimensional (dimension, position etc.) errors
and surface defects (crack, spallings etc.) of precast concrete elements. However, there are several
problems with manual inspection. Firstly, the results obtained are subjective and may not be reliable
(Phares et al. 2004). Second, manual inspection is time consuming and expensive. Third, there is a
lack of trained and experienced inspectors. Finally, there is a lack of data storage and management
system necessary for effective and efficient information sharing and management between the
participants of a construction project. Therefore, there is an urgent need for techniques that access and
manage the dimensional and surface qualities of precast concrete elements in an automated and
accurate manner.
1.2 Literature Review
Non-contact sensing based quality assessment 1.2.1
Dimensional and surface QAs have been mainly studied in the industrial engineering sectors
for the purpose of faultless goods production (Newman and Jain 1995). In most cases, inspections are
conducted using image processing techniques involving one or more cameras, and the scene is
illuminated and arranged to extract the image features necessary for processing and classification.
However, these studies are limited to relatively small objects and the inspection environment is well
controlled, which is not possible for the in-situ inspection of precast concrete elements.
In the Architecture, Engineering and Construction (AEC) sector, many researchers have
explored non-contact sensing techniques to monitor the dimensional and surface qualities of structures
during the last decade. Among the non-contact sensing technologies, the use of images obtained from
2D cameras is one of the most common approaches to detect dimensional errors or surface defects

Chapter 1.Introduction
4
because it is fast and inexpensive. In terms of the dimensional QA, Ordonez et al. (2008) proposed
two different image-based approaches for detecting and measuring the dimensions of flat building
elements. Shin and Dunston (2009) presented an augmented reality method for the steel column
inspection (anchor bolt positions and plumbness). These approaches, however, require significant
human interaction for the dimensional inspections. With regards to the surface QA, the majority of
studies have focused on the detection of cracks, air-pockets and spallings. Abdel-Qader et al. (2006)
suggested a concrete crack detection technique using the principal component analysis for the purpose
of autonomous bridge inspections. Hutchinson and Chen (2006) proposed a probabilistic method
based on Bayesian decision theory for automatic crack detection on concrete surfaces. Zhu and
Brilakis (2010) suggested the use of three circular filters to detect air pockets on the surfaces of
concrete. Koch and Brilakis (2011) proposed a technique using image segmentation and
morphological thinning to detect spalling defects on concrete surfaces. While these image-based
methods generally offer good measurement accuracy, their performance is heavily affected by lighting
conditions. In addition, although identification of size information such as length, width, area and
volume is important for the dimensional and surface QA of concrete structures, this kind of qualitative
information cannot be gained using image-based methods without multiple cameras (at least two) or
prior knowledge such as the distance between a camera and a target structure or the size of a reference
target.
Contrary to the digital imaging approach, laser scanning directly acquires 3D data with good
accuracy (typically 2-6 mm at 50 m (Olsen et al. 2010)) and high point density (up to 960,000
points/sec (FARO 2014)). Due to these merits, several researchers have investigated the feasibility of
laser scanning technology for the dimensional and surface QA of structures during the last decade.
With regards to the dimensional QA, Bosche (2010) proposed an automated technique of recognizing
3D CAD objects from laser-scanned data for dimensional compliance inspection of construction
elements. Shih and Wang (2004) reported a laser scanning-based system for measuring the
dimensional quality of finished walls. Akinci et al. (2006) proposed a general framework for quality
inspection of structures based on comparison of as-built models obtained from laser scanning with the
corresponding design CAD models. Han et al. (2013) suggested an automated technique of extracting
tunnel cross sections using laser-scanning data for dimensional quality control. Gordon et al. (2007)
and Park et al. (2007) reported deformation measurement results obtained from laser scanners for
dimensional quality control of structures. In terms of the surface QA, Teza et al. (2009) proposed a

Chapter 1.Introduction
5
damage detection technique based on the computation of the mean and Gaussian curvatures of a
concrete surface. Tang et al. (2011) investigated the detectability of surface flatness defects using
damage detection algorithms and laser scanners. Olsen et al. (2010) proposed a volume loss
quantification technique for a reinforced concrete structure. Lastly, Liu et al. (2011) proposed a
distance and gradient-based volume loss estimation technique for an in-situ concrete bridge. Although
laser-scanning data has been widely utilized for the dimensional and surface QA in variety of civil
applications, there have been no studies utilizing laser scanning for dimensional and surface QA of
precast concrete elements.
Data storage and delivery for quality assessment 1.2.2
The current data storage and delivery for QA of precast concrete elements follows the
following procedure (Yin et al. 2009): (1) certified inspection personnel monitors and records the
inspection results of specified checklists in the inspection form and (2) once the QA is completed, the
inspector stores the inspection data of the inspection form into a database system via a computer. The
current data storage and delivery system, however, has limitations. First, it is inefficient due to the
duplicated process of recording the inspection data in both document from and the database. Second,
there is a possibility of data entry error and inspection form loss. Moreover, there are difficulties in
interactively updating and sharing the inspection data with other project participants who work in
different places.
Building Information Modeling (BIM) is a conceptual approach to computer-intelligible
exchange of building information in design, construction and other disciplines (Sack et al. 2010).
Note that more details behind BIM are described in Chapter 1.4.2. Several recent studies have
explored the possibility of a BIM-based system for effective data storage and management. The
majority of those studies have focused on solving frequently occurring data exchange problems in
construction projects due to the diversity of construction participants. Jeong et al. (2009), for example,
tested various BIM tools such as Revit Architecture (2014) from Autodesk Inc. and Tekla Structures
from Tekla Inc. (2014) to identify the interoperability of BIM data such as geometric shapes and
relationship information of precast concrete elements. The study concluded that the Industry
Foundation Classes (IFC) is the only candidate for the effective exchange of geometry and other
information among various data formats, but current IFC-based data exchanges remains lacking in
data exchanges between BIM tools. To this end, Venugopal et al. (2012) proposed an IFC based

Chapter 1.Introduction
6
framework to facilitate data exchange and avoid ambiguity in IFC information for precast/pre-stressed
concrete elements. The study recommended that definitions of entities, attributes and relationships of
precast concrete models needs to be clearly defined for reliable data exchanges. Aram et al. (2013)
proposed a process model for identifying the necessary capabilities of BIM tools for supporting and
improving the entire data exchange of concrete reinforcement supply chain. However, the
aforementioned studies mainly focus on data interoperability of design models of precast concrete
elements, with less attention paid to storing and delivering dimensional and surface QA data of
precast concrete elements.
Regarding the representation of QA data obtained from non-contact sensors, Yin et al. (2009)
proposed a precast production management system based on Radio Frequency Identification (RFID).
Several quality inspection targets, such as material property and production process, were monitored
in that system, but the dimensional and surface qualities are not studies and thus, there is no standard
data format for the system. Anil et al. (2011) investigated the data representation requirements of as-
built BIM generated from laser scanned point cloud data. The study found that there is no formalized
schema for representing the quality of as-built BIM such as model deviations and noises in the current
version of IFC. Hence, a formalized and systematic data storage and delivery method for representing
the dimensional and surface QA of precast concrete elements is necessary. In this study, an IFC-based
data storage and delivery system is proposed for dimensional and surface QA of precast concrete
elements.

Chapter 1.Introduction
7
1.3 Research Objectives and Scope
To tackle the limitations of current QA techniques, the goal of this research is to develop
smart QA techniques and a system for precast concrete elements using 3D laser scanning and BIM
technology. Specifically, this study has four main objectives: (1) Development of dimensional and
surface QA techniques; (2) Development of a framework for systematic precast concrete QA; (3)
Optimization of scan parameters for enhanced precast concrete QA; and (4) Validation of the
proposed technique and system through field test. The scope of this dissertation is as follows:
(1) Development of dimensional quality assessment technique: This study develops an
automated and non-contact measurement technique that measures and assesses the dimensions and the
quality of precast concrete elements using a 3D laser scanner. An edge and corner extraction
technique is developed to estimate the dimensional properties of precast concrete elements from laser
scanning data. To increase the measurement accuracy, a compensation model is employed to account
for the dimension losses caused by an intrinsic limitation of laser scanners. Experimental tests are
performed on a laboratory specimen and actual precast concrete elements to validate the effectiveness
of the proposed technique.
(2) Development of surface quality assessment technique: This study develops a new
technique that can simultaneously localize and quantify spalling defects on precast concrete surfaces
using a laser scanner. Defect sensitive features, which have complementary properties, are developed
and combined for improved localization and quantification of spalling defects. A defect classifier is
developed to automatically diagnose whether the investigated surface region is damaged, as well as
the location and size of the defect. Numerical simulations and experiments are conducted to
demonstrate the effectiveness of the proposed concrete surface defect detection technique.
Furthermore, a parametric study with varying scan parameters is performed for optimal detection
performance.
(3) Development of BIM-based systematic framework of QA data management: This study
develops a holistic framework for dimensional and surface QA of precast concrete elements based on
BIM and 3D laser scanning technology. Here, the term ‘holistic’, as used in this paper, refers to the
‘end-to-end’ from actual dimensional and surface QA to storage and management of the inspection
data. First, a framework is developed to answer four essential questions for practical precast concrete
QA: (1) what the inspection checklists should be; (2) what quality inspection procedures should be
employed; (3) which kind of laser scanner is appropriate and which scan parameters are optimal for

Chapter 1.Introduction
8
the intended quality inspection; and (4) how the inspection data should be stored and delivered. Then,
the applicability of the proposed framework is evaluated using case studies where dimensional errors
and surface defects within actual precast concretes are detected and measured.
(4) Optimization of scan parameters: This study proposes a method of ensuring the accuracy
of the proposed dimensional and surface QA techniques. It was found from the experimental studies
in the previous study that enhancement of dimensional estimation accuracy is essential for success of
actual applications. The objective of this study is to improve the dimensional quality assessment
technique through scan parameter optimization. To do this, a modeling the laser beam position and the
measurement errors of the laser scanner is conducted, and parametric studies with different scan
parameters are implemented with the developed model. Comparison tests with experiments are also
investigated to determine the effectiveness of the proposed scan parameter optimization method.
(5) Validation through field tests: This study investigates the feasibility of the proposed
quality assessment system of precast concrete elements through field tests. The developed
dimensional quality assessment technique is further advanced so that this technique can also be
applied to full-scale precast concrete elements with complex geometries. In the field test, two types of
full-scale precast concrete slabs with complex geometries are scanned in a precast concrete factory
and dimensional QA checklists including dimension and positions are inspected. The challenges
encountered during the data analysis of the full-scale test are discussed and addressed. In addition, a
comparison test with the conventional deviation analysis is conducted and the robustness of the
developed dimensional QA technique is demonstrated. Furthermore, a cloud-BIM web-service is
employed to investigate the potential of the proposed data storage and management system for QA of
precast concrete elements.

Chapter 1.Introduction
9
1.4 Research Means
3D laser scanning technology 1.4.1
Figure 1.2 Working principles of 3D laser scanners: (a) Time-of-flight scanners; (b) Phase-shift scanners
Developments in Information Technology (IT) have provided opportunities for the AEC
industry, one of which is 3D laser scanning technology. 3D laser scanning is a relatively new
technology, first developed for surveying engineering. The principle of 3D laser scanning is that a
laser scanner moves rapidly along both horizontal and vertical directions and captures the distance,
azimuth, and altitude information of multiple points on a target structure. These scanned points are
called ‘point cloud data’, and their positions are defined in a 3D spherical coordinate system. The
azimuth and altitude information is recorded by the laser scanner as it rotates, and the distance is
measured by two different principles: time-of-flight (TOF) and phase-shift. Laser scanners using the
TOF principle send out an initial laser pulse signal, and measures the arrival time of the laser beam
reflected from a target point. The distance to the target point is then computed based on the laser
travel time and the laser velocity. Laser scanners with phase-shift emit a continuous sinusoidal laser
beam, and estimates the distance by measuring the phase difference between the emitted and reflected
Distance (d)
Target ObjectLaser Receiver
Laser Generator
3D Laser Scanner
d = v· V : Velocity of Pulse
t : Time of Round-trip
Transmitted Pulse
Reflected Pulse
T = 0
T = t
Transmitted
Continuous Laser
Reflected
Continuous LaserPhase-
shift ( )
d = · : Frequency of Laser
Time-of-Flight Scanner Phase-shift Scanner

Chapter 1.Introduction
10
sinusoidal laser beams. Typically, TOF scanners have a relatively slow measurement speed and are
used for long-range scanning (typically 4-10 mm (one sigma value) accuracy at a distance of 50 m
(Olsen et al. 2010)). On the other hand, phase-shift laser scanners have a faster measurement speed
and are suitable for a short-range scanning (2-4 mm (one sigma value) accuracy at a distance less than
20 m (FARO 2014)).
Compared to conventional contact-type sensors used in the AEC industry, a 3D laser scanner
provides the following advantages: (1) It allows the quick scanning of a large structure and
measurement of a surface profile; (2) It yields ‘point cloud’ data of a scanned target surface with
millimeter-level accuracy and spatial resolution; and (3) It offers long-range measurement up to 6000
m (REIGL 2014). In addition, as shown in Table 1.1, 3D laser scanning has advantages over the other
two 3D measurement technologies (stereo-vison camera and TOF camera) in (1) accuracy, (2)
measurement range, (3) measurement angle, and (4) resolution. Note that for each 3D measurement
technology, the specification of the most common commercial device is provided. With these features,
3D laser scanners have been successfully employed for a wide variety of applications, including 3D
modeling of structures (Bernardini and Rushmeier 2002; Son et al. 2002), deflection and deformation
monitoring (Park et al. 2007), construction progress monitoring (Kim et al. 2013) and topographical
surveys (Priestnall et al. 2000).
Table 1.1 Comparison of technical specifications of 3D measurement sensors.
Property 3D laser scanner
(Ex. FARO Focus-3D)
Stereo Camera
(Ex. Point-Grey
Bumblebee2)
TOF Camera
(Ex. MESA SR4000)
Accuracy ± 2 mm @ 20 m ± 2 mm @ 2 m ± 20 mm @ 5 m
Measurement range 0.6 ~ 120 m ~ 4 m 0.1 ~ 10 m
Measurement angle Hori. 360° / Vert. 310° Hori. 66° / Vert. 43° Hori. 44° / Vert. 35°
Measurement speed 960,000 points / sec 48 frames / sec 30 frames / sec
Resolution Depends on angular
resolution Pixels 648 × 488 Pixels 176 × 144

Chapter 1.Introduction
11
Building information modeling (BIM) 1.4.2
Figure 1.3 Conceptual diagram of Building Information Modeling (BIM)
Another leading piece of IT in the AEC industry is BIM. According to the National BIM
Standard (NBIMS) Project Committee of the BuildingSMART alliance (2014), BIM is defined as ‘a
digital representation of physical and functional characteristics of a facility’. As depicted in Figure 1.3,
BIM serves as a central data repository that stores and recalls information about a facility, and is
currently regarded as an essential tool in managing the lifecycle of a construction project from initial
design to maintenance (Hajian and Becerik-Gerber 2009). Due to these abilities in enhancing
communication between the various stakeholders involved in the different stages of a facility's life
cycle and the multitude of potential uses ranging from improved planning for renovations to more
accurate modeling of a building's energy consumption (GSA 2009), BIM is gaining attention in the
Architecture, Construction, Engineering, and Facility Management (AEC/FM) community. Adoption
has been rapid, with nearly half of AEC professionals implementing BIM, an increase of 75% in the
past two years (McGraw-Hill Construction 2009). Unlike a traditional CAD model that is mainly used
for visualization, BIM represents a facility in a semantically rich manner. For example, while a CAD

Chapter 1.Introduction
12
model would represent a wall as a set of independent planar surfaces, BIM would represent the wall
as a single, volumetric object with multiple surfaces, while also showing the adjacent relationships
with other components in the model (Tang et al. 2010). Because of this unique characteristic of BIM,
working environment of the AEC industry is shifting from 2D-based information platforms to object-
based 3D information platforms. Moreover, the advent of BIM has allowed the participants of a
project to more effectively share and update information generated during the construction process in
a timely manner, producing a synergy effect.
Combining laser scanning with BIM can yield significant advantages over traditional
approaches by facilitating design and construction activities on the basis of accurate, fully
representative existing conditions captured with laser scanners (Randall 2011). The approach of
integrating as-built and as-designed data sets enhances the efficiency of information management and
results in improved reliability of the project model (Goedert and Meadati 2008). Coming from the
advantages of integrating two IT methods, recently conducted studies have taken advantage of this
integration in the AEC industry. As an example of this trend, General Services Administration (GSA
2009) documented BIM guidance for 3D imaging, intended for assisting the project teams in
contracting for and ensuring quality in 3D imaging contracts.

Chapter 1.Introduction
13
1.5 Organization
This document is organized as follows:
Chapter 2 presents the dimensional QA technique as one of the precast concrete QA
techniques. Data processing algorithms, including an edge and corner extraction technique, are
described for the estimation of the dimensional properties of precast concrete elements from laser
scanning data. In addition, a compensation model, which compensates the dimension losses caused by
the ‘mixed-pixel’ problem of 3D laser scanners, is discussed to increase the measurement accuracy.
Lastly, validation tests on a laboratory specimen as well as actual precast concrete elements are
presented to prove the effectiveness of the proposed dimensional QA technique.
Chapter 3 deals with the surface QA technique that simultaneously localizes and quantifies
surface defects on precast concrete surfaces using a laser scanner. Defect sensitive features and a
defect classifier utilized for surface defect detection are discussed. The results of numerical simulation
and experiments on a lab-scale actual precast concrete are presented to demonstrate the effectiveness
of the proposed surface QA technique of precast concrete elements.
Chapter 4 presents the framework for dimensional and surface QA of precast concrete
elements based on BIM and 3D laser scanning technology. The framework answers four essential
questions for practical precast concrete QA in terms of (1) what the inspection checklists should be; (2)
what the quality inspection procedure should be employed; (3) which kind of laser scanner is
appropriate and which scan parameters are optimal for the intended quality inspection; and (4) how
the inspection data should be stored and delivered. In addition, case studies for investigating the
applicability of the proposed framework are presented.
Chapter 5 presents the scan parameter optimization technique to guarantee satisfactory
dimensional QA accuracy. To do this, a modeling of the laser beam position and measurement errors
of the laser scanner is conducted, and parametric studies with different scan parameters are
implemented using the developed model. Comparison tests with experiments are also investigated to
identify the effectiveness of the proposed scan parameter optimization method.
Chapter 6 discusses the feasibility of the proposed quality assessment system of precast
concrete elements through field tests. The developed dimensional QA technique is applied to full-
scale precast concrete elements with complex geometries. A comparison test between the proposed
dimensional QA technique and a conventional deviation analysis technique is presented.
Chapter 7 summarizes this document with expected contributions, and presents future work
associated with this research.

Chapter 1.Introduction
14

Chapter 2. Quality Assessment Technique I: Dimensional Estimation
15
2 QUALITY ASSESSMENT TECHNIQUE I:
DIMENSONAL ESTIMATION
2.1 Chapter Introduction
A dimensional QA technique for precast concrete elements is presented in this chapter. The
main checklists for the dimensional QA of precast concrete elements include their dimensions (length,
width and thickness), squareness, straightness and flatness as shown in Fig. 2.1. To tackle the
limitations of the conventional dimensional QA method, this chapter presents an automated technique
that allows accurate and reliable dimensional estimation of precast concrete elements using 3D laser
scanning. To measure the length, width and squareness of the precast concrete elements, a novel edge
extraction algorithm is developed so that only boundary points of a precast concrete element are
automatically extracted from the point cloud obtained by a 3D laser scanner. To validate the
dimensional QA technique, experiments on a laboratory specimen as well as actual precast concrete
elements are were conducted. The results demonstrate that the proposed dimensional QA technique
has potential in automatically and accurately assessing dimensional qualities including dimensions,
positions and squarenesses. This chapter is organized as follows. First, related literatures are presented
in Chapter 2.2, followed by development of the dimensional QA technique in Chapter 2.3. Then, a
series of laboratory tests for investigation of various scan parameter effects are discussed in Chapter
2.4, and actual experimental results implemented on real precast concrete slabs are presented in
Chapter 2.5. The chapter then concludes with a summary in Chapter 2.6.
Figure 2.1 Dimensional quality assessment of precast concrete elements: (a) Dimensions; (b) Squareness; (c)
Straightness; (d) Flatness.
(a) (b) (c) (d)

Chapter 2. Quality Assessment Technique I: Dimensional Estimation
16
2.2 Related Work
Surface reconstruction using point cloud data 2.2.1
Over the past few decades, many studies have been conducted in computer graphics
regarding geometric data analysis based on laser scanners. The main purpose of these approaches is to
improve surface reconstruction of an object based on dense laser scan data (Hoppe et al. 1992;
Althaus and Christensen 2003; Dey 2007). Most surface reconstruction methods employ triangle
meshes to model geometric surface information of a physical object, and mainly focus on improving
the smoothness of the object surface. However, the target objects of these studies are limited to small
objects, and the point clouds acquired from triangulation-based laser scanners allow for only very
short scan range (less than 5 m). In civil engineering, several techniques have been proposed for
modeling of building facades with help of long-range measurement from laser scanners. Pu and
Vosselman (2009) presented a feature extraction technique using point cloud data with the purpose of
building façade modeling. This method uses knowledge about the building façade to segment the
point cloud and match the data with building feature constraints. Becker and Haala (2007) proposed a
building façade reconstruction method by integrating point cloud data and digital photos. However,
these approaches focus on modeling building façade features such as windows and doors, which gives
no quantitative dimensional measurements of building components.
Three-dimensional edge detection 2.2.2
3D edge detection has been mainly studied in the computer graphics community. The
majority of the work finds edges or lines from polygonal mesh models or point cloud data (Ohtake et
al. 2004; Truong-Hong et al. 2012; Gumhold et al. 2001; Pauly et al. 2003). As for the polygonal
mesh model, Ohtake et al. (2004) searched edge lines of an object based on curvature derivatives of
the mesh model. Truong-Hong et al. (2012) presented a boundary feature detection algorithm for
recognition of building facades using point cloud data. This method employs Delaunay triangulation
meshes to find boundary points and uses a grid clustering technique to determine the boundary lines
of widow openings. The result provides relative geometric errors of 1.2-3.0% for building facades and
open windows when compared with CAD-based models. However, the average absolute geometric
errors are over 20 mm, which is not acceptable for precast concrete dimensional QA requiring small
tolerances (± 6 mm for precast slabs). As for the edge detection from point cloud data, Gumhold et al.

Chapter 2. Quality Assessment Technique I: Dimensional Estimation
17
(2001) developed an edge line extraction method using local neighbor graph theory for surface
reconstruction. Pauly et al. (2003) proposed a technique for extracting line-type features based on
point-sampled geometry. This method employs principal component analysis and minimum spanning
graph to detect boundary edges. Although those approaches were successful in surface reconstruction
of small objects, they are not suitable for large-scale objects such as precast concrete elements due to
the prohibitive computational costs of running complex algorithms. In this study, a new and robust
edge detection algorithm is developed for dimensional QA of precast concrete elements, and it is
described in Chapter 2.3.3.
Object recognition and classification based on point cloud data 2.2.3
Object recognition and classification from point cloud data have gained much interest in the
computer vision community due to its various applications such as urban modelling, simultaneous
localization and mapping. In object recognition, researchers have extracted various features from
point cloud data. Althaus and Christensen (2003) used line features to detect corridors and doorways.
Hahnel et al. (2003) employed a region growing technique to identify planes. For object classification,
Golovinskiy et al. (2009) proposed a method based on graph cut algorithm to classify various objects
such as cars and trees from airborne point clouds. Triebel et al. (2006) classified the building
components using associative Markov networks. The aforementioned studies, however, are mostly
based on supervised learning, which requires expensive computations and sufficient training data for
accurate object recognition and classification. Tang et al. (2009) proposed a range image based object
detection technique, which is most relevant to our object detection study. Although Tang et al. (2009)
directly detects objects with the help of range images generated from point cloud data, the detection is
not automated because three points on the range image need to be manually selected to detect the pose
of a target object plane. In this study, the object detection process is automated for the dimensional
measurement of precast concrete elements.
Laser scanning-based quality inspection of concrete structures 2.2.4
For the QA of concrete structures based on laser scanning, Akinci et al. (2006) proposed a
general framework which compares the as-built model of a structure generated from a laser scanner
with it’s design CAD model. However, these require much manual work in the generation of an as-
built model. Bosche (2010) proposed an automated technique of recognizing 3D CAD objects from
laser-scanned data for dimensional compliance inspection of construction elements. Other laser

Chapter 2. Quality Assessment Technique I: Dimensional Estimation
18
scanning-based QA studies for concrete structures have mainly focused on detection of damages such
as large cracks, flatness and spallings (Teza et al. 2009; Tang et al. 2011; Olsen et al. 2010; Liu et al.
2010). Little work has been done on dimensional estimation of construction components, and there
have been no studies on dimensional QA of precast concrete panels. Hence, there is an urgent need for
developing an accurate and automated dimensional QA technique for precast concrete panels.
2.3 Development of an Automated Dimensional Quality Assessment
Technique
This study aims to develop an automated dimensional QA technique for precast concrete
panels. Fig. 2.2 (a) illustrates the schematic of the overall hardware configuration for the proposed
dimensional QA technique. For the purpose of this study, it is assumed that the precast concrete panel
has a rectangular planar surface and a laser scanner positioned above the panel scans the whole
surface of the panel in a single scan. Fig. 2.2 (b) shows the necessary steps for the proposed
dimensional QA, including data acquisition, data pre-processing, edge and corner extraction,
compensation for edge loss, and dimension estimation and QA. The details for each step are described
below.
Figure 2.2 The proposed precast concrete dimensional QA technique: (a) Schematic of overall system
configuration; (b) Dimensional QA procedures
(a) (b)
3D Laser
Scanner
Precast Concrete Panel
Data acquisition
Data pre-processing
Edge & corner extraction
Compensation for edge loss
Dimension estimation &
Quality assessment
Shear Pocket

Chapter 2. Quality Assessment Technique I: Dimensional Estimation
19
Data acquisition 2.3.1
It is necessary to first determine the position and scan parameters of the laser scanner to
achieve the highest inspection quality. There are three main factors which influence the measurement
accuracy of a laser scanner: 1) distance; 2) the incident angle between a laser scanner and a target
structure; and 3) angular resolution of a laser scanner. The effects of these parameters on dimension
estimation accuracy are investigated in Chapter 2.4. Once the position and scan parameters of the
laser scanner are determined, a region of interest (ROI) covering the precast concrete element is
selected after a coarse scan. It is desirable to make the ROI slightly bigger than the target area to
reduce the scan time and accelerate the post-processing of data. Then, a fine scan is conducted over
the ROI, generating a point cloud containing a set of 3D points, i.e., (𝑥𝑖, 𝑦𝑖 , 𝑧𝑖), 𝑖 = 1,… ,𝑁, where N
is the number of total scan points. Note that the scanning and data acquisition are conducted
automatically without human intervention once the scan parameters of the laser scanner and ROI are
manually determined prior to data acquisition. The word ‘fully automated’ used in this study implies
that once the raw scan data becomes available, the proposed technique operates in a fully automated
manner for all data processing from data-preprocessing to quality assessment.
Data pre-processing 2.3.2
2.3.2.1 Coordinate transformation of a point cloud
Figure 2.3 Coordinate transformation from a laser scanner to the target object: (a) Laser scanner coordinate
system; (b) Object coordinate system
(a) (b)
y'
x'
z'
x
y z
Laser scanner
O'
O
Target object

Chapter 2. Quality Assessment Technique I: Dimensional Estimation
20
(a) (b) (c)Estimated near-corner point
Figure 2.4 Autonomous determination of three corner points of the target object from a range image: (a) The
initial range image of a target specimen; (b) Edge and corner detection in the binary image using the Canny
edge detector and the Hough transform; (c) Determination of three points near the corner of the target object.
Figure 2.5 Three pixel point selection algorithm for the automated coordinate transformation
Once the point cloud is acquired, the 3D coordinates with respect to the laser scanner (Fig.
2.3 (a)) are transformed into a new coordinate system with respect to one of the corners of the panel
such that the surface of the panel is nearly parallel to the new x-y plane as shown in Fig. 2.3 (b). The
main objective of the coordinate transformation is to remove unwanted background scan points
behind the target so that only the scan points on the target surface are retained for next data processing.

Chapter 2. Quality Assessment Technique I: Dimensional Estimation
21
For coordinate transformation, three points near the corners of the precast concrete element
are first identified from the range image as shown in Fig. 2.4. Here, the range image is a 2D image
generated from the acquired point cloud, and each pixel point within a range image is coupled with
the corresponding scan point in point cloud data so that each pixel point of the range image holds the
distance value from the laser scanner to the corresponding scan point. In Fig. 2.4 (a), the target object
closer to the laser scanner is shown in a darker grey while the background behind the object is shown
in a lighter grey. In Fig. 2.4 (b), the Canny edge detection (Canny 1986) is first conducted on the
range image to obtain an edge (binary) image. Note that the edge points extracted by the Canny edge
detector are used only for coordinate transformation, but not for subsequent dimensional estimations
due to the mixed-pixel problem at edges, as would be discussed in Chapter 2.3.4. The Hough
transform (Ballard 1981) is then employed to obtain the edge lines of the target object from the edge
image. Here, there is a constraint for the edge line extraction that the lengths of edge lines should be
longer than a certain threshold so that only the edges of the panel are extracted. Next, the four
intersection points between the obtained edge lines are identified as the corner points of the object.
Subsequently, the proposed algorithm, as shown in Fig. 2.5, determines the three pixel points used for
the coordinate transformation. First, candidate pixel points surrounding each corner point (C1, C2,
and C3) are limited to 1) ones from each corner point within a certain margin bound (ϵ) and 2) with a
range distance of less than a range threshold (α). Note that ϵ and α are selected as 10 pixels and the
mean range value of the range image in this study such that only pixel points, which are on the target
object surface and 10-pixel distance from each corner point, are selected as the candidate pixel points.
Iterative searching for finding best pixel points is then performed based on the condition that the
horizontal and vertical lines formed by the three scan points corresponding to the selected three pixel
points are orthogonal in the 3D space. Note that the orthogonality between the horizontal and vertical
lines should be preserved to avoid distortion of the scan points after coordinate transformation.
However, since a perfect right angle between the two lines might not be guaranteed due to limited
spatial resolution of laser scanners, three pixel points forming the closest angle to right angle are
determined in this study. Once the three points are chosen, a plane of the precast concrete panel is
determined and all 3D points in the point cloud are then transformed into the object coordinate system
as shown in Fig. 2.3 (b).

Chapter 2. Quality Assessment Technique I: Dimensional Estimation
22
(a) (b)
Margins
2.3.2.2 Removal of unnecessary scan points and projection to a 2D plane
Figure 2.6 Elimination of unnecessary scan points and dimensional reduction: (a) Removal of scan points
outside the target object with margins; (b) Dimensional reduction through projection of the filtered points
onto a fitted plane.
To avoid the difficulties associated with redundant data, two data pre-processing tasks are
conducted in this step. Once the coordinates of the scan points are aligned along the local x and y axes
of the object, unnecessary scan points are eliminated as shown in Fig. 2.6 (a). Note that the size of the
rectangular margin box in each direction is determined to be ‘design length ± margin’ with the
following assumptions: 1) The dimensions of an ideal precast concrete panel are known from a
blueprint, and 2) The deviation of the dimensions of an actual precast concrete panel from the design
values is within a certain margin. The nominal margin was selected to be 2 cm since the margin is
large enough compared to the maximum distance error (2 mm) produced by the laser scanner used in
this study. Then, the surface plane of the precast concrete panel is estimated by least-squares fitting
the retained scan points inside the margins. Finally, the filtered scan points are projected from the 3D
space onto the fitted 2D plane as shown in Fig. 2.6 (b).

Chapter 2. Quality Assessment Technique I: Dimensional Estimation
23
(a) (b) (c)
Reference point
Edge and corner extraction 2.3.3
The proper extraction of the edges and corner points of the target object is crucial to
precisely estimate the dimensions of the precast concrete panel. Here, an automated algorithm named
as ‘Vector-sum algorithm’ is developed to extract the scan points along the horizontal and vertical
edge lines of the precast concrete element.
Figs. 2.7 and 2.8 show the principle of the ‘vector-sum’ algorithm for the scan points inside
and on the edge of the target object, respectively. To simplify the description of the algorithm, it is
assumed that all scanned points are equally spaced in both horizontal and vertical directions as shown
in Fig. 2.7 (a). In practice, the equal scan spacing is not a necessary condition. Once one scan point is
designated as a reference point, pn, the eight nearest neighboring points around the reference point
denoted as m
np , m = 1,2, ...,8, are selected based on the Euclidean distance. Next, the eight vectors,
m
n np p , connecting the reference point to each neighboring points are computed as shown in Fig. 2.7
(b). Finally, the summation of the eight vectors, ( )n
V p , is computed as follows.
Figure 2.7 Vector-sum algorithm for a scan (reference) point inside the target object: (a)
Determination of eight nearest neighboring points around the reference point; (b) Vector
representation from the reference point to each the eight nearest neighboring points; (c) Vector-sum
of the eight vectors (the magnitude of vector-sum is zero).

Chapter 2. Quality Assessment Technique I: Dimensional Estimation
24
(a) (b) (c)
Edge line
Figure 2.8 Vector-sum algorithm for a scan (reference) point along the edge of the target object: (a)
Determination of eight nearest neighboring points around the reference point; (b) Vector representation
from the reference point to each of the eight nearest neighboring points; (c) Vector-sum of the eight
vectors (the magnitude of vector sum is 5 times of the spacing interval).
8
1
( )m
n n n
m
V p p p
(2.1)
When the reference point, pn, lies inside the region of the panel, ( )n
V p becomes zero as
shown in Fig. 2.7 (c). On the other hand, if pn rests on the edge of the panel as shown in Fig. 2.8 (c),
( )n
V p becomes 5 times of the point-to-point spacing interval (S). Based on this observation, the
magnitude of ( )n
V p serves as an indicator that classifies whether a reference point is an edge point
or not. To formalize this classification, a threshold value of 2.5 times the scanning spacing is used as
follows.
( ) 2.5 , . , n n n
If V p S p is a potential edge point Otherwise p is inside the panel region
Note that S varies with respect to scan parameters such as scan distance, incident angle and angular
resolution. In reality, the vector-sum algorithm can misclassify non-edge points as edge points mainly

Chapter 2. Quality Assessment Technique I: Dimensional Estimation
25
(a)
(b) (c)
due to the measurement error of laser scanners. In this study, the algorithm is further developed to
eliminate false edge points. The development of the non-edge point removal algorithm is based on the
observation that the non-edge points are sparsely scattered from the edges while the edge points are
densely aligned along the edge with equal spacing (see Fig. 2.9). From this observation, a classifier
for removal of false edge points is proposed. The filtering is performed only on the candidate edge
points identified from the previous Vector-Sum algorithm. For a candidate edge point, pn , the distance
from pn and to the 8th nearest point 8
n np p should be 4 times of S if pn is an edge point as shown in
Fig. 2.9 (b). On the other hand, the distance 8
n np p would be longer than 4S if pn is a non-edge point.
To be conservative, a threshold for the filtering is set to be 6S,
8 6 , . , a
n n n nIf p p S p is an edge point O therw ise p is non edge po int
Figure 2.9 Removal of non-edge points from edge candidate points: (a) A set of edge candidate points
identified by the Vector-sum algorithm; (b) If the reference point is indeed on the edge of the target object,
the distance from the reference point to the 8th closest neighboring point should be about four times of the
spacing interval; (c) For a non-edge reference point, the neighboring points are sparsely scattered and the
distance from the reference point to the 8th closest point would be much longer.

Chapter 2. Quality Assessment Technique I: Dimensional Estimation
26
Surface of an object
SD/2
D – Diameter of laser beam
S – Spacing interval of TLS
Laser beam
Lower bound Upper bound
Edge
Compensation for edge dimension loss 2.3.4
Figure 2.10 Mixed-pixel phenomenon: (a) The mixed-pixel phenomenon typically occurs at the boundaries
of an object where the laser beam is split into two and reflected from two discontinuous surfaces; (b) An
example of mixed-pixels from laser scanning data.
Figure 2.11 Dimensional loss compensation model (Tang et al. 2009)
Although a laser scanner provides reliable spatial information of an object in most occasions,
a certain adverse scanning configuration between the laser scanner and the object can adversely affect
measurement accuracy. One such condition is known as the mixed-pixel effect (Hebert and Krotkov
1991; Mills and Barber 2004; Lichti et al. 2005; Tang et al. 2007). The mixed-pixel phenomenon
occurs when the laser beam is split into two and reaches two distinctive surfaces which have different
distances from the laser scanner as shown in Fig. 2.10 (a). Under this situation, the encoder of the
laser scanner receives a mixture of two signals reflected separately from the two surfaces resulting in
(a) (b)
Laser beam
Surface 1Surface 2
Mixed-pixels

Chapter 2. Quality Assessment Technique I: Dimensional Estimation
27
inaccurate range measurements for the scanned point. Fig. 2.10 (b) shows an example of the mixed-
pixel phenomenon obtained from the test specimen investigated in this study. It can be seen that a
number of scanned points on the edge lines deviate and appear apart from the actual edge lines due to
the mixed-pixel phenomenon. Although recently introduced full-waveform LiDAR may reduce range
measurement error in boundaries, but it cannot entirely remove the mixed pixel problem (Godbaz et al.
2008).
To cope with the mixed-pixel phenomenon, an edge loss compensation model (Tang et al.
2009), which quantitatively estimates dimension loss on the edges caused by the mixed-pixels, is
employed to compensate for the dimensional loss of the precast concrete panel as shown in Fig. 2.11
For the phase-shift laser scanner used in this study, the lower and the upper bounds, lower
E and
upperE , of the dimensional loss due to the mixed pixel phenomenon can be expressed as:
0 0( )
2 2 cos( )
D s
I
low er
D abs L L t LDE
0 0( )
2 cos( ) 2 cos( )
D sR
I I
upper
D abs L L t LLDSE
(2.2)
where D0 and D are the laser beam diameters of a laser scanner at the focal point (L0) and at the object
surface, respectively. L denotes the scan distance between the object and the laser scanner. is the
laser scanner’s vertical rotation rate (speed) in radians/second and st is the laser scanner’s sampling
time in seconds. Note that the effect of the horizontal rotation rate of the laser scanner on the
dimensional loss compensation model is neglected since the horizontal ratation rate of the laser
scanner is much lower than the vertical rotating rate (typically 1/2000 times lower). αD, αI and αR are
the divergence rate of the laser beam, the scanner’s incident angle and angular resolution, repectively.
In this study, the dimensional loss, which needs to be compensated for, is assumed to be the average
of the lower and the upper bounds of the dimensional loss because the edge loss is assumed uniformly
distributed across the theoretical range:
0 0( ( )
2 cos( )
)
2
D s
I
lower upper R
comp
D abs L L t L LE EE
(2.3)
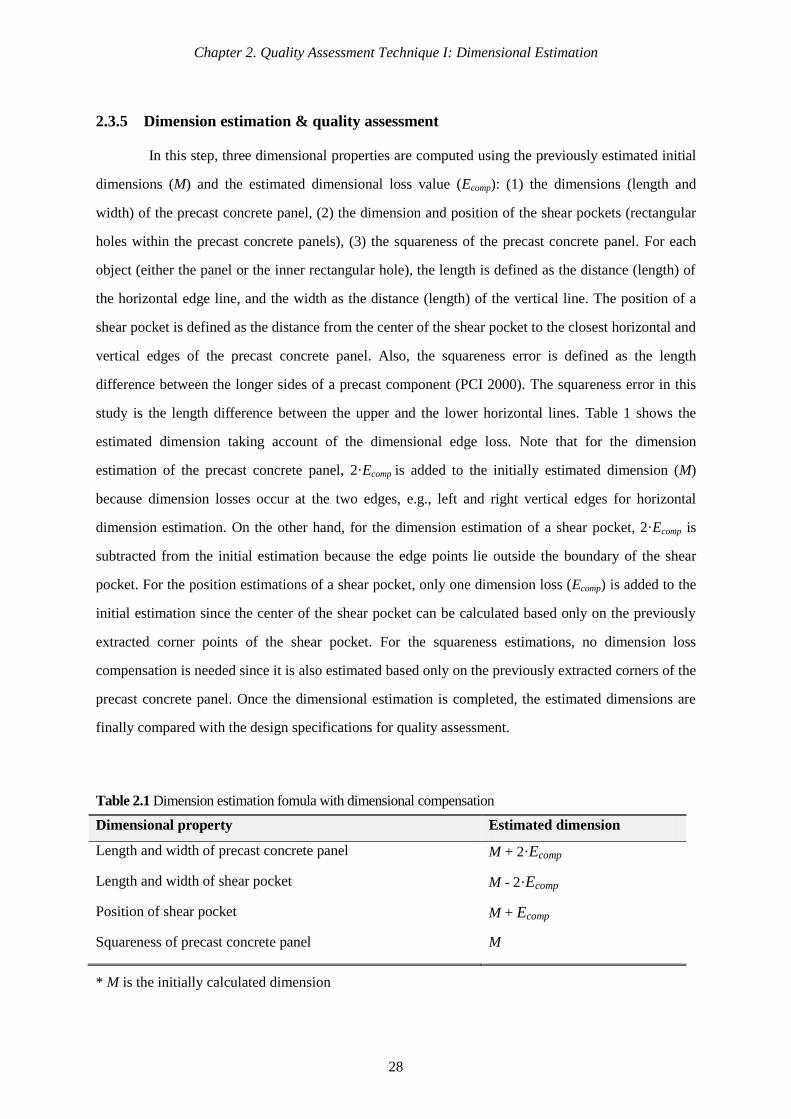
Chapter 2. Quality Assessment Technique I: Dimensional Estimation
28
Dimension estimation & quality assessment 2.3.5
In this step, three dimensional properties are computed using the previously estimated initial
dimensions (M) and the estimated dimensional loss value (Ecomp): (1) the dimensions (length and
width) of the precast concrete panel, (2) the dimension and position of the shear pockets (rectangular
holes within the precast concrete panels), (3) the squareness of the precast concrete panel. For each
object (either the panel or the inner rectangular hole), the length is defined as the distance (length) of
the horizontal edge line, and the width as the distance (length) of the vertical line. The position of a
shear pocket is defined as the distance from the center of the shear pocket to the closest horizontal and
vertical edges of the precast concrete panel. Also, the squareness error is defined as the length
difference between the longer sides of a precast component (PCI 2000). The squareness error in this
study is the length difference between the upper and the lower horizontal lines. Table 1 shows the
estimated dimension taking account of the dimensional edge loss. Note that for the dimension
estimation of the precast concrete panel, 2·Ecomp is added to the initially estimated dimension (M)
because dimension losses occur at the two edges, e.g., left and right vertical edges for horizontal
dimension estimation. On the other hand, for the dimension estimation of a shear pocket, 2·Ecomp is
subtracted from the initial estimation because the edge points lie outside the boundary of the shear
pocket. For the position estimations of a shear pocket, only one dimension loss (Ecomp) is added to the
initial estimation since the center of the shear pocket can be calculated based only on the previously
extracted corner points of the shear pocket. For the squareness estimations, no dimension loss
compensation is needed since it is also estimated based only on the previously extracted corners of the
precast concrete panel. Once the dimensional estimation is completed, the estimated dimensions are
finally compared with the design specifications for quality assessment.
Table 2.1 Dimension estimation fomula with dimensional compensation
Dimensional property Estimated dimension
Length and width of precast concrete panel M + 2·Ecomp
Length and width of shear pocket M - 2·Ecomp
Position of shear pocket M + Ecomp
Squareness of precast concrete panel M
* M is the initially calculated dimension

Chapter 2. Quality Assessment Technique I: Dimensional Estimation
29
61
0 m
m (
Wid
th)
910 mm (Length)
250 mm
15
0 m
m
17
5 m
m
265 mm
(Position)Laser scanner
Laboratory
specimen
(a) (b)
2.4 Dimensional Assessment Test of a Laboratory Specimen
Description of test and laboratory specimen 2.4.1
Figure 2.12 Laboratory test configuration and specimen: (a) Test set-up; (b) Dimensions of the laboratory
test specimen
Table 2.2 Experiment scenario - laser scanning parameters
Scan parameters Values
External Distance 4 m, 8 m, 12 m, 16 m
Incident angle 0°, 15°, 30°, 45°
Internal Angular resolution 0.009°, 0.018°, 0.036°
Laser beam size Diameter 3.8 mm at 0 m with divergence angle 0.16
milliradians
Vertical rotation speed Maximum 5820 rounds/min
Measurement rate 976,000 points / sec @0.009° angular resolution; 488,000
points / sec @0.018° ”; 244,000 points/sec @0.036° ”
A laboratory experiment was conducted to validate the proposed dimensional quality
assessment technique. The goals of this laboratory test were to estimate 1) the dimensions of three
objects (the panel itself and two rectangular holes in it), 2) the positions of the holes with respect to
the panel, and 3) the squareness of the panel.
In this experiment, a set of point cloud data was acquired from the test specimen using a
phase-shift laser scanner, FARO Focus-3D (FARO 2014), shown in Fig. 2.12 (a). The phase-shift laser

Chapter 2. Quality Assessment Technique I: Dimensional Estimation
30
scanner was selected with the target scanning distance (less than 20 m) and target dimension
estimation tolerance (less than 6 mm) taken into account. The scanner offers distance accuracy of ±
2 mm in a range of 0.6 m and 120 m, and a measurement rate of up to 976,000 points/sec. The scanner
was set up and leveled on a tripod at 1.5 m height, which was at the same height as the center of the
test specimen. Instead of an actual concrete panel, a rectangular test specimen made of Styrofoam
with a size of 910 mm × 610 mm was used as shown in Fig. 2.12 (b). Two identical through-
thickness rectangular holes with dimensions of 250 mm × 150 mm were introduced to emulate shear
pockets, which were needed to connect precast concrete panels with bridge girders. PCI manual states
that the length and width of precast concrete panels and shear pockets as well as the position of shear
pockets should be carefully inspected with dimensional tolerance of ± 6 mm (PCI, 2000).
The laboratory test was performed by varying the following three parameters to investigate
their effects on the accuracy of the proposed technique: 1) scan distance between the laser scanner and
the test specimen, 2) angular resolution of the laser scanner, and 3) incident angle between the laser
beam and the test specimen. Table 2.2 shows the details of the investigated scan parameters. A total of
48 scans with different scan parameters were conducted: four different distances (4, 8, 12, 16 m), four
different incident angles (0, 15, 30, 45°), and three varying angular resolutions (0.009, 0.018, 0.036°).
The scan distance and incident angle were selected based on an assumption that the length of a precast
concrete panel would not exceed 30 m. These two parameters are called external parameters since the
laser scanner needs to be repositioned for each scan. The angular resolution was the only controllable
internal parameter of the laser scanner, and the other internal parameters such as rotation speed and
measurement rate were automatically selected based on the angular resolution. For instance, when the
angular resolution was chosen to be 0.009°, the vertical rotation speed and the measurement rate of
the scanner were set as 5,820 rounds/min and 976,000 points/sec, respectively.
Laboratory experiment results 2.4.2
Fig. 2.13 shows the edge and corner points extraction results obtained from the laboratory
specimen by setting the scan distance, incident angle and angular resolution to 8 m, 0° and 0.009°,
respectively. The 3D scan points were first projected onto a fitted plane obtained from least square
minimization method (Fig. 2.13 (a)). Then, the vector-sum algorithm in Eq. (2.2) was applied to the
projected scan points to extract edge points (Fig. 2.13 (b)). Using the filtering described in Chapter
2.2.3, false edge (non-edge) points were removed (Fig. 2.13 (c)). Finally, the corner points of the
target objects are identified as the intersections of the lines fitted from the edge points (Fig. 2.13 (d)).

Chapter 2. Quality Assessment Technique I: Dimensional Estimation
31
Figure 2.13 Edge and corner points extraction results (scanning parameters of 8 m scan distance, 0° incident
angle, and 0.009° angular resolution): (a) Scan points projected onto a fitted plane; (b) Edge points extraction
using the Vector-sum algorithm; (c) Removal of the non-edge points; (d) Corner detection.
Table 2.3 shows the performance of the proposed dimension estimation technique and how
its accuracy varies depending on scan parameters. The dimension error is defined as the difference
between the design dimension and the one estimated by the proposed technique. In this laboratory test,
4 dimension errors (2 lengths and 2 widths) were estimated for each object such that a total of 12
dimension errors (3 objects × 4 dimensions) were obtained from each scan. Note that the dimension
error presented in Table 3 is the average of these 12 dimension errors. The dimension estimation error
was 3.06 mm on average for 48 scans. 526 times out of 576 estimated dimensions (48 scans and 12
dimensions for each scan) were within the target tolerance (± 6 mm), resulting in 91.3 % of
satisfactory dimension estimation. It is observed that the incident angle is the main parameter that
affects the accuracy of the dimension estimation. In particular, the 45° incident angle seriously
deteriorated the dimension error such that the average error was 4.3 mm and 60.0 % of the over-
tolerance dimensions was obtained from the 45° incident angle cases. On the other hand, the scan
distance and angular resolutions had a negligible impact on the dimension estimation accuracy.
(a) (b)
(c) (d)
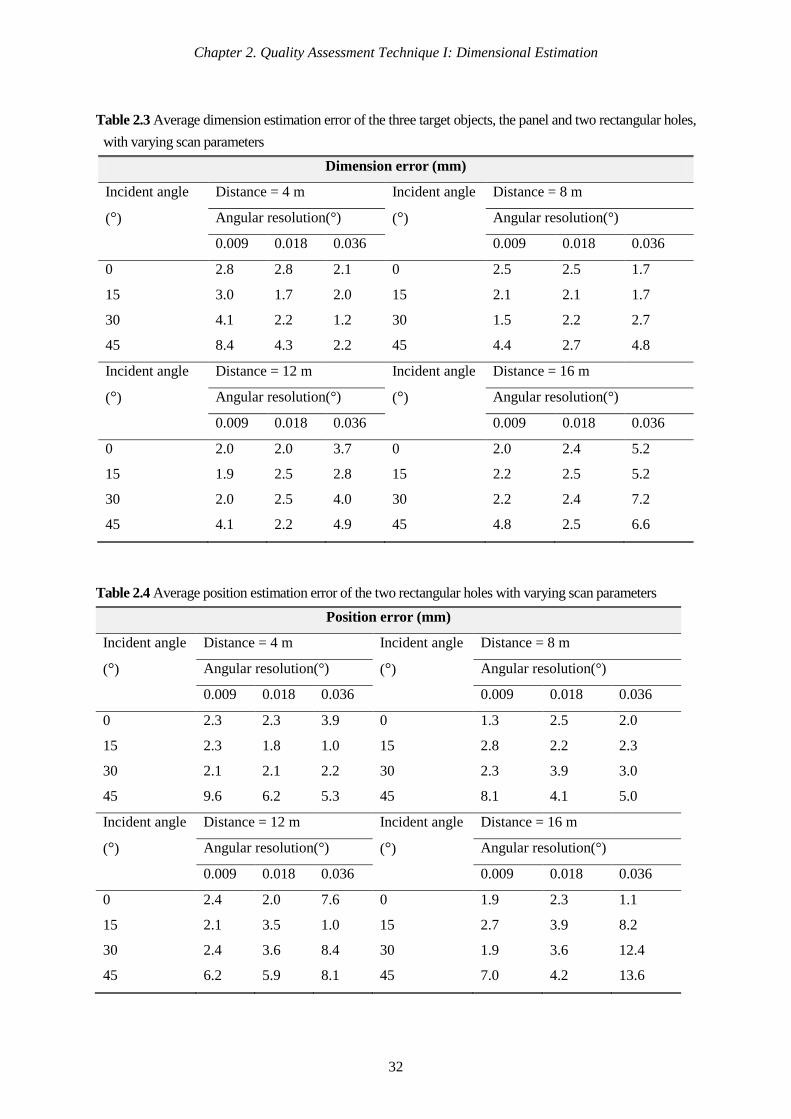
Chapter 2. Quality Assessment Technique I: Dimensional Estimation
32
Table 2.3 Average dimension estimation error of the three target objects, the panel and two rectangular holes,
with varying scan parameters
Dimension error (mm)
Incident angle
(°)
Distance = 4 m Incident angle
(°)
Distance = 8 m
Angular resolution(°) Angular resolution(°)
0.009 0.018 0.036 0.009 0.018 0.036
0 2.8 2.8 2.1 0 2.5 2.5 1.7
15 3.0 1.7 2.0 15 2.1 2.1 1.7
30 4.1 2.2 1.2 30 1.5 2.2 2.7
45 8.4 4.3 2.2 45 4.4 2.7 4.8
Incident angle
(°)
Distance = 12 m Incident angle
(°)
Distance = 16 m
Angular resolution(°) Angular resolution(°)
0.009 0.018 0.036 0.009 0.018 0.036
0 2.0 2.0 3.7 0 2.0 2.4 5.2
15 1.9 2.5 2.8 15 2.2 2.5 5.2
30 2.0 2.5 4.0 30 2.2 2.4 7.2
45 4.1 2.2 4.9 45 4.8 2.5 6.6
Table 2.4 Average position estimation error of the two rectangular holes with varying scan parameters
Position error (mm)
Incident angle
(°)
Distance = 4 m Incident angle
(°)
Distance = 8 m
Angular resolution(°) Angular resolution(°)
0.009 0.018 0.036 0.009 0.018 0.036
0 2.3 2.3 3.9 0 1.3 2.5 2.0
15 2.3 1.8 1.0 15 2.8 2.2 2.3
30 2.1 2.1 2.2 30 2.3 3.9 3.0
45 9.6 6.2 5.3 45 8.1 4.1 5.0
Incident angle
(°)
Distance = 12 m Incident angle
(°)
Distance = 16 m
Angular resolution(°) Angular resolution(°)
0.009 0.018 0.036 0.009 0.018 0.036
0 2.4 2.0 7.6 0 1.9 2.3 1.1
15 2.1 3.5 1.0 15 2.7 3.9 8.2
30 2.4 3.6 8.4 30 1.9 3.6 12.4
45 6.2 5.9 8.1 45 7.0 4.2 13.6

Chapter 2. Quality Assessment Technique I: Dimensional Estimation
33
Table 2.5 Squareness estimation error of the panel with varying scan parameters
Squareness error (mm)
Incident angle
(°)
Distance = 4 m Incident angle
(°)
Distance = 8 m
Angular resolution(°) Angular resolution(°)
0.009 0.018 0.036 0.009 0.018 0.036
0 0.3 0.0 0.4 0 0.2 0.6 1.7
15 0.1 0.5 0.6 15 0.5 0.5 0.9
30 0.3 0.2 0.1 30 0.3 1.1 0.9
45 3.1 0.5 1.8 45 0.6 0.0 1.0
Incident angle
(°)
Distance = 12 m Incident angle
(°)
Distance = 16 m
Angular resolution(°) Angular resolution(°)
0.009 0.018 0.036 0.009 0.018 0.036
0 0.2 1.7 0.7 0 2.5 0.4 11.7
15 1.1 0.7 2.6 15 0.9 1.9 1.0
30 0.4 2.2 7.8 30 0.3 0.2 7.2
45 3.3 3.6 4.6 45 1.0 5.1 7.3
Table 2.4 presents the position errors of the two rectangular holes estimated by the proposed
technique under varying scan parameters. Here, the distance between the center point of each object
and the nearest edge of the panel is defined as the position as mentioned earlier. The position error of
each hole was calculated in both horizontal and vertical directions so that a total of 4 position errors (2
objects × 2 positions) were obtained from each scan. Note that the position error presented Table 4 is
the average of these 4 position errors. The position estimation error was overall 4.09 mm for 192
dimension estimations (48 scans and 4 positions for each scan), and 154 dimensions out of 192 were
successfully estimated within the tolerance. Like the dimension error results in Table 2.3, the
estimation performance deteriorated with increasing incident angles, particularly in 45° incident angle
cases where the average position error was 6.9 mm and 52.6 % of the over-tolerance dimensions was
obtained.
Table 2.5 shows the squareness estimation error for the panel. The average squareness error
was 1.76 mm, and squareness was successfully estimated for 44 cases out of 48 scans (48 scans and 1
squareness estimation for each scan), resulting in a success rate of 91.7%. The success rate for the
squareness estimation was higher than the dimension and position estimations because it was
estimated based on only the extracted corner information without any edge loss compensation.

Chapter 2. Quality Assessment Technique I: Dimensional Estimation
34
Figure 2.14 Effects of scan parameters on dimension and position estimations: (a), (b) and (c) investigate
effects of distance, incident angle and angular resolution on dimensions of three targets, respectively. (d), (e)
and (f) investigate effects of distance, incident angle and angular resolution on positions of two rectangular
holes, respectively.
In Fig. 2.14 (a), (b) and (c), the effects of the scan parameters on the length and width
estimations of the three targets are investigated. To examine the effect of each scan parameter
individually, only one scan parameter was varied in each subfigure while the other two parameters
were fixed to their reference values, i.e., distance: 8 m, incident angle: 0° and angular resolution:
0.009°. In addition, error bars are used to show error bounds for the dimensional measurements. The
width of the error bar was two times the standard deviation of each measurement. As expected, the
4 8 12 16
2
4
6
8
10
Distance (m)
Dim
en
sio
n e
rro
r (m
m)
Distance Effect
Average
Length
Width
4 8 12 16
2
4
6
8
10
Distance (m)
Po
sit
ion
err
or
(mm
)
Distance Effect
Average
Length
Width
0 15 30 45
2
4
6
8
10
Incident angle (deg.)
Dim
en
sio
n e
rro
r (m
m)
Incident Angle Effect
Average
Horizontal
Vertical
0 15 30 45
2
4
6
8
10
Incident angle (deg.)
Dim
en
sio
n e
rro
r (m
m)
Incident Angle Effect
Average
Horizontal
Vertical
0.009 0.018 0.036
2
4
6
8
10
Angular resolution (deg.)
Dim
en
sio
n e
rro
r (m
m)
Angular Resolution Effect
Average
Horizontal
Vertical
0.009 0.018 0.036
2
4
6
8
10
Angular resolution (deg.)
Po
sit
ion
err
or
(mm
)
Angular Resolution Effect
Average
Horizontal
Vertical
(a)
(b)
(c)
(d)
(e)
(f)

Chapter 2. Quality Assessment Technique I: Dimensional Estimation
35
dimension estimation is not much influenced by the scan distance. The incident angle effect, there was
no big difference in the dimension errors among incident angles of 0°, 15° and 30°. However, in the
case of 45°, the dimension error (4.4 mm) became much larger than the other dimension errors (2.5,
2.1 and 1.5 mm) of lower incident angles. This incident angle effect agrees with past work on
measurement error of the laser scanner by other researchers (Laefer et al. 2009; Lichti 2007). The
angular resolution, however, showed no significant trend with the increase in angular resolution. As
shown in Fig. 2.14 (d), (e) and (f), similar parameter studies were conducted for the estimation of the
horizontal and vertical positions of two rectangular holes. From the results, the incident angle
parameter is more dominant than scan distance and angular resolution parameters in a similar manner
to the dimension results. In the case of the 45° incident angle, the position error (8.1 mm) is the
highest among those (1.3, 2.8 and 2.3 mm) of the other incident angle cases. From the results, scans
under incident angles of less than 45° are recommended for dimensional quality assessment of precast
concrete panels. The cause of these observations is illustrated in the following paragraph.
Figure 2.15 Edge point extraction results with a large incident angle: (a) With scan parameters (distance 8 m,
incident angle 0° and angular resolution 0.018°); (b) With incident angle of 45°.
-0.2 0 0.2 0.4 0.6 0.8 1
0
0.2
0.4
0.6
Horizontal length (m)
Vert
ical
len
gth
(m
)
-0.05 0 0.05 0.1 0.15 0.2 0.25
0.28
0.3
0.32
0.34
0.36
0.38
0.4
0.42
0.44
0.46
Horizontal length (m)
Vert
ical
len
gth
(m
)
-0.2 0 0.2 0.4 0.6 0.8 1
0
0.2
0.4
0.6
Horizontal length (m)
Vert
ical
len
gth
(m
)
-0.05 0 0.05 0.1 0.15 0.2 0.25
0.28
0.3
0.32
0.34
0.36
0.38
0.4
0.42
0.44
0.46
Horizontal length (m)
Vert
ical
len
gth
(m
)
(a)
(b)
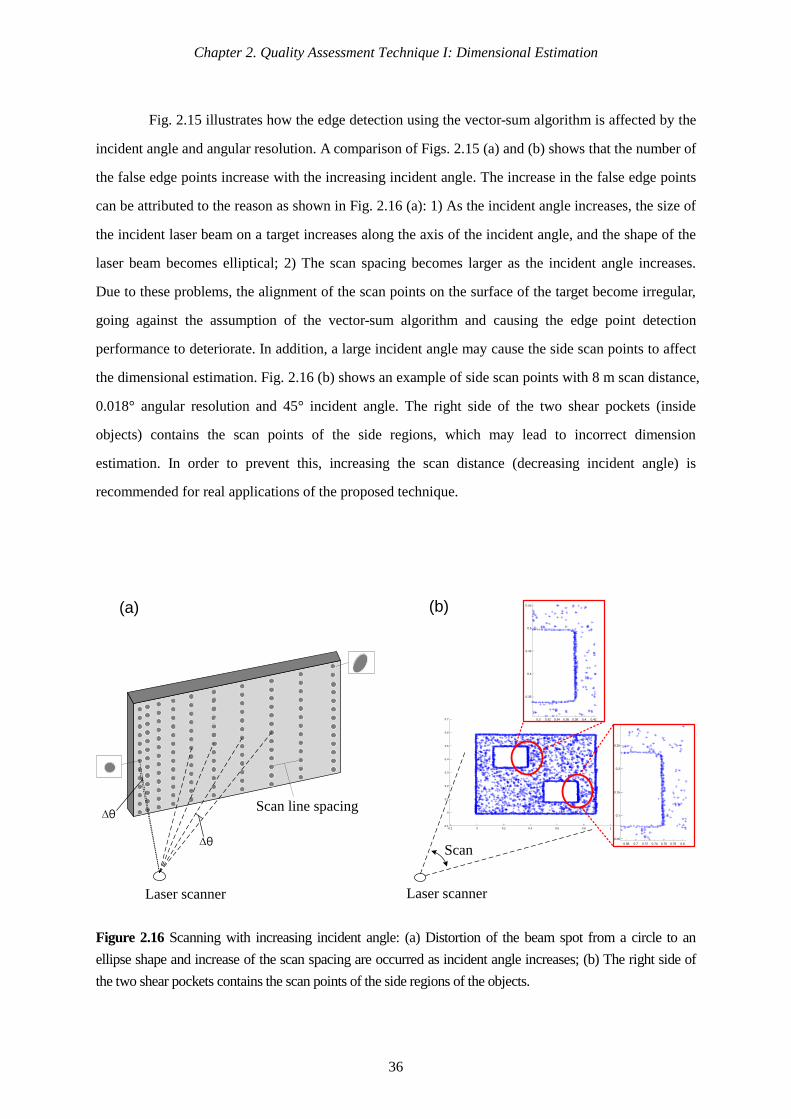
Chapter 2. Quality Assessment Technique I: Dimensional Estimation
36
Fig. 2.15 illustrates how the edge detection using the vector-sum algorithm is affected by the
incident angle and angular resolution. A comparison of Figs. 2.15 (a) and (b) shows that the number of
the false edge points increase with the increasing incident angle. The increase in the false edge points
can be attributed to the reason as shown in Fig. 2.16 (a): 1) As the incident angle increases, the size of
the incident laser beam on a target increases along the axis of the incident angle, and the shape of the
laser beam becomes elliptical; 2) The scan spacing becomes larger as the incident angle increases.
Due to these problems, the alignment of the scan points on the surface of the target become irregular,
going against the assumption of the vector-sum algorithm and causing the edge point detection
performance to deteriorate. In addition, a large incident angle may cause the side scan points to affect
the dimensional estimation. Fig. 2.16 (b) shows an example of side scan points with 8 m scan distance,
0.018° angular resolution and 45° incident angle. The right side of the two shear pockets (inside
objects) contains the scan points of the side regions, which may lead to incorrect dimension
estimation. In order to prevent this, increasing the scan distance (decreasing incident angle) is
recommended for real applications of the proposed technique.
Figure 2.16 Scanning with increasing incident angle: (a) Distortion of the beam spot from a circle to an
ellipse shape and increase of the scan spacing are occurred as incident angle increases; (b) The right side of
the two shear pockets contains the scan points of the side regions of the objects.
(a) (b)
-0.2 0 0.2 0.4 0.6 0.8 1-0.1
0
0.1
0.2
0.3
0.4
0.5
0.6
0.7
Laser scanner
0.3 0.32 0.34 0.36 0.38 0.4 0.42
0.35
0.4
0.45
0.5
0.55
0.68 0.7 0.72 0.74 0.76 0.78 0.8
0.05
0.1
0.15
0.2
0.25
Scan
Scan line spacing
Laser scanner
∆θ
∆θ

Chapter 2. Quality Assessment Technique I: Dimensional Estimation
37
The angular resolution in a short scan distance can also affect dimensional estimation results.
Tables 2.3-5 show that high scan densities (a short scan distance and dense angular resolution) can
produce larger estimation errors than low scan densities. For example, given the identical scan
distance of 4 m and incident angle of 45°, the dimensional error was larger with a 0.009° angular
resolution (8.2 mm) than with a 0.036° angular resolution (2.2 mm) Fig. 2.17 shows the effect of
angular resolution on edge point extraction results when the scan parameters are set at scan distance
of 4 m and an incident angle of 0°. It can be seen that the edge detection performance deteriorates
with increasing angular resolution. This deterioration can be explained by the fact that, as the angular
resolution increases, the spacing between two adjacent scan points (0.673 mm = distance ×
angular resolution ÷ cos(incident angle)) becomes irregular because the spacing gets closer to
the measurement noise level (0.6 mm at 90% reflectivity) of the laser scanner used in this study. To
prevent this problem, the scan distance and angular resolution should be chosen properly so the point-
to-point distance is larger than the laser scanner’s measurement noise levels.
Figure 2.17 The effect of angular resolution on edge point extraction (at 4 m distance and with 15° incident
angle): (a) 0.009° angular resolution, and (b) 0.036° angular resolution
(a) High scan density - distance 4 m, angular resolution 0.009°
at incident angle 15°
(b)Low scan density - distance 4 m, angular resolution 0.036°
at incident angle 15°

Chapter 2. Quality Assessment Technique I: Dimensional Estimation
38
2.5 Application to Actual Precast Concrete Panel
Test configuration 2.5.1
Figure 2.18 Experimental setup and dimensions of precast concrete panels: (a) Test configuration; (b)
Dimension specifications.
To further examine the effectiveness of the proposed dimensional quality assessment
technique, tests on two actual precast concrete panels were conducted. The overall experimental
configuration and the investigated precast concrete panels are shown in Fig. 2.18. The bottom surface
of the precast concrete panels was fixed onto a concrete wall and scanned by the laser scanner as
shown in Fig. 2.18 (a). In this experiment, the laser scanner was positioned 10m from the precast
concrete panels and 2.5 m from the ground, resulting in a maximum incident angle of 5.7°. Scans with
three different angular resolution cases (0.009, 0.018 and 0.036°) were performed. Fig. 2.18 (b)
describes the two precast concrete panels tested in the experiments. Precast concrete panel I was
assumed a normal (well-manufactured) panel and precast concrete panel II was fabricated to represent
an abnormal panel with dimensional errors exceeding the tolerance. For both panels, there are six
rectangular shear pockets with identical dimensions of 250 mm × 150 mm. For precast concrete
panel II, three dimensional errors were intentionally introduced: 1) 20 mm loss of the upper horizontal
dimension (1980 mm) 2) position shift of No. 2 shear pocket to the right and downward by both 25
mm 3) position shift of No. 6 shear pocket to the left and downward by both 25 mm.
(a) (b)
Precast concrete panel
Laser
scanner
10
00
mm
2000 mm
150
mm
675 mm
45
0 m
m
15
0 m
m
250 mm
325 mm
27
5 m
m
675 mm
Precast Concrete Panel I
10
00
mm
1980 mm
150
mm
700 mm
47
5 m
m
650 mm
Precast Concrete Panel II
30
0 m
m
Shear
2 31
4 5 6
2000 mm
2 31
4 5 6

Chapter 2. Quality Assessment Technique I: Dimensional Estimation
39
Experimental results 2.5.2
Figure 2.19 Edge and corner extraction results on: (a) Precast concrete panel I; (b) Precast concrete panel II
(obtained with angular resolution of 0.009°)
Fig. 2.19 shows the result of the edge and corner point extractions for two the precast
concrete panels. The edge and corner points of the precast panels and the six shear pockets for each
panel were successfully obtained from the vector-sum algorithm. Tables 2.6, 2.7 and 2.8 summarize
the dimensional estimation results compared to the design dimensions of the precast concrete panels.
For the dimension estimation in Table 2.6, the dimension error was an average of 1.9 mm for 84
dimension estimations (6 scans and 14 dimensions for each scan) producing a success rate of 95.2 %
within the tolerance. Note that the vertical dimension estimation is more influenced by the angular
resolution than the horizontal one. For the position estimation in Table 2.7, the average position
estimation error of the shear pockets was 1.8 mm with a success rate of 96.5 %. For the squareness
error in Table 2.8, the average squareness error was 2.7 mm and all cases were within the tolerance. In
order to compare the estimated results with the conventional method, manual inspections were
conducted on the two precast concrete panels. Table 2.9 shows the manual inspection error results

Chapter 2. Quality Assessment Technique I: Dimensional Estimation
40
compared to the design dimensions of the precast panels. The average errors of the dimension and
position of the two precast panels were 0.5 and 1.9 mm, respectively, which have differences of 1.4
and 0.1 mm compared to the estimation result of the proposed technique. This demonstrates that the
proposed dimensional quality assessment technique can accurately and reliably measure the length,
position and squareness of the precast concrete panels.
Table 2.6 Dimension estimation error of precast concrete panels I & II and their six shear pockets.
Precast Slab Precast Slab I Precast Slab II
Angular resolution (˚) 0.009 0.018 0.036 0.009 0.018 0.036
Dimension
Error (mm)
Slab
Hori. Upper 1.4 0.6 0.3 1.1
(-21.1)
0.5
(-19.5)
2.9
(-22.9)
Hori. Bot. 1.3 0.4 0.7 2.4 4 2.6
Vert. 0.9 0.1 1.2 4.1 1.4 3.8
S. P. 1 Hori. 2.4 2.9 1.7 1.8 3.4 5
Vert. 0.1 1 6.1 0.4 3.1 1.5
S. P. 2 Hori. 0.5 0.3 3 0.4 1.9 2.9
Vert. 0.4 1.3 5.8 0.8 1.9 7.1
S. P. 3 Hori. 1.4 1.2 2.8 1.6 3.2 2.6
Vert. 0.9 1.6 2.3 0.4 3.1 1.9
S. P. 4 Hori. 1.6 0.9 0.6 1.7 3.2 1.1
Vert. 1.4 0.6 1.1 0.4 2.4 7.3
S. P. 5 Hori. 1.6 1.7 0.6 0.3 1.3 4.7
Vert. 1.6 0.5 1.4 0.9 1.8 6.5
S. P. 6 Hori. 2.0 1.4 1.1 1.1 2.7 2.6
Vert. 1.9 1 0.4 1.5 1.2 4.8
Average 1.3 1.1 2 1.2 2.3 3.9
Hori. Ave. 1.6 1.3 1.4 1.2 2.5 3.1
Vert. Ave. 1.0 0.9 2.6 1.2 2.1 4.7
( ) denotes the actual dimension error regarding the artificially introduced dimensional errors.

Chapter 2. Quality Assessment Technique I: Dimensional Estimation
41
Table 2.7 Position estimation error of the six shear pockets for precast concrete panels I&II.
Precast Slab Precast Slab I Precast Slab II
Angular resolution (˚) 0.009 0.018 0.036 0.009 0.018 0.036
Position
Error (mm)
S. P. 1 Hori. 2.3 2 2.4 2.8 3.6 2.7
Vert. 0.6 2.6 5.2 2.6 3.9 3.2
S. P. 2
Hori. 0.1 0.3 0.6 1.1
(-26.1)
1.9
(-26.9)
0.1
(-25.1)
Vert. 1.7 2.2 3.9 0.8
(-24.2)
0.5
(-25.5)
0.3
(-24.7)
S. P. 3 Hori. 1.4 1.4 2.4 0.1 0.9 1.3
Vert. 3.8 1.4 0.6 0.5 0.8 1
S. P. 4 Hori. 0.1 0.9 0.3 1.9 2.6 1.3
Vert. 2 1 3.6 2.5 1.2 3.9
S. P. 5 Hori. 0.7 0.5 0.5 2.1 2.9 2.6
Vert. 0.3 0.4 2.1 1.1 0.3 1.9
S. P. 6
Hori. 1.9 1.9 0.3 6.9
(-31.9)
6.1
(-31.1)
2.2
(-27.2)
Vert. 0.2 2.7 4.2 2.2
(-22.8)
3.6
(-21.4)
0.4
(-24.6)
Average 1.3 1.4 2.2 2.1 2.4 1.7
Hori. Ave. 1.1 1.2 1.1 2.5 3 1.7
Vert. Ave. 1.4 1.7 3.3 1.6 1.7 1.8
( ) denotes the actual position error regarding the artificially introduced dimensional errors.
Table 2.8 Squareness estimation error of precast concrete panels I&II.
Angular resolution (˚) Squareness error (mm)
Precast Slab I
0.009 0.9
0.018 1.4
0.036 1.4
Precast Slab II
0.009 3.5 (23.5)
0.018 3.5 (23.5)
0.036 5.5 (25.5)
( ) denotes the actual squareness error regarding the artificially introduced dimensional errors.

Chapter 2. Quality Assessment Technique I: Dimensional Estimation
42
Table 2.9 Manual inspection error of precast concrete panels I & II and their six shear pockets
Precast Slab Precast
Slab I
Precast
Slab II
Precast
Slab I
Precast
Slab II
Dimension
Error (mm)
Slab Hori. 1.5 0.0
Position
Error
(mm)
- -
Vert. 0.5 0.5 - -
S. P. 1 Hori. 1.0 0.5 5.0 3.0
Vert. 0.0 0.0 2.0 1.0
S. P. 2 Hori. 0.5 1.5 1.0 3.0
Vert. 0.5 0.0 3.0 1.0
S. P. 3 Hori. 1.0 0.0 3.0 3.0
Vert. 0.0 0.5 2.0 1.0
S. P. 4 Hori. 0.5 1.5 0.0 4.0
Vert. 0.0 0.0 1.0 2.0
S. P. 5 Hori. 1.5 1.0 0.0 3.0
Vert. 0.0 0.0 0.0 3.0
S. P. 6 Hori. 1.0 0.0 2.0 0.0
Vert. 0.5 0.5 0.0 2.0
Average 0.6 0.4 1.6 2.2
Hori. Ave. 1.0 0.6 1.8 2.7
Vert. Ave. 0.2 0.2 1.3 1.7
2.6 Chapter Summary
This chapter describes an automated and non-contact technique that measures and assesses the
dimensional qualities of precast concrete elements based on 3D laser scanning. A new edge and corner
extraction technique was developed in this study, and successfully estimated the dimensional properties of
the laboratory specimen and actual precast concrete elements. The experimental results demonstrate that
the dimension, position and squareness estimation of the tested precast concrete elements are estimated
within the 6 mm tolerance with a 95.2, 96.5 and 100 % success rate, respectively. In addition, the lessons
learned from the results of the laboratory test are that: (1) scans under an incident angle of less than 45° is
recommended for dimensional quality assessment of precast concrete panels; and (2) scans with a high
scan density where the point-to-point distance of scan data is close to laser scanners’ measurement noise,
should be avoided. Compared to other studies, this study has the following uniqueness: (1) the
development and validation of an automated technique for dimensional QA of actual precast concrete
elements; (2) the development of a fully-automated coordinate transformation edge extraction algorithms
However, the applicability of the proposed dimensional QA technique is limited to precast concrete
elements with a rectangular-shape and uniform thickness in this study.

Chapter 3. Quality Assessment Technique II: Surface Defect Estimation
43
(a) (b)
3 QUALITY ASSESSMENT TECHNIQUE II:
SURFACE DEFECT ESTIMATION
3.1 Chapter Introduction
Figure 3.1 Surface quality assessment of precast concrete elements: (a) Spallings; (b) Warping and fissuring
A surface quality assessment (QA) technique for precast concrete elements is presented in
this chapter. Surface defects such as cracks, spallings and warping appear on the surface of a precast
concrete element during the manufacturing or in-delivery stages due to inappropriate curing, sudden
external loading or environmental changes (Portland Cement Association (PCA) 2001). These defects
on a concrete surface may become severer as time passes and can reach the point the steel rebars
inside the precast concrete become exposed and corrode, compromising the serviceability and safety
of the structure. Furthermore, the consequence of poor surface QA of precast concrete elements can be
expensive. It was reported that defects on concrete components during construction, such as cracks
and local mass losses, could result in rework costs of up to 6-12% of the total construction costs
(Josephson and Hammarlund 1999). Currently, the inspection of the surface defects of precast
concrete elements is done manually by certified personnel similar to the dimensional assessment.
Inspectors mostly use contact-type devices, such as a measuring tape or a profilometer, to identify the
size and location of surface defects on the surface of a precast concrete element. A profilometer moves
above the precast concrete surface in a predetermined pattern and measures the elevation of the
surface, which is then compared to the as-designed elevations (Tang et al. 2011). However, the current
surface QA methods are time-consuming and costly. To overcome these problems, this study develops

Chapter 3. Quality Assessment Technique II: Surface Defect Estimation
44
a technique that can simultaneously localize and quantify spalling defects, which are a representative
defect on precast concrete surfaces with a 3D laser scanner. Defect sensitive features, which have
complementary properties to each other, are developed and combined for improved localization and
quantification of spalling defects. In order to verify the proposed surface QA technique, numerical
simulations and experiments are conducted. Furthermore, a parametric study with varying scan
parameters was performed for finding optimal detection conditions.
This chapter is organized as follows. First, the related literature is presented in Chapter 3.2,
followed by the development of the surface quality assessment technique in Chapter 3.3. Then, a
series of numerical simulation and laboratory tests are discussed in Chapters 3.4 and 3.5, respectively.
Actual experimental results implemented on real precast concrete slabs are presented in Chapter 3.6.
The discussing and chapter summary are then presented in Chapters 3.7 and 3.8.
3.2 Related Work
Vision camera-based surface quality inspection 3.2.1
The use of visual images is the most popular approach in detecting the exterior defects of a
structure because it is fast and inexpensive. For the detection of cracks, Hutchinson and Chen (2006)
proposed a probabilistic method based on Bayesian decision theory for automatic crack detection
from images. Barazzetti and Scaioni (2009) employed the RGB intensity to detect cracks, then
computed the crack width at a given cross-section. For the detection of air-pockets, Suwwanakarn et
al. (2007) proposed the use of three circular filters to detect air pockets on the surfaces of concrete.
For the detection of spallings, Koch and Brilakis (2011) proposed a technique using image
segmentation and morphological thinning. While the image-based methods offer good accuracy, their
performance is heavily affected by lighting conditions. Furthermore, although identification of defect
sizes such as length, width, depth and volume is important for assessment of concrete structures, these
types of qualitative information cannot be retrieved using image-based methods without prior
knowledge such as the distance between a camera and a target structure or the size of a reference
target.

Chapter 3. Quality Assessment Technique II: Surface Defect Estimation
45
Laser scanning-based surface quality inspection 3.2.2
Using the point cloud data acquired from 3D laser scanner, researchers have proposed
algorithms to detect and visualize defects on concrete surfaces. Teza et al. (2009) proposed a defect
detection technique based on the computation of the mean and Gaussian curvatures of the surface.
Tang et al. (2011) compared the detectability of surface flatness defects with different algorithms and
scanners. Olsen et al. (2010; 2013) proposed a technique that analyzed the volumetric change of a
reinforced concrete structure using I-Site Studio 3.0 software program and discussed the potential of
integrating laser scan points with intensity images for recognizing complex defect patterns,
respectively. Liu et al. (2011) proposed a distance and gradient based volume loss detection technique
for an in-situ concrete bridge. Mizoguchi et al. (2013) estimated the depth of scaling defects based on
a customized region growing approach. Despite the large volume of literature on laser scanning based
defect detection of concrete surfaces, little attention has been paid to the simultaneous and
quantitative estimation of surface defect location and volume loss. Moreover, there has been no
logistic guidance for optimal scanning parameter selection, although it can be useful in practice. Thus,
it is necessary to develop a technique that accurately localizes and quantifies surface defects, and
identify an optimal scanning parameter for enhancing the detectability of precast concrete surface
defects.
3.3 Surface Defect Quality Assessment Technique for Precast Concrete
Elements
Fig. 3.2 (a) provides an overview of the proposed precast concrete spalling defect detection
technique. Here, it is important to note that the term ‘spalling’ used in this study is defined as a deeper
surface defect than scaling, often appearing as circular or oval depressions on surfaces (PCA 2001). The
target object is assumed to be a rectangular precast concrete structure. The laser scanner is positioned at a
certain distance from the target concrete structure and scans the concrete surface. First, a region of interest
(ROI) is selected, and then the laser scanner captures the 3D coordinate information of the scanned points
inside the ROI. Fig. 3.2 (b) shows the overall procedures for the proposed automated technique, which
include coordinate transformation, defect localization and defect quantification. Note that the word
‘automated’, as used in this study implies that, once the raw scan data within a ROI becomes available, the
proposed technique operates in a fully automated way for all data processing from coordinate
transformation for defect quantification. Details for each step are described below.

Chapter 3. Quality Assessment Technique II: Surface Defect Estimation
46
(a) (b) (c)
Estimated near-corner point
(a) (b)
Scan data acquisition
Coordinate transform with respect
to laser scanner to a target object
Defect localization
Defect quantification
L.S.
Precast Concrete
Spalling defect
Laser beam
Figure 3.2 Overview of the proposed precast concrete spalling defect detection technique: (a) Laser scanner
configuration for precast concrete surface scanning; (b) Procedures for the proposed defect localization and
quantification
Coordinate transformation 3.3.1
Once point cloud data is acquired from the laser scanner, their 3D coordinates with respect to
the laser scanner are transformed to a new coordinate system with respect to the target object. The
main purpose of this is to remove unwanted background scan points behind the target so that only
scan points within the target surface are retained for data processing. The removal can be easily
achieved after coordinate transformation by setting a proper region for the three axes of the new
coordinate system.
Figure 3.3 Determination of three points of the target object from a range image for coordinate
transformation: (a) The initial range image of a target specimen within a ROI; (b) Edge and corner detection
using the canny edge detection and Hough transform in a binary image; (c) Determination of three points
near the corners of the target object

Chapter 3. Quality Assessment Technique II: Surface Defect Estimation
47
Figure 3.4 Three point selection algorithm for automated coordinate transformation
For coordinate transformation, three pixel points near the corners of the target structure are
automatically determined from the range image generated from the point cloud. Here, each pixel of
the range image and each scan point are coupled so that each pixel of the range image holds the
distance value from the laser scanner to the corresponding scan point. Also, at this stage, only pixel
points ‘near’ the exact corners are identified and used for coordinate transformation because the range
values of the exact corners have large measurement errors due to the mixed pixel problem (Hebert and
Krotkov 1991). Fig. 3.3(a) shows the range image of the ROI of the target object. The target object
closer to the laser scanner is shown in black while the background of the object is shown in white. In
order to determine three pixel points near the corners of the target object, the exact corners of the
target object are first extracted by intersecting the edge lines obtained from the Hough transform as
shown in Fig. 3.3(b). Subsequently, the three pixel points used for coordinate transformation in Fig.
3.3(c) are determined using the proposed algorithm in Fig. 3.4. First, candidate pixel points
surrounding each corner point (𝐶1, 𝐶2, and 𝐶3) are limited to 1) the ones from each corner point
within a certain margin bound (𝜖) and 2) ones with a range distance of less than the range threshold
(𝛾). Note that 𝜖 and 𝛾 are selected to be 10 pixels and the mean range value of the range image such
that only pixel points on the target object surface and 10 pixel distance from each corner point are
selected as candidate pixel points. An iterative search for the best three pixel points is then performed
based on the condition that the horizontal and vertical lines formed by the three scan points

Chapter 3. Quality Assessment Technique II: Surface Defect Estimation
48
x
y
Spalling defect
(a)
(b)
Scan point
z
x
z
(c)
z
x
Distance deviation from the
globally fitted plane
Globally fitted plane
Locally fitted plane
Normal vector of a
locally fitted plane
Concrete surface
Angle deviation from
the reference direction
Reference direction
(+ z axis)
corresponding to the selected three pixel points are orthogonal in the 3D space. Note that the
orthogonality condition between the two lines should be preserved to avoid the distortion of scan
points after coordinate transformation. However, since a perfect right angle between the two lines
might not be achievable due to the limited spatial resolution of the laser scanner, three pixel points
forming the angle closest to a right angle are determined as shown in Fig. 3.3(c). Once the three scan
points corresponding to the selected pixel points are extracted, the rotation and the translation
matrices for coordinate transformation are determined, and the coordinates of all scan points are
transformed with respect to the target object coordinate system. The unnecessary background scan
points are then removed by setting a margin to each of the three axes of the new coordinate system
such that only scan points on the target surface are retained for further data processing.
Defect-sensitive features 3.3.2
Figure 3.5 Definitions of defect sensitive features: (a) Overview of scan points lying on a concrete surface
(b) Definition of the angle deviation from the reference direction in the x-z plane view; (c) Definition of the
distance deviation from the globally fitted plane in the x-z plane view

Chapter 3. Quality Assessment Technique II: Surface Defect Estimation
49
Once coordinate transformation and elimination of unwanted scan points are complete,
defect localization and quantification processes ensue. In this study, two defect-sensitive features, i.e.,
angle deviation and distance deviation, are selected and combined to enhance the detectability on the
entire region of spalling defects since each feature has unique yet complementary characteristics. Fig.
3.5 illustrates the definition of the two defect sensitive features. The angle deviation is defined as the
angle difference between the normal vector of a locally fitted plane and the reference direction and the
distance deviation stands for the distance difference between a scan point and the globally fitted plane.
Fig. 3.5 (b) illustrates that the angle deviation from the reference direction increases as the scan point
within the defect area moves closer to the defect edges. Therefore, the angle deviation is effective in
identifying the defect boundaries. On the other hand, as shown in Fig. 3.5 (c), the distance deviation
has a larger value near the center of the defect area rather than near the edges so that the distance
deviation is effective in identifying the inside region of defects.
First, the angle deviation for each scan point is computed as follows:
(1) The local plane of the i-th scan point (𝑝𝑖) is generated from its eight nearest neighboring points
(𝑝𝑖𝑗 , 𝑗 = 1,… ,8).
(2) The covariance matrix (𝐂(𝑝𝑖) ∈ 3 3 ) of the eight neighboring points is computed as:
𝐂(𝑝𝑖) =1
8∑(𝑝𝑖
𝑗
𝑗
𝑝 ) (𝑝𝑖𝑗 𝑝 )
(3.1)
where 𝑝 is the centroid of the eight neighboring points around 𝑝𝑖.
(3) A principal component analysis (PCA) is performed on the covariance matrix to estimate a normal
vector of the local plane (Shakarji 1998):
𝐂(𝑝𝑖) (𝑝𝑖) = (𝑝𝑖) (𝑝𝑖), ∈ 1,2,3 (3.2)
where and stand for the m-th eigenvector and eigenvalue of the covariance matrix,
respectively. Because the covariance matrix (𝐂) is symmetric and positive-definite, its eigenvalues are
all real and non-negative. When the eigenvalues are arranged in ascending order (0 ≤ ≤ 2 ≤ 3),
the first eigenvector ( ) corresponding to the smallest eigenvalue ( ) approximates the normal
vector +𝒏 = 𝑛𝑥, 𝑛𝑦, 𝑛𝑧 or its opposite 𝒏. The ambiguity of the sign of the normal vector is

Chapter 3. Quality Assessment Technique II: Surface Defect Estimation
50
resolved by forcing the orientation of all normal vectors to an upward direction (+ z axis).
(4) A defect index (DI1(𝑝𝑖)) for the first defect sensitive feature, i.e., the angle deviation from the
reference direction, is defined as the average of the angle deviations of the eight neighbor points
surrounding 𝑝𝑖:
(𝑝𝑖) =1
8∑ (𝑝𝑖
𝑗)
𝑗
(3.3)
where (𝑝𝑖𝑗) denotes the angle deviation of the j-th nearest point from the reference direction. Here,
the reference direction is set to the +z direction perpendicular to the x-y plane. Note that DI1 increases
as the scan point within the defect area moves closer to the defect so that DI1 is effective in
identifying the defect boundaries.
As the second defect sensitive feature, the distance deviation of each scan point from a
globally fitted plane is defined as illustrated in Fig. 3.4 (c). Here, the globally fitted plane is obtained
by least-square fitting a 3D linear plane into all scan points within the target concrete surface. Then,
the distance deviation of a scan point (𝑝𝑖) from the global surface is computed as follows:
2(𝑝𝑖) = | 𝑝𝑖(𝑥) + 𝑝𝑖(𝑦) + 𝑝𝑖(𝑧) +
√ 2 + 2 + 2| (3.4)
where a, b, c and d are the coefficients of the globally fitted plane ( 𝑥 + 𝑦 + z + =0). 𝑝𝑖(𝑥),
𝑝𝑖(𝑦) and 𝑝𝑖(𝑧) are x, y and z coordinates of 𝑝𝑖, respectively. Note that DI2 typically has a larger
value near the center of the defect area rather than near the edges as mentioned earlier. Therefore, DI1
and DI2 are complementary for defect localization.

Chapter 3. Quality Assessment Technique II: Surface Defect Estimation
51
Defect identification and quantification procedures 3.3.3
The defect identification and quantification procedures are described below and outlined in
Fig. 3.6.
1) Subdivision of the target surface area: The entire surface area is virtually divided into a number of
subdivisions. Since the spatial resolution of scan points within the target surface is not constant due to
different scan parameters (scan distance and incident angle) for each scan point within the target
surface, this subdivision process is necessary in localizing and quantifying spalling defects. Here, the
size of each subdivision should be small enough to achieve high defect localization accuracy, but
sufficiently larger than the spatial resolution of laser scanning. The effect of the subdivision size on
the defect localization is investigated in the experimental test section.
2) Calculation of two defect indices for each scan point: Based on Eqs. (3.3) and (3.4), two defect
indices, DI1 and DI2, are calculated for all scan points. Note that the global plane necessary for the
calculation of DI2 is obtained using all scan points over the entire target surface.
3) Calculation of two defect indices for each subdivision: Once two defect indices for all scan points
are obtained, the defect indices for each subdivision are computed by averaging the defect index
values of the scan points falling inside each subdivision. Hence, each subdivision holds two defect
index values (DI1(Si) and DI2(Si)), where Si stands for the i-th subdivision.
4) Calculation of a unified defect index for each subdivision (DI(Si)): A unified defect index for each
subdivision is defined as follows:
DI(Si) = α· DI1(Si) + (1-α)· DI2(Si), 0< α <1 (3.5)
where α and (1- α) are weighting factors for DI1 and DI2, respectively. In this study, an equal value of
0.5 is assigned to α and (1- α) such that same contribution to detection of a defect is given to DI1 (the
edge region) and DI2 (the inner region). Note that DI1 and DI2 are combined here because they are
complementary as discussed in the previous section. Therefore, the combined index preserves the
individual advantages of the two indices. Here, it is important to note that each index is normalized by
dividing its value with the maximum value among all subdivisions, so that each index ranges from 0
to 1.

Chapter 3. Quality Assessment Technique II: Surface Defect Estimation
52
Defect Localization and Quantification
1) Subdivision generation on x-y plane
2) Calculation of two defect indices for all points
2.1) Angle deviation from the reference direction (DI1(Pi))
2.2) Distance deviation from the global plane (DI2(Pi))
4) Calculation of unified defect index (DI(Si))
* DI(Si) = α ·DI1(Si) + (1-α)·DI2(Si)
6) Initial defect localization
3) Calculation of two defect indices (DI1(Si), DI2(Si))
for each subdivision
Yes
No
8) Defect quantification
5) Calculation of threshold (TR) 5.1) Selection of candidate intact subdivisions
5.2) Calculation of TR from the candidate intact subdivisions
* TR = α ·TR1 + (1-α)·TR2
7) Recursive defect localization
7.4) Change on defect localization ?
7.1) Refit the global plane using only points inside the intact area
7.2) Update DI2
7.3) Repeat steps from 3) to 6)
Figure 3.6 Procedures for concrete surface defect identification
5) Calculation of a threshold (TR): A threshold (TR) for defect diagnosis is computed from the intact
subdivisions of the surface. There are two steps in determining a threshold value from the intact
subdivisions. First, selection of candidate intact subdivisions is undertaken. Since the actual intact
subdivisions are initially unknown, candidate intact subdivisions, with DI values lower than the
threshold value associated with 95% confidence level from the Weibull distribution of all subdivision
DI values, are determined. Note that the confidence level is selected based on two assumptions: 1) the
surface area of intact subdivisions is much larger than that of defect subdivisions; and 2) the intact
subdivisions have both low DI values. Once the candidate intact subdivisions are obtained, as the
second step, each threshold (TR1 and TR2) for DI1 and DI2 is established with 99% confidence level
from the Weibull distribution of DI1 and DI2 values obtained from the candidate intact subdivisions.

Chapter 3. Quality Assessment Technique II: Surface Defect Estimation
53
Finally, the unified threshold (TR) is obtained as follows:
TR = α· TR1 + (1-α)· TR2 (3.6)
Note that the form (Eq. (3.6)) of calculating TR should be derived in the same from as that of Eq. (3.5)
since the threshold is nothing but the defect index value corresponding to a certain statistical
confidence interval. Also, it is important to note that the candidate intact subdivisions are iteratively
updated through the recursive defect localization step (step 7)) and finally converged.
6) Initial defect localization: Once DI(Si) and TR are computed, initial defect diagnosis is undertaken
based on the following statement:
“If DI(Si) exceeds TR, the corresponding subdivision (Si) is diagnosed as damaged. Otherwise the
subdivision is classified as healthy.”
7) Recursive defect localization: In this step, recursive defect localization is performed for improved
defect localization. The initial defect localization result may not be accurate enough because the
global plane necessary for the calculation of DI2 may even include scan points from defect areas. To
improve the defect localization accuracy, the global plane is re-fitted at this stage excluding the scan
points within the defect areas identified in the previous step. Then, DI2 is updated, and steps 3) to 6)
are repeated until there is no difference between the previous and current defect localization results.
8) Defect quantification: Once all damaged subdivisions are identified, the total volume loss caused
by defect is estimated by multiplying the size of each subdivision with the defect depth (the distance
deviation of each subdivision from the global plane) and summing up this product over all damaged
subdivisions.

Chapter 3. Quality Assessment Technique II: Surface Defect Estimation
54
0
25
50
0
25
50
x (mm)y (mm)
(a) (b)
z (mm)
Defect I –
Concave-shape Defect
Defect II –
Flat-top Defect
Damage I Damage II
y (mm) x (mm)
0 25 50
x (mm)
z (mm)
x (mm)Defect I Defect II
3.4 Numerical Simulation
Numerical setup 3.4.1
Figure 3.7 Configuration of numerical simulation model: (a) Two types of spalling defects: Concave-shape
defect with a maximum deviation of 2 mm (damage I) from the surface, and flat-top defect with a uniform 2
mm deviation (damage II); (b) Cross-section view of the concave and flat-top defects in x-z plane
The proposed concrete spalling defect localization and quantification technique was first
validated through a numerical simulation. Fig. 3.7 shows the configuration of the numerical
simulation model. In the simulation, it is assumed that the shape of laser beam is circular and the
spatial resolution between two adjacent scan points is equal within the target surface. A 50 mmⅹ50
mm virtual panel with a spatial resolution of 1 mm (total 2601 points) was generated to simulate a set
of point cloud data lying on a concrete surface. Two different types of spalling defects, which are the
most commons in practice, were considered: 1) concave-shape defect with dimensions of 10 mmⅹ10
mm (defect I); 2) flat-top defect with dimensions of 10 mmⅹ10 mm (defect II). A maximum
thickness of 2 mm at the center of the defect and a uniform thickness of 2 mm were simulated for
defects I and II, respectively. In order to examine the effect of the measurement noise of the laser
scanner on defect localization and quantification results, Gaussian random noise with zero mean and
five different levels of standard deviations (STD) (0.1, 0.2, 0.3, 0.4 and 0.5 mm) was added to all
virtual scan points.
Simulation results 3.4.2
Fig. 3.8 shows the defect localization results from the numerical simulation. Note that the
results are obtained with 0.3 mm standard deviation noise. Figs. 3.8 (a) and (b) show the effectiveness

Chapter 3. Quality Assessment Technique II: Surface Defect Estimation
55
(a) (b)
(c) (d)
0.2
0.3
0.4
0.5
0.6
0.7
0.8
0.9
0.1
0.2
0.3
0.4
0.5
0.6
0.7
0.8
0.1
0.2
0.3
0.4
0.5
0.6
0.7
of DI1 and DI2 in detecting the edges and the inner regions of the defect areas, respectively. When the
two defect sensitive features are combined, the overall detectability of the defects is enhanced as
shown in Fig 3.8 (c). For the defect classification shown in Fig. 3.8 (d), a threshold value
corresponding to a confidence interval of 99% is used. Table 1 summarizes the results of defect
localization and volume loss estimation with varying measurement noise levels. Note that all
simulations are repeated 10 times, and the average results are reported.
To evaluate the defect localization performance of the proposed technique, recall and
precision ratios are computed (Su 1999). Fig. 3.9 illustrates the definitions of these two ratios. The
recall ratio represents the ratio of the correctly identified defect area (B) to the actual defect area
(B+C), while the precision ratio denotes the ratio of the correctly identified defect area (B) to the
detected defect area (A+B). For the evaluation of defect volume estimation performance, the volume
estimation ratio is defined as the ratio of the estimated volume loss to the actual volume loss.
Figure 3.8 Defect localization results (numerical simulation): (a) Angle deviation from the reference
direction (DI1); (b) Distance deviation from the globally fitted plane (DI2); (c) Combination of two
defect indices (DI);(d) Defect classification (the red lines indicate the boundaries of the actual defect
areas, and the regions with white color are the detected defect regions)

Chapter 3. Quality Assessment Technique II: Surface Defect Estimation
56
Figure 3.9 Definition of recall and precision ratios used for the evaluation of defect localization performance.
Recall ratio represents the ratio of the correctly detected defect area (B) to the actual defect area (B+C), and
the precision ratio denotes the rate of the correctly detected defect area (B) to the estimated defect area (A+B)
Table 3.1 Summary of defect localization and quantification results (simulation)
Noise STD
(mm)
Defect I Defect II
Recall
ratio (%)
Precision
ratio (%)
Volume
estimation
ratio (%)
Recall
ratio (%)
Precision
ratio (%)
Volume
estimation
ratio (%)
0.1 100.0 65.4 97.1 99.3 91.0 98.2
0.2 98.2 78.5 95.8 98.4 88.2 99.1
0.3 92.1 87.2 97.0 97.9 88.8 98.8
0.4 86.3 91.8 95.3 95.8 92.8 96.2
0.5 52.3 98.2 63.0 70.2 91.8 70.1
From Table 3.1, the following observations can be made: (1) As the noise level rises, the
recall and volume estimation ratios decrease and the precision ratio increases. This trend is attributed
to the fact that the threshold value is mainly affected by the noise level. With a lower noise level, the
threshold value becomes lower and the defect size is overestimated. On the other hand, with a higher
noise level, only severely damaged subdivisions inside a defect are detected, resulting in low recall
and volume estimation ratios but a high precision ratio; (2) The overall best performance is obtained
with a noise level of 0.3 mm; (3) The flat-top defect (defect II) is more easily detected than the
concave-shape defect (defect I).
A B CRecall ratio
B
B+C
Precision ratio
B
A+B
Actual defect
Detected
defect

Chapter 3. Quality Assessment Technique II: Surface Defect Estimation
57
Laser
Scanner
Test Specimen
Flat-top
defect
350 m
m
600 mm
Concave-shape
defect
Defect 1 – 100 x 100 x 7
Defect 2 – 50 x 50 x 4
Defect 3 - 30 x 30 x 3
Defect 4 - D100 x 5
Defect 5 - D100 x 7
Defect 6 - D100 x 5
Defect 7 - D50 x 5
Defect 8 - D10 x 4
Dimensions (mm)
(a) (b)
1
2
3
4
5 6
7
8
3.5 Laboratory Experiments
Laboratory specimen test configuration 3.5.1
Figure 3.10 Laboratory test configuration and test specimen: (a) Test configuration; (b) Dimensions of the
specimen and induced defects
Laboratory tests were conducted to further validate the proposed spalling defect localization
and quantification technique. The overall test configuration and details of the test specimen are shown
in Fig. 3.10. FARO Focus-3D was used for data acquisition (FARO 2014). The laser scanner was
mounted on a tripod at a height of 1.5 m, which was the same height as the center of the test specimen
as shown in Fig. 3.10 (a). A planar styroform with dimensions of 600 mm ⅹ 350 mm was used as
the test specimen, and eight surface defects of varying sizes (10-100 mm) and depths (3-7 mm) were
introduced at multiple locations on the specimen surface as shown in Fig. 3.10 (b). The eight defects
were either flat-top (defects 1 to 4 in red color) or concave-shape (defects 5 to 8 in blue color). The
subdivision size was selected to be 5 ⅹ 5 mm2 for defect localization and quantification.
Table 3.2 presents the scan parameters used in laboratory testing. To examine the effect of
scan parameters on the performance of the proposed technique, a total of 18 scans were conducted by
varying the following scan parameters: 1) scan distance (4, 8, 12 m) between the laser scanner and the
test specimen, 2) angular resolution (0.009, 0.018, 0.036°) of the laser scanner, and 3) incident angle
(0, 15, 30°) between the laser scanner and the test specimen. The measurement noise of the laser
scanner was 0.3 mm at 10 m based on the vendor specification. The total scanning time was around 72
minutes for 18 scans (average 4 minutes per scan). Note that the scanning time mainly depends on the
selection of angular resolution, and scans with denser angular resolution (0.009°) required more time
than scans with coarser angular resolution (0.018°).

Chapter 3. Quality Assessment Technique II: Surface Defect Estimation
58
(a) (b)
(c) (d)
0.1
0.2
0.3
0.4
0.5
0.6
0.7
0.8
0.1
0.2
0.3
0.4
0.5
0.6
0.7
0.8
0.9
1
0
0.1
0.2
0.3
0.4
0.5
0.6
0.7
0.8
0.9
1
Table 3.2 Experiment scenario - laser scanning parameters
Scan parameters Values
Distance 4m, 8m, 12m
Incident angle 0°, 15°, 30°
Angular resolution 0.009°, 0.018°
Measurement rate 976,000 points / second (0.009° angular resolution),
488,000 points / second (0.018° angular resolution)
Measurement noise (STD) 0.3mm @10m, 0.5mm @25m
Scanning time Total 72 minutes for 18 scans
Laboratory Test Results 3.5.2
Figure 3.11 Defect localization results (laboratory test with 8 m scan distance, 0.009° angular resolution, and
0° incident angle): (a) Angle deviation from the reference direction (DI1); (b) Distance deviation from the
globally fitted plane (DI2); (c) Combination of two damage features (DI); (d) Defect classification (the red
lines indicate the boundaries of the actual defect area, and the regions with white color are the detected defect
regions)

Chapter 3. Quality Assessment Technique II: Surface Defect Estimation
59
Fig. 3.11 shows the test results obtained with 8 m scan distance, 0.009° angular resolution,
and 0° incident angle. Figs. 3.11 (a) and (b) show the different sensitivities of DI1 and DI2 to the
boundaries and inner areas of the defects, respectively. Note that, to minimize the mixed pixel
problem that occurred at the edges of the test specimen, both DI1 and DI2 at the specimen’s boundaries
were set to zero. Like before, the localization performance was improved with the combination of the
two defect indices (Fig. 3.11 (c)). Then, defect classification on each subdivision was undertaken (Fig.
3.11 (d)). Table 3.3 summarizes the defect localization and quantification with 18 sets of scan
parameters. Note that each entry in Table 3.3 is the average value obtained for all eight defects. The
following observations are drawn from Table 3.3: (1) The incident angle is the most critical parameter
affecting the localization and volume estimation accuracy. In fact, the accuracy deteriorates as the
incident angle increases from 0° to 30°; and (2) Increase of the angular resolution or the scan distance
leads to a higher recall ratio and a lower precision ratio.
Table 3.3 Summary of defect localization and quantification results (laboratory test)
Angular
resolution (°)
Scanning
distance (m)
Incident
angle (°)
Recall
ratio (%)
Precision
ratio (%)
Volume estimation
ratio (%)
0.009 4 0 80.6 97.1 85.4
15 76.0 94.7 74.5
30 68.2 90.3 73.8
8 0 84.7 90.5 88.4
15 84.5 90.1 89.2
30 79.6 88.7 85.2
12 0 88.1 93.0 88.9
15 84.7 90.1 87.5
30 72.9 84.5 78.7
0.018 4 0 87.7 92.6 86.8
15 87.3 93.2 81.9
30 76.0 87.7 81.6
8 0 91.6 89.3 90.1
15 89.6 85.7 90.3
30 79.5 83.4 81.7
12 0 92.3 90.7 90.0
15 71.8 96.8 74.9
30 49.8 85.9 50.9

Chapter 3. Quality Assessment Technique II: Surface Defect Estimation
60
(a)
(b) (c) (d)
Figure 3.12 The effects of the scan parameters on defect localization: (a) Reference scan parameters (8 m
distance, 0° incident angle, and 0.009° angular resolution); (b) 12 m distance; (c) 30° incident angle; (d)
0.018° angular resolution
Fig. 3.12 illustrates how the scan parameters affect the defect localization performance. The
localization and quantification result for defect 5 is presented in Fig. 3.12 as a representative example.
Comparison of Fig. 3.12 (a) with Fig. 3.12 (b) or (d) reveals that scan distance increase (12 m) or
coarser angular resolution (0.018°) result in widening of the scan spacing and enhancement of the
defect localization performance, particularly the recall ratio. This phenomenon can be explained as
follows: As the scan spacing increases due to a longer scan distance or coarser angular resolution, the
number of scan points lying inside each subdivision is reduced. Since the DI1 of each scan point is
determined by its eight neighboring points, the decreased scan points lying near edge subdivisions
results in the increased sensitivity of DI1 to the edge subdivisions of a defect. For instance, Fig. 3.13
(a) illustrates that the edge subdivision with a longer distance or coarser angular resolution has less
scan points (2 intact and 2 defect points in this example) within the subdivision, and the
corresponding DI1 is more sensitive to edge defects because the DI1 values of the points are affected
by the defect points. On the other hand, the other edge subdivision with a short distance or denser
angular resolution includes 9 scan points (6 intact and 3 defect points) within the subdivision, and
results in a relatively lower DI1 value since the left 3 intact scan points are not influenced by the
defect points. As for the incident angle effect, Fig. 12 (c) shows that, as the incident angle increases

Chapter 3. Quality Assessment Technique II: Surface Defect Estimation
61
(a)
(b)
Intact pointDefect point
With a longer scan
distance or coarser
angular resolution
With a short scan
distance or denser
angular resolution
With a large incident angle
SubdivisionDefect
area
TLS
∆θ
θ
Subdivision
boundary
from 0° to 30°, the location of the estimated defect is shifted to the right of the actual defect. Fig. 3.13
(b) illustrates that, as the incident angle increase, the scan spacing becomes coarser and subdivisions
at the edge region of the defect may not include any scan points. In addition, this phenomenon
becomes more serious when the defect depth increases at the defect edges. Therefore, the scan spacing
with respect to the subdivision size should be properly selected for optical defect localization and
quantification performance.
Figure 3.13 The effects of scan distance, angular resolution and incident angle on scan spacing: (a) The
number of scan points within each subdivision decreases with a longer scan distance or coarser angular
resolution; (b) With an increasing incident angle, subdivisions located at the defect edges may not have any
scan points

Chapter 3. Quality Assessment Technique II: Surface Defect Estimation
62
Flat-top
defect
900 m
m
Concave-shape
defect
Defect 1 - 180 x 180 x 15
Defect 2 - 120 x 120 x 5
Defect 3 - 60 x 60 x 3
Defect 4 - 30 x 30 x 2
Defect 5 - D180 x 10
Defect 6 - D150 x 30
Defect 7 - D120 x 20
Defect 8 - D60 x 10
Defect 9 - D30 x 4
1200 mm
Laser
Scanner
Actual concrete panel
Dimensions (mm)
(a) (b)
12
3
4
5
6
7
8
9
3.6 Actual Concrete Panel Test
Figure 3.14 Test set-up and actual concrete panel: (a) Test configuration; (b) Dimensions of the specimen
and induced defects
To further examine the feasibility of the proposed localization and quantification technique
for concrete spalling defects, an experiment was performed on an actual concrete panel with
dimensions of 1200 mmⅹ900 mmⅹ150 mm. Fig. 3.14 shows the overall test configuration and the
details of the concrete panel. The same laser scanner used for the laboratory specimen test was
utilized and positioned at a fixed distance of 10 m from the concrete panel as shown in Fig. 3.14 (a).
The concrete panel was fixed to a concrete wall, and the laser scanner scanned the panel at two
different angular resolutions, 0.009° and 0.018°. Nine artificial spalling defects with different
dimensions and depths were introduced on the concrete panel surface as shown in Fig. 3.14 (b). The
defects were either flat-top (defects 1 to 5 in red color) or concave-shape (defects 6 to 9 in blue color).
The size of each subdivision was chosen to be 5 ⅹ 5 mm2 as before such that the whole surface area
is divided into 43200 subdivisions.
Fig. 3.15 shows the defect localization results obtained with 0.009° angular resolution. As
expected, Figs. 3.15 (a) and (b) show the effectiveness of each defect sensitive feature for detecting
the edge and inner areas of the defects, respectively. Combining the two damage indices, enhanced
defect localization results are obtained in Fig. 3.15 (c), followed by the defect classification (Fig. 3.15
(d)). The defect localization results show that all defects were successfully identified except defects 3
and 4, which has very small thickness deviations (3 and 2 mm). The manual inspection of the concrete
panel revealed that the upper-left corner of the panel has a noticeable non-flat surface, and this non-

Chapter 3. Quality Assessment Technique II: Surface Defect Estimation
63
0.2
0.3
0.4
0.5
0.6
0.7
0.8
0.9
0.1
0.2
0.3
0.4
0.5
0.6
0.7
0.8
0.9
1
0.1
0.2
0.3
0.4
0.5
0.6
0.7
0.8
0.9
1
(a) (b)
(c) (d)
uniform surface condition attributed to difficulties in detecting shallow spalling defects (defects 3 and
4). Tables 4 and 5 show the defect localization and volume loss estimation results for the concrete
panel, respectively. Note that each entry in Table 3.4 is the average value of the seven successfully
localized defects. The recall and precision ratios are 91.9% and 88.9%, respectively. In Table 3.5, the
average volume loss estimation ratio is 84.8% in the case of 0.009° angular resolution. The results
demonstrate that the proposed technique is able to successfully locate and quantify all surface defects
excepts defects 3 and 4.
Figure 3.15 Defect localization results (concrete panel test): (a) Angle deviation from the reference direction
(DI1); (b) Distance deviation from the globally fitted plane (DI2); (c) Combination of two defect indices (DI);
(d) Defect classification (the red lines indicate the boundaries of the actual defect areas, and the regions with
white color are the detected defect regions)
Table 3.4 Defect localization results (concrete panel test)
Scanning distance
(m)
Incident angle
(°)
Angular
resolution (°)
Recall
ratio (%)
Precision
ratio (%)
10 0 0.009 89.1 89.8
0.018 94.6 88.1

Chapter 3. Quality Assessment Technique II: Surface Defect Estimation
64
Table 3.5 Defect volume loss estimation results (concrete panel test)
Aspects Volume loss (10-6 ⅹm
3)
Estimation ratio (%)
Estimation average (%)
Defect number
1 Design 486
88.1
84.8
Est. 428.3
2 Design 72
88.6 Est. 80.2
5 Design 254.5
91.3 Est. 276.4
6 Design 353.4
86.1 Est. 304.4
7 Design 150.8
93.3 Est. 160.7
8 Design 18.9
78 Est. 14.7
9 Design 1.9
68.3 Est. 1.3
3.7 Discussion
All the simulation and test results presented in this study clearly indicate the importance of
proper scan parameter selection. It is recommended that the scan distance, incident angle, and angular
resolution be no more than 12 m, 15° and 0.018°, respectively, to achieve correct localization and
volume loss estimation ratios of over 80% for spalling defects using the proposed technique. For
example, if the laser scanner is 10 m away from a concrete structure, an allowed scan area
corresponding to a maximum incident angle of 15° becomes 5.4 ⅹ5.4 m2.
Second, the relation between the subdivision size and scan spacing needs to be considered
carefully. The size of the subdivision should be small enough to achieve precise defect localization,
but sufficiently larger than the laser scan spacing. Theoretically, the subdivision size should be larger
than the following scan spacing (∆):
= × 𝛼
cos (𝛼 ) (3.6)
where L denotes the scan distance between the concrete surface and the laser scanner, and αR and αI
denotes the angular resolution and the incident angle, respectively. For example, if the subdivision
size is 5ⅹ5 mm2, and L, αI and αR are set to 15 m, 30° and 0.018°, respectively, the scanning can be
problematic because ∆ (5.4 mm) is larger than the subdivision size. Based on the experiment results of

Chapter 3. Quality Assessment Technique II: Surface Defect Estimation
65
this study, it is recommended that at least four scan points are included in each subdivision. Hence,
the scan parameters should be carefully selected to ensure a good accuracy of spalling defect
localization and quantification.
Third, scanning time needs be also considered. The scanning time is mainly dependent on
selection of angular resolution which dictates horizontal and vertical speeds of laser scanners. The
size of a target structure also influences the scanning time. If scan parameters such as angular
resolution and scan distance are assumed to be fixed, bigger size of target surface requires more
scanning time than small size one. Hence, proper estimation of scanning time should be conducted
prior to actual inspections for effective spalling defect detection.
3.8 Chapter Summary
This chapter presents a new surface QA technique that can simultaneously localize and
quantify spalling defects on precast concrete surfaces using a laser scanner. Two defect sensitive
features, which are complementary to each other, are proposed and combined for improved spalling
localization and quantification performance. A defect classifier is also developed to automatically
diagnose whether the investigated surface region is damaged, where the defect is located, and how
large it is. Numerical simulations and experiments are conducted to demonstrate the effectiveness of
the proposed defect detection technique. The results demonstrate that the proposed technique can
accurately estimate the location and volume of concrete spalling defects. Furthermore, a parametric
study with varying scan parameters of the laser scanner is performed for optimal scan parameter
selection. The proposed technique can offer the following features: (1) Autonomous and simultaneous
spalling defect localization and volume estimation on precast concrete surfaces, (2) Improved defect
localization and quantification with combination of complementary defect sensitive features, and (3)
Guidance for optimal scan parameter selection. In addition, based on the results obtained from actual
precast concrete tests that the proposed surface QA technique can detect any spalling defect which is
bigger than 3 mm in both length and depth. Currently the applicability of the proposed technique is,
however, limited to flat concrete surfaces and two types of surface defects (concave and flat-top
defects), and shallow spalling defects (less than 3 mm deep) can hardly be detected. Further
investigation is needed in the following directions: (1) Extension of the applicability of the proposed
technique to more complex structures and various types of defects, (2) Enhancement of the
detectability on shallow defects, and (3) Integration of the laser scanner data with intensity images for
more comprehensive analysis of spalling defects.

Chapter 3. Quality Assessment Technique II: Surface Defect Estimation
66

Chapter 4. BIM based Quality Assessment System of Precast Concrete Elements
67
4 BIM-BASED QUALITY ASSESSMENT SYSTEM OF
PRECAST CONCRETE ELEMENTS
4.1 Chapter Introduction
This study presents a systematic and practical system framework for dimensional and surface
quality assessment (QA) of precast concrete elements using building information modeling (BIM) and
3D laser scanning technology. As precast concrete based rapid construction is becoming
commonplace and standardized in the construction industry, checking the conformity of dimensional
and surface qualities of precast concrete elements to the specified tolerances has become ever more
important in order to prevent failure during construction. Moreover, as BIM gains popularity due to
significant developments in information technology, an autonomous and intelligent quality assessment
system that is interoperable with BIM is needed. The current methods for the dimensional and surface
QA of precast concrete elements, however, rely largely on manual inspection and contact-type
measurement devices, which are time-consuming and costly. In addition, systematic data storage and
delivery systems for dimensional and surface QA are currently lacking. To overcome these limitations,
this study aims to establish an end-to-end framework for dimensional and surface QA of precast
concrete elements based on BIM and 3D laser scanning. The proposed framework is composed of four
parts: (1) the inspection checklists; (2) the inspection procedure; (3) the selection of an optimal
scanner and scan parameters; and (4) the inspection data storage and delivery method. In order to
investigate the feasibility of the proposed framework, case studies assessing the dimensional and
surface qualities of actual precast concretes are conducted.
This chapter is organized as follows. First, a review of the related literature is presented in
Chapter 4.2, followed by a systematic framework development for the dimensional and surface QA of
precast concrete elements in Chapter 4.3. Subsequently, case studies and their results for validating
the feasibility of the proposed framework are presented in Chapter 4.4. Finally, this paper concludes
with a summary and future work in Chapter 4.5.
4.2 Related Work
There are few studies on precast concrete BIM for efficient and effective data interoperability.
One of them is work of the National Building Information Model Standard (NBIMS). NBIMS is a

Chapter 4. BIM based Quality Assessment System of Precast Concrete Elements
68
Figure 4.1 Overview of National BIM Strandard (NBIMS)
joint project coordinated by the National Institute of Building Sciences (NIBS) and the buildingSMART
Alliance. The goal of the project was to develop a national BIM standard for precast concrete design,
engineering, fabrication and erection. The process of NBIMS consists of three major steps as shown in Fig.
4.1: (1) Define the user functional requirements needed for precast concrete design, fabrication and
construction in a report, Information Delivery Manuals (IDM) that was prepared by a precast concrete
BIM team and technical advisors led by Prof. Chuck Eastman at Georgia Institute of Technology; (2)
Deliver and translate the IDM into an implementable specification for software vendors. In the project, the
standard data model was selected as Industry Foundation Classes (IFC) schema; (3) Implement and test the
exchange specifications. Here, the output of this step is a set of Model View Definitions (MVD) that define
the exchange data needed to support the workflows defined in the IDM, covering the major digital
exchanges dealing with precast concrete. However, these studies have focused only on the design and
fabrication processes without QA of precast concrete element. Hence, this study proposes a framework for
the dimensional and surface QA of precast concrete elements based on BIM and 3D laser scanning.

Chapter 4. BIM based Quality Assessment System of Precast Concrete Elements
69
3D Laser
Scanner
Precast concrete
(a) (b)
Inspection
Data management
BIM
Module I
Module II
4.3 Development of a Framework for Dimensional and Surface QA of
Precast Concrete Elements
The objective of this study is to develop a holistic framework for laser scanning and BIM
based automated inspection data storage and management of dimensional and surface qualities of
precast concrete elements. Fig. 4.2 shows an overview of the proposed BIM and laser scanning based
precast concrete QA system. In Fig. 4.2 (a), it is assumed that a precast concrete element is placed at a
predetermined location and the laser scanner is positioned above the element and scans the whole
surface of the panel in a single scan. Fig. 4.2 (b) shows two main modules of the proposed
dimensional and surface QA system in relation to BIM, i.e., inspection and data management modules.
For the inspection module, the following three issues should be clarified: (1) what the inspection
checklists should be; (2) what the QA procedure should be employed; (3) which type of laser scanner
is appropriate and which scan parameters are optimal for the intended QA checklists. For the data
management module, one should determine how inspection information, including the inspection
checklists, scan parameters and inspection results, is stored and delivered so that the system is
interoperable with BIM. To answer the issues posed above, a systematic framework consisting of four
parts is developed and described below.
Figure 4.2 Overview of the proposed precast concrete quality assessment system combined with BIM and laser
scanning: (a) Configuration for 3D laser scanning of a precast concrete element; (b) Two major modules within
the proposed inspection system in relation to BIM

Chapter 4. BIM based Quality Assessment System of Precast Concrete Elements
70
Inspection checklists 4.3.1
Prior to performing precast concrete QA, it is essential to identify the inspection checklists -
namely, what attributes of precast concrete elements need to be inspected with what degree of
accuracy. In general, the construction specifications for a project play a major role in identifying the
inspection checklists for precast concrete elements. These specifications detail the quality
requirements for each precast component of the construction project, and these quality requirements
can then be translated into inspection checklists. In this study, the inspection checklist is determined
from the tolerance manual for precast and prestressed concrete as specified in the Precast Concrete
Institute (PCI, 2000), and the guide for precast concrete wall panels from American Concrete Institute
(ACI, 1998). Table 4.1 shows the determined inspection checklists, consisting of two categories -
geometry and defects. For the geometry category, there are four dimensional features - dimension,
position, straightness and squareness of precast concrete elements. Each dimensional feature has its
own inspection checklists, called ‘attributes’. For example, length, width and thickness are the
attributes for the feature ‘dimension’. The tolerance corresponding to each attribute varies with
construction type, element type, length of the element and so on. In Table 4.1, tolerances for an
exemplary precast slab of bridge deck are presented. Each dimensional attribute should be carefully
inspected so that its value falls within the specified tolerance. Otherwise, the dimensional errors in
each precast element can accumulate over the entire precast section. Within the defect category, there
are four features - spalling, crack, warping and flatness. The ACI reports that these defects occur
mainly due to improper concrete mixture proportions, careless curings as well as friction between the
element and the mold form (ACI, 1998). The attributes for the defect features include the number, size,
depth, length, width, area, location and volume of defects.
Table 4.1 Inspection checklists for precast concrete elements
Quality
Category Feature Attribute (tolerance*)
Geometry Dimension Length (±6 mm); Width (±6 mm); Thickness (±6 mm)
Position Length (horizontal (±6 mm), vertical (±6 mm))
Straightness Size (±10 mm); Location
Squareness Size (±3 mm); Location
Defect Spalling Number; Location; Area; Volume
Crack Number; Depth; Length; Width (0.3 mm); Location
Warping Number; Size (±6 mm); Location
Flatness Number; Size (±6 mm); Location
* The tolerances are exemplary values for bridge deck precast concrete elements.

Chapter 4. BIM based Quality Assessment System of Precast Concrete Elements
71
Decision
Reference CAD
Model
Inspection Checklist
with tolerance
Construction
Site
Disposal or
Rework
Precast
concrete
Material & Geometry
Information
Inspection Result
Data acquisition
(Scanning)
Data processing
Check and comparison
with reference model
Inspection result
Accepted Denied
BIM Library
Supplier
Precast concrete Scanner
· Optimal Scan
parameter selection
· Identification of ID
· Set-up & Treatment
(2) Preparation
(3) Scan &
Inpsection
(1) Supply
(4) Decision & Delivery
Step Flow
Data Flow
BIM and laser scanning based quality assessment procedure 4.3.2
Once the inspection checklists and desired tolerances are determined, an inspection
procedure needs to be established. Fig. 4.3 describes the proposed dimensional and surface QA
procedure for precast concrete elements using BIM and laser scanning. The QA procedure is
composed of 4 phases:
(1) Supply: Suppliers manufacture the precast elements ordered for a given project and
deliver the elements to an inspection site. It is important to note that the inspection site can be at a
predetermined location in the manufacturing factory or at a certain location in the construction site.
The suppliers also store the reference CAD model of each precast concrete element and their material
and geometry properties, such as the concrete strength and dimensional tolerances of the precast
elements in a BIM library.
(2) Preparation: Prior to the implementation of the QA, preliminary action on both the
precast concrete element and the laser scanner is performed. This action includes the confirmation of
the information of the precast element, inspection set-up, treatment for the precast elements and the
Figure 4.3 Proposed BIM and laser scanning based precast concrete quality assessment procedure

Chapter 4. BIM based Quality Assessment System of Precast Concrete Elements
72
selection of the optimal scan parameters of the laser scanner. Here, the confirmation of detail
information of the precast concrete elements, which is stored in the BIM library, is ideally carried out
through portable electronic devices such as smartphone or personal digital assistants (PDAs). Once
the confirmation of the information of the precast element is completed, the precast element is sent to
a designated location, and treatment processes such as the surface checking and cleansing of finished
(hardened) precast concrete are undertaken before actual inspection. At the same time, the optimal
scan parameters of the laser scanner are selected.
(3) Scan and inspection: Once the preparation for scanning is complete, data acquisition
using the laser scanner is undertaken. In this step, the selection of the region of interest (ROI) is
conducted with a coarse scan, followed by a dense scan for effective and accurate inspection. Once
the raw scan data is acquired, data processing, which includes data cleansing and feature extraction, is
conducted to automatically measure the intended inspection goals. Since the raw scan data has a high
data capacity, data cleansing and feature extraction algorithms are needed for reducing data and
computation cost. Subsequently, comparisons between the measured inspection results and the
reference CAD model exported from the BIM library are conducted. At this stage, the inspection
results are also delivered to and stored in the BIM library.
(4) Decision and delivery: At this stage, the decision of whether the discrepancies between
the actual element and the reference model are within the tolerances in the inspection checklists is
made. If any specific discrepancy exceeds the corresponding tolerance, disposal or rework of the
precast element follows. Otherwise, the precast element is approved for use and delivered to a
construction site for assembly. Here, the classification and detail information of the accepted and
rejected elements are also accessible through the BIM library so that field engineers in the
construction site can access and check the condition of the delivered precast concrete element via
portable electric devices.
Selection of optimal scanner and scan location 4.3.3
The inspection quality depends largely on the specifications of a laser scanner such as laser
source type, laser wavelength and operation principles. In addition, different inspection checklists
may have different scanning requirements. For instance, checking the alignment of an anchor bolt
attached to a precast concrete element may require a higher scanning resolution than simply
identifying the existence of an anchor bolt. Therefore, the selection of the most appropriate laser
scanner for a given project is critical for successful inspection. In this study, five criteria for the
selection of a laser scanner are established as shown in Fig. 4.4:

Chapter 4. BIM based Quality Assessment System of Precast Concrete Elements
73
Dimensions – 6mm
(Length, width, thickness)
Defect – 0.3mm ~ 6mm
(crack, flatness, warping)
Depends on
laser source and working principle
TOF scanner –
up to 6000 m
Phase-shift scanner –
up to 120 m
TOF scanner –
up to 3-4 mm
Phase-shift scanner –
up to 2 mm
Depends on
vendors
From US$ 30,000 to
US$ 200,000
Depends on
scan speed and
size of elements
Inspection
tolerance
Measurement
range
Depends on
tolerance manual
Accuracy Price Scanning time
Scanner Selection
Project - dependent Scanner - dependent
Inspection tolerance: This refers to the limit of an acceptable discrepancy value (normally in
mm) between the actual and the reference model for a specified inspection checklist. For example, the
tolerance for length and width of a precast slab for bridge construction is ± 6 mm according to the
PCI (PCI 2000). Note that the tolerance which is project-dependent is the criterion first considered
during the selection of an optimal laser scanner.
Accuracy: This refers to how close a measured value is to the actual (true) value. In laser
scanning, this is often referred to as the ‘error’ in the range measurement. The accuracy of a laser
scanner depends on its working principle. Typically, phase-shift laser scanners offer a relatively higher
accuracy (up to 2 mm at 20 m) (FARO 2014) than time-of-flight (TOF) laser scanners (up to 4 mm at
100 m) (Olsen et al. 2010). Note that there is a condition for the optimal scanner selection that the
accuracy of a laser scanner should be below the tolerance of inspection checklists.
Measurement range: This refers to an allowable scanning distance for the laser scanner. The
measurement range is mainly affected by the working principle and laser source of the laser scanner.
In general, TOF laser scanners have a longer measurement range (up to 6000 m) (RIEGL 2014) than
phase-shift laser scanners (up to 120 m) (FARO 2014).
Price: In this study, it is assumed that the quality inspection of precast concrete elements is
conducted using a commercially available laser scanner. The price of laser scanners ranges from
$30,000 to $200,000 USD.
Scanning time: This refers to the time required to scan the desired inspection area. The
scanning time depends mainly on the selection of a laser scanner’s angular resolution, which dictates
horizontal and vertical scanning rate of the laser scanner. The scanning time is also influenced by the
Figure 4.4 Criteria for optimal selection of a laser scanner for precast concrete quality inspection

Chapter 4. BIM based Quality Assessment System of Precast Concrete Elements
74
H
θ-∆θ
L
W
∆θ
d
s
L.S.
Subdivision
size of the target precast concrete element.
Depending on the goal of each checklist, different weighting on each aforementioned
criterion can be assigned. For instance, for a dimensional QA, which requires a tolerance of ± 6 mm,
accuracy, is the most important criterion for the laser scanner selection and thus a higher weighting
can be given.
The scan parameters of a laser scanner should be optimized to obtain the best dimensional
and surface quality inspection results. For the scanning of a precast concrete element, the scan
distance and angular resolution are determined assuming that the laser scanner is positioned right
above the center of the target precast concrete. These two parameters mainly govern the density of
scan points. In general, the higher the density of the scan points is, the better the inspection results.
However, a high density of scan points requires more scanning time and computing cost, which may
not be allowed in real application. Hence, there is a trade-off between accuracy, cost and time when
considering the inspection requirement of a project.
Since the dimensional quantities such as length, width and position of a target precast
element may requires the extraction of features such as edges and corners from point cloud data,
enough scan points should lie on both the edge and corner regions of the precast element. Furthermore,
Figure 4.5 A mathematical model for the determination of the subdivision size, which is necessary for
optimal detection of defects within a precast concrete element

Chapter 4. BIM based Quality Assessment System of Precast Concrete Elements
75
for the QA of defects such as spalling, warping and flatness, the scan region needs to be further
divided into a number of subdivisions, and at least one scan point should fall inside each subdivision
for localization and quantification of defects.
A mathematical model is developed to theoretically determine the minimum size of the
subdivision considering the scanning distance and the angular resolution as shown in Fig. 4.5. For
simplicity, the inspected precast concrete element is assumed to have a rectangular shape and a flat
surface although the concept here can be generalized to more complex geometries. In the developed
mathematical model, the maximum incident angle ( ) and the maximum spatial resolution (d) of the
laser scanner can be computed as:
= tan (√ 2 + 2
2 ) (4.1)
=√ 2 + 2
2 tan ( ) (4.2)
where H, L and W are the laser scanner height (normal distance from the scanner to the target precast
element), the length and the width of the precast element, respectively. Here, L and W are assumed
known from the blueprint of the precast concrete element. denotes the angular resolution of the
laser scanner. Note that a square shape is assumed for the subdivision, and the size is the length and/or
width of the subdivision. As a result, the minimum size (𝑠) of the subdivision covering the maximum
spatial resolution (d) can be formulated as:
𝑠 =
√ 2 + 2=
2
√ 2 + 2 tan ( ) (4.3)
Note that Eq. (4.3) only specifies the minimum requirement, which may not be large enough
for robust localization and quantification of defects. Therefore, a generous selection of scan
parameters ( and ) for determining the size of subdivision is recommended so that several scan
points are included in each subdivision. Note that finding specific solutions for an optimal subdivision
size and the number of scan points in a subdivision cannot be solved through only theoretical analysis
and depend on many other factors such as surface roughness and reflectivity, is out of scope of this
study.

Chapter 4. BIM based Quality Assessment System of Precast Concrete Elements
76
BIM LIBRARY
SUPPLIERSUPPLIER INSPECTIONINSPECTION
Material
Property
Reference
CAD Model
Inspection
Checklist
and Manual
Inspection Result
SITESITE
Cloud ServerCloud Server
IFC
Format
IFC
Format
IFC
Format
IFC
Format
IFC
Format
In addition, the effects of the scanning parameters should be investigated for the selection of
optimal scan parameters, as several studies show that a wrong selection of scanning parameters can
have a negative impact on the results of quality inspections (Soudarissanane et al. 2011; Lichti 2007;
Laefer et al. 2009). Among the scanning parameters, the incident angle, defined as the angle between
the laser scanner and the scan point, is the key parameter affecting the measurement results. Laefer et
al. (2009) recommended that scans with an incident angle of over 45° be avoided. Here, the scanning
distance ( ) is controlled so that the maximum incident angle ( ) is less than 45°, i.e., >√𝐿2+𝑊2
2.
Data storage and delivery method 4.3.4
To address data interoperability problems caused by differences in data format, IFC
developed by BuildingSMART (2014) (formerly called the International Alliance for Interoperability
(IAI)) is used as a delivery file format in this study. IFC was chosen here because (1) it is currently an
open and neutral data format compatible with various BIM applications; (2) it is the only public
Figure 4.6 Schematic diagram of data storage and delivery for dimensional and surface quality assessment of
precast concrete elements

Chapter 4. BIM based Quality Assessment System of Precast Concrete Elements
77
IfcPrecastElement
has
IfcInspectionInfoIfcScanInfo
IfcInspectionResult
contains
IfcDesignGeometry
IfcScanParameter
IfcScanner
IfcScanTime
contains
ScanDistanceAngularResolutionIncidentAngle
IfcDimension
IfcCrack IfcSpallingIfcWarping IfcFlatness
IfcStraightness
Number Volume
contains
Width
Location
ENTITY IfcSpalling;
SUBTYPE OF (IfcInspectionResult);
Number : IfcCount;
Area : IfcArea;
Volume : IfcVolume;
Location : IfcDirection;
END_ENTITY;
- Entity - Attribute
Schema of IfcSpalling
Area
Length
IfcQualityInspection
IfcInspectionCriteria
IfcInspection
Dimensional
IfcInspectionDefect
IfcPosition
IfcSquareness
contains
Thickness
contains contains
contains
standard for building model data exchanges including object structure (topology), geometry and
material and performance attributes; and (3) it has been found to be a promising candidate for
effective exchange of geometry and other information of precast concrete (Jeong et al. 2009).
Fig. 4.6 illustrates the IFC based data storage and delivery scheme for dimensional and
surface QA of precast concrete elements. All the data, from supply to delivery of the precast products,
is created in the IFC format, then stored in and delivered to the BIM library through the cloud server.
The cloud server serves bridges the participants of a project and allows them to reach the information
whenever and wherever it is needed, and updating the information surely. Inspectors in charge of
inspecting the quality of precast elements, for instance, can call up the material and geometry
information stored in the BIM library via the cloud server. In addition, the inspectors can upload the
scanning parameters they used and the inspection results in the format of IFC into the BIM library.
Similarly, on-site engineers in the construction site can use tablets to access the inspection information
for precise assembly of precast concrete elements.
Figure 4.7 IFC based entity relationship model for the precast concrete element quality inspection

Chapter 4. BIM based Quality Assessment System of Precast Concrete Elements
78
Fig. 4.7 shows the IFC-based entity relationship model (ER model), which illustrates the
association between different entities included in IfcPrecastElement, of a precast concrete element for
quality inspection. The authors, based on the general scheme and properties of the latest IFC version
(IFC 2×4), created the presented entities to overcome the absence of entities related to QA of precast
concrete elements. The ER model consists of several entities and their attributes. The entity
IfcQualityInspection, which is a sub-entity of IfcPrecastElement, consists of two sub-entities,
IfcInspectionInfo and IfcInspectionResult. IfcInspectionInfo provides specific details regarding
inspection preparation, such as laser scanning (IfcScanInfo), the design geometry of the inspected
element (IfcDesignGeometry), and inspection checklist (IfcInspectionCriteria). The entity IfcScanInfo
includes detailed information regarding scanning time (IfcScanTime), the laser scanner (IfcScanSensor)
and the scanning parameters (IfcScanParameter). The other high-level entity in the quality inspection
process is IfcInspectionResult, which contains the inspection results of the geometry
(IfcInspectionDimensional) and defect (IfcInspectionDefect) quality for the precast element. The
inspection result entities (IfcInspectionDimensional and IfcInspectionDefect) both provide
quantitative values of the corresponding attributes defined in the inspection checklists of Table 1. For
instance, the entity IfcInspectionSpalling has four quantatative attributes, which indicate how many
(number) and how large (area and volume) the spalling defects are, as well as where (location) they
are. Due to the limited space, not all attributes of the QA entity are included in Fig. 4.7.
4.4 Case Studies
To examine the applicability of the proposed framework to dimensional and surface QA of
precast concrete elements, two case studies composed of dimension estimation and surface defect
characterization were conducted on actual precast concrete elements.
Selection of inspection checklists and laser scanner 4.4.1
The inspection checklists were determined prior to the experiments. For dimensional
estimation, three dimensional properties were estimated: (1) the dimensions (length and width) of the
precast concrete element, (2) the dimension and positions of the shear pockets, which are rectangular
holes within the precast concrete element, and (3) the squareness of the precast concrete element. The
squareness error is defined as the difference in length between the longer sides of a precast component
(PCI 2000). The surface defect characterization mainly targeted spalling defects, and four specific

Chapter 4. BIM based Quality Assessment System of Precast Concrete Elements
79
checklists, the number, location, area and volume of defects, were established.
Once the inspection checklists were selected, an optimal laser scanner was then selected.
Table 4.2 shows the specification of five commercially available laser scanners. As mentioned in
Chapter 4.3.3, the primary criterion considered for laser scanner selection in this study was the
accuracy of a laser scanner since the target tolerance for the dimensional QA was set to be 6 mm. The
measurement rate (speed) and the price were also important considerations. In terms of the
measurement range, all the candidate scanners satisfied the minimum requirement (20 m) of the
measurement range. From these considerations, scanner no. 5, which offers the best accuracy,
measurement rate and price was selected as the optimal laser scanner in this study.
Table 4.2 Specifications of commercial 3D laser scanners
Scanner
number
Maximum range
(m)
Measurement rate
(pts/sec)
Accuracy
(mm)
Price (order)
1 400 m 125,000 pts/sec 5 mm @ 100 m 1 (expensive)
2 350 m 5,000 pts/sec 7 mm @ 100 m 2
3 300 m 25,000 pts/sec 7 mm @ 100 m 4
4 300 m 50,000 pts/sec 4 mm @ 50 m 3
5 120 m 960,000 pts/sec 2 mm @ 20 m 5 (cheap)

Chapter 4. BIM based Quality Assessment System of Precast Concrete Elements
80
(a)
(b)
Flat-top
defect
90
0 m
m
Concave-
shape defect
Defect 1 - 180 x 180 x 15
Defect 2 - 120 x 120 x 5
Defect 3 - 60 x 60 x 3
Defect 4 - 30 x 30 x 2
Defect 5 - D180 x 10
Defect 6 - D150 x 30
Defect 7 - D120 x 20
Defect 8 - D60 x 10
Defect 9 - D30 x 4
1200 mm
12
4
5
7
8
6
3
9
Dimensions (mm)
10
00
mm
1980 mm
150
mm
700 mm
47
5 m
m
650 mm
30
0 m
m
2000 mm
2 31
4 5 6
Precast Panel I
Precast Panel II
675 mm
15
0 m
m
250 mm
27
5 m
m
45
0 m
m
325 mm
Test specimens 4.4.2
Fig. 4.8 shows two test specimens used for the case study. Two precast panels (precast panels
I and II) were designed and fabricated for dimensional estimation and surface defect characterization,
respectively. The precast panels were fixed on a concrete wall and scanned by the laser scanner
positioned at 10 m away from the panels, and scans with two different angular resolutions (0.009° and
0.018°) were conducted for both case studies. Here, the scanning distance and the angular resolutions,
which dictates the density of scan points, were selected considering scanning time (around 3-5
minutes), point-to-point scan spacing (around 2-3 mm), the minimum size (𝑠) of subdivision for
precast panel II (1.26 mm for 0.009° angular resolution and 2.52 mm for 0.018° angular resolution)
and maximum incident angle (5.71° for precast panel I and 3.43° for precast panel II). Precast panel I,
used for dimensional estimation, has dimensions of 2000 mm (actually it has 1980 mm on one side)
× 1000 mm × 150 mm and include six rectangular shear pockets as shown in Fig. 4.8 (a). Three
dimensional errors were intentionally introduced to Panel I - a 20 mm loss of the upper horizontal
dimension (1980 mm), a shift of No. 2 shear pocket right and downward by 25 mm and a shift of No.
Figure 4.8 Test specimens for the dimensional estimation and surface defect characterization: (a) A photo and
dimensions of the precast panel I used for dimensional estimation test; (b) A photo and defect dimensions of the
precast panel II used for surface defect characterization test

Chapter 4. BIM based Quality Assessment System of Precast Concrete Elements
81
6 shear pocket left and downward by 25 mm. Precast panel II, used for surface defect characterization,
has dimensions of 1200 mm × 900 mm × 150 mm, and nine artificial spalling defects with
different sizes and depths were induced on the surface of panel II as shown in Fig. 4.8 (b). The defects
were either flat top (numbered from 1 to 5) or concave-shape (numbered from 6 to 9). Based the
computed minimum size of subdivision from Eq. (4.3), the subdivision size of precast panel II for
defect localization and quantification was selected as 5 mm for both 0.009° and 0.018° angular
resolution cases.
Data analysis 4.4.3
The data-process procedures for dimensional QA were implemented after acquisition of a set
of point cloud data from the selected laser scanner as followed.
Step 1 – Coordinate transformation: The 3D coordinates of the scan data with respect to the laser
scanner were transformed into a new coordinate system with respect to precast panel I. In this step, a
2D range image, where each pixel holds the distance value between the scan point and the laser
scanner was generated from the scan data.
Step 2 – Filtering: Unwanted background scan points positioned behind the precast panel surface were
filtered out. Due to the coordinate transformation process, elimination of unwanted background scan
points was implemented by setting a margin to each axis.
Step 3 - Edge and corner extraction: An autonomous edge point extraction algorithm called ‘Vector-
sum algorithm’ was implemented to extract only edge points along the horizontal and vertical edge
lines of precast panel I. Once the edge points were extracted, the corners of the panel were identified
by line fitting the edge points and finding the intersections between the fitted edge lines.
Step 4 – Dimension estimation: The dimensions of precast panel I were initially estimated based on
the extracted corner points. However, because of the mixed-pixel phenomenon of the laser scanner
(Hebert et al. 1991), a phenomenon called edge loss occurs and the actual dimensions will always be
underestimated. This underestimation caused by the edge loss was compensated based on an edge loss
model (Tang et al. 2009). A more detailed explanation of the dimensional estimation steps is provided
in Chapter 2.
As for the surface QA, The first two steps for surface defect characterization are identical to
those of the dimensional QA. Defect identification, localization and quantification were then
performed using two defect sensitive features: (1) angle deviation between the surface normal of a
locally fitted plane and the reference direction, and (2) distance deviation between each scan point and

Chapter 4. BIM based Quality Assessment System of Precast Concrete Elements
82
a globally fitted plane. The data-process procedures were implemented after obtaining a set of point
cloud data from the laser scanner as followed.
Step 3 - Subdivision of the target surface area: The entire surface area is virtually divided into a
number of subdivisions. Here, the size of each subdivision should be small enough to achieve high
defect localization accuracy, but sufficiently larger than the spatial resolution of laser scanning.
Step 4 – Calculation of two defect-sensitive features for each scan point: First, angle deviation is
calculated. The eight nearest neighbors of a given scan point were identified based on the Euclidean
distance, and the covariance matrix of the eight neighboring points was computed to estimate the
normal vector of a local plane fitted by the eight neighboring points. Note that, the angle deviation
index generally has a lager value near the edge of the defect area than the center region of the edges.
As the second defect sensitive feature, the distance deviation from a globally fitted plane was
calculated. The globally fitted plane was obtained by least-square fitting a linear plane into all scan
points within the surface of precast panel II. Here, the deviation index typically has a larger value near
the center of the defect area than near the edges. Therefore, those two different indices are
complementary each other for defect localization.
Step 5 – Unified defect index and threshold: Once the two defect indices for all the scan points were
obtained, the defect indices (DI(Si)), where Si stands for the i-th subdivision, for each subdivision
were computed by averaging the defect index values of the scan points falling inside each subdivision.
In a similar manner, a threshold (TR) for defect diagnosis was computed from the intact subdivisions.
Step 6 – Initial defect diagnosis: An initial defect diagnosis was first undertaken based on the
condition that if (𝑆𝑖) exceeds TR, the subdivision (𝑆𝑖) is diagnosed as defective otherwise the
subdivision is classified as healthy.
Step 7 - Recursive defect localization: In this step, a recursive defect localization is performed for
improved defect localization since the initial defect localization result may not be accurate enough
because the global plane necessary for the calculation of distance deviation index may even include
scan points from defect areas. To improve the defect localization accuracy, the global plane is re-fitted
and the distance deviation index is updated until there is no difference between the previous and
current defect localization results. Finally, once all damaged subdivisions are identified, the total
volume loss caused by defect is estimated. A more detailed explanation on entire process of surface
defect localization and quantification is provided in Chapter 3.

Chapter 4. BIM based Quality Assessment System of Precast Concrete Elements
83
0 0.5 1 1.5 2
0
0.2
0.4
0.6
0.8
1
Horizontal length (m)
Vert
ical
len
gth
(m
)
0.2
0.3
0.4
0.5
0.6
0.7
0.8
0.9
(a) (b)
Test results and data storage and delivery 4.4.4
Fig. 4.9 shows the edge and corner points obtained from scanning of precast panel I with
angular resolution of 0.009°. The edge and corner points of the panel and six shear pockets were
successfully identified. Table 3 summarizes the dimensional estimation results. Each entity in Table
4.3 is the estimated dimensional (dimension, position and squareness) value, and estimation error
compared to the design value is presented in parenthesis next to each entity. The estimated upper
lengths of the panel were 1978.9 mm and 1979.5 mm with the angular resolutions of 0.009° and
0.018°, respectively. These estimated upper lengths of the panel were 21.1 mm and 20.5 mm shorter
than the design value (2000 mm), and agrees with the intended length loss (20 mm) with 1.1 mm and
0.5 mm error. The average dimension errors for all the entities with 0.009° and 0.018° angular
Figure 4.9 Results of edge and corner point extraction as part of dimensional estimation (obtained by
scanning precast panel I with angular resolution of 0.009°)
Figure 4.10 Characterization results of surface defects on precast panel II (obtained with angular resolution of
0.009°): (a) Visualization of unified defect index (DI); (b) Defect classification result (the red lines indicate the
boundaries of the actual defect areas, and the regions with white color are the detected defect regions)

Chapter 4. BIM based Quality Assessment System of Precast Concrete Elements
84
resolutions were 1.3 mm and 2.3 mm, respectively, and the average error values fall within the
tolerance (±6 mm). With regard to the position estimation of the shear pockets, the intended shifting
of No. 2 and 6 shear pockets were well recognized and with the average estimation errors of 2.7 and
3.0 mm respectively. The average position errors of all the entities with 0.009° and 0.018° angular
resolutions were 2.1 mm and 2.4 mm, respectively. In terms of the squareness estimation, the
estimated errors were 23.5 mm and 23.5 mm with 0.009° and 0.018° angular resolutions, and close to
the exact squareness error value of 20 mm.
Table 4.3 Dimensional estimation results from precast panel I
Angular resolution (°) 0.009 0.018
0.009 0.018
0.009 0.018
Dim
ensi
on
err
or
(mm
)
Panel
Upper Length
1978.9 (21.1)
1979.5 (20.5)
Po
siti
on
err
or
(mm
)
- -
Sq
uar
enes
s er
ror
(mm
)
23.5 (3.5)
23.5 (3.5)
Bottom Length
2002.4 (2.4)
2004 (4.0)
Width 995.9 (4.1)
998.6 (1.4)
S. P. 1
Hori. 248.2 (1.8)
246.6 (3.4)
327.8 (2.8)
328.6 (3.6)
Vert. 149.6 (0.4)
153.1 (3.1)
277.6 (2.6)
278.9 (3.9)
S. P. 2
Hori. 249.6 (0.4)
251.9 (1.9)
1026.1 (26.1)
1026.9 (26.9)
Vert. 150.8 (0.8)
151.9 (1.9)
299.2 (24.2)
300.5 (25.5)
S. P. 3
Hori. 248.4 (1.6)
246.8 (3.2)
1675.1 (0.1)
1675.9 (0.9)
Vert. 149.6 (0.4)
153.1 (3.1)
274.5 (0.5)
274.2 (0.8)
S. P. 4
Hori. 248.3 (1.7)
246.8 (3.2)
326.9 (1.9)
327.6 (2.6)
Vert. 150.4 (0.4)
152.4 (2.4)
272.5 (2.5)
273.8 (1.2)
S. P. 5
Hori. 250.3 (0.3)
251.3 (1.3)
1002.1 (2.1)
1002.9 (2.9)
Vert. 150.9 (0.9)
151.8 (1.8)
273.9 (1.1)
274.7 (0.3)
S. P. 6
Hori. 248.9 (1.1)
252.7 (2.7)
1643.1 (31.9)
1643.9 (31.1)
Vert. 151.5 (1.5)
151.2 (1.2)
252.2 (22.8)
253.6 (21.4)
* S.P. , Hori. and Vert. stand for ‘Shear Pocket’, ‘Horizontal’ and ‘Vertical’, respectively.

Chapter 4. BIM based Quality Assessment System of Precast Concrete Elements
85
Table 4.4 Surface defect characterization results from precast panel II
Angular resolution (°) 0.009 0.018
0.009 0.018
Defect area (10 4 × 2)
Defect 1 Actual 324
Defect volume loss (10 6 × 3)
486
Est. 346 349 428.3 445.2
Defect 2 Actual 144 72
Est. 164 168 80.2 85.5
Defect 5 Actual 254 254.5
Est. 281 287 276.4 288.8
Defect 6 Actual 177 353.4
Est. 178 181 304.4 305.3
Defect 7 Actual 113 150.8
Est. 133 136 160.7 167.8
Defect 8 Actual 28 18.9
Est. 27 29 14.7 15.4
Defect 9 Actual 7 1.9
Est. 3.8 6.5 1.3 2
* Est. stands for ‘Estimated’.
Fig. 4.10 shows the localization results of spalling defects on precast panel II obtained with
0.009° angular resolution. The defect localization results show that all the defects were successfully
identified except defects 3 and 4, which had small thickness deviations (3 and 2 mm). The manual
inspection of the concrete panel revealed that the upper-left corner of thepanel had a noticeable non-
flat surface, and this non-uniform surface condition caused difficulties in detecting shallow spalling
defects (defects 3 and 4). Table 4.4 summaries the defect estimation results for precast panel II. Note
that Table 4.4 presents the detected area and volume loss values of the seven successfully localized
defects. For defect area estimation, the average accuracies of 85.8 and 89.8 % for each angular
resolution were obtained compared to the actual defect area. Here, the accuracy is defined as (actual
area – estimated area) divided by actual area. As for the volume loss estimation of the detected defects,
the average accuracies of 84.8 and 87.2 % for each angular resolution were obtained. The results
demonstrate that the proposed laser scanning method can successfully locate and quantify surface
defects except small defects where the thickness change is comparable to the measurement noise level
of the laser scanner.

Chapter 4. BIM based Quality Assessment System of Precast Concrete Elements
86
Length error ( - 21.1 mm )
Position error
( Hori. 2
6.1 mm
Vert. 24.2 mm )
( Hori. 3
1.9 mm
Vert. 22.8 mm )
Position error
(a) (b)
#207 = IfcDimension(#134, #146, #153)
#134 = IfcLength(((1978.9(21.1),2002.4(2.4)), (248.2(1.8)), (249.6(0.4)), (248.4(1.6)), (248.3(1.7)), (250.3(0.3)),
(248.9(1.1))), mm);
#146 = IfcWidth(((995.9(4.1)), (149.6(0.4)), (150.8(0.8)), (149.6(0.4)), (150.4(0.4)), (150.9(0.9)), (151.5(1.5))), mm);
#153 = IfcThickness(150(0.0), mm);
#255 = IfcPosition(#135, #147);
#135 = IfcLength(((327.8(2.8)), (1026.1(26.1)), (1675.1(0.1)), (326.9(1.9)), (1002.1(2.1)), (1643.1(31.9))), mm);
#147 = IfcWidth(((277.6(2.6)), (299.2(24.2)), (274.5(0.5)), (272.5(2.5)), (273.9(1.1)), (252.2(22.8))), mm);
#283 = IfcSquareness(#136);
#136 = IfcLength(23.5(3.5), mm)
(c)
Squareness error ( 23.5 mm )
Figs. 4.11 and 12 describe the IFC-based inspection data storage and delivery for
dimensional estimation and surface defect characterization, respectively. The inspection results of
Tables 4.3 and 4.4 were stored in the attributes of each IFC entity. For the dimensional estimation, all
estimated dimensional values in Table 4.3 were stored in the corresponding attributes of the
dimensional entities IfcDimension, IfcPosition and IfcSqureness as shown in Fig. 4.11 (c). For
example, the estimated length and width of seven objects (panel I and six shear pockets) of precast
panel I were stored in the attributes (length (#134) and width (#146)) of the IFC entity IfcDimension.
Here, the ‘#’ refers to the line number of the IFC file. In addition, the dimensional abnormalities,
which exceed the corresponding dimensional tolerances, were visualized with the error values as
shown in Fig. 4.11 (b). Similarly, the detected spalling defect information of precast panel II were
stored in the attributes (number, area, volume and location) of the IFC entity IfcSpalling as shown in
Fig. 4.12 (c). For instance, the lines #276, #277, #10 and #6 in the IFC file of precast panel II indicate
that seven spalling defects were detected and the corresponding defect area, volume loss and defect
location were quantified.
Figure 4.11 IFC representation of dimensional estimation results of precast panel I: (a) Hierarchical structure of
IFC entities and attributes; (b) 3D BIM model of precast panel I with dimensional inspection results; (c) IFC
data tree for the dimensional inspection results

Chapter 4. BIM based Quality Assessment System of Precast Concrete Elements
87
Defect 1 ( Area: 346 cm2
Volume: 428 cm3 )
Defect 2 ( Area: 164 cm2
Volume: 80 cm3 )
Defect 3 ( Area: 281 cm2
Volume: 276 cm3 )
Defect 4 ( Area: 178 cm2
Volume: 304 cm3 )
Defect 5 ( Area: 133 cm2
Volume: 161 cm3 )
Defect 6 ( Area: 4 cm2
Volume: 1 cm3 )
Defect 7 ( Area: 27 cm2
Volume: 15 cm3 )
(a) (b)
#288 = IfcSpalling(#276, #277, #10, #6)
#276 = IfcCount(7);
#277 = IfcArea((346.0, 164.0, 281.0, 178.0, 133.0, 27.0, 3.8), cm2 );
#10 = IfcVolume((428.3, 80.2, 276.4, 304.4, 160.7, 14.7, 1.3), cm3 );
#6 = IfcDirection(((21.0,91.0), (66.0,72.0), (99.0,69.0), (27.0,21.0), (54.0,24.0), (93.0,33.0), (88.5,13.5)), cm );
(c)
4.5 Chapter Summary
This chapter describes a holistic approach for dimensional and surface QA of precast
concrete elements based on BIM and 3D laser scanning technology. To make the proposed approach
practical and systematic, a detail framework consisting of four cores – (1) the inspection checklists, (2)
the inspection procedure, (3) the selection of an optimal scanner and scan parameters, and (4) the
inspection data storage and the delivery method was developed for QA of precast concrete elements.
The applicability of the proposed framework with a 3D laser scanner was examined through assessing
the dimensional and surface qualities of actual precast concrete elements. Furthermore, IFC-based
inspection data storage and delivery method was validated using the estimated dimensional and
surface quality assessment results. The experimental results show that the proposed BIM and laser
scanning based quality assessment system has potential in autonomous and reliable QA of precast
concrete elements. More specifically, the proposed method successfully estimated dimensions of a
precast panel with average error of 2.5 mm and detected spalling defects on the surface of another
panel with average localization and volume estimation accuracy of 86.9 % when the thickness change
Figure 4.12 IFC representation of surface defect characterization results of precast panel II: (a) Hierarchical
structure of IFC entities and attributes; (b) 3D BIM model of precast panel II with defect characterization
results; (c) IFC data tree for the defect characterization results

Chapter 4. BIM based Quality Assessment System of Precast Concrete Elements
88
of the spalling defect was over 3 mm. However, the proposed system has limitations, which are topics
for future research. Firstly, the applicability of the proposed dimensional and surface quality
assessment system is currently limited to precast concrete elements with a rectangular-shape and a
uniform thickness, and further investigation is needed to extend the applicability of the proposed
system to other types of precast concrete elements that have more complex geometries. Second,
quantitative analysis of selecting the optimal laser scanner and its scan parameters is out of the scope
of this paper. Since data collection parameters and scanner selection may affect the data quality and
accuracy of the dimensional and surface quality assessment for precast concrete elements (Tang and
Alaswad 2012), quantitative analysis on the selection of optimal scanner and its parameters is needed.
Third, the proposed dimensional and surface quality assessment technique is a sensor (i.e., laser
scanner) and model dependent method, which is inevitably influenced by the measurement noise of
the sensor and the uncertainty of the selected model. In future research, the accuracy of dimensional
and surface QA can be improved through the development of optimized algorithms and analysis of the
uncertainty of the model. Finally, the implementation of the inspection data storage and delivery of
this study is limited to a single server scale, and the decision making process, which computes the
discrepancy between the estimated dimensions and the corresponding design values, is not fully
automated in this study. An efficient and effective data storage and delivery system based on cloud
servers may become more attractive for future applications.

Chapter 5. Optimal Scan Parameter Selection for Enhanced Quality Assessment
89
5 OPTIMAL SCAN PARAMETER SELECTION FOR
ENHANCED QUALITY ASSESSMENT
5.1 Chapter Introduction
This chapter presents a method of selecting optimal scan parameters of a laser scanner for
enhanced DQA technique of precast concrete elements. As described in Chapter 2, the performance of
the DQA technique is largely influenced by scan parameters, and incident angle turned out to be the
main factor among them. Hence, it is important to minimize the negative impact of incident angle on
dimensional estimation accuracy. In order to meet this demand, this study aims to enhance the
dimensional estimation accuracy of the DQA technique by optimizing the scan parameters of a laser
scanner. To find an optimal scan parameter, a laser beam model, that simulates the position and the
measurement noise of the laser beam of the laser scanner, is developed in this study. First, the
mathematical equation of the laser beam position is derived based on the geometric relationship
between the laser scanner and a target object. Then, estimation of the measurement noise of laser
beam is conducted using an empirical approach since the theoretical measurement noise of a laser
scanner is hard to be estimated due to different working principles and laser sources of laser scanners.
Subsequently, validation of the proposed laser beam model is performed by comparing with
experimental results. Then, parametric studies with different scanning geometry are followed using
the developed model to find optimal scan parameters. It can be expected that the proposed DQA
technique with accuracy enhancement via scan parameter optimization has a potential in achieving
robust and accurate dimensional measurements of precast concrete elements.
This chapter is organized as follows. First, research background of laser beam including the
measurement error source and the energy distribution of a laser beam is discussed in Chapter 5.2. The
laser beam model developed for scan parameter optimization is then presented in Chapter 5.3.
Validation of the proposed model and the scan parameter optimization result are discussed in Chapters
5.4 and 5.5, respectively. Finally, this chapter concludes with a summary and future work in Chapter
5.6.

Chapter 5. Optimal Scan Parameter Selection for Enhanced Quality Assessment
90
5.2 Research Background
Measurement error sources of laser scanners 5.2.1
High spatial resolution and fast capturing possibilities make 3D laser scanners popular in
engineering settings. However, the quality of the individual points in the point cloud is not well
investigated although it actually influences the quality of data processing outputs such as point cloud
registration and segmentation. In fact, scans are subject to measurement noise despite the laser
scanning data being highly accurate (in the range of 2-5 mm). Manufacturers often provide technical
specifications of laser scanners, including its measurement accuracy, which is performed on reference
surfaces under laboratory conditions. However, in practice, most target objects for laser scanning
contains a variety of materials such as concrete, wood and steel. In addition, different parts of the
scenery are scanned with different scanning distances and incident angles, resulting in different levels
of measurement errors. Also, environmental conditions including temperature, lighting conditions and
humidity are often neglected, but may vary between scans during the survey.
Four main sources have been established as influencing the quality of individual scan points
(Soudarissanane et al. 2010): (1) Scan mechanism; (2) Atmospheric conditions and environment; (3)
Object properties and (4) Scanning geometry.
(1) Scanner mechanism – This includes internal (scan mirror alignment and laser beam divergence)
and external (mounting) laser scanner settings. The misalignment of the laser mirror positioned
inside the laser scanner can result in inaccurate range measurements. In previous studies, Zhuang
and Roth (1995) investigated the scanner mechanism, focusing particularly on modeling the
center offset of a laser mirror, and Lichti and Jamtsho (2006) studied the influence of the beam
divergence and angular resolution on the quality of scan points. Other studies investigated the
mechanism of the detection process of the reflected signal (Adams and Probert, 1996; Pesci and
Teza, 2008).
(2) Atmospheric conditions and environment – This includes the humidity, temperature, lighting
conditions and pressure variations. These natural factors can affect the measurement error
behavior of a laser scanner. In terms of the lighting conditions, Pfeifer et al. (2007) and Voisin et
al. (2007) investigated the effect of darkness, artificial light and natural sunlight on measurement
noise. The scanning environment, (e.g. indoors, outdoors), have been also studied by Borah and
Voelz (2007).
(3) Object properties – This refers to the surface properties of the target object, concerning the
anisotropy of the laser beam reflection that depends on the reflectivity and the roughness of the

Chapter 5. Optimal Scan Parameter Selection for Enhanced Quality Assessment
91
Specular Quasi-specular Lambertian
Minnaert model Henyey-Greenstein
model
Backscatter Henyey-
Greenstein model
surface material with respect to the wavelength of the scanner (Boehler et al. 2003; Pfeifer et al.
2008; Hoefle and Pfeifer, 2007; Kaasalainen et al. 2009; Leader 1979).
(4) Scanning geometry – This refers to the placement of laser scanner relative to the location and
orientation of the scanned surface, which determines the local incidence angle, local range and
local point density of the laser points (Lindenbergh et al. 2005; Lichti 2007).
In this study, the first three factors were not considered for the following reasons. First, the
measurement error caused by the scanning mechanism was neglected due to the assumption that the
internal and external laser scanner settings were well configured. Second, according to a study that
investigated the effect of atmospheric conditions and environment on measurement errors of laser
scanners (Hejbudzka et al. 2010), the atmospheric conditions and environment were not considered in
this study since the scans are carried out under scan distances of less than 20 m. Third, surface
properties such as roughness and reflectivity can be negligible since target object is specified as only
precast concrete elements and the surface can be assumed to have a high regularity. Therefore,
scanning geometry containing the incident angle and scan distance was the main concern of this study
for the estimation of the measurement errors of a laser scanner. The following section discusses the
mathematical illustration of the signal deterioration with respect to the scanning geometry.
Signal deterioration with scanning geometry 5.2.2
Figure 5.1 Schematic illustration of different surface scattering models (Rees 2001)

Chapter 5. Optimal Scan Parameter Selection for Enhanced Quality Assessment
92
L. S.
N = (a,b,c)
ρ = d
P = (x,y,z)
L. S.
N = (a,b,c)d
P = (x,y,z)
ρ
Footprint on the
surface
Threshold
Energy distribution
α
α = 0
(a) (b)
The intensity value of a received laser beam represents the amount of light reflected back to
the scanner relative to amount of emitted light. The strength of the laser signal received by the scanner
depends on the scattering behavior of the object surface. Six main types of reflectivity behaviors can
be distinguished as illustrated in Fig. 5.1 (Rees 2001). Specular reflection occurs on a mirror-like
smooth surface, and occurs when light from a single incoming direction is reflected into a single
outgoing direction. In contrast to the specular reflection, Lambertian reflectance appears when the
surface scatters the light in all directions. In practice, scattering behavior is often described by mixed
models as the Minnaert model or the Henyey-Greenstein model that result from combining the
Lambertian with the specular model. The geometric relationship between a laser scanner and an object
surface determines the local scanning geometry. In this study, the ‘scanning geometry’ refers to the
two components, i.e. incident angle (𝛼) and scan distance (ρ). If let the vector 𝑃𝑖 = [𝑥𝑖, 𝑦𝑖 , 𝑧𝑖]𝑖 …𝑛
be the laser beam vector from the laser scanner to the object surface, the scan distance can be directly
obtained as 𝜌𝑖 = √𝑥𝑖2 + 𝑦𝑖
2 + 𝑧𝑖2. The incident angle for i-th scan point, 𝛼𝑖, which is defined as the
angle between the laser beam vector 𝑃𝑖 and the normal vector 𝑁 of the surface can be formulated as:
𝛼𝑖 = cos (𝑃𝑖 𝑁
|𝑃𝑖| |𝑁|) (5.1)
Note that the incident angle is always in the interval [0 < 𝛼𝑖 <𝜋
2].
Figure 5.2 Schematic description of the energy distribution of a laser beam with different incident angle: (a)
With a perpendicular laser beam (𝛼 = 0); (b) With an incident angle 𝛼 to the normal N of a planar surface
placed at a distance d.

Chapter 5. Optimal Scan Parameter Selection for Enhanced Quality Assessment
93
Fig. 5.2 shows the schematic illustration of the energy distribution of a laser beam with two
different incident angles. A laser beam hitting a surface perpendicularly results in a circular footprint
on the object’s surface. In this study, the laser beam is assumed to be a Gaussian beam (Alda, 2003),
which means that the distribution of the energy in the footprint is normally distributed, as depicted on
the left of Fig. 5.2. In the perpendicular case, the energy distribution is the same along all radial
sections in the footprint, and a greater distance results in wider circular footprints and therefore
weaker returned signals. On the other hand, if the laser beam is hitting the surface with a non-zero
incident angle, the resulting footprint on the surface is elongated along a certain direction and
therefore the energy distribution is also spread and forms an ellipse on the surface as shown in the
right of Fig. 5.2. A lower intensity of received signal implies a deteriorating Signal to Noise Ratio
(SNR). For longer distances or higher incident angles, the output signal is week and the detection of
the signal becomes harder.
To quantify the amount of the received signal with respect to the emitted signal, the energy
relationship between the laser light transmitter and the detection unit is described. According to the
Bidirectional Reflectance Distribution Function (BRDF) (Jelalian 1992), the amount of received laser
beam power with respect to emitted laser power can be formulated in free space path propagation as
below:
𝑃 (𝜌) = 𝑃 cos 𝛼
𝜌2 𝛾 𝐶 𝑦 𝐶 (5.2)
where 𝑃 is the received power and 𝑃 is the transmitted power. Note that Eq. (5.2) assumes that
the surface hit by the laser pulse behaves in the form of a Lambertian scatter model, meaning the
energy at the surface is scattered uniformly in all directions. 𝛾 denotes the surface reflectivity, and
𝐶 𝑦 and 𝐶 refers to the constants of system and atmospheric losses, respectively. Since 𝛾, 𝐶 𝑦
and 𝐶 can be assumed not to vary as mentioned earlier, only two variables (𝜌 and 𝛼) are
considered as the influence factors on the measurement errors of a laser beam. Hence, Eq. (5.2) shows
that the SNR of a laser beam decreases with the increase in incident angles, and inversely proportional
to the scan distance squared.

Chapter 5. Optimal Scan Parameter Selection for Enhanced Quality Assessment
94
Laser
Scanner
Las
er B
eam
Object surface
5.3 Laser Beam Simulation Model
Position modeling 5.3.1
Figure 5.3 Geometric model for the position of a laser beam on the surface of an object
As described in Chapter 2, the effect of the incident angle on the dimensional estimation
results is closely related to the edge extraction performance of the DQA technique. In order to select
an optimal scan parameter set for the enhanced dimensional estimation of the DQA technique, a
simulation of the position of a scan point falling on the target object surface is necessary.
Modeling the position of laser beam was first conducted. Fig. 5.3 shows the geometric model
for the y position of the laser beam on the target object surface. Note that the surface of the target
object is assumed to be planar. With the line-of-sight characteristic of the laser scanner, the y position
of the laser beam with horizontal angle of H and vertical angle of V on the object surface can be
derived as:
𝑦 = 1
cos tan =
1
cos( 𝑖) tan( 𝑗) (5.3)
where d is the orthogonal scan distance between the laser scanner and the object. and
denote the angular resolution in the horizontal and vertical directions, respectively. Similar to the y

Chapter 5. Optimal Scan Parameter Selection for Enhanced Quality Assessment
95
position, the x position of the laser beam having the same horizontal and vertical angles (H and V) is
calculated as:
𝑥 = 1
cos tan =
1
cos( 𝑗) tan( 𝑖) (5.4)
Measurement noise modeling 5.3.2
Modeling of the measurement noise for each scan point was then performed to reflect the
actual position of each scan point with measurement noise. Here, the measurement noise is defined as
the standard deviation of the distance values of scan points from the best-fit plane generated about the
scan points. A few previous studies (Lichti 2007; Soudarissanane et al. 2011) have investigated the
measurement noise of laser scanners and attempted to make a model for the measurement noise,
Figure 5.4 Procedures for the proposed measurement noise modeling
(1) Collect "multiple"base scan data sets
with different scanning geometry and calculate
its measurement noise for each set
(2) Collect a"single"set of test
scan points
Scan distanceIncident
angle
(3) Select "two"closest base scan
data sets to each test scan point
Scan distance Incident angle
ρ1
ρ2...ρn
α1
α2...αn
ρT, i=1...m αT, i=1...m
ρ1
ρ2
α1
α2
Two closest base scan data sets(4) Do interpolation of the
measurement noise for
each test scan point
Measurement
noise
E (ρ1 , α1)
E (ρ2 , α2)...
E (ρn , αn)
E (ρ1 , α1)
E (ρ2 , α2)E (ρT, i=1...m ,
αT, i=1...m)ρT, i=1...m αT, i=1...m

Chapter 5. Optimal Scan Parameter Selection for Enhanced Quality Assessment
96
estimating the actual measurement noise for a scan point is still inaccurate and the models are limited
to laser scanners used in those studies. To tackle these limitations, this study proposed an empirical
method of modeling the measurement noise of a laser scanner, which can be adapted to other types of
laser scanners. Fig. 5.4 describes the process of the proposed measurement noise modeling. It is
important to note that the proposed empirical modeling method is based on the actual measurement
noise values obtained from multiple scan sets. There are four steps for the measurement noise
modeling as follows:
(1) Collection of “multiple” base scan data sets with different scanning geometry and calculation of its
measurement noises for each set – In this step, acceptable scan distances and incident angles are
selected according to the size of precast concrete elements being scanned, and multiple base scan sets
are obtained within the selected ranges of the scan distance and incident angle. For example, if the
length of a precast concrete element is 10 m, the acceptable ranges of scan distance and incident angle
for the base scan sets would be 5-15 m and 0-50°, respectively. Note that this selection is based on the
assumption that the maximum incident angle between the laser scanner and the precast concrete
element is below 45°. The measurement noise for each base scan is then computed using a planar
fitting algorithm, i.e. total least squares. Here, the measurement noise (E) is defined as the standard
deviation of the distance values of scan points from the best-fit plane generated about the scan points.
The linear regression determined by the total least squares method minimizes the orthogonal distances
from the point cloud of a scan to the fitted model (Hartley and Zisserman 2003). Using matrix notation,
the equation of a plane is expressed as:
= 𝑛× (5.5)
where the matrix of known observables is defined as = [𝐏, 𝟏𝑛× ]. Here, 𝐏 is the matrix of the set
of test scan points, 𝑃𝑖 = [𝑥𝑖, 𝑦𝑖 , 𝑧𝑖]𝑖 …𝑛. The unknown parameters are denoted as which consists
of four coefficients of the fitted plane. Here 𝑛× denotes the zero matrix. The solution =
[ , , , ] of the total least squares estimation of the planer parameters minimizes the sum of the
squared orthogonal distances to the fitted plane. The residuals ��𝑑 of the fitted plane and the
measurement noise (Ei) for each scan can be computed as:
��𝑑 = (5.6)

Chapter 5. Optimal Scan Parameter Selection for Enhanced Quality Assessment
97
E𝑖 = 𝜎�� 𝑤ℎ𝑒𝑟𝑒 𝑖 = 1,…𝑛 (5.7)
Hence, the implementation of Step (1) results in three nominal values for each base scan set, i.e. scan
distance (ρ), incident angle (α) and measurement noise (E).
(2) Collection of a ‘single’ set of test scan points – In this step, the entire surface of a target precast
concrete element is scanned and a set of point cloud data is acquired. In the point cloud, all scan points
have different scan distances and incident angles so the measurement noise for each scan point needs
to be estimated based on the base scan data sets collected in Step 1.
(3) Selection of two closest base scan data sets to each scan points of test scan set – In this step, the two
closest base scan data sets to each scan point of the test scan set are determined for measurement noise
estimation.
(4) Estimation of the measurement noise for each scan point based on linear interpolation – The last step
for the measurement noise modeling, the construction of a measurement noise value for each scan
point is performed by interpolating the measurement noises of the selected two base scan data sets.
Once the interpolation process is completed, all scan points within the precast concrete element have
its own measurement noise value so that actual position estimation of laser beams considering the
measurement error is realized.
Figure 5.5 Test set-up for collection of base scan sets for measurement noise modeling

Chapter 5. Optimal Scan Parameter Selection for Enhanced Quality Assessment
98
Figure 5.6 Measurement noises with increasing scan distance and incident angles
For the measurement noise modeling, a series of scans with different scan distance and
incidence angle were conducted, which corresponds to Step 1 of Fig. 5.4. Fig. 5.5 shows the
experimental set-up for the collection of the base scan data sets. A laser scanner, Focus-3D (FARO Inc.
2014), and a lab-scale precast concrete panel with dimensions of 600 mm x 450 mm were used for the
data acquisition. The test specimen was mounted on a table via a screw clamp mechanism with a
goniometer enabling the mechanism to rotate horizontally with a precision of 2°, as depicted in Fig.
5.5. The specimen was placed at distances ranging from 1 to 16 m with an increment of 1 m and
rotated from 0° to 70° in 10° increments. The surface of the precast concrete specimen was scanned at
each scan set such that a total of 128 scans were done for the collection of base scan data. For each
scan, measurement noise was estimated by using the obtained scan points and interpolation method.
For each scan, at least 5000 scan points are used for the plane fitting in this study.
Fig. 5.6 shows the measurement noise results with increasing scan distances and incidence
angles, which were computed based on the collected base scan data sets. It can be seen that there are
two main trends. First, the level of the measurement noise over a scan distance of 8 m increases as the
scan distance increases. Second, larger incidence angles cause larger measurement noise on the laser
scan points. These observations are in accordance with Eq. (5.2).
Based on the calculated measurement noise values for the base scan data sets, the estimation
of measurement noise for each scan point of test scan data was carried out by 1) selecting two closest
base scan data sets to the scan point and 2) constructing the interpolated measurement noise using the
selected two ranges. Once the measurement noise is estimated, the process of decomposing the
measurement noise into those of three axes (x,y and z) is performed so the position model considers
the measurement noise of scan points for all axes. The decomposed measurement noise for each axis

Chapter 5. Optimal Scan Parameter Selection for Enhanced Quality Assessment
99
can be presented as:
𝑥,𝑖 =𝑥𝑖
𝑆𝑖 𝑖 , 𝑦,𝑖 =
𝑦𝑖
𝑆𝑖 𝑖 , 𝑧,𝑖 =
𝑧𝑖
𝑆𝑖 𝑖 (5.8)
Finally, modeling for the laser beam position is completed with combination of the geometric
model of laser beam (Chapter 5.3.1) and it’s measurement noise. In the following sections, the
proposed laser beam model is validated by comparison with the experimental data, and selection of
optimal scan parameters of the laser scanner is discussed.
5.4 Validation of the Laser Beam Model
In this section, the validation of the proposed laser beam model was performed by comparing
the edge extraction results of the simulated scan points with experimental data. Fig. 5.7 shows the
edge extraction performance in both the simulation model and the experimental test. Note that both
results are the outcome of the ‘vector-sum’ algorithm implementation of the DQA technique. In the
case of 0° incident angle, clear edge extraction results are obtained in both the simulation and
experimental tests. On the other hand, in the case of 30° incident angle, the edge extraction results are
relatively poor compared to the 0° incident angle due to the position irregularity of the scan points.
Table 5.1 summarizes the quantitative results of the edge extraction performance comparison between
the developed laser beam model and the experiment. In the table, the accuracy of edge extraction is
defined as the vector-sum algorithm performance, which was calculated as (detected edge points +
detected non-edge points) / total scan points. An average difference of 2.5 % between the developed
model and the experiment was obtained, indicating that the developed laser beam model can
accurately simulate he actual position of laser beam.
Figure 5.7 Comparison of edge extraction performance between the proposed laser beam model and the
experiment resultsin in cases of incidence angle 0° and 30°: (a) Simulation and (b) Experiment

Chapter 5. Optimal Scan Parameter Selection for Enhanced Quality Assessment
100
Table 5.1 Validation of the proposed laser beam model with varying scan parameters
Scan parameter Simulation
accuracy (%) Experiment
accuracy (%) Difference
(%) Angular resolution (°)
Distance (m) Incident angle
(°)
0.018
8
0 99.99 99.97 0.02
15 99.67 99.89 0.20
30 87.14 93.87 6.73
45 69.25 66.48 3.23
12
0 99.97 99.99 0.02
15 99.90 99.94 0.04
30 93.34 94.55 1.21
45 79.25 67.12 8.13
5.5 Selection of Optimal Scan Parameter
Fig. 5.8 describes the tested virtual precast concrete specimen used for the scan parameter
optimization. The specimen with dimensions of 4800 mm ⅹ 1000 mm ⅹ 150 mm has eight shear
pockets on the surface, and each identical shear pocket has 300 mm ⅹ 200 mm sizes. The objective
of this simulation test was to find the optimal scan parameters to give the best dimensional estimation
result for the dimension and the position of the tested specimen and the eight shear pockets is obtained.
In this simulation, scan distances ranging from 4 m to 12 m with 0.25 m increments and angular
resolutions ranging from 0.015° to 0.036° with and increment of 0.003° were investigated. The range
was selected based on the assumption that the maximum incident angle of laser beam is below 30°.
Figure 5.8 Tested virtual precast slab specimen for selection of optimal scan parameters
10
00
mm
4800 mm
150
mm
900 mm
40
0 m
m
20
0 m
m
300 mm
600 mm
30
0 m
m
900 mm
Shear
3 51
2 4 6
7
8
900 mm

Chapter 5. Optimal Scan Parameter Selection for Enhanced Quality Assessment
101
Figure 5.9 Visualization of the dimension estimation result of the simulation test: (a) Dimension error plot in
3D; (b) Dimension error plot in 2D; and (c) Classfication result of optimal scan parameter
Table 5.2 Dimensional estimation results with varying scan parameters for the simulation
Angular resolution (°) Distance (m)
Dimensional error (mm)
Dimension Position
0.018
4 6.2 3.6
5 4.5 2.8
6 2.8 1.9
7 1.1 0.9
8 0.7 0.7
9 0.6 0.5
10 0.7 0.6
11 1.3 0.6
12 0.8 0.4
0.036
4 1.6 1.0
5 0.5 0.7
6 0.8 1.0
7 0.9 0.9
8 1.4 1.1
9 1.7 0.8
10 1.4 1.6
11 2.0 1.0
12 3.1 1.6
Scan Distance (m)
An
gu
lar
Re
so
lutio
n (
ᵡ 10
-3 °
)
(mm)
Scan Distance (m)
An
gu
lar
Re
so
lutio
n (
ᵡ 10
-3 °
)
Dim
ensio
n E
rror
(mm
)
(a)
(b) (c)

Chapter 5. Optimal Scan Parameter Selection for Enhanced Quality Assessment
102
Fig. 5.9 shows the visualization of the dimensional estimation of the simulation test. The red
pixels in Fig. 5.9 (b) indicate scan cases over the dimension error of 1.5 mm, while the blue pixels
indicates the scan cases less than the dimension error of 1.5 mm. It can be summarized from the result
as follows: (1) In cases of high point density (combination of low scan distance and angular resolution)
such as the case of scan distance of 4 m and angular resolution of 0.015°, the dimensional errors are
relatively large compared to cases of mid-level point density. Here, point density can be defined as
ratio of the number of scan points to a unit region; (2) In the cases of low point density such as the
condition of scan distance of 12 m and angular resolution of 0.036°, the dimension errors are also
larger than mid-point density. Table 5.2 summaries the dimensional estimation results of the tested
specimen with varying scan parameters. It is noted that due to the space limitation, only results for
two angular resolutions of 0.015° and 0.036° are shown in Table 5.2. It can be seen that there are
different trends between two different point density cases. The reason behind these phenomena is
illustrated in details in Chapter 2.4.2.
The scan parameter selection, however, only provides safe scanning regions for the size of
the tested specimen, which means that the safe scanning regions may change depending on the size of
precast concrete elements being investigated. Thus, a method that can provide a general solution of
selecting optimal scan parameters is needed. To this end, in this study two features, which are
sensitive to the dimensional estimation error, are used to determine the optimal scan parameters in a
general way regardless of the size of precast concrete elements. The features are (1) the average
spatial resolution of the scan points and (2) the maximum incident angle between the laser scanner
and the precast concrete element. These two features are selected based on the observation that the
dimensional estimation errors are largely dependent on the point density of scan points as discussed in
the previous paragraph and the measurement noise is largely influenced by the incident angle. The
two features can be computed as:
Feature I - = ×
( ) (5.9)
Feature II - 𝛼 , 𝑥 = tan (√𝐿2+𝑊2
2 ) (5.10)
where D is the orthogonal scan distance between the laser scanner and a precast concrete element. L
and W denote the length and the width of the precast concrete element, respectively, and are assumed
known from the blueprint of the precast concrete element.

Chapter 5. Optimal Scan Parameter Selection for Enhanced Quality Assessment
103
Spatial Resolution (ᵡ 10-3
mm)
Ma
xim
um
In
cid
en
t A
ng
le (°)
1 2 3 4 5 6 7 810
15
20
25
30
35
Unsafe Scan Parameter Set
Safe Scan Parameter Set
Figure 5.10 Classification of optimal scan parameter in the two feature domain
Fig. 5.10 shows the classification results of optimal scan parameter selection in the domain
of two features. It is observed that the combined conditions of a high maximum incident angle and a
low spatial resolution had large dimensional errors. For example, in the combined cases of over
maximum incident angle of 20° and below spatial resolution of 2.5 mm, the classification indicates
unsafe scan parameters for the DQA technique. In addition, the cases of a relatively large spatial
resolution scan of over 4 mm, even in small maximum incident angles, were classified as improper
scan parameters. In summary, the following recommendation can be derived from the simulation test
when selecting scan parameters for DQA technique.
2 < < and 𝛼 , 𝑥 < 2 ° (5.11)
Even though the proposed simulation model was developed based on a certain type of laser
scanner, this approach can be adopted to other laser scanners for DQA of precast concrete elements.
However, in this study, scanning time was not considered for the optimal scan parameter selection. To
find the best scan parameter set for the DQA technique, further study considering scanning time will
be investigated.

Chapter 5. Optimal Scan Parameter Selection for Enhanced Quality Assessment
104
5.6 Chapter Summary
This chapter presents a method of selecting optimal scan parameters of a laser scanner for enhanced
DQA technique of precast concrete elements. As described in Chapter 2, the performance of the DQA
technique is largely influenced by scan parameters, and incident angle turned out to be the main factor. Hence,
it is important to minimize the negative impact of incident angle on dimensional estimation accuracy. In order
to meet this demand, this study aims to enhance the dimensional estimation accuracy of the DQA technique
by selecting optimal scan parameters of a laser scanner. To achieve this goal, a laser beam model, that can
simulate the position and the measurement noise of the laser beams of the laser scanner, is developed. First,
the mathematical equation for the laser beam position is derived based on the geometric relationship between
the laser scanner and a target object. Then, estimation of the measurement noise of laser beam is conducted
using an empirical approach. Subsequently, validation of the proposed laser beam model was performed
through comparison with experimental results. The validation result demonstrates that the proposed model
can estimate accurately the position and the measurement noise of laser beams. Parametric studies with
different scanning geometry are followed based on the developed model to find optimal scan parameters.
Recommendations are derived from the simulation test, but further studies considering scanning time
optimizing scan parameters need to be complete.

Chapter 6. Application to Full-scale Precast Concrete Elements
105
6 APPLICATION TO FULL-SCALE PRECAST CONCRETE
ELEMENTS
6.1 Chapter Introduction
Until now, the validation results of the proposed DQA technique on only lab-scale specimens
were presented. However, these validation results are not enough to prove the effectiveness of the
proposed DQA technique. In addition, in the previous chapters, there was no validation test on how
the obtained QA data was actually stored and managed in BIM. Thus, this chapter investigates the
feasibility of the proposed methods for QA of precast concrete elements. The main objectives of this
study are (1) full automation and additional of the DQA technique for real and complex field
applications and (2) development of a cloud-BIM system for effective data storage and management
of the estimated dimensional quality information. Different types of two full-scale precast slabs were
used in this study and associated implementation issues are discussed. First, a new coordinate
transformation algorithm is developed to make the DQA technique fully automated so that large-scale
application can be successfully accomplished. Second, a new geometry matching technique that ties
the precast slab models constructed from the scanner data with the built-in BIM model is developed
for precise estimation of errors between the BIM model and the actual precast slabs. Third, the
performance of the proposed DQA technique is compared with a conventional deviation analysis
technique. From the comparison results, the average dimensional error for the proposed technique is
3.2 mm, while that of the conventional deviation analysis is 9.4 mm, demonstrating that the proposed
technique can have high potentials in estimating and assessing the dimensional properties of the
precast concrete element. This chapter is organized as follows. First, the configuration and test results
of the field test are described in Chapter 6.2. The proposed cloud-BIM platform and validation results
for effective data storage and management are presented in Chapter 6.3. Finally, this paper concludes
with a brief summary and future work.

Chapter 6. Application to Full-scale Precast Concrete Elements
106
6.2 Full-scale Application of Dimensional Quality Assessment Technique
Test configuration 6.2.1
Figure 6.1 Test configuration of the full-scale dimensional QA: (a) Test set-up; (b) Top view of the inspected
precast slabs
Figure 6.2 Blueprint (top view) of the precast slab type I and II
Crane3D Laser
Scanner
Target Precast Slab
Precast Slab Type II
Precast Slab Type I

Chapter 6. Application to Full-scale Precast Concrete Elements
107
The experimental configuration of the field test is shown in Fig. 6.1. The field test was
conducted in a precast manufacturing company located in Gim-Je in Republic of Korea. In the field
test, a set of point cloud data was acquired from the test specimens using a phase-shift laser scanner,
FARO Focus-3D (FARO 2014) shown in Fig. 6.1 (a). The laser scanner was positioned 9 m from the
center of the target precast slab, and was fixed on the top of a crane. Table 6.1 shows the details of the
scan parameters investigated and the tested two precast slabs. For data acquisition, three different
angular resolutions (0.018, 0.036 and 0.072°) were investigated and the scanning times for each
angular resolution case were measured at around 25, 8 and 4 minutes, respectively. In the field test,
two types of precast slab were scanned as shown in Fig. 6.2. For the precast slab type I, the
dimensions are 10,610 mm ⅹ1,980 (1956) mm ⅹ240 mm and it has 16 shear pockets with identical
dimension of 220 mmⅹ200 mm. It is important to note that the vertical lengths of the slab type I,
1,980 mm for the left and 1,956 mm for the right, are different so that the slab is in the shape of a
trapezoid. It is also noted that the shear pocket plays a role in assembling precast slabs with precast
girders. For the precast slab type II, the dimensions are 12,600 mm ⅹ2,480 mm ⅹ240 mm and it
has 25 shear pockets with identical dimension of 440 mmⅹ140 mm. It is important to note that the
corners of the slab have two different angles (89.4° and 90.6°) such that the slab is in the shape of a
parallelogram. In other words, both the slabs are a non-rectangular shape of precast slab. In the
blueprint, the dimensional tolerances are specified. For the length and the width of the two precast
slabs, the tolerances are specified as ± 10 mm and ± 5 mm, respectively. For the dimensions
(length and width) and the position of the shear pockets, the tolerances are specified as ± 5 mm.
Hence, the certain objective of the field test was to identify whether the dimensional properties of the
precast slabs and the shear pockets conform to the corresponding tolerances - specifically, to estimate
1) the dimension errors of the precast slab and the shear pockets and 2) the position errors of the shear
pockets on the precast slab. Here, the position of the shear pocket is defined as the distance between
the center point of a shear pocket and the closest edge of the precast slab.

Chapter 6. Application to Full-scale Precast Concrete Elements
108
Table 6.1 Specifications of the tested scan parameter and precast slab
Aspect Property Value
Scan parameter Scan distance 9 m
Angular resolution 0.018, 0.036, 0.072°
Scan time 25 (0.018°), 8 (0.036°), 4(0.072°) min.
Precast slab Dimension Type I - 10,610 mmⅹ1,980 (1956) mm ⅹ240 mm
220 mmⅹ200 mm for each shear pocket
Type II – 12,600 mmⅹ2,480 mm ⅹ240 mm
440 mmⅹ140 mm for each shear pocket
Specified tolerance ± 10 mm for precast slab length
± 5 mm for precast slab width
± 5 mm for shear pocket dimension and position
Improved coordinate transformation algorithm 6.2.2
In this section, a new coordinate transformation algorithm developed for the filed test is
discussed. Fig. 6.3 shows the range image of the full-scale precast slab type I. In the previous
coordinate transformation algorithm described in Chapter 2.3.2, this process requires three points
‘near’ the corners of the precast slab. However, there is a difficulty in identifying three points because
the range image generated from the point cloud data is distorted (curved) due to the large-scale
dimension of the precast slab, and the scan points corresponding to external steel bars used for lifting
are positioned near the corners of the precast slab. As a result, the coordinate transformation process is
hard to be accurate and automated. To resolve this, a new coordinate transformation algorithm is
developed using directly the 3D point cloud data instead of using the initial 2D range image. This
algorithm consists of the following four steps.
Step 1- Data cleansing: Removal of unwanted scan points is first conducted using a threshold of Z coordinate.
Since the laser scanner is assumed to be positioned right above the center of the precast slab, the Z values of
the point cloud within the precast slab are always larger than those of the unwanted background scan points
as shown in Fig. 6.4 (a). Based on this knowledge, a threshold value is determined to filter out the useless
scan points. The threshold is set as follows. First, Zmax, which is the maximum Z coordinate of all the scan
points, is selected. Then, Zmid, which is the Z coordinate corresponding to the point whose X and Y
coordinates are the median value of all the points, is estimated from a linear interpolation based on all the

Chapter 6. Application to Full-scale Precast Concrete Elements
109
(a) (b)
d
d
d
Z max
Z mid (Z max – d)
Z min (Z max – 2d)
Threshold (Z max - 3d)
points. Here, denote the distance difference between Zmax and Zmid as d. Since the scanned surface is assumed
to be planar, the minimum Z coordinate of all the valid points, Zmin, would also has a difference of d from Zmid.
As a result, Zmin is ideally equal to Zmid - d. To determine a threshold for data cleansing, another d is applied as
a safety factor and the threshold T is set as Zmid - 2d. All the points that have a Z coordinate smaller than T are
regarded as the background points and then removed as shown in Fig. 6.4 (b).
Figure 6.3 The range image of precast slab type I
Figure 6.4 Removal of background scan points: (a) Selection of a threshold for data cleansing; (b) Data
cleansing result

Chapter 6. Application to Full-scale Precast Concrete Elements
110
Figure 6.5 Four corner pixel extraction of a range image: (a) Generation of a range image; (b) Edge
detection; (c) Line extraction using Hough transform and (d) Corner detection
Step 2 – Four corner pixel extraction of a range image: Once unwanted scan points are eliminated, a
range image is generated from the remained scan data, and four corner pixels of the range image
corresponding to the four corner of the precast slab are extracted. Fig 6.5 shows the four sub-steps for
this process. First, a range image is generated by constructing virtual grids along the X and Y axes and
dividing the X-Y plane into user-defined pixels. For each pixel, a group of X, Y and Z values are
allocated. X and Y values of each pixel are the coordinates of its center while Z value is generated
from the linear interpolation based on remaining scan data. Note that if a pixel is inside the slab’s
boundary, a valid Z value is returned from the interpolation. But, if a pixel is outside the slab’s
boundary, no values of Z coordinate are given to the pixel. For each pixel with a valid Z value, the
range is computed by the fomula √𝑋2 + 𝑌2 + 𝑍2, then normalized to the range of [0, 1]. Here, the
range values ‘0’ and ‘1’ denote the ‘black’ and ‘white’ colors in the range image. As shown in Fig. 6.5
(a), the precast slab closer to the laser scanner is shown in a darker grey while the background behind
the slab is shown in a lighter grey. Second, the edge of the precast slab is then extracted. In this study,
a customized edge detector was developed so that only the outside boundary edges of the precast slab
are extracted as shown in Fig. 6.5 (b). The edge detector finds only the first and last pixels that have a
range value less than 1 in each row and column of the range image, and they are marked as edge
pixels. Third, four line segments which represent the four sides of the slab are detected using the
Hough Transform as shown in Fig. 6.5 (c). Finally, four corners A, B, C and D of the slab are
extracted by finding the intersection points of the four line segments as shown in Fig. 6.5 (d), and the
3D coordinates of the four corner pixels are extracted.

Chapter 6. Application to Full-scale Precast Concrete Elements
111
Figure 6.6 Finding of an ideal left-side direction of the slab for coordinate transformation: (a) Ideal
coordinate system; (b) Example of an abnormal slab with a manufacturing error (red dotted line); (c)
Coordinate transformation result with a biased left-side direction AD of the slab; (d) Finding of an ideal
left-side direction AD by best matching
Step 3 – Finding of an ideal left-side direction of the slab: Once the corners’ coordinates are extracted,
a correction is undertaken to ensure that the coordinate system constructed by the corners is in
accordance with the desired coordinate system. In the ideal coordinate system as shown in Fig. 6.6 (a),
the left-bottom corner is the origin and the left side of the slab is along the Y axis. Note that the
investigated slab in this study is a trapezoid (non-rectangular) slab, and the as-built and as-design
sides of the slab are shown in red and blue lines, respectively. However, there is a possibility that the
as-built left-side of the precast slab, which is constructed by corner A and D, is a little inclined due to
a manufacturing error as shown in Fig. 6.6 (b). In this case, if the tilted left side is taken as the Y-axis,
the scan data after coordinate transformation would be like what is shown in Fig. 6.6 (c). Obviously,
with a biased left-side direction AD of the slab, the scan data after coordinate transformation doesn’t
match the as-design one which is in the ideal coordinate system. Hence, a correction algorithm that
makes as-built scan points after coordinate transformation matches the as-design one is developed.
Fig. 6.7 shows the pseudo code of the correction algorithm for the coordinate transformation. This
algorithm finds the ideal left-side direction AD of the slab. To do this, a set of directions is first taken

Chapter 6. Application to Full-scale Precast Concrete Elements
112
Figure 6.7 Pseudo code for finding the ideal left-side direction AD of the slab
as candidates of the ideal left-side direction AD. These directions are generated from a dense linear
sampling within the range of ‘ 𝑖𝑟𝑒 𝑡𝑖𝑜𝑛 𝑜𝑓 𝐴𝐷 ± 𝜀’. Here, 𝜀 is determined as the largest angle
among the angles between four pairs of the slab sides, i.e. angle between side AB and A0B0, between
side BC and B0C0, etc. For each candidate direction of AD, coordinate transformation is conducted by
taking this candidate as the Y-axis, and the mean square of the distances between the four pairs of
corners, i.e. distance between point A1 and A0, between point B1 and B0, etc., is calculated. The ideal
left-side direction AD of the slab with respect to the as-design side is found when the mean square of
distances is minimized as shown in Fig. 6.6 (d).
Step 4 – Coordinate transformation: Once the extraction of the ideal corners (A1, B1, C1 and D1) is
completed, corner D1 is adjusted to D2 on the Y axis and corner B1 is also adjusted to B2 on the X axis
so that it makes up a rectangular coordinate system. Finally, the scan points in the scanner coordinate
system are transformed into the object coordinate system by taking corner A as the origin and AB2 and
AD2 as the X and Y axes.

Chapter 6. Application to Full-scale Precast Concrete Elements
113
Improved edge and corner extraction algorithm 6.2.3
In the field test, there were other technical challenges encountered during the data analysis,
which are associated with edge and corner extractions. First, as can be seen in Fig. 6.8, the side and
middle areas of the slab have different incident angles due to the long size of the slab. For instance,
the incidence angle of the edges (sides) of the precast slab from the laser scanner was measured at
approximately 25°, while the incidence angle of the inner shear pockets near the center of the slab was
about 10°, resulting in poor edge extraction results on the surface area near the edges. Note that the
negative effect of a large incident angle on the dimensional estimation results and its causes are
explained in Chapter 2.4.2. Second, external barriers, i.e. steel bars, were positioned near vertical
edges of the precast slab, which prevent extractions of accurate edge points. Fig. 6.9 (a) shows a photo
of the steel bars built for lifting the precast slab. Note that the exterior barriers does not included in
the blueprint of the precast slab. It can be seen in Fig. 6.9 (b) that the scan points of the steel bars are
still remained after the implementation of the edge point extraction, which may affect negatively the
dimension and position estimation for the precast slab.
Figure 6.8 Varying incident angle according to different positions of the precast slab
Incident angle -
25°
Incident angle -
10°
Laser
Scanner

Chapter 6. Application to Full-scale Precast Concrete Elements
114
Figure 6.9 Effect of external attachments on edge extractions: (a) A photo of steel bar for lifting; (b) The
edge extraction result containing scan points of the steel bars
Figure 6.10 Near-field non-edge point removal based on the RANSAC algorithm
In order to deal with these problems, a two-step non-edge point elimination algorithm is proposed. As
the first step, the far-field non-edge point removal algorithm, which is illustrated in Fig. 2.9 of
Chapter 2.3.3, is executed after the initial edge point extraction. Note that the far-field non-edge point
removal algorithm is based on the observation that the non-edge points are sparsely scattered from the
edges while the edge points are densely aligned along the edge with equal spacing. However, this far-
field non-edge point removal algorithm is not effective in removing non-edge points near edge lines.
To improve the edge extraction accuracy, the RANSAC (RANdom Sample Consensus) algorithm
(Fischler and Bolles 1981) was employed to the remaining edge candidate points after implementing
the first step of eliminating the non-edge points. Note that the RANSAC algorithm is an iterative
method to estimate the parameters with a high degree of accuracy even when a significant number of
outliers are present in the data set. Fig. 6.10 shows the performance results of the RANSAC algorithm.
It can be seen that the fitted two lines are a little biased due to the remaining non-edge scan points in
Fig. 6.10(a), but more accurate line fittings are obtained from the employment of the RANSAC
algorithm in Fig. 6.10(b), resulting in more accurate and reliable dimensional estimation results.
(a) (b)
Steel bar for lifting
(a) (b)

Chapter 6. Application to Full-scale Precast Concrete Elements
115
Field test results 6.2.4
Figure 6.11 Data processing results of the precast slab type I
Fig. 6.11 shows the data processing results of the precast slab type I from the field test. Note
that the results were obtained from the case of angular resolution of 0.036°. Once the point cloud of
the precast slab was acquired with the laser scanner (step 1), coordinate transformation based on the
algorithm described in the previous section was implemented (step 2). Subsequently, edge points were
obtained from the two-step non-edge point removal algorithm and the corners were extracted from the
intersection of the fitted edge lines (step 3). Finally, the dimensions and positions of the precast slab
and shear pockets were computed using the extracted corners and the dimensional compensation
model.
Using the extracted corner points, dimensions and positions of the precast slab and shear
pockets are calculated. Fig. 6.12 shows the dimensional errors in the case of angular resolution of
0.036° by comparing the estimated ones with the design dimensions of the blueprint. In contrast with
the dimension error results, the position estimation error of some shear pockets are significantly large.
For instance, the horizontal position error of #5 shear pocket exceed 40 mm and the vertical position
errors of #4, #8 and #15 are over 15 mm. Table 6.2 summarizes the dimension and position estimation
errors compared with the blueprint under varying angular resolutions. For the dimension error
estimation, a total of 68 dimensions, i.e. 4 for the slab and 64 for the sixteen shear pockets, were
estimated from each scan. The average dimension errors of 4.4, 4.6 and 4.8 mm were obtained for the
angular resolutions of 0.072, 0.036 and 0.018°, respectively. For the position error estimation, a total
Step (1) - Acquisition of 3D scan points Step (2) - Coordinate transformation using range
image and best-matching with as-design model
Step (3) - Edge extraction Step (4) - Corner extraction
0 1 2 3 4 5 6 7 8 9 10
-1
-0.5
0
0.5
1
1.5
2
2.5
3
0 1 2 3 4 5 6 7 8 9 10
-1
-0.5
0
0.5
1
1.5
2
2.5
3

Chapter 6. Application to Full-scale Precast Concrete Elements
116
of 32 position errors were obtained from each scan, and the average position errors of 9.4, 7.2, 7.4
mm were obtained for each angular resolution such that all the scan cases over the allowable tolerance
of 5 mm.
To investigate whether the obtained large position errors are true, a manual inspection was
carried out on the precast slab type I. Fig. 6.13 illustrates the dimensional results of the case of 0.036°
angular resolution by comparing it with the manual inspection. It can be observed that the position
errors of shear pockets of #4, #5, #8 and #15 are significantly reduced, indicating that the positions of
the shear pockets were incorrectly manufactured. Table 6.3 summaries the dimension and position
estimation errors compared to the manual inspection. It can be seen that the dimensional errors for all
scan cases are within the specified tolerance of 5 mm except for the case of 0.072° angular resolution,
demonstrating that the proposed DQA technique assesses dimensional checklists of full-scale precast
concrete elements in a robust and accurate manner.
Figure 6.12 Dimensional estimation results compared with blueprint for precast slab type I: (a) dimension; (b)
position
Figure 6.13 Dimensional estimation results compared with manual measurement for precast slab type
I: (a) dimension; (b) position
(a) (b)
Tolerance - 5 mm
(a) (b)
Tolerance - 5 mm

Chapter 6. Application to Full-scale Precast Concrete Elements
117
Table 6.2 Dimensional estimation results compared with the blueprint for precast slab type I
Angular resolution
(˚)
Dimension error (mm)
Length (slab) Width (slab) Length
(shear pocket)
Width
(shear pocket) Ave.
0.072 15.0 6.0 3.1 4.1 4.4
0.036 10.1 3.7 4.6 4.0 4.6
0.018 12.0 6.3 4.5 4.0 4.8
Angular resolution
(˚)
Position error (mm)
Length (shear pocket) Width (shear pocket) Ave.
0.072 7.5 11.3 9.4
0.036 7.2 7.1 7.2
0.018 7.7 7.0 7.4
Table 6.3 Dimensional estimation results compared with manual measurement for precast slab type I
Angular resolution
(˚)
Dimension error (mm)
Length (slab) Width (slab) Length
(shear pocket)
Width
(shear pocket) Ave.
0.072 5.0 6.5 2.7 3.5 3.4
0.036 0.1 3.7 3.3 3.2 3.1
0.018 2.0 5.7 3.4 4.3 3.8
Angular resolution
(˚)
Position error (mm)
Length (shear pocket) Width (shear pocket) Ave.
0.072 3.7 6.4 5.1
0.036 2.6 2.7 2.7
0.018 1.9 3.0 2.4
For precast slab type II, Fig. 6.14 shows the dimensional errors in the case of angular
resolution of 0.036° by comparing the estimated ones with the blueprint dimensions. In contrast with
the dimension error result, the position estimation error of some shear pockets are significantly larger,
especially in the horizontal position. Table 6.4 summaries the dimension and position estimation
errors compared with the blueprint of the precast slab type II under varying angular resolutions. For
the dimension error estimation, a total of 104 dimensions, i.e. 4 for the slab and 100 for the 25 shear
pockets, were estimated from each scan. The average dimension errors of 5.3, 3.3 and 3.6 mm are
obtained for the angular resolutions of 0.072, 0.036 and 0.018°, respectively. For the position error
estimation, a total of 50 position errors were obtained from each scan, and the average position errors

Chapter 6. Application to Full-scale Precast Concrete Elements
118
of 9.2, 7.7, 5.4 mm are obtained for each angular resolution such that all the scan cases are over the
allowable tolerance of 5 mm.
In order to investigate whether the obtained large position errors are true, a manual
inspection was carried out on the precast slab type II. Fig. 6.15 illustrates the dimensional results of
the case of angular resolution of 0.036° by comparing with the manual inspection. It can be observed
that the position errors of shear pockets are significantly reduced, indicating that the positions of the
shear pockets were incorrectly manufactured. Table 6.5 summarizes the dimension and position
estimation errors compared to the manual inspection. It can be seen that the dimensional errors for all
scan cases are within the specified tolerance of 5 mm except for the case of angular resolution of
0.072°, demonstrating that the proposed DQA technique assesses dimensional checklists of full-scale
precast concrete elements in a robust and accurate manner.
Figure 6.14 Dimensional estimation results compared with blueprint for precast slab type II: (a)
Dimension; (b) Position
Figure 6.15 Dimensional estimation results compared with manual measurement for precast slab type
II: (a) Dimension; (b) Position
(a) (b)
(a) (b)

Chapter 6. Application to Full-scale Precast Concrete Elements
119
Table 6.4 Dimensional estimation results compared with the blueprint for precast slab type II
Angular resolution
(˚)
Dimension error (mm)
Length (slab) Width (slab) Length
(shear pocket)
Width
(shear pocket) Ave.
0.072 4.2 5.8 4.7 5.5 5.3
0.036 8.4 6.2 2.3 3.7 3.3
0.018 5.6 6.9 2.0 4.7 3.6
Angular resolution
(˚)
Position error (mm)
Length (shear pocket) Width (shear pocket) Ave.
0.072 14.3 4.1 9.2
0.036 10.1 5.3 7.7
0.018 7.0 3.8 5.4
Table 6.5 Dimensional estimation results compared with manual measurement for precast slab type II
Angular resolution
(˚)
Dimension error (mm)
Length (slab) Width (slab) Length
(shear pocket)
Width
(shear pocket) Ave.
0.072 5.8 6.2 4.0 7.0 5.7
0.036 0.9 3.6 3.5 4.3 3.4
0.018 1.0 4.7 4.0 3.2 3.6
Angular resolution
(˚)
Position error (mm)
Length (shear pocket) Width (shear pocket) Ave.
0.072 6.4 4.0 5.2
0.036 4.7 1.5 3.1
0.018 3.2 2.5 2.8
To further investigate the dimensional estimation accuracy of the proposed DQA technique, a
comparison test with a commercialized DQA technique, i.e. deviation analysis, was conducted in this
study. Note that the deviation analysis is a method of measuring the dimensional discrepancies
between the design model and an as-built model generated from the point clouds of several scans. Fig.
6.16 shows the deviation analysis results of tested precast slab type I. For the deviation analysis, point
clouds of 10 different position scans were used to create a 3D as-built model. In addition, commercial
software, Cyclone (Leica Geosystems. 2014) and Geomagic Studio (Geomagic Inc. 2014), were used
for registration of the point clouds and estimation of the dimension discrepancies between two models

Chapter 6. Application to Full-scale Precast Concrete Elements
120
of the precast slab. The different colors presented in Fig. 6.16 indicate the varying dimensional
deviation levels. Table 6.6 summarizes the accuracy comparison results between the proposed DQA
technique and the deviation analysis. It is reported that the proposed DQA technique results in more
accurate dimensional estimation performance (3.2 mm) than that (9.4 mm) of the deviation analysis,
proving that the proposed DQA technique can provide a robust and accurate capability for
dimensional estimations of full-scale precast concrete elements.
Figure 6.16 Deviation analysis between the design model and as-built model of precast slab type I
Table 6.6 Dimensional estimation comparison with conventional deviation analysis for precast slab type I
Method
Dimension error (mm) Position error (mm)
Length
(Slab)
Width
(Slab)
Length
(S. P.)
Width
(S. P.)
Length (S.
P.)
Width (S.
P.) Ave.
Deviation
Analysis 20.0 4.5 1.8 6.5 17.5 11.1 9.4
Proposed
DQA
technique
2.0 5.7 3.4 4.3 1.9 3.0 3.2
* S.P. denote the ‘shear pocket’.
Table 6.7 Comprison of time required for the DQA of precast slab type I among three different methods
Time (minutes)
Scanning Modeling Measuring Total
Deviation
analysis
30 (3 (each scan) *
10 (position) 60 10 100
Manual
inspection - - 90 90
Proposed
technique 5 - 0.5 5.5

Chapter 6. Application to Full-scale Precast Concrete Elements
121
6.3 Cloud-BIM based Inspection Data Storage and Management
Introduction of loud-BIM for QA of precast concrete element 6.3.1
Commercial BIM solutions, such as Autodesk Revit and Bentley Architecture, have ‘stand-
alone’ system framework and are developed specifically for visualizing project information (Chuang
et al. 2011). However, this nature of BIM solutions makes it difficult for participants from different
sites to access and update a common set of information, resulting in issues with communication and
information distribution. As an alternative, cloud-computing technology has gained much attention in
the BIM sector for its unique advantages when applied to management of BIM data. The most
common meaning of ‘cloud computing’ refers to the delivery of hosted IT services over the Internet
(Whatis.com 2009), so users can access these services without previous knowledge of managing the
required computing resources. Because of this unique feature, the cloud-BIM concept can change the
form of BIM computing framework from “stand-alone” to “host-based”. In addition, the cloud-BIM
concept offers many benefits, as it is economical, flexible and scalable. First, operating costs can be
significantly reduced, since virtualized servers and software built in a cloud-BIM require no physical
space to setup and is provided by ‘pay-as-you-go’ services. Second, the cloud-BIM concept allows for
more flexibility amongst the members of a project both in and out of the workplace, because they can
assess and share documents over the Internet almost anywhere. Third, the cloud-BIM concept offers
scalability because a project team can upscale and downscale IT requirements as needed.
Current data storage and delivery for QA of precast concrete elements is conducted based on
the following procedure (Yin et al. 2009): (1) certified inspection personnel monitor and record the
inspection results of specified checklists in the inspection form; and (2) once the QA is completed, the
inspector comes to the office and stores the inspection data of the inspection form in a database
system via a computer. The current data storage and delivery system, however, is inefficient due to the
duplicated process of recording the inspection data in both document and database forms. Moreover,
there is a possibility of data entry error and inspection form loss, as well as difficulties in interactively
updating and sharing the inspection data with other project participants who work in different places.
To overcome the limitations of the current data storage and delivery mechanism for QA of
precast concrete elements, a cloud-BIM system is proposed for effective and flexible data storage and
management of precast concrete QA. In terms of efficiency in data storage and delivery, the proposed
cloud-BIM system provides efficiency and flexibility over the current method. Therefore, it is
expected that the proposed cloud-BIM system adapting hosted IT services over the Internet has
potential as an efficient and effective data storage and delivery for QA of precast concrete elements.

Chapter 6. Application to Full-scale Precast Concrete Elements
122
Storage Module
(BIM Server)
Worker
Computing Module
Worker
MasterMaster
Master
Precast
Supplier
Inspector
Initial BIM
model (IFC file)
Inspection
result
Construction
Engineer
System architecture of the proposed cloud-BIM 6.3.2
Figure 6.17 System architecture of the proposed cloud-BIM based data storage and management for precast
concrete QA
Fig. 6.17 shows the system architecture of the proposed cloud-BIM based data storage and
management system for QA of precast concrete elements. In the system, three different parties
(precast supplier, inspector and construction engineer) are involved and designed for each party to
connect the cloud-BIM system through a master node. Here, the master node serves as a gateway like
web-browsers to the cloud-BIM system and do not store any QA data itself. Through the master node,
users from all three parties generate queries regarding the QA of precast concrete elements, which the
workers in the cloud-BIM execute. There are two workers in the cloud-BIM, which are namely
‘computing’ and ‘storage’ modules. In the computing model, once the automated data matching
process between the BIM model and the inspected QA data is complete, the IFC files are updated
based on the calculated discrepancy of QA data is performed. On the other hand, the storage module
can be regarded as the BIM server, which serves as a repository for data during a construction project,
including the BIM model of precast concrete elements and its updated IFC files.
The overall precast concrete QA data flow in the proposed cloud-BIM system can be
described as follows: (1) Precast element suppliers upload detailed information about the elements in
the cloud-BIM in the form of IFC after manufacture; (2) At the inspection site, inspectors obtain the
QA results of the precast elements after scanning and upload them into the cloud-BIM system. Here,

Chapter 6. Application to Full-scale Precast Concrete Elements
123
data type of the QA data is assumed to be a format familiar to inspectors; (3) In the computing module,
data matching process between the design BIM model stored in the storage module and the uploaded
QA data is carried out and the discrepancies are obtained and reflected on the updated IFC file; (4)
The decision of whether the inspected precast concrete element is acceptable or not is made by
comparing the discrepancy with the corresponding tolerances of the QA checklists in the computing
module; and (5) Finally, the accepted elements are delivered to the construction sites and construction
engineers assess the QA data via portable devices as needed with the aim of precise connection of the
accepted precast concrete elements.
Data matching method 6.3.3
In order to automatically conduct the decision-making of the precast element acceptance, a
data matching process that automatically extracts the required geometry information from the BIM
model and matches with the QA data is necessary. In this study, a data matching method, which is
undertaken in the computing module of the cloud-BIM system, is developed as shown in Fig. 6.18. In
this study, it is assumed that the dimensional (dimensions and positions) QA outcomes are stored in a
Figure 6.18 Data matching method between the QA results and the design BIM model for precast slab I
Length(mm)
Width (mm)
Position hori
(mm)
Position vert
(mm)
Slab 10619.5 1984.7
Sp 1 216.8 194.4 1200.1 248.0
Sp 2 216.9 196.2 1203.0 741.1
Sp 3 214.6 196.0 1201.5 736.6
Sp 4 215.1 196.4 1197.6 256.3
Sp 5 217.7 203.2 3845.7 237.3
Sp 6 219.4 199.9 3809.7 727.0
Sp 7 218.1 200.6 3798.3 728.0
Sp 8 217.5 200.5 3804.5 223.2
Sp 9 216.2 196.8 3792.4 240.6
Sp 10 218.4 196.9 3801.8 735.0
Sp 11 218.4 197.4 3805.6 727.1
Sp 12 221.4 197.6 3797.7 231.3
Sp 13 218.8 205.9 1207.8 241.2
Sp 14 217.6 204.7 1213.4 734.0
Sp 15 218.7 204.1 1203.5 709.1
Sp 16 219.6 203.4 1205.1 239.2
representation of geometry
representation of cross
section
representation of
outer/inner boundaries
Inspection Results
IFC File of Precast BIM Model
Data
Matching

Chapter 6. Application to Full-scale Precast Concrete Elements
124
template of CSV (Comma-Separated Values) file, and then uploaded into the cloud-BIM by the
inspectors. The design BIM model stored in IFC format stored in the BIM library is called up from the
computing module and an IFC parser is used to read and extract the IFC file associated with the
geometry data to be matched with the inspection results.
In an IFC file, elements of a structure are expressed by IFC entities which have a hierarchical
structure. For example, the IFC data representing a precast slab with several rectangle holes (shear
pockets) contains higher or lower level entities expressing specific information of the precast slab as
shown in Fig. 6.18. The IFC entity representing the geometry information of the precast slab is
IfcExtrudedAreaSolid (#298), meaning the 3D object created by extruding a cross section with a
sweeping direction. Here, the cross section stands for the horizontal cross section of the precast slab
model and the sweeping direction is the height direction perpendicular to the cross section. The cross
section is expressed with IfcArbitraryProfileDefWithVoids (#293), which means the two-dimensional
profiles of the closed holes. In this IFC model, the profile has two types of boundaries: (1) an outer
boundary which represents the outer edge of the precast slab; and (2) inner boundaries representing
the holes (shear pockets) within the slab. The outer boundary is expressed with IfcPolyline (#131) and
it contains the coordinate information of four corner points expressed with IfcCartesianPoint (#123,
#125, #127 and #129), and these four points are the corner points of the precast slab’s cross section to
be used for the data matching. In a similar manner, the inner boundaries are also expressed with
IfcPolyline (#141, #151…#291) and they are extracted for the data matching of dimensional
properties of the shear pockets. After extracting the desirable geometry information from the BIM
model based on the proposed data matching method, discrepancies of the dimensional QA data
between the BIM model and the inspected data is computed automatically and the decision on
whether the inspected precast element is acceptable or not is made based on the comparison results
between the discrepancies and the corresponding tolerances.

Chapter 6. Application to Full-scale Precast Concrete Elements
125
Extension of IFC file for the inspection QA data 6.3.4
Table 6.8 Properties of the proposed IFC property set “QualityAssessment”
Property Name Data Type Description
Checklists String Inspection checklists
Tolerance_Dimension double Allowable tolerance of precast slab
dimension
Tolerance_Position double Allowable tolerance of shear pocket
position
Discrepancy_Dimension double Dimension difference obtained from
data matching
Discrepancy_Position double Position difference from data matching
IsAccepted boolean Whether the precast slab is accepted or
not
Since the latest version of IFC schema (IFC 2ⅹ4) currently does not include information
regarding QA of precast concrete elements, an IFC extension containing a new property set and its
properties was proposed in this study to store the quality assessment information in IFC files. The
proposed property set is named ‘QualityAssessment’. As shown in Table 6.8, the property set consists
of six properties – QA checklists, dimensional tolerances, dimensional discrepancy and boolean-type
decision making result. The dimensional tolerances are defined as the allowable tolerances for each
checklist and these values are normally pre-determined prior to the launch of a construction project.
The dimensional discrepancy is the outputs of the data matching process discussed in the previous
section. The ‘IsAccepted’ property represents the decision of whether the inspected precast element is
accepted or not. In the IFC extension, an IFC parser executing the storing and retrieving of the QA
data of precast concrete elements was used to extend the proposed property set in IFC files.
Data matching and IFC extension result 6.3.5
Fig. 6.19 shows the data matching results between the BIM models and the as-built models
of both the precast slabs. The dimensional discrepancy is expressed by different colors based on the
distance between two groups of corner points. Note that the as-design boundary is drawn in blue and
the as-built boundary is drawn in red. The color filled between the as-design and as-built boundaries
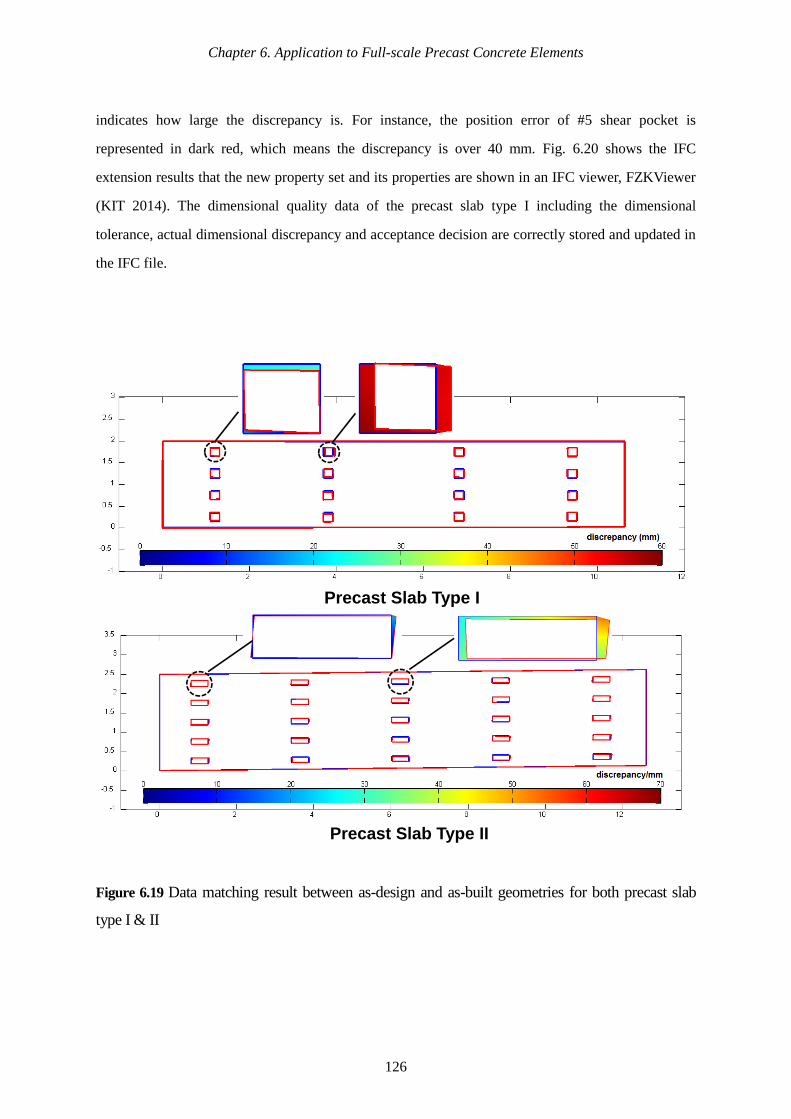
Chapter 6. Application to Full-scale Precast Concrete Elements
126
indicates how large the discrepancy is. For instance, the position error of #5 shear pocket is
represented in dark red, which means the discrepancy is over 40 mm. Fig. 6.20 shows the IFC
extension results that the new property set and its properties are shown in an IFC viewer, FZKViewer
(KIT 2014). The dimensional quality data of the precast slab type I including the dimensional
tolerance, actual dimensional discrepancy and acceptance decision are correctly stored and updated in
the IFC file.
Figure 6.19 Data matching result between as-design and as-built geometries for both precast slab
type I & II
Precast Slab Type I
Precast Slab Type II
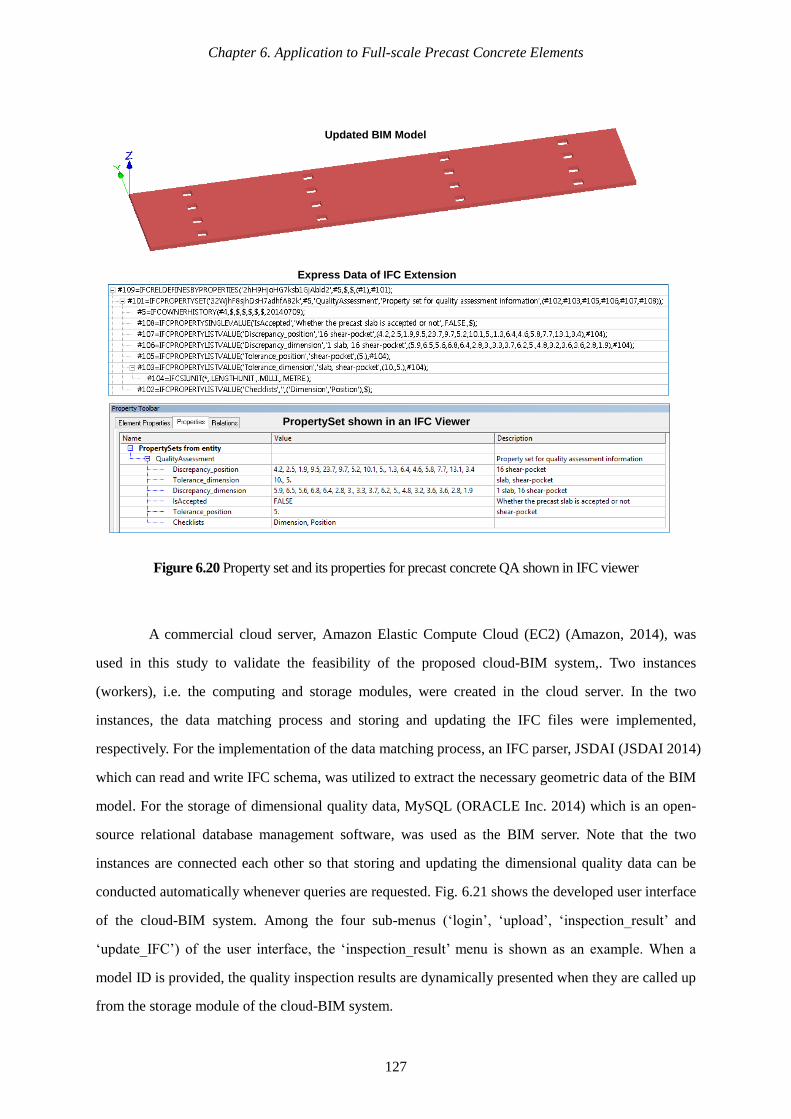
Chapter 6. Application to Full-scale Precast Concrete Elements
127
Figure 6.20 Property set and its properties for precast concrete QA shown in IFC viewer
A commercial cloud server, Amazon Elastic Compute Cloud (EC2) (Amazon, 2014), was
used in this study to validate the feasibility of the proposed cloud-BIM system,. Two instances
(workers), i.e. the computing and storage modules, were created in the cloud server. In the two
instances, the data matching process and storing and updating the IFC files were implemented,
respectively. For the implementation of the data matching process, an IFC parser, JSDAI (JSDAI 2014)
which can read and write IFC schema, was utilized to extract the necessary geometric data of the BIM
model. For the storage of dimensional quality data, MySQL (ORACLE Inc. 2014) which is an open-
source relational database management software, was used as the BIM server. Note that the two
instances are connected each other so that storing and updating the dimensional quality data can be
conducted automatically whenever queries are requested. Fig. 6.21 shows the developed user interface
of the cloud-BIM system. Among the four sub-menus (‘login’, ‘upload’, ‘inspection_result’ and
‘update_IFC’) of the user interface, the ‘inspection_result’ menu is shown as an example. When a
model ID is provided, the quality inspection results are dynamically presented when they are called up
from the storage module of the cloud-BIM system.
Express Data of IFC Extension
PropertySet shown in an IFC Viewer
Updated BIM Model
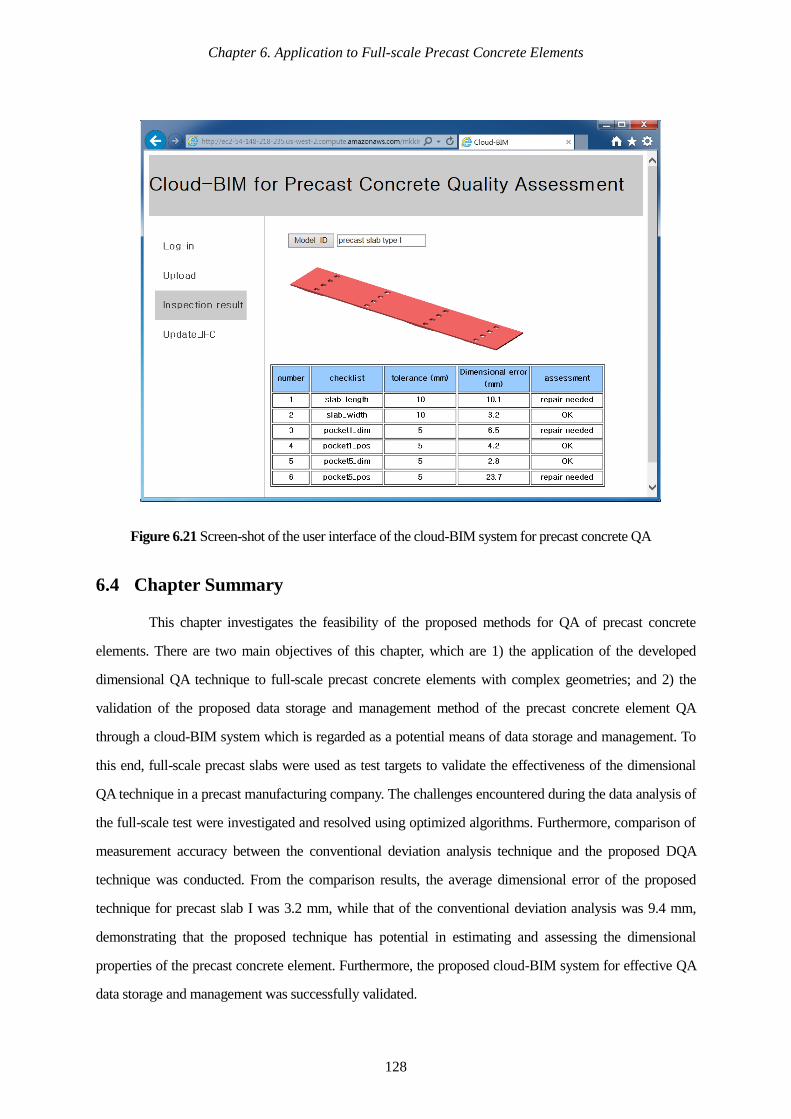
Chapter 6. Application to Full-scale Precast Concrete Elements
128
Figure 6.21 Screen-shot of the user interface of the cloud-BIM system for precast concrete QA
6.4 Chapter Summary
This chapter investigates the feasibility of the proposed methods for QA of precast concrete
elements. There are two main objectives of this chapter, which are 1) the application of the developed
dimensional QA technique to full-scale precast concrete elements with complex geometries; and 2) the
validation of the proposed data storage and management method of the precast concrete element QA
through a cloud-BIM system which is regarded as a potential means of data storage and management. To
this end, full-scale precast slabs were used as test targets to validate the effectiveness of the dimensional
QA technique in a precast manufacturing company. The challenges encountered during the data analysis of
the full-scale test were investigated and resolved using optimized algorithms. Furthermore, comparison of
measurement accuracy between the conventional deviation analysis technique and the proposed DQA
technique was conducted. From the comparison results, the average dimensional error of the proposed
technique for precast slab I was 3.2 mm, while that of the conventional deviation analysis was 9.4 mm,
demonstrating that the proposed technique has potential in estimating and assessing the dimensional
properties of the precast concrete element. Furthermore, the proposed cloud-BIM system for effective QA
data storage and management was successfully validated.

Chapter 7. Conclusion
129
7 CONCLUSION
7.1 Summary of the Work
This study explores intelligent precast concrete quality assessment (QA) system and it’s
technique based on 3D laser scanning and building information modeling (BIM) technology. The
specific objectives of this dissertation are (1) the development of a new dimensional and surface QA
technique, (2) the development of a BIM-based data storage and management framework for precast
concrete QA (3) scan parameter optimization of the dimensional QA technique for accurate precast
concrete QA and (4) validation through field tests for real applications.
Objective (1)
Dimensional and surface QA techniques have been successfully developed. First, a new dimensional
assessment technique that automatically assesses the dimensional qualities of precast concrete
elements whether the dimensional quality is within the tolerances have been developed using a 3D
laser scanner. A robust edge extraction algorithm, which is able to extract only the scan points within
the edges of a target precast concrete element, is developed based on the unique spatial alignment of
scan points captured from the laser scanner. Experimental tests on a lab scale specimen as well as lab
scale actual precast concrete elements have been performed to validate the effectiveness of the
proposed dimensional QA technique. Second, a new surface QA technique that simultaneously
localizes and quantifies surface defects of precast concrete surfaces has been developed. For the
surface QA technique, two defect sensitive features with complementary properties, have been
extracted and combined for improved localization and quantification of surface defects. A defect
classifier has been also developed to automatically diagnose whether the investigated surface region is
damaged, where the defect is located, and how large it is. Numerical simulations and experiments
have been conducted for validation of the developed surface QA technique. The details of two QA
techniques and its validation tests are described in Chapters 2 and 3, respectively.
Objective (2)
The BIM-based data storage and management framework for the QA of precast concrete elements has
Chapter 7. Conclusion
130
been developed. The framework has been developed to answer four essential questions for precast
concrete QAs, which are (1) what the QA checklists should be, (2) what QA procedure should be
employed, (3) which kind of laser scanner is appropriate and which scan parameters are most
appropriate for the intended specific QA, and (4) how the inspected QA data can be effectively stored
and delivered. The proposed framework has focused on dimensional and surface QAs and the
feasibility of the framework for dimensional and surface QAs of precast concrete elements have been
investigated through case studies. The results of the case studies have been described in Chapter 4.
Objective (3)
Optimal scan parameter selection has been successfully conducted. The method of selecting optimal
scan parameters of a laser scanner has been proposed in order to ensure that the developed
dimensional QA technique provides satisfactory measurement accuracy regardless of scan parameters.
A laser beam model that estimates the laser beam position of the laser scanner have been developed
by constructing the geometric position of a laser beam and incorporating the measurement noise of the
laser beam into the mathematical estimated position of the laser beam. The developed laser beam
model has been successfully validated by comparing it with experiment data. The details of
parametric studies based the developed model for finding optimal scan parameters have been
described in Chapter 5.
Objective (4)
The applicability of the dimensional QA technique to full-scale precast slabs has been investigated.
First, two types of full-scale precast concrete slabs with complex geometries have been scanned in a
precast concrete factory and dimensional QA checklists including dimensions and positions have been
inspected. For this filed test, new algorithms have been developed to tackle obstacles created by large-
scale implementations. A comparison test with the conventional deviation analysis has been conducted
and the robustness of the developed dimensional QA technique has been successfully demonstrated.
Second, a cloud-BIM based web-service for effective storage and management of precast concrete QA
data have been developed. The details of the field test results and the cloud-BIM platform have been
described in Chapter 6.

Chapter 7. Conclusion
131
7.2 Uniqueness of the Work
The unique contributions of this work are summarized as follows:
(1) Development of automated dimensional and surface quality assessment techniques
In contrast with the conventional manual inspection approaches for precast concrete quality
assessment, automated and remote dimensional and surface quality assessment techniques specially
developed for precast concrete elements provide fast non-contact measurement. New coordinate
transformation and edge extraction algorithms are developed for automated and complete dimensional
quality assessment, and unique defect sensitive features and a new recursive algorithm are developed
for improved localization and quantification of surface defects. The developed complete and
automated dimensional and surface quality assessment techniques significantly reduce the burdens of
the conventional manual inspection.
(2) Development of the framework for systematic dimensional and surface quality assessment
The systematic quality inspection and assessment of precast concrete elements is challenging through
conventional manual inspection in terms of time and cost. The developed framework for quality
assessment of precast concrete elements overcomes these limitations by answering the essential
questions raised during real application. This framework systematically illustrates how dimensional
and surface quality assessment for precast concrete elements can be implemented and how the
inspection data can be stored and managed by combining laser scanning and building information
modeling technology, resulting in efficient and effective quality assessment.
(3) Field tests for real applications
The feasibility tests of the proposed dimensional quality assessment technique are carried out on full-
scale precast slabs. The field test on two types of precast slabs with complex geometry is a unique
opportunity given by the research project. Through the real and unique experiments, the feasibility of
the proposed dimensional quality assessment technique is successfully investigated and practical
issues of the proposed technique are found. Furthermore, a comparison test with the conventional
deviation analysis demonstrates the robustness of the developed dimensional quality assessment
technique. In addition, the feasibility of the cloud-BIM system is investigated via commercial cloud
services.

Chapter 7. Conclusion
132
7.3 Future Work
It is expected that applications of the proposed quality assessment techniques and its data
management system will be successful in effecting rapid and precise construction in the precast
concrete industry. However, there are still several issues in this research, which are topics for future
research. Ongoing efforts are briefly summarized below.
(1) Improvement of applicability of the dimensional and surface QA techniques
The proposed dimensional and surface QA techniques are currently limited to precast concrete
elements with a nearly rectangular-shape and a uniform thickness. To improve and validate the
performance of the proposed techniques for real applications, further validations are still needed for
other types of precast concrete elements with more complex geometries such as curved and diamond
shapes. Moreover, the scope of this research for QA inspection of precast concrete elements was
limited to dimensions, positions and squarenesses for dimensional QA and spalling defects for surface
QA. Further investigation on other QA checklists such as flatness, warping and distortion is necessary.
In addition, the proposed dimensional and surface QA techniques are implemented on only the top
surfaces of precast concrete elements. To make the proposed techniques to be promising solutions for
QA of precast concrete elements, further validation of the techniques on the side parts of precast
concrete elements is necessary.
(2) Reduction of implementation time of the QA techniques
Although the proposed dimensional and surface QA techniques require less implementation time than
conventional methods - manual inspection and the deviation analysis, implementation time needs to
be further reduced so the productivity of the precast concrete element QA is enhanced. To achieve this
demand, the algorithms of the QA techniques should be improved in a way that those are
implemented quickly, and code transformation from the current program language to C is necessary.
Furthermore, algorithm comparison with Point Cloud Library (PCL) will be conducted to investigate
the difference of algorithm performances and implementation times.

Chapter 7. Conclusion
133
(3) Improvement of the QA data management system
Implementation of the proposed QA data storage and delivery system for field tests was performed
using a cloud server with a low-capacity, since this study focuses on the QA data of precast concrete
elements and uses only two types of precast slabs. However, since the proposed QA data storage and
delivery system operates based on all kinds of information of precast concrete elements and there are
various types of precast concrete elements in real situations, an appropriate-capacity cloud server
which accounts for these factors should be selected and used. In addition, it seems that the proposed
IFC-file based scheme for precast concrete element QA requires large data capacity due to the
voluminous IFC schema, so more efficient and effective means of QA data storage and management
instead of IFC format needs to be considered. Lastly, the proposed cloud-BIM system should be
realized in a prototype by improving the contents of the web-service.

Chapter 7. Conclusion
134

135
REFERENCES
[1] Abdel-Qader, I., Pashaie-Rad S., Abudayyeh O., and Yehia, S. (2006). “PCA-Based algorithm
for unsupervised bridge crack detection” Advanced Engineering Software, 37(12), pp. 771-778.
[2] Adams, M.D. and Probert, P.J. (1996). “The interpretation of phase and intensity data for AMCW
light detection sensors for reliable ranging” International Journal of Robotics Research, 15(5), pp.
441–458.
[3] AGPL v3 (2014), (URL http://www.jsdai.net/home).
[4] Amazon Elastic Compute Cloud (EC2), Amazon Inc., 2014 (URL http://aws.amazon.com/ ec2/)
[5] American Concrete Institute (ACI) (1998). Identification and Control of Visible Effects of
Consolidation on Formed Concrete Surfaces. ACI Committee 309.
[6] Akinci, B., Boukamp, F., Gordon, C., Huber, D., Lyons, C., and Park, K. (2006). “A formalism
for utilization of sensor systems and integrated project models for active construction quality
control” Automation in Construction, 15 (2), pp. 124-138.
[7] Alda, J. (2003) “Laser and Gaussian beam propagation and transformation, Encyclopedia of
Optical Engineering, Marcel Dekker, New York, pp. 999–1013.
[8] Allen, E.A. (2009). Fundamentals of building construction materials and methods. John Wiley &
Sons, New Jersey.
[9] Althaus, P., and Christensen, H. (2003) “Behaviour coordination in structured environments”
Advanced Robotics, 17(7), pp. 657-674.
[10] Amazon Elastic Compute Cloud (Amazon EC2) (2014) (URL https://aws.amazon.com/ec2/).
[11] Amenta, N., and Bern, M. (1999) “Surface reconstruction by Voronoi filtering” Discrete
Computer Geometry, 22, pp. 481-504.
[12] Anil, E., Akinci, B., and Huber, D. (2011). “Representation requirements of as-is building
information models generated from laser scanned point cloud data” 28th International
Symposium on Automation and Robotics in Construction.
[13] Aram, S., Eastman, C., Sacks, R. (2013). “Requirements for BIM platforms in the concrete
reinforcement supply chain” Automation in Construction, 35, pp. 1-17.
[14] Arditi, D., Ergin, U., and Gunhan, S. (2000). “Factors affecting the use of precast concrete
systems.” Journal of Architectural Engineering, 6(3), pp. 79-86.
[15] Autodesk Building Solutions Revit architecture, Autodesk Inc., 2014 (URL
http://www.autodesk.com/products/autodesk-revit-family/overview/)
[16] Ballard, D.H. (1981) “Generalizing the Hough transform to detect arbitrary shapes” Pattern
Recognition, 13 (2), pp. 111-122.
[17] Barber, P., Sheath, D., Tomkins, C., Graves, A. (2000) “The cost of quality failures in major civil

136
engineering projects” International Journal of Quality Reliability Management 17(4/5), pp. 479-492.
[18] Barazzetti, L. and Scaiono, M. (2009). “Crack measurement: Development, testing and
applications of an automatic image-based algorithm.” J. Photogramm. Remote Sens., 64(3), pp.
285-296.
[19] Becker,S., and Haala, N. (2007) “Refinement of building facades by integrated processing of
LiDAR and image data” The International Archives of the Photogrammetry, Remote Sensing and
Spatial Information Sciences 36 (Part 3/W49A), pp. 7–12.
[20] Bernardini, F., and Rushmeier, H. (2002) “The 3D model acquisition pipeline” Computure
Graphics Forum, 21 (2), pp. 149-172.
[21] Bhandarkar, S. M., Luo, X., Daniels, R., and Tollner, E. W. (2005) “Detection of cracks in
computer tomography images of logs” Pattern Recognition. Letter, 26(14), pp. 2282-2294.
[22] Bilsmas, N., Pasquire, C. and Gibb, A. (2006) “Benefit evaluation for off-site production in
construction” Construction Management Economics, 24 (2), pp. 121-130.
[23] Bo hler, W., Bordas Vicent, M. and Marbs, A. (2003) “Investigating laser scanner accuracy”
International Archives of Photogrammetry. Remote Sensing and the Spatial Information Sciences,
34(5/C15), pp. 696–701.
[24] Borah, D.K. and Voelz, D.G. (2007) “Estimation of laser beam pointing parameters in the
presence of atmospheric turbulence” Applied Optics, 46(23), pp. 6010–6018.
[25] Bosche, F. (2010) “Automated recognition of 3D CAD model objects in laser scans and
calculation of as-built dimensions for dimensional compliance control in construction” Advanced
Engineering Informatics, 24, pp. 107-118.
[26] Boyer, K. L. and Ozguner, T. (2001) “Robust online detection of pipeline corrosion from range
data” Vision Application, 12, pp. 291-304.
[27] Brosnan,T.and Sun, D “Improving quality inspection of food products by computer vision – a
review” Journal of Food Engineering, 61, pp. 3-16.
[28] Burati, J.L., and Farrington, J.J. (1987), Construction Industry Institute – Costs of Quality
Deviations in Design and Construction, Bureau of Engineering Research, University of Texas at
Austin.
[29] Canny, J. (1986) “A computational approach to edge detection” IEEE Transation Pattern
Analysis and Machine Intelligent, 8, pp. 679-698.
[30] CIRIA (Construction Industry Research and Information Association) (1999), Standardization
and Pre-Assembly Adding Value to Construction Projects, Report 176, London.
[31] Construction Industry Institute (CII) (2005), Making zero rework a reality, The Univ. of Texas at
Austin, Report 203-1.
[32] Chuang T.H, Lee, B.C., Wu, I.C. (2011). “Applying cloud computing technology to BIM

137
visualization and manipulation” The 28th international Symposium on Automation and Robotics
in Construction (ISARC), Seoul, Korea.
[33] Dey, T.K. (2007), Curve and surface reconstruction: algorithms with mathematical analysis,
Cambridge University Press.
[34] FARO, Focus-3D Technical Specification, FARO Inc., 2014 (URL
http://www.faro.com/products/3d-surveying/laser-scanner-faro-focus-3d/overview/)
[35] Fischler, M. and Bolles, R. (1981) “Random Sample Consensus: A Paradigm for Model Fitting
with Applications to Image Analysis and Automated Cartography” Communications of the ACM,
24(6), pp. 381–395.
[36] Geomagic Studio, Geomagic Inc., 2014 (URL
http://www.geomagic.com/en/products/studio/overview/)
[37] Godbaz, J.P., Cree, M.J., and Dorrington, A.A. (2008) “Mixed pixel return separation for a full-
field ranger” Proceedings of Image and Vision Computing New Zealand 2008 (IVCNZ’08), pp.
1–6.
[38] Goedert, J., and Meadati, P. (2008). “Integrating construction process documentation into
building information modeling.” Journal of Construction Engineering Management, 134(7), pp.
509–516.
[39] Golovinskiy, A., Kim,V., and Funkhouser, T. (2009) “Shape-based recognition of 3D point
clouds in urban environments” Proceedings of International Conference on Computer Vision
(ICCV).
[40] Gordon, S., Lichti, D.D., Franke, J., and Stewart, M.P. (2004). “Measurement of structural
deformation using terrestrial laser scanners.” 1st FIG International Symposium on Engineering
Surveys for Construction Works and Structural Engineering, Copenhagen, Denmark.
[41] Gordon, S., Lichti, D. (2007) “Modeling terrestrial laser scanner data for precise structural
deformation measurement” Journal of Surveying Engineering, 133(2), pp. 72-80.
[42] GSA, (2009) “GSA BIM Guide For 3D Imaging, version 1.0.” vol. 3 http://www.gsa.gov/bim:
U.S. General Services Administration (GSA).
[43] Guerra, E. and Villalobos, J. R. (2001) “A three-dimensional automated visual inspection system
for SMT assembly” Computer Industry Engineering, 40(2), pp. 175-190.
[44] Gumhold, S., Wang, X., and Macleod, R. (2001) “Feature extraction from point clouds”
Proceedings of 10th International Meshing Roundtable, Sandia National Laboratory, October, pp.
293-305.
[45] Hahnel, D., Burgard, W., Thrun, S. (2003) “Learning compact 3D models of indoor and outdoor
environments with a mobile robot” Robotic Automation Systems, 44, pp. 15-27.
[46] Hajian, H. and Becerik-Gerber, B. (2009) “A research outlook for real-time project information
management by integrating advanced field data acquisition systems and building information

138
modeling” Proceedings of Computing in Civil Engineering, pp. 83-94.
[47] Han, S., Choe, H., Kim, S. et al. (2013) “Automated and efficient method for extraction of tunnel
cross sections using terrestrial laser scanned data” Journal of Compting in Civil Engineering,
27(3), pp. 274-281.
[48] Hebert, M., and Krotkov, E. (1991) “3-D measurements from imaging laser radars: how good are
they?” Proceedings of the IEEE/RSJ International Workshop on Intelligent Robots and Systems
IROS’91, IEEE, Osaka, Japan, pp. 359-364.
[49] Hoefle, B., Pfeifer, N. (2007) “Correction of laser scanning intensity data: data and model-driven
approach”. ISPRS Journal of Photogrammetry and Remote Sensing, 62(6), pp. 415–433.
[50] Hejbudzka K., Lindenbergh, R., Soudarissanane S., Humme, A. (2010) “Influence of an
atmospheric conditions on the range distance and number of returned points in Leica scanstation
2 point clouds” International Archives of Photogrammetry, Remote Sensing and Spatial
Information Sciences, XXXVIIII Part 5, pp. 282-286.
[51] Hoppe, H., DeRose, T., Duchamp, T., McDonald, J., and Stuetzle, W. (1992) “Surface
reconstruction from unorganized points” Proceedings of Computer Graphics (SIGGRAPH ’92
Proceedings) 26, pp. 71-78.
[52] Hutchinson, T. and Chen, Z. (2006) “Improved image analysis for evaluating concrete damage”
Journal of Compting in Civil Engineering, 20(3), pp. 210-216.
[53] ISO, 9001 (2008), Quality Management Systems, International Organization for Standardization,
Reported by ISO committee.
[54] Jaillon, L., Poon, C.S., and Chiang, Y.H. (2009) “Quantifying the waste reduction potential of
using prefabrication in building construction in Hong Kong” Waste Management. 29 (1), pp.309-
320.
[55] Jelalian (1992), Laser radar systems. Artech House.
[56] Jeong, Y.S., Eastman, C.M., Sacks,R., and Kaner, I. (2009) “Benchmark tests for BIM data
exchanges of precast concrete” Automation in Construction, 18, pp.469-484.
[57] Josephson, P.E., and Hammarlund, Y. (1999) “The causes and costs of defects in construction: A
study of seven building projets” Automation in Construction, 8 (6), pp. 681-487.
[58] JSDAI V4.1.3, 2014 (URL http://www.jsdai.net/)
[59] Kaasalainen, S., Krooks, A., Kukko, A., Kaartinen, H. (2009) “Radiometric calibration of
terrestrial laser scanners with external reference targets” Remote Sensing, 1(3), pp. 144–158.
[60] Kazaz, A. and Ulubeyli, S. (2006). "Physical factors affecting productivity of Turkish
construction workers." 22th Annual Association of Researchers in Construction Management
(ARCOM) Conference, 4-6 September 2006, Birmingham, UK, pp. 29-37.
[61] Kim, C., Son, H., Kim, C. (2013) “Automated construction progress measurement using a 4D

139
building information model and 3D data” Automation in Construction, 31, pp.75-82.
[62] FZKViewer, KIT (Karlsruhe Institute of Technology), 2014 (URL http://iai-
typo3.iai.fzk.de/www-extern/index.php?id=1931&L=1)
[63] Koch, G.M,. and Brilakis, I. (2011) “Pothole detection in asphalt pavement images” Advanced
Engineering Informatics, 25, pp. 27-34.
[64] Laefer, D., Fitzgerald, M., Maloney, E., Coyne, D., Lennon, D., and Morrish, S. (2009) “Lateral
image degradation in terrestrial laser scanning” Structural Engineering International, 19(2), pp.
184-189.
[65] Latimer, D., Gujar, S., Garrett, J., Akinci, B., Thayer, S., and Paredis, C. (2002), Running surface
assessment technology review, ICES Research Project Report, Carnegie Mellon University, Pittsburgh.
[66] Leader, J.C. (1979) “Analysis and prediction of laser scattering from rough-surface materials”
Journal of the Optical Society of America, 69, pp. 610–628.
[67] Leica Cyclone - 3D point cloud processing software, Leica Geosystems Inc., 2014 (URL
http://hds.leica-geosystems.com/en/Leica-Cyclone_6515.htm)
[68] Lichti, D.D. (2007) “Error modeling, calibration and analysis of an AM-CW terrestrial laser
scanner system” ISPRS Journal of Photogrammetry and Remote Sensing 61(5), pp. 307-324.
[69] Lichti, D.D., Gordon, S.J., and Tipdecho, T. (2005) “Error models and propagation in directly
georeferenced terrestrial laser scanner networks” Journal of Surveying Engineering, 131(4), pp.
135-142.
[70] Lichti, D.D. and Jamtsho, S. (2006) “Angular resolution of terrestrial laser scanners” The
Photogrammetric Record, 21(114), pp. 141–160.
[71] Lindenbergh, R., Pfeifer, N., Rabbani, T. (2005) “Accuracy analysis of the Leica Hds3000 and
feasibility of tunnel deformation monitoring” International Society for Photogrammetry and
Remote Sensing (ISPRS) Workshop Laser scanning, Enschede, the Netherlands, pp. 24–29.
[72] Liu, W., Chen, S., and Hauser, E. (2011) “Lidar-based bridge structure defect detection”
Experimenal Techniques, 35(6), pp.27-34.
[73] Love, P., and Li,H. (2000) “Quantification of causes and costs of rework in construction”
Construction Management and Economics, 18(4), pp.479-490.
[74] McGraw-Hill Construction. (2009). “The business value of BIM—Getting building information
modeling to the bottom line.” The McGraw-Hill Companies, New York.
[75] Mills, A., Love, P., and Williams, P. (2009) “Defect costs in residential construction” Journal of
Construction Engineering and Management, 135(1), pp. 12-16.
[76] Mizoguchi T., Koda, Y., Iwaki, I., et al. (2013). “Quantitative scaling evaluation of concrete
structures based on terrestrial laser scanning.” Automation in Constion, 35, pp. 263-274
[77] MySQL, ORACLE Inc., 2014 (URL http://www.mysql.com/)

140
[78] Olsen, N.J., Chen, Z., Hutchinson, T., and Kuester, F. (2013). “Optical techniques for multiscale
damage assessment.” Geomatic Natural Hazards and Risk, 4 (1), pp. 49-70.
[79] Newman, T. S., and Jain, A. K. (1995) “A survey of automated visual inspection” Computer
Vision and Image Understanding, 61(2), pp. 231-262.
[80] Ohtake, Y., Belyaev, A., Seidel, H. P. (2004) “ Ridge-valley lines on meshes via implicit surface
fitting” ACM Transaction Graphics, 23, pp. 609-612.
[81] Olsen, M.J., Kuester,F., Chang, B.J., and Hutchinson, T.C. (2010) “Terrestrial laser scanning-
based structural damage assessment” Journal of Computing in Civil Engineering, 24 (3), pp. 264-
272.
[82] Ordonez, C., Arias, P., Herraez, J. et al. (2008) “Two photogrammetric methods for measuring
flat elements in buildings under construction” Automation in Construction, 17, pp. 517-525.
[83] Park, H.S., Lee, H.M., and Adeli, H. (2007) “A new approach for health monitoring of structure:
Terrestrial laser scanning” Computer-Aided Civil Infrastructure Engineering, 22, pp. 19-30.
[84] Pauly, M., Keiser, R., Kobbelt L., and Gross, M. (2003) “Shape modeling with point-sampled
geometry” ACM Transactions on Graphics, 22(3), pp. 641-650.
[85] PCI (2000), Tolerance manual for precast and prestressed concrete construction,
Precast/Prestressed Concrete Institute, Reported by PCI committee.
[86] Pfeifer, N., Dorninger, P., Haring, A., Fan, H. (2007) “Investigating terrestrial laser scanning
intensity data: Quality and functional relations, In: Proceedings of the VIII conference on Optical
3D measurement tech., Zurich,, Switzerland, pp. 328–337.
[87] Pfeifer, N., Höfle, B., Briese, C., Rutzinger, M., Haring, A. (2008) “Analysis of the backscattered
energy in terrestrial laser scanning data” International Archives of Photogrammetry Remote
Sensing 37, pp. 1045–1052.
[88] Pesci, A. and Teza, G. (2008) “Effects of surface irregularities on intensity data from laser
scanning: an experimental approach” Annals of Geophysics, 51(5/6), pp. 839–848
[89] Phares, B., Washer, G., Rolander, D., Graybeal, B., and Moore, M. (2004) “Routine highway
bridge inspection condition documentation accuracy and reliability” Journal of Bridge
Engineering, 9 (4), pp.403-413.
[90] Pheng, L.S., and Chuan, C.J. (2001) “Just-in-time management of precast concrete components”
Journal of Construnction Engineering and Management, 127 (6), pp. 494-501.
[91] Portland Cement Association (PCA). (2001). Concrete slab surface defects: Causes, prevention,
and repair, Skokie, Ill. IS177.
[92] Priestnall, G., Jaafar, J., and Duncan, A. (2000) “Extracting urban features from LiDAR digital
surface models” Computers Environment Urban System, 24, pp. 65-78.
[93] Pu, S., and Vosselman, G. (2009) “Knowledge based reconstruction of building models from

141
terrestrial laser scanning data” ISPRS Journal of Photogrammetry and Remote Sensing, 64(6), pp.
575-584.
[94] Randall, T. (2011) “Construction engineering requirements for integrating laser scanning
technology and building information modeling” Journal of Construction Engineering and
Management, 137(10), pp. 797-805.
[95] Rees, W.G., (2001) “Physical Principles of Remote Sensing” Scott Polar Research Institute,
Cambridge.
[96] RIEGL (2014), VZ-6000 Technical Specification, RIEGL Inc., 2014 (URL
http://www.riegl.com/nc/products/terrestrial-scanning/)
[97] Rinaldi, A., Krajcinovic, D., Mastilovic, S. (2007) “Statistical damage mechanics and extreme
value theory” International Journal of Damage Mechanics, 16(1), pp. 57-76.
[98] Sacks, R., Eastman, C.M., and Lee, G. (2004) “Process model perspectives on management and
engineering procedures in the precast/prestressed concrete industry” Journal of Construction
Enginerring Management, 130 (2), pp. 206-215.
[99] Shakarji, C. (1998) “Least-squares fitting algorithms of the NIST algorithm testing system”
Journal of Research of National Institute of Standard and Technology, 103(6), pp. 633-641.
[100] Shih, N.J., and Wang, P.H. (2004) “Using point cloud to inspect the construction quality of wall
finish” 22nd eCAADe Conference, Copenhagen, Denmark, pp. 573-578.
[101] Shin, H., and Dunston, P.S. (2009) “Evaluation of augmented reality in steel column inspection”
Automation in Construction, 18, pp. 118-129.
[102] Son, S., Park, H., and Lee, K. H. (2002) “Automated laser scanning system for reverse
engineering and inspection” International Journal of Machine Tools and Manufacture, 42(8), pp.
889-897.
[103] Soudarissanane, S., Lindenbergh,,R., Menenti, M., and Teunissen, P. (2011) “Scanning geometry:
Influencing factor on the quality of terrestrial laser scanning points” ISPRS Journal of
Photogrammetry and Remote Sensing, 66, pp. 389-399.
[104] Su, L. (1999). “The relevance of recall and precision in user evaluation.” Journal of American
Society for Information Science, 45(3), pp. 207-217.
[105] Suwwanakarn, S., Zhu, Z., and Brilakis, I. (2007). “Automated air pockets detection for
architectural concrete inspection.” Proceedings of Construction Congress I, American Society of
Civil Engineers (ASCE), Reston, VA, USA.
[106] Tam, V. W. Y.; Tam, C. M.; Zeng, S. X., and Ng, W. C. Y. (2007) “Towards adoption of
prefabrication in construction” Building and Environment, 42(10), pp. 3642-3654.
[107] Tang,P., Akinci, B., and Huber, D. (2009) “Quantification of edge loss of laser scanned data at
spatial discontinuities” Automation in Construction, 18 (8), pp. 1070-1083.
[108] Tang, P., and Alaswad, F.S. (2012) “Sensor modeling of laser scanners for automated scan

142
planning on construction jobsites” Proceedings of Construction Research Congress (CRC), pp.
1021-1031.
[109] Tang, P., Huber, D. and Akinci, B. (2007) “A comparative analysis of depth discontinuity and
mixed pixel detection algorithms” 6th International Conference on 3-D Digital Imaging and
Modeling, IEEE, Montreal, Quebec, Canada, pp. 29-38
[110] Tang, P., Huber, D., and Akinci, B. (2011) “Characterization of laser scanners and algorithms for
detection flatness defects on concrete surfaces” Journal of Computing in Civil Engineering, 25
(1), pp. 31-42.
[111] Tang, P., Huber, D., Akinci, B., Lipman, R., and Lytle, A. (2010) “Automatic reconstruction of
as-built building information models from laser-scanned point clouds: A review of related
techniques” Automation in Construction, 19, pp. 829-843.
[112] Tekla Structures (2014), Tekla Inc., (URL http://www.tekla.com/products/tekla-structures)
[113] Teza, G., Galgaro, A., and Moro, F. (2009) “Contactless recognition of concrete surface damage
from laser scanning and curvature computation” NDT&E International, 42 (4), pp. 240-249.
[114] The BuildingSMART Alliance, 2014 (URL http://www.buildingsmartalliance.org/)
[115] The Georgia Department of Transportation (The GDT) (2011), Quality control and quality
assurance of precast/prestressed concrete members and structural precast concrete members.
[116] Triebel, R., Kersting, K., and Burgard, W. (2006) “Robust 3D scan point classification using
associative markov networks” Proceedings of the IEEE International Conference on Robotics and
Automation, Orlando, USA, pp. 2603-2608.
[117] Truong-Hong, L., Laefer, D., Hinks, T., and Carr, H. (2012) “Flying Voxel Method with
Delaunay Triangulation Criterion for Façade/Feature Detection for Computation” Journal of
Computing in Civil Engineering, 26(6), pp. 691-707.
[118] UNEP Report. (2002). Industry as a partner for sustainable development: Construction.
Confederation of International Contractors' Associations, UK.
[119] Voisin, S., Foufou, S., Truchetet, F., Page, D., Abidi, M. (2007) “Study of ambient light influence
for three-dimensional scanners based on structured light” Optical Engineering, 46(3), 030502-1–
030502–3.
[120] Vosselman, G., Maas, H-G. (2010), Airborne and terrestrial laser scanning, Whittles Publishing,
Dunbeath.
[121] Venugopal, M., Eastman, C.M., Sacks, R., and Teizer, J. (2012) “Semantics of model views for
information exchanges using the industry foundation class schema” Advanced Engineering
Informatics, 26(2), pp. 411-428.
[122] Wong, R., Hao, J.L., and Zou, P.X.W. (2003) “The application of precast concrete technology in
buildings and civil structures construction: Hong Kong experience” 21st Century (CITC-II),
Sustainability and Innovation in Management and Technology, Hong Kong, China, pp. 629–634.

143
[123] Yastikli, N. (2007) “Documentation of cultural heritage using digital photogrammetry and laser
scanning” Cultural Heritage, 8(4), pp. 423-427.
[124] YEMAR Report. (2006). Turkish construction sector report. Yemar, Istanbul (in Turkish).
[125] Yee, A.A. (2001) “Structural and economic benefits of precast/prestressed concrete construction”
PCI Journal, pp. 34-42.
[126] Yin, S.Y.L., Tserng, H.P., Wang, J.C., and Tsai, S.C. (2009) “Developing a precast production
management system using RFID technology” Automation in Construction, 18, pp. 677-691.
[127] Zhu, Z. and Brilakis, I. (2010) “Machine vision-based concrete surface quality assessment”
Journal of Construction Engineering Management, 136(2), pp. 210-218.
[128] Zhuang, H. and Roth, Z.S. (1995) “Modeling gimbal axis misalignments and mirror center offset
in a single-beam laser tracking measurement system” The International Journal of Robotics
Research, 14 (3), pp. 211–224.

144

145
SUMMARY (IN KOREAN)
레이저 스캐닝 및 빌딩 정보 모델링을 활용한 비접촉식
프리캐스트 콘크리트부재 품질평가
최근 교량 및 빌딩 건설에 있어 공기단축 및 비용절감을 이유로 프리캐스트 콘리리트부재의
수요가 늘어나고 있다. 프리캐스트 부재 기반의 급속, 정밀 시공을 위해 부재의 품질검사가
필수적으로 수행되고 있지만, 현재의 품질검사는 대부분 인력에 의존하고 있어 시간 및 비용이
많이 소요되고 있다. 또한 건설 데이터의 저장 및 관리에 있어, 최근 빌딩 정보 모델링(BIM)
기술이 데이터의 지능형 관리를 목적으로 건설산업 전반에 보급화되기 시작하면서 프리캐스트
콘크리트 부재의 품질관리에 BIM 과 연계한 지능형 데이터 관리 시스템이 요구되고 있다. 이에
본 논문에서는 프리캐스트 콘크리트부재의 지능화된 품질검사 및 관리를 위해, 3 차원 레이저
스캐닝 및 BIM 기반의 품질검사 기법과 그 시스템을 개발하였다. 본 논문에서는 다음의 네 가지
목표를 위해 연구를 수행하였다: (1) 치수 및 표면결함 검사기법 개발, (2) 레이저 스캐닝 및
BIM 기반의 지능형 품질관리 체계(framework) 개발, (3) 향상된 품질검사를 위한 스캔
파라미터 최적화, (4) 실 프리캐스트 부재에 대한 적용성 검토.
첫째, 프리캐스트 콘크리트부재 치수 및 표면결함 검사기법을 개발하였다. 먼저
치수(dimensional) 검사기법은 레이저 스캔 데이터로부터 자동화된 치수 측정을 위해 좌표변환
알고리즘 및 가장자리 점(edge-scan points)만을 추출하는 벡터 합(vector-sum) 알고리즘을
개발하였고, 레이저 스캐너의 계측 원리에 의해 불가피하게 발생하는 모서리(edge) 치수손실을
보상하기 위해 모서리 치수손실 보상모델을 개발하여 치수 품질검사의 정확성을 높였다. 개발된
치수 검사기법의 검증을 위해 다양한 실험실 규모의 실험을 수행하였다. 다음으로, 프리캐스트
콘크리트부재의 표면결함(surface defect) 검사기법을 개발하였다. 표면결함의 위치 및 손상
정도를 정량적으로 검사하기 위하여 계측된 3 차원 계측정보에서 표면결함에 민감한
특징(feature) 정보들을 추출하였으며, 검사의 정확도 향상을 위해 추출된 각 특징정보를
융합하여 지수화한 융합 손상지수를 개발하였다. 또한 개발된 표면결함 검사기술의 자동화를
위하여 확률론적 표면결함 분류기(defect classifier)를 개발하였다. 개발된 표면결함 검사기법의
검증을 위하여 시뮬레이션 및 실험실 규모의 실험을 수행하였으며, 손상크기 및 깊이가 2 mm
이상의 표면손상에 대하여 그 손상위치와 손상정도를 정확하게 계측할 수 있음을 알 수 있었다.
둘째, 레이저 스캐닝 및 BIM 기반의 지능형 품질관리 체계를 개발하였다. 개발된
프리캐스트 콘크리트 부재 품질관리 체계는 부재의 제조 후부터 공사현장 반출 시까지
품질관리에 있어서 필수적으로 요구되는 네 가지 사항에 대한 해결책을 제시하고자 하였다. 이

146
네 가지 사항은 다음과 같다: (1) 어떤 품질검사 항목을 검사해야 하는가? (2) 품질검사는 어떤
과정으로 수행되어야 하는가? (3) 각 품질검사 항목마다 어떤 레이저 스캐너를 이용하며 최적의
스캔 파라미터는 어떠한가? (4) 어떻게 품질검사 데이터를 체계적으로 관리하는가?. 제안된
품질관리체계는 BIM 과 연계되어 품질검사의 자동화 및 지능화가 가능하도록 하였다. 제안된
품질관리 체계의 검증을 위하여 사례연구(case study)를 진행하였으며 BIM 과 연계한 제안된
체계의 적용 가능성을 확인하였다.
셋째, 프리캐스트 콘크리트 품질검사 기법의 신뢰성 향상을 위해 스캔 파라미터(scan
parameter) 최적화 기법을 개발하였다. 개발된 치수 및 표면결함 검사 기술의 정확도는 계측
장비인 레이저 스캐너의 계측 파라미터에 의해 크게 영향을 받음을 연구실 규모의 실험을 통해
알 수 있었는데, 계측 결과의 신뢰성을 높이기 위해 최적의 계측 파라미터 값을 찾는 것이
중요하다. 이를 위하여 본 논문에서는 레이저 광선(laser beam)의 기하학적 위치 정보 및 계측
오차를 산정하는 모델을 개발하였으며, 이 개발된 모델을 이용한 레이저 스캐닝 시뮬레이션을
통하여 치수 검사기법의 최적화된 계측 파라미터의 선정이 이루어졌다.
마지막으로, 본 연구에서는 개발된 품질 검사기법 및 시스템의 실 적용성을 검증하기
위해 현장실험을 수행 하였다. 길이 12 m 의 복잡한 형상을 가진 두 종류의 실 프리캐스트
콘크리트 바닥판 부재를 대상으로 실험을 수행 하였으며, 성공적으로 개발된 치수 검사기법의
정확성 및 신뢰성을 입증하였다. 또한 기존 품질검사기법인 deviation analysis 와의 정확성
비교를 통해 개발된 품질 검사기법의 우수성을 확인하였다. 또한 실 부재로부터 계측된 품질검사
데이터의 체계적 관리를 위해 클라우드(cloud)-BIM 시스템을 제안하고 이 시스템을 상용
클라우드 서버에 구축하였다.
핵심어: 프리캐스트 콘크리트, 레이저 스캐닝, 빌딩 정보 모델링 (BIM), 품질 검사, 데이터 관리
시스템

147
ACKNOWLEDGEMENT
I always feel that I am a lucky person, and the completion of this dissertation serves another example of
my luck in my life. For all the goals I set at different stages of the research presented in this dissertation, I
encountered many wonderful people, who generously helped me in a variety of ways. I would like to thank
them for their invaluable help.
I would like to express my sincerest gratitude to my advisors, Prof. Hoon Sohn and Prof. Chih-Chen
Chang. My deepest appreciation goes to Professor Sohn who gave me the chance to join the KAIST-
HKUST joint-Ph.D. program and introduced me to the area of geometric data collection and processing
when I needed guidance at the beginning of my doctoral research. Without his continuous support and
valuable advice, my dissertation would have been impossible. Also, I would like to sincerely thank Prof.
Chang for his encouragement and support during thesis research at HKUST. His excellent insights and
friendly concern have influenced me greatly, not only on my research but also on my life.
I sincerely appreciate the efforts of my committee members, Prof. Hyun Myung at KAIST, Prof. Chang-Su
Shim at Chung-Ang University, and Profs. Lambros Katafygiotis and Jack C.P. Cheng at HKUST. All my
committee members spent a lot of time on reviewing the dissertation and providing constructive
suggestions. I really appreciate their encouragement and help. I would like to express my special thanks to
Prof. Cheng for insightful suggestions to my research during my stay at HKUST and wonderful course in
construction IT. Then, I also want to express my thanks to laboratory technicians Mr. Hung and Tong in
the Structure Laboratory at HKUST for preparing my concrete specimens and giving me experimental
opportunities.
I would also like to convey thanks to the funding agencies for providing the financial means and laboratory
facilities. Parts of this work were financially supported by National Research Foundation of Korea and the
Ministry of Land, Infrastructure and Transport of the Korean Government, and the joint-Ph.D. program
between Korea Advanced Institute of Science and Technology and The Hong Kong University of Science
and Technology.
I would like to take this opportunity to acknowledge the help and support I received from colleagues and
friends. I first would like to express my gratitude to Smart Structures and System (SSS) Group members at
KAIST, particularly colleagues Mr. Qian Wang and Mr. Joonwoo Park for helping my research, and Dr.
Yun-Kyu An at Southeast University in China, Mr. Kiyoung Kim, Mr. Jinyeol Yang, Mr. Hyungjin Lim,

148
Mr. Byeongjin Park, Mr. Jimin Kim and the other SSS Group members for sharing their experiences on
various aspects of life. I also would like to thank my colleagues and friends at HKUST for their warm-
hearted concern: Mr. Sin-Hang Man, Mr. Zhe Wang, Mr. Chong Cao, Mr. Pengfei Wang, Mr. Chao Wang,
Ms. XinXing Chen, Mr. Liu Yang, Ms. Kaihui Zhong, Ms. Qiuchen Lu, Mr. Hongxin Chen, Mr. Yichuan
Deng, Mr. Maziar Jamshidi, Mr. Andrea. Also special thanks go to Yong-Kil An, Hyun-Chul Maeng,
Jaewon Lee and Mun-young Lee. With their friendship, the two and half years at HKUST have not been as
lonely as I imagined. In addition, I want to thank my friends Minho, Seungjin, Minchul, Taewoo and
Sangryul for their constant encouragement.
Finally, I could not express my appreciation enough to my parents, sisters and brothers-in-law. They
always believed in me and supported me with unconditional and infinite love. Without their support, I
could not have finished my graduate study at KAIST and HKUST.
2014. 11. 18
Kim, Min-Koo

149
CURRICULUM VITAE
PERSONAL INFORMATION
Name : Min-Koo Kim
Place and Date of Birth: DaeGu, South Korea on January 25, 1983
E-mail: [email protected]
EDUCATION
2015 February Ph.D. in Civil and Environmental Engineering, KAIST and HKUST (Joint dual
degree), Daejeon, Korea and Hong Kong
2010 August M.S. in Civil and Environmental Engineering, KAIST, Daejeon, Korea
2009 February B.S. in Architectural Engineering, KyungPook National University, DaeGu, Korea
RESEARCH & EDUCATIONAL EXPERIENCES
Research Assistant
- Smart Structures and Systems Laboratory, KAIST, 2009 – Present.
- Prof. Chih-Chen Chang’s Research Group, HKUST, 2012. Aug. – Present.
Teaching Assistant
- CE520 Introduction to Smart Structure Technologies, KAIST, 2009 Fall
- CIVL3320 Reinforced Concrete design, HKUST, 2013 Spring
- CIVL4330 Introduction to Structural Dynamics, HKUST, 2013 Fall
- CIVL3310 Structural Analysis, HKUST, 2014 Spring
Field Test Experiences
- Precast Concrete Scanning, GimJe, Jeollabuk-do, Korea, 2013-2014.
- Bridge Monitoring, NJ Rt 23 Wayne Bridge, New Jersey, USA, 2011 June
- Bridge Monitoring, KimPo Ramp-G Bridge, Kimpo, Korea, 2009-2012
- Aircraft Wing Monitoring, Agency for Defense Development (ADD), Daejeon, Korea, 2010-2011
- Bridge Monitoring, Samseung Bridge, Yeoju, Korea, 2009-2010

150
JOURNAL PUBLICATIONS
*The corresponding author is underlined.
1. Min-Koo Kim, Qian Wang, JoonWoo Park, Jack C.P. Cheng, Chih-Cheng Chang, Hoon Sohn “Application
of Cloud-BIM based Dimensional Assurance Technique to Full-scale Precast Concrete Elements”, To be
submitted to Advanced Engineering Informatics, 2014.
2. Min-Koo Kim, Jack C.P. Cheng, Hoon Sohn and Chih-Chen Chang “A Framework for Dimensional and
Surface Quality Assessment of Precast Concrete Elements using BIM and 3D Laser Scanning”, Automation
in Construction, Vol. 49, 2015.
3. Min-Koo Kim, Hoon Sohn and Chih-Chen Chang “Automated dimensional quality assessment of precast
concrete panels using terrestrial laser scanning”, Automation in Construction, Vol. 45, 2014.
4. Min-Koo Kim, Hoon Sohn and Chih-Chen Chang “Localization and Quantification of Concrete Spalling
Defects using Terrestrial Laser Scanning”, Journal of Computing in Civil Engineering (ASCE), 04014086,
2014.
5. Yun-Kyu An, Hyung Jin Lim, Min Koo Kim, Jin Yeol Yang, Hoon Sohn, Chang Guen Lee “Application of
Local Reference-free Damage Detection Techniques to In Situ Bridges,” Journal of Structural Engineering
(ASCE), Vol. 140 (3), 2014.
6. Yun-Kyu An, Min Koo Kim, Hoon Sohn “Aircraft Hot Spot Monitoring using Integrated Impedance and
Guided Wave Measurements,”, Structural Control and Health Monitoring, Vol. 19 (7), 2012.
7. Min Koo Kim, Eun Jin Kim, Yun Kyu An, Hyun Woo Park, Hoon Sohn “Reference-free Impedance based
Crack Detection in Plates,” Journal of Sound and Vibration, Vol. 330(24), 2011.
8. Hyung Jin Lim, Min Koo Kim, Hoon Sohn, Chan Yik Park “Impedance based Damage Detection under
Varying Temperature and Loading Conditions,” NDT&E International, Vol. 44(8), 2011.
9. Eun Jin Kim, Min Koo Kim, Hoon Sohn, Hyun Woo Park “Investigating Electro-mechanical Signal from
Collocated Piezoelectric Wafers for the Reference-free Damage Diagnosis of a Plate,” Smart Materials and
Structures, Vol. 20, 065001, 2011.
DISSERTATION & THESIS
Min-Koo Kim, “Advanced Impedance-based Damage Detection Considering Temperature and Loading Effects”
M.S. Thesis, Department of Civil and Environmental Engineering, KAIST, Daejeon, Korea, June 2010.

151
BOOK CHAPTER
Yun-Kyu An, Min Koo Kim and Hoon Sohn “Piezoelectric transducers,” Chapter 4 in Advancement in Sensor
Technology for Infrastructure,” in Sensor Technologies for Civil Infrastructures, M. L. Wang, J. P. Lynch and H.
Sohn (eds.), pp.410-445, Book (DOI 10.1533/9780857099136), (Chapter DOI: 10.1533/9780857099136.410),
ISBN 978-0-85709-432-2 (Print), 978-0-85709-913-6 (Online), Woodhead Publishing Limited, April, 2014.
PATENT
Hoon Sohn, MinKoo Kim, “Apparatus and method of precast concrete quality control using 3D laser scanning,”
Korean Patent (Application # 10-2013-0120253), October 10, 2013.
AWARD & SCHOLARSHIP
2008. August 1st Place Prize for Team Competition, 1st ANCRISST Short Course On ‘Smart
Wireless Sensor Technology and Applications’, KAIST, Daejeon, South Korea
2011. May Best Paper Prize, Seoul, Paper Title: Optimized Pipe Damage Detection using 3D
Geometry Information, KBIM Annual Conference, Seoul, South Korea
2010 Sep. – 2012. Aug. Scholarship of KAIST & HKUST joint dual Ph.D Program, KAST, South Korea
2013 Sep. – 2015. Jan. Scholarship of KAIST & HKUST joint dual Ph.D Program, HKUST, Hong Kong
2014
2014. June
2014. August
Research Travel Grant from HKUST, Hong Kong
1) Project Number: RTG13/14.EG147, Funds awarded: HK$ 12,000)
2) Project Number: RTG13/14.EG221, Funds awarded: HK$ 10,000)

152
RESEARCH PROJECTS
2013 – Present ICT (Information & Communication Technology) Bridge Technology: Ministry of
Land, Infrastructure and Transport of the Korea Government (Funded: 24,000,000
USD for 06/01/13-05/31/18)
2009 – 2011 Development of Enabling Technologies for Structural Health Monitoring: Korea
Agency for Defense Development (Funded: 240,000 USD for 06/01/08-05/31/11)
*Selected as the excellent government project award (2012)
2009 – 2011 Online Continuous Monitoring of Bridge Structures: Smart Infra-Structure
Technology Center, National Research Foundation of Korea (Funded: 140,000
USD for 03/01/07 to 02/28/11)
CONFERENCE PROCEEDINGS
International Conference
1. MinKoo Kim, Chih-Chen Chang, Hoon Sohn, “Scan Parameter Optimization for Enhancement of
Dimensional Quality Assessment of Precast Concrete Elements”, The 27th KKTHCNN Symposium on
Civil Engineering, TongJi University, Shanghai, China, 10-12 November, 2014.
2. Min-Koo Kim, Qian Wang, Jack C.P. Cheng, Hoon Sohn, Chih-Chen Chang, “Cloud-BIM based
Automated Quality Assessment of Full-scale Bridge Precast Concrete”, The 21st International Workshop:
Intelligent Computing in Engineering, Cardiff University, The Unite Kingdom, July 16-18, 2014. (Invited
for Advanced Engineering Informatics Special Issue)
3. Min-Koo Kim, Jun-Woo Park, Hoon Sohn, Chih-Chen Chang, “Full-scale Application of a Dimensional
Quality Assessment Technique to Precast Concrete Panels using Terrestrial Laser Scanning”, International
Society for Computing in Civil and Building Engineering (ISCCBE), University of Florida, USA, 23-25
June, 2014.
4. Min-Koo Kim, Hoon Sohn, Chih-Chen Chang, “Concrete Surface Defect Detection using Terrestrial Laser
Scanning”, The 26th KKTHCNN Symposium on Civil Engineering, National University of
Singapore(NUS), Singapore, 18-20 November, 2013.
5. Min Koo Kim, Di Wu, Jack Chin Pang Cheng, Hoon Sohn, Chih-Chen Chang, “Formulation of a
Framework for Quality Assessment of Precast Concrete based on 3D Laser Scanner,” The 30th international
Symposium on Automation and Robotics in Construction and Mining, Montreal, Canada, 11-15 August,
2013. (Invited for Automation in Construction Special Issue)
6. Min Koo Kim, Hoon Sohn, Chih-Chen Chang, “Active Dimensional Quality Assessment of Precast
Concrete using 3D Laser Scanner,” ASCE International Workshop on Computing in Civil Engineering,

153
University of Southern California, Los Angeles, CA, USA, 23-25 June, 2013.
7. Min Koo Kim, Hoon Sohn, Chih-Chen Chang, “Contactless Damage Detection of Concrete Surface from
3D Laser Scanner,” The 1st International Conference on Performance-based and Life-cycle Structural
Engineering, Hong Kong, China, 5-7 December, 2012.
8. Min Koo Kim, Hoon Sohn, Chih-Chen Chang, “3D Laser Scanner based Dimensional Quality Control of
Precast Concrete Elements,” The 25th KKCNN Symposium on Civil Engineering, BEXCO, Busan, Oct.
22-24, 2012.
9. Min Koo Kim, Hyung Jin Lim, Hoon Sohn, Chan Yik Park, “Impedance-based Bolt Loosening Detection
under Varying Temperature and Loading,” the 3rd Asia-Pacific Workshop on Structural Health Monitoring,
Tokyo, Japan, November 30 – December 2, 2010.
10. Hoon Sohn, Yun-kyu An, Chang Gil Lee, Min Koo Kim, Hyung Jin Lim, “Application of Online NDT
Techniques to Decommissioned Bridge Testing,” the 5th European Workshop on Structural Health
Monitoring, Sorrento, Italy, June 29 – July 02, 2010.
11. Min Koo Kim, Hyung Jin Lim, Hoon Sohn, Chan Yik Park, “Impedance based Damage Diagnosis of a
Complex Composite Aircraft Wing under Changing Loading and Temperature Conditions,” the 5th
European Workshop on Structural Health Monitoring, Sorrento, Italy, June 29 – July 02, 2010.
12. Eun Jin Kim, Min Koo Kim, Hoon Sohn, Hyun Woo Park, “Understanding a Reference-free Impedance
Method using Collocated PZT Transducers,” SPIE International Symposia, Smart Structures & Materials
and Nondestructive Evaluation for Health Monitoring and Diagnostics, San Diego, CA, March 7-11, 2010.
13. Min Koo Kim, Eun Jin Kim, Hyun Woo Park, Hoon Sohn, “Reference-free Impedance-based Crack
Detection in Plate-like Structures,” SPIE International Symposia, Smart Structures & Materials and
Nondestructive Evaluation for Health Monitoring and Diagnostics, San Diego, CA, March 7-11, 2010.
Domestic Conference
14. Min Koo Kim, Hoon Sohn, Chih-Chen Chang, “Precast concrete quality control using 3D laser scanner for
accelerated bridge construction” KBIM Annual Conference, KonKuk Univ., Seoul, 2012.
15. Min Koo Kim, Byung Jin Park, Hoon Sohn, “Optimized Pipe Damage Detection using 3D Geometry
Information” KBIM Annual Conference, Seoul, 2011. (Awarded for A Best Paper)
16. Yun-kyu An, Hyung Jin Lim, Min Koo Kim, Hoon Sohn, “Validations of Reference-Free Crack Detection
Technique through a Decommissioned Bridge Test” Computational Structural Engineering Institute of
Korea Annual Conference, Jeju, 2010.
17. Hye Won Seo, Min Koo Kim, Kyung Jae Shin, “Damage Measure of Girder using PZT sensor,”
Architectural Institute of Korea Annual Conference, Vol. 1, Daegu, 2008.