ZAKIUDIN MUNASIR - Perhimpunan Dokter Gizi Medik Indonesia | Perhimpunan Dokter Gizi ... ·...
45
FOOD ALLERGY AND IMMUNITY ZAKIUDIN MUNASIR DIVISION OF ALLERGY-IMMUNOLOGY - DEPARTMENT OF CHILD HEALTH UNIVERSITY OF INDONESIA / CIPTO MANGUNKUSUMO HOSPITAL
-
Upload
duongtuyen -
Category
Documents
-
view
233 -
download
0
Transcript of ZAKIUDIN MUNASIR - Perhimpunan Dokter Gizi Medik Indonesia | Perhimpunan Dokter Gizi ... ·...
FOOD ALLERGY AND IMMUNITY
ZAKIUDIN MUNASIR D I V I S I O N O F A L L E R G Y - I M M U N O L O G Y - D E P A R T M E N T O F C H I L D H E A L T H
U N I V E R S I T Y O F I N D O N E S I A / C I P T O M A N G U N K U S U M O H O S P I T A L
DR. Dr. Zakiudin Munasir, SpA(K) Division of Allergy and Clinical Immunology, University of Indonesia, Jakarta, Indonesia
Doctor Zakiudin Munasir is Head of the Division of Allergy and Immunology, Department of Child Health in the Faculty of Medicine, University of Indonesia-Cipto Mangunkusumo Hospital. He completed his medical degree at the University of Indonesia, Jakarta, Indonesia and residency in paediatrics. Dr. Munasir subsequently became a pediatric consultant in allergy and immunology for the Indonesian Pediatric Society.
Dr Munasir is a member of the working group on allergy and immunology for the Indonesian Pediatric Society and also a member of the Indonesian Allergy and Immunology Association. He is a member of the European Pediatric Allergy Rheumatology, the World Allergy Organization, the European Academy of Allergy and. Clinical Immunology and board member of Asia Pacific Association of Pediatric Allergy, Respirology & Immunology (APAPARI) He is also an editor for the Asia Pacific Allergy Journal.
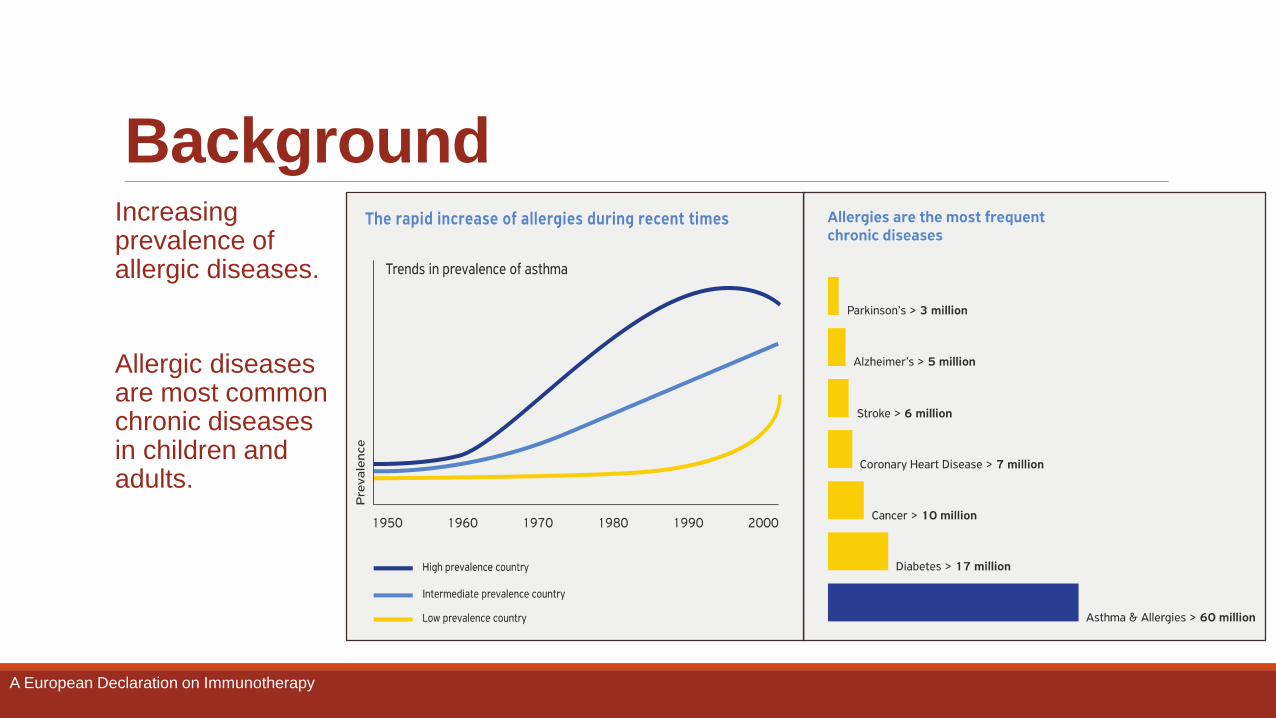
Background Increasing prevalence of allergic diseases.
Allergic diseases are most common chronic diseases in children and adults.
A European Declaration on Immunotherapy
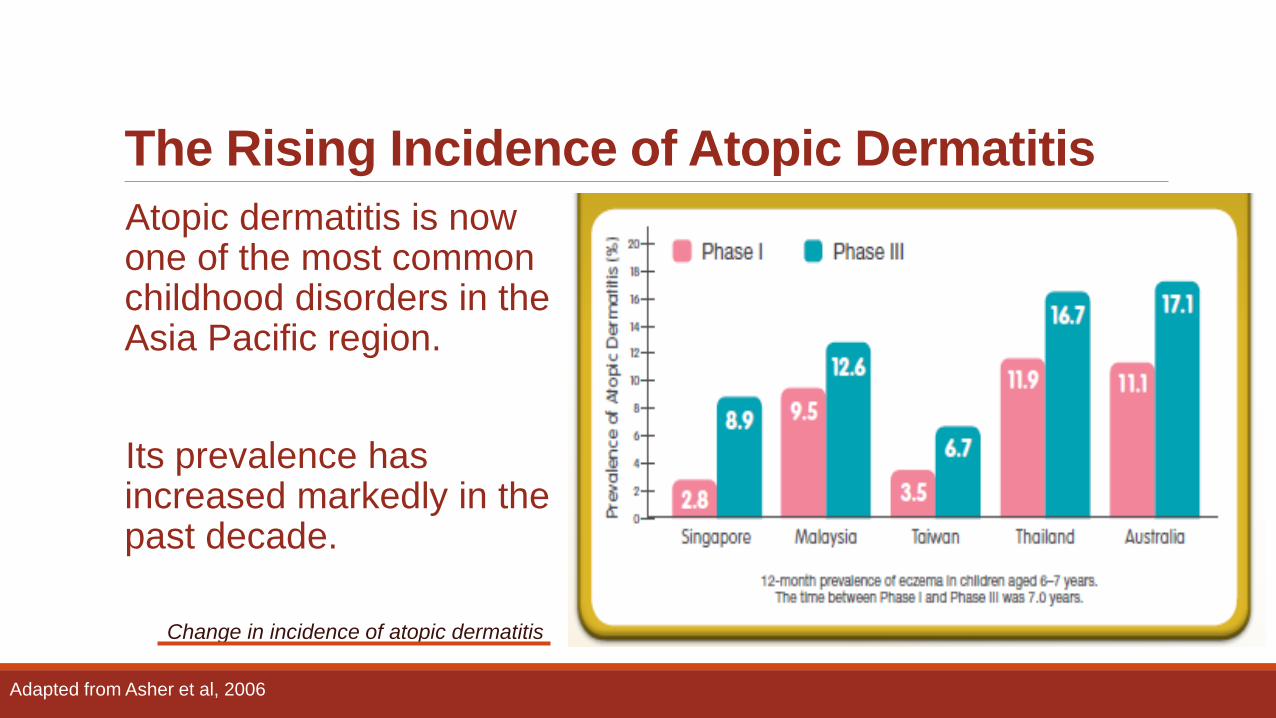
The Rising Incidence of Atopic Dermatitis
Atopic dermatitis is now one of the most common childhood disorders in the Asia Pacific region.
Its prevalence has increased markedly in the past decade.
Adapted from Asher et al, 2006
Change in incidence of atopic dermatitis
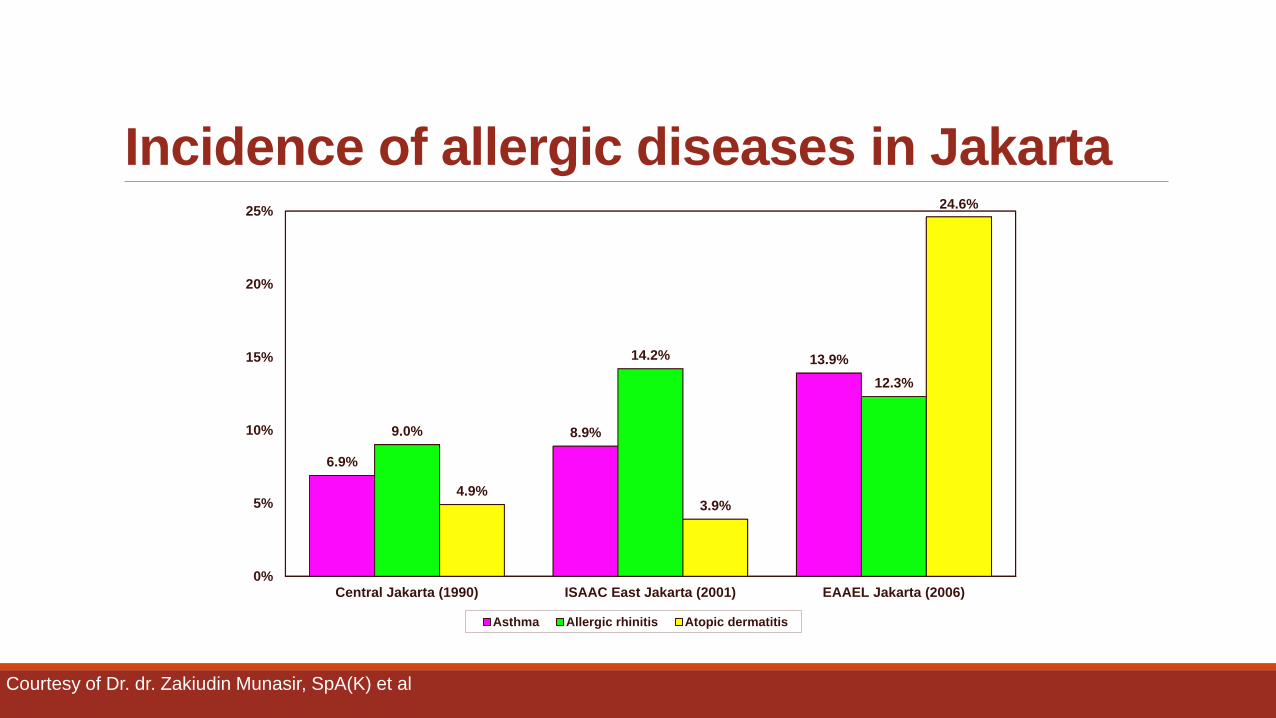
Incidence of allergic diseases in Jakarta
0%
5%
10%
15%
20%
25%
Central Jakarta (1990) ISAAC East Jakarta (2001) EAAEL Jakarta (2006)
6.9%
8.9%
13.9%
9.0%
14.2%
12.3%
4.9% 3.9%
24.6%
Asthma Allergic rhinitis Atopic dermatitis
Courtesy of Dr. dr. Zakiudin Munasir, SpA(K) et al
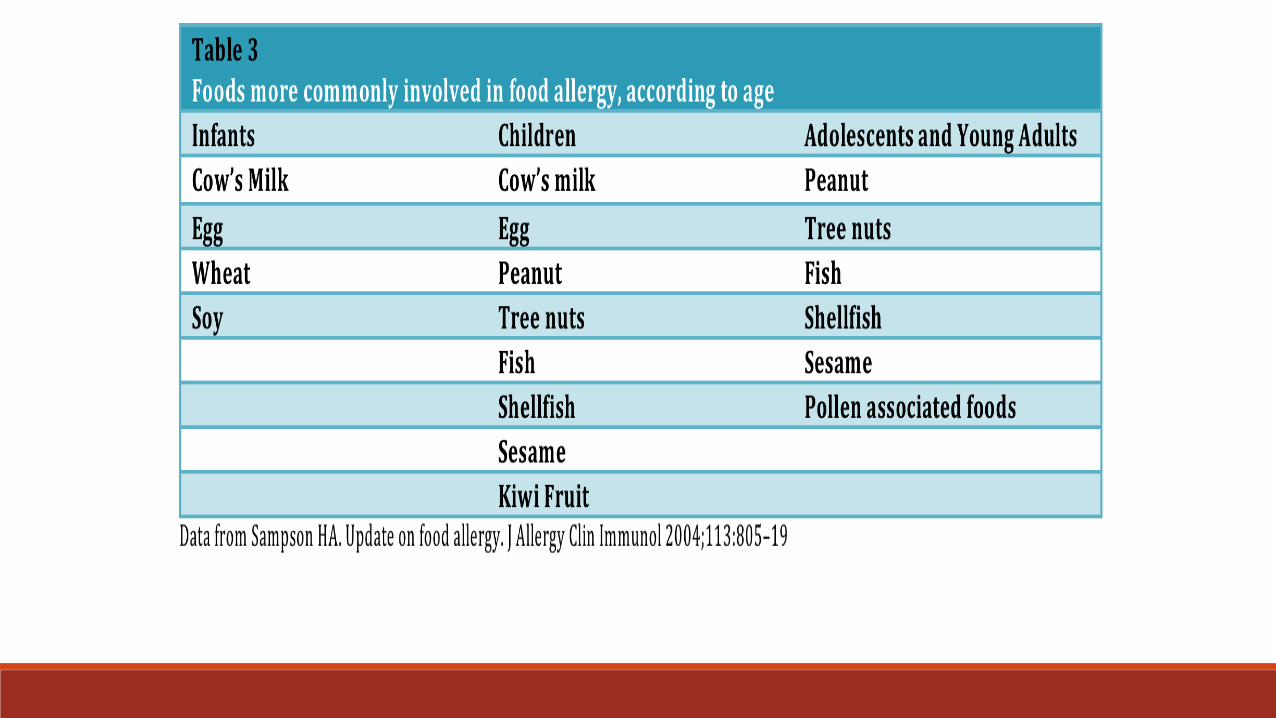
Food Allergy Food allergy is one of most important allergic disease in children.
In fact, every food could induce allergy. However, there is different degree of allergenicity between each food.
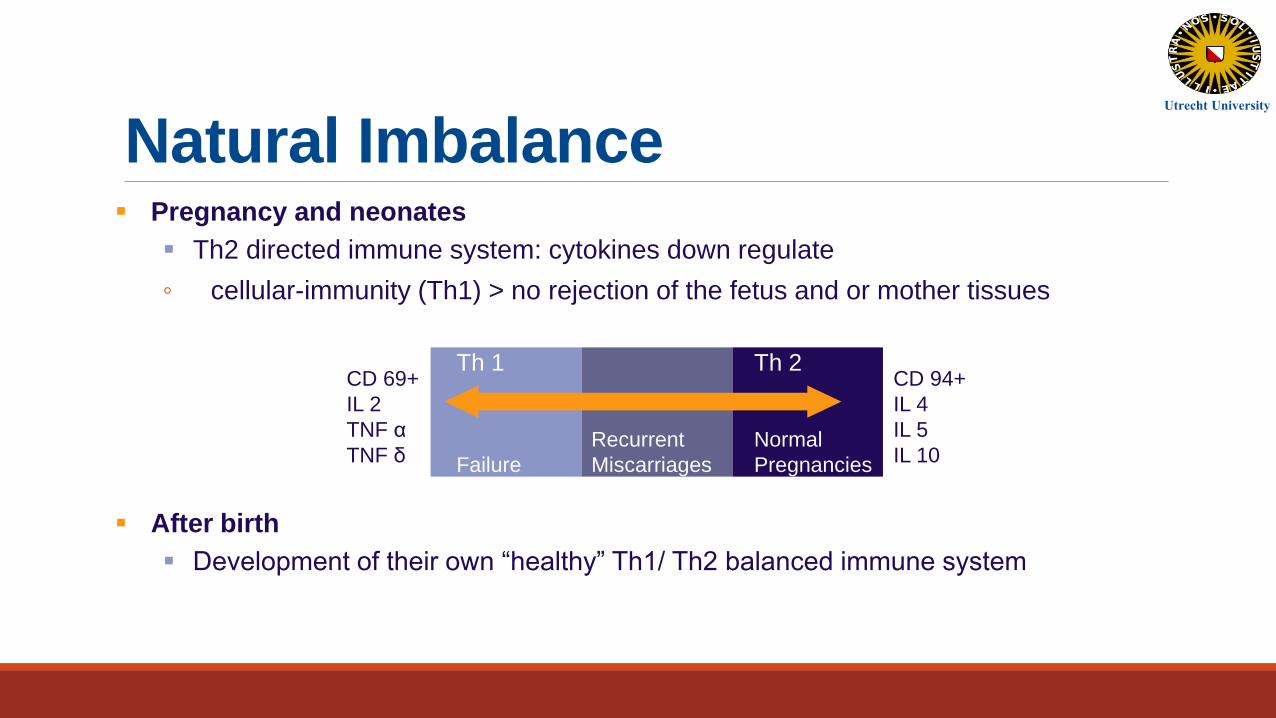
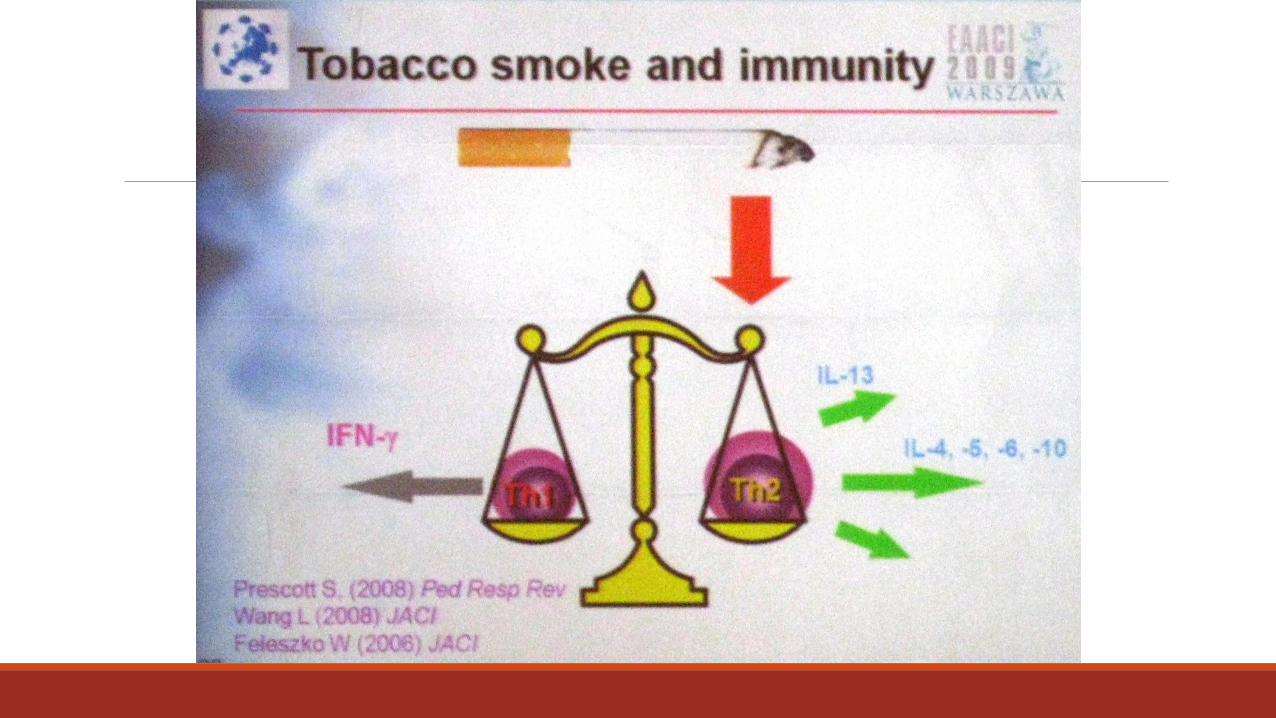
Natural Imbalance Pregnancy and neonates
Th2 directed immune system: cytokines down regulate
◦ cellular-immunity (Th1) > no rejection of the fetus and or mother tissues
After birth
Development of their own “healthy” Th1/ Th2 balanced immune system
Th 1 Th 2
Normal
Pregnancies
Recurrent
Miscarriages
Failure
CD 69+
IL 2
TNF α
TNF δ
CD 94+
IL 4
IL 5
IL 10
Utrecht University
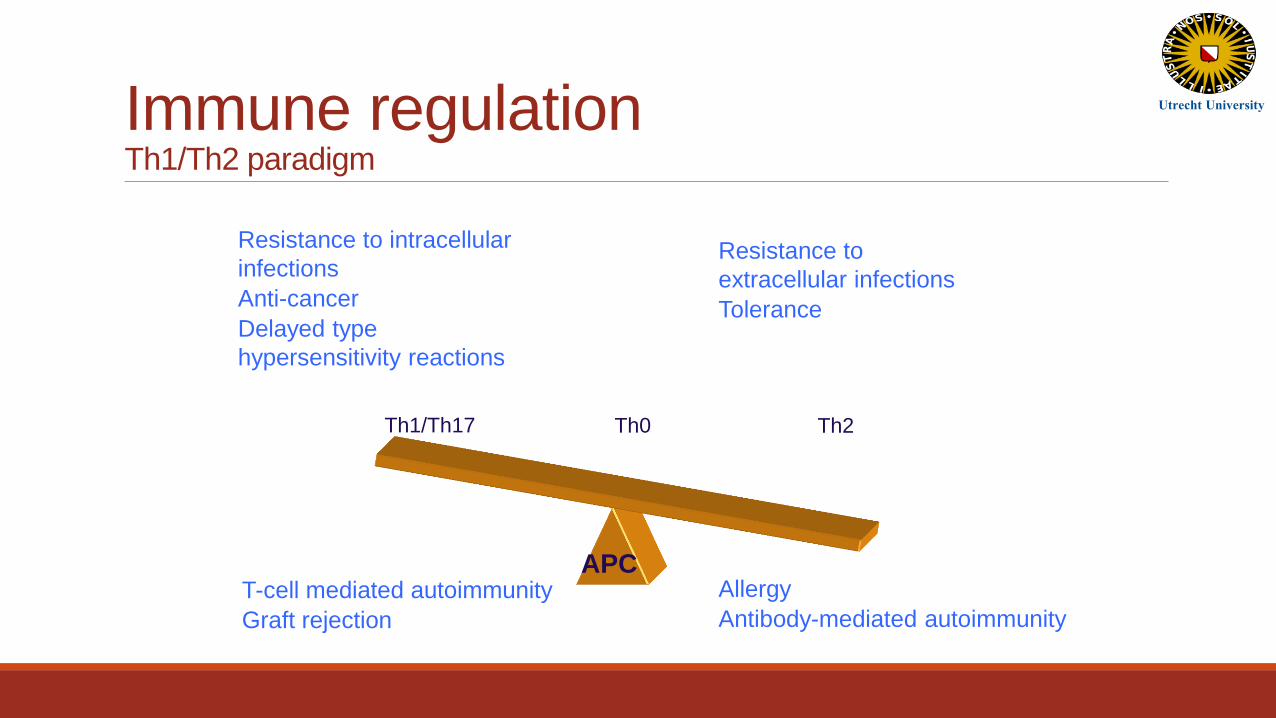
Th0 Th1/Th17 Th2
APC
Immune regulation Th1/Th2 paradigm
Allergy
Antibody-mediated autoimmunity
Resistance to intracellular
infections
Anti-cancer
Delayed type
hypersensitivity reactions
Resistance to
extracellular infections
Tolerance
T-cell mediated autoimmunity
Graft rejection
Utrecht University
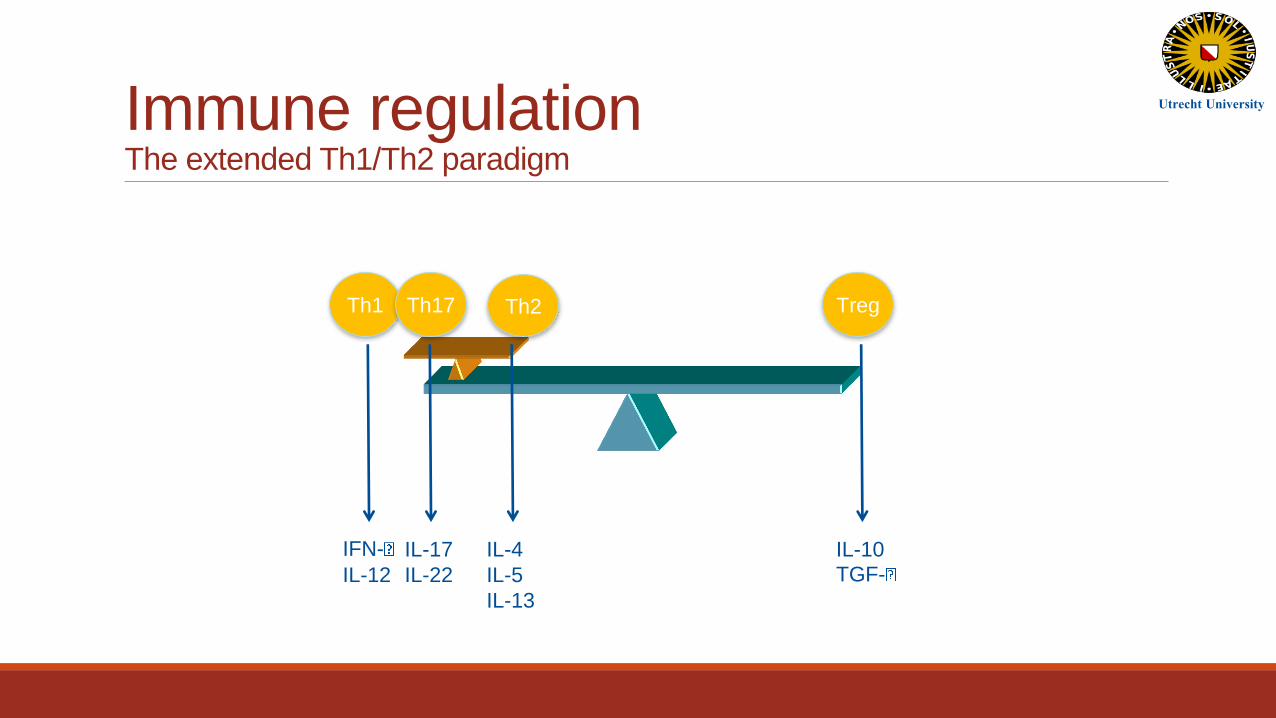
Immune regulation The extended Th1/Th2 paradigm
IFN-
IL-12
IL-17
IL-22
IL-4
IL-5
IL-13
IL-10
TGF-
Th1 Th2 Th17 Treg
Utrecht University
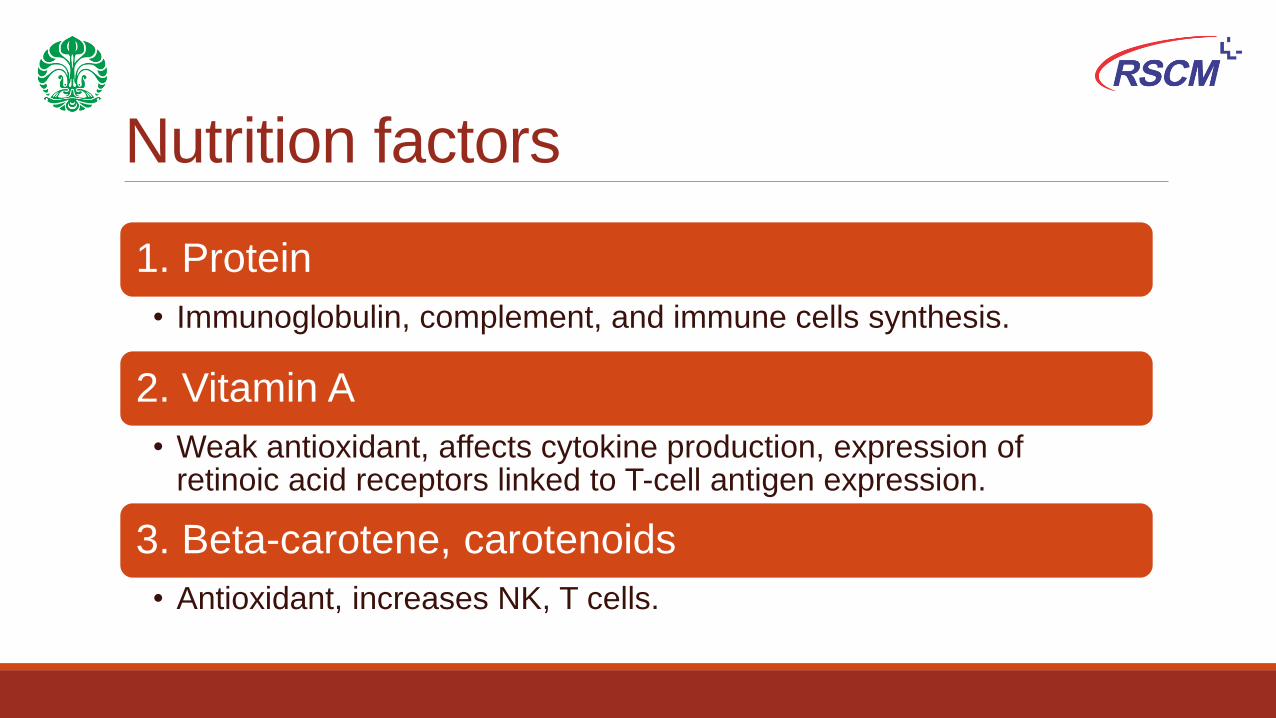
Nutrition factors
1. Protein
• Immunoglobulin, complement, and immune cells synthesis.
2. Vitamin A
• Weak antioxidant, affects cytokine production, expression of retinoic acid receptors linked to T-cell antigen expression.
3. Beta-carotene, carotenoids
• Antioxidant, increases NK, T cells.
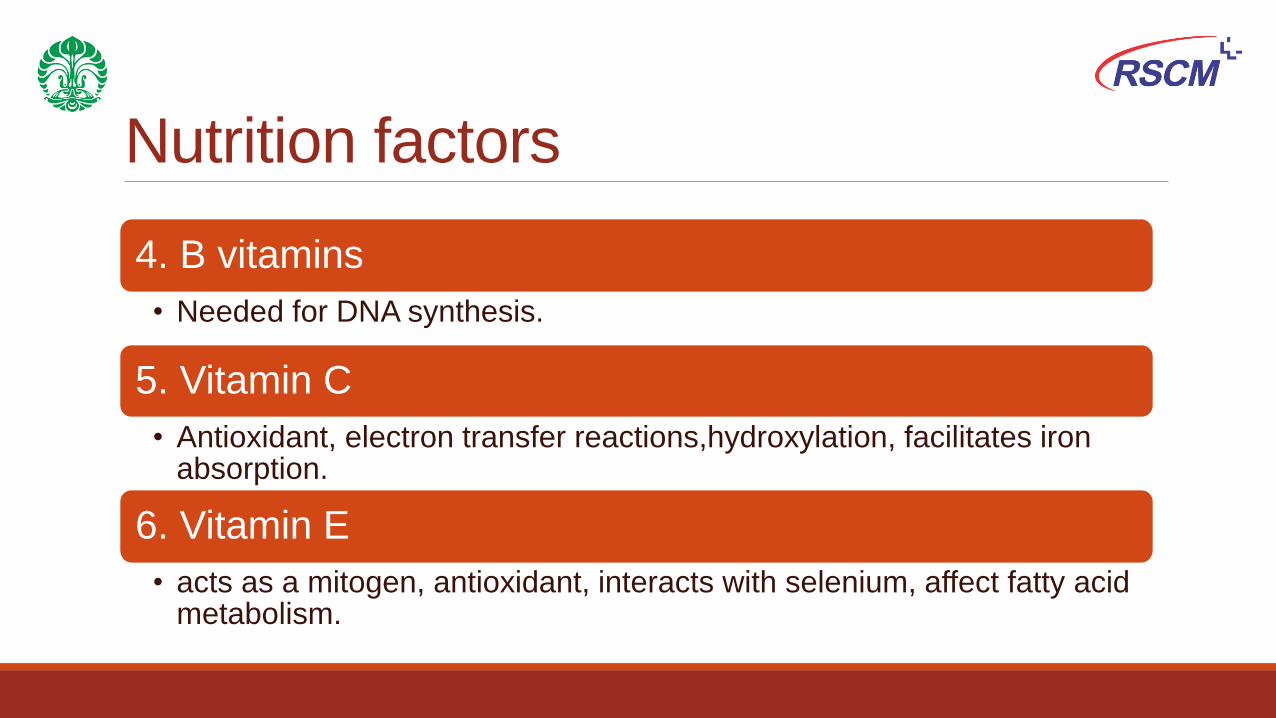
Nutrition factors
4. B vitamins
• Needed for DNA synthesis.
5. Vitamin C
• Antioxidant, electron transfer reactions,hydroxylation, facilitates iron absorption.
6. Vitamin E
• acts as a mitogen, antioxidant, interacts with selenium, affect fatty acid metabolism.
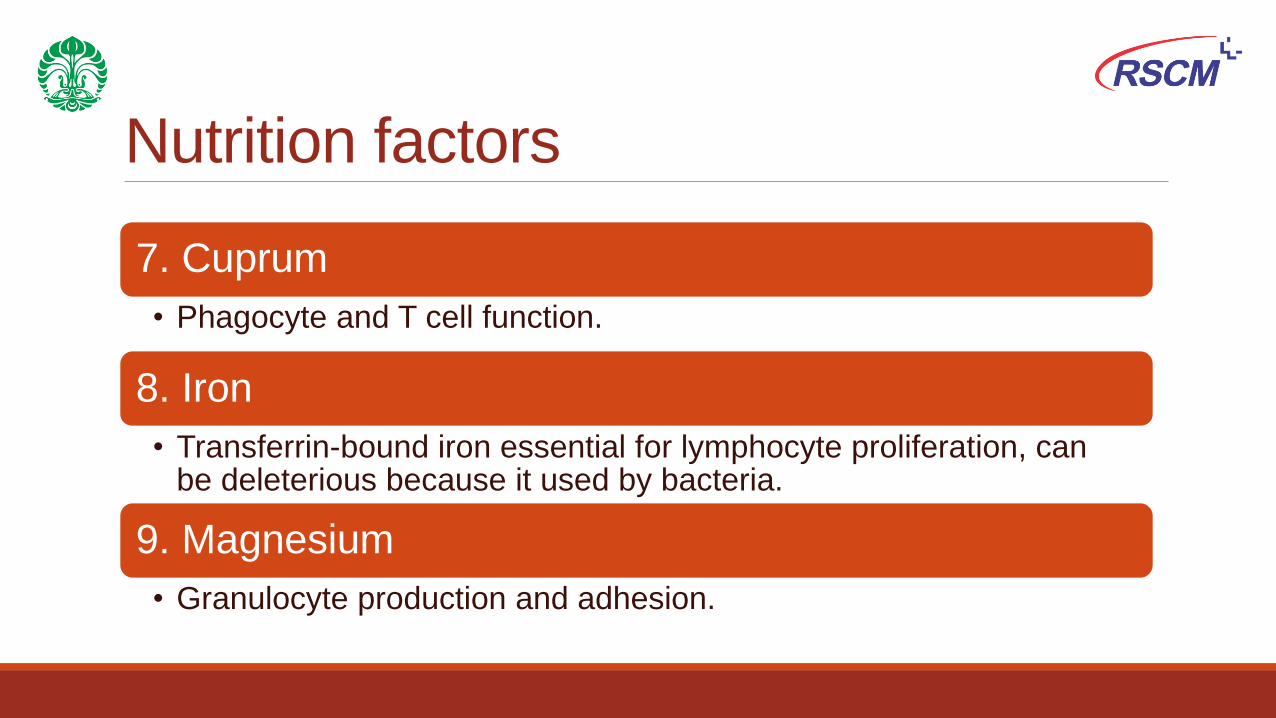
Nutrition factors
7. Cuprum
• Phagocyte and T cell function.
8. Iron
• Transferrin-bound iron essential for lymphocyte proliferation, can be deleterious because it used by bacteria.
9. Magnesium
• Granulocyte production and adhesion.
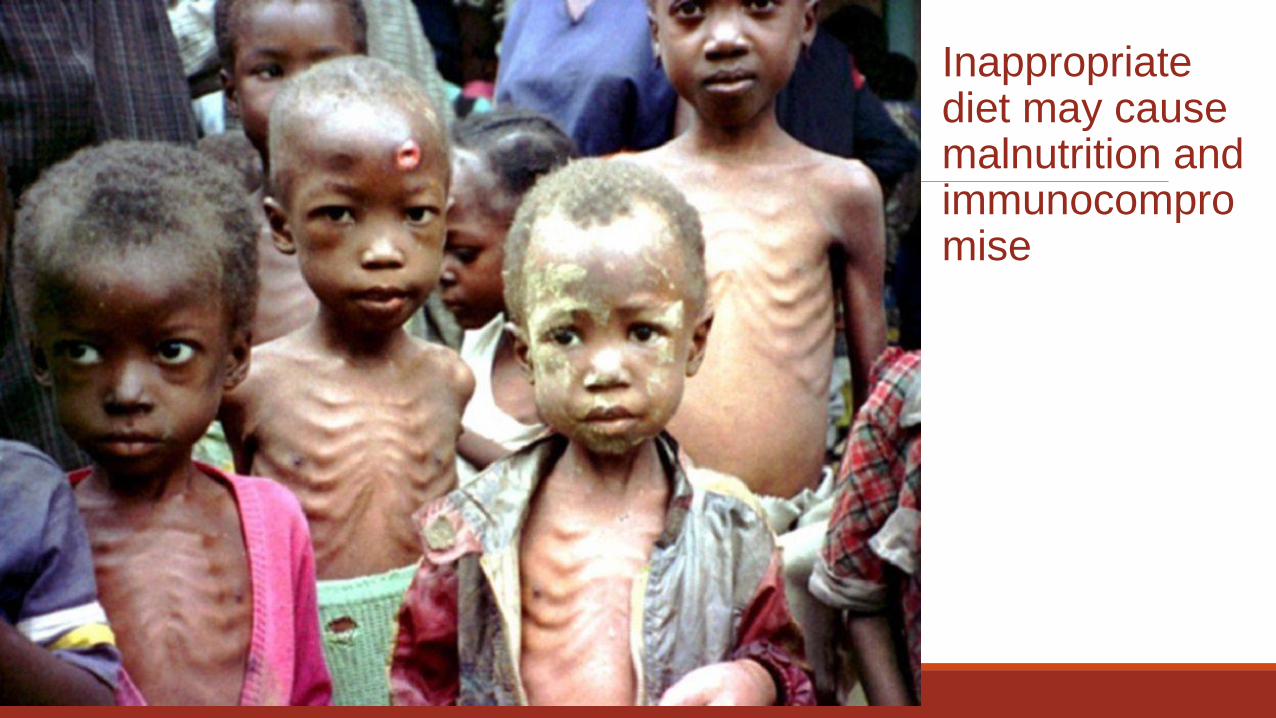
Inappropriate diet may cause malnutrition and immunocompromise
J Clin Allerg Immunol 2003; 112:S118-27
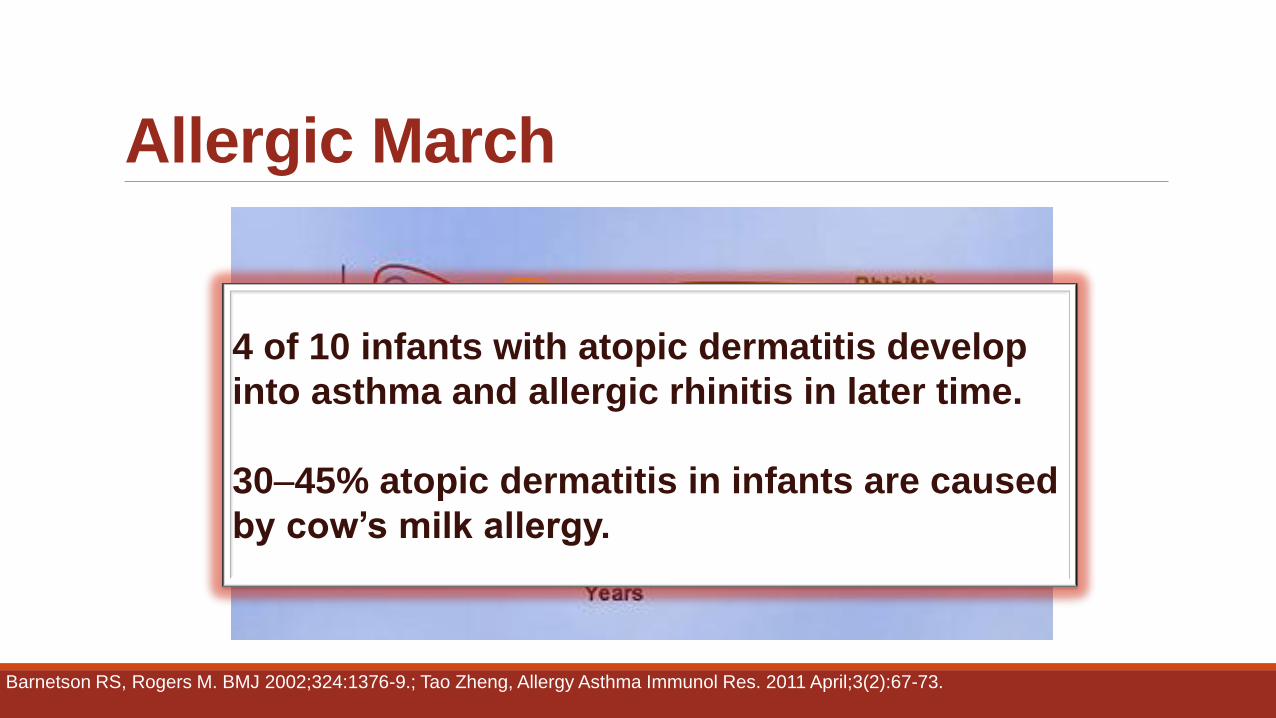
Allergic March
Barnetson RS, Rogers M. BMJ 2002;324:1376-9.; Tao Zheng, Allergy Asthma Immunol Res. 2011 April;3(2):67-73.
4 of 10 infants with atopic dermatitis develop
into asthma and allergic rhinitis in later time.
30–45% atopic dermatitis in infants are caused
by cow’s milk allergy.
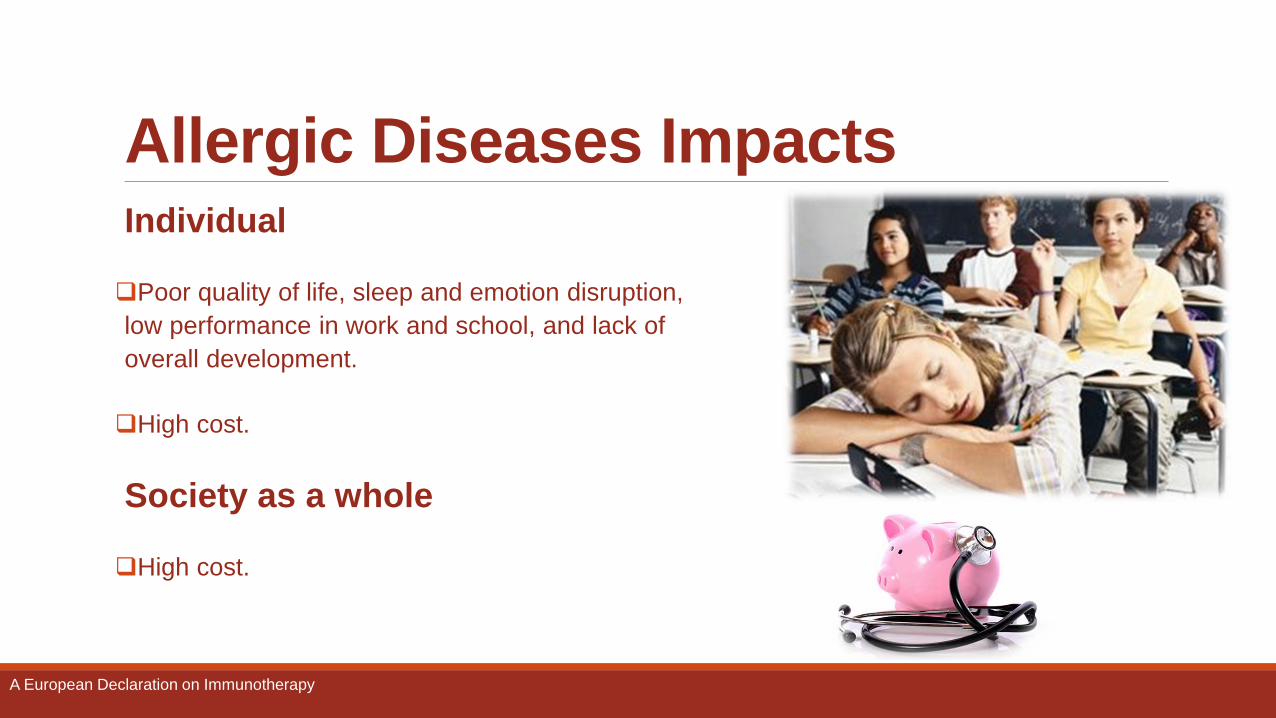
Allergic Diseases Impacts Individual
Poor quality of life, sleep and emotion disruption,
low performance in work and school, and lack of
overall development.
High cost.
Society as a whole
High cost.
A European Declaration on Immunotherapy
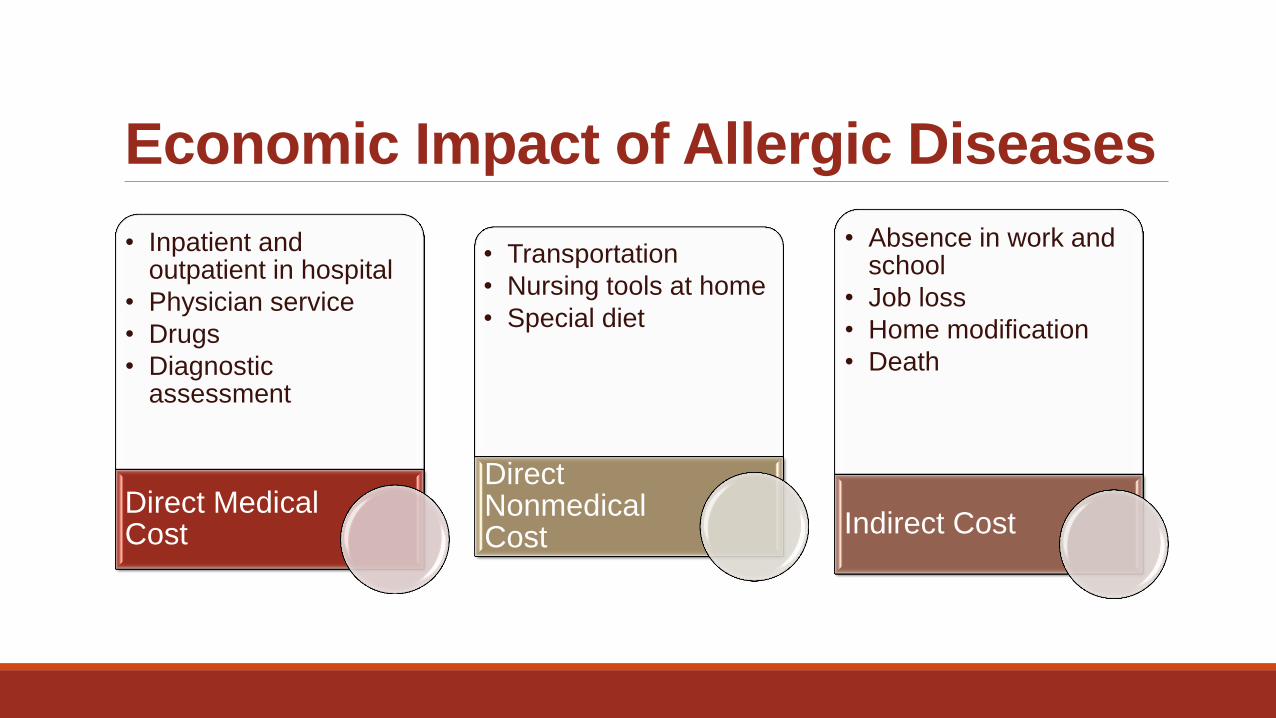
Economic Impact of Allergic Diseases
• Inpatient and outpatient in hospital
• Physician service
• Drugs
• Diagnostic assessment
Direct Medical Cost
• Transportation
• Nursing tools at home
• Special diet
Direct Nonmedical Cost
• Absence in work and school
• Job loss
• Home modification
• Death
Indirect Cost
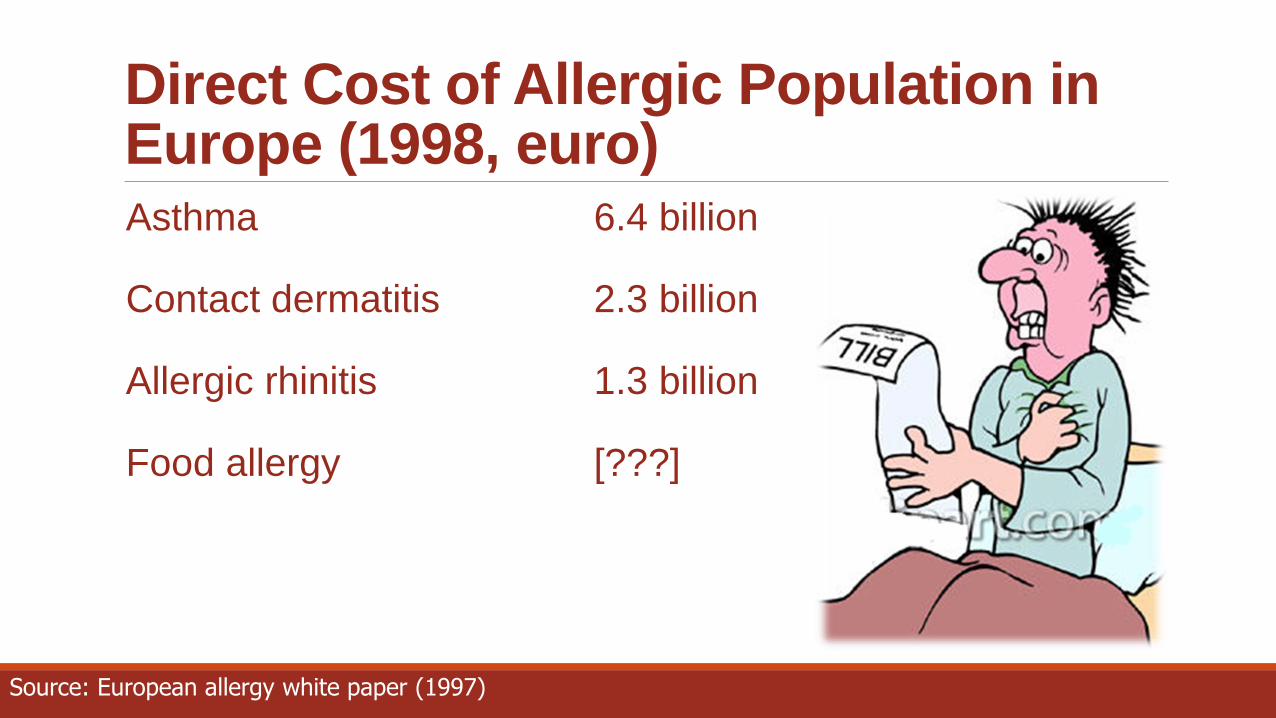
Direct Cost of Allergic Population in Europe (1998, euro)
Asthma 6.4 billion
Contact dermatitis 2.3 billion
Allergic rhinitis 1.3 billion
Food allergy [???]
Source: European allergy white paper (1997)
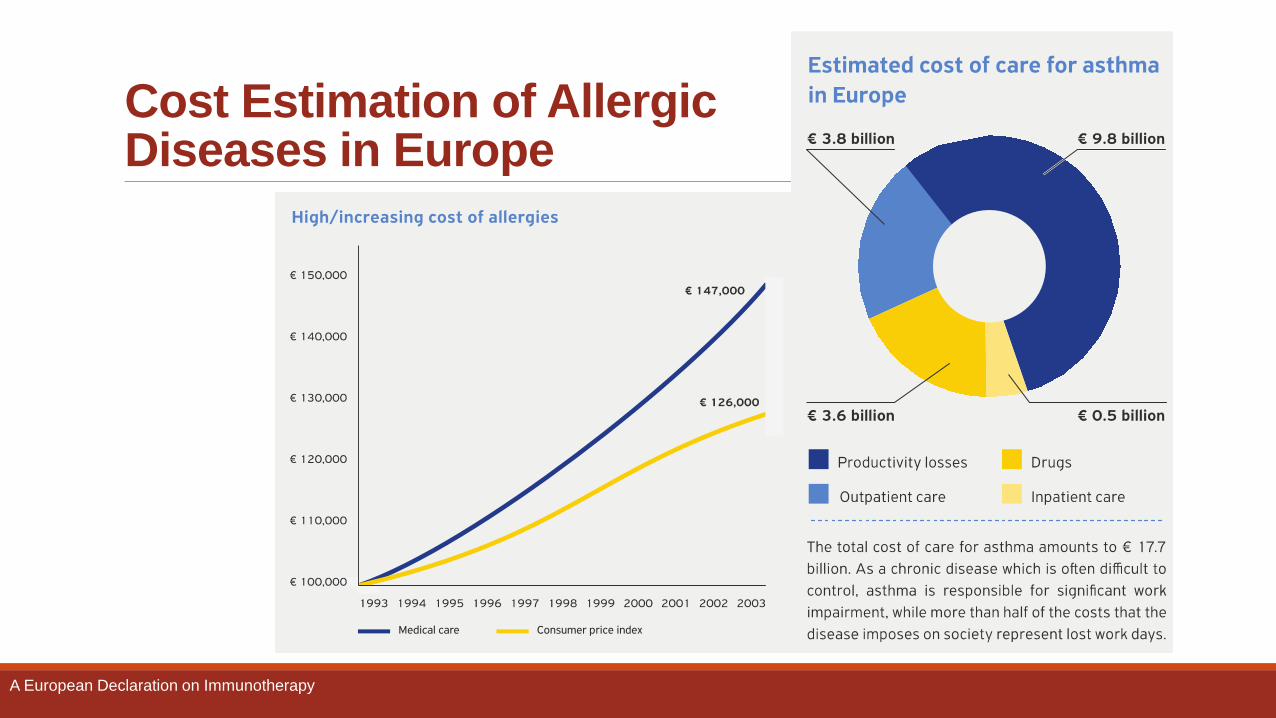
Cost Estimation of Allergic Diseases in Europe
A European Declaration on Immunotherapy
Cost of allergic diseases in Thailand
treatments typically involve substitution of the current
milk diet with different nutrition in addition to symptom-
atic treatments.
Monitoring and lab tests
Prick skin test and immunoglobulin E(IgE) blood test were
common tests included across all atopic conditions.
Additional tests included gastroscopy, colonoscopy,
intestinal biopsy, pH monitoring, complete blood count,
and stool culture, which were relevant specifically to the
gastrointestinal symptomsof the CMA.
Outpatient care
Outpatient careconsidered included routinevisitsto pedi-
atricians, specialists(i.e., allergist), and occasionally to the
emergency department.
Inpatient care
Inpatient care included hospitalization and visits to the
emergency department that led to inpatient admission.
Unit costs
Costspresented are in 2010 Thai baht (THB). Treatment
unit costs were obtained from the Pharmacy Department
at King Chulalongkorn Memorial Hospital. Costs of the
nutrition to treat CMA included in the model were only
the marginal costs to those of the current milk diet if the
children did not have CMA. Unit costs of each resource
use (i.e., physician visits, lab tests, hospitalization) were
obtained from a Thai standard cost list developed specifi-
cally for health technology assessment20.
Model inputs (unit costsand medical resource use) for
each atopic condition are shown in the Appendix.
Sensitivity analysis
In order to account for uncertainty in the model, a prob-
abilistic sensitivity analysis where key inputs including
prevalence rates, costs, severity distribution, and quantity
of resourceusewerevaried simultaneously from replication
to replication (i.e., 10,000 replications were run) by sam-
pling from probability distributions was performed.
Proportionsof patientsutilizing each resource and propor-
tions of severe cases among each atopic condition were
varied randomly according to a beta distribution, while
quantity of resource use, unit costs, and prevalence rates
were varied according to a gamma distribution, assuming
20% standard deviations around the mean. Univariate
deterministic sensitivity analysis was also performed in
four key parameters: prevalence, quantity of resource use,
unit costs, and, since severe cases are usually associated
with highest costscompared to mild and moderate condi-
tion, proportion of severecases. Each parameter wasvaried
according to the95% confidence intervals, assuming stan-
dard deviationswere 20% of the mean, while other var-
iableswere holding constant.
Results
By applying the prevalence ratesof 10.1%, 10.3%, 11.1%,
and 3.6% for atopic dermatitis, chronic rhinitis, asthma
(i.e., recurrent wheeze), and CMA, respectively, to the
number of Thai children aged 0–5 years in 2010 (i.e.,
5,315,800), 536,896 cases of atopic dermatitis; 547,527
cases of chronic rhinitis; 590,054 cases of asthma; and
191,369 casesof CMA were identified.
Table 1 presents the total annual medical direct costs
of atopic diseases for all four conditions, which were
estimated to be THB 27.8 billion (US$899 million).
Treatments contributed largest to the total costs (46%),
followed by inpatient care (37%), outpatient care (12%),
and monitoring and lab tests (5%). Comparing the costs
among the atopic conditions, CMA was associated with
the highest costs (44% of the total burden), followed by
chronic rhinitis (25%), asthma (20%), and atopic derma-
titis (11%).
The average yearly medical cost of atopic diseases per
patient isdisplayed in Table 2. CMA wasassociated with
the highest per-patient annual cost (THB 64,383;
US$2077), with treatments accounting for the largest
cost component (68%). Inpatient care accounted for
20% of the total direct costs, while outpatient care
accounted for 8%. Monitoring and lab tests contributed
only 4% of the total costs, but still represent total annual
expenditures of close to THB 500 million (US$16 mil-
lion). The second most costly condition was chronic
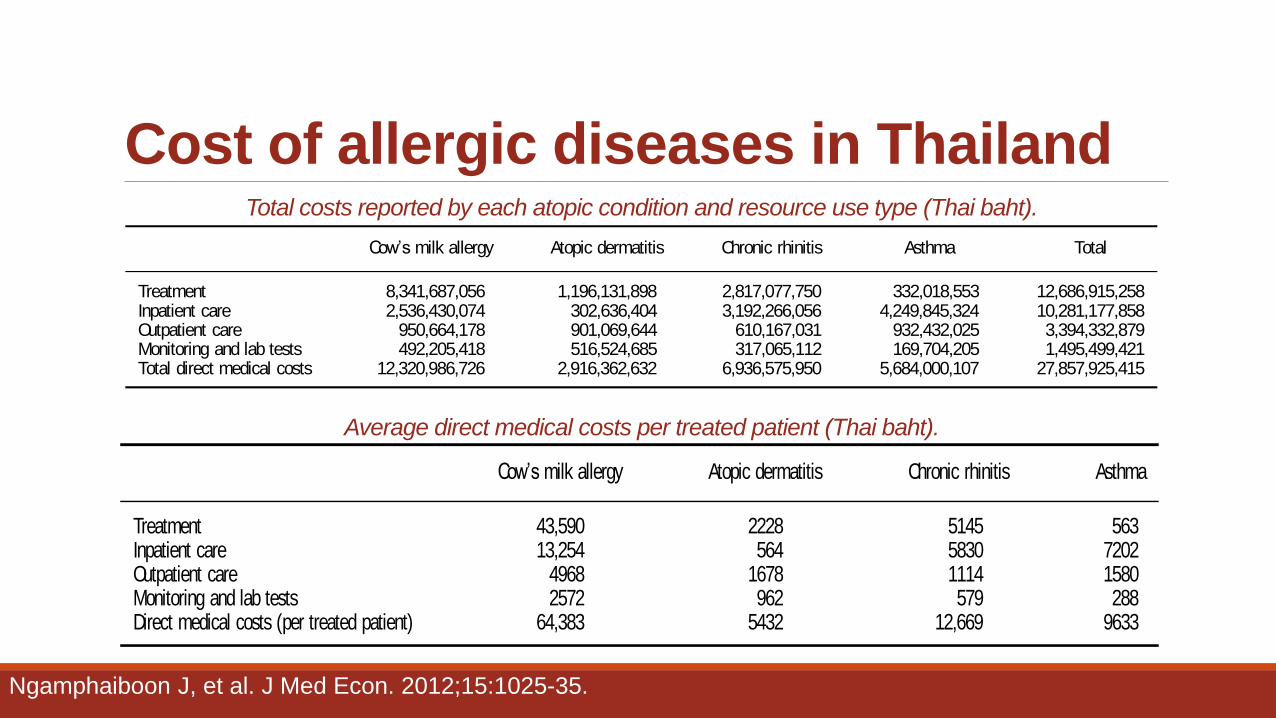
Table 1. Total costs reported by each atopic condition and resource use type (Thai baht).
Cow’s milk allergy Atopic dermatitis Chronic rhinitis Asthma Total
Treatment 8,341,687,056 1,196,131,898 2,817,077,750 332,018,553 12,686,915,258Inpatient care 2,536,430,074 302,636,404 3,192,266,056 4,249,845,324 10,281,177,858Outpatient care 950,664,178 901,069,644 610,167,031 932,432,025 3,394,332,879Monitoring and lab tests 492,205,418 516,524,685 317,065,112 169,704,205 1,495,499,421Total direct medical costs 12,320,986,726 2,916,362,632 6,936,575,950 5,684,000,107 27,857,925,415
Journal of Medical Economics 2012
4 Direct medical cost of atopic disease in Thailand Ngamphaiboon et al. www.informahealthcare.com/jme ! 2012 Informa UKLtd
Jou
rnal
of
Med
ical
Eco
no
mic
s D
ow
nlo
aded f
rom
in
form
ahea
lthcar
e.co
m b
y U
nit
ed B
ioS
ourc
e C
orp
on
07/2
4/1
2F
or
per
sonal
use
on
ly.
Total costs reported by each atopic condition and resource use type (Thai baht).
rhinitis, with an estimated per-patient annual cost of
THB 12,669 (US$409). The majority of the costs were
associated with inpatient care (46%) and treatments
(41%). Costsof outpatient care and monitoring and diag-
nostic tests accounted for only 9% and 4%, respectively.
Annual cost per child with asthma wasestimated at THB
9633 (US$312), slightly lower than the cost of chronic
rhinitis. The main cost driver for asthma was related to
inpatient care (75%), followed by outpatient care (16%),
treatments(6%), and then monitoringand laboratory tests
(3%). Atopic dermatitis was estimated with the lowest
annual per-patient cost (THB 5432; US$175). The aver-
age treatment cost that was the largest cost component,
representing 41% of the total costs, wasestimated at THB
2228 (US$72). Outpatient care accounted for 31% and
monitoring and diagnostic testsfor 18%. Sinceatopic der-
matitis isgenerally managed on an outpatient basis, inpa-
tient care costsaccounted for only 10% of the total costs.
Probabilistic sensitivity analysis revealed a 95% confi-
denceinterval of thetotal direct medical costsranged from
THB 22.1 billion (US$712 million) to THB 29.7 billion
(US$957 million). In addition, the results from the
univariate sensitivity analysis are graphically shown as a
tornado diagram in Figure 2. In all scenarios, varying
parameters to the lower bound of the 95% confidence
interval resulted in a decrease in the total annual direct
medical costs. Reciprocally, increasing the parameters to
theupper boundsconsistently increased theresulting total
costs. The top three parameters that had the most influ-
ence on the total medical direct costswere thequantity of
treatmentsused, treatment costs, and prevalenceof CMA.
Varying the amount of treatments consumed from the
lower bound to the upper bound of its 95% confidence
interval fluctuated the total direct costs from THB 23.4
billion (US$754 million; decreased by 16%) to THB 33.3
billion (US$1074 million; increased by 20%), respec-
tively. Similarly, the total medical direct costs decreased
to THB 23.4 billion (US$756 million) and increased to
THB 33.2 billion (US$1072 million) when treatment
costs were varied from the lower to the upper bounds of
its 95% confidence interval. Lowering the prevalence of
CMA to thelower bound (i.e., 2.3%) wasassociated with a
decrease in the total direct costs to THB 23.4 billion
(US$755 million), whereasthe total direct costsincreased
to THB 33.0 billion (US$1064 million) when the preva-
lence increased to 5.1%.
Lowering theaveragequantity useof inpatient and out-
patient care to the lower bound decreased the total direct
costs by 13% and 4%, respectively, while increasing the
average quantity to the upper bound increased the total
direct costsby 16% and 5%. Varying the average quantity
use in monitoring and lab tests had the smallest impact
compared to variations in the inpatient care, outpatient
care, and treatments utilization. This resulted in the
change from 2% (negative sign indicates a decrease in
the total costs from base case) to 2%.
Variation in inpatient and outpatient care costs is
shown to have a relatively moderate effect on the total
direct costs. Decreasing unit costs of inpatient care (i.e.,
hospital per diem cost) and outpatient care (i.e., cost per
visit) resulted in reduction in the total costs by 13% and
4%, respectively. An increase in inpatient or outpatient
care unit costsresulted in an increase in the total costsby
14% and 5%, respectively.
Regardingtheprevalence, whereasvaryingtheinput on
prevalence of CMA had substantial impact on the results,
smaller impacts are observed when varying prevalence of
chronic rhinitis (i.e., total costs were varied by 9% to
11% for lower and higher prevalence, respectively),
followed by that of asthma (by 7% to 9%) and atopic
dermatitis ( 4% to 4%), respectively.
Theresultsfrom thebasecasehaveshown that thecost
of monitoring and lab testscontributed to only 5% of the
total direct cost. Variation in the unit cost of monitoring
and lab tests over the 95% confidence interval slightly
affected the total direct cost, resulting in the changes of
up to 2% compared to base case results.
Although severe cases are associated with highest cost
compared to illness with milder severity, varying the pro-
portion of severecasesin each atopic condition had shown
only a limited impact to the total costs. Varying this
parameter for each atopic condition resulted in a decrease
or an increasein thetotal costsby only up to 3% compared
to the base case.
Discussion
Atopic diseasesimpose asubstantial burden on healthcare
resources in Thailand as shown by the results from
Table 2. Average direct medical costs per treated patient (Thai baht).
Cow’s milk allergy Atopic dermatitis Chronic rhinitis Asthma
Treatment 43,590 2228 5145 563Inpatient care 13,254 564 5830 7202Outpatient care 4968 1678 1114 1580Monitoring and lab tests 2572 962 579 288Direct medical costs (per treated patient) 64,383 5432 12,669 9633
Journal of Medical Economics 2012
! 2012 Informa UKLtd www.informahealthcare.com/jme Direct medical cost of atopic disease in Thailand Ngamphaiboon et al. 5
Jou
rnal
of
Medic
al
Eco
nom
ics D
ow
nlo
ad
ed
fro
m i
nfo
rmah
ealt
hcare
.co
m b
y U
nit
ed B
ioS
ou
rce C
orp
on
07
/24/1
2F
or
pers
on
al
use o
nly
.
Average direct medical costs per treated patient (Thai baht).
Ngamphaiboon J, et al. J Med Econ. 2012;15:1025-35.
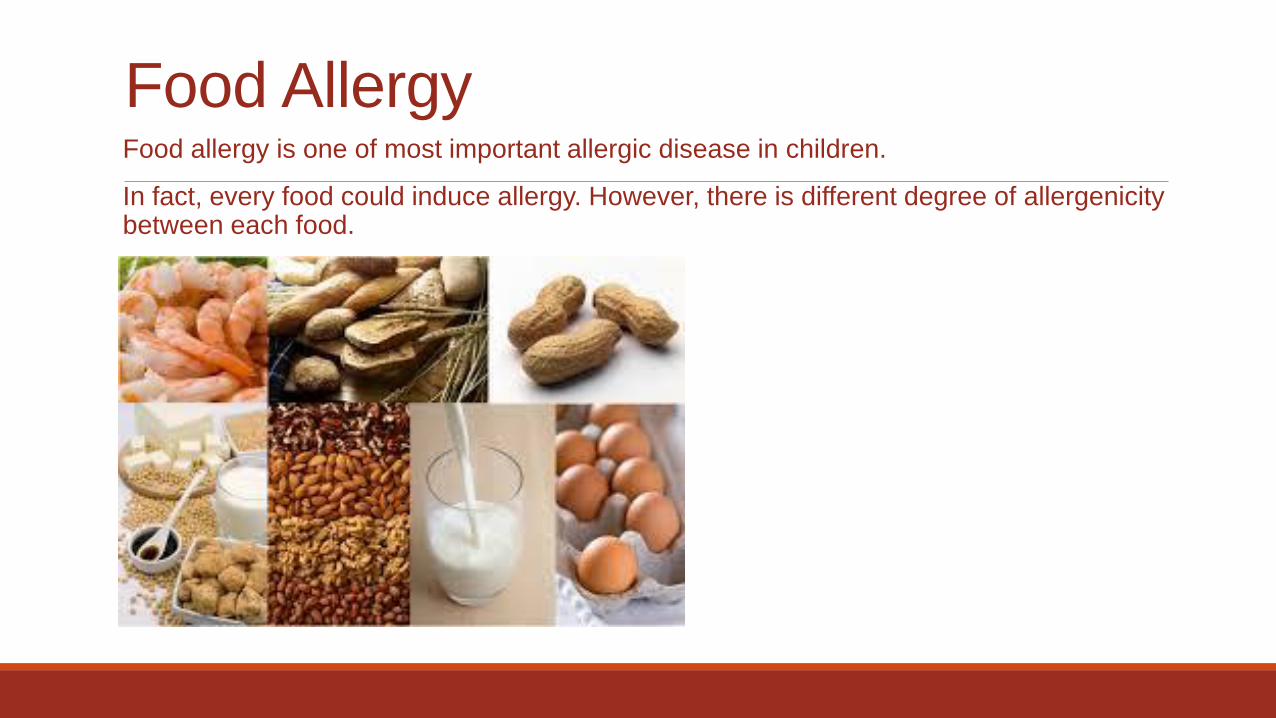
Food Allergy Food allergy is one of most important allergic disease in children.
In fact, every food could induce allergy. However, there is different degree of allergenicity between each food.
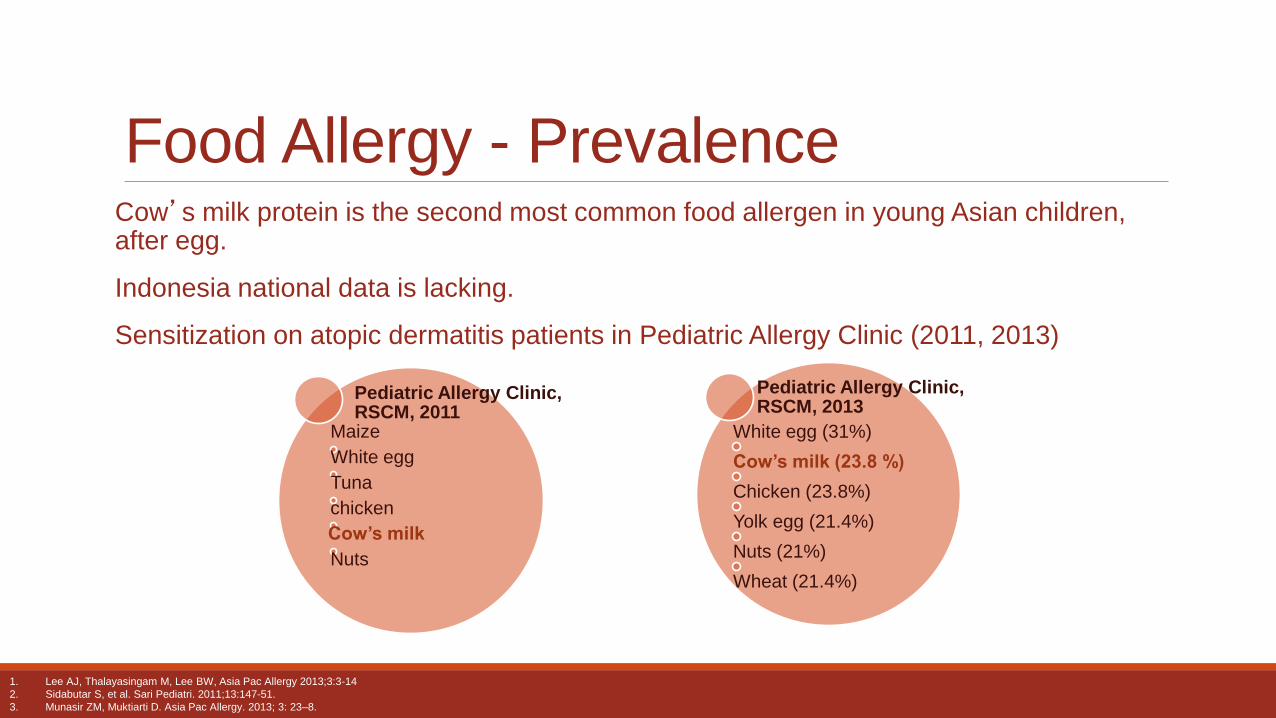
Cow’s milk protein is the second most common food allergen in young Asian children, after egg.
Indonesia national data is lacking.
Sensitization on atopic dermatitis patients in Pediatric Allergy Clinic (2011, 2013)
Food Allergy - Prevalence
Pediatric Allergy Clinic, RSCM, 2013
White egg (31%)
Cow’s milk (23.8 %)
Chicken (23.8%)
Yolk egg (21.4%)
Nuts (21%)
Wheat (21.4%)
Pediatric Allergy Clinic, RSCM, 2011
Maize
White egg
Tuna
chicken
Cow’s milk
Nuts
1. Lee AJ, Thalayasingam M, Lee BW, Asia Pac Allergy 2013;3:3-14
2. Sidabutar S, et al. Sari Pediatri. 2011;13:147-51.
3. Munasir ZM, Muktiarti D. Asia Pac Allergy. 2013; 3: 23–8.
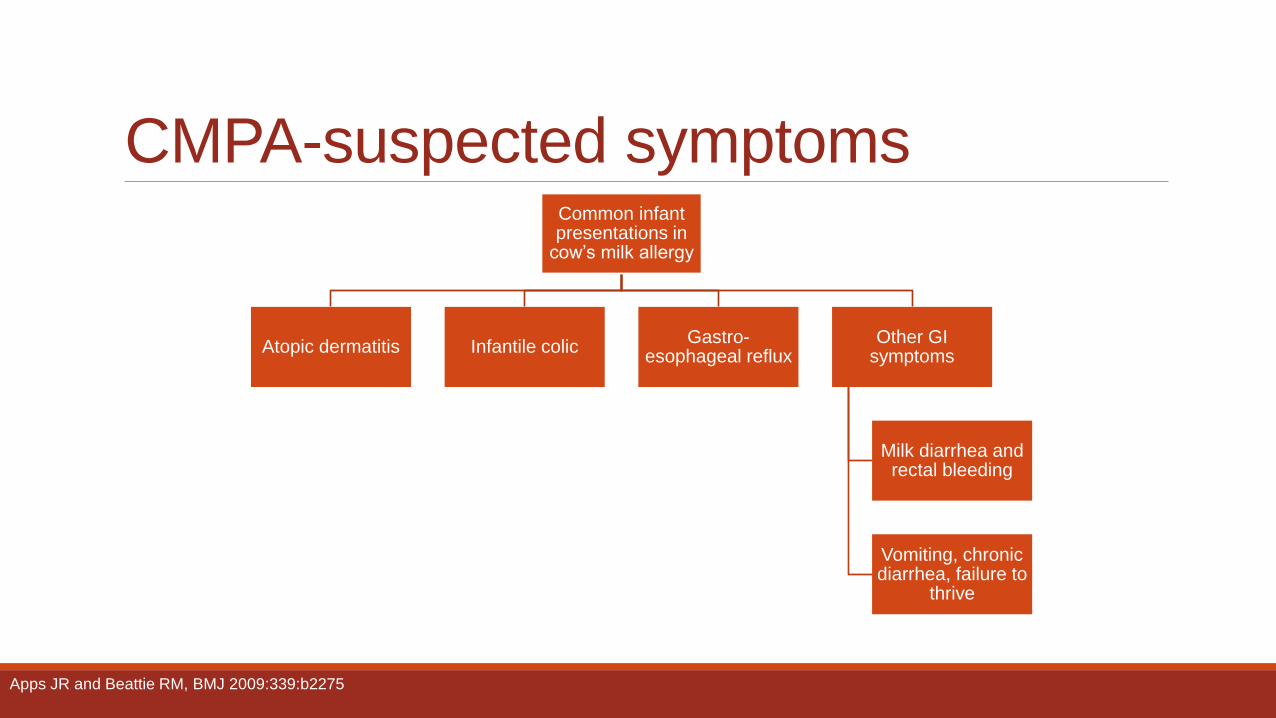
CMPA-suspected symptoms Common infant presentations in
cow’s milk allergy
Atopic dermatitis Infantile colic Gastro-
esophageal reflux Other GI
symptoms
Milk diarrhea and rectal bleeding
Vomiting, chronic diarrhea, failure to
thrive
Apps JR and Beattie RM, BMJ 2009:339:b2275

How to Prevent Allergic Diseases?
Allergic Diseases Prevention
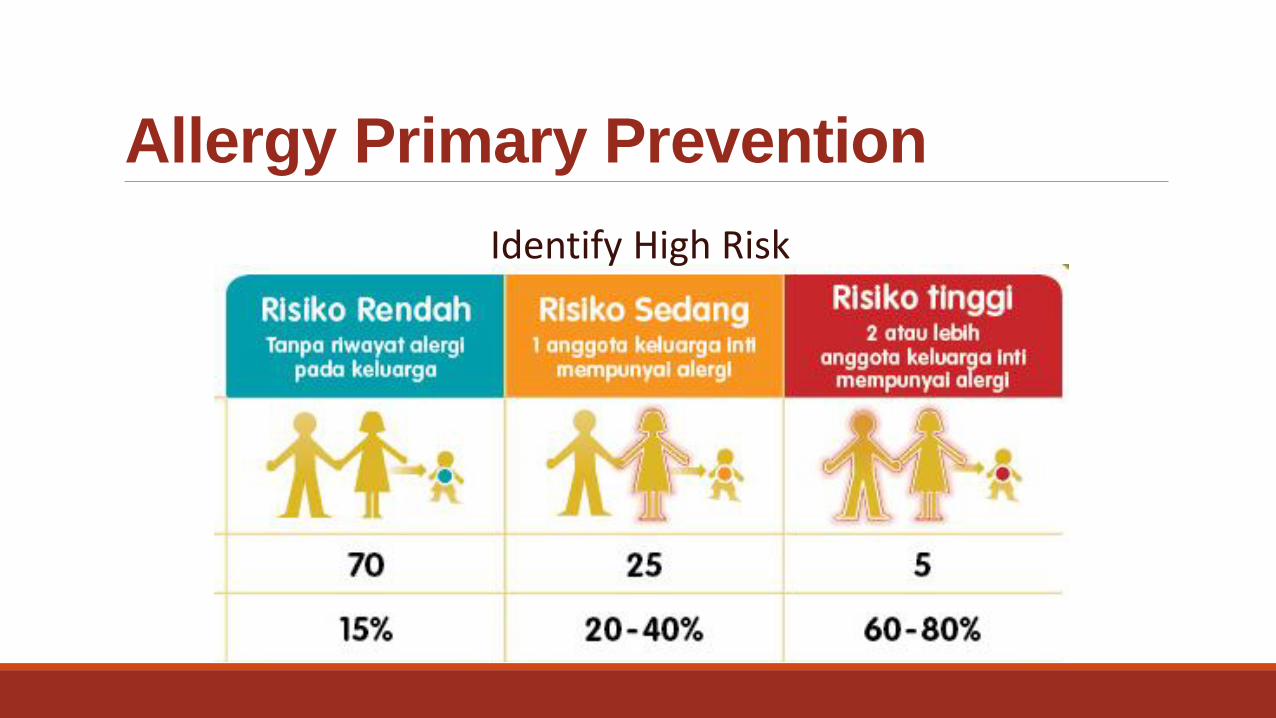
Allergy Primary Prevention
Identify High Risk
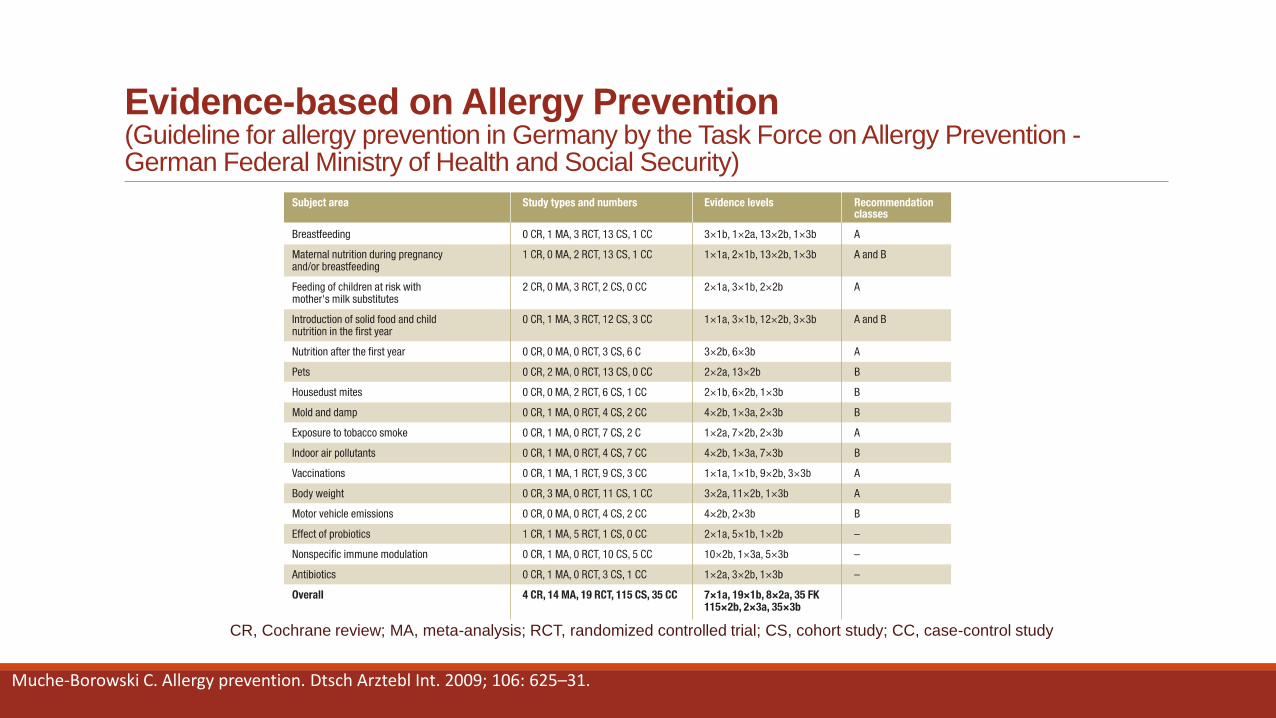
Evidence-based on Allergy Prevention (Guideline for allergy prevention in Germany by the Task Force on Allergy Prevention - German Federal Ministry of Health and Social Security)
CR, Cochrane review; MA, meta-analysis; RCT, randomized controlled trial; CS, cohort study; CC, case-control study
Muche-Borowski C. Allergy prevention. Dtsch Arztebl Int. 2009; 106: 625–31.
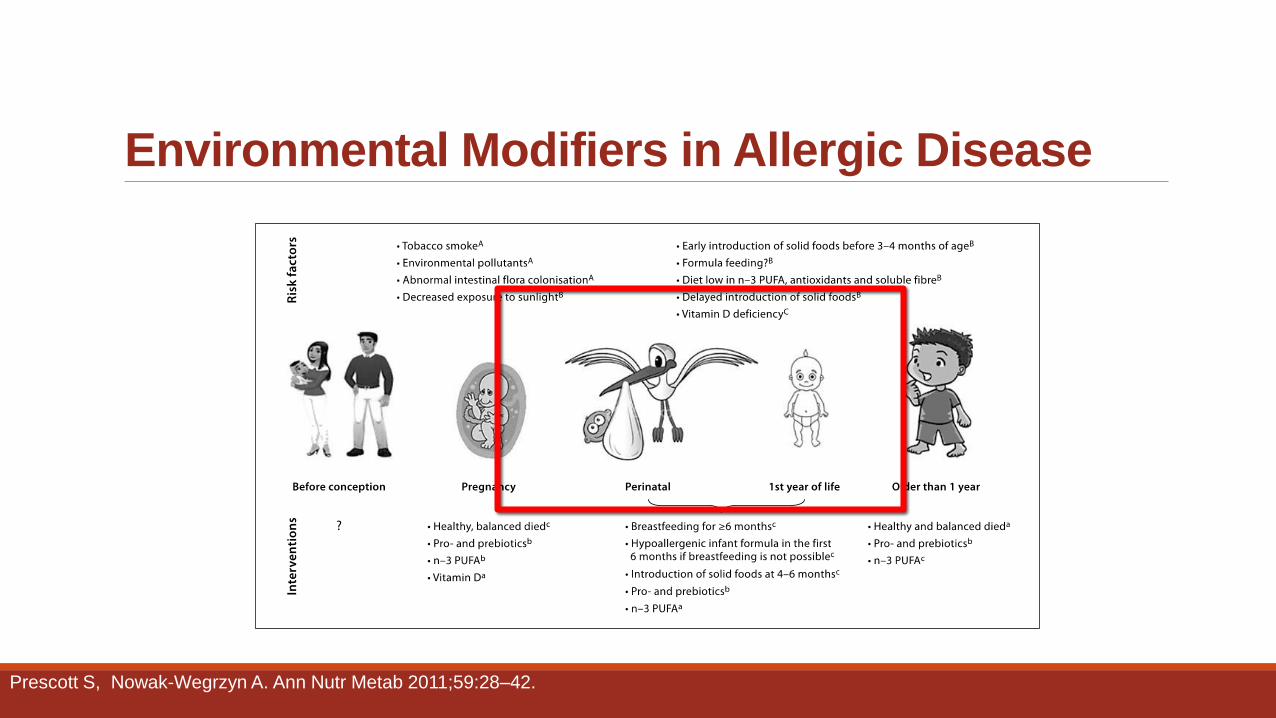
Environmental Modifiers in Allergic Disease
Prescott S, Nowak-Wegrzyn A. Ann Nutr Metab 2011;59:28–42.
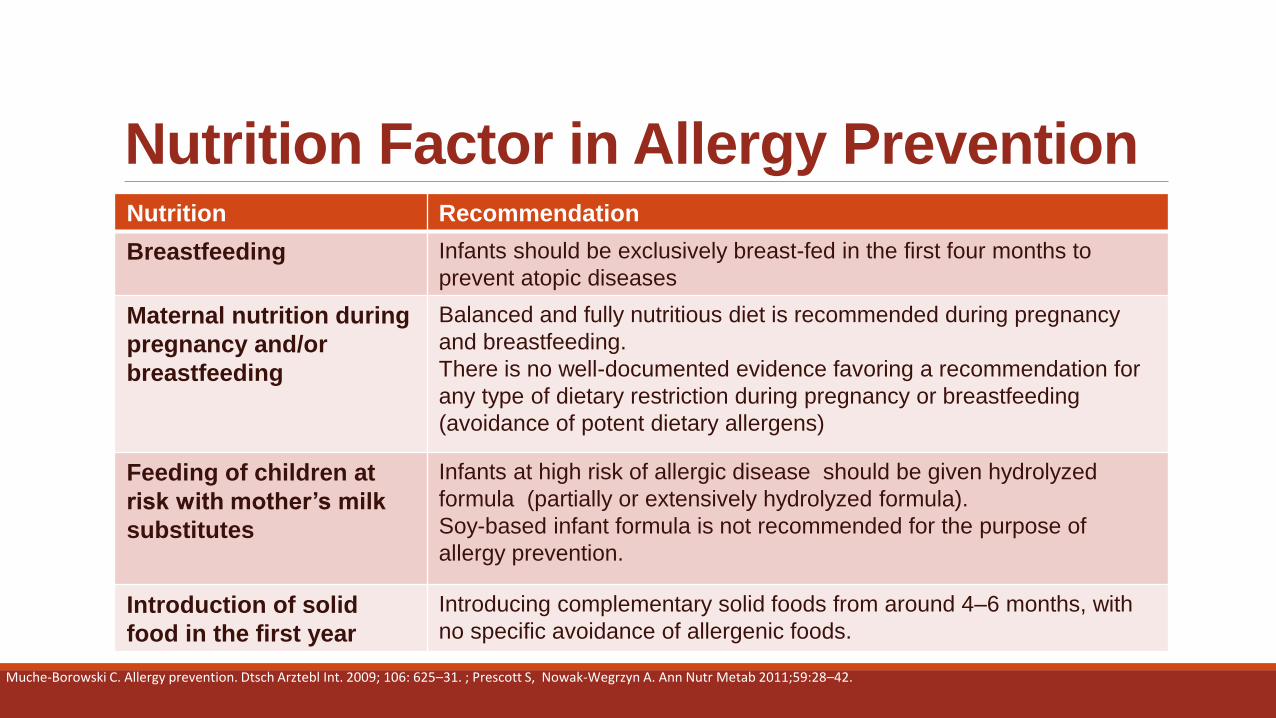
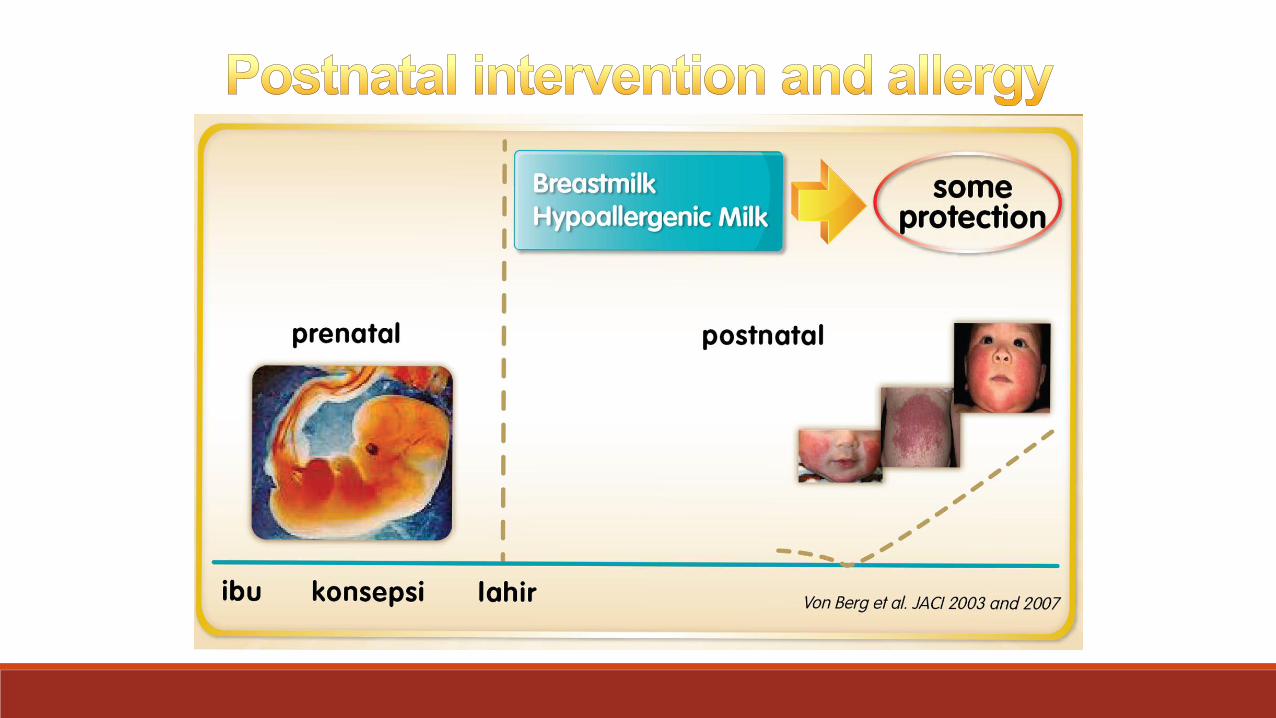
Nutrition Factor in Allergy Prevention Nutrition Recommendation
Breastfeeding Infants should be exclusively breast-fed in the first four months to
prevent atopic diseases
Maternal nutrition during
pregnancy and/or
breastfeeding
Balanced and fully nutritious diet is recommended during pregnancy
and breastfeeding.
There is no well-documented evidence favoring a recommendation for
any type of dietary restriction during pregnancy or breastfeeding
(avoidance of potent dietary allergens)
Feeding of children at
risk with mother’s milk
substitutes
Infants at high risk of allergic disease should be given hydrolyzed
formula (partially or extensively hydrolyzed formula).
Soy-based infant formula is not recommended for the purpose of
allergy prevention.
Introduction of solid
food in the first year
Introducing complementary solid foods from around 4–6 months, with
no specific avoidance of allergenic foods.
Muche-Borowski C. Allergy prevention. Dtsch Arztebl Int. 2009; 106: 625–31. ; Prescott S, Nowak-Wegrzyn A. Ann Nutr Metab 2011;59:28–42.
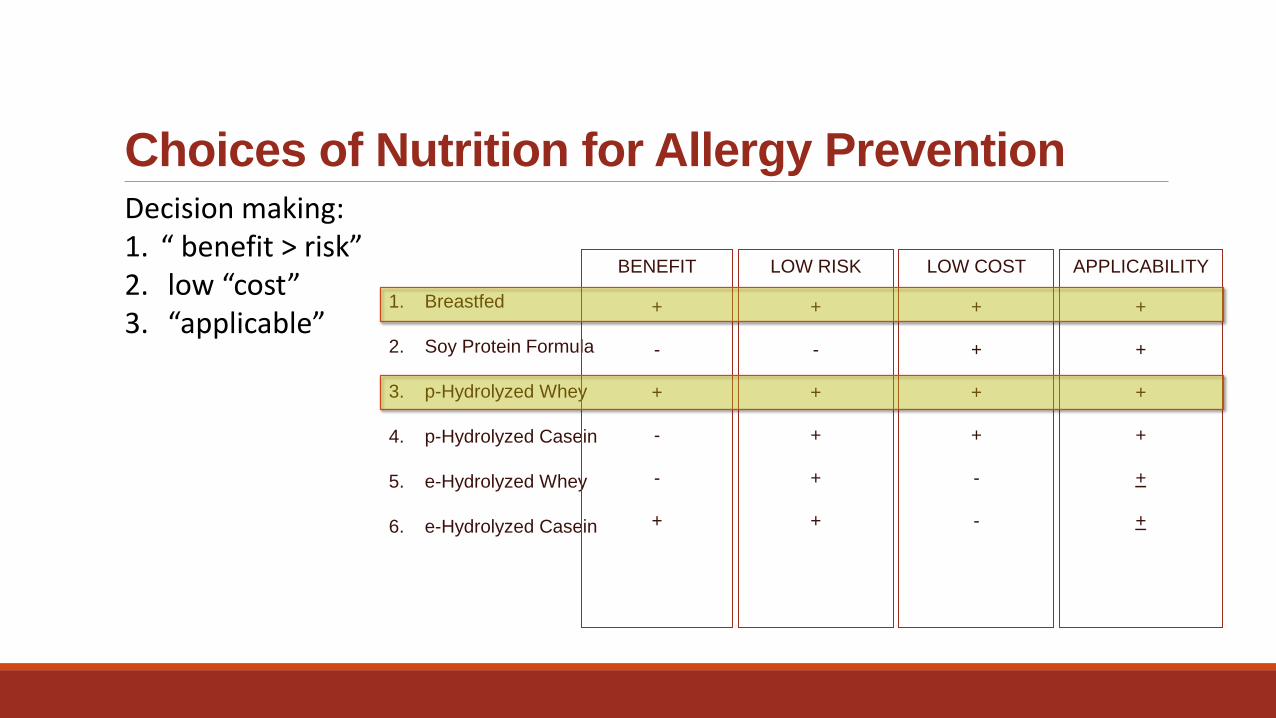
Decision making: 1. “ benefit > risk” 2. low “cost” 3. “applicable”
Choices of Nutrition for Allergy Prevention
1. Breastfed
2. Soy Protein Formula
3. p-Hydrolyzed Whey
4. p-Hydrolyzed Casein
5. e-Hydrolyzed Whey
6. e-Hydrolyzed Casein
APPLICABILITY
+
+
+
+
+
+
LOW COST
+
+
+
+
-
-
LOW RISK
+
-
+
+
+
+
BENEFIT
+
-
+
-
-
+
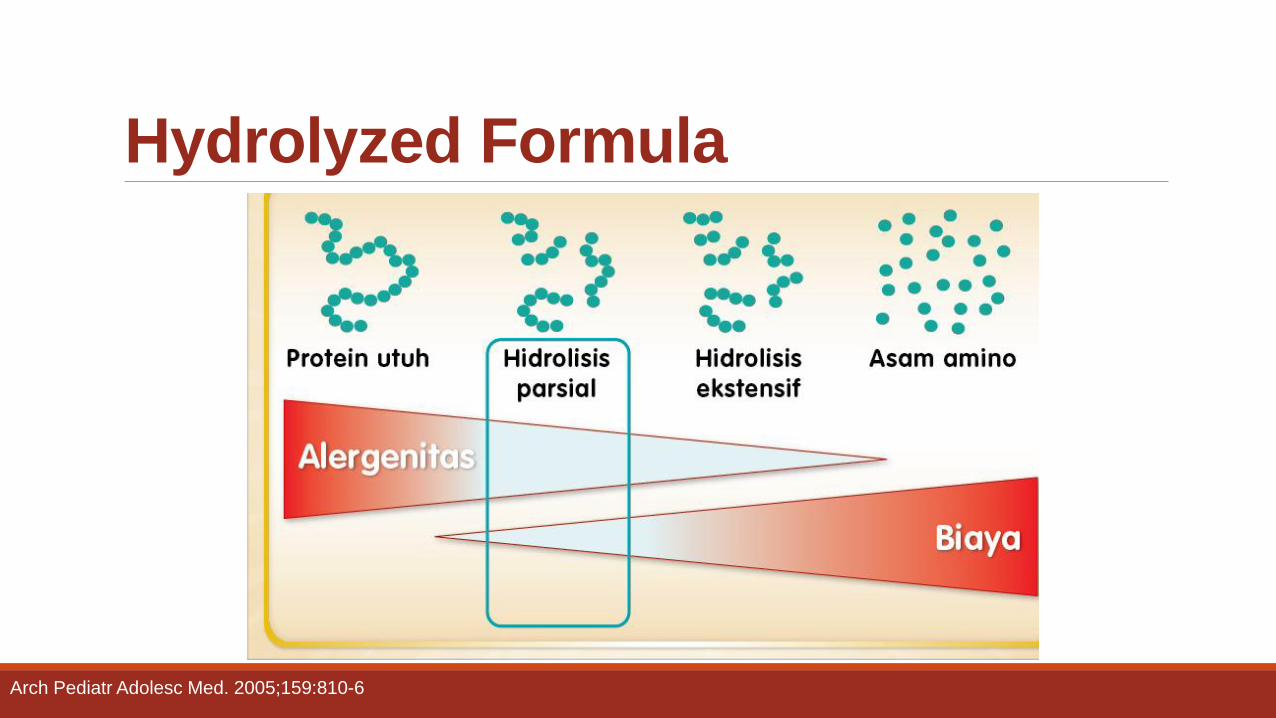
Hydrolyzed Formula
Arch Pediatr Adolesc Med. 2005;159:810-6
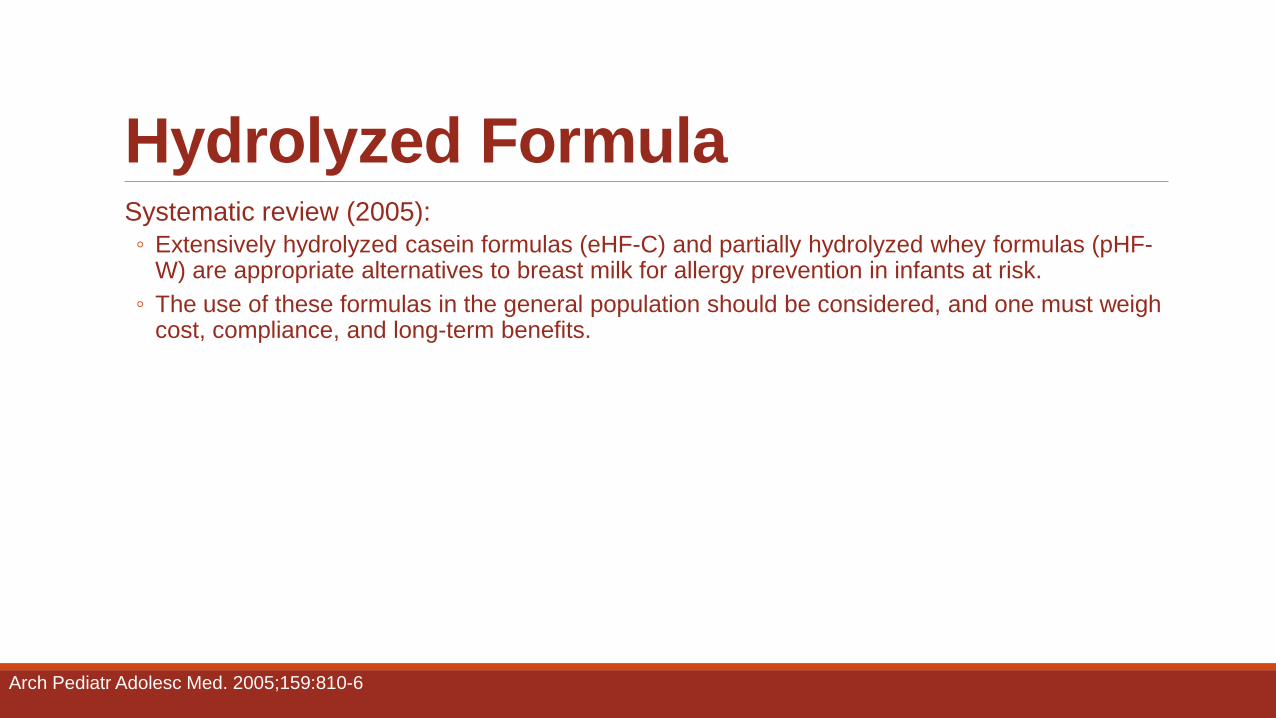
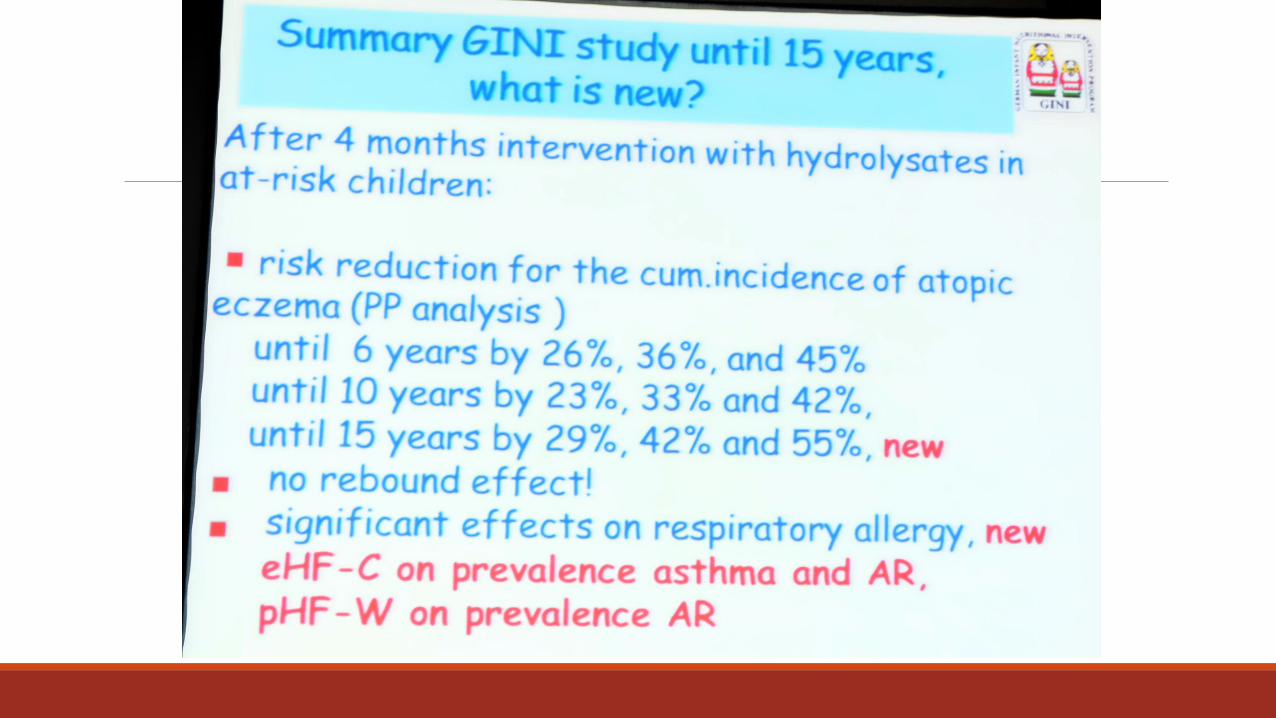
Hydrolyzed Formula Systematic review (2005):
◦ Extensively hydrolyzed casein formulas (eHF-C) and partially hydrolyzed whey formulas (pHF-W) are appropriate alternatives to breast milk for allergy prevention in infants at risk.
◦ The use of these formulas in the general population should be considered, and one must weigh cost, compliance, and long-term benefits.
Arch Pediatr Adolesc Med. 2005;159:810-6
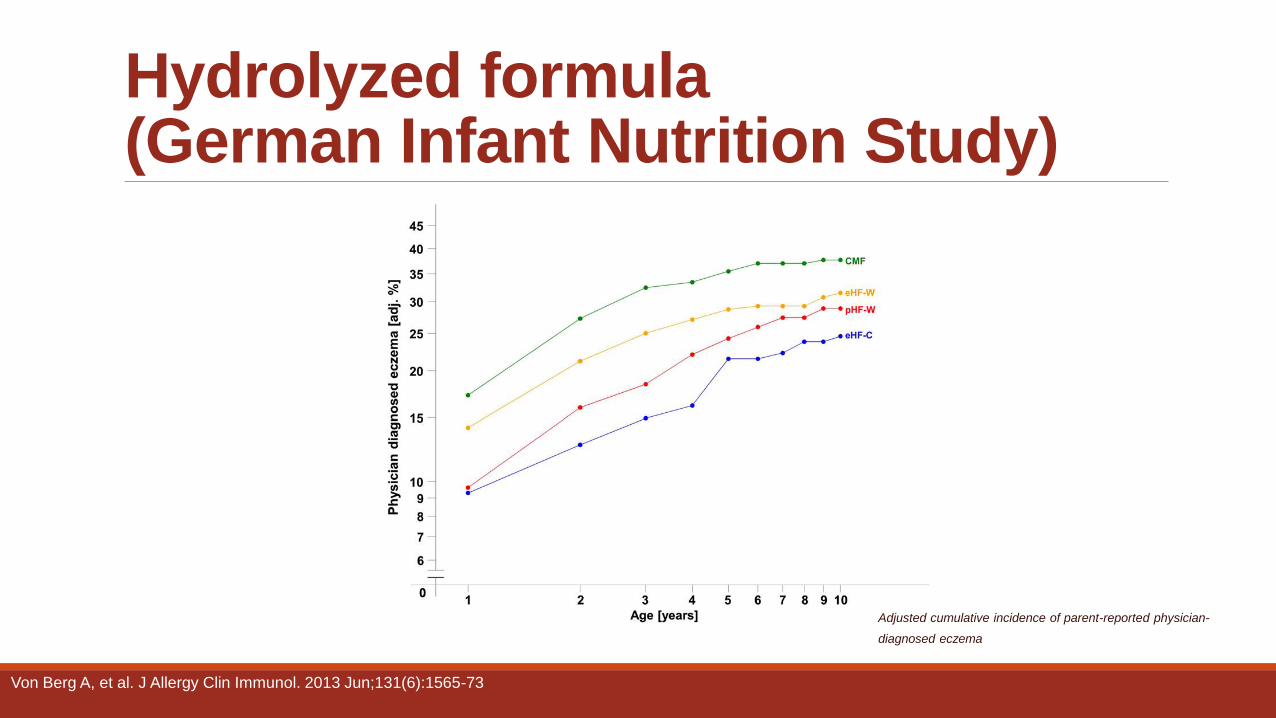
Hydrolyzed formula (German Infant Nutrition Study)
Adjusted cumulative incidence of parent-reported physician-
diagnosed eczema
Von Berg A, et al. J Allergy Clin Immunol. 2013 Jun;131(6):1565-73
ECONOMIC IMPACT OF NUTRITION INTERVENTION AS ALLERGIC PREVENTION

Conclusions Primary prevention of allergic diseases should be started in early life.
If breastfeeding is not possible, a partially hydrolyzed formula (pHF-W) is cost-effective for infants at high risk of allergic disease.

Primary
Allergy
Prevention
for Better
Indonesia
Generation
Thank You..