Travel Cost Methodsdgcenter.unpad.ac.id/wp-content/uploads/2019/04/3_Travel-Cost-Method.pdfTCM dan...
22
SDGs Center Travel Cost Method Dr. Zuzy Anna Deputy Director EEI Indonesia Universitas Padjadjaran Sekolah Valuasi 1
Transcript of Travel Cost Methodsdgcenter.unpad.ac.id/wp-content/uploads/2019/04/3_Travel-Cost-Method.pdfTCM dan...
SDGs Center
Travel Cost Method
Dr. Zuzy Anna
Deputy Director EEI Indonesia
Universitas Padjadjaran
Sekolah Valuasi 1
1
2
3
4
5
Konsep Dasar TCM
Sekolah Valuasi 2
OUTLINE
TCM dan Surplus Konsumen
Pendekatan TCM
Studi Kasus
Kelebihan dan Kelemahan TCM

Travel Cost Method
• Merupakan salah satu metode revealed preference untuk non-usevalue, yang didasari pada perilaku yang diamati, yakni pengeluaranindividu untuk perjalanan.
• Metode ini biasanya digunakan untuk menilai komponen non-usevalue dari tempat rekreasi.
• Komponen yang diamati adalah perjalanan ke tempat rekreasi yangdikeluarkan seseorang.
• Metode ini pertama kali dikembangkan oleh Wood and Trice (1958)dan Clawson and Knetsch (1966).
Sekolah Valuasi 3
Konsep Dasar Travel Cost Method
• Prinsip dasar metode ini dari teori permintaan konsumen, yaitu nilailingkungan (merupakan atribut yang tidak dipasarkan) yangdiberikan seseorang merupakan biaya yang dikeluarkan orang tsbuntuk mengunjungi lingkungan.
• Biaya “konsumsi” layanan jasa lingkungan ini dapat berupa biayatransportasi, biaya masuk, pengeluaran di tempat rekreasi, danbiaya korbanan waktu yang dikeluarkan oleh seseorang.
• Asumsi dasar dari model TCM adalah bahwa perjalanan dan tempatrekreasi bersifat komplementari lemah (Weak Complementary),sehingga nilai tempat rekreasi dapat diukur dari biaya perjalanan.
Sekolah Valuasi 4

TCM dan Surplus Konsumen
Sekolah Valuasi 5
Biaya/trip/orang
C max
C0
Surplus konsumen
A
Fungsi permintaan perjalanan
Pengeluaran wisata
Trip Generation Function (Hubungan antara jumlahkunjungan dan besaran biaya):
V=f(TC,X)
dimana V = Jumlah kunjungan ke suatu lokasiX = variabel sosial ekonomi lainnya
x

Pendekatan TCM
Individual Travel Cost Method (ITCM)
Didasarkan pada survei pada pengunjung tempat rekreasi.
Zone Travel Cost Method (ZTCM)
•Pendekatan yang didasarkan pada data sekunder, dimana jumlah kunjungandiduga merupakan fungsi dari biaya perjalanan yang didasarkan pada zonawilayah relatif terhadap tempat wisata.
Random Utility Model (RUM)
Metode ini lebih kompleks dan memerlukan pendekatan ekonometrika yang jugakompleks.
Sekolah Valuasi 6
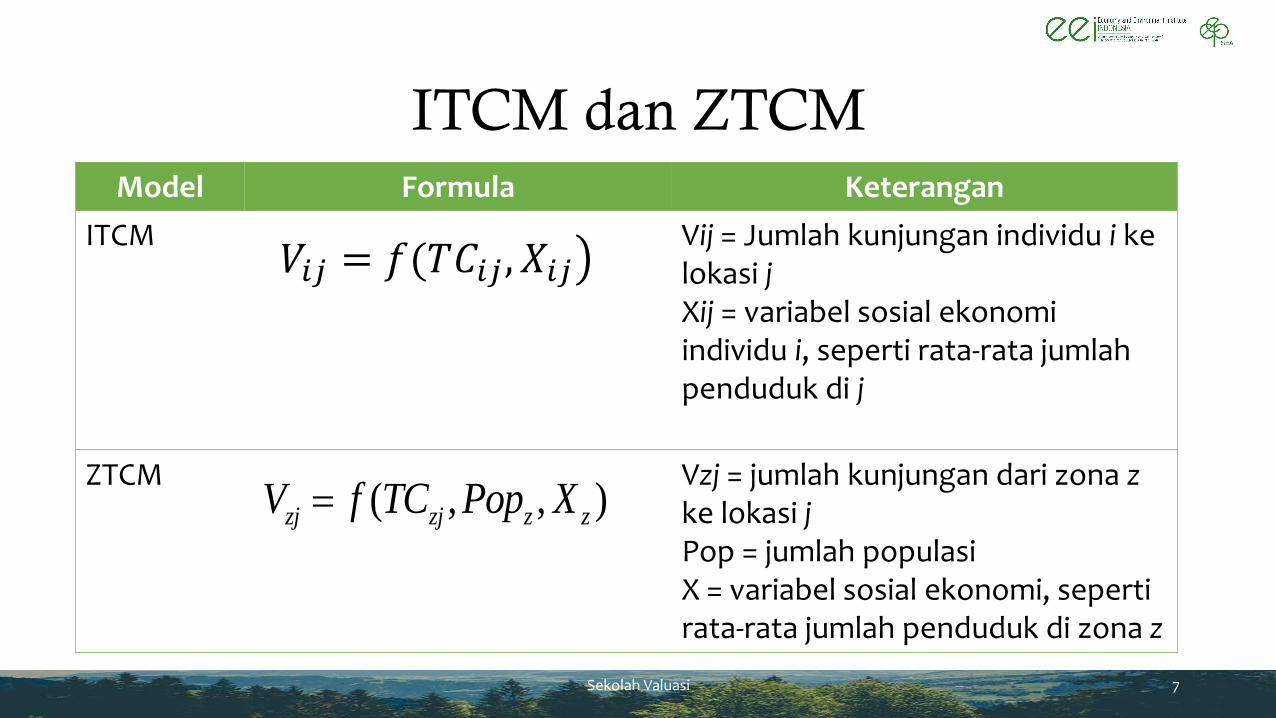
ITCM dan ZTCM
Sekolah Valuasi 7
Model Formula Keterangan
ITCM Vij = Jumlah kunjungan individu i kelokasi jXij = variabel sosial ekonomiindividu i, seperti rata-rata jumlahpenduduk di j
ZTCM Vzj = jumlah kunjungan dari zona zke lokasi jPop = jumlah populasiX = variabel sosial ekonomi, sepertirata-rata jumlah penduduk di zona z
൯𝑉𝑖𝑗 = 𝑓(𝑇𝐶𝑖𝑗 , 𝑋𝑖𝑗
( , , )zj zj z zV f TC Pop X=
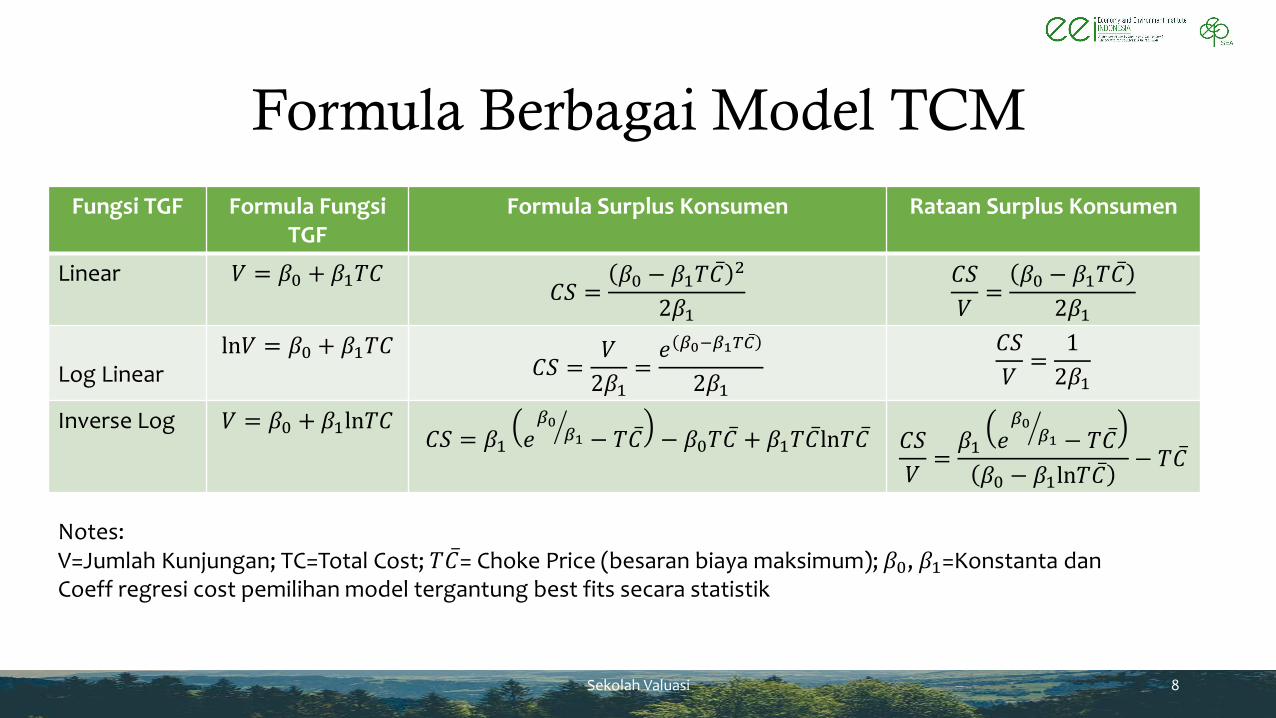
Formula Berbagai Model TCM
Sekolah Valuasi 8
Fungsi TGF Formula FungsiTGF
Formula Surplus Konsumen Rataan Surplus Konsumen
Linear 𝑉 = 𝛽0 + 𝛽1𝑇𝐶𝐶𝑆 =
𝛽0 − 𝛽1𝑇 ҧ𝐶 2
2𝛽1
𝐶𝑆
𝑉=
𝛽0 − 𝛽1𝑇 ҧ𝐶
2𝛽1
Log Linearln𝑉 = 𝛽0 + 𝛽1𝑇𝐶
𝐶𝑆 =𝑉
2𝛽1=𝑒 𝛽0−𝛽1𝑇 ҧ𝐶
2𝛽1
𝐶𝑆
𝑉=
1
2𝛽1
Inverse Log 𝑉 = 𝛽0 + 𝛽1ln𝑇𝐶𝐶𝑆 = 𝛽1 𝑒
൘𝛽0
𝛽1 − 𝑇 ҧ𝐶 − 𝛽0𝑇 ҧ𝐶 + 𝛽1𝑇 ҧ𝐶ln𝑇 ҧ𝐶 𝐶𝑆
𝑉=𝛽1 𝑒
൘𝛽0
𝛽1 − 𝑇 ҧ𝐶
𝛽0 − 𝛽1ln𝑇 ҧ𝐶− 𝑇 ҧ𝐶
Notes:V=Jumlah Kunjungan; TC=Total Cost; 𝑇 ҧ𝐶= Choke Price (besaran biaya maksimum); 𝛽0, 𝛽1=Konstanta danCoeff regresi cost pemilihan model tergantung best fits secara statistik
Studi Nilai Ekonomi Pariwisata Dari Taman Nasional(Anna and Saputra, 2017)
Sekolah Valuasi 9
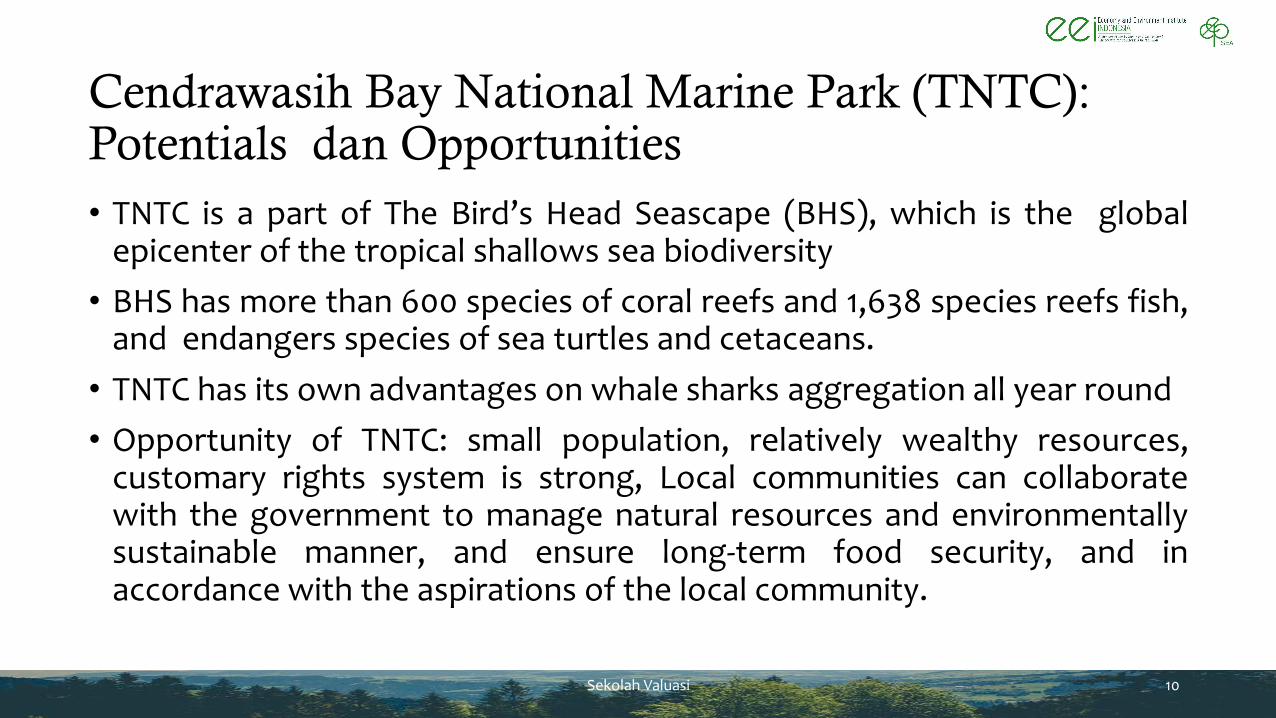
Cendrawasih Bay National Marine Park (TNTC): Potentials dan Opportunities
• TNTC is a part of The Bird’s Head Seascape (BHS), which is the globalepicenter of the tropical shallows sea biodiversity
• BHS has more than 600 species of coral reefs and 1,638 species reefs fish,and endangers species of sea turtles and cetaceans.
• TNTC has its own advantages on whale sharks aggregation all year round
• Opportunity of TNTC: small population, relatively wealthy resources,customary rights system is strong, Local communities can collaboratewith the government to manage natural resources and environmentallysustainable manner, and ensure long-term food security, and inaccordance with the aspirations of the local community.
Sekolah Valuasi 10

Whale Sharks: TNTC’s Tourism Attraction Potentials
• Species in red list IUCN 2014 and CITES• Experienced a decline in population due to IUU
fishing, slow growth rate.
• Need to change the pattern management, fromhunting, to a spectacle.
• The value of the whale shark which is the value ofbiodiversity, may be higher than the value whenconsumed (anthropocentric value).
• Economic valuation studies need to be done tounderstand the value of whales sharks, including thevalue of the habitat (TNTC).
• The purpose of the study is to measure value of thewhale shark tourism and the trade offs and futuredevelopment of TNTC.
Sekolah Valuasi 11
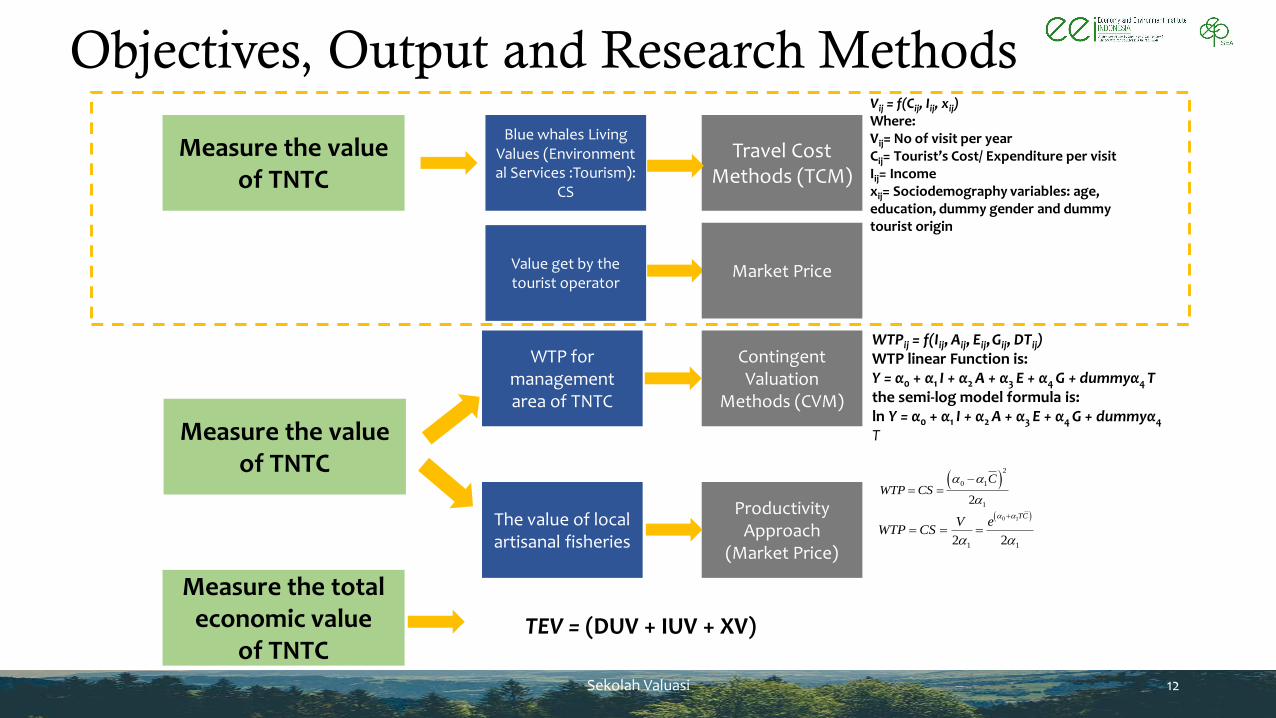
Objectives, Output and Research Methods
Sekolah Valuasi 12
Measure the value of TNTC
Measure the valueof TNTC
Blue whales Living Values (Environmental Services :Tourism):
CS
WTP for management area of TNTC
The value of local artisanal fisheries
Travel Cost Methods (TCM)
Contingent Valuation
Methods (CVM)
Productivity Approach
(Market Price)
TEV = (DUV + IUV + XV)
Measure the total economic value
of TNTC
WTPij = f(Iij, Aij, Eij, Gij, DTij)WTP linear Function is: Y = α0 + α1 I + α2 A + α3 E + α4 G + dummyα4 Tthe semi-log model formula is: ln Y = α0 + α1 I + α2 A + α3 E + α4 G + dummyα4
T
Vij = f(Cij, Iij, xij)Where: Vij= No of visit per yearCij= Tourist’s Cost/ Expenditure per visitIij= Incomexij= Sociodemography variables: age, education, dummy gender and dummy tourist origin
( )2
0 1
12
CWTP CS
−= =
( )0 1
1 12 2
TCV e
WTP CS
+
= = =
Value get by the tourist operator
Market Price

Tourists Visit 2011-2015
Sekolah Valuasi 13
Sumber:BBNTC 2013
Year Number of Tourists /Year Non Tax National Revenue
(PNPB)Rp Local Foreign Total
2011 408 339 747 80.250.000
2012 933 831 1764 221.605.000
2013 756 1046 1802 249.793.000
2014 872 1434 2306 369.999.000
2015 3144 2564 5708 586.160.000
Total 6113 6214 12327 1.507.807.000
Source: BBTNC (2016)
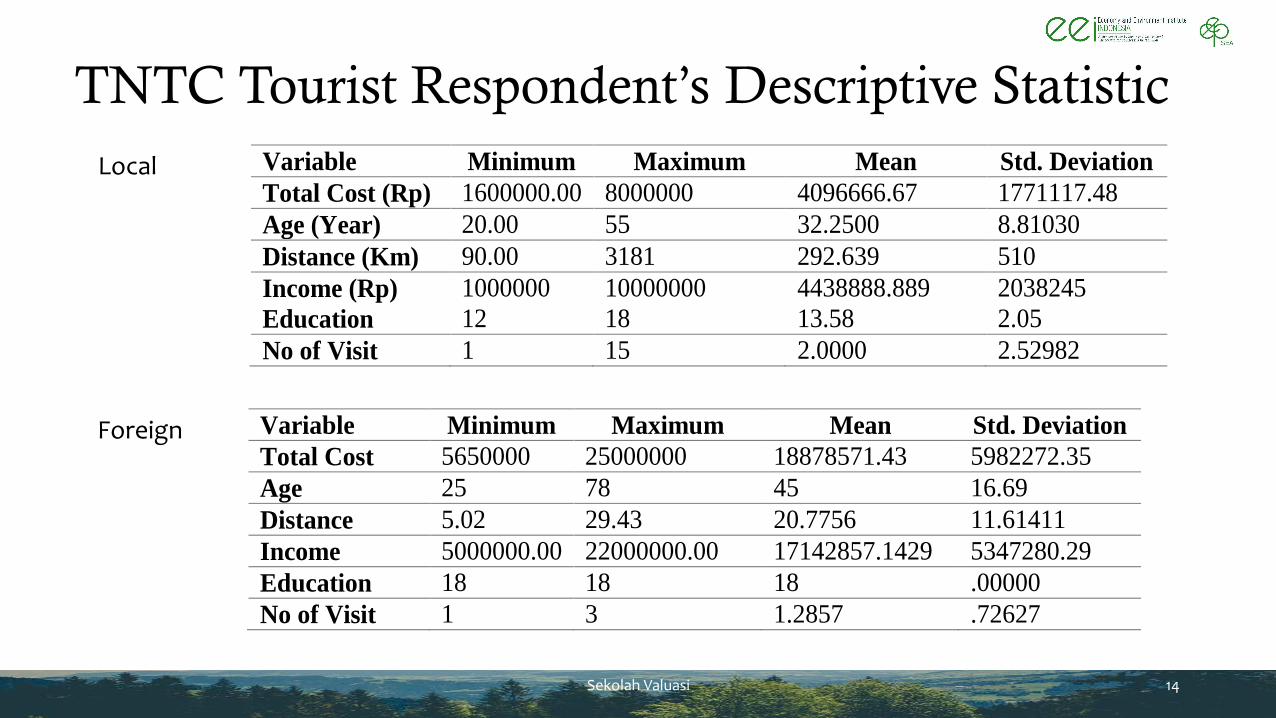
TNTC Tourist Respondent’s Descriptive Statistic
Sekolah Valuasi 14
Variable Minimum Maximum Mean Std. Deviation
Total Cost (Rp) 1600000.00 8000000 4096666.67 1771117.48
Age (Year) 20.00 55 32.2500 8.81030
Distance (Km) 90.00 3181 292.639 510
Income (Rp) 1000000 10000000 4438888.889 2038245
Education 12 18 13.58 2.05
No of Visit 1 15 2.0000 2.52982
Variable Minimum Maximum Mean Std. Deviation
Total Cost 5650000 25000000 18878571.43 5982272.35
Age 25 78 45 16.69
Distance 5.02 29.43 20.7756 11.61411
Income 5000000.00 22000000.00 17142857.1429 5347280.29
Education 18 18 18 .00000
No of Visit 1 3 1.2857 .72627
Local
Foreign
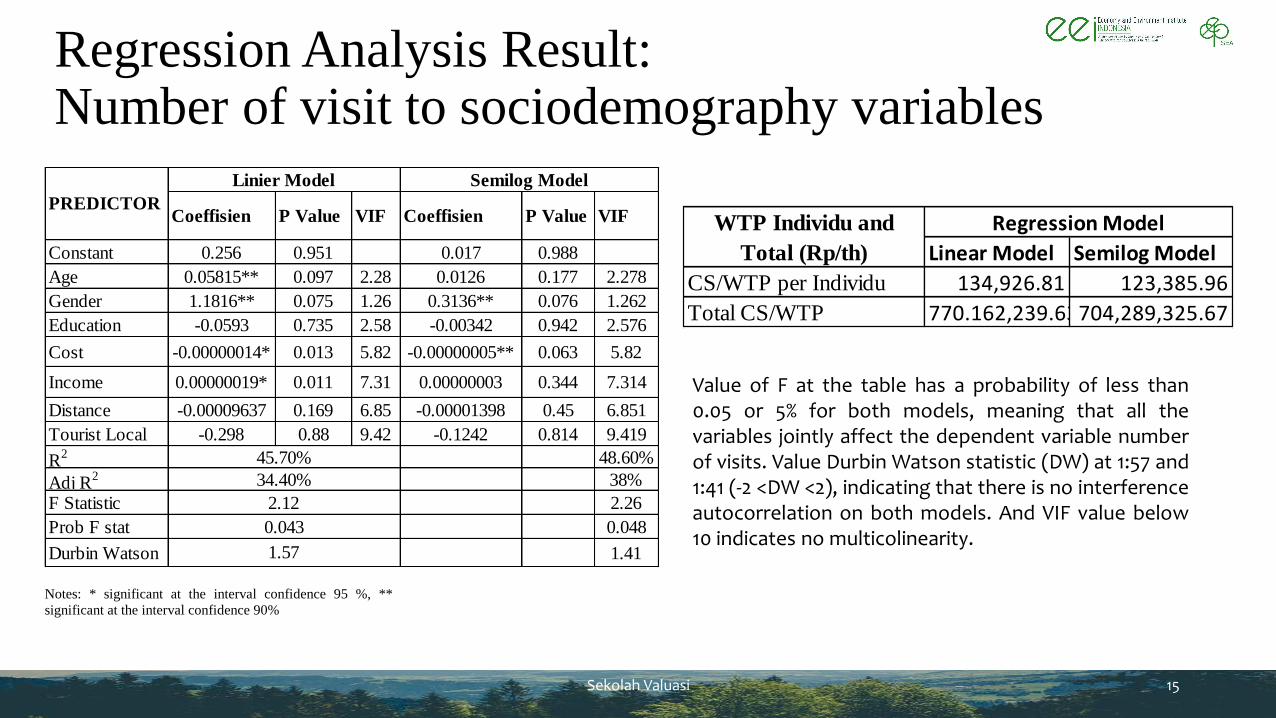
Regression Analysis Result:Number of visit to sociodemography variables
Sekolah Valuasi 15
Coeffisien P Value VIF Coeffisien P Value VIF
Constant 0.256 0.951 0.017 0.988
Age 0.05815** 0.097 2.28 0.0126 0.177 2.278
Gender 1.1816** 0.075 1.26 0.3136** 0.076 1.262
Education -0.0593 0.735 2.58 -0.00342 0.942 2.576
Cost -0.00000014* 0.013 5.82 -0.00000005** 0.063 5.82
Income 0.00000019* 0.011 7.31 0.00000003 0.344 7.314
Distance -0.00009637 0.169 6.85 -0.00001398 0.45 6.851
Tourist Local -0.298 0.88 9.42 -0.1242 0.814 9.419
R2 48.60%
Adj R2 38%
F Statistic 2.26
Prob F stat 0.048
Durbin Watson 1.41
0.043
1.57
PREDICTOR
Linier Model Semilog Model
45.70%
34.40%
2.12
Notes: * significant at the interval confidence 95 %, **
significant at the interval confidence 90%
Value of F at the table has a probability of less than0.05 or 5% for both models, meaning that all thevariables jointly affect the dependent variable numberof visits. Value Durbin Watson statistic (DW) at 1:57 and1:41 (-2 <DW <2), indicating that there is no interferenceautocorrelation on both models. And VIF value below10 indicates no multicolinearity.
Linear Model Semilog Model
CS/WTP per Individu 134,926.81 123,385.96
Total CS/WTP 770.162,239.63704,289,325.67
WTP Individu and
Total (Rp/th)
Regression Model

Total Economic Value TNTC/Year
Sekolah Valuasi 16
Utilization Methods Values (Rp)
Proxy WTP (CS) environmental services whale shark tourism.
Travel Cost Methods770,162,239.63
Value of TNTC (Tourist WTP to TNTC area) Contingent Valuation Methods (CVM) 35,445,812,154,345.00
Value of Fisheries economic local artisanal inTNTC
Productivity Approach/Market Value 2,578,036,578.95
Resources rent (PNBP) Secondary data 586,160,000.00
Tour operator Interview/Market price 400,000,000.00
Total Value of TNTC 35,450,146,513,163.60
Compare with the value of whalesharks Rp. 11,80 usd/kgRegeneration of whalesharks is on average 24 -30 years
So, what is the importance of knowing the value?
• Increase our awareness of how high the value of environmentalservices whale sharks, and also TNTC region, when compared withthe value of its extractive.
• The Value of TNTC, can be a proxy for the cost of management,mitigation cost, damage cost / compensation / restoration or forpayment for environmental services.
• Directives policy extractives or conservatives?
Sekolah Valuasi 17
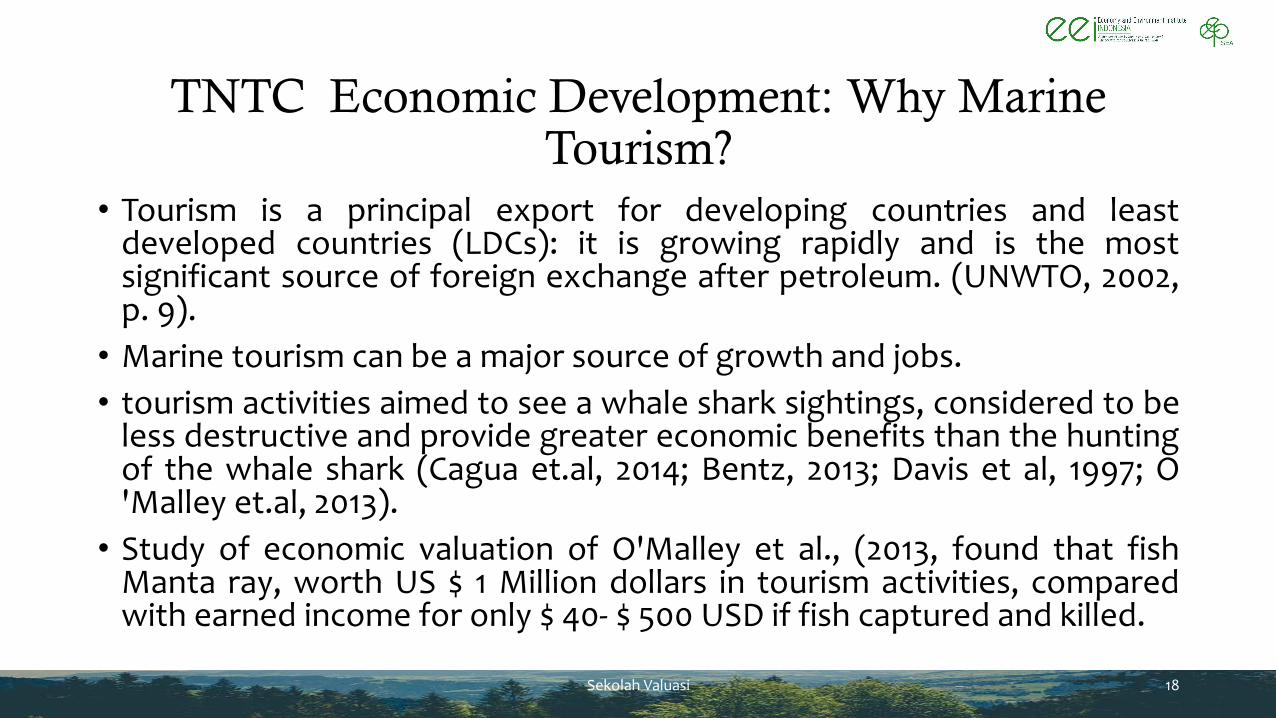
TNTC Economic Development: Why Marine Tourism?
• Tourism is a principal export for developing countries and leastdeveloped countries (LDCs): it is growing rapidly and is the mostsignificant source of foreign exchange after petroleum. (UNWTO, 2002,p. 9).
• Marine tourism can be a major source of growth and jobs.
• tourism activities aimed to see a whale shark sightings, considered to beless destructive and provide greater economic benefits than the huntingof the whale shark (Cagua et.al, 2014; Bentz, 2013; Davis et al, 1997; O'Malley et.al, 2013).
• Study of economic valuation of O'Malley et al., (2013, found that fishManta ray, worth US $ 1 Million dollars in tourism activities, comparedwith earned income for only $ 40- $ 500 USD if fish captured and killed.
Sekolah Valuasi 18
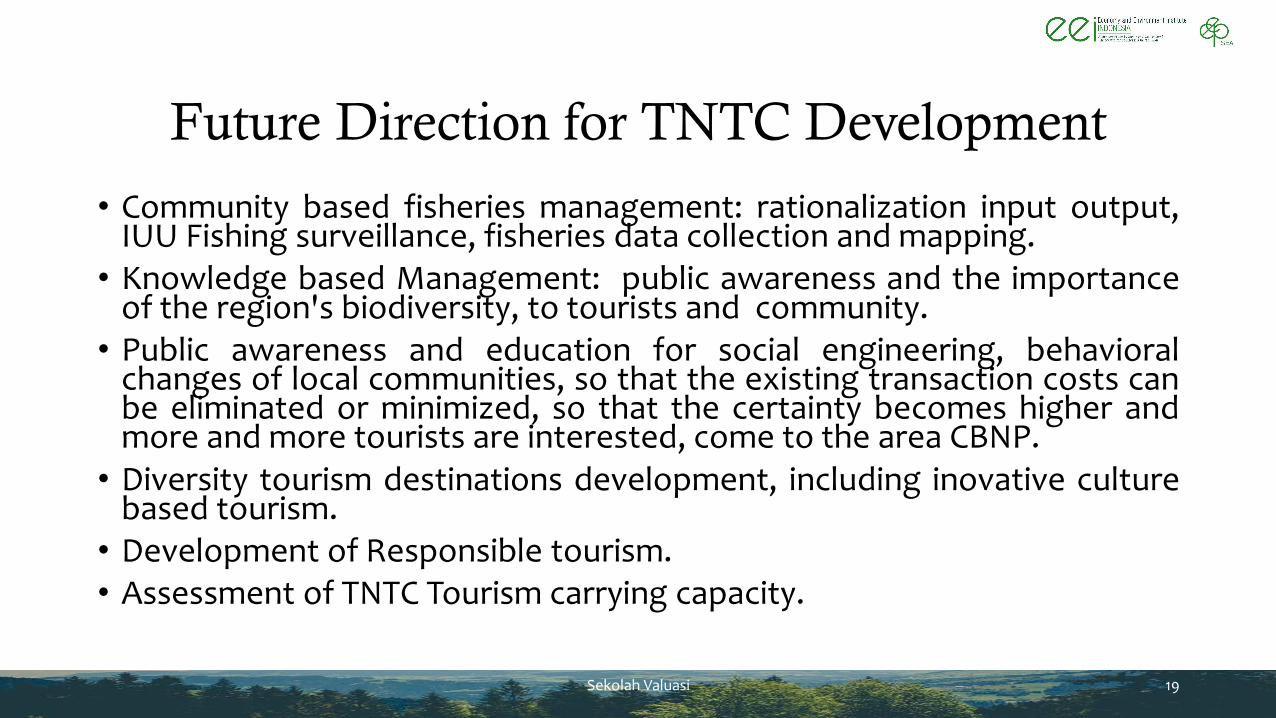
Future Direction for TNTC Development
• Community based fisheries management: rationalization input output,IUU Fishing surveillance, fisheries data collection and mapping.
• Knowledge based Management: public awareness and the importanceof the region's biodiversity, to tourists and community.
• Public awareness and education for social engineering, behavioralchanges of local communities, so that the existing transaction costs canbe eliminated or minimized, so that the certainty becomes higher andmore and more tourists are interested, come to the area CBNP.
• Diversity tourism destinations development, including inovative culturebased tourism.
• Development of Responsible tourism.• Assessment of TNTC Tourism carrying capacity.
Sekolah Valuasi 19
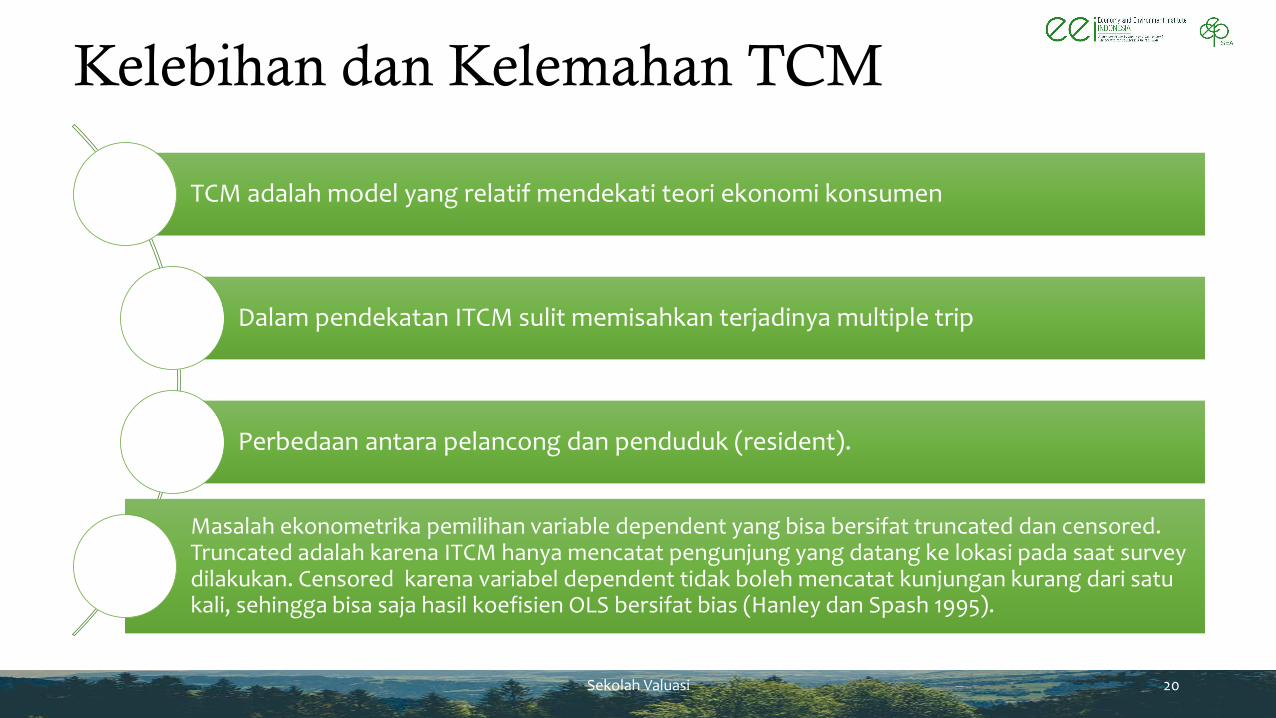
Kelebihan dan Kelemahan TCM
TCM adalah model yang relatif mendekati teori ekonomi konsumen
Dalam pendekatan ITCM sulit memisahkan terjadinya multiple trip
Perbedaan antara pelancong dan penduduk (resident).
Masalah ekonometrika pemilihan variable dependent yang bisa bersifat truncated dan censored. Truncated adalah karena ITCM hanya mencatat pengunjung yang datang ke lokasi pada saat survey dilakukan. Censored karena variabel dependent tidak boleh mencatat kunjungan kurang dari satukali, sehingga bisa saja hasil koefisien OLS bersifat bias (Hanley dan Spash 1995).
Sekolah Valuasi 20
https://tinyurl.com/tcm-eeii
Sekolah Valuasi 21
SDGs Center
TERIMA KASIHEEI-Indonesia member of EEPSEA
http://sdgcenter.unpad.ac.id/eei-indonesia/www.eepseapartners.org/indonesia-home/
SDGs Center - Universitas Padjadjaranwww.sdgcenter.unpad.ac.id
Sekolah Valuasi 22