REDD REDD dandanREDD Plus REDD Plus ......1.5% 1 Bogor, 23 Oktober 2009 REDD REDD dandanREDD Plus...
19
1.5% 1 Bogor, 23 Oktober 2009 REDD REDD dan dan REDD Plus REDD Plus Dalam Dalam Struktur Struktur Negosiasi Negosiasi Global Global Doddy S. Sukadri Dewan Nasional Perubahan Iklim ( DNPI) Pengantar: Pemanasan global dan DNPI REDD: Dari Montreal ke Kopenhagen Outline Outline Struktur Negosiasi Global Menuju Kopenhagen: Sudah siapkah kita ? Pandangan ke depan: REDD dan REDD Plus
Transcript of REDD REDD dandanREDD Plus REDD Plus ......1.5% 1 Bogor, 23 Oktober 2009 REDD REDD dandanREDD Plus...
1.5%
1
Bogor, 23 Oktober 2009
REDD REDD dandan REDD Plus REDD Plus
DalamDalam StrukturStruktur
NegosiasiNegosiasi Global Global
Doddy S. SukadriDewan Nasional
Perubahan Iklim ( DNPI)
Pengantar: Pemanasan global dan DNPI
REDD: Dari Montreal ke Kopenhagen
Outline Outline
Struktur Negosiasi Global
Menuju Kopenhagen: Sudah siapkah kita ?
Pandangan ke depan: REDD dan REDD Plus
1.5%
2
Some energy is radiated back
into space by the earth in
the form of infrared waves
Some energy is radiated back
into space by the earth in
the form of infrared waves
Some of this outgoing
infrared radiation is
trapped by the earth’s
atmosfir and warms it
Some of this outgoing
infrared radiation is
trapped by the earth’s
atmosfir and warms it
Most of this radiation
is absorbed by the
Earth and warms it
Most of this radiation
is absorbed by the
Earth and warms it
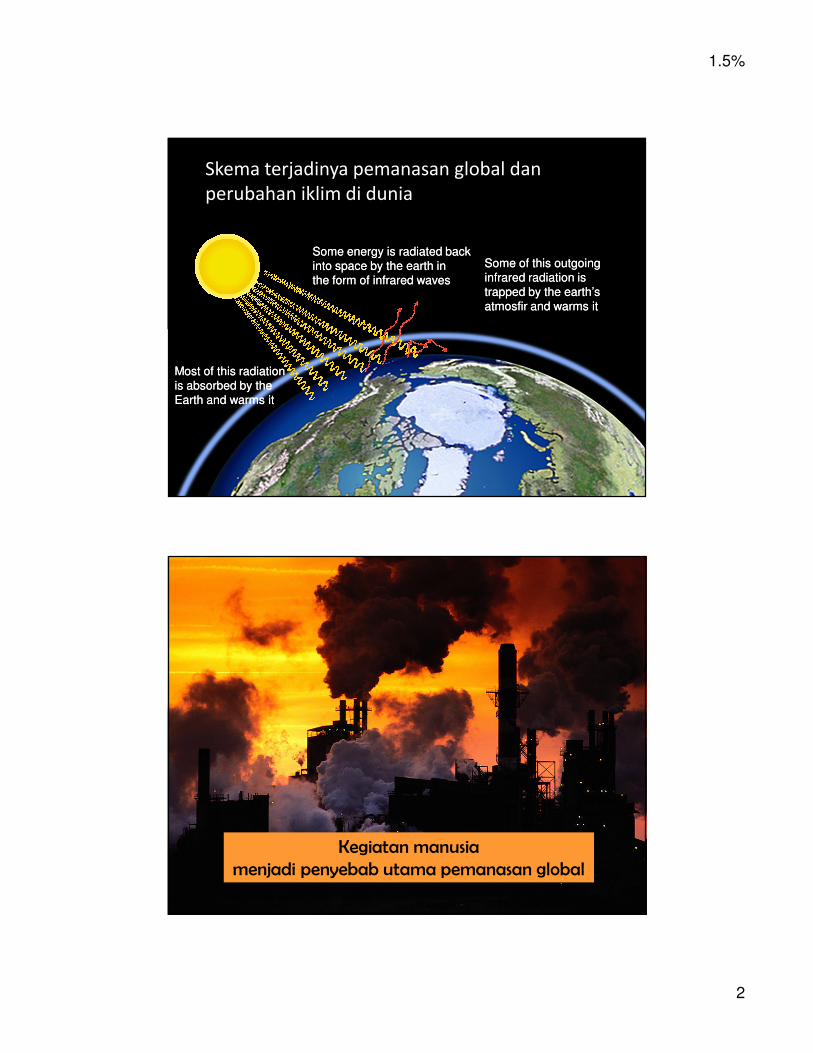
Skema terjadinya pemanasan global dan
perubahan iklim di dunia
Kegiatan manusia
menjadi penyebab utama pemanasan global
1.5%
3
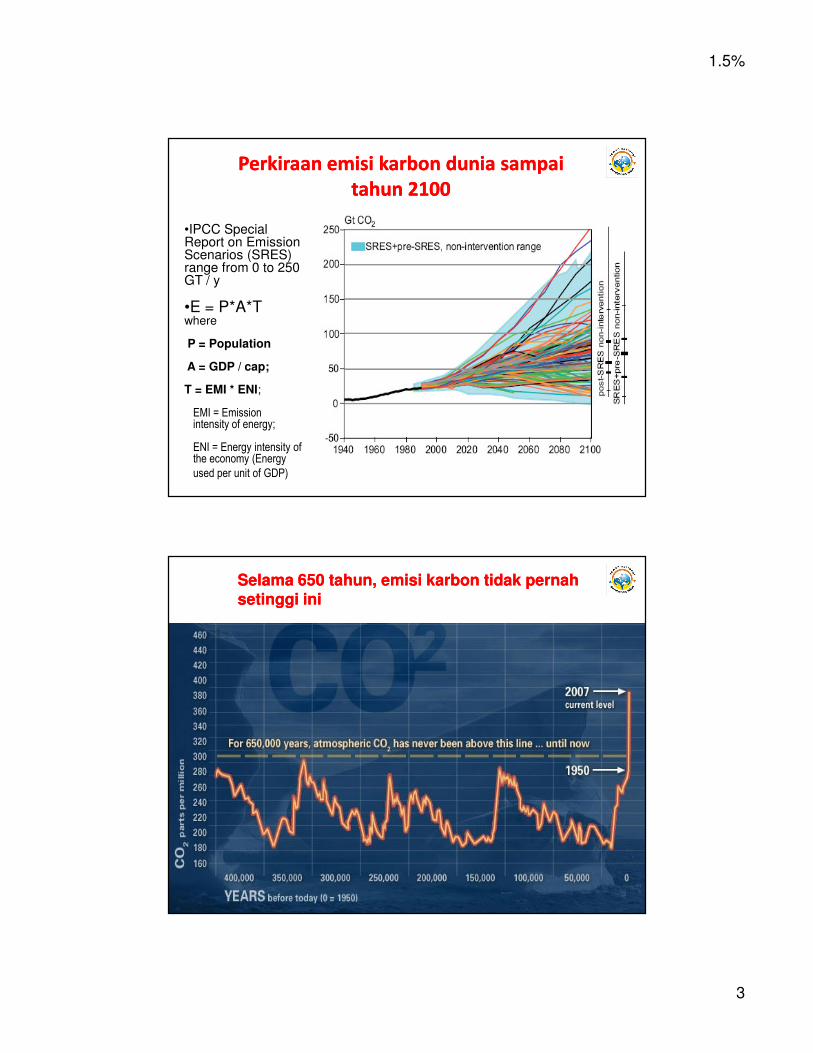
PerkiraanPerkiraan emisiemisi karbonkarbon duniadunia sampaisampai
tahuntahun 21002100
•IPCC Special Report on Emission Scenarios (SRES) range from 0 to 250 GT / y
•E = P*A*Twhere
P = Population
A = GDP / cap;
T = EMI * ENI;
EMI = Emission intensity of energy;
ENI = Energy intensity of the economy (Energy
used per unit of GDP)
SelamaSelama 650 650 tahuntahun, , emisiemisi karbonkarbon tidaktidak pernahpernahsetinggisetinggi iniini
1.5%
4
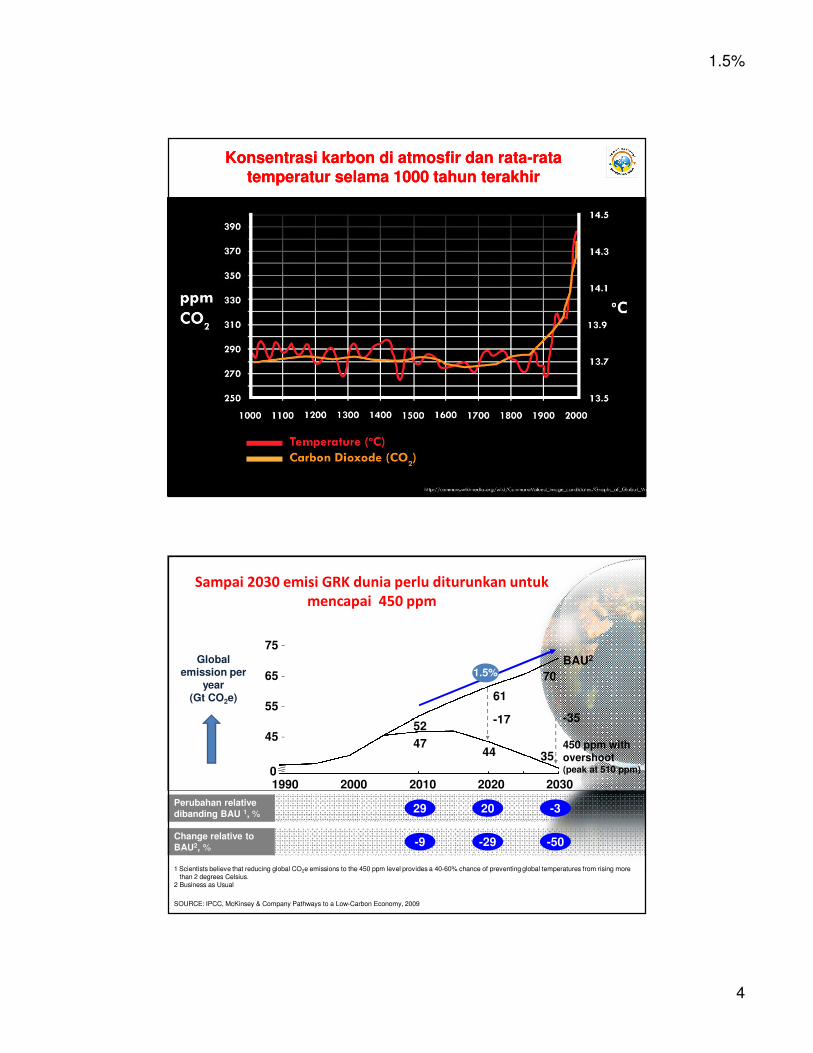
KonsentrasiKonsentrasi karbonkarbon didi atmosfiratmosfir dandan ratarata--rata rata temperaturtemperatur selamaselama 1000 1000 tahuntahun terakhirterakhir
1 Scientists believe that reducing global CO2e emissions to the 450 ppm level provides a 40-60% chance of preventing global temperatures from rising more than 2 degrees Celsius.
2 Business as Usual
Perubahan relative
dibanding BAU 1, %29 20
Change relative to
BAU2, %-9 -29
SOURCE: IPCC, McKinsey & Company Pathways to a Low-Carbon Economy, 2009
Sampai 2030 emisi GRK dunia perlu diturunkan untuk
mencapai 450 ppm
Global emission per
year (Gt CO2e)
BAU2
450 ppm with overshoot (peak at 510 ppm)
1.5%
1990 2000 2010 2020 20300
45
55
65
75
-17 -35
61
70
52
4744 35
-3
-50
1.5%
5
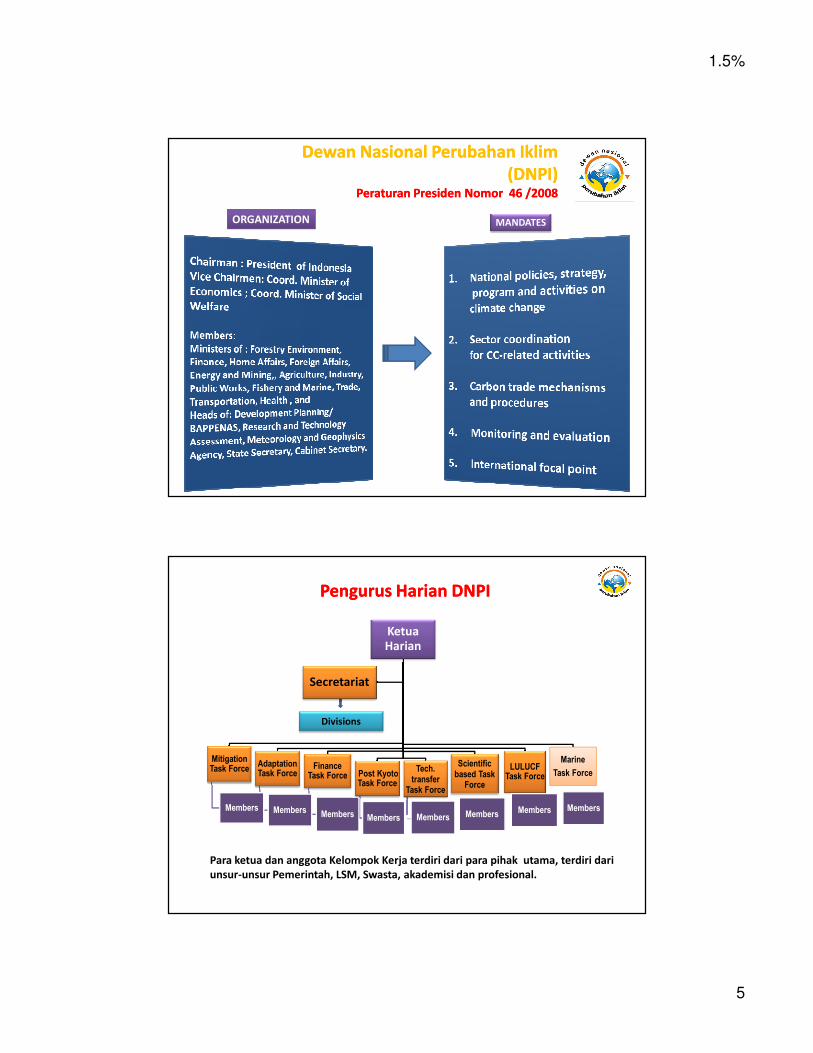
DewanDewan NasionalNasional PerubahanPerubahan IklimIklim
(DNPI) (DNPI) PeraturanPeraturan PresidenPresiden NomorNomor 46 /2008 46 /2008
ORGANIZATION MANDATES
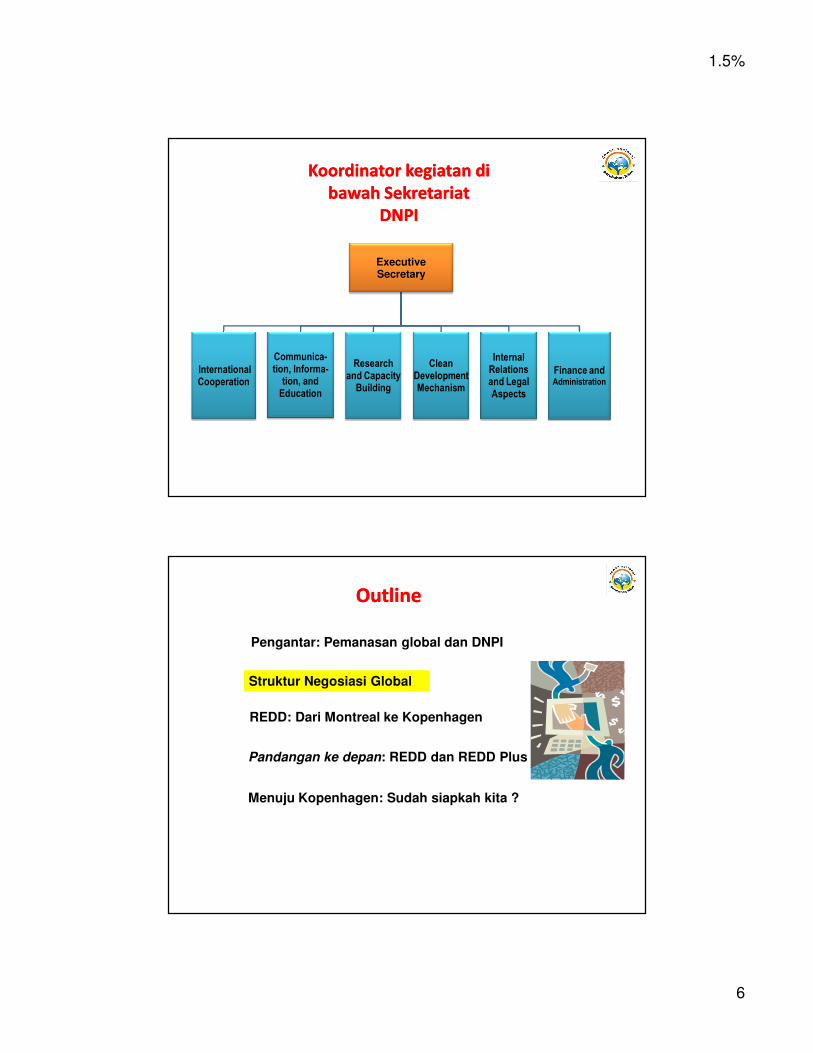
PengurusPengurus HarianHarian DNPI DNPI
KetuaHarian
Mitigation Task Force
Members
Adaptation Task Force
Members
Finance Task Force
Members
Post Kyoto Task Force
Members
Tech. transfer
Task Force
Scientific based Task
Force
LULUCF Task Force
Marine
Task Force
Secretariat
Members Members Members Members
Para ketua dan anggota Kelompok Kerja terdiri dari para pihak utama, terdiri dari
unsur-unsur Pemerintah, LSM, Swasta, akademisi dan profesional.
Divisions
1.5%
6
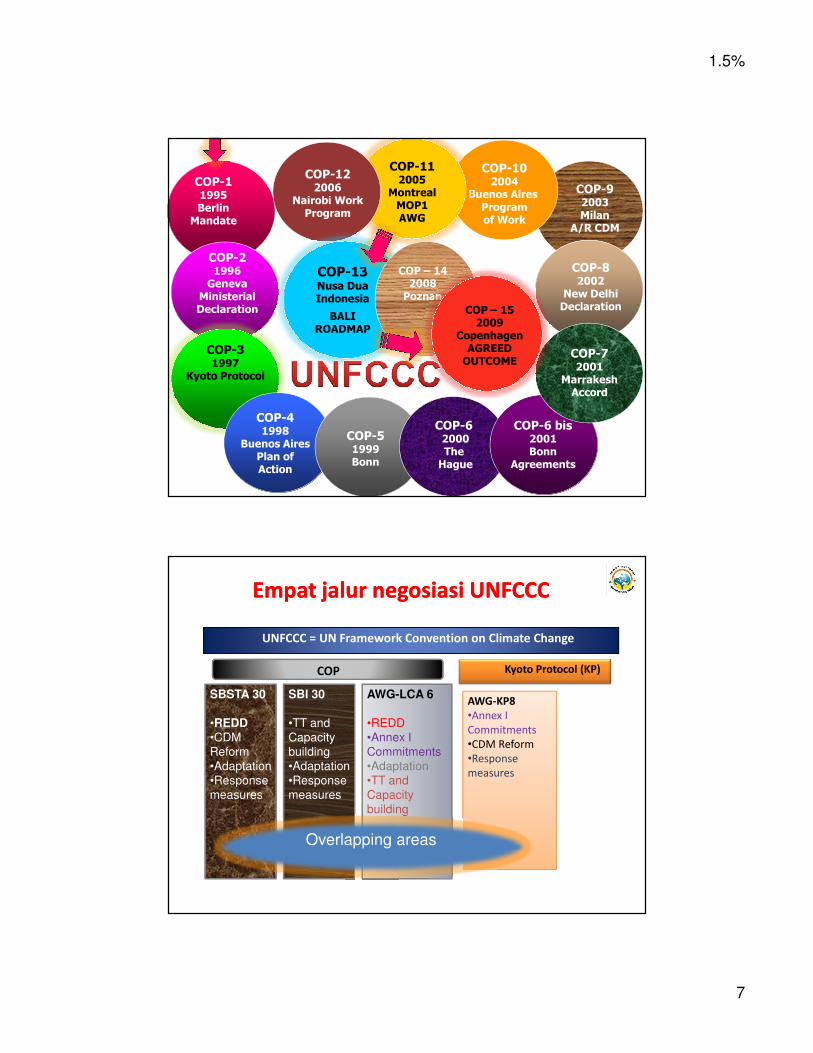
Executive Secretary
International Cooperation
Communica-tion, Informa-
tion, and Education
Research and Capacity
Building
Clean Development Mechanism
Internal Relations and Legal Aspects
Finance and Administration
KoordinatorKoordinator kegiatankegiatan didi
bawahbawah SekretariatSekretariat
DNPIDNPI
Pengantar: Pemanasan global dan DNPI
REDD: Dari Montreal ke Kopenhagen
Outline Outline
Struktur Negosiasi Global
Menuju Kopenhagen: Sudah siapkah kita ?
Pandangan ke depan: REDD dan REDD Plus
1.5%
7
COP-11995BerlinMandate
COP-41998
Buenos AiresPlan ofAction
COP-51999Bonn
COP-6 2000The Hague
COP-6 bis2001Bonn
Agreements
COP-72001
MarrakeshAccord
COP-92003Milan
A/R CDM
COP-31997
Kyoto Protocol
COP-21996GenevaMinisterialDeclaration
COP-102004
Buenos Aires Programof Work
COP-112005
MontrealMOP1AWG
COP-122006
Nairobi WorkProgram
COP-13Nusa DuaIndonesia
BALI ROADMAP
COP – 142008Poznan
COP – 152009
CopenhagenAGREED OUTCOME
COP-82002
New DelhiDeclaration
EmpatEmpat jalurjalur negosiasinegosiasi UNFCCCUNFCCC
AWG-LCA 6
•REDD
•Annex I
Commitments
•Adaptation
•TT and
Capacity
building
SBSTA 30
•REDD•CDM
Reform
•Adaptation
•Response
measures
SBI 30
•TT and
Capacity
building
•Adaptation
•Response
measures
AWG-KP8
•Annex I
Commitments
•CDM Reform
•Response
measures
Overlapping areas
UNFCCC = UN Framework Convention on Climate Change
Kyoto Protocol (KP)COP
1.5%
8
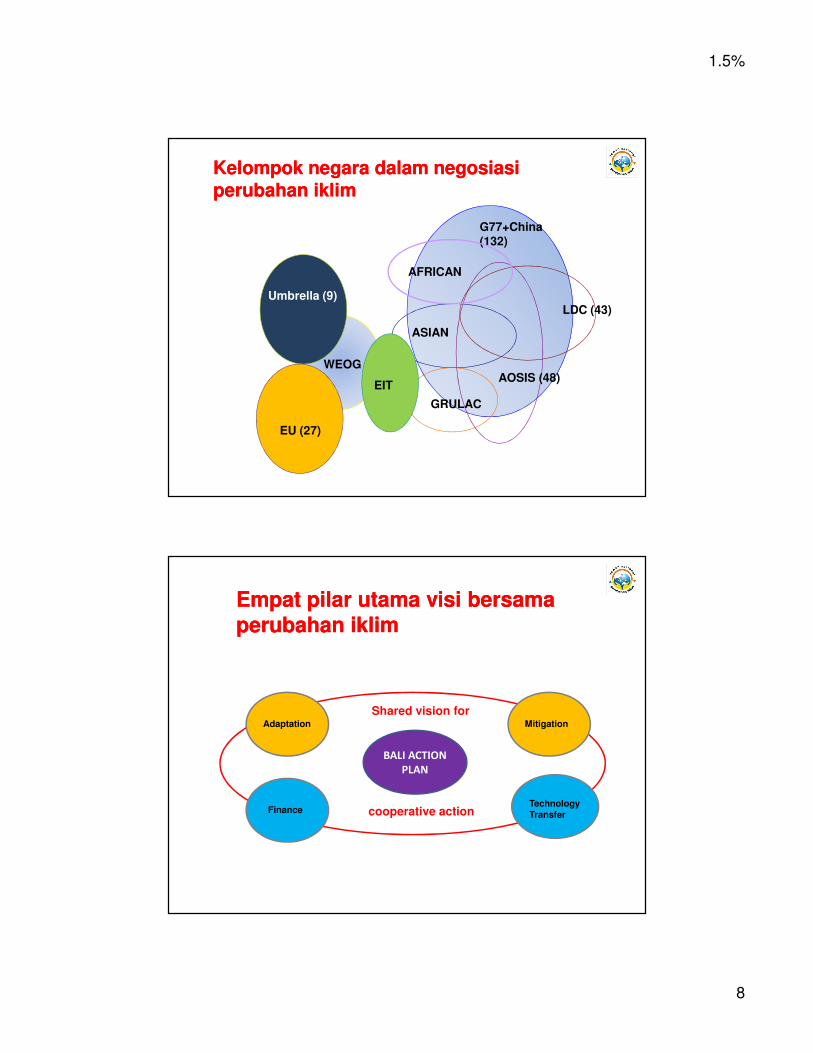
G77+China (132)
AOSIS (48)
ASIAN
GRULAC
EIT
LDC (43)
AFRICAN
EU (27)
WEOG
Umbrella (9)
KelompokKelompok negaranegara dalamdalam negosiasinegosiasiperubahanperubahan iklimiklim
Shared vision for
cooperative action Technology
Transfer
Adaptation Mitigation
Finance
BALI ACTION
PLAN
EmpatEmpat pilarpilar utamautama visivisi bersamabersamaperubahanperubahan iklimiklim
1.5%
9
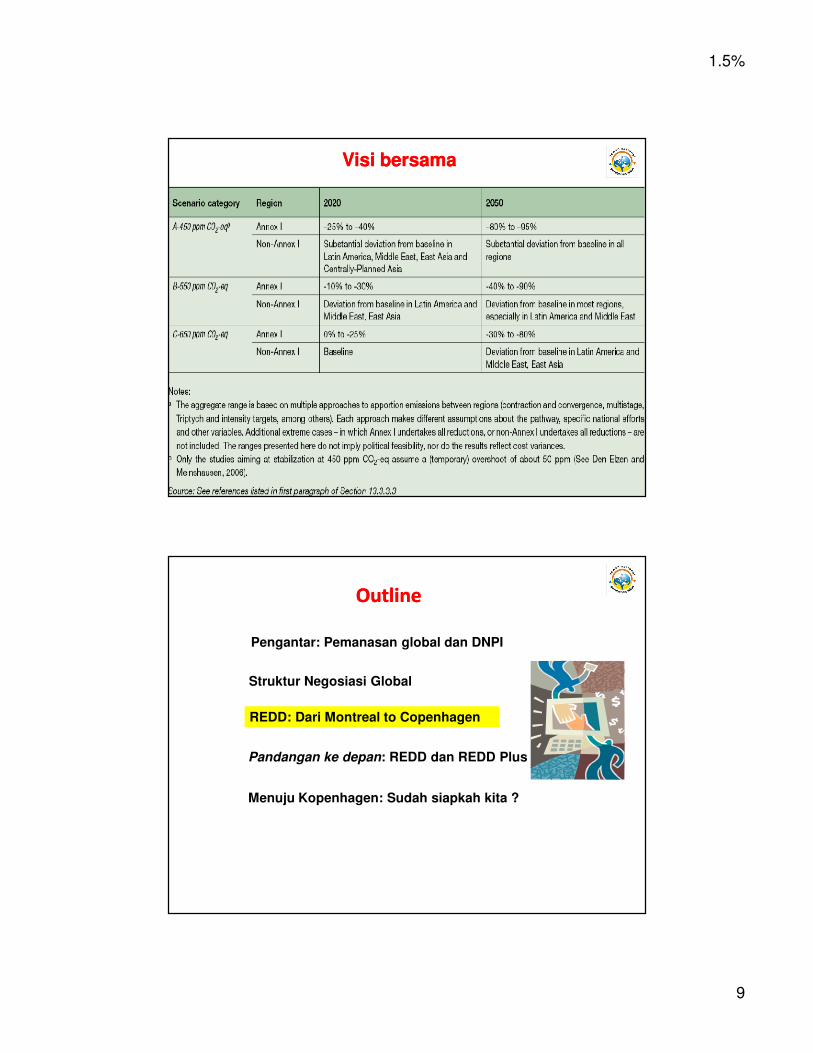
VisiVisi bersamabersama
Pengantar: Pemanasan global dan DNPI
REDD: Dari Montreal to Copenhagen
Outline Outline
Struktur Negosiasi Global
Menuju Kopenhagen: Sudah siapkah kita ?
Pandangan ke depan: REDD dan REDD Plus
1.5%
10
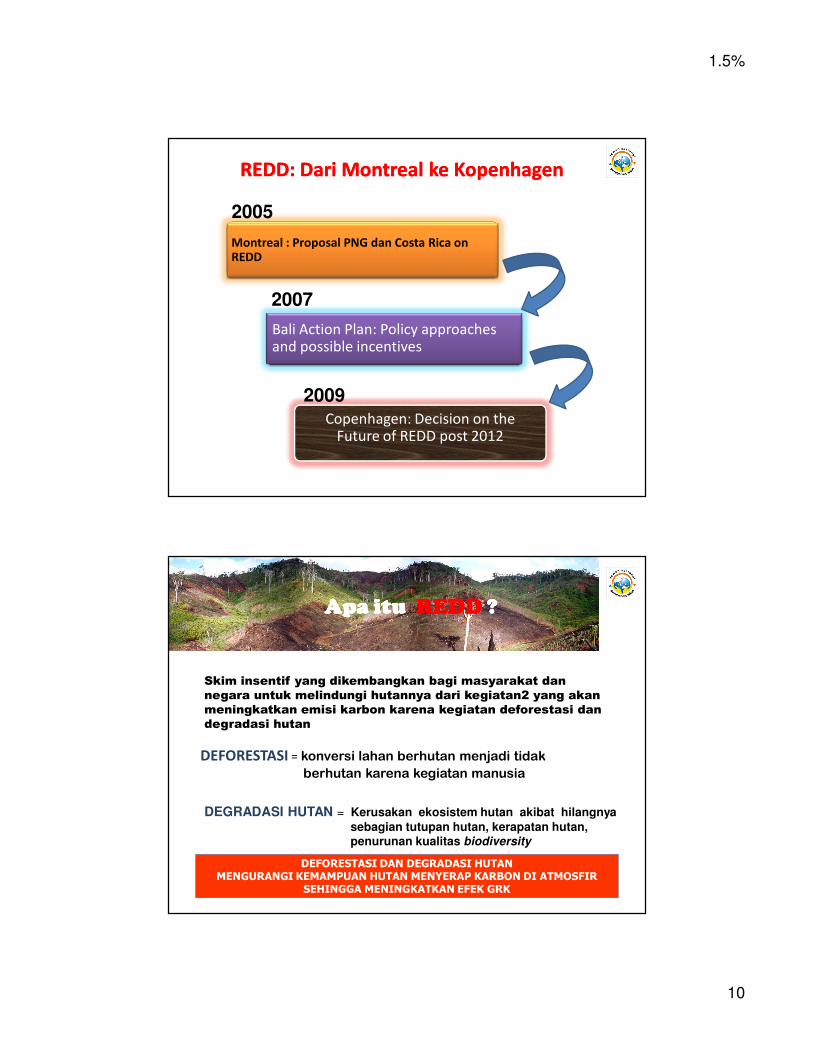
REDD: Dari Montreal REDD: Dari Montreal keke KopenhagenKopenhagen
Montreal : Proposal PNG dan Costa Rica on REDD
Bali Action Plan: Policy approaches and possible incentives
Copenhagen: Decision on the Future of REDD post 2012
2005
2007
2009
DEFORESTASI = konversi lahan berhutan menjadi tidak
berhutan karena kegiatan manusia
Skim insentif yang dikembangkan bagi masyarakat dan
negara untuk melindungi hutannya dari kegiatan2 yang akan
meningkatkan emisi karbon karena kegiatan deforestasi dan
degradasi hutan
DEGRADASI HUTAN = Kerusakan ekosistem hutan akibat hilangnya
sebagian tutupan hutan, kerapatan hutan, penurunan kualitas biodiversity
DEFORESTASI DAN DEGRADASI HUTAN MENGURANGI KEMAMPUAN HUTAN MENYERAP KARBON DI ATMOSFIR
SEHINGGA MENINGKATKAN EFEK GRK
ApaApaApaApa ituituituitu REDDREDDREDDREDD ? ? ? ?
1.5%
11
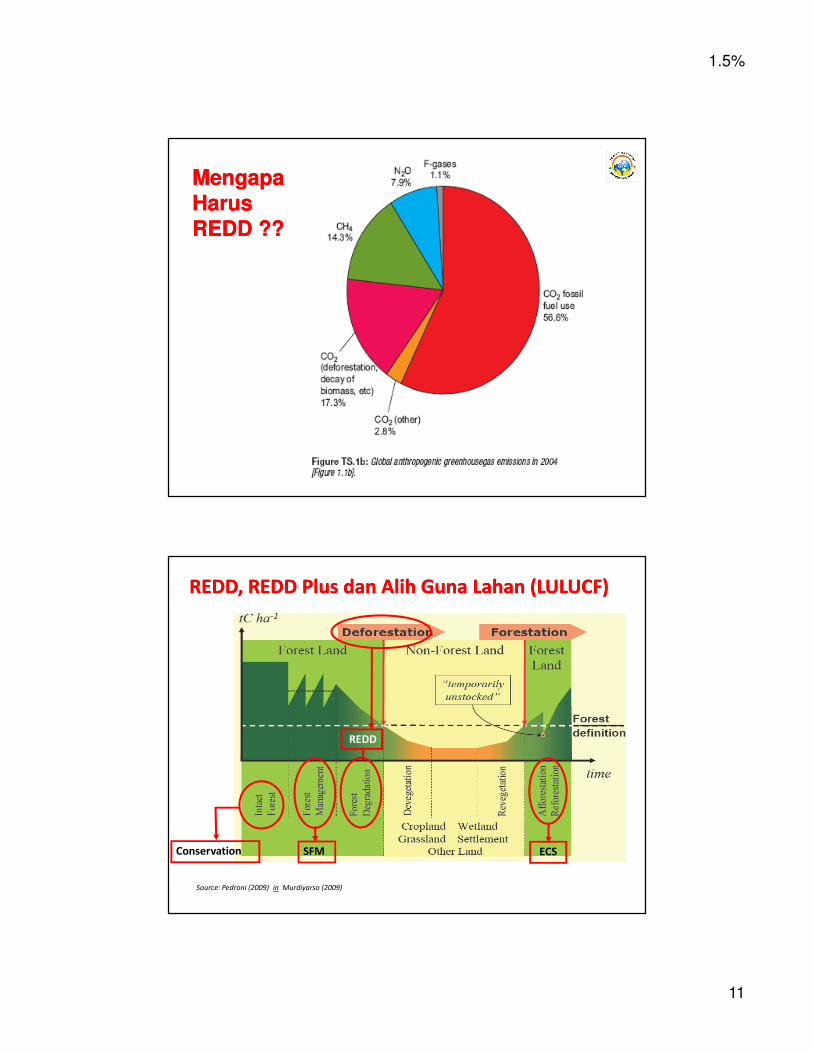
MengapaMengapaHarusHarusREDD ??REDD ??
REDD, REDD Plus REDD, REDD Plus dandan AlihAlih GunaGuna LahanLahan (LULUCF)(LULUCF)
SFM
REDD
Conservation ECS
Source: Pedroni (2009) in Murdiyarso (2009)
1.5%
12
Pengantar: Pemanasan global dan DNPI
REDD: Dari Montreal ke Kopenhagen
Outline Outline
Struktur Negosiasi Global
Menuju Kopenhagen: Sudah siapkah kita ?
Pandangan ke depan: REDD dan REDD Plus
-60
-20
20
40
60
-160
-140
-120
-80
-100
200 400 600 800
Reduction potential2
MtCO2e per year
0
-40
2,4002,2002,0000 1,8001,6001,4001,2001,000
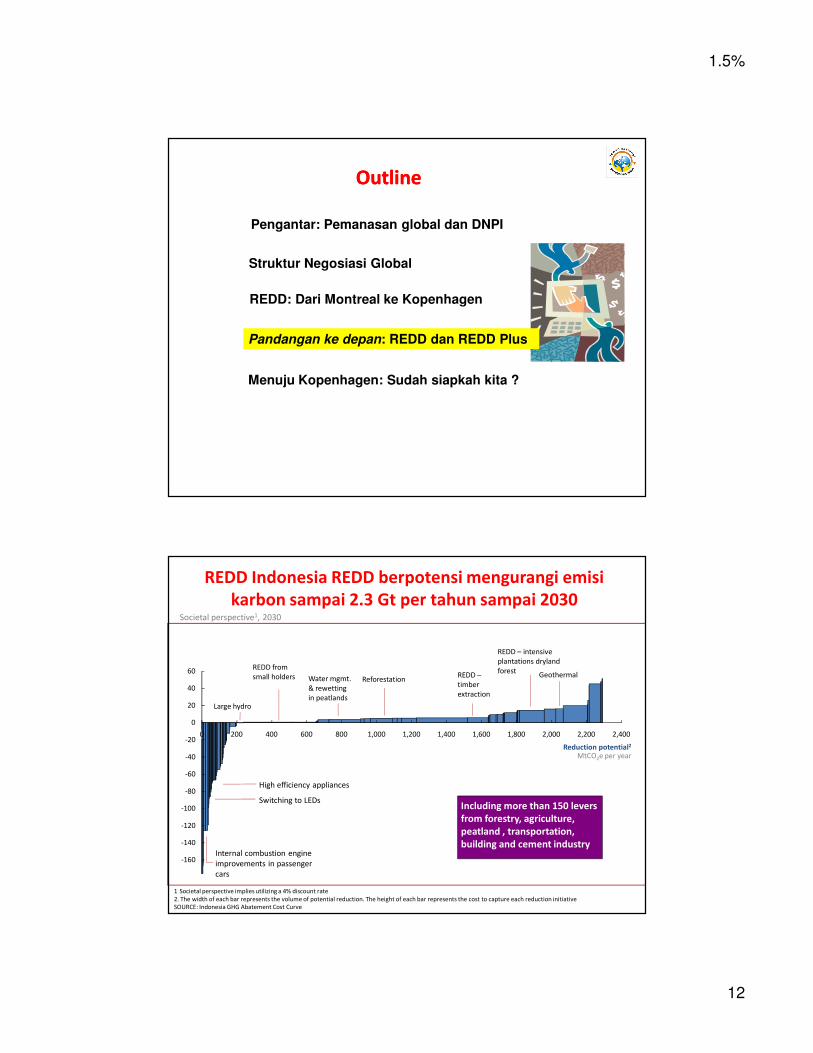
REDD Indonesia REDD berpotensi mengurangi emisi
karbon sampai 2.3 Gt per tahun sampai 2030
SOURCE: Indonesia GHG Abatement Cost Curve
GeothermalREDD from
small holders
High efficiency appliances
Internal combustion engine
improvements in passenger
cars
Switching to LEDs
Water mgmt.
& rewetting
in peatlandsLarge hydro
REDD –
timber
extraction
REDD – intensive
plantations dryland
forestReforestation
1 Societal perspective implies utilizing a 4% discount rate
2. The width of each bar represents the volume of potential reduction. The height of each bar represents the cost to capture each reduction initiative
Societal perspective1, 2030
Including more than 150 levers
from forestry, agriculture,
peatland , transportation,
building and cement industry
1.5%
13
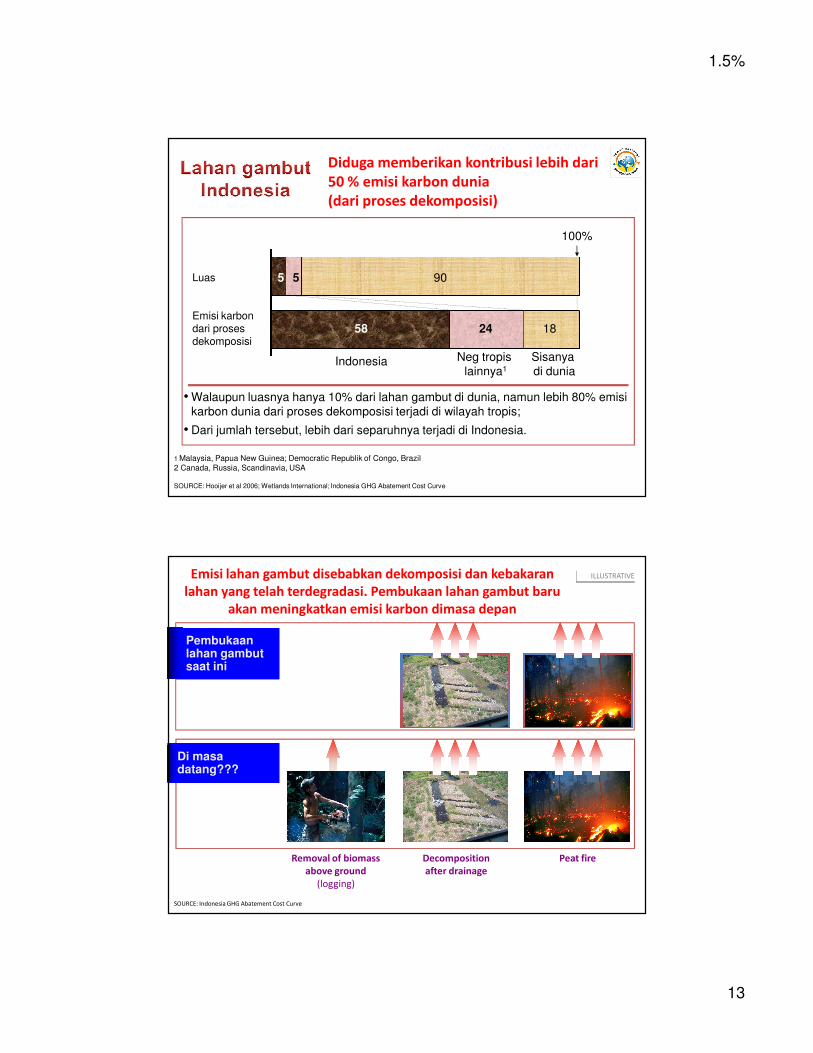
Diduga memberikan kontribusi lebih dari
50 % emisi karbon dunia
(dari proses dekomposisi)
SOURCE: Hooijer et al 2006; Wetlands International; Indonesia GHG Abatement Cost Curve
100%
Indonesia Neg tropis
lainnya1
Sisanya
di dunia
Emisi karbon dari proses dekomposisi
58 24 18
Luas 5 5 90
• Walaupun luasnya hanya 10% dari lahan gambut di dunia, namun lebih 80% emisi
karbon dunia dari proses dekomposisi terjadi di wilayah tropis;
• Dari jumlah tersebut, lebih dari separuhnya terjadi di Indonesia.
1 Malaysia, Papua New Guinea; Democratic Republik of Congo, Brazil
2 Canada, Russia, Scandinavia, USA
Peat
fire
Decomposition
after drainage
Emisi lahan gambut disebabkan dekomposisi dan kebakaran
lahan yang telah terdegradasi. Pembukaan lahan gambut baru
akan meningkatkan emisi karbon dimasa depan
SOURCE: Indonesia GHG Abatement Cost Curve
ILLUSTRATIVE
Pembukaanlahan gambutsaat ini
Pembukaanlahan gambutsaat ini
Di masadatang???Di masadatang???
Removal of biomass
above ground
(logging)
Decomposition
after drainage
Peat fire
1.5%
14
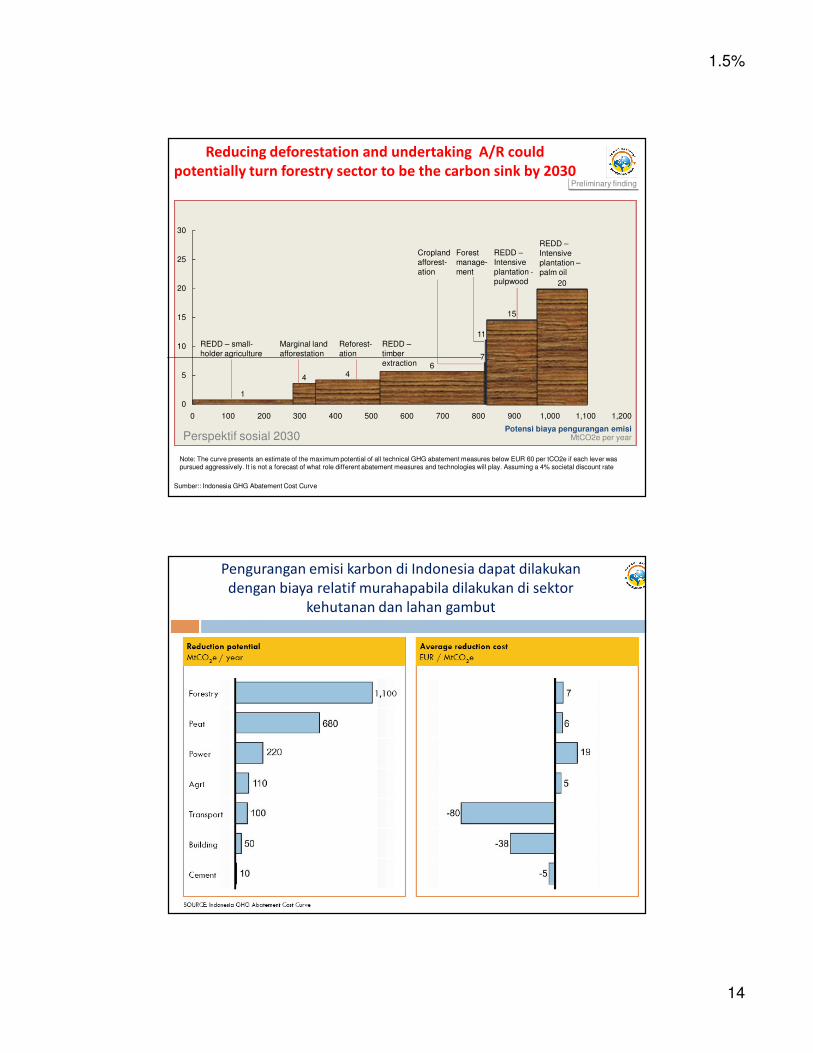
Note: The curve presents an estimate of the maximum potential of all technical GHG abatement measures below EUR 60 per tCO2e if each lever was pursued aggressively. It is not a forecast of what role different abatement measures and technologies will play. Assuming a 4% societal discount rate
6005003002001000
10
0
30
5
15
2020
25
1,200
15
11
7
Potensi biaya pengurangan emisiMtCO2e per year
44
1
1,100400 1,000900800700
6
Reducing deforestation and undertaking A/R could
potentially turn forestry sector to be the carbon sink by 2030
Sumber:: Indonesia GHG Abatement Cost Curve
REDD – small-
holder agriculture
Marginal land
afforestation
Forest
manage-
ment
Reforest-
ation
REDD –
timber
extraction
Cropland
afforest-
ation
REDD –
Intensive
plantation -
pulpwood
REDD –
Intensive
plantation –
palm oil
Perspektif sosial 2030
Preliminary finding
Pengurangan emisi karbon di Indonesia dapat dilakukan
dengan biaya relatif murahapabila dilakukan di sektor
kehutanan dan lahan gambut
1.5%
15
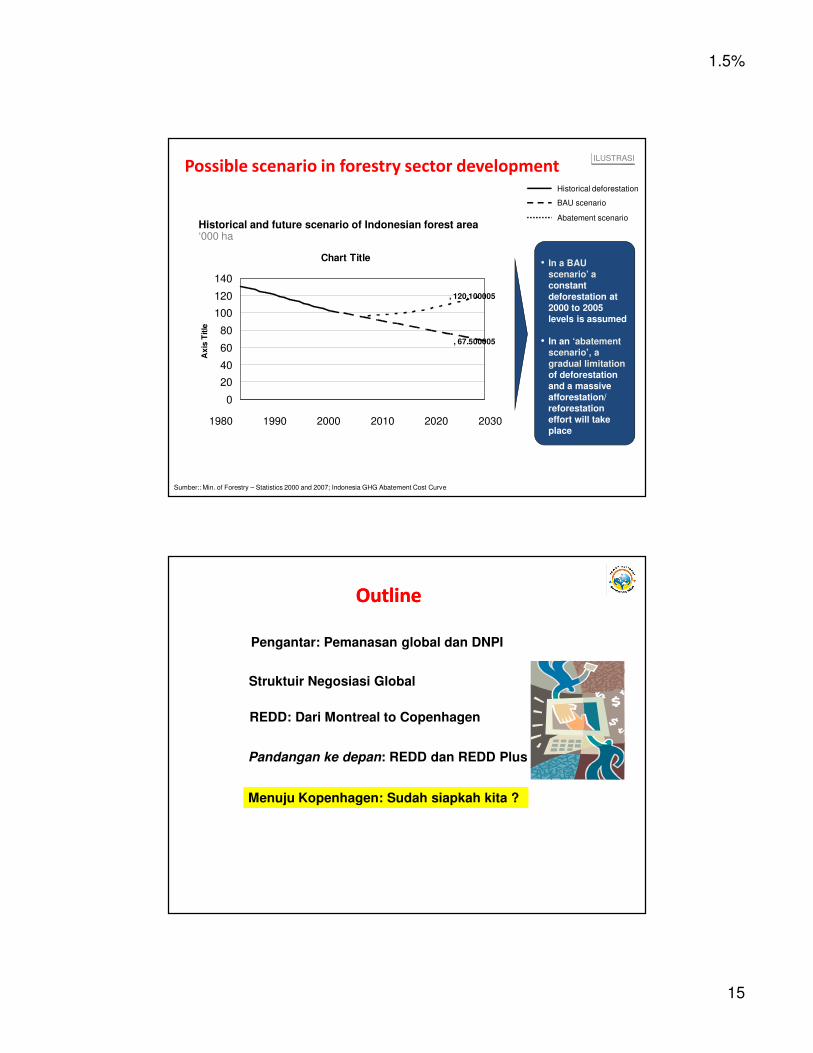
Possible scenario in forestry sector development
Sumber:: Min. of Forestry – Statistics 2000 and 2007; Indonesia GHG Abatement Cost Curve
1980 1990 2000 2010 2020 2030
• In a BAU
scenario’ a
constant
deforestation at
2000 to 2005
levels is assumed
• In an ‘abatement
scenario’, a
gradual limitation
of deforestation
and a massive
afforestation/
reforestation
effort will take
place
Chart Title
, 67.500005
, 120.100005
0
20
40
60
80
100
120
140
Ax
is T
itle
Historical and future scenario of Indonesian forest area‘000 ha
Historical deforestation
BAU scenario
Abatement scenario
ILUSTRASI
Pengantar: Pemanasan global dan DNPI
REDD: Dari Montreal to Copenhagen
Outline Outline
Struktuir Negosiasi Global
Menuju Kopenhagen: Sudah siapkah kita ?
Pandangan ke depan: REDD dan REDD Plus
1.5%
16
UsulanUsulan beberapabeberapa negaranegara untukuntuk
komitmenkomitmen pascapasca 2012 2012
1. “Copenhagen Agreement” (EU)
2. “Copenhagen Protocol” (Developed countries, but USA)
3. “Implementing Agreement” (USA)
4. Second period of commitment (China, South Africa, India, Brazil dan Saudi Arabia)
5. Legally binding instrument (Brazil and South Africa)
6. “COP Decision” (India and China)
7. “National Schedules” (Australia)
1.5%
17
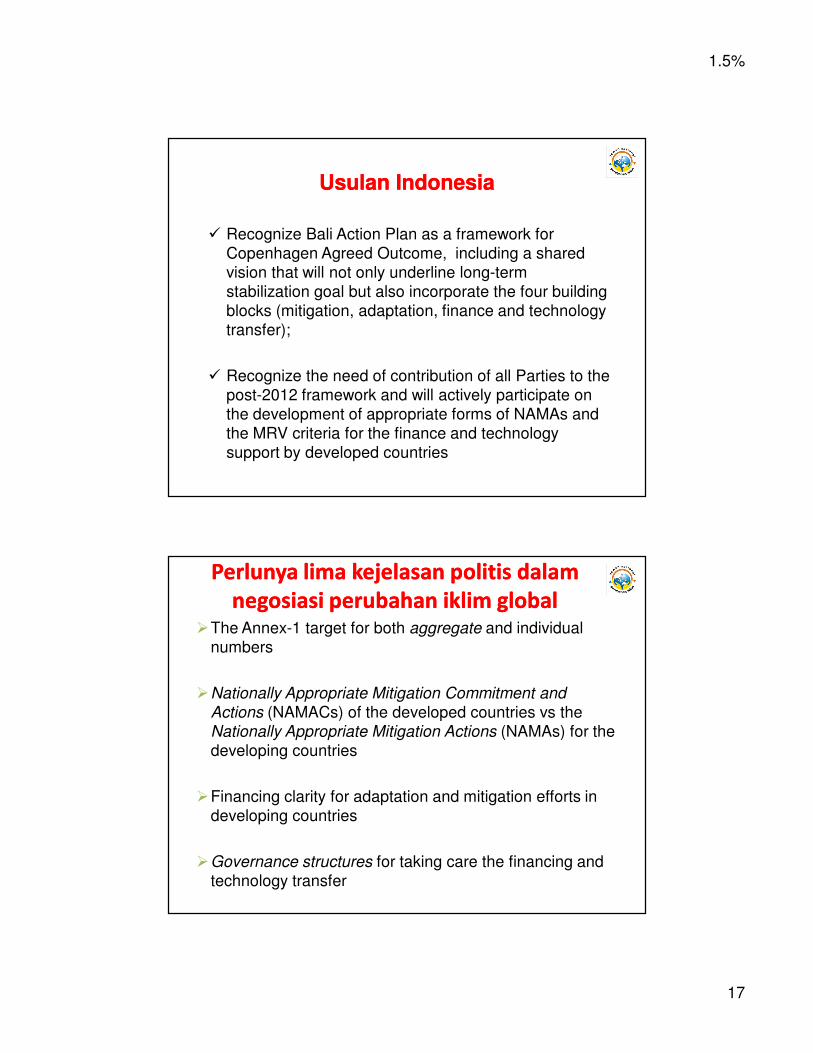
� Recognize Bali Action Plan as a framework for
Copenhagen Agreed Outcome, including a shared
vision that will not only underline long-term
stabilization goal but also incorporate the four building
blocks (mitigation, adaptation, finance and technology
transfer);
� Recognize the need of contribution of all Parties to the
post-2012 framework and will actively participate on
the development of appropriate forms of NAMAs and
the MRV criteria for the finance and technology
support by developed countries
UsulanUsulan Indonesia Indonesia
PerlunyaPerlunya lima lima kejelasankejelasan politispolitis dalamdalam
negosiasinegosiasi perubahanperubahan iklimiklim global global �The Annex-1 target for both aggregate and individual
numbers
�Nationally Appropriate Mitigation Commitment and
Actions (NAMACs) of the developed countries vs the
Nationally Appropriate Mitigation Actions (NAMAs) for the
developing countries
�Financing clarity for adaptation and mitigation efforts in
developing countries
�Governance structures for taking care the financing and
technology transfer
1.5%
18
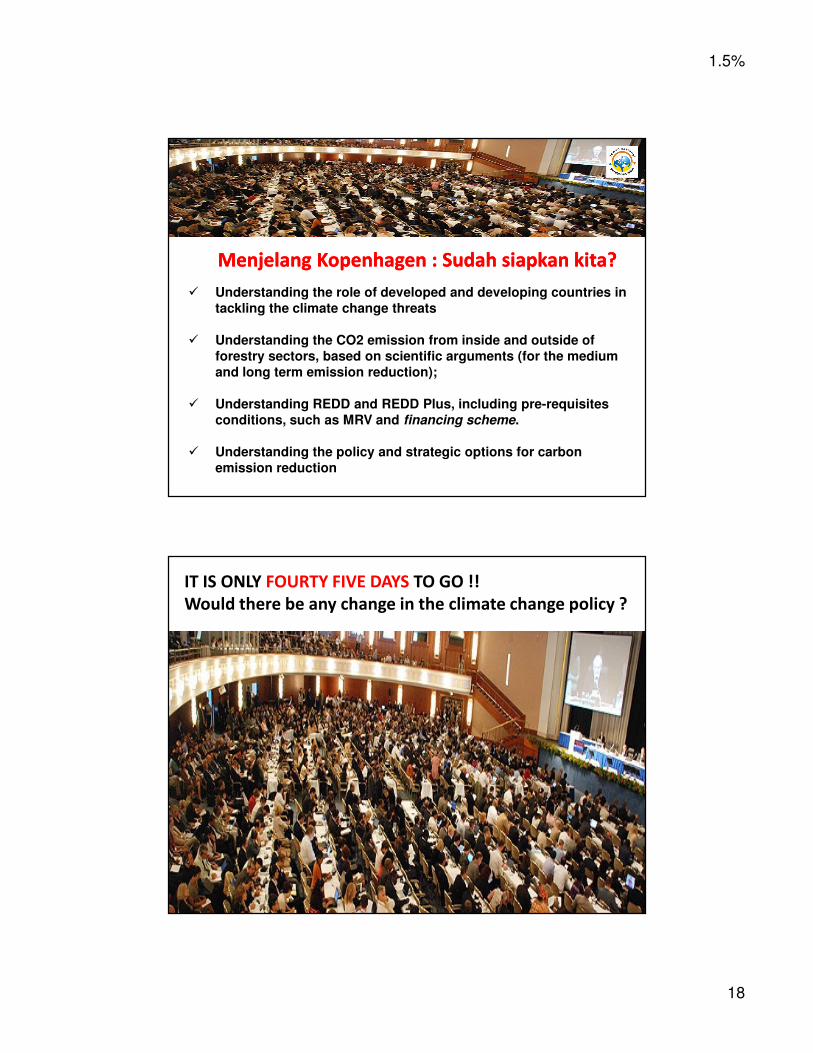
� Understanding the role of developed and developing countries in
tackling the climate change threats
� Understanding the CO2 emission from inside and outside of
forestry sectors, based on scientific arguments (for the medium
and long term emission reduction);
� Understanding REDD and REDD Plus, including pre-requisites
conditions, such as MRV and financing scheme.
� Understanding the policy and strategic options for carbon
emission reduction
MenjelangMenjelang KopenhagenKopenhagen : : SudahSudah siapkansiapkan kitakita??
IT IS ONLY FOURTY FIVE DAYS TO GO !!
Would there be any change in the climate change policy ?
1.5%
19


![Buku foto sri lange karya doddy [akar] obenk](https://static.fdokumen.com/doc/165x107/568ca61b1a28ab186d8fd667/buku-foto-sri-lange-karya-doddy-akar-obenk.jpg)