Analisa Laporan Keuangan - Analisa Rasio : Liquidity and Solvency Ratio

Conference on Management and Behavioral Studies Universitas Tarumanagara, Jakarta, 12 Oktober 2017
ISSN NO: 2541-3406 e-ISSN NO: 2541-285X
364
PROFITABILITY, LIQUIDITY, ACTIVITY, AND SOLVENCY
RATIOS ANALYSIS OF OIL AND GAS INDUSTRY:
AN INDONESIA EXPERIENCE
Wiwiek Mardawiyah Daryanto1, Cut Sjahrifa 2
1Sekolah Tinggi Manajemen IPMI, Jakarta, [email protected]
2Sekolah Tinggi Manajemen IPMI, Jakarta, [email protected]
ABSTRAK: Industri minyak dan gas bumi di Indonesia dimulai 1883, dan merupakan komoditas vital bagi manusia,
dan juga sumber dana utama Negara. Industri ini penyumbang terbesar pendapatan ekspor untuk
menghasilakan devisa Negara. Namun demikian, terjadi penurunan persentase kontribusi pendapatan
kepada negara secara signifikan, yaitu 14,11% di 2014; 4,46% di 2015, dan 3,44% di 2016. Hal ini
disebabkan menurunnya produksi minyak bumi dan gas di 2013. Juga terjadi fluktuasi penurunan harga
jual komoditi ini sejak awal 2015. Studi ini bertujuan untuk menganalisa dan mengukur kinerja keuangan
industri minyak dan gas bumi dengan menggunakan analisa rasio keuangan, yang diklasifikasikan ke
rasio profitability, liquidity, activity, dan solvency. Data dikumpulkan dari laporan keuangan yang sudah
diaudit suatu perusahaan minyak dan gas bumi terbesar kedua di Indonesia untuk periode 2011 – 2015.
Hasil studi menunjukkan bahwa perusahaan tersebut dalam kondisi kurang sehat disebabkan oleh
turunnya laba bersih sejak 2011, dan bahkan merugi di 2015. Peneliti yakin bahwa studi ini bermanfaat
bagi para manager yang aktif mencari solusi pemecahan masalah, yang membuahkan hasil yang tinggi.
Kata Kunci: Profitability, Liquidity, Solvency, Kinerja keuangan
ABSTRACT: Oil and gas industry in Indonesia has been started since 1883, and as vital commodities that control the
livelihood of people. It is also the main resource of state revenue. Indonesia’s oil and gas industry is the
huge contributor to government export revenues and foreign exchange. However, there was a significant
percentage decline in the total contribution of revenue to the state, from 14.11% in 2014 to 4.46% in
2015, and a further decrease to 3.44% in 2016. It caused by the decline in crude oil and gas production
in 2013. The industry also having a fluctuation growth since the world oil prices have been hit severely
since early 2015. The purpose of this study is to analyze and to measure the financial performance of oil
and gas industry by using financial ratio analysis, which is classified into profitability, liquidity, activity,
and solvency ratios. The data were collected from audited financial reports of the second largest oil and
Gas Company in Indonesia for the periods of 2011 – 2015. The finding shows that the company was in
less healthy condition due to the decrease of its net income since 2011, and even gained losses in 2015.
The authors believe that the findings will be helpful for managers who continuously attempt to explore
opportunities to solve problems and provide a higher return.
Key Words: Profitability, Liquidity, Solvency, Financial performance
Conference on Management and Behavioral Studies Universitas Tarumanagara, Jakarta, 12 Oktober 2017
ISSN NO: 2541-3406 e-ISSN NO: 2541-285X
365
INTRODUCTION
Indonesia’s economy has experienced steady growth emerging from the Asian financial
crisis of 1997-1999, averaging stable 5 – 6 % annual growth rate, and the strength of the
country’s economy was formerly based on its considerable oil and gas exports
(Tharakan, 2015). The oil price in Indonesia is not in line with the changes of oil price
in global. In 2008, the amount of oil price was lower than the crude oil price in global
which is US$96,13 per barrels and then it fell down to US$61,58 per barrels in 2009
(Indonesia Crude Price, 2009)
In terms of oil price, oil and gas industry has experienced dramatic volatility globally
(Frederer (1996), Beike et al. (2010), Anzuini et al. (2012), Vespignani and Ratti
(2013). Regnier (2007) supported that the oil price has been volatile since its first oil
crisis in 1973. According to PWC (2016), the amount of oil price in the global market
declined sharply from US$145 per barrel in the mid of 2008 to approximately US$40
per barrel at the end of 2008. Then oil price increased at US$ 77,11 per barrels in 2010
and a further increased at US$91,39 per barrels in 2011 (Energy today, 2015).
Unfortunately, the oil price fell slightly at US$88, 95 per barrels in 2012 and a further
fell at US$ 49.93 per barrels in May 2016. This fluctuated situation has affected the
industry in many ways. According to Rohimat (2016), there are many companies and
countries which rely on oil revenue and end up falling and collapse. For instance, in
Indonesia, Chevron would terminate their contracts in East Kalimantan after 50 years of
operation and dismiss around 1,500 employees due to decline in the efficiency (Reuters,
2016).
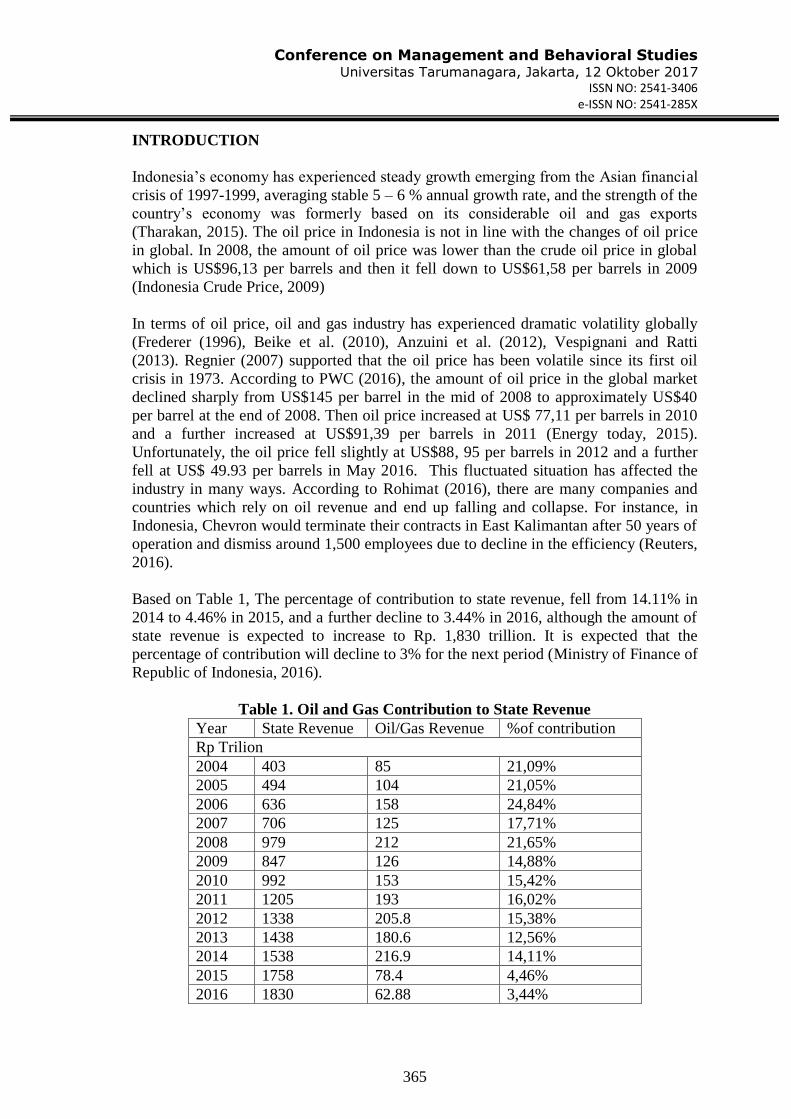
Based on Table 1, The percentage of contribution to state revenue, fell from 14.11% in
2014 to 4.46% in 2015, and a further decline to 3.44% in 2016, although the amount of
state revenue is expected to increase to Rp. 1,830 trillion. It is expected that the
percentage of contribution will decline to 3% for the next period (Ministry of Finance of
Republic of Indonesia, 2016).
Table 1. Oil and Gas Contribution to State Revenue
Year State Revenue Oil/Gas Revenue %of contribution
Rp Trilion
2004 403 85 21,09%
2005 494 104 21,05%
2006 636 158 24,84%
2007 706 125 17,71%
2008 979 212 21,65%
2009 847 126 14,88%
2010 992 153 15,42%
2011 1205 193 16,02%
2012 1338 205.8 15,38%
2013 1438 180.6 12,56%
2014 1538 216.9 14,11%
2015 1758 78.4 4,46%
2016 1830 62.88 3,44%
Conference on Management and Behavioral Studies Universitas Tarumanagara, Jakarta, 12 Oktober 2017
ISSN NO: 2541-3406 e-ISSN NO: 2541-285X
366
According to Lev (1969) and Frecka and Lee (1983), firms should measure the financial
ratio and adjust the performance based on industry norms. Most studies on financial
performance have focused on bank, retail and manufacturing, hospital, construction and
SME industry (McMahon (1994); Voulgaris et al. (2000); Van der Westhuizen (2004);
O’Donnell and Van der Westhuizen (2002); Okeahalam (2006); Ocal et al. (2007);
Cronje (2007); Ncube (2009).
The purpose of this study is to analyze and to measure the financial performance of oil
and gas industry by using financial ratio analysis, which is classified into profitability,
liquidity, activity, and solvency ratios. The data were collected from audited financial
reports of the second largest oil and gas Company in Indonesia for the periods of 2011 –
2015.
II. DEVELOPMENT OF OIL AND GAS INDUSTRY IN INDONESIA
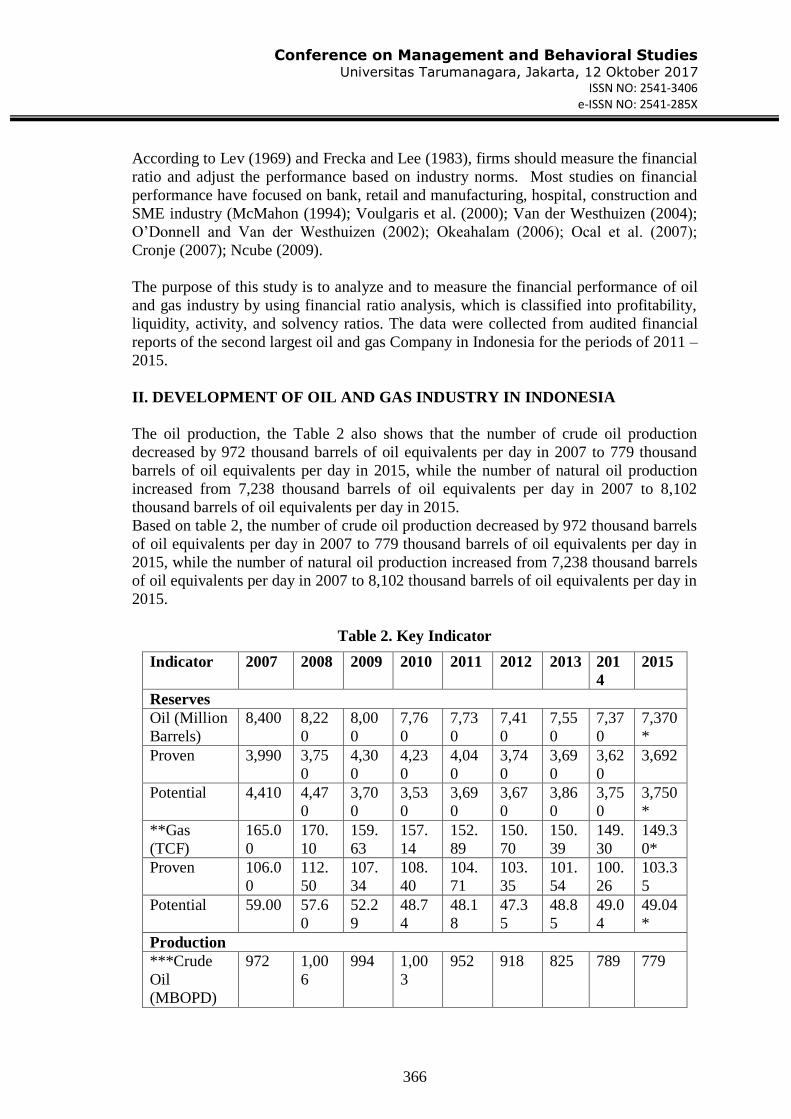
The oil production, the Table 2 also shows that the number of crude oil production
decreased by 972 thousand barrels of oil equivalents per day in 2007 to 779 thousand
barrels of oil equivalents per day in 2015, while the number of natural oil production
increased from 7,238 thousand barrels of oil equivalents per day in 2007 to 8,102
thousand barrels of oil equivalents per day in 2015.
Based on table 2, the number of crude oil production decreased by 972 thousand barrels
of oil equivalents per day in 2007 to 779 thousand barrels of oil equivalents per day in
2015, while the number of natural oil production increased from 7,238 thousand barrels
of oil equivalents per day in 2007 to 8,102 thousand barrels of oil equivalents per day in
2015.
Table 2. Key Indicator
Indicator 2007 2008 2009 2010 2011 2012 2013 201
4
2015
Reserves
Oil (Million
Barrels)
8,400 8,22
0
8,00
0
7,76
0
7,73
0
7,41
0
7,55
0
7,37
0
7,370
*
Proven 3,990 3,75
0
4,30
0
4,23
0
4,04
0
3,74
0
3,69
0
3,62
0
3,692
Potential 4,410 4,47
0
3,70
0
3,53
0
3,69
0
3,67
0
3,86
0
3,75
0
3,750
*
**Gas
(TCF)
165.0
0
170.
10
159.
63
157.
14
152.
89
150.
70
150.
39
149.
30
149.3
0*
Proven 106.0
0
112.
50
107.
34
108.
40
104.
71
103.
35
101.
54
100.
26
103.3
5
Potential 59.00 57.6
0
52.2
9
48.7
4
48.1
8
47.3
5
48.8
5
49.0
4
49.04
*
Production
***Crude
Oil
(MBOPD)
972 1,00
6
994 1,00
3
952 918 825 789 779

Conference on Management and Behavioral Studies Universitas Tarumanagara, Jakarta, 12 Oktober 2017
ISSN NO: 2541-3406 e-ISSN NO: 2541-285X
367
Source:
* 2007-2014 Oil Proven and Potential Reserves: ESDM
* 2015 Oil proven: EIA
** 2007-2014 Gas Proven and Potential Reserves: ESDM
** 2015 Gas proven: EIA New contract signed: ESDM # Using 2014 as an estimate as
2015 data not yet available
*** 2007-2012 Crude Oil and Natural Gas Production: BP Statistical Review of World
Energy
*** 2013-2014 Crude Oil and Natural Gas production: SKK Migas Annual Report 2013
and 2014
*** 2015 Crude oil production: Ministry of Finance (State Budget Realization)
*** 2015 Natural gas production: SKK Migas
LITERATUR REVIEW
There are two methods to measure the financial performances which are accounting
and market measurement. There are many researchers who prefer to use accounting
measurement (Waddock and Graves 1997; Cochran and Wood 1984), rather than
market measurement (Alexander and Buchholz, 1978; Vance, S. C., 1975), and some of
them adopt both methods (McGuire, J. B., Sundgren, A., Schneeweis, T., 1988). There
are few differences between accounting and market measurement method. In
accounting, company use the historical aspects to measure their financial performance
(McGuire, Schneeweis, & Hill, 1986) and it contain a bias which lead to managerial
manipulation. On the other hand, market measurement method is straight forward, focus
on performance and represent the ability of a company to generate future income
(McGuire, J. B., A. Sundgren, and T. Schneeweis, 1988). There have been a large
number of empirical studies on financial ratio on different industries around the world
(Yeh, 1996; Webb, 2003; Lacewell, 2003; Halkos and Salamouris, 2004; Tarawneh,
2006).
Based on the study in Oman Commercial Banks, financial performance has
relationship with asset management, size and operational efficiency. Iskakov and
Yilmaz (2015) investigated the financial performance in four major Oil and Gas
Company and found that three of them have a high level of satisfactory and Exxon
Mobil was the outstanding one. According to Andika et al. (2014), there is significance
different in the performance of oil and gas industry in Indonesia between ROA, ROE,
current ratio, and quick ratio in the period of before and after the global crisis.
METHODOLOGY
To accomplish this study, descriptive financial ratio analysis used to measure,
describe and analyze the financial performance of Oil and Gas Company in Indonesia
during the period of 2011 – 2015. PT. Medco Energy International, Tbk was selected
because it is a publicly listed and one of the biggest oil and gas company in Indonesia
*** Natural
gas
(MMSCFD)
7,283 7,46
0
7,96
2
8,85
7
8,41
5
7,11
0
6,82
6
8,21
8
8,102

Conference on Management and Behavioral Studies Universitas Tarumanagara, Jakarta, 12 Oktober 2017
ISSN NO: 2541-3406 e-ISSN NO: 2541-285X
368
with their extensive experience in the industry. In this research, the data were collected
from Annual Report (audited) of the company for the periods of 2011 to 2015.
THE VARIABLES
A. Profitability Performance
ROE indicates the company’s profitability and growth potential.
ROI shows the ability of the company to measure the income generated on investment
relative to the amount of money invested (Anthony et. al, 2011).
B. Liquidity Performance
According to Gitman and Zutter (2012), liquidity ratio can be used to measure
the company’s ability to pay their short-term liabilities. This type of liquidity is different
with the investor’s fund which company saves in the highly liquid account because it
can’t generate a return.
Cash ratio measures the liquidity of the company to pay the current liabilities
with only cash and cash equivalents. If the cash ratio above 1, it means that company
has the ability to pay its current liabilities with only cash and cash equivalents. If the
cash ratio is less than 1, the company needs more cash and cash equivalents to pay its
current liabilities.
The current ratio measures the company ability to pay its short-term liabilities using
their short-term assets.
Collection period is a good indicator to measure the problem of the company to collect a
debt from customers. If the companies have high collection period, they should
communicate with their customers regarding their debts.
C. Activity Ratio
Inventory turnover describes how many times the inventory is sold or replaced by the
company. If the ratio is high, it indicates that the inventory level is inadequate. If the

Conference on Management and Behavioral Studies Universitas Tarumanagara, Jakarta, 12 Oktober 2017
ISSN NO: 2541-3406 e-ISSN NO: 2541-285X
369
ratio is low, it indicates that the company is overstocking and deficiencies in the
marketing effort.
TATO ratio indicates the company ability to generate revenue from deploying its asset.
A Higher ratio indicates that company using its assets more efficiently and lower ratio
indicates that company is using its asset deficiently.
D. Solvency ratio
It is a good indicator to measure the financial health of the company. Equity to asset
ratio measures the percentage of company’s asset owned by investors and the leverage
level of the company with its debt.
RESULTS AND DISCUSSION
Figure 1 shows the information about the percentage of return on equity (ROE) and
return on investment (ROI) of PT Medco Energi Internasional, Tbk between 2011 and
2015. Overall, the percentage of ROI and ROE decreased sharply and there was a sharp
decrease in the percentage of profit margin. The profitability performances were very
poor, and even negative in 2015. In fact, oil prices decreased significantly during the
last two years. The ROI percentages in 2011-2015 were 3.6%; 0.85%; 0.79%; 0.33%;
and -6.40% respectively. And ROE were 10.78%; 2.72%: 2.26%; 0.99%; and -26.54%
respectively. The poor profitability also supported by negative figure in 2015, or -
29.63%, so the company experienced big losses. The profit margin percentages in 2011
to 2015 were very poor: 11.56%; 2.50%; 2.23%; 1.17%; and -29.63% respectively.
(Medco Annual Report 2011 – 2015).
Figure 1. Profitability Trend
-35,00%
-30,00%
-25,00%
-20,00%
-15,00%
-10,00%
-5,00%
0,00%
5,00%
10,00%
15,00%
2011 2012 2013 2014 2015
Pe
rce
nta
ge
Profitablity Trend
ROE
ROA
Profit Margin

Conference on Management and Behavioral Studies Universitas Tarumanagara, Jakarta, 12 Oktober 2017
ISSN NO: 2541-3406 e-ISSN NO: 2541-285X
370
Source : PT Medco Energi Internasional, Tbk. - Audited Annual Report 2011 – 2015
Liquidity Performance
Figure 2 shows the percentages of cash ratios and current ratios of PT Medco Energi
Internasional, Tbk. from 2011 to 2015. Overall, there were significant increases in the
percentage of cash ratio and current ratio in the first two years, 2011 and 2012. But then
the two ratios fluctuated. The cash ratio percentages in 2011-2015 were 86.77%;
121.23%; 64.41%; 44.17%; and 87.96 respectively. And current ratio percentages were
160.75%; 335.12%: 200.39%; 161.26% and 198.42% respectively. The highest
percentage was current ratio and the lowest was cash ratio. The current ratio is the
general indicator to measure the liquidity of the company. The company can optimally
manage its working capital within safe limits. So, it does not have short-term financial
problems or the company in a liquid condition.
Figure 2: Liquidity Trend
0,00%
100,00%
200,00%
300,00%
400,00%
2011 2012 2013 2014 2015
Pe
rce
nta
ge
Liquidity Trend
Cash Ratio
Current Ratio
Source : PT Medco Energi Internasional, Tbk. - Audited Annual Report 2011 – 2015
Activity Performance
Figure 3 gives information about the percentages of inventory turnover (ITO) and total
assets turnover (TATO) of PT Medco Energi Internasional, Tbk. between 2011 and
2015. Overall, there was a slight decrease in the number of those two ratios. In
inventory turnover (ITO), the percentages were 53.787%; 52.235%; 49.301%; 37.732%;
and 38.897% respectively in 2011-2015. The ratios decreased slightly during 5 years.
The percentages of total assets turnover (TATO) from also decreased slightly during 5
years : 31.1576%; 33.9187%; 35.3328%; 28.1393%; 21.5994% respectively. It can be
concluded that those two ratios were in good condition and the management of assets
run efficiently.

Conference on Management and Behavioral Studies Universitas Tarumanagara, Jakarta, 12 Oktober 2017
ISSN NO: 2541-3406 e-ISSN NO: 2541-285X
371
Figure 3: Activity Trend
0,00%
10,00%
20,00%
30,00%
40,00%
50,00%
60,00%
2011 2012 2013 2014 2015
Pe
rce
nta
ge
Activity Trend
Inv Turnover
Total Asset Turn Over
Source : PT Medco Energi Internasional, Tbk. - Audited Annual Report 2011 – 2015
Solvency Performance
Figure 4 shows the percentage of the total of equity to total asset (TETA) ratio of PT
Medco Energi Internasional, Tbk. between 2011 and 2015. Overall, there were
fluctuated in the TETA ratios, 33.414%; 31.179%; 34.882%; 33.252%; and 24.112%
respectively from 2011 to 2015. In the long term, the company rated insolvent because
the average ratio of total equity to a total asset for the last 5 years was only 31.3678%,
where the general standard was 50%. It shows that the risks of the company were higher
unless the company can achieve high profit.

Conference on Management and Behavioral Studies Universitas Tarumanagara, Jakarta, 12 Oktober 2017
ISSN NO: 2541-3406 e-ISSN NO: 2541-285X
372
Figure 4: Solvency Trend
0,00%
5,00%
10,00%
15,00%
20,00%
25,00%
30,00%
35,00%
40,00%
2011 2012 2013 2014 2015
Solvency Trend
Total Equity to TotalAsset
Source : PT Medco Energi Internasional, Tbk. - Audited Annual Report 2011 – 2015
CONCLUSION AND RECOMMENDATION
The purpose of this study is to analyze and to measure the financial performance of
oil and gas industry by using financial ratio analysis, which is classified into
profitability, liquidity, activity, and solvency ratios. The data were collected from
audited financial reports of the second largest oil and gas company in Indonesia for the
periods of 2011 – 2015. The finding shows that the company was in less healthy
condition due to the decrease of its net income since 2011, and even gained losses in
2015. It is reflected by the very poor of ROI and ROE ratios. ROI reflects how much the
firm has earned on the investment of all the financial resources committed to the firm. It
is a useful measure if one wants to evaluate how well an enterprise has used its fund,
without regard to the relative magnitudes of the sources of the funds. ROE reflects how
much the firm has earned on the funds invested by the shareholders, either directly or
through retained earnings. The ROE ratio is obviously of interest to present or
prospective shareholder, and is also of concern to management because this measure is
viewed as an important indicator of shareholder value creation. Therefore, the company
should concerns of the poor profitability ratios, moreover the company is going public
company. In order to be survive or going concern, it is recommended that the company
should take an action, may be diversify of its operations to the downstream of oil and
gas industry. This result implied that the oil and gas industry can increase their market
share, even though the industry faces major challenges. This study has added the
knowledge in the financial literature. It also gives a strong insight for managers in oil
and gas industry about the financial performance. Therefore, the managers can make a
better decision with the purpose to increase the market share.

Conference on Management and Behavioral Studies Universitas Tarumanagara, Jakarta, 12 Oktober 2017
ISSN NO: 2541-3406 e-ISSN NO: 2541-285X
373
REFERENCES
Anthony, R.N; Hawkins, D.F; and Merchant, K.A. 2011. Accounting: Text and Cases.
Mc.Graw - Hill International Edition. 13th Ed. Asia
Alexander, G. J., and Rogene A. Buchholz (1978) “Corporate social responsibility and
stock market performance.” Academy of Management Journal, 21 (3): 479-
486.ok
Anzuini, A., Lombardi, M.J., Pagano, P., (2012). The impact of monetary policy shocks
on commodity prices. Bank of Italy Working Paper, Number 851.ok
Beike, W. Orth, R. Setzer. (2010). Liquidity and the dynamic pattern of asset price
adjustment: A global view. Journal of Banking and Finance, 34, pp. 1933–1945.
British Petroleum.ok (2015). Statistical Review of World Energy. Retrieved from
http://www.bp.com/en/global/corporate/energy-economics/statistical-review-of-
world-energy.html
Energy today (2015). Ini perkembangan harga minyak mentah dunia dari tahun ketahun.
Retrieved from http://energitoday.com/2015/01/ini-perkembangan-harga-
minyak-mentah-dunia-dari-tahun-ke-tahun/
Frederer, J.P. (1996). Oil price volatility and the macroeconomy. Journal of
Macroeconomics, 18(1), 1-26.
Gitman, L. J., & Zutter, C. J. (2012). Principles of Managerial Finance. New Jersey:
Prentice Hall.
Indonesia Bond Pricing Agency (2016).Daily Fair Price and Yield Indonesia
Government Securities.Retrievedfrom
http://www.ibpa.co.id/DataPasarSuratUtang/HargadanYield/tabid/84/Default.asp
x.Indonesia Crude Oil. (2009)ok
Iskakov, S. & Yilmaz, K.N. (2015). Performance of evaluation of major integrated oil
and gas companies. International Journal of Economics, Commerce and
Management, 3(6), 332-361.ok
McGuire, J. B., A. Sundgren, and T. Schneeweis (1988) “Corporate social responsibility
and firm financial performance.” Academy of Management Journal, 31 (4): 854-
872.ok
McMahon, Richard G P; Davies, L. G. (1994). Financial reporting and analysis
practices in small enterprises: Their association with growth rate and financial
performance. Journal of Small Business Management , 32(1), 9. ?
McNichols, C.W. & Zimmerer, T.W. (1985). Situational ethics: an empirical study
of differentiators of student attitudes. Journal of Business Ethics, 4(3), 175-
180. doi:10.1007/BF00705616 ?
McWilliams, A., and D. Siegel (2000) “Corporate social responsibility and financial
performance: Correlation or misspecification?” Strategic Management Journal,
21 (5): 603-609. ?
Medco Energi Internasional, PT, Tbk. Published Audited Financial Report, 2011-2015.
Ministry of Energy and Mineral Resources (MEMR) of Republic of Indonesia (2016).
ICP Juni 2016 turun jadi US$ 44,50 per Barel. Retrieved from
http://esdm.go.id/berita/umum/37-umum/8579-icp-juni-2016-turun-jadi-us-
4450-per-barel.html.ok
Ministry of Energy and Mineral Resources (MEMR) of Republic of Indonesia (2016).
Conventional Oil and Gas Working Area.Retrieved from http://e-
wkmigas.esdm.go.id).

Conference on Management and Behavioral Studies Universitas Tarumanagara, Jakarta, 12 Oktober 2017
ISSN NO: 2541-3406 e-ISSN NO: 2541-285X
374
Ministry of Finance of Republic of Indonesia (2015), Crude Oil Production, State
Budget Realization.
Moskowitz, M. (1972) “Choosing socially responsible stocks.” Business and Society
Review, 1: 71-75.not ok
Ocal, E. M., Oral, L. E., Erdis, E., Vural, G. (2007). Industry financial ratios—
application of factor analysis in Turkish construction industry. Building and
Environment, 42(1), 385-392.
Qommarria, R. (2016). 3 dampak penurunan harga minyak bagi Indonesia. Retrieved
from http://www.republika.co.id/berita/ekonomi/makro/16/01/12/o0ubd1368-3-
dampak-penurunan-harga-minyak-bagi-indonesia.not
Raymond, K.S & Chu, T.C. (2000). An importance-performance analysis of hotel
selection factors in the Hong Kong hotel industry: a comparison of business and
leisure travelers. Tourism Management, 21(4), 363-377.
Regnier, E. (2007). Oil and energy price volatility. Energy Economics, 29(3), 405 – 427.
Conference on Management and Behavioral Studies Universitas Tarumanagara, Jakarta, 12 Oktober 2017
ISSN NO: 2541-3406 e-ISSN NO: 2541-285X
375
Reuters. (2016). Chevron says will not extend contract operate Indonesia oil and gas.
Retrieved from http://www.reuters.com/article/us-chevron-indonesia-
idUSKCN0UX0QK
Rohimat, N. (2016). Badai pemecatan karyawan perusahaan minyak. Retrieved from
http://www.money.id/finance/badai-pemecatan-karyawan-perusahaan-minyak-
160128n.html.
SKK Migas, Annual Report (2015), Natural Gas Production.
Tharakan, Pradeep. (2015). Summary of Indonesia’s Energy Sector Assessment, ADB
Papers on Indonesia, no. 09, December 2015.
Vance, S. C.(1975) “Are socially responsible corporations good investment risks?”
Management Review, 64: 18-24.
Voulgaris, F., Doumpos, M. &Zopounidis, C. (2000). On the evaluation of Greek
industrial SME’s performance via multi-criteria analysis of financial ratios.
Small Business Economics, 15(127), doi:10.1023/A:1008159408904
Waddock, S. A., and Samuel B. Graves (1997) “The corporate social performance-
financial performance link.” Strategic Management Journal, 18 (4): 303-319.
Copyright © 2022 FDOKUMEN