PENGUMUMAN Equity Research PT Gema Grahasarana Tbk. … fileu.p. Ibu Natalia Agus, Corporate...
18
PENGUMUMAN Equity Research PT Gema Grahasarana Tbk. (GEMA) (Tercatat Di Papan : Pengembangan) No.Peng-ER-00011/BEI.PPJ/08-2013 (dapat dilihat di laman: http://www.idx.co.id ) PT Bursa Efek Indonesia pada tanggal 1 Agustus 2013 telah menerima surat melalui email dari PT Pemeringkat Efek Indonesia dengan No. 1389/PEF-DIR/VII/2013 tanggal 31 Juli 2013 mengenai Publikasi Laporan Penilaian Target Harga Referensi Saham PT Gema Grahasarana Tbk. sebagaimana terlampir (17 lembar). Demikian untuk diketahui. 1 Agustus 2013 Goklas Tambunan Eko Siswanto P.H. Kepala Divisi Penilaian Perusahaan Sektor Jasa P.H. Kepala Divisi Perdagangan Saham Tembusan: 1. Yth. Kepala Eksekutif Pengawas Pasar Modal, Otoritas Jasa Keuangan; 2. Yth. Direktur Transaksi dan Lembaga Efek, Otoritas Jasa Keuangan; 3. Yth. Direktur Penilaian Keuangan Perusahaan Sektor Jasa, Otoritas Jasa Keuangan; 4. Yth. Direktur Indonesian Capital Market Electronic Library; 5. Yth. Direksi PT Gema Grahasarana Tbk. psu_GEMA_er_20130801_11
-
Upload
phamnguyet -
Category
Documents
-
view
219 -
download
1
Transcript of PENGUMUMAN Equity Research PT Gema Grahasarana Tbk. … fileu.p. Ibu Natalia Agus, Corporate...
PENGUMUMAN Equity Research
PT Gema Grahasarana Tbk. (GEMA) (Tercatat Di Papan : Pengembangan) No.Peng-ER-00011/BEI.PPJ/08-2013
(dapat dilihat di laman: http://www.idx.co.id) PT Bursa Efek Indonesia pada tanggal 1 Agustus 2013 telah menerima surat melalui email dari PT Pemeringkat Efek Indonesia dengan No. 1389/PEF-DIR/VII/2013 tanggal 31 Juli 2013 mengenai Publikasi Laporan Penilaian Target Harga Referensi Saham PT Gema Grahasarana Tbk. sebagaimana terlampir (17 lembar). Demikian untuk diketahui.
1 Agustus 2013
Goklas Tambunan Eko Siswanto P.H. Kepala Divisi Penilaian Perusahaan Sektor Jasa P.H. Kepala Divisi Perdagangan Saham
Tembusan: 1. Yth. Kepala Eksekutif Pengawas Pasar Modal, Otoritas Jasa Keuangan; 2. Yth. Direktur Transaksi dan Lembaga Efek, Otoritas Jasa Keuangan; 3. Yth. Direktur Penilaian Keuangan Perusahaan Sektor Jasa, Otoritas Jasa Keuangan; 4. Yth. Direktur Indonesian Capital Market Electronic Library; 5. Yth. Direksi PT Gema Grahasarana Tbk.
psu_GEMA_er_20130801_11

(ID PEFINDOONESIA
1389/ PEF- Dr R/Vrr/ 2013
Jakarta, 3l Juli 2013
Kepada Yth.l. PT Gema Grahasarana TbkGTaha VIVEREJl. S. Parman No. 6Jakafta 11480
u.p. Ibu Natalia Agus, Corporate &cretary
2. PT Bursa Efek IndonesiaGedung Bursa Efek Indone'siaJl. Jend. Sudirman Kav 52-53Jakarta Selatan, 12190
u.p. Bapak lto Warsito, Direktur UtamaBapak Hoesen, Direktur Penilaian Perusahaan
Perihal: Publikasi Laporan Penilaian Target Harga Referensi Saham PT GemaGrahasarana Tbk.
Dengan hormat,
Sehubungan dengan penugasan yang kami peroleh untuk melakukan Penilaian Target HargaReferensi Saham, dengan ini kami sampaikan hasil penilaian kami atas saham PT Gema GrahasaranaTbk (GEMA) dalam versi Bahasa Indonesia dan Bahasa Inggris.
Apabila masih ada hal-hal yang memerlukan penjelasan lebih lanjut, mohon agar menghubungi kami.Atas perhatian dan kerjasamanya, kami ucapkan terima kasih.
Hormat kami,
0\4M+
Yohanes Afts Abima nyu +DireKur
Tembusan : Ibu Umi Kulsum, Kepala Divisi Pencatatan Sektor Jasa, PT Bursa Efek Indonesia
/ma
PT. Pemeringkat Efek IndonesiaPanin Tower Senayan City, 17th FloorJl. Asia Afrika Lot. 19, Jakarta 10270, tNDONES|APhon e : (62-2 1 ) 7 27 8 2380 . F ax : (62-2Ll 7 27 I 237 O

Halaman 1 dari 8
Kontak: Equity & Index Valuation Division Phone: (6221) 7278 2380 [email protected] “Pernyataan disclaimer pada halaman akhir
merupakan bagian yang tidak terpisahkan dari
dokumen ini”
www.pefindo.com
Gema Grahasarana, Tbk Laporan Kedua
Equity Valuation
30 Juli 2013 Target Harga
Terendah Tertinggi 680 770
Interior dan Furnitur
Kinerja Saham
0
100
200
300
400
500
600
700
800
0
500
1.000
1.500
2.000
2.500
3.000
3.500
4.000
4.500
5.000
5.500
Jul-12 Sep-12 Nov-12 Jan-13 Mar-13 May-13 Jul-13
GEMAIHSG
IHSG GEMA
Sumber: Bloomberg
Informasi Saham Rp
Kode Saham GEMA
Harga Saham Per 29 Juli 2013 550
Harga Tertinggi Penutup 52 minggu terakhir 740
Harga Terendah Penutup 52 minggu terakhir 340
Kapitalisasi Pasar Tertinggi 52 minggu (miliar) 237
Kapitalisasi Pasar Terendah 52 minggu (miliar) 109
Penilaian Saham Sebelumnya Saat ini
Tertinggi 580 770
Terendah 500 680
Market Value Added & Market Risk
0
0,2
0,4
0,6
0,8
1
1,2
-55
-54
-53
-52
-51
-50
-49
-48
-47
-46
2011 2012
Mar
ket
Ris
k
MV
A
MVA Market Risk
Sumber:Bloomberg, Pefindo Divisi Valuasi Saham & Indexing
Pemegang Saham
(%)
PT Virucci Indogriya Sarana 74,74
Tommy Diary Tan 7,50
Dedy Rochimat 0,26
Publik (masing-masing dibawah 5%
kepemilikan) 17,50
*Keterangan: per 30 Juni 2013
Permintaan Tinggi di Industri yang sedang Bertumbuh
Didirikan pada tahun 1984, PT Gema Grahasarana Tbk (GEMA) bergerak di bidang pekerjaan interior dan pembuatan furnitur. Perusahaan memiliki tiga anak perusahaan, yaitu PT Laminatech Kreasi Sarana, PT Prasetya Gemamulia dan PT Vivere Multi Kreasi, yang juga dikenal sebagai grup VIVERE. Perusahaan dan anak perusahaan didukung oleh tiga pabrik yang berlokasi di Tangerang, Cikande dan Cikarang. Perusahaan juga menyewakan pabrik lainnya di Cikarang ke perusahaan
afiliasi. Pada 2012, GEMA melakukan beberapa aksi korporasi, termasuk membuka toko VIVERE ke 12 dan 13, yang terletak di Bali dan Lippo Mall Kemang Jakarta, meluncurkan Vassa Collection (furnitur seri ramah lingkungan untuk daerah perumahan) dan Ikkat Collection serta ditunjuk sebagai distributor Steelcase, produk Amerika untuk perabot kantor. Melalui pengalamannya selama 29 tahun, GEMA telah mendapatkan
kepercayaan dari perusahaan-perusahaan besar dari berbagai sektor, termasuk PT Pertamina Hulu Energi, Bank Dunia, PT Eni Muara Bakau, PT Schlumberger Geophysics Nusantara, Fitness First, Harum Energy, Bank Mega Syariah, Blackberry Jakarta, dan banyak lagi.

“Pernyataan disclaimer pada halaman
akhir merupakan bagian tak
terpisahkan dari dokumen ini”
www.pefindo.com
Gema Grahasarana, Tbk
30 Juli 2013 Halaman 2 dari 8
Penyesuaian Target Harga Kami melakukan beberapa penyesuaian terhadap proyeksi sebelumnya dan menyesuaikan target harga saham naik menjadi Rp680 – Rp770 per saham, berdasarkan pertimbangan – pertimbangan sebagai berikut:
Pandangan optimis pada sektor properti. Kami memiliki pandangan positif pada sektor properti, yang didukung oleh kondisi demografi dan ekonomi negara yang kuat. GEMA diuntungkan dari permintaan yang kuat pada pasokan kantor dan perumahan di Jakarta, sebagai hasil dari ekspansi agresif perusahaan nasional dan multinasional. Di 2012, Perusahaan telah mengerjakan proyek interior seluas 277.751 m2, meningkat 26% dari tahun 2011. Sejalan dengan booming properti yang diharapkan terus berlanjut ditambah proyek-proyek
baru GEMA, kami percaya sekitar 325.000 m2 akan selesai pada akhir tahun ini.
Kinerja keuangan GEMA. Pada 2012, GEMA berhasil mencatat pertumbuhan pendapatan 15% YoY menjadi Rp 598 miliar, berkat peningkatan jumlah proyek. Pencapaian ini sedikit dibawah proyeksi kami dalam laporan
sebelumnya yaitu Rp 625 miliar. Mempertimbangkan beberapa proyek baru
yang ada, kami percaya Perusahaan akan mampu mencetak pertumbuhan pendapatan sebesar 24% year-on year (YoY) pada 2013.
Leverage yang lebih baik. Kami mencatat bahwa utang Perusahaan terhadap ekuitas (DER) menurun dari 4.3x di tahun 2009 menjadi 1,7 x di 1Q13. Selain itu, kemampuan GEMA untuk membayar utang jangka pendeknya meningkat, seperti yang ditunjukkan oleh interest coverage ratio sebesar 9.6x di 1Q13, naik dari 2,6 x di tahun 2010.
Asumsi risk free rate, equity premium dan beta masing-masing adalah sebesar 8,0%, 3,6% dan 0,4x.
Prospek Usaha Dengan indikator ekonomi yang baik di Indonesia, seperti yang terlihat dari peningkatan pendapatan per kapita dan daya beli serta populasi usia produktif yang besar, kami percaya bahwa industri properti masih akan terus bertumbuh.
Kondisi ini menarik perusahaan nasional dan multinasional untuk membuka
cabang di Jakarta. Jakarta, sebagai kota penyumbang utama pendapatan GEMA, mencatat pertumbuhan sewa kantor tertinggi di Asia Pasifik yaitu 7,4% YoY di 1Q13, di tengah melemahnya permintaan ruang kantor di wilayah ini. Hal ini, pada gilirannya akan meningkatkan proyek GEMA. Mengingat semua peluang ini ditambah proyek-proyek baru GEMA baik di dalam maupun di luar Jakarta,
bersama dengan kekuatan merek VIVERE, kami percaya GEMA akan dapat mencapai laju pertumbuhan tahunan gabungan (CAGR) sebesar 19% pada tahun 2012-2015. Tabel 1: Ringkasan Kinerja
2010 2011 2012 2013P 2014P
Penjualan [Rp Miliar] 448 518 598 741 878
Laba sebelum pajak [Rp miliar]
39 40 44 58 65
Laba bersih [Rp miliar] 26 28 29 37 42
EPS [Rp] 82 86 90 115 131
Pertumbuhan EPS [%] 350 6 4 28 14
P/E [x] 3,4 3,5 4,4 4,8* 4,2*
PBV [x] 1,0 0,8 0,9 1,0* 0,8* Sumber: PT Gema Grahasarana Tbk, Estimasi Pefindo Divisi Valuasi Saham & Indexing *Berdasarkan harga saham GEMA per 29 Juli 2013 – Rp 550/lembar
PARAMETER INVESTASI

“Pernyataan disclaimer pada halaman akhir merupakan bagian tak
terpisahkan dari dokumen ini”
www.pefindo.com
Gema Grahasarana, Tbk
2 30 Juli 2013 Halaman 3 dari 8
Growth-Value Map memberikan gambaran akan ekspektasi pasar untuk
perusahaan-perusahaan yang tercatat di BEI. Metrik Current Performance (“CP”), sumbu horisontal, adalah bagian dari nilai pasar saham saat ini yang dapat dihubungkan dengan nilai perpetuitas dari kinerja profitabilitas perusahaan. Metrik Growth Expectations (“GE”), sumbu vertikal, merupakan perbedaan antara nilai pasar saham saat ini dengan nilai current performance. Kedua metrik tersebut dinormalisasikan dengan nilai buku perusahaan.
Growth-Value Map membagi perusahaan-perusahaan ke dalam empat klaster, yaitu:
Excellent value managers (“Q-1”) Pasar memiliki ekspektasi terhadap perusahaan-perusahaan di Q-1 melebih benchmark mereka dalam hal profitabilitas dan pertumbuhan.
Expectation builders (“Q-2”)
Pasar memiliki ekspektasi yang relatif rendah terhadap profitabilitas
perusahaan-perusahaan di Q-2 dalam jangka pendek, tetapi memiliki ekspektasi pertumbuhan yang melebihi benchmark.
Traditionalists (“Q-3”)
Pasar memiliki ekspektasi yang rendah terhadap pertumbuhan perusahaan-perusahaan di Q-3, walaupun mereka menunjukkan profitabilitas yang baik dalam jangka pendek.
Asset-loaded value managers (“Q-4”)
Pasar memiliki ekspektasi yang rendah terhadap profitabilitas dan pertumbuhan perusahaan-perusahaan di Q-4.
Kami mengklasifikasikan GEMA pada klaster Traditionalists (Q-3), yang berarti Perusahaan melampaui benchmark pada ekspektasi profitabilitas dalam jangka
pendek, tetapi dipersepsikan lebih rendah pada pertumbuhan dalam jangka panjang. Dengan diuntungkan oleh prospek industri properti, kami percaya GEMA secara bertahap dapat berpindah ke klaster Excellent Value Managers (Q-1). Diperlukan juga upaya untuk memperkuat sistem internal dan secara teratur memperbarui masyarakat tentang keberhasilan ekonomi Perusahaan.
Gambar 1: Growth Value Map GEMA (Interior dan Furnitur)
-5
-3
-1
1
3
5
-1 0 1 2 3 4 5 6 7
Gro
wth
Exp
ect
atio
ns
Current Performance (CP)
Q-2 Q-1
Q-4 Q-3
GEMA
Sumber: Bloomberg, Pefindo Divisi Valuasi Saham & Indexing
GROWTH VALUE MAP

“Pernyataan disclaimer pada halaman
akhir merupakan bagian tak
terpisahkan dari dokumen ini”
www.pefindo.com
Gema Grahasarana, Tbk
30 Juli 2013 Halaman 4 dari 8
Pertumbuhan Industri Properti Mendorong Permintaan Interior dan
Furnitur Dalam beberapa tahun terakhir, industri properti di Indonesia telah menunjukkan
hasil yang menggembirakan, terutama didukung oleh suku bunga rendah, pertumbuhan ekonomi yang stabil dan peningkatan pendapatan. Hasilnya, sektor perkantoran dan perumahan, dimana Perusahaan berfokus, memiliki peluang yang luas ke depan. Jakarta mencatat pertumbuhan sewa kantor tertinggi di Asia Pasifik sekitar 7,4% YoY di 1Q13, di tengah melemahnya permintaan ruang kantor di wilayah tersebut. Tahun ini, pasokan ruang perkantoran di Jakarta diperkirakan seluas 311.908 m2. Ke depan, kami memperkirakan Jakarta akan
dibanjiri oleh sekitar 1,2 juta m2 pasokan perkantoran di 2014-2015, mengingat perkembangan agresif gedung perkantoran. Kondisi menguntungkan ini akan mempengaruhi proyek GEMA, yang diperkirakan sekitar 325.000 m2 tahun ini dibandingkan dengan 277.751 m2 pada tahun 2012.
Gambar 2: Pasokan Kantor vs Total Area yang Dikerjakan GEMA
184.576 219.858 277.751 325.000
5,83
6,09
6,4
6,7
5,2
5,4
5,6
5,8
6
6,2
6,4
6,6
6,8
0
50.000
100.000
150.000
200.000
250.000
300.000
350.000
2010 2011 2012 2013P
(juta m2)(m2)
Total area yang dikerjakan GEMA Pasokan kantor
Sumber: PT Gema Grahasarana Tbk., Estimasi Pefindo Divisi Valuasi Saham & Indexing
Mendapatkan Banyak Proyek Baru di dalam dan luar Jakarta Secara umum, sebagian besar proyek GEMA berada di wilayah Jakarta dan sekitarnya. Namun, karena konsistensinya dalam memberikan pelayanan optimal,
GEMA kini dipercaya oleh klien baru di daerah geografis yang lebih besar. Beberapa proyek baru di luar Jakarta adalah Blackberry Bali, Hotel Shangri-la dan Hotel JW Marriot di Bali, serta kantor Intiland dan Rumah Sakit Nasional di Surabaya. Selain itu, Perusahaan sedang mempersiapkan untuk membuka lini baru untuk sofa dan pabrik worksteel di Cikande, Tangerang. Sementara anak perusahaannya, PT Vivere Multi Kreasi, akan menawarkan lini furnitur premium baru bernama VIVERE Couture.
Tabel 2: Proyek-proyek Baru GEMA
Nilai Kontrak (Rp miliar)
Perkiraan Selesai
Sierad Produce 11,8 Juli 2013
Ciputra World Office 4,1 Juli 2013
Swiber 2,9 Juli 2013
VICO 4,5 Juli 2013
Fitness First 5,8 Agustus 2013
IPMI Business School 12,0 Agustus 2013
Harum Energy 10,0 September 2013
Lotte Duty Free 9,0 Juni 2013
Lotte Department Store 31,9 Juni 2013
Saipem 6,7 Maret 2013
Bank Mega Syariah 6,3 Juni 2013
Blackberry Jakarta 2,3 September 2013
Sumber: PT Gema Grahasarana Tbk., Pefindo Divisi Valuasi Saham & Indexing
INFORMASI USAHA
“Pernyataan disclaimer pada halaman
akhir merupakan bagian tak
terpisahkan dari dokumen ini”
www.pefindo.com
Gema Grahasarana, Tbk
30 Juli 2013 Halaman 5 dari 8
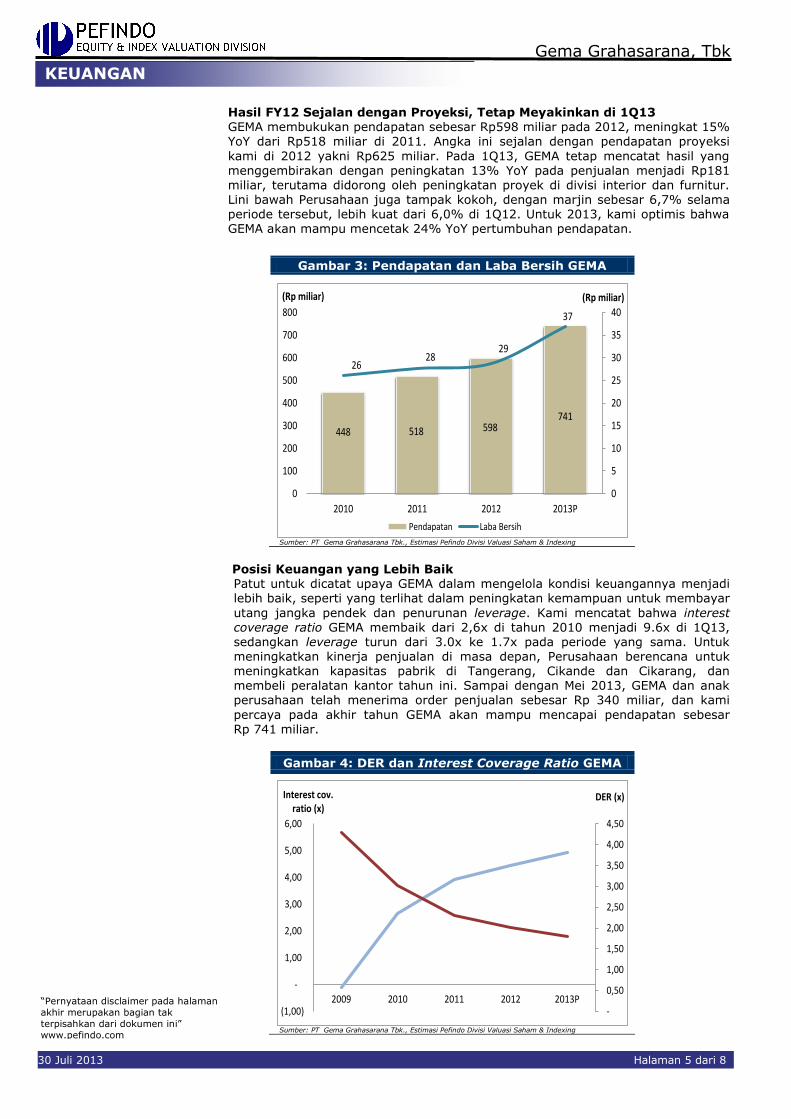
Hasil FY12 Sejalan dengan Proyeksi, Tetap Meyakinkan di 1Q13
GEMA membukukan pendapatan sebesar Rp598 miliar pada 2012, meningkat 15% YoY dari Rp518 miliar di 2011. Angka ini sejalan dengan pendapatan proyeksi
kami di 2012 yakni Rp625 miliar. Pada 1Q13, GEMA tetap mencatat hasil yang menggembirakan dengan peningkatan 13% YoY pada penjualan menjadi Rp181 miliar, terutama didorong oleh peningkatan proyek di divisi interior dan furnitur. Lini bawah Perusahaan juga tampak kokoh, dengan marjin sebesar 6,7% selama periode tersebut, lebih kuat dari 6,0% di 1Q12. Untuk 2013, kami optimis bahwa GEMA akan mampu mencetak 24% YoY pertumbuhan pendapatan.
Gambar 3: Pendapatan dan Laba Bersih GEMA
448 518 598741
2628
29
37
0
5
10
15
20
25
30
35
40
0
100
200
300
400
500
600
700
800
2010 2011 2012 2013P
(Rp miliar)(Rp miliar)
Pendapatan Laba Bersih
Sumber: PT Gema Grahasarana Tbk., Estimasi Pefindo Divisi Valuasi Saham & Indexing
Posisi Keuangan yang Lebih Baik Patut untuk dicatat upaya GEMA dalam mengelola kondisi keuangannya menjadi lebih baik, seperti yang terlihat dalam peningkatan kemampuan untuk membayar
utang jangka pendek dan penurunan leverage. Kami mencatat bahwa interest coverage ratio GEMA membaik dari 2,6x di tahun 2010 menjadi 9.6x di 1Q13, sedangkan leverage turun dari 3.0x ke 1.7x pada periode yang sama. Untuk meningkatkan kinerja penjualan di masa depan, Perusahaan berencana untuk meningkatkan kapasitas pabrik di Tangerang, Cikande dan Cikarang, dan membeli peralatan kantor tahun ini. Sampai dengan Mei 2013, GEMA dan anak perusahaan telah menerima order penjualan sebesar Rp 340 miliar, dan kami
percaya pada akhir tahun GEMA akan mampu mencapai pendapatan sebesar Rp 741 miliar.
Gambar 4: DER dan Interest Coverage Ratio GEMA
-
0,50
1,00
1,50
2,00
2,50
3,00
3,50
4,00
4,50
(1,00)
-
1,00
2,00
3,00
4,00
5,00
6,00
2009 2010 2011 2012 2013P
DER (x)Interest cov. ratio (x)
Sumber: PT Gema Grahasarana Tbk., Estimasi Pefindo Divisi Valuasi Saham & Indexing
KEUANGAN

“Pernyataan disclaimer pada halaman
akhir merupakan bagian tak
terpisahkan dari dokumen ini”
www.pefindo.com
Gema Grahasarana, Tbk
30 Juli 2013 Halaman 6 dari 8
VALUASI
Metodologi
Kami mengaplikasikan metode discounted cash flow (DCF) sebagai metode penilaian utama dengan pertimbangan bahwa pertumbuhan pendapatan adalah merupakan faktor yang sangat mempengaruhi nilai (value driver) bagi GEMA jika dibandingkan dengan pertumbuhan aset.
Kami tidak mengkombinasikan perhitungan DCF ini dengan metode Guideline Company Method (GCM) di dalam valuasi ini, disebabkan tidak terdapat peers
yang benar-benar dapat diperbandingkan dengan GEMA di Bursa Efek Indonesia.
Penilaian ini berdasarkan pada nilai 100% saham GEMA per 29 Juli 2013, menggunakan laporan keuangan GEMA per 31 Maret 2013 sebagai dasar dilakukannya analisa fundamental.
Estimasi Nilai
Kami menggunakan Cost of Capital sebesar 9,0% dan Cost of Equity sebesar 9,4% berdasarkan asumsi-asumsi berikut:
Tabel 3: Asumsi
Risk free rate [%]* 8,0
Risk premium [%]* 3,6
Beta [x]* 0,4
Cost of Equity [%] 9,4
Marginal tax rate [%] 25,0
Interest Bearing Debt to Equity Ratio 0,5
WACC [%] 9,0 Sumber: Bloomberg, Estimasi Pefindo Divisi Valuasi Saham & Indexing *Catatan: Per 29 Juli 2013 **PEFINDO Beta Saham, per 25 Juli 2013
Estimasi Target harga saham untuk 12 bulan berdasarkan posisi penilaian pada tanggal 29 Juli 2013 dengan menggunakan metode DCF dan asumsi tingkat diskonto 9,0% adalah sebesar Rp680 – Rp770 per lembar saham.
Tabel 4: Ringkasan Penilaian dengan Metode DCF
Konservatif Moderat Agresif
PV of Free Cash Flows [Rp miliar] 18 19 20 PV Terminal Value [Rp miliar] 261 275 289 Non-Operating Assets- [Rp miliar] 11 11 11 Net Debt [Rp miliar] (74) (74) (74) Total Equity Value [Rp miliar] 217 232 246 Number of Share [juta saham] 320 320 320 Fair Value per Share [Rp] 680 720 770
Sumber: Estimasi Pefindo Divisi Valuasi Saham & Indexing
TARGET HARGA
“Pernyataan disclaimer pada halaman
akhir merupakan bagian tak
terpisahkan dari dokumen ini”
www.pefindo.com
Gema Grahasarana, Tbk
30 Juli 2013 Halaman 7 dari 8
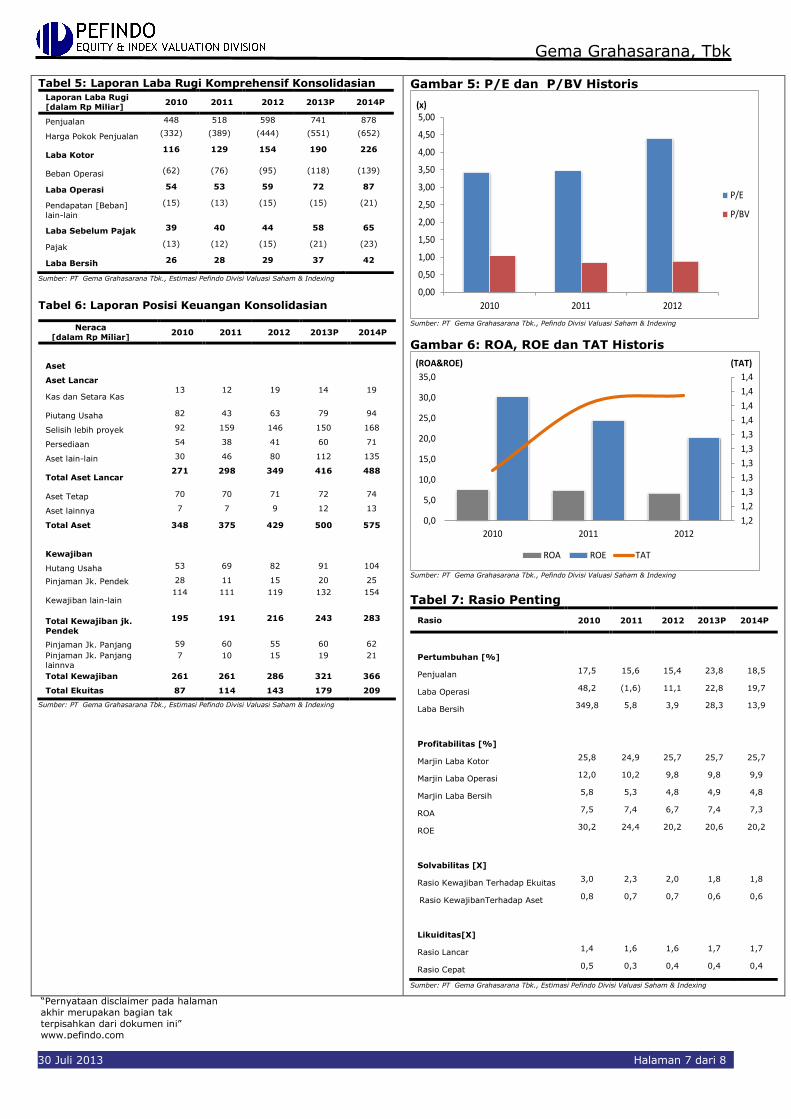
Tabel 5: Laporan Laba Rugi Komprehensif Konsolidasian Laporan Laba Rugi
[dalam Rp Miliar] 2010 2011 2012 2013P 2014P
Penjualan 448 518 598 741 878
Harga Pokok Penjualan (332) (389) (444) (551) (652)
Laba Kotor 116 129 154 190 226
Beban Operasi (62) (76) (95) (118) (139)
Laba Operasi 54 53 59 72 87
Pendapatan [Beban]
lain-lain
(15) (13) (15) (15) (21)
Laba Sebelum Pajak 39 40 44 58 65
Pajak (13) (12) (15) (21) (23)
Laba Bersih 26 28 29 37 42
Sumber: PT Gema Grahasarana Tbk., Estimasi Pefindo Divisi Valuasi Saham & Indexing
Tabel 6: Laporan Posisi Keuangan Konsolidasian
Neraca
[dalam Rp Miliar] 2010 2011 2012 2013P 2014P
Aset
Aset Lancar
Kas dan Setara Kas 13 12 19 14 19
Piutang Usaha 82 43 63 79 94
Selisih lebih proyek 92 159 146 150 168
Persediaan 54 38 41 60 71
Aset lain-lain 30 46 80 112 135
Total Aset Lancar 271 298 349 416 488
Aset Tetap 70 70 71 72 74
Aset lainnya 7 7 9 12 13
Total Aset 348 375 429 500 575
Kewajiban
Hutang Usaha 53 69 82 91 104
Pinjaman Jk. Pendek 28 11 15 20 25
Kewajiban lain-lain 114 111 119 132 154
Total Kewajiban jk.
Pendek
195 191 216 243 283
Pinjaman Jk. Panjang 59 60 55 60 62
Pinjaman Jk. Panjang
lainnya
7 10 15 19 21
Total Kewajiban 261 261 286 321 366
Total Ekuitas 87 114 143 179 209
Sumber: PT Gema Grahasarana Tbk., Estimasi Pefindo Divisi Valuasi Saham & Indexing
Gambar 5: P/E dan P/BV Historis
0,00
0,50
1,00
1,50
2,00
2,50
3,00
3,50
4,00
4,50
5,00
2010 2011 2012
(x)
P/E
P/BV
Sumber: PT Gema Grahasarana Tbk., Pefindo Divisi Valuasi Saham & Indexing
Gambar 6: ROA, ROE dan TAT Historis
1,2
1,2
1,3
1,3
1,3
1,3
1,3
1,4
1,4
1,4
1,4
0,0
5,0
10,0
15,0
20,0
25,0
30,0
35,0
2010 2011 2012
(TAT)(ROA&ROE)
ROA ROE TAT
Sumber: PT Gema Grahasarana Tbk., Pefindo Divisi Valuasi Saham & Indexing
Tabel 7: Rasio Penting
Rasio 2010 2011 2012 2013P 2014P
Pertumbuhan [%]
Penjualan 17,5 15,6 15,4 23,8 18,5
Laba Operasi 48,2 (1,6) 11,1 22,8 19,7
Laba Bersih 349,8 5,8 3,9 28,3 13,9
Profitabilitas [%]
Marjin Laba Kotor 25,8 24,9 25,7 25,7 25,7
Marjin Laba Operasi 12,0 10,2 9,8 9,8 9,9
Marjin Laba Bersih 5,8 5,3 4,8 4,9 4,8
ROA 7,5 7,4 6,7 7,4 7,3
ROE 30,2 24,4 20,2 20,6 20,2
Solvabilitas [X]
Rasio Kewajiban Terhadap Ekuitas 3,0 2,3 2,0 1,8 1,8
Rasio KewajibanTerhadap Aset 0,8 0,7 0,7 0,6 0,6
Likuiditas[X]
Rasio Lancar 1,4 1,6 1,6 1,7 1,7
Rasio Cepat 0,5 0,3 0,4 0,4 0,4
Sumber: PT Gema Grahasarana Tbk., Estimasi Pefindo Divisi Valuasi Saham & Indexing
“Pernyataan disclaimer pada halaman
akhir merupakan bagian tak
terpisahkan dari dokumen ini”
www.pefindo.com
Gema Grahasarana, Tbk
30 Juli 2013 Halaman 8 dari 8
DISCLAIMER
Laporan ini dibuat berdasarkan sumber-sumber yang kami anggap terpercaya dan dapat
diandalkan, Namun kami tidak menjamin kelengkapan, keakuratan atau kecukupannya , Dengan demikian kami tidak bertanggung jawab atas segala keputusan investasi yang diambil
berdasarkan laporan ini, Adapun asumsi, opini, dan perkiraan merupakan hasil dari pertimbangan internal kami per tanggal penilaian (cut-off date), dan kami dapat mengubah pertimbangan diatas sewaktu-waktu tanpa pemberitahuan terlebih dahulu. Kami tidak bertanggung jawab atas kekeliruan atau kelalaian yang terjadi akibat penggunaan laporan ini, Kinerja dimasa lalu tidak selalu dapat dijadikan acuan hasil masa depan , Laporan ini bukan merupakan rekomendasi penawaran, pembelian atau menahan suatu saham tertentu,
Laporan ini mungkin tidak sesuai untuk beberapa investor, Seluruh opini dalam laporan ini telah disampaikan dengan itikad baik, namun sewaktu-waktu dapat berubah tanpa pemberitahuan terlebih dahulu, dan disajikan dengan benar per tanggal diterbitkan laporan ini, Harga, nilai, atau pendapatan dari setiap saham Perusahaan yang disajikan dalam laporan ini kemungkinan dapat lebih rendah dari harapan pemodal, dan pemodal juga mungkin mendapatkan pengembalian yang lebih rendah dari nilai investasi yang ditanamkan, Investasi didefinisikan
sebagai pendapatan yang kemungkinan besar diterima dimasa depan, namun nilai dari
pendapatan yang akan diterima tersebut kemungkinan besar juga akan berfluktuasi , Untuk saham Perusahaan yang penyajian laporan keuangannya didenominasi dalam mata uang selain Rupiah, perubahan nilai tukar mata uang tersebut kemungkinan dapat menurunkan nilai, harga, atau pendapatan investasi pemodal, Informasi dalam laporan ini bukan merupakan pertimbangan pajak dalam mengambil suatu keputusan investasi.
Target harga saham dalam Laporan ini merupakan nilai fundamental, bukan merupakan Nilai Pasar Wajar, dan bukan merupakan harga acuan transaksi yang diwajibkan oleh peraturan perundang-undangan yang berlaku. Laporan target harga saham yang diterbitkan oleh Pefindo Divisi Valuasi Saham dan Indexing bukan merupakan rekomendasi untuk membeli, menjual, atau menahan suatu saham tertentu, dan tidak dapat dianggap sebagai nasehat investasi oleh Pefindo Divisi Valuasi Saham dan
Indexing yang behubungan dengan cakupan Jasa Pefindo kepada, atau kaitannya kepada, beberapa pihak, termasuk emiten, penasehat keuangan, pialang saham, investment banks, institusi keuangan dan perantara keuangan, dalam kaitannya menerima imbalan atau keuntungan lainnya dari pihak tersebut.
Laporan ini tidak ditujukan untuk pemodal tertentu dan tidak dapat dijadikan bagian dari tujuan
investasi terhadap suatu saham dan juga bukan merupakan rekomendasi investasi terhadap suatu saham tertentu atau suatu strategi investasi , Sebelum melakukan tindakan dari hasil laporan ini, pemodal disarankan untuk mempertimbangkan terlebih dahulu kesesuaian situasi dan kondisi dan, jika dibutuhkan, mintalah bantuan penasehat keuangan. PEFINDO memisahkan kegiatan Valuasi Saham dengan kegiatan Pemeringkatan untuk menjaga independensi dan objektivitas dari proses dan produk kegiatan analitis , PEFINDO telah
menetapkan kebijakan dan prosedur untuk menjaga kerahasiaan informasi non-publik tertentu yang diterima sehubungan dengan proses analitis, Keseluruhan proses, metodologi dan database yang digunakan dalam penyusunan Laporan Target Harga Referensi Saham ini secara keseluruhan adalah berbeda dengan proses, metodologi dan database yang digunakan PEFINDO dalam melakukan pemeringkatan. Laporan ini dibuat dan disiapkan Pefindo Divisi Valuasi Saham & Indexing dengan tujuan untuk
meningkatkan transparansi harga saham yang tercatat di Bursa Efek Indonesia , Laporan ini
juga bebas dari pengaruh tekanan atau paksaan dari Bursa maupun Perusahaan yang dinilai, Pefindo Divisi Valuasi Saham & Indexing akan menerima imbalan sebesar Rp. 20.000.000,- masing-masing dari Bursa Efek Indonesia dan Perusahaan yang dinilai untuk 2 (dua) kali pelaporan per tahun, Untuk keterangan lebih lanjut, dapat mengunjungi website kami di http://www,pefindo,com
Laporan ini dibuat dan disiapkan oleh Pefindo Divisi Valuasi Saham dan Indexing , Di Indonesia Laporan ini dipublikasikan pada website kami dan juga pada website Bursa Efek Indone sia.
Page 1 of 8
Contact: Equity & Index Valuation Division Phone: (6221) 7278 2380 [email protected]
“Disclaimer statement in the last page is an
integral part of this report”
www.pefindo.com
Gema Grahasarana, Tbk Secondary Report
Equity Valuation
July 30, 2013
Target Price
Low High 680 770
Interior and Furniture
Historical Chart
0
100
200
300
400
500
600
700
800
0
500
1.000
1.500
2.000
2.500
3.000
3.500
4.000
4.500
5.000
5.500
Jul-12 Sep-12 Nov-12 Jan-13 Mar-13 May-13 Jul-13
GEMAJCI
JCI GEMA
Source: Bloomberg
Stock Information IDR
Ticker code GEMA
Market price as of July 29, 2013 550
Market price – 52 week high 740
Market price – 52 week low 340
Market cap – 52 week high (bn) 237
Market cap – 52 week low (bn) 109
Stock Valuation Last Current
High 580 770
Low 500 680
Market Value Added & Market Risk
0
0.2
0.4
0.6
0.8
1
1.2
-55
-54
-53
-52
-51
-50
-49
-48
-47
-46
2011 2012
Mar
ket
Ris
k
MV
A
MVA Market Risk
Source: Bloomberg, Pefindo Equity & Index Valuation Division
Shareholders (%)
PT Virucci Indogriya Sarana 74.74
Tommy Diary Tan 7.50
Dedy Rochimat 0.26
Public (each below 5% ownership) 17.50
*Note: as of June 30, 2013
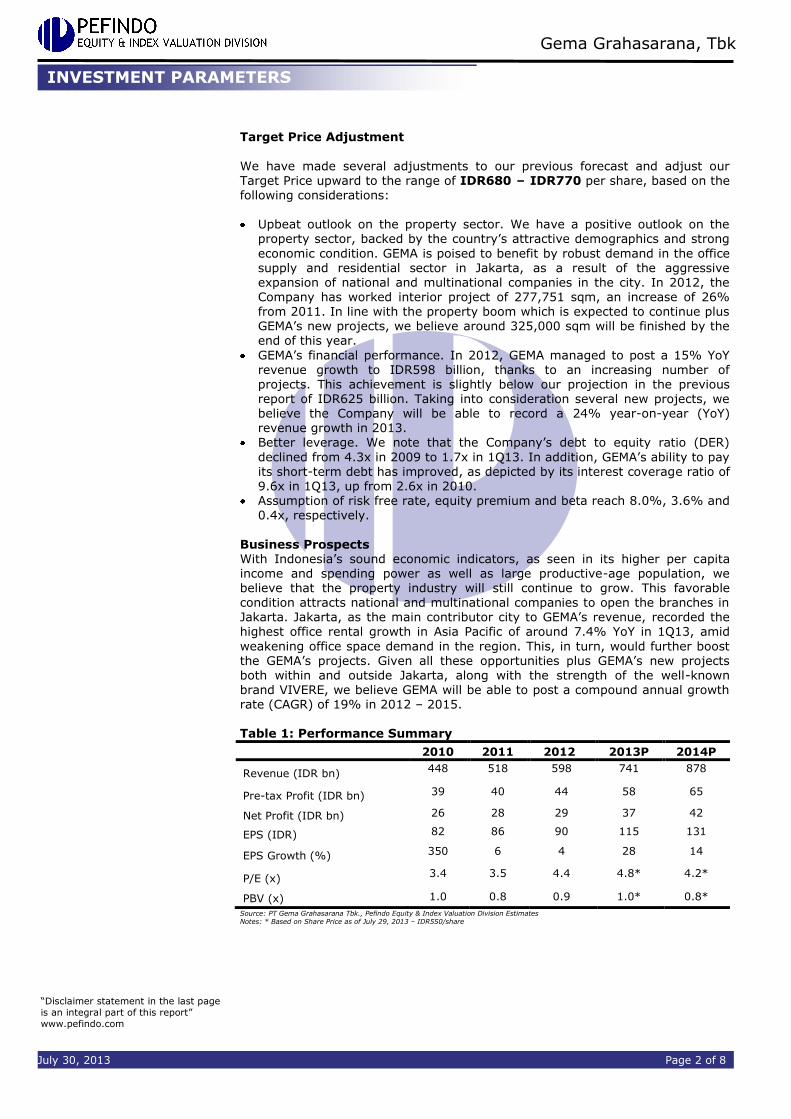
High Demand in a Growing Industry
Established in 1984, PT Gema Grahasarana Tbk (GEMA) is engaged in
contract interior work and furniture manufacturing. The Company has three subsidiaries, namely PT Laminatech Kreasi Sarana, PT Prasetya Gemamulia and PT Vivere Multi Kreasi, also known as VIVERE Group. The Company and its subsidiaries are supported by three manufacturing plants located in Tangerang, Cikande and Cikarang. The Company also
rents out another plant in Cikarang to an affiliated company. In 2012, GEMA carried out several actions, including opening VIVERE’s 12th and
13th store, located in Bali and Lippo Mall Kemang Jakarta, and launching the Vassa Collection (eco-friendly furniture series for residential areas) and the Ikkat Collection as well as appointed as distributor of Steelcase, USA products for office furniture. Through its 29-year experience, GEMA has gained the trust of major companies from different sectors, including the PT Pertamina Hulu Energi, World Bank, PT Eni Muara Bakau, PT Schlumberger Geophysics Nusantara, Fitness First, Harum Energy, Bank
Mega Syariah, Blackberry Jakarta, and more.
“Disclaimer statement in the last page
is an integral part of this report”
www.pefindo.com
Gema Grahasarana, Tbk
July 30, 2013 Page 2 of 8
Target Price Adjustment
We have made several adjustments to our previous forecast and adjust our Target Price upward to the range of IDR680 – IDR770 per share, based on the following considerations:
Upbeat outlook on the property sector. We have a positive outlook on the
property sector, backed by the country’s attractive demographics and strong
economic condition. GEMA is poised to benefit by robust demand in the office supply and residential sector in Jakarta, as a result of the aggressive expansion of national and multinational companies in the city. In 2012, the Company has worked interior project of 277,751 sqm, an increase of 26% from 2011. In line with the property boom which is expected to continue plus GEMA’s new projects, we believe around 325,000 sqm will be finished by the end of this year.
GEMA’s financial performance. In 2012, GEMA managed to post a 15% YoY
revenue growth to IDR598 billion, thanks to an increasing number of projects. This achievement is slightly below our projection in the previous report of IDR625 billion. Taking into consideration several new projects, we believe the Company will be able to record a 24% year-on-year (YoY) revenue growth in 2013.
Better leverage. We note that the Company’s debt to equity ratio (DER)
declined from 4.3x in 2009 to 1.7x in 1Q13. In addition, GEMA’s ability to pay its short-term debt has improved, as depicted by its interest coverage ratio of 9.6x in 1Q13, up from 2.6x in 2010.
Assumption of risk free rate, equity premium and beta reach 8.0%, 3.6% and 0.4x, respectively.
Business Prospects With Indonesia’s sound economic indicators, as seen in its higher per capita income and spending power as well as large productive-age population, we believe that the property industry will still continue to grow. This favorable
condition attracts national and multinational companies to open the branches in Jakarta. Jakarta, as the main contributor city to GEMA’s revenue, recorded the highest office rental growth in Asia Pacific of around 7.4% YoY in 1Q13, amid
weakening office space demand in the region. This, in turn, would further boost the GEMA’s projects. Given all these opportunities plus GEMA’s new projects both within and outside Jakarta, along with the strength of the well-known brand VIVERE, we believe GEMA will be able to post a compound annual growth rate (CAGR) of 19% in 2012 – 2015. Table 1: Performance Summary
2010 2011 2012 2013P 2014P
Revenue (IDR bn) 448 518 598 741 878
Pre-tax Profit (IDR bn) 39 40 44 58 65
Net Profit (IDR bn) 26 28 29 37 42
EPS (IDR) 82 86 90 115 131
EPS Growth (%) 350 6 4 28 14
P/E (x) 3.4 3.5 4.4 4.8* 4.2*
PBV (x) 1.0 0.8 0.9 1.0* 0.8*
Source: PT Gema Grahasarana Tbk., Pefindo Equity & Index Valuation Division Estimates Notes: * Based on Share Price as of July 29, 2013 – IDR550/share
INVESTMENT PARAMETERS
“Disclaimer statement in the last page
is an integral part of this report”
www.pefindo.com
Gema Grahasarana, Tbk
July 30, 2013 Page 3 of 8
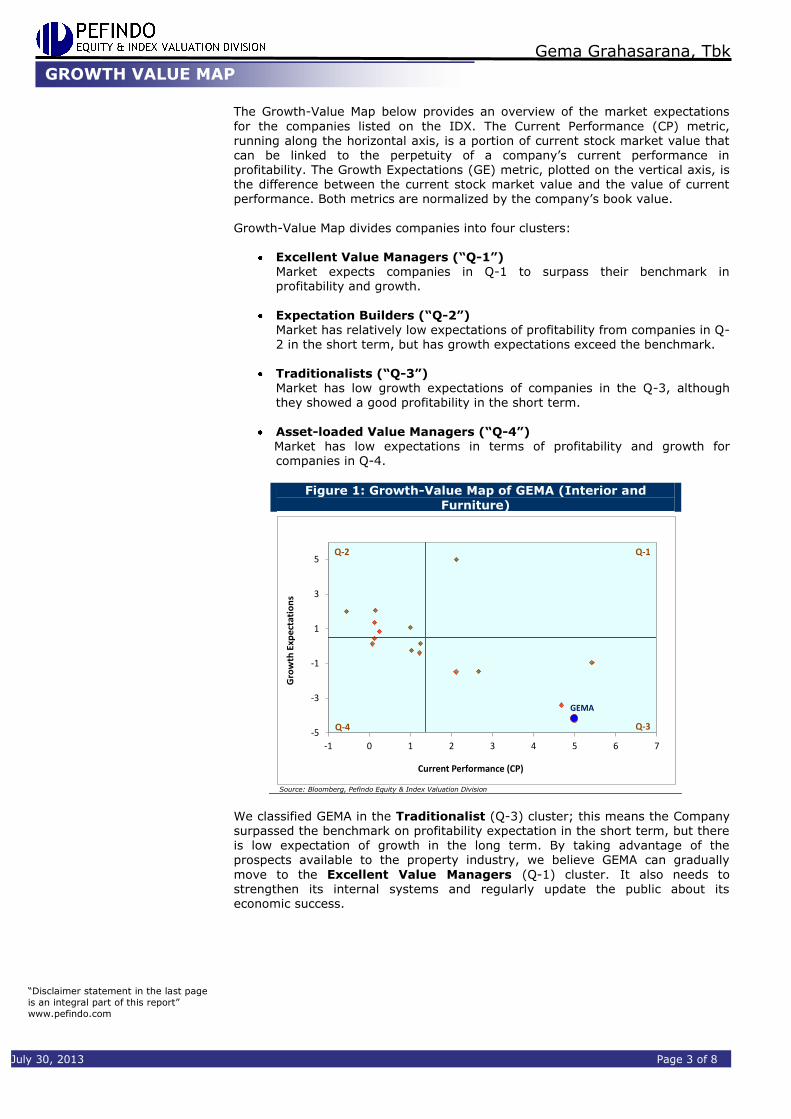
The Growth-Value Map below provides an overview of the market expectations
for the companies listed on the IDX. The Current Performance (CP) metric, running along the horizontal axis, is a portion of current stock market value that can be linked to the perpetuity of a company’s current performance in profitability. The Growth Expectations (GE) metric, plotted on the vertical axis, is the difference between the current stock market value and the value of current performance. Both metrics are normalized by the company’s book value.
Growth-Value Map divides companies into four clusters:
Excellent Value Managers (“Q-1”) Market expects companies in Q-1 to surpass their benchmark in profitability and growth.
Expectation Builders (“Q-2”) Market has relatively low expectations of profitability from companies in Q-2 in the short term, but has growth expectations exceed the benchmark.
Traditionalists (“Q-3”)
Market has low growth expectations of companies in the Q-3, although they showed a good profitability in the short term.
Asset-loaded Value Managers (“Q-4”) Market has low expectations in terms of profitability and growth for companies in Q-4.
Figure 1: Growth-Value Map of GEMA (Interior and
Furniture)
-5
-3
-1
1
3
5
-1 0 1 2 3 4 5 6 7
Gro
wth
Exp
ect
atio
ns
Current Performance (CP)
Q-2 Q-1
Q-4 Q-3
GEMA
Source: Bloomberg, Pefindo Equity & Index Valuation Division
We classified GEMA in the Traditionalist (Q-3) cluster; this means the Company surpassed the benchmark on profitability expectation in the short term, but there
is low expectation of growth in the long term. By taking advantage of the prospects available to the property industry, we believe GEMA can gradually
move to the Excellent Value Managers (Q-1) cluster. It also needs to strengthen its internal systems and regularly update the public about its economic success.
GROWTH VALUE MAP
“Disclaimer statement in the last page
is an integral part of this report”
www.pefindo.com
Gema Grahasarana, Tbk
July 30, 2013 Page 4 of 8
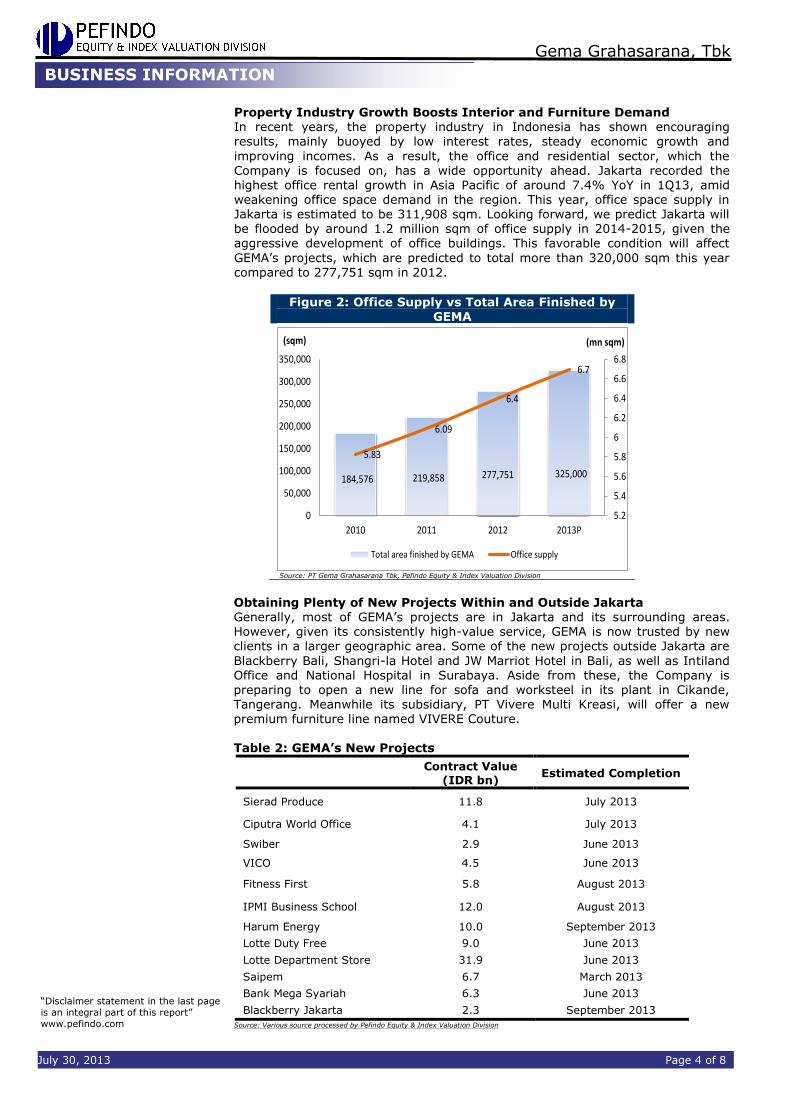
Property Industry Growth Boosts Interior and Furniture Demand
In recent years, the property industry in Indonesia has shown encouraging results, mainly buoyed by low interest rates, steady economic growth and
improving incomes. As a result, the office and residential sector, which the Company is focused on, has a wide opportunity ahead. Jakarta recorded the highest office rental growth in Asia Pacific of around 7.4% YoY in 1Q13, amid weakening office space demand in the region. This year, office space supply in Jakarta is estimated to be 311,908 sqm. Looking forward, we predict Jakarta will be flooded by around 1.2 million sqm of office supply in 2014-2015, given the aggressive development of office buildings. This favorable condition will affect
GEMA’s projects, which are predicted to total more than 320,000 sqm this year compared to 277,751 sqm in 2012.
Figure 2: Office Supply vs Total Area Finished by GEMA
184,576 219,858 277,751 325,000
5.83
6.09
6.4
6.7
5.2
5.4
5.6
5.8
6
6.2
6.4
6.6
6.8
0
50,000
100,000
150,000
200,000
250,000
300,000
350,000
2010 2011 2012 2013P
(mn sqm)(sqm)
Total area finished by GEMA Office supply
Source: PT Gema Grahasarana Tbk, Pefindo Equity & Index Valuation Division
Obtaining Plenty of New Projects Within and Outside Jakarta Generally, most of GEMA’s projects are in Jakarta and its surrounding areas. However, given its consistently high-value service, GEMA is now trusted by new clients in a larger geographic area. Some of the new projects outside Jakarta are
Blackberry Bali, Shangri-la Hotel and JW Marriot Hotel in Bali, as well as Intiland Office and National Hospital in Surabaya. Aside from these, the Company is preparing to open a new line for sofa and worksteel in its plant in Cikande, Tangerang. Meanwhile its subsidiary, PT Vivere Multi Kreasi, will offer a new premium furniture line named VIVERE Couture. Table 2: GEMA’s New Projects
Contract Value
(IDR bn) Estimated Completion
Sierad Produce 11.8 July 2013
Ciputra World Office 4.1 July 2013
Swiber 2.9 June 2013
VICO 4.5 June 2013
Fitness First 5.8 August 2013
IPMI Business School 12.0 August 2013
Harum Energy 10.0 September 2013
Lotte Duty Free 9.0 June 2013
Lotte Department Store 31.9 June 2013
Saipem 6.7 March 2013
Bank Mega Syariah 6.3 June 2013
Blackberry Jakarta 2.3 September 2013
Source: Various source processed by Pefindo Equity & Index Valuation Division
BUSINESS INFORMATION
“Disclaimer statement in the last page
is an integral part of this report”
www.pefindo.com
Gema Grahasarana, Tbk
July 30, 2013 Page 5 of 8
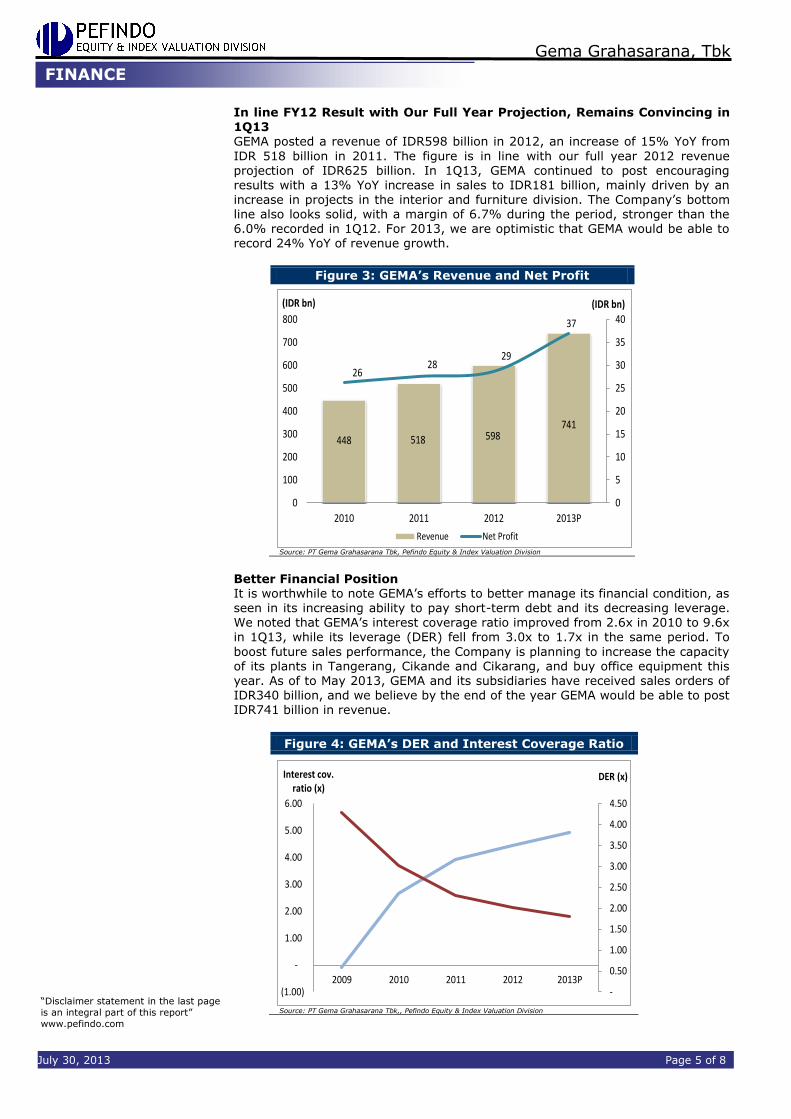
In line FY12 Result with Our Full Year Projection, Remains Convincing in
1Q13 GEMA posted a revenue of IDR598 billion in 2012, an increase of 15% YoY from
IDR 518 billion in 2011. The figure is in line with our full year 2012 revenue projection of IDR625 billion. In 1Q13, GEMA continued to post encouraging results with a 13% YoY increase in sales to IDR181 billion, mainly driven by an increase in projects in the interior and furniture division. The Company’s bottom line also looks solid, with a margin of 6.7% during the period, stronger than the 6.0% recorded in 1Q12. For 2013, we are optimistic that GEMA would be able to record 24% YoY of revenue growth.
Figure 3: GEMA’s Revenue and Net Profit
448 518 598741
2628
29
37
0
5
10
15
20
25
30
35
40
0
100
200
300
400
500
600
700
800
2010 2011 2012 2013P
(IDR bn)(IDR bn)
Revenue Net Profit
Source: PT Gema Grahasarana Tbk, Pefindo Equity & Index Valuation Division
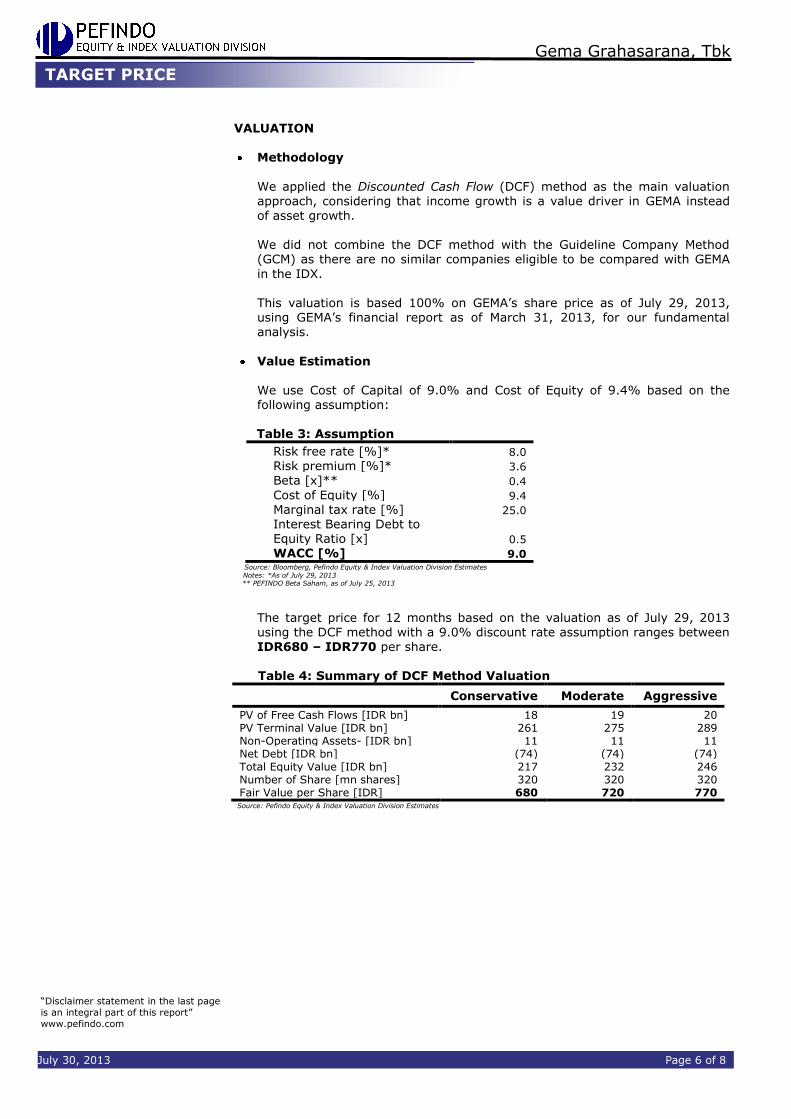
Better Financial Position It is worthwhile to note GEMA’s efforts to better manage its financial condition, as
seen in its increasing ability to pay short-term debt and its decreasing leverage. We noted that GEMA’s interest coverage ratio improved from 2.6x in 2010 to 9.6x in 1Q13, while its leverage (DER) fell from 3.0x to 1.7x in the same period. To
boost future sales performance, the Company is planning to increase the capacity of its plants in Tangerang, Cikande and Cikarang, and buy office equipment this year. As of to May 2013, GEMA and its subsidiaries have received sales orders of IDR340 billion, and we believe by the end of the year GEMA would be able to post IDR741 billion in revenue.
Figure 4: GEMA’s DER and Interest Coverage Ratio
-
0.50
1.00
1.50
2.00
2.50
3.00
3.50
4.00
4.50
(1.00)
-
1.00
2.00
3.00
4.00
5.00
6.00
2009 2010 2011 2012 2013P
DER (x)Interest cov. ratio (x)
Source: PT Gema Grahasarana Tbk,, Pefindo Equity & Index Valuation Division
FINANCE
“Disclaimer statement in the last page
is an integral part of this report”
www.pefindo.com
Gema Grahasarana, Tbk
July 30, 2013 Page 6 of 8
VALUATION
Methodology
We applied the Discounted Cash Flow (DCF) method as the main valuation approach, considering that income growth is a value driver in GEMA instead of asset growth. We did not combine the DCF method with the Guideline Company Method (GCM) as there are no similar companies eligible to be compared with GEMA
in the IDX. This valuation is based 100% on GEMA’s share price as of July 29, 2013, using GEMA’s financial report as of March 31, 2013, for our fundamental analysis.
Value Estimation
We use Cost of Capital of 9.0% and Cost of Equity of 9.4% based on the following assumption:
Table 3: Assumption
Risk free rate [%]* 8.0
Risk premium [%]* 3.6
Beta [x]** 0.4
Cost of Equity [%] 9.4
Marginal tax rate [%] 25.0
Interest Bearing Debt to Equity Ratio [x] 0.5
WACC [%] 9.0 Source: Bloomberg, Pefindo Equity & Index Valuation Division Estimates Notes: *As of July 29, 2013 ** PEFINDO Beta Saham, as of July 25, 2013
The target price for 12 months based on the valuation as of July 29, 2013 using the DCF method with a 9.0% discount rate assumption ranges between IDR680 – IDR770 per share. Table 4: Summary of DCF Method Valuation
Conservative Moderate Aggressive
PV of Free Cash Flows [IDR bn] 18 19 20 PV Terminal Value [IDR bn] 261 275 289 Non-Operating Assets- [IDR bn] 11 11 11 Net Debt [IDR bn] (74) (74) (74) Total Equity Value [IDR bn] 217 232 246 Number of Share [mn shares] 320 320 320 Fair Value per Share [IDR] 680 720 770 Source: Pefindo Equity & Index Valuation Division Estimates
TARGET PRICE
“Disclaimer statement in the last page
is an integral part of this report”
www.pefindo.com
Gema Grahasarana, Tbk
July 30, 2013 Page 7 of 8
Table 5: Consolidated Statements of Comprehensive
Income
(IDR bn) 2010 2011 2012 2013P 2014P
Sales 448 518 598 741 878
COGS (332) (389) (444) (551) (652)
Gross Profit 116 129 154 190 226
Operating Expense (62) (76) (95) (118) (139)
Operating Profit 54 53 59 72 87
Other Income (Charges) (15) (13) (15) (15) (21)
Pre-tax Profit 39 40 44 58 65
Tax (13) (12) (15) (21) (23)
Net Profit 26 28 29 37 42
Source: PT Gema Grahasarana Tbk., Pefindo Equity & Index Valuation Division Estimates
Table 6: Consolidated Statements of Financial Position
(IDR bn) 2010 2011 2012 2013P 2014P
Assets
Current Assets
Cash & cash equivalents 13 12 19 14 19
Receivables 82 43 63 79 94
Progress Billing 92 159 146 150 168
Inventory 54 38 41 60 71
Other Assets 30 46 80 112 135
Total Current Asset 271 298 349 416 488
Fixed Asset 70 70 71 72 74
Other Asset 7 7 9 12 13
Total Asset 348 375 429 500 575
Liabilities
Trade payables 53 69 82 91 104
Short-term liabilities 28 11 15 20 25
Other liabilities 114 111 119 132 154
Total short-term liabilities 195 191 216 243 283
Long-term liabilities 59 60 55 60 62
Other long-term liabilities 7 10 15 19 21
Total Liabilities 261 261 286 321 366
Total Equity 87 114 143 179 209
Source: PT Gema Grahasarana Tbk., Pefindo Equity & Index Valuation Division Estimates.
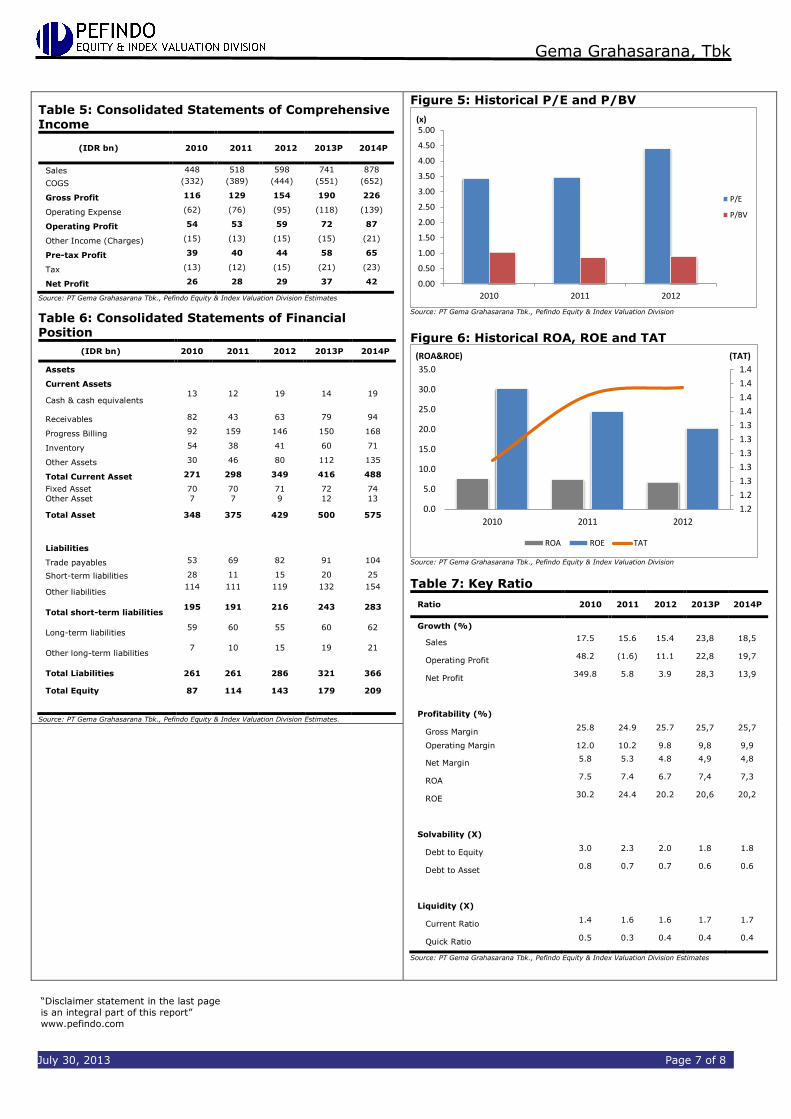
Figure 5: Historical P/E and P/BV
0.00
0.50
1.00
1.50
2.00
2.50
3.00
3.50
4.00
4.50
5.00
2010 2011 2012
(x)
P/E
P/BV
Source: PT Gema Grahasarana Tbk., Pefindo Equity & Index Valuation Division
Figure 6: Historical ROA, ROE and TAT
1.2
1.2
1.3
1.3
1.3
1.3
1.3
1.4
1.4
1.4
1.4
0.0
5.0
10.0
15.0
20.0
25.0
30.0
35.0
2010 2011 2012
(TAT)(ROA&ROE)
ROA ROE TAT
Source: PT Gema Grahasarana Tbk., Pefindo Equity & Index Valuation Division
Table 7: Key Ratio
Ratio 2010 2011 2012 2013P 2014P
Growth (%)
Sales 17.5 15.6 15.4 23,8 18,5
Operating Profit 48.2 (1.6) 11.1 22,8 19,7
Net Profit 349.8 5.8 3.9 28,3 13,9
Profitability (%)
Gross Margin 25.8 24.9 25.7 25,7 25,7
Operating Margin
12.0 10.2 9.8 9,8 9,9
Net Margin 5.8 5.3 4.8 4,9 4,8
ROA 7.5 7.4 6.7 7,4 7,3
ROE 30.2 24.4 20.2 20,6 20,2
Solvability (X)
Debt to Equity 3.0 2.3 2.0 1.8 1.8
Debt to Asset 0.8 0.7 0.7 0.6 0.6
Liquidity (X)
Current Ratio 1.4 1.6 1.6 1.7 1.7
Quick Ratio 0.5 0.3 0.4 0.4 0.4
Source: PT Gema Grahasarana Tbk., Pefindo Equity & Index Valuation Division Estimates
“Disclaimer statement in the last page
is an integral part of this report”
www.pefindo.com
Gema Grahasarana, Tbk
July 30, 2013 Page 8 of 8
DISCLAIMER
This report was prepared based on the trusted and reliable sources. Nevertheless, we do not guarantee its completeness, accuracy and adequacy. Therefore we do not responsible of any investment decision making based on this report. As for any assumptions, opinions and predictions were solely our internal judgments as per reporting date, and those judgments are
subject to change without further notice. We do not responsible for mistake and negligence occurred by using this report. Last performance could not always be used as reference for future outcome. This report is not an offering recommendation, purchase or holds particular shares. This report might not be suitable for some investors. All opinion in this report has been presented fairly as per issuing date with good intentions; however it could be change at any time without further notice. The price, value
or income from each share of the Company stated in this report might lower than the investor expectation and investor might obtain lower return than the invested amount. Investment is defined as the probable income that will be received in the future; nonetheless such return may possibly fluctuate. As for the Company which its share is denominated other than Rupiah, the foreign exchange fluctuation may reduce the value, price or investor investment return. This
report does not contain any information for tax consideration in investment decision making.
The share price target in this report is a fundamental value, not a fair market value nor a transaction price reference required by the regulations. The share price target issued by Pefindo Equity & Index Valuation Division is not a recommendation to buy, sell or hold particular shares and it could not be considered as an investment advice from Pefindo Equity & Index Valuation Division as its scope of service to, or
in relation to some parties, including listed companies, financial advisor, broker, investment bank, financial institution and intermediary, in correlation with receiving rewards or any other benefits from that parties. This report is not intended for particular investor and cannot be used as part of investment objective on particular shares and neither an investment recommendation on particular shares or an investment strategy. We strongly recommended investor to consider the suitable situation
and condition at first before making decision in relation with the figure in this report. If it is necessary, kindly contact your financial advisor.
PEFINDO keeps the activities of Equity Valuation separate from Ratings to preserve independence and objectivity of its analytical processes and products. PEFINDO has established policies and procedures to maintain the confidentiality of certain non-public information
received in connection with each analytical process. The entire process, methodology and the database used in the preparation of the Reference Share Pr ice Target Report as a whole is different from the processes, methodologies and databases used PEFINDO in doing the rating. This report was prepared and composed by Pefindo Equity & Index Valuation Division with the objective to enhance shares price transparency of listed companies in Indonesia Stock Exchange (IDX). This report is also free of other party’s influence, pressure or force either from IDX or the listed company
which reviewed by Pefindo Equity & Index Valuation Division. Pefindo Equity & Index Valuation Division will earn reward amounting to Rp 20 mn each from IDX and the reviewed company for issuing report twice per year. For further information, please visit our website at http://www.pefindo.com This report is prepared and composed by Pefindo Equity & Index Valuation Division. In Indonesia, this report is published in our website and in IDX website.