KUESIONEReprints.walisongo.ac.id/6518/8/LAMPIRAN.pdfdiinginkan oleh pihak keluarga serta sudah...
31
Transcript of KUESIONEReprints.walisongo.ac.id/6518/8/LAMPIRAN.pdfdiinginkan oleh pihak keluarga serta sudah...


KUESIONER
Hal : Permohonan Pengisian Angket
Lampiran : Satu Berkas
Yth.
Bapak / Ibu / Sdr/i Pasien / Pengunjung
Rumah Sakit Islam Pati
di Tempat
Assalamu’alaikum Wr. Wb.
Sehubungan dengan proses penyelesaian karya ilmiah (Skripsi)
saya, pada jurusan Ekonomi Islam di Universitas Islam Negeri (UIN)
Walisongo Semarang dengan judul “PENGARUH PELAYANAN
DAN FASILITAS KESEHATAN TERHADAP KEPUASAN
PASIEN BPJS DI RUMAH SAKIT ISLAM PATI”. Saya:
Nama : TRI UTAMI
NIM : 122411017
Jurusan : Ekonomi Islam
Memohon dengan hormat kesediaan Bapak/Ibu/Saudara/Saudari
Pasien/Pengunjung RSI Pati untuk mengisi kuesioner penelitian ini.
Peran serta Bapak/Ibu/Saudara/Saudari sangat bermanfaat bagi
keberhasilan penelitian yang akan dilaksanakan.
Atas bantuan dan kerjasama Bapak/Ibu/Saudara/Saudari dalam
menjawab pertanyaan/pernyataan pada kuesioner ini, penulis
sampaikan terima kasih.
Wassalamu’alaikum Wr. Wb.
Semarang, 16 Maret 2016
Hormat Saya,
TRI UTAMI

KUESIONER
ANGKET PENELITIAN
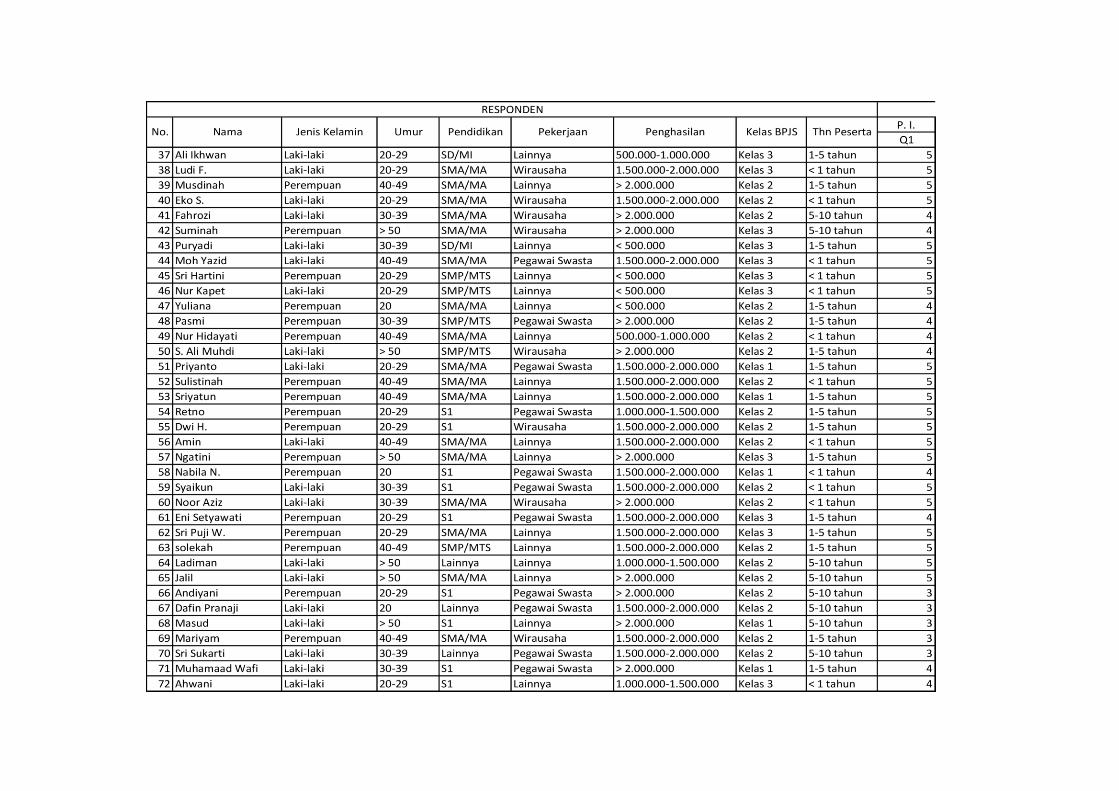
I. IDENTITAS RESPONDEN
Mohon dengan hormat kesediaan Bapak/ Ibu/ Saudara/ Saudari
untuk menjawab pertanyaan dibawah ini dengan memberikan tanda ( √):
1. Nama : ………………………………..
2. Jenis Kelamin : 1. Laki-laki 2. Perempuan
3. Umur : 1. 20 tahun 2. 20-29 tahun
3. 30-39 tahun 4. 40-49 tahun
5. >50 tahun
4. Pendidikan : 1. :S D/MI 2. SMP/MTS
3. SMA/MA 4. S1
5. Lainnya
5. Pekerjaan/Profesi : 1. PNS 2. Pegawai Swasta
3. Wirausaha 4. Lainnya
6. Penghasilan : 1. < 500.000
2. 500.000-1.000.000
3. 1.000.000 - 1.500.000
4. 1.500.000 - 2.000.000
5. > 2.000.000
7. Memilih perawatanBPJS: 1. Kelas 1 (59.500)
2. Kelas 2 (42.500)
3. Kelas 3 (25.500)
8. Berapa lama menjadi peserta BPJS : 1. < 1 tahun
2. 1 - 5 tahun
3. 5 - 10 tahun
4. > 10 tahun

KUESIONER
II. PETUNJUK PENGISIAN
1. Berilah tanda silang ( √ ) pada kolom jawaban yang Bapak/Ibu/Sdr/I
anggap sesuai, dengan alternative jawaban sebagai berikut:
SS : Sangat Setuju
S : Setuju
N : Netral
TS : Tidak Setuju
STS : Sangat Tidak Setuju
2. Lembar angket ini semata-mata bertujuan untuk memperoleh data
sebagai bahan skripsi tentang Pengaruh Pelayanan Dan Fasilitas
Kesehatan Terhadap Kepuasan Pasien BPJS Di Rumah Sakit Islam
Pati.
3. Mengenai jawaban yang diberikan, akan dijaga kerahasiaannya.
III. PERTANYAAN
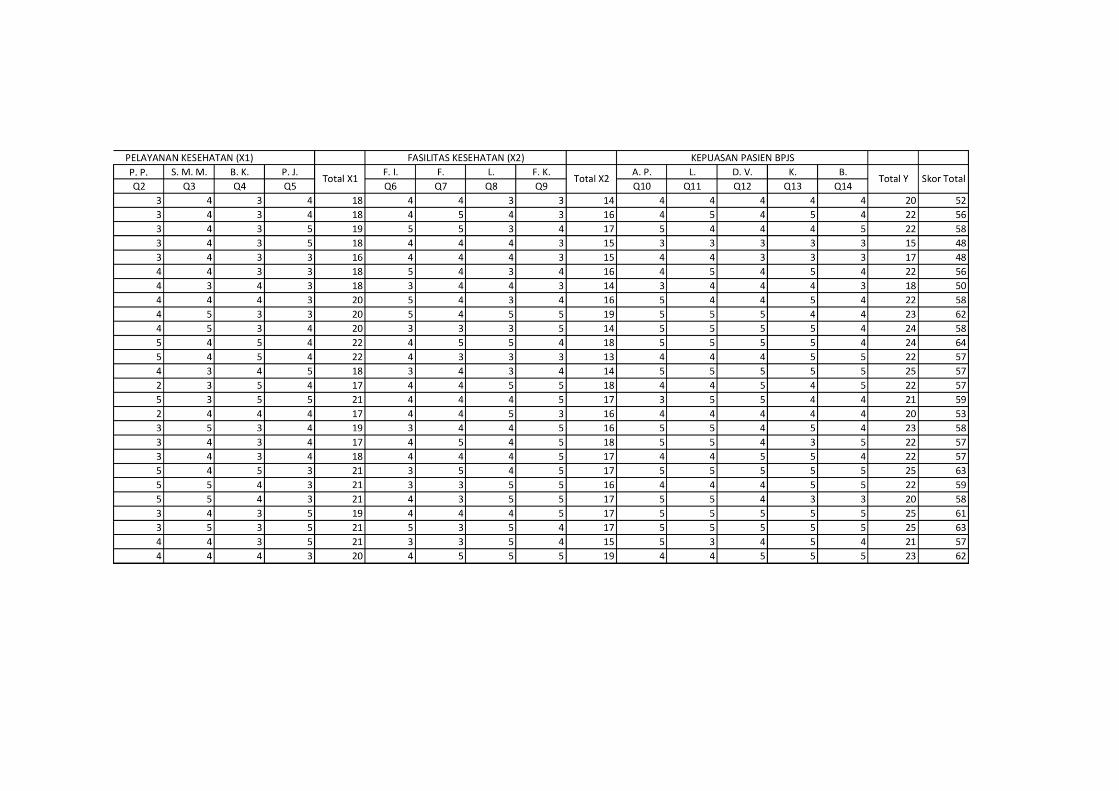
A. Pelayanan Kesehatan
N
O
Pertanyaan/pernyataan SS S N TS STS
Pelayanan yang Islami
1 Semua dokter/perawat RSI Pati
sebelum menangani pasien membaca
basmallah mengucapkan salam
sebelum memasuki ruangan/kamar
pasien terlebih dahulu.
Pembagian Perawat
2 Pasien ditangani oleh perawat yang
sesuai dengan muhrimnya (pasien
wanita oleh perawat wanita, begitu
juga pria).
Sajian Makanan dan Minuman
3 Pasien di RSI Pati memperoleh
makanan dan minuman sesuai dengan
gizi yang sedang dibutuhkan serta
terjamin kehalalannya.
Pelayanan Medis TIK
4 Semua dokter/perawat/karyawan RSI
Pati sudah mengunakan alat medis
Teknologi Informasi dan Komunikasi
Misal: Telvon, Komputer, Internet,
Bel Panggil di setiap ruangan dll.
Pemulasaran Jenazah
5 Pelayanan pemulasaran jenazah
diberikan sesuai dengan yang

diinginkan oleh pihak keluarga serta
sudah sesuai dengan ketentuan syari’at
Islam.
B. Fasilitas Kesehatan
N
O
Pertanyaan/pernyataan SS S N TS ST
S
Fasilitas Ibadah
6 Terdapat tempat ibadah dilengkapi
dengan tempat wudhu yang terjamin
kesuciannya serta di sediakannya
peralatan sholat dan Al-Qur’an.
Farmasi
7 Kecekatan dan keterampilan petugas
dalam melayani, pemberian obat, ganti
infuse dll.
Laboratorium
8 RSI Pati menyediakan tempat
laboratorium yang memadai serta
memberikan pelayanan dan perhatian
kepada setiap pasien.
Fasilitas Kamar
9 Tempat tidur yang nyaman,
disediakannya bantal, selimut yang
terjaga kebersihannya serta terdapat
telpon/bel panggil di setiap masing-
masing kamar.
C. Kepuasan Pasien BPJS (Badan Penyelenggara Jaminan Sosial)
N
O
Pertanyaan/pernyataan SS S N TS ST
S
Aspek Pelayanan
10 RSI Pati menyediakan jasa/pelayanan
yang sesuai dengan kebutuhan dan
kenyamanan saya (sesuai prinsip
syari’ah).
Lokasi
11 Saya memilih pelayanan kesehatan
(berobat) di RSI Pati karena lokasi
yang mudah dijangkau dan mudahnya
transportasi.
Desain Visual
12 Saya memilih RSI Pati karena
tampilan dekorasinya yang menarik

serta mengandung unsur-unsur Islami.
Komunikasi
13 Dokter/perawat/karyawan di RSI Pati
melakukan komunikasi yang ramah
dan sopan terhadap pasien.
Biaya
14 Tingkat pendapatan saya
mempengaruhi pengambilan
keputusan saya dalam memilih RSI
Pati.
TERIMA KASIH ATAS PARTISIPASINYA


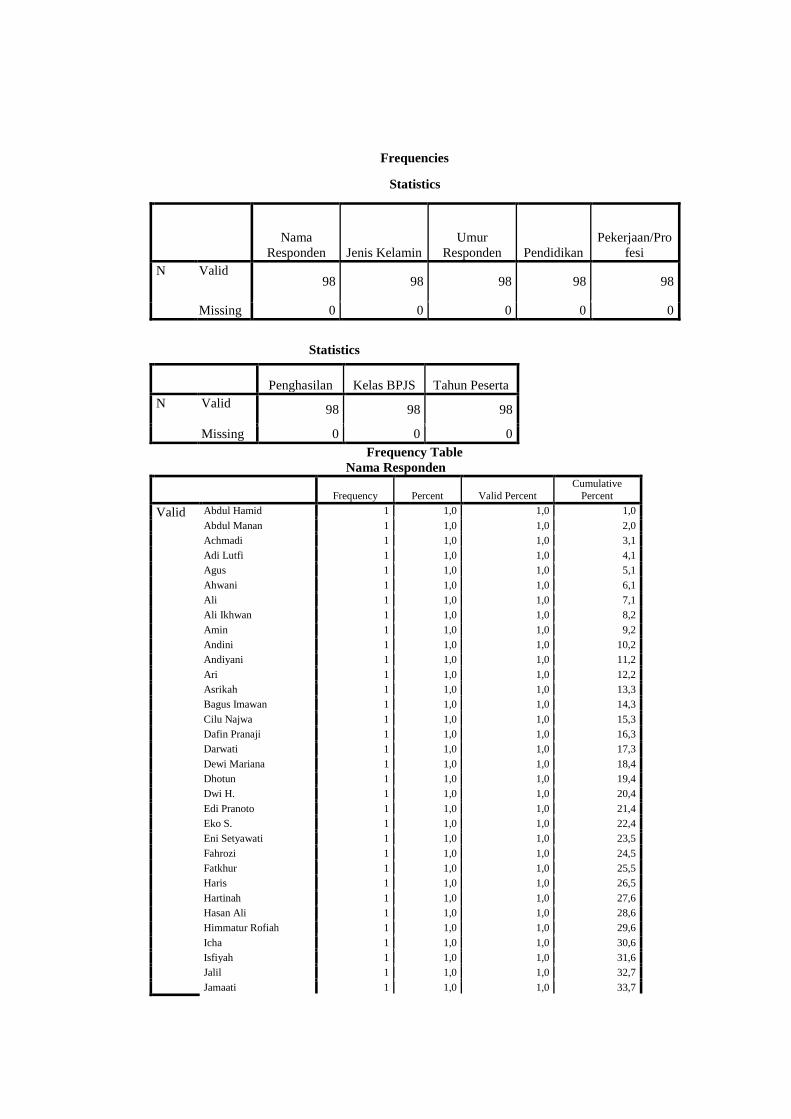
Frequencies
Statistics
Nama
Responden Jenis Kelamin
Umur
Responden Pendidikan
Pekerjaan/Pro
fesi
N Valid 98 98 98 98 98
Missing 0 0 0 0 0
Statistics
Penghasilan Kelas BPJS Tahun Peserta
N Valid 98 98 98
Missing 0 0 0
Frequency Table
Nama Responden
Frequency Percent Valid Percent
Cumulative
Percent
Valid Abdul Hamid 1 1,0 1,0 1,0
Abdul Manan 1 1,0 1,0 2,0
Achmadi 1 1,0 1,0 3,1
Adi Lutfi 1 1,0 1,0 4,1
Agus 1 1,0 1,0 5,1
Ahwani 1 1,0 1,0 6,1
Ali 1 1,0 1,0 7,1
Ali Ikhwan 1 1,0 1,0 8,2
Amin 1 1,0 1,0 9,2
Andini 1 1,0 1,0 10,2
Andiyani 1 1,0 1,0 11,2
Ari 1 1,0 1,0 12,2
Asrikah 1 1,0 1,0 13,3
Bagus Imawan 1 1,0 1,0 14,3
Cilu Najwa 1 1,0 1,0 15,3
Dafin Pranaji 1 1,0 1,0 16,3
Darwati 1 1,0 1,0 17,3
Dewi Mariana 1 1,0 1,0 18,4
Dhotun 1 1,0 1,0 19,4
Dwi H. 1 1,0 1,0 20,4
Edi Pranoto 1 1,0 1,0 21,4
Eko S. 1 1,0 1,0 22,4
Eni Setyawati 1 1,0 1,0 23,5
Fahrozi 1 1,0 1,0 24,5
Fatkhur 1 1,0 1,0 25,5
Haris 1 1,0 1,0 26,5
Hartinah 1 1,0 1,0 27,6
Hasan Ali 1 1,0 1,0 28,6
Himmatur Rofiah 1 1,0 1,0 29,6
Icha 1 1,0 1,0 30,6
Isfiyah 1 1,0 1,0 31,6
Jalil 1 1,0 1,0 32,7
Jamaati 1 1,0 1,0 33,7

Kadarwati 1 1,0 1,0 34,7
Khoirul Huda 1 1,0 1,0 35,7
Khoirunnizar 1 1,0 1,0 36,7
Khomsah 1 1,0 1,0 37,8
Ladiman 1 1,0 1,0 38,8
Lailatul 1 1,0 1,0 39,8
Lailatul Wuza 1 1,0 1,0 40,8
Leginah 1 1,0 1,0 41,8
Ludi F. 1 1,0 1,0 42,9
Luluk Izzatul H 1 1,0 1,0 43,9
M. Ali Ma'ruf 1 1,0 1,0 44,9
Magfiroh 1 1,0 1,0 45,9
Mariyam 1 1,0 1,0 46,9
Masud 1 1,0 1,0 48,0
Mifda Alfianita 1 1,0 1,0 49,0
Misbahul Munir 1 1,0 1,0 50,0
Moh Yazid 1 1,0 1,0 51,0
Muhamaad Wafi 1 1,0 1,0 52,0
Muhamaat Muchit 1 1,0 1,0 53,1
Mursiati 1 1,0 1,0 54,1
Musdinah 1 1,0 1,0 55,1
Muslikah 1 1,0 1,0 56,1
Nabila N. 1 1,0 1,0 57,1
Najib 1 1,0 1,0 58,2
Ngatini 1 1,0 1,0 59,2
Noor Aziz 1 1,0 1,0 60,2
Noor Sahar 1 1,0 1,0 61,2
Noor Salim 1 1,0 1,0 62,2
Novitasari 1 1,0 1,0 63,3
Nur Halimah 1 1,0 1,0 64,3
Nur Hidayati 1 1,0 1,0 65,3
Nur Kapet 1 1,0 1,0 66,3
Parsini 1 1,0 1,0 67,3
Pasmi 1 1,0 1,0 68,4
Priyanto 1 1,0 1,0 69,4
Puji Astuti 1 1,0 1,0 70,4
Puryadi 1 1,0 1,0 71,4
Retno 1 1,0 1,0 72,4
Romli 1 1,0 1,0 73,5
S. Ali Muhdi 1 1,0 1,0 74,5
Soleh 1 1,0 1,0 75,5
solekah 1 1,0 1,0 76,5
Sri Hartini 1 1,0 1,0 77,6
Sri Puji W. 1 1,0 1,0 78,6
Sri rejeki 1 1,0 1,0 79,6
Sri Sukarti 1 1,0 1,0 80,6
Sriyatun 1 1,0 1,0 81,6
Suci 1 1,0 1,0 82,7
Sudarmaji 1 1,0 1,0 83,7
Suhardi 1 1,0 1,0 84,7
Sulistinah 1 1,0 1,0 85,7
Suminah 1 1,0 1,0 86,7
Sutesno 1 1,0 1,0 87,8
Suwarjo 1 1,0 1,0 88,8
Syaikun 1 1,0 1,0 89,8
Tiono 1 1,0 1,0 90,8
Turnadzi 1 1,0 1,0 91,8

Ulfa Riyana 1 1,0 1,0 92,9
Ulya 1 1,0 1,0 93,9
Utamy 1 1,0 1,0 94,9
Victor 1 1,0 1,0 95,9
Widarti 1 1,0 1,0 96,9
Yani 1 1,0 1,0 98,0
Yoto 1 1,0 1,0 99,0
Yuliana 1 1,0 1,0 100,0
Total 98 100,0 100,0
Jenis Kelamin
Frequency Percent Valid Percent
Cumulative
Percent
Valid Laki-laki 49 50,0 50,0 50,0
Perempuan 49 50,0 50,0 100,0
Total 98 100,0 100,0
Umur Responden
Frequency Percent Valid Percent
Cumulative
Percent
Valid > 50 15 15,3 15,3 15,3
20 7 7,1 7,1 22,4
20-29 27 27,6 27,6 50,0
30-39 26 26,5 26,5 76,5
40-49 23 23,5 23,5 100,0
Total 98 100,0 100,0
Pendidikan
Frequency Percent Valid Percent
Cumulative
Percent
Valid Lainnya 5 5,1 5,1 5,1
S1 26 26,5 26,5 31,6
SD/MI 14 14,3 14,3 45,9
SMA/MA 39 39,8 39,8 85,7
SMP/MTS 14 14,3 14,3 100,0
Total 98 100,0 100,0
Pekerjaan/Profesi
Frequency Percent Valid Percent
Cumulative
Percent
Valid Lainnya 48 49,0 49,0 49,0
Pegawai Swasta 21 21,4 21,4 70,4
PNS 9 9,2 9,2 79,6
Wirausaha 20 20,4 20,4 100,0
Total 98 100,0 100,0
Penghasilan
Frequency Percent Valid Percent
Cumulative
Percent
Valid < 500.000 18 18,4 18,4 18,4
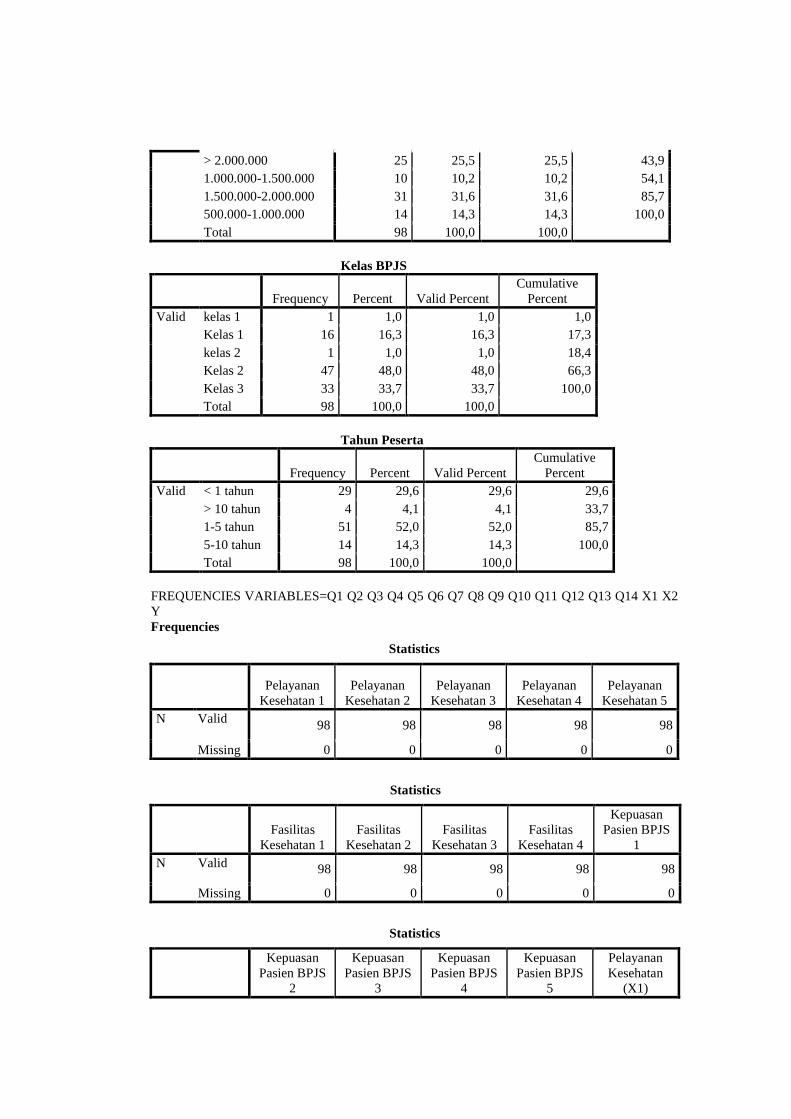
> 2.000.000 25 25,5 25,5 43,9
1.000.000-1.500.000 10 10,2 10,2 54,1
1.500.000-2.000.000 31 31,6 31,6 85,7
500.000-1.000.000 14 14,3 14,3 100,0
Total 98 100,0 100,0
Kelas BPJS
Frequency Percent Valid Percent
Cumulative
Percent
Valid kelas 1 1 1,0 1,0 1,0
Kelas 1 16 16,3 16,3 17,3
kelas 2 1 1,0 1,0 18,4
Kelas 2 47 48,0 48,0 66,3
Kelas 3 33 33,7 33,7 100,0
Total 98 100,0 100,0
Tahun Peserta
Frequency Percent Valid Percent
Cumulative
Percent
Valid < 1 tahun 29 29,6 29,6 29,6
> 10 tahun 4 4,1 4,1 33,7
1-5 tahun 51 52,0 52,0 85,7
5-10 tahun 14 14,3 14,3 100,0
Total 98 100,0 100,0
FREQUENCIES VARIABLES=Q1 Q2 Q3 Q4 Q5 Q6 Q7 Q8 Q9 Q10 Q11 Q12 Q13 Q14 X1 X2
Y
Frequencies
Statistics
Pelayanan
Kesehatan 1
Pelayanan
Kesehatan 2
Pelayanan
Kesehatan 3
Pelayanan
Kesehatan 4
Pelayanan
Kesehatan 5
N Valid 98 98 98 98 98
Missing 0 0 0 0 0
Statistics
Fasilitas
Kesehatan 1
Fasilitas
Kesehatan 2
Fasilitas
Kesehatan 3
Fasilitas
Kesehatan 4
Kepuasan
Pasien BPJS
1
N Valid 98 98 98 98 98
Missing 0 0 0 0 0
Statistics
Kepuasan
Pasien BPJS
2
Kepuasan
Pasien BPJS
3
Kepuasan
Pasien BPJS
4
Kepuasan
Pasien BPJS
5
Pelayanan
Kesehatan
(X1)

N Valid 98 98 98 98 98
Missing 0 0 0 0 0
Statistics
Fasilitas
Kesehatan (X2)
Kepuasan
Pasien BPJS
(Y)
N Valid 98 98
Missing 0 0
Frequency Table
Pelayanan Kesehatan 1
Frequency Percent Valid Percent
Cumulative
Percent
Valid 2 1 1,0 1,0 1,0
3 12 12,2 12,2 13,3
4 34 34,7 34,7 48,0
5 51 52,0 52,0 100,0
Total 98 100,0 100,0
Pelayanan Kesehatan 2
Frequency Percent Valid Percent
Cumulative
Percent
Valid 2 2 2,0 2,0 2,0
3 13 13,3 13,3 15,3
4 30 30,6 30,6 45,9
5 53 54,1 54,1 100,0
Total 98 100,0 100,0
Pelayanan Kesehatan 3
Frequency Percent Valid Percent
Cumulative
Percent
Valid 3 13 13,3 13,3 13,3
4 31 31,6 31,6 44,9
5 54 55,1 55,1 100,0
Total 98 100,0 100,0
Pelayanan Kesehatan 4
Frequency Percent Valid Percent
Cumulative
Percent
Valid 3 25 25,5 25,5 25,5
4 18 18,4 18,4 43,9
5 55 56,1 56,1 100,0
Total 98 100,0 100,0
Pelayanan Kesehatan 5
Frequency Percent Valid Percent
Cumulative
Percent
Valid 2 1 1,0 1,0 1,0
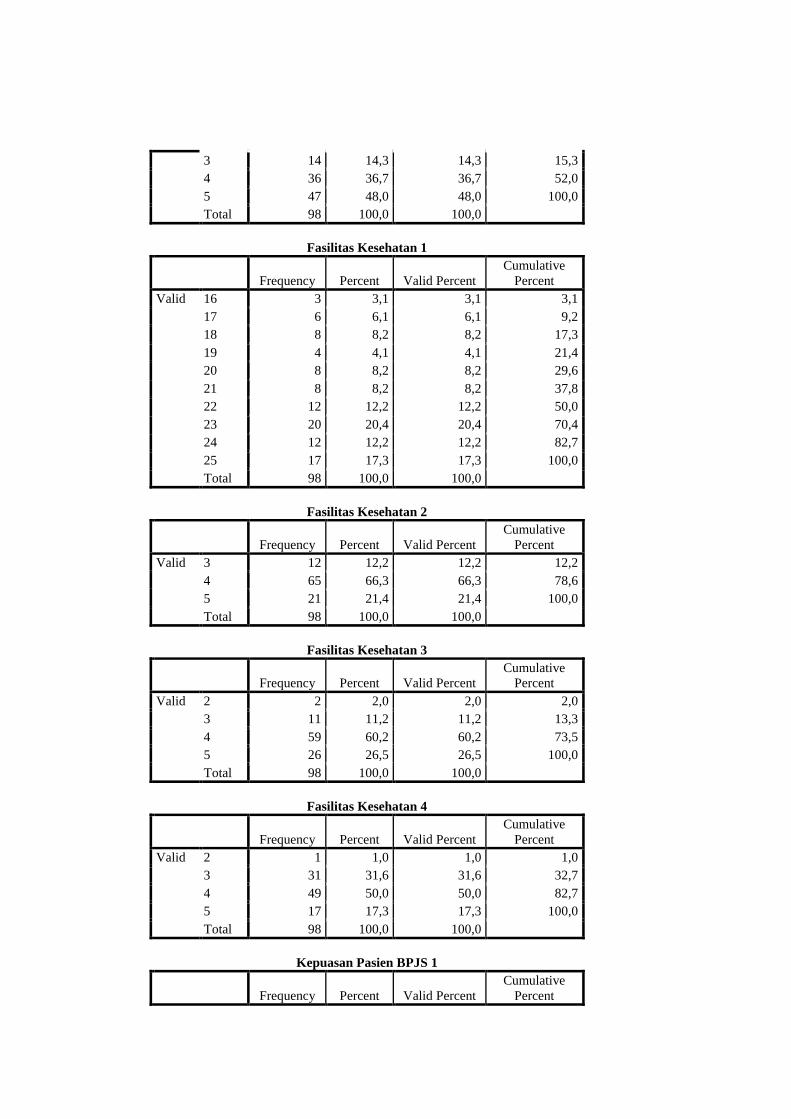
3 14 14,3 14,3 15,3
4 36 36,7 36,7 52,0
5 47 48,0 48,0 100,0
Total 98 100,0 100,0
Fasilitas Kesehatan 1
Frequency Percent Valid Percent
Cumulative
Percent
Valid 16 3 3,1 3,1 3,1
17 6 6,1 6,1 9,2
18 8 8,2 8,2 17,3
19 4 4,1 4,1 21,4
20 8 8,2 8,2 29,6
21 8 8,2 8,2 37,8
22 12 12,2 12,2 50,0
23 20 20,4 20,4 70,4
24 12 12,2 12,2 82,7
25 17 17,3 17,3 100,0
Total 98 100,0 100,0
Fasilitas Kesehatan 2
Frequency Percent Valid Percent
Cumulative
Percent
Valid 3 12 12,2 12,2 12,2
4 65 66,3 66,3 78,6
5 21 21,4 21,4 100,0
Total 98 100,0 100,0
Fasilitas Kesehatan 3
Frequency Percent Valid Percent
Cumulative
Percent
Valid 2 2 2,0 2,0 2,0
3 11 11,2 11,2 13,3
4 59 60,2 60,2 73,5
5 26 26,5 26,5 100,0
Total 98 100,0 100,0
Fasilitas Kesehatan 4
Frequency Percent Valid Percent
Cumulative
Percent
Valid 2 1 1,0 1,0 1,0
3 31 31,6 31,6 32,7
4 49 50,0 50,0 82,7
5 17 17,3 17,3 100,0
Total 98 100,0 100,0
Kepuasan Pasien BPJS 1
Frequency Percent Valid Percent
Cumulative
Percent

Valid 3 32 32,7 32,7 32,7
4 47 48,0 48,0 80,6
5 19 19,4 19,4 100,0
Total 98 100,0 100,0
Kepuasan Pasien BPJS 2
Frequency Percent Valid Percent
Cumulative
Percent
Valid 13 5 5,1 5,1 5,1
14 15 15,3 15,3 20,4
15 13 13,3 13,3 33,7
16 32 32,7 32,7 66,3
17 21 21,4 21,4 87,8
18 8 8,2 8,2 95,9
19 4 4,1 4,1 100,0
Total 98 100,0 100,0
Kepuasan Pasien BPJS 3
Frequency Percent Valid Percent
Cumulative
Percent
Valid 2 1 1,0 1,0 1,0
3 17 17,3 17,3 18,4
4 53 54,1 54,1 72,4
5 27 27,6 27,6 100,0
Total 98 100,0 100,0
Kepuasan Pasien BPJS 4
Frequency Percent Valid Percent
Cumulative
Percent
Valid 3 16 16,3 16,3 16,3
4 60 61,2 61,2 77,6
5 22 22,4 22,4 100,0
Total 98 100,0 100,0
Kepuasan Pasien BPJS 5
Frequency Percent Valid Percent
Cumulative
Percent
Valid 3 13 13,3 13,3 13,3
4 69 70,4 70,4 83,7
5 16 16,3 16,3 100,0
Total 98 100,0 100,0
Pelayanan Kesehatan (X1)
Frequency Percent Valid Percent
Cumulative
Percent
Valid 2 2 2,0 2,0 2,0
3 21 21,4 21,4 23,5
4 48 49,0 49,0 72,4
5 27 27,6 27,6 100,0

Pelayanan Kesehatan (X1)
Frequency Percent Valid Percent
Cumulative
Percent
Valid 2 2 2,0 2,0 2,0
3 21 21,4 21,4 23,5
4 48 49,0 49,0 72,4
5 27 27,6 27,6 100,0
Total 98 100,0 100,0
Fasilitas Kesehatan (X2)
Frequency Percent Valid Percent
Cumulative
Percent
Valid 3 19 19,4 19,4 19,4
4 54 55,1 55,1 74,5
5 25 25,5 25,5 100,0
Total 98 100,0 100,0
Kepuasan Pasien BPJS (Y)
Frequency Percent Valid Percent
Cumulative
Percent
Valid 15 2 2,0 2,0 2,0
16 1 1,0 1,0 3,1
17 8 8,2 8,2 11,2
18 10 10,2 10,2 21,4
19 17 17,3 17,3 38,8
20 18 18,4 18,4 57,1
21 11 11,2 11,2 68,4
22 17 17,3 17,3 85,7
23 6 6,1 6,1 91,8
24 3 3,1 3,1 94,9
25 5 5,1 5,1 100,0
Total 98 100,0 100,0
COMPUTE X1= Q1 + Q2 + Q3 + Q4 + Q5. VARIABLE LABELS X1 'Pelayanan Kesehatan
(X1)'.
EXECUTE. COMPUTE X2= Q6 + Q7 + Q8 + Q9. VARIABLE LABELS X2 'Fasilitas Kesehatan
(X2)'.
EXECUTE. COMPUTE Y= Q10 + Q11 + Q12 + Q13 + Q14. VARIABLE LABELS Y 'Kepuasan
Pasien BPJS (Y)'.
EXECUTE.CORRELATIONS /VARIABLES=Q1 Q2 Q3 Q4 Q5 X1
Correlations
Pelayanan
Kesehatan 1
Pelayanan
Kesehatan 2
Pelayanan
Kesehatan 3
Pelayanan Kesehatan 1 Pearson Correlation 1 ,553**
,516**
Sig. (2-tailed) ,000 ,000
N 98 98 98
Pelayanan Kesehatan 2 Pearson Correlation ,553**
1 ,290**
Sig. (2-tailed) ,000 ,004
N 98 98 98

Pelayanan Kesehatan 3 Pearson Correlation ,516**
,290**
1
Sig. (2-tailed) ,000 ,004
N 98 98 98
Pelayanan Kesehatan 4 Pearson Correlation ,337**
,594**
,176
Sig. (2-tailed) ,001 ,000 ,083
N 98 98 98
Pelayanan Kesehatan 5 Pearson Correlation ,264**
,097 ,229*
Sig. (2-tailed) ,009 ,343 ,023
N 98 98 98
Pelayanan Kesehatan (X1) Pearson Correlation ,769**
,752**
,624**
Sig. (2-tailed) ,000 ,000 ,000
N 98 98 98
**. Correlation is significant at the 0.01 level (2-tailed).
*. Correlation is significant at the 0.05 level (2-tailed).
Correlations
Pelayanan
Kesehatan 4
Pelayanan
Kesehatan 5
Pelayanan
Kesehatan (X1)
Pelayanan Kesehatan 1 Pearson Correlation ,337**
,264**
,769**
Sig. (2-tailed) ,001 ,009 ,000
N 98 98 98
Pelayanan Kesehatan 2 Pearson Correlation ,594**
,097 ,752**
Sig. (2-tailed) ,000 ,343 ,000
N 98 98 98
Pelayanan Kesehatan 3 Pearson Correlation ,176 ,229* ,624
**
Sig. (2-tailed) ,083 ,023 ,000
N 98 98 98
Pelayanan Kesehatan 4 Pearson Correlation 1 ,296**
,727**
Sig. (2-tailed) ,003 ,000
N 98 98 98
Pelayanan Kesehatan 5 Pearson Correlation ,296**
1 ,546**
Sig. (2-tailed) ,003 ,000
N 98 98 98
Pelayanan Kesehatan (X1) Pearson Correlation ,727**
,546**
1
Sig. (2-tailed) ,000 ,000
N 98 98 98
**. Correlation is significant at the 0.01 level (2-tailed).
*. Correlation is significant at the 0.05 level (2-tailed).
CORRELATIONS: VARIABLES= Q6 Q7 Q8 Q9 X2
Correlations
Fasilitas
Kesehatan 1
Fasilitas
Kesehatan 2
Fasilitas
Kesehatan 3
Fasilitas Kesehatan 1 Pearson Correlation 1 ,088 ,002
Sig. (2-tailed) ,392 ,984
N 98 98 98
Fasilitas Kesehatan 2 Pearson Correlation ,088 1 ,240*
Sig. (2-tailed) ,392 ,018
N 98 98 98
Fasilitas Kesehatan 3 Pearson Correlation ,002 ,240* 1
Sig. (2-tailed) ,984 ,018
N 98 98 98
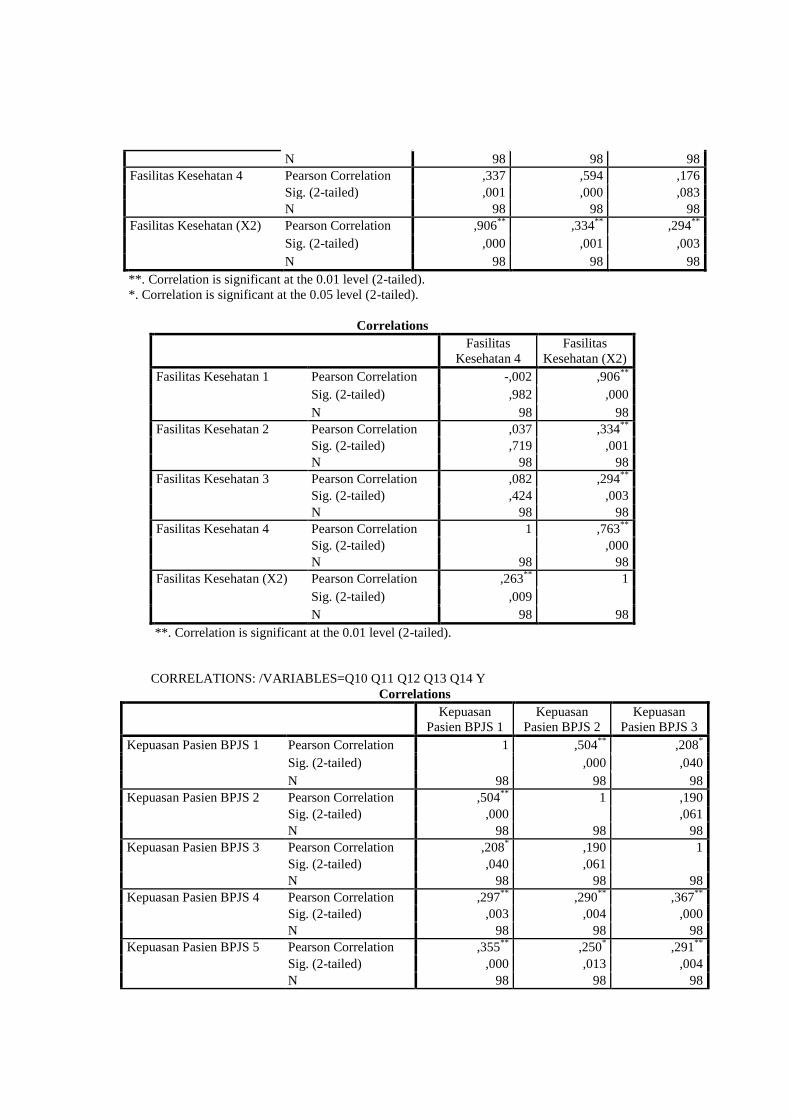
Fasilitas Kesehatan 4 Pearson Correlation ,337 ,594 ,176
Sig. (2-tailed) ,001 ,000 ,083
N 98 98 98
Fasilitas Kesehatan (X2) Pearson Correlation ,906**
,334**
,294**
Sig. (2-tailed) ,000 ,001 ,003
N 98 98 98
**. Correlation is significant at the 0.01 level (2-tailed).
*. Correlation is significant at the 0.05 level (2-tailed).
Correlations
Fasilitas
Kesehatan 4
Fasilitas
Kesehatan (X2)
Fasilitas Kesehatan 1 Pearson Correlation -,002 ,906**
Sig. (2-tailed) ,982 ,000
N 98 98
Fasilitas Kesehatan 2 Pearson Correlation ,037 ,334**
Sig. (2-tailed) ,719 ,001
N 98 98
Fasilitas Kesehatan 3 Pearson Correlation ,082 ,294**
Sig. (2-tailed) ,424 ,003
N 98 98
Fasilitas Kesehatan 4 Pearson Correlation 1 ,763**
Sig. (2-tailed) ,000
N 98 98
Fasilitas Kesehatan (X2) Pearson Correlation ,263**
1
Sig. (2-tailed) ,009
N 98 98
**. Correlation is significant at the 0.01 level (2-tailed).
CORRELATIONS: /VARIABLES=Q10 Q11 Q12 Q13 Q14 Y
Correlations
Kepuasan
Pasien BPJS 1
Kepuasan
Pasien BPJS 2
Kepuasan
Pasien BPJS 3
Kepuasan Pasien BPJS 1 Pearson Correlation 1 ,504**
,208*
Sig. (2-tailed) ,000 ,040
N 98 98 98
Kepuasan Pasien BPJS 2 Pearson Correlation ,504**
1 ,190
Sig. (2-tailed) ,000 ,061
N 98 98 98
Kepuasan Pasien BPJS 3 Pearson Correlation ,208* ,190 1
Sig. (2-tailed) ,040 ,061
N 98 98 98
Kepuasan Pasien BPJS 4 Pearson Correlation ,297**
,290**
,367**
Sig. (2-tailed) ,003 ,004 ,000
N 98 98 98
Kepuasan Pasien BPJS 5 Pearson Correlation ,355**
,250* ,291
**
Sig. (2-tailed) ,000 ,013 ,004
N 98 98 98

Kepuasan Pasien BPJS (Y) Pearson Correlation ,708**
,814**
,542**
Sig. (2-tailed) ,000 ,000 ,000
N 98 98 98
**. Correlation is significant at the 0.01 level (2-tailed).
*. Correlation is significant at the 0.05 level (2-tailed).
Correlations
Kepuasan
Pasien BPJS 4
Kepuasan
Pasien BPJS 5
Kepuasan
Pasien BPJS
(Y)
Kepuasan Pasien BPJS 1 Pearson Correlation ,297**
,355**
,708**
Sig. (2-tailed) ,003 ,000 ,000
N 98 98 98
Kepuasan Pasien BPJS 2 Pearson Correlation ,290**
,250* ,814
**
Sig. (2-tailed) ,004 ,013 ,000
N 98 98 98
Kepuasan Pasien BPJS 3 Pearson Correlation ,367**
,291**
,542**
Sig. (2-tailed) ,000 ,004 ,000
N 98 98 98
Kepuasan Pasien BPJS 4 Pearson Correlation 1 ,449**
,632**
Sig. (2-tailed) ,000 ,000
N 98 98 98
Kepuasan Pasien BPJS 5 Pearson Correlation ,449**
1 ,591**
Sig. (2-tailed) ,000 ,000
N 98 98 98
Kepuasan Pasien BPJS (Y) Pearson Correlation ,632**
,591**
1
Sig. (2-tailed) ,000 ,000
N 98 98 98
**. Correlation is significant at the 0.01 level (2-tailed).
*. Correlation is significant at the 0.05 level (2-tailed).
RELIABILITY: VARIABLES=Q1 Q2 Q3 Q4 Q5
Reliability
Case Processing Summary
N %
Cases Valid 98 100,0
Excludeda 0 ,0
Total 98 100,0
a. Listwise deletion based on all variables in the
procedure.
Reliability Statistics
Cronbach's
Alpha N of Items
,716 5
Item Statistics
Mean Std. Deviation N
Pelayanan Kesehatan 1 4,3776 ,73940 98
Pelayanan Kesehatan 2 4,3673 ,79155 98
Pelayanan Kesehatan 3 4,4184 ,71686 98

Pelayanan Kesehatan 4 4,3061 ,85444 98
Pelayanan Kesehatan 5 4,3163 ,75433 98
Item-Total Statistics
Scale Mean if
Item Deleted
Scale Variance
if Item Deleted
Corrected Item-
Total
Correlation
Cronbach's
Alpha if Item
Deleted
Pelayanan Kesehatan 1 17,4082 4,533 ,608 ,616
Pelayanan Kesehatan 2 17,4184 4,473 ,566 ,630
Pelayanan Kesehatan 3 17,3673 5,142 ,412 ,692
Pelayanan Kesehatan 4 17,4796 4,438 ,508 ,655
Pelayanan Kesehatan 5 17,4694 5,386 ,297 ,735
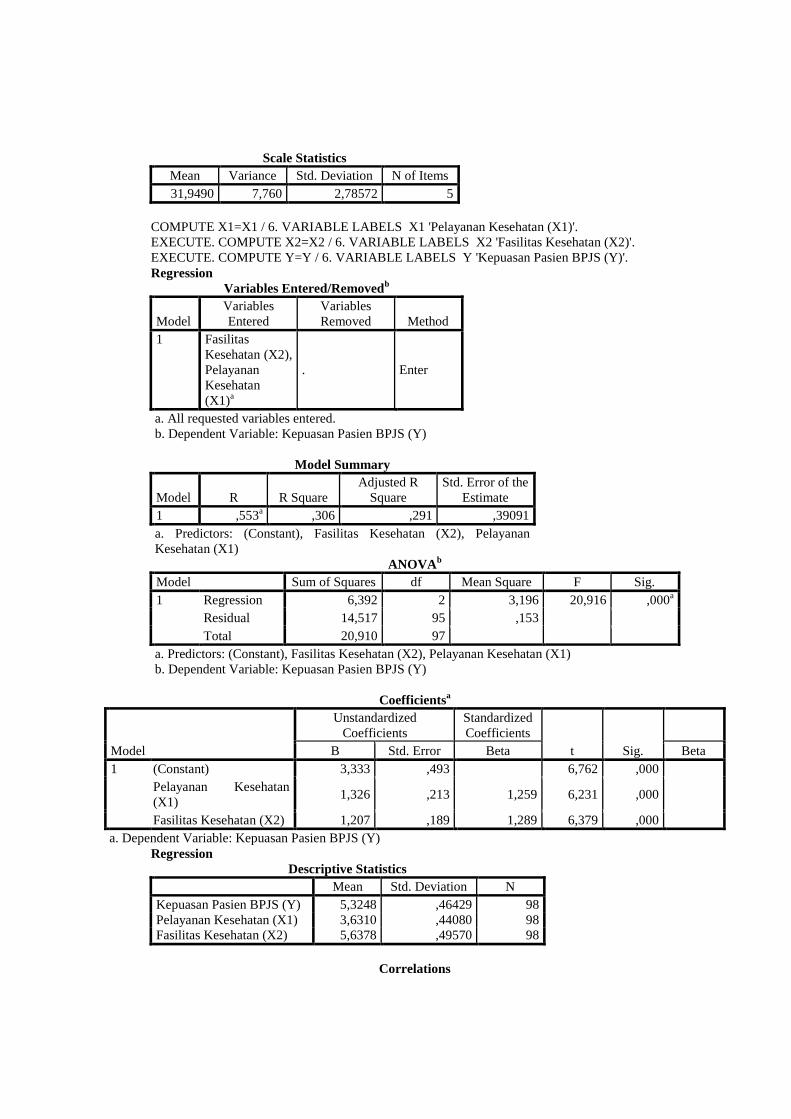
Scale Statistics
Mean Variance Std. Deviation N of Items
21,7857 6,995 2,64478 5
RELIABILITY: VARIABLES=Q6 Q7 Q8 Q9
Reliability
Scale: ALL VARIABLES
Case Processing Summary
N %
Cases Valid 98 100,0
Excludeda 0 ,0
Total 98 100,0
a. Listwise deletion based on all variables in the
procedure.
Reliability Statistics
Cronbach's
Alpha N of Items
,799 4
Item Statistics
Mean Std. Deviation N
Fasilitas Kesehatan 1 21,7857 2,64478 98
Fasilitas Kesehatan 2 4,0918 ,57592 98
Fasilitas Kesehatan 3 4,1122 ,67171 98
Fasilitas Kesehatan 4 3,8367 ,71355 98
Item-Total Statistics
Scale Mean if
Item Deleted
Scale Variance
if Item Deleted
Corrected Item-
Total
Correlation
Cronbach's
Alpha if Item
Deleted
Fasilitas Kesehatan 1 12,0408 1,586 ,040 ,278
Fasilitas Kesehatan 2 29,7347 8,032 ,148 ,014
Fasilitas Kesehatan 3 29,7143 8,124 ,071 ,053

Item-Total Statistics
Scale Mean if
Item Deleted
Scale Variance
if Item Deleted
Corrected Item-
Total
Correlation
Cronbach's
Alpha if Item
Deleted
Fasilitas Kesehatan 1 12,0408 1,586 ,040 ,278
Fasilitas Kesehatan 2 29,7347 8,032 ,148 ,014
Fasilitas Kesehatan 3 29,7143 8,124 ,071 ,053
Fasilitas Kesehatan 4 29,9898 8,237 ,024 ,084
Scale Statistics
Mean Variance Std. Deviation N of Items
33,8265 8,846 2,97420 4
RELIABILITY: VARIABLES=Q10 Q11 Q12 Q13 Q14
Reliability
Scale: ALL VARIABLES
Case Processing Summary
N %
Cases Valid 98 100,0
Excludeda 0 ,0
Total 98 100,0
a. Listwise deletion based on all variables in the
procedure.
Reliability Statistics
Cronbach's
Alpha N of Items
,637 5
Item Statistics
Mean Std. Deviation N
Kepuasan Pasien BPJS 1 3,8673 ,71274 98
Kepuasan Pasien BPJS 2 15,9082 1,45791 98
Kepuasan Pasien BPJS 3 4,0816 ,69865 98
Kepuasan Pasien BPJS 4 4,0612 ,62287 98
Kepuasan Pasien BPJS 5 4,0306 ,54591 98
Item-Total Statistics
Scale Mean if
Item Deleted
Scale Variance
if Item Deleted
Corrected Item-
Total
Correlation
Cronbach's
Alpha if Item
Deleted
Kepuasan Pasien BPJS 1 28,0816 5,457 ,539 ,527
Kepuasan Pasien BPJS 2 16,0408 3,277 ,447 ,649
Kepuasan Pasien BPJS 3 27,8673 6,137 ,328 ,612
Kepuasan Pasien BPJS 4 27,8878 5,956 ,466 ,568
Kepuasan Pasien BPJS 5 27,9184 6,261 ,440 ,586
Scale Statistics
Mean Variance Std. Deviation N of Items
31,9490 7,760 2,78572 5
COMPUTE X1=X1 / 6. VARIABLE LABELS X1 'Pelayanan Kesehatan (X1)'.
EXECUTE. COMPUTE X2=X2 / 6. VARIABLE LABELS X2 'Fasilitas Kesehatan (X2)'.
EXECUTE. COMPUTE Y=Y / 6. VARIABLE LABELS Y 'Kepuasan Pasien BPJS (Y)'.
Regression
Variables Entered/Removedb
Model
Variables
Entered
Variables
Removed Method
1 Fasilitas
Kesehatan (X2),
Pelayanan
Kesehatan
(X1)a
. Enter
a. All requested variables entered.
b. Dependent Variable: Kepuasan Pasien BPJS (Y)
Model Summary
Model R R Square
Adjusted R
Square
Std. Error of the
Estimate
1 ,553a ,306 ,291 ,39091
a. Predictors: (Constant), Fasilitas Kesehatan (X2), Pelayanan
Kesehatan (X1)
ANOVAb
Model Sum of Squares df Mean Square F Sig.
1 Regression 6,392 2 3,196 20,916 ,000a
Residual 14,517 95 ,153
Total 20,910 97
a. Predictors: (Constant), Fasilitas Kesehatan (X2), Pelayanan Kesehatan (X1)
b. Dependent Variable: Kepuasan Pasien BPJS (Y)
Coefficientsa
Model
Unstandardized
Coefficients
Standardized
Coefficients
t Sig.
B Std. Error Beta Beta
1 (Constant) 3,333 ,493 6,762 ,000
Pelayanan Kesehatan
(X1) 1,326 ,213 1,259 6,231 ,000
Fasilitas Kesehatan (X2) 1,207 ,189 1,289 6,379 ,000
a. Dependent Variable: Kepuasan Pasien BPJS (Y)
Regression
Descriptive Statistics
Mean Std. Deviation N
Kepuasan Pasien BPJS (Y) 5,3248 ,46429 98
Pelayanan Kesehatan (X1) 3,6310 ,44080 98
Fasilitas Kesehatan (X2) 5,6378 ,49570 98
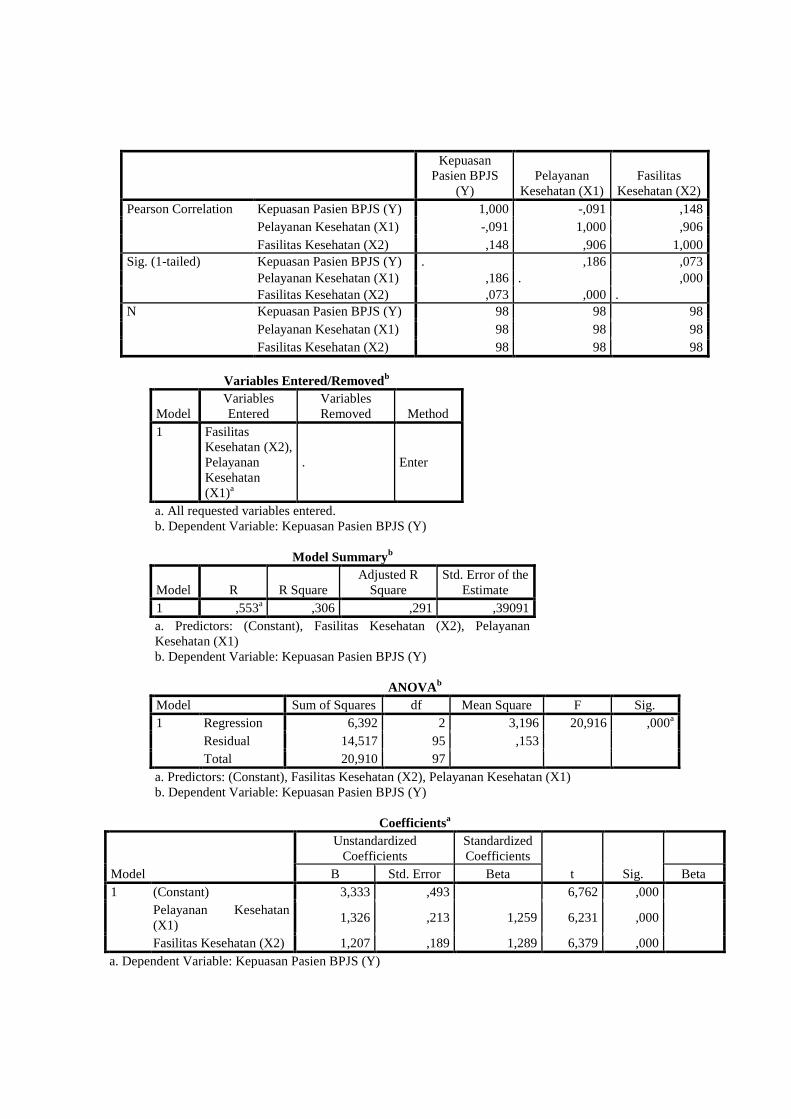
Correlations
Kepuasan
Pasien BPJS
(Y)
Pelayanan
Kesehatan (X1)
Fasilitas
Kesehatan (X2)
Pearson Correlation Kepuasan Pasien BPJS (Y) 1,000 -,091 ,148
Pelayanan Kesehatan (X1) -,091 1,000 ,906
Fasilitas Kesehatan (X2) ,148 ,906 1,000
Sig. (1-tailed) Kepuasan Pasien BPJS (Y) . ,186 ,073
Pelayanan Kesehatan (X1) ,186 . ,000
Fasilitas Kesehatan (X2) ,073 ,000 .
N Kepuasan Pasien BPJS (Y) 98 98 98
Pelayanan Kesehatan (X1) 98 98 98
Fasilitas Kesehatan (X2) 98 98 98
Variables Entered/Removedb
Model
Variables
Entered
Variables
Removed Method
1 Fasilitas
Kesehatan (X2),
Pelayanan
Kesehatan
(X1)a
. Enter
a. All requested variables entered.
b. Dependent Variable: Kepuasan Pasien BPJS (Y)
Model Summaryb
Model R R Square
Adjusted R
Square
Std. Error of the
Estimate
1 ,553a ,306 ,291 ,39091
a. Predictors: (Constant), Fasilitas Kesehatan (X2), Pelayanan
Kesehatan (X1)
b. Dependent Variable: Kepuasan Pasien BPJS (Y)
ANOVAb
Model Sum of Squares df Mean Square F Sig.
1 Regression 6,392 2 3,196 20,916 ,000a
Residual 14,517 95 ,153
Total 20,910 97
a. Predictors: (Constant), Fasilitas Kesehatan (X2), Pelayanan Kesehatan (X1)
b. Dependent Variable: Kepuasan Pasien BPJS (Y)
Coefficientsa
Model
Unstandardized
Coefficients
Standardized
Coefficients
t Sig.
B Std. Error Beta Beta
1 (Constant) 3,333 ,493 6,762 ,000
Pelayanan Kesehatan
(X1) 1,326 ,213 1,259 6,231 ,000
Fasilitas Kesehatan (X2) 1,207 ,189 1,289 6,379 ,000
a. Dependent Variable: Kepuasan Pasien BPJS (Y)

Coefficientsa
Model
Collinearity Statistics
Tolerance VIF Tolerance VIF
1 (Constant)
Pelayanan Kesehatan (X1) ,179 5,587
Fasilitas Kesehatan (X2) ,179 5,587
a. Dependent Variable: Kepuasan Pasien BPJS (Y)
Collinearity Diagnosticsa
Model
Dimen
sion Eigenvalue Condition Index
Variance Proportions
(Constant)
Pelayanan
Kesehatan (X1)
Fasilitas
Kesehatan (X2)
1 1 2,992 1,000 ,00 ,00 ,00
2 ,007 19,989 ,52 ,13 ,00
3 ,001 58,557 ,48 ,87 ,99
a. Dependent Variable: Kepuasan Pasien BPJS (Y)
Residuals Statisticsa
Minimum Maximum Mean Std. Deviation N
Predicted Value 4,6493 5,8962 5,3248 ,25671 98
Std. Predicted Value -2,631 2,226 ,000 1,000 98
Standard Error of Predicted
Value ,040 ,116 ,066 ,018 98
Adjusted Predicted Value 4,5994 5,8886 5,3241 ,25814 98
Residual -,89156 ,91836 ,00000 ,38686 98
Std. Residual -2,281 2,349 ,000 ,990 98
Stud. Residual -2,317 2,441 ,001 1,007 98
Deleted Residual -,92040 ,99151 ,00071 ,40093 98
Stud. Deleted Residual -2,373 2,508 ,002 1,016 98
Mahal. Distance ,008 7,553 1,980 1,692 98
Cook's Distance ,000 ,158 ,012 ,021 98
Centered Leverage Value ,000 ,078 ,020 ,017 98
a. Dependent Variable: Kepuasan Pasien BPJS (Y)
Charts


DAFTAR RIWAYAT HIDUP
DATA PRIBADI:
Nama Lengkap : Tri Utami
Tempat, Tanggal Lahir : Pati, 23 April 1994
Jenis Kelamin : Perempuan
Agama : Islam
Alamat : Ds. Jatimulyo, Rt 002/Rw 004, Kec.
Wedarijaksa, Kab. Pati, Prov. Jawa
Tengah
Email : [email protected]
PENDIDIKAN FORMAL
a. TK Tunas Bangsa, Pati, Lulus Tahun 2000
b. SD Negeri 01, Pati, Lulus Tahun 2006
c. MTS Silahul Ulum, Pati, Lulus Tahun 2009
d. MA Silahul Ulum, Pati, Lulus Tahun 2012
e. Universitas Islam Negeri Walisongo Semarang, Jawa Tengah,
Lulus Tahun 2016
Semarang, 04 April 2016
Tri Utami
NIM. 122411017