No Pernyataan STS TS N S SS Kualitas Layanan (X1repository.wima.ac.id/3920/7/LAMPIRAN.pdf · No...
37
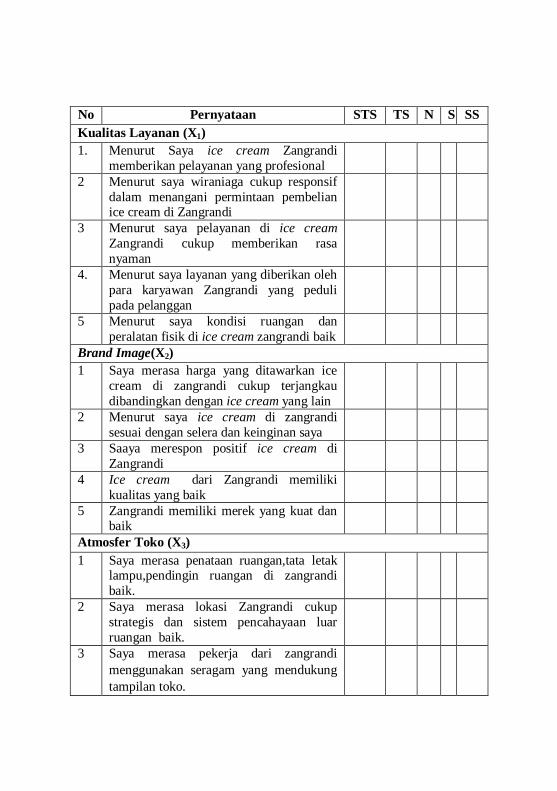
No Pernyataan STS TS N S SS Kualitas Layanan (X 1 ) 1. Menurut Saya ice cream Zangrandi memberikan pelayanan yang profesional 2 Menurut saya wiraniaga cukup responsif dalam menangani permintaan pembelian ice cream di Zangrandi 3 Menurut saya pelayanan di ice cream Zangrandi cukup memberikan rasa nyaman 4. Menurut saya layanan yang diberikan oleh para karyawan Zangrandi yang peduli pada pelanggan 5 Menurut saya kondisi ruangan dan peralatan fisik di ice cream zangrandi baik Brand Image(X 2 ) 1 Saya merasa harga yang ditawarkan ice cream di zangrandi cukup terjangkau dibandingkan dengan ice cream yang lain 2 Menurut saya ice cream di zangrandi sesuai dengan selera dan keinginan saya 3 Saaya merespon positif ice cream di Zangrandi 4 Ice cream dari Zangrandi memiliki kualitas yang baik 5 Zangrandi memiliki merek yang kuat dan baik Atmosfer Toko (X 3 ) 1 Saya merasa penataan ruangan,tata letak lampu,pendingin ruangan di zangrandi baik. 2 Saya merasa lokasi Zangrandi cukup strategis dan sistem pencahayaan luar ruangan baik. 3 Saya merasa pekerja dari zangrandi menggunakan seragam yang mendukung tampilan toko.
Transcript of No Pernyataan STS TS N S SS Kualitas Layanan (X1repository.wima.ac.id/3920/7/LAMPIRAN.pdf · No...
No Pernyataan STS TS N S SS
Kualitas Layanan (X1)
1. Menurut Saya ice cream Zangrandi
memberikan pelayanan yang profesional
2 Menurut saya wiraniaga cukup responsif
dalam menangani permintaan pembelian ice cream di Zangrandi
3 Menurut saya pelayanan di ice cream
Zangrandi cukup memberikan rasa
nyaman
4. Menurut saya layanan yang diberikan oleh
para karyawan Zangrandi yang peduli
pada pelanggan
5 Menurut saya kondisi ruangan dan
peralatan fisik di ice cream zangrandi baik
Brand Image(X2)
1 Saya merasa harga yang ditawarkan ice
cream di zangrandi cukup terjangkau
dibandingkan dengan ice cream yang lain
2 Menurut saya ice cream di zangrandi
sesuai dengan selera dan keinginan saya
3 Saaya merespon positif ice cream di
Zangrandi
4 Ice cream dari Zangrandi memiliki
kualitas yang baik
5 Zangrandi memiliki merek yang kuat dan baik
Atmosfer Toko (X3)
1 Saya merasa penataan ruangan,tata letak lampu,pendingin ruangan di zangrandi
baik.
2 Saya merasa lokasi Zangrandi cukup
strategis dan sistem pencahayaan luar
ruangan baik.
3 Saya merasa pekerja dari zangrandi
menggunakan seragam yang mendukung
tampilan toko.

4 Saya merasa poster dan gambar-gambar
yang ditampilkan menyediakan informasi
yang jelas.
Kepuasan Konsumen ( Y1)
1 Harga makanan dan minuman yang
ditawarkan cafe Zangrandi cukup
terjangkau
2 Penataan makanan dan minuman yang
disajikan cafe Zangrandi cukup baik
3 Rasa makanan dan minuman yang
dihidangkan cafe Zangrandi memuaskan
4 Karyawan cafe Zangrandi selalu melayani
dengan baik
5 Pelayanan karyawan cafe Zangrandi
selalu sesuai dengan harapan
6 Pelayanan yang diberikan karyawan cafe
Zangrandi selalu memuaskan hati
7 Karyawan cafe Zangrandi sangat
bersahabat dengan para pelanggannya
Loyalitas Konsumen (Y2)
1 Saya akan mengatakan hal-hal positif
kepada orang lain bahwa ice cream di Zangrandi memiliki kualitas yang baik
2 Saya akan merekomendasikan ice cream
di Zangrandi kepada orang lain
3 Saya akan melakukan pembelian ulang ice
cream di cafe Zangrandi
4 Saya menolak untuk melakukan
pembelian ice cream pada produk
lainnya.
5 Saya terbiasa untuk mengkonsumsi ice
cream di Zangrandi
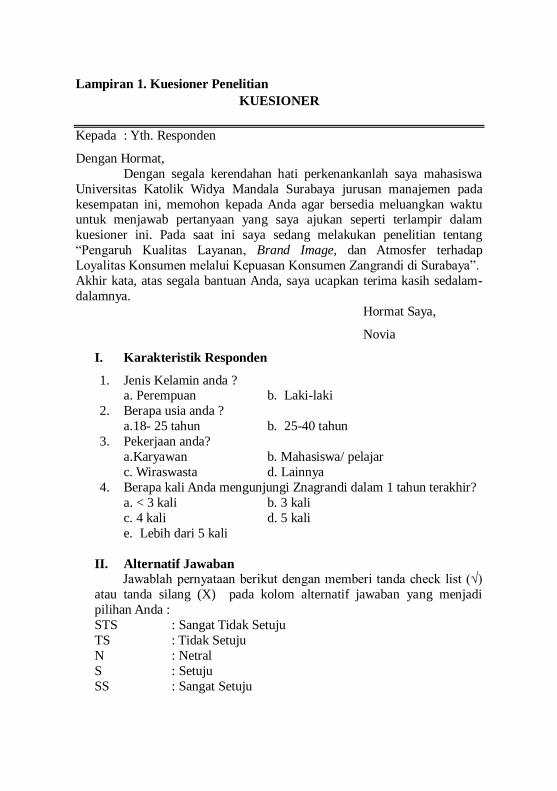
Lampiran 1. Kuesioner Penelitian
KUESIONER
Kepada : Yth. Responden
Dengan Hormat,
Dengan segala kerendahan hati perkenankanlah saya mahasiswa
Universitas Katolik Widya Mandala Surabaya jurusan manajemen pada
kesempatan ini, memohon kepada Anda agar bersedia meluangkan waktu untuk menjawab pertanyaan yang saya ajukan seperti terlampir dalam
kuesioner ini. Pada saat ini saya sedang melakukan penelitian tentang
“Pengaruh Kualitas Layanan, Brand Image, dan Atmosfer terhadap
Loyalitas Konsumen melalui Kepuasan Konsumen Zangrandi di Surabaya”.
Akhir kata, atas segala bantuan Anda, saya ucapkan terima kasih sedalam-
dalamnya.
Hormat Saya,
Novia
I. Karakteristik Responden
1. Jenis Kelamin anda ? a. Perempuan b. Laki-laki
2. Berapa usia anda ?
a.18- 25 tahun b. 25-40 tahun
3. Pekerjaan anda?
a.Karyawan b. Mahasiswa/ pelajar
c. Wiraswasta d. Lainnya
4. Berapa kali Anda mengunjungi Znagrandi dalam 1 tahun terakhir?
a. < 3 kali b. 3 kali
c. 4 kali d. 5 kali
e. Lebih dari 5 kali
II. Alternatif Jawaban
Jawablah pernyataan berikut dengan memberi tanda check list (√)
atau tanda silang (X) pada kolom alternatif jawaban yang menjadi
pilihan Anda :
STS : Sangat Tidak Setuju
TS : Tidak Setuju
N : Netral
S : Setuju
SS : Sangat Setuju
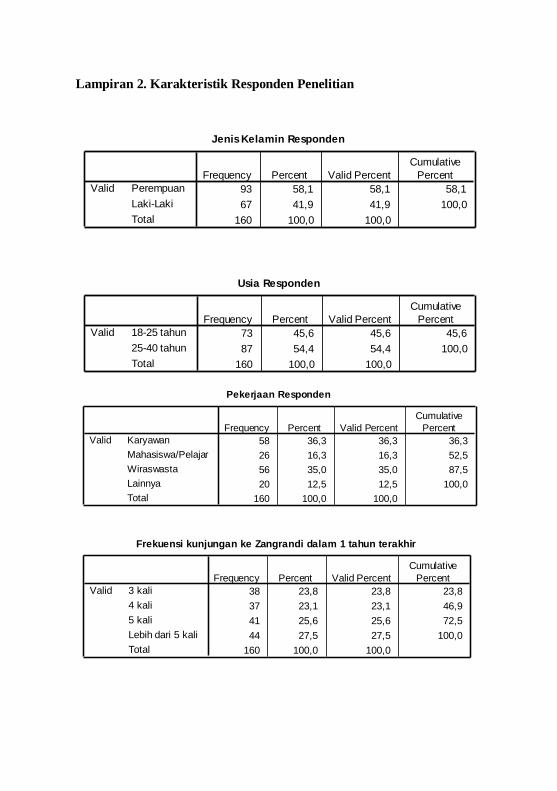
Lampiran 2. Karakteristik Responden Penelitian
Jenis Kelamin Responden
93 58,1 58,1 58,1
67 41,9 41,9 100,0
160 100,0 100,0
Perempuan
Laki-Laki
Total
Valid
Frequency Percent Valid Percent
Cumulative
Percent
Usia Responden
73 45,6 45,6 45,6
87 54,4 54,4 100,0
160 100,0 100,0
18-25 tahun
25-40 tahun
Total
Valid
Frequency Percent Valid Percent
Cumulative
Percent
Pekerjaan Responden
58 36,3 36,3 36,3
26 16,3 16,3 52,5
56 35,0 35,0 87,5
20 12,5 12,5 100,0
160 100,0 100,0
Karyawan
Mahasiswa/Pelajar
Wiraswasta
Lainnya
Total
Valid
Frequency Percent Valid Percent
Cumulative
Percent
Frekuensi kunjungan ke Zangrandi dalam 1 tahun terakhir
38 23,8 23,8 23,8
37 23,1 23,1 46,9
41 25,6 25,6 72,5
44 27,5 27,5 100,0
160 100,0 100,0
3 kali
4 kali
5 kali
Lebih dari 5 kali
Total
Valid
Frequency Percent Valid Percent
Cumulative
Percent
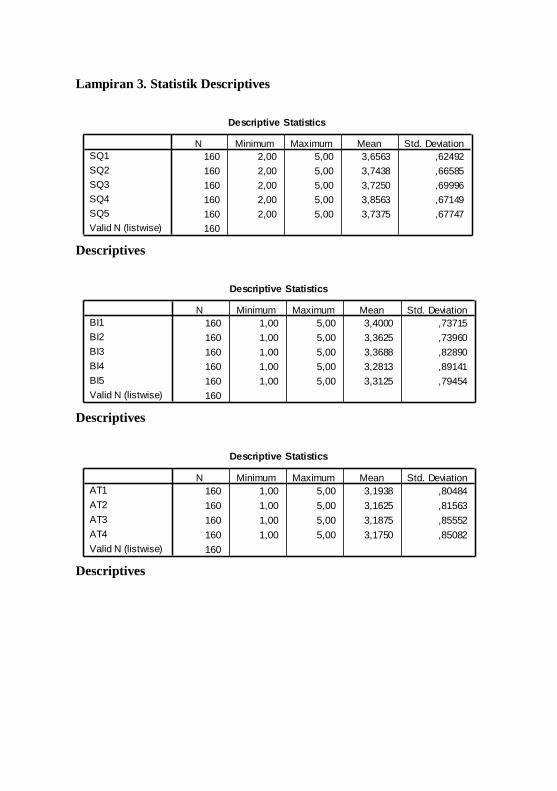
Lampiran 3. Statistik Descriptives
Descriptive Statistics
160 2,00 5,00 3,6563 ,62492
160 2,00 5,00 3,7438 ,66585
160 2,00 5,00 3,7250 ,69996
160 2,00 5,00 3,8563 ,67149
160 2,00 5,00 3,7375 ,67747
160
SQ1
SQ2
SQ3
SQ4
SQ5
Valid N (listwise)
N Minimum Maximum Mean Std. Deviation
Descriptives
Descriptive Statistics
160 1,00 5,00 3,4000 ,73715
160 1,00 5,00 3,3625 ,73960
160 1,00 5,00 3,3688 ,82890
160 1,00 5,00 3,2813 ,89141
160 1,00 5,00 3,3125 ,79454
160
BI1
BI2
BI3
BI4
BI5
Valid N (listwise)
N Minimum Maximum Mean Std. Deviation
Descriptives
Descriptive Statistics
160 1,00 5,00 3,1938 ,80484
160 1,00 5,00 3,1625 ,81563
160 1,00 5,00 3,1875 ,85552
160 1,00 5,00 3,1750 ,85082
160
AT1
AT2
AT3
AT4
Valid N (listwise)
N Minimum Maximum Mean Std. Deviation
Descriptives
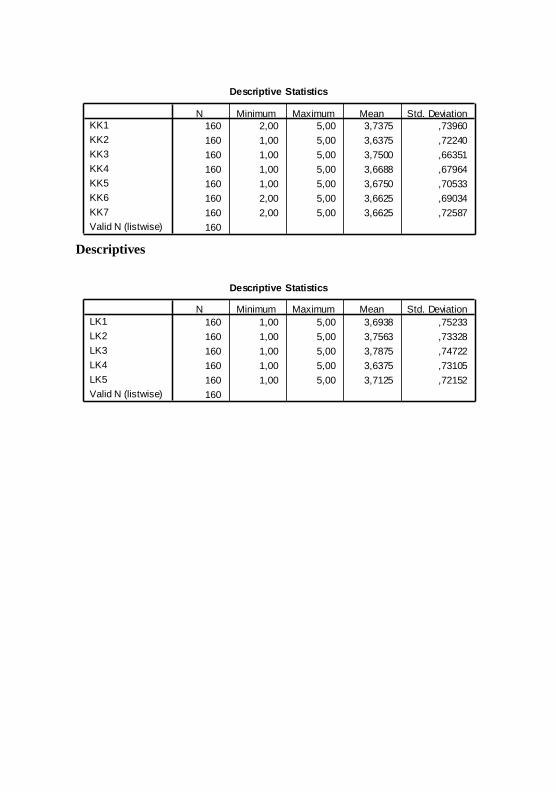
Descriptive Statistics
160 2,00 5,00 3,7375 ,73960
160 1,00 5,00 3,6375 ,72240
160 1,00 5,00 3,7500 ,66351
160 1,00 5,00 3,6688 ,67964
160 1,00 5,00 3,6750 ,70533
160 2,00 5,00 3,6625 ,69034
160 2,00 5,00 3,6625 ,72587
160
KK1
KK2
KK3
KK4
KK5
KK6
KK7
Valid N (listwise)
N Minimum Maximum Mean Std. Deviation
Descriptives
Descriptive Statistics
160 1,00 5,00 3,6938 ,75233
160 1,00 5,00 3,7563 ,73328
160 1,00 5,00 3,7875 ,74722
160 1,00 5,00 3,6375 ,73105
160 1,00 5,00 3,7125 ,72152
160
LK1
LK2
LK3
LK4
LK5
Valid N (listwise)
N Minimum Maximum Mean Std. Deviation
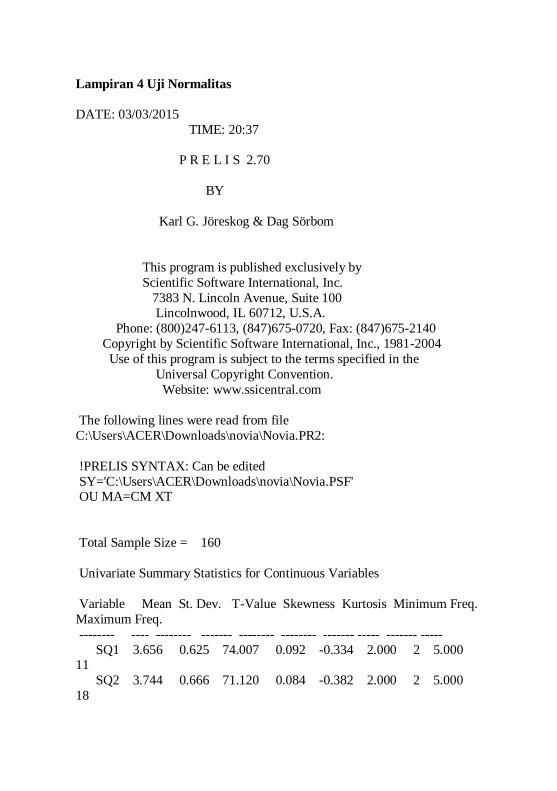
Lampiran 4 Uji Normalitas
DATE: 03/03/2015
TIME: 20:37
P R E L I S 2.70
BY
Karl G. Jöreskog & Dag Sörbom
This program is published exclusively by
Scientific Software International, Inc.
7383 N. Lincoln Avenue, Suite 100 Lincolnwood, IL 60712, U.S.A.
Phone: (800)247-6113, (847)675-0720, Fax: (847)675-2140
Copyright by Scientific Software International, Inc., 1981-2004
Use of this program is subject to the terms specified in the
Universal Copyright Convention.
Website: www.ssicentral.com
The following lines were read from file
C:\Users\ACER\Downloads\novia\Novia.PR2:
!PRELIS SYNTAX: Can be edited
SY='C:\Users\ACER\Downloads\novia\Novia.PSF' OU MA=CM XT
Total Sample Size = 160
Univariate Summary Statistics for Continuous Variables
Variable Mean St. Dev. T-Value Skewness Kurtosis Minimum Freq.
Maximum Freq.
-------- ---- -------- ------- -------- -------- ------- ----- ------- -----
SQ1 3.656 0.625 74.007 0.092 -0.334 2.000 2 5.000 11
SQ2 3.744 0.666 71.120 0.084 -0.382 2.000 2 5.000
18
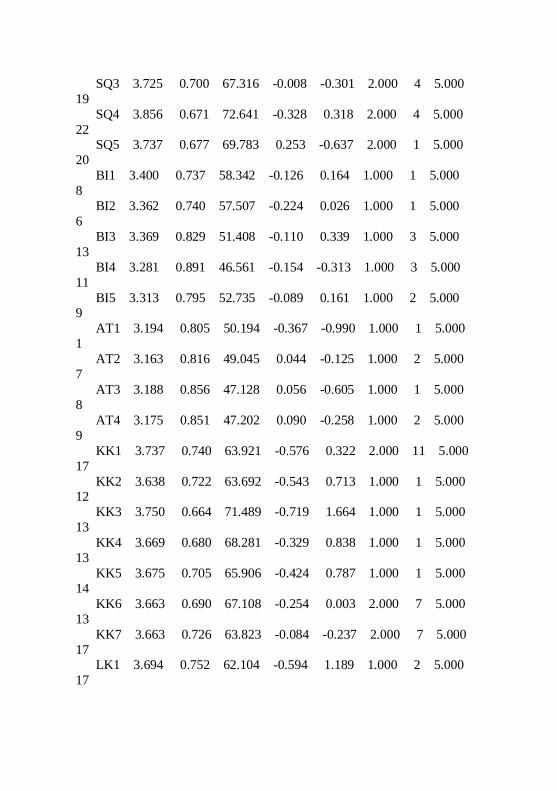
SQ3 3.725 0.700 67.316 -0.008 -0.301 2.000 4 5.000
19
SQ4 3.856 0.671 72.641 -0.328 0.318 2.000 4 5.000
22 SQ5 3.737 0.677 69.783 0.253 -0.637 2.000 1 5.000
20
BI1 3.400 0.737 58.342 -0.126 0.164 1.000 1 5.000
8
BI2 3.362 0.740 57.507 -0.224 0.026 1.000 1 5.000
6
BI3 3.369 0.829 51.408 -0.110 0.339 1.000 3 5.000
13
BI4 3.281 0.891 46.561 -0.154 -0.313 1.000 3 5.000
11
BI5 3.313 0.795 52.735 -0.089 0.161 1.000 2 5.000 9
AT1 3.194 0.805 50.194 -0.367 -0.990 1.000 1 5.000
1
AT2 3.163 0.816 49.045 0.044 -0.125 1.000 2 5.000
7
AT3 3.188 0.856 47.128 0.056 -0.605 1.000 1 5.000
8
AT4 3.175 0.851 47.202 0.090 -0.258 1.000 2 5.000
9
KK1 3.737 0.740 63.921 -0.576 0.322 2.000 11 5.000
17
KK2 3.638 0.722 63.692 -0.543 0.713 1.000 1 5.000 12
KK3 3.750 0.664 71.489 -0.719 1.664 1.000 1 5.000
13
KK4 3.669 0.680 68.281 -0.329 0.838 1.000 1 5.000
13
KK5 3.675 0.705 65.906 -0.424 0.787 1.000 1 5.000
14
KK6 3.663 0.690 67.108 -0.254 0.003 2.000 7 5.000
13
KK7 3.663 0.726 63.823 -0.084 -0.237 2.000 7 5.000
17 LK1 3.694 0.752 62.104 -0.594 1.189 1.000 2 5.000
17
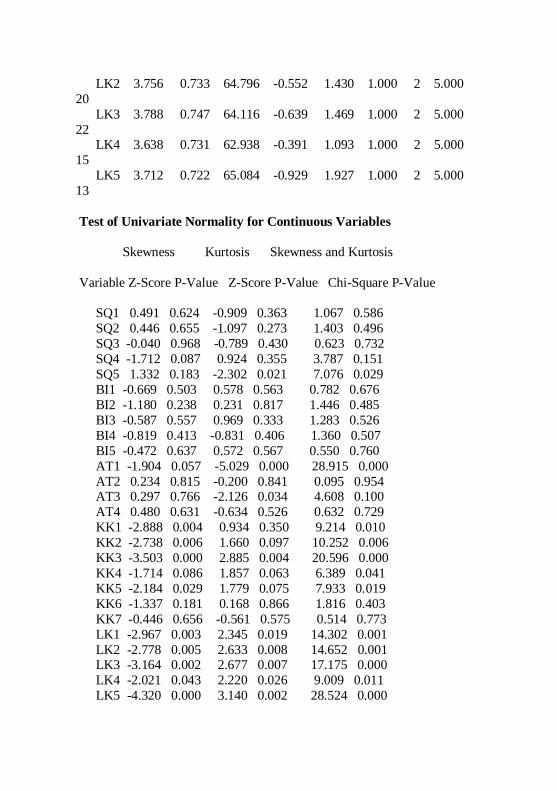
LK2 3.756 0.733 64.796 -0.552 1.430 1.000 2 5.000
20
LK3 3.788 0.747 64.116 -0.639 1.469 1.000 2 5.000
22 LK4 3.638 0.731 62.938 -0.391 1.093 1.000 2 5.000
15
LK5 3.712 0.722 65.084 -0.929 1.927 1.000 2 5.000
13
Test of Univariate Normality for Continuous Variables
Skewness Kurtosis Skewness and Kurtosis
Variable Z-Score P-Value Z-Score P-Value Chi-Square P-Value
SQ1 0.491 0.624 -0.909 0.363 1.067 0.586
SQ2 0.446 0.655 -1.097 0.273 1.403 0.496
SQ3 -0.040 0.968 -0.789 0.430 0.623 0.732
SQ4 -1.712 0.087 0.924 0.355 3.787 0.151
SQ5 1.332 0.183 -2.302 0.021 7.076 0.029
BI1 -0.669 0.503 0.578 0.563 0.782 0.676
BI2 -1.180 0.238 0.231 0.817 1.446 0.485
BI3 -0.587 0.557 0.969 0.333 1.283 0.526
BI4 -0.819 0.413 -0.831 0.406 1.360 0.507
BI5 -0.472 0.637 0.572 0.567 0.550 0.760
AT1 -1.904 0.057 -5.029 0.000 28.915 0.000
AT2 0.234 0.815 -0.200 0.841 0.095 0.954 AT3 0.297 0.766 -2.126 0.034 4.608 0.100
AT4 0.480 0.631 -0.634 0.526 0.632 0.729
KK1 -2.888 0.004 0.934 0.350 9.214 0.010
KK2 -2.738 0.006 1.660 0.097 10.252 0.006
KK3 -3.503 0.000 2.885 0.004 20.596 0.000
KK4 -1.714 0.086 1.857 0.063 6.389 0.041
KK5 -2.184 0.029 1.779 0.075 7.933 0.019
KK6 -1.337 0.181 0.168 0.866 1.816 0.403
KK7 -0.446 0.656 -0.561 0.575 0.514 0.773
LK1 -2.967 0.003 2.345 0.019 14.302 0.001
LK2 -2.778 0.005 2.633 0.008 14.652 0.001 LK3 -3.164 0.002 2.677 0.007 17.175 0.000
LK4 -2.021 0.043 2.220 0.026 9.009 0.011
LK5 -4.320 0.000 3.140 0.002 28.524 0.000
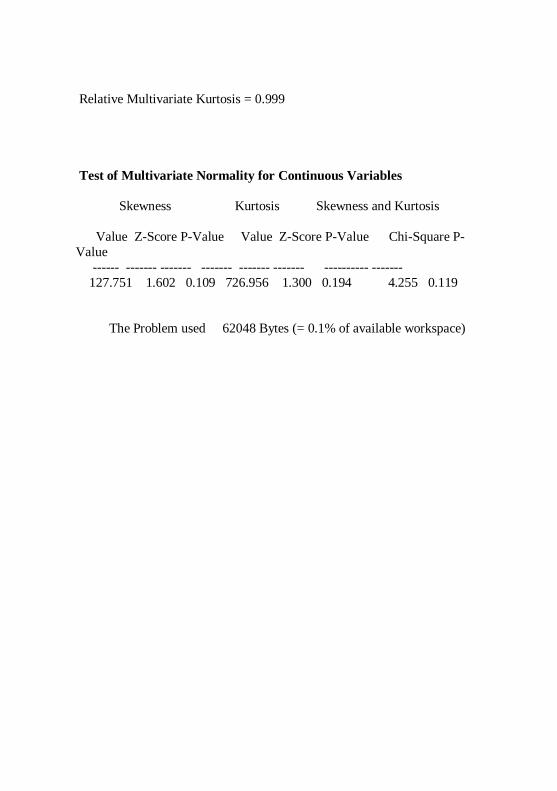
Relative Multivariate Kurtosis = 0.999
Test of Multivariate Normality for Continuous Variables
Skewness Kurtosis Skewness and Kurtosis
Value Z-Score P-Value Value Z-Score P-Value Chi-Square P-
Value
------ ------- ------- ------- ------- ------- ---------- -------
127.751 1.602 0.109 726.956 1.300 0.194 4.255 0.119
The Problem used 62048 Bytes (= 0.1% of available workspace)
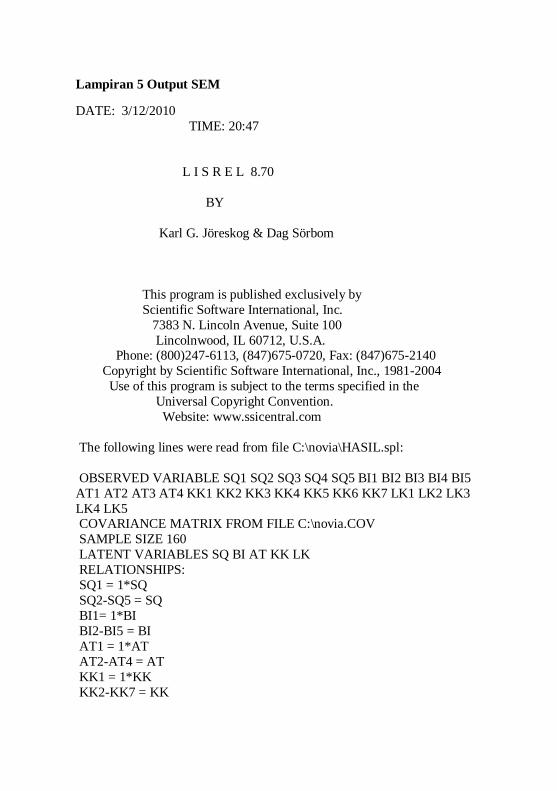
Lampiran 5 Output SEM
DATE: 3/12/2010
TIME: 20:47
L I S R E L 8.70
BY
Karl G. Jöreskog & Dag Sörbom
This program is published exclusively by
Scientific Software International, Inc.
7383 N. Lincoln Avenue, Suite 100
Lincolnwood, IL 60712, U.S.A. Phone: (800)247-6113, (847)675-0720, Fax: (847)675-2140
Copyright by Scientific Software International, Inc., 1981-2004
Use of this program is subject to the terms specified in the
Universal Copyright Convention.
Website: www.ssicentral.com
The following lines were read from file C:\novia\HASIL.spl:
OBSERVED VARIABLE SQ1 SQ2 SQ3 SQ4 SQ5 BI1 BI2 BI3 BI4 BI5
AT1 AT2 AT3 AT4 KK1 KK2 KK3 KK4 KK5 KK6 KK7 LK1 LK2 LK3
LK4 LK5 COVARIANCE MATRIX FROM FILE C:\novia.COV
SAMPLE SIZE 160
LATENT VARIABLES SQ BI AT KK LK
RELATIONSHIPS:
SQ1 = 1*SQ
SQ2-SQ5 = SQ
BI1= 1*BI
BI2-BI5 = BI
AT1 = 1*AT
AT2-AT4 = AT
KK1 = 1*KK
KK2-KK7 = KK
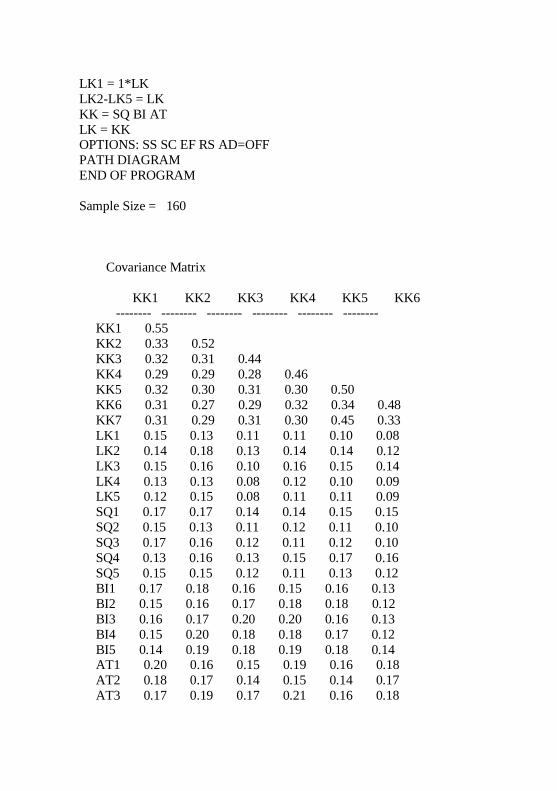
LK1 = 1*LK
LK2-LK5 = LK
KK = SQ BI AT
LK = KK OPTIONS: SS SC EF RS AD=OFF
PATH DIAGRAM
END OF PROGRAM
Sample Size = 160
Covariance Matrix
KK1 KK2 KK3 KK4 KK5 KK6 -------- -------- -------- -------- -------- --------
KK1 0.55
KK2 0.33 0.52
KK3 0.32 0.31 0.44
KK4 0.29 0.29 0.28 0.46
KK5 0.32 0.30 0.31 0.30 0.50
KK6 0.31 0.27 0.29 0.32 0.34 0.48
KK7 0.31 0.29 0.31 0.30 0.45 0.33
LK1 0.15 0.13 0.11 0.11 0.10 0.08
LK2 0.14 0.18 0.13 0.14 0.14 0.12
LK3 0.15 0.16 0.10 0.16 0.15 0.14
LK4 0.13 0.13 0.08 0.12 0.10 0.09 LK5 0.12 0.15 0.08 0.11 0.11 0.09
SQ1 0.17 0.17 0.14 0.14 0.15 0.15
SQ2 0.15 0.13 0.11 0.12 0.11 0.10
SQ3 0.17 0.16 0.12 0.11 0.12 0.10
SQ4 0.13 0.16 0.13 0.15 0.17 0.16
SQ5 0.15 0.15 0.12 0.11 0.13 0.12
BI1 0.17 0.18 0.16 0.15 0.16 0.13
BI2 0.15 0.16 0.17 0.18 0.18 0.12
BI3 0.16 0.17 0.20 0.20 0.16 0.13
BI4 0.15 0.20 0.18 0.18 0.17 0.12
BI5 0.14 0.19 0.18 0.19 0.18 0.14 AT1 0.20 0.16 0.15 0.19 0.16 0.18
AT2 0.18 0.17 0.14 0.15 0.14 0.17
AT3 0.17 0.19 0.17 0.21 0.16 0.18
AT4 0.20 0.20 0.23 0.23 0.18 0.20
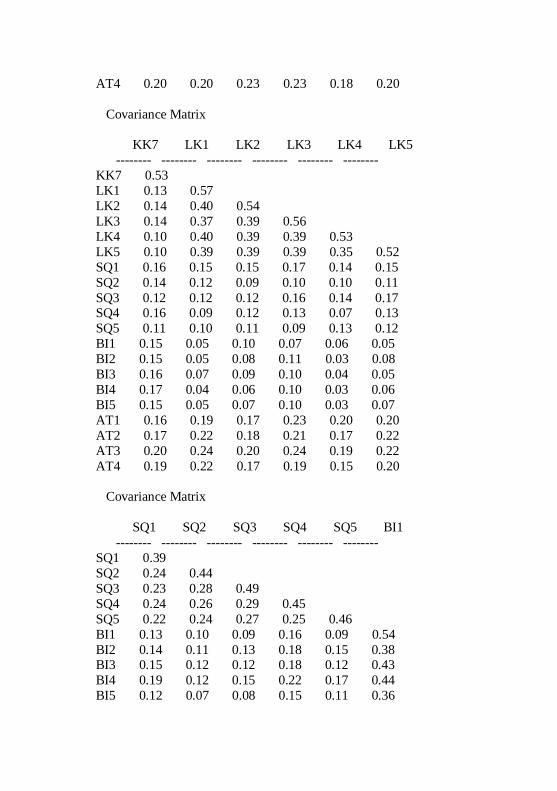
Covariance Matrix
KK7 LK1 LK2 LK3 LK4 LK5
-------- -------- -------- -------- -------- --------
KK7 0.53
LK1 0.13 0.57
LK2 0.14 0.40 0.54
LK3 0.14 0.37 0.39 0.56
LK4 0.10 0.40 0.39 0.39 0.53
LK5 0.10 0.39 0.39 0.39 0.35 0.52
SQ1 0.16 0.15 0.15 0.17 0.14 0.15
SQ2 0.14 0.12 0.09 0.10 0.10 0.11
SQ3 0.12 0.12 0.12 0.16 0.14 0.17 SQ4 0.16 0.09 0.12 0.13 0.07 0.13
SQ5 0.11 0.10 0.11 0.09 0.13 0.12
BI1 0.15 0.05 0.10 0.07 0.06 0.05
BI2 0.15 0.05 0.08 0.11 0.03 0.08
BI3 0.16 0.07 0.09 0.10 0.04 0.05
BI4 0.17 0.04 0.06 0.10 0.03 0.06
BI5 0.15 0.05 0.07 0.10 0.03 0.07
AT1 0.16 0.19 0.17 0.23 0.20 0.20
AT2 0.17 0.22 0.18 0.21 0.17 0.22
AT3 0.20 0.24 0.20 0.24 0.19 0.22
AT4 0.19 0.22 0.17 0.19 0.15 0.20
Covariance Matrix
SQ1 SQ2 SQ3 SQ4 SQ5 BI1
-------- -------- -------- -------- -------- --------
SQ1 0.39
SQ2 0.24 0.44
SQ3 0.23 0.28 0.49
SQ4 0.24 0.26 0.29 0.45
SQ5 0.22 0.24 0.27 0.25 0.46
BI1 0.13 0.10 0.09 0.16 0.09 0.54
BI2 0.14 0.11 0.13 0.18 0.15 0.38 BI3 0.15 0.12 0.12 0.18 0.12 0.43
BI4 0.19 0.12 0.15 0.22 0.17 0.44
BI5 0.12 0.07 0.08 0.15 0.11 0.36
AT1 0.19 0.15 0.20 0.16 0.18 0.08
AT2 0.18 0.17 0.19 0.16 0.14 0.10
AT3 0.22 0.18 0.21 0.20 0.17 0.13
AT4 0.21 0.20 0.21 0.22 0.18 0.12
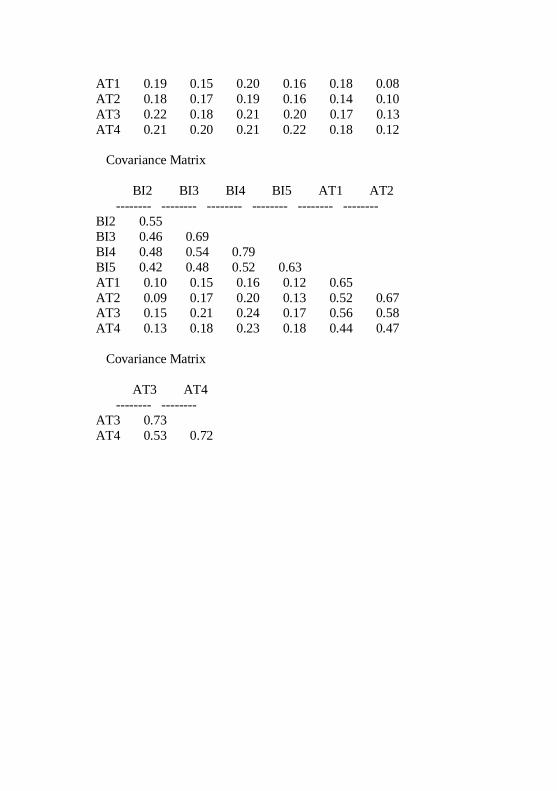
Covariance Matrix
BI2 BI3 BI4 BI5 AT1 AT2
-------- -------- -------- -------- -------- --------
BI2 0.55
BI3 0.46 0.69
BI4 0.48 0.54 0.79
BI5 0.42 0.48 0.52 0.63
AT1 0.10 0.15 0.16 0.12 0.65
AT2 0.09 0.17 0.20 0.13 0.52 0.67 AT3 0.15 0.21 0.24 0.17 0.56 0.58
AT4 0.13 0.18 0.23 0.18 0.44 0.47
Covariance Matrix
AT3 AT4
-------- --------
AT3 0.73
AT4 0.53 0.72
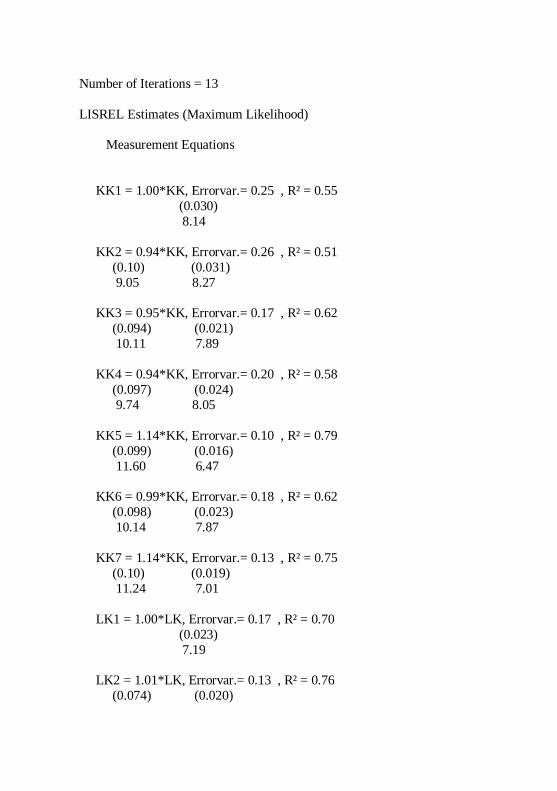
Number of Iterations = 13
LISREL Estimates (Maximum Likelihood)
Measurement Equations
KK1 = 1.00*KK, Errorvar.= 0.25 , R² = 0.55
(0.030)
8.14
KK2 = 0.94*KK, Errorvar.= 0.26 , R² = 0.51
(0.10) (0.031)
9.05 8.27
KK3 = 0.95*KK, Errorvar.= 0.17 , R² = 0.62
(0.094) (0.021)
10.11 7.89
KK4 = 0.94*KK, Errorvar.= 0.20 , R² = 0.58
(0.097) (0.024)
9.74 8.05
KK5 = 1.14*KK, Errorvar.= 0.10 , R² = 0.79
(0.099) (0.016)
11.60 6.47
KK6 = 0.99*KK, Errorvar.= 0.18 , R² = 0.62
(0.098) (0.023)
10.14 7.87
KK7 = 1.14*KK, Errorvar.= 0.13 , R² = 0.75
(0.10) (0.019)
11.24 7.01
LK1 = 1.00*LK, Errorvar.= 0.17 , R² = 0.70
(0.023)
7.19
LK2 = 1.01*LK, Errorvar.= 0.13 , R² = 0.76
(0.074) (0.020)
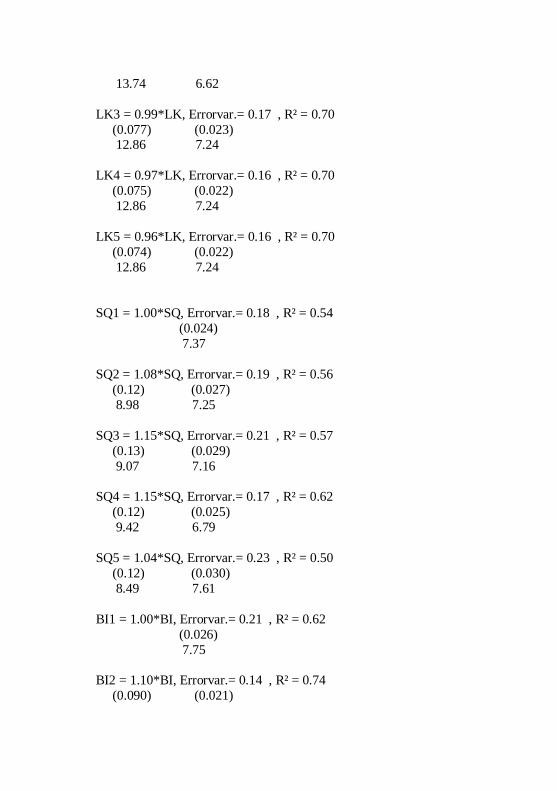
13.74 6.62
LK3 = 0.99*LK, Errorvar.= 0.17 , R² = 0.70
(0.077) (0.023) 12.86 7.24
LK4 = 0.97*LK, Errorvar.= 0.16 , R² = 0.70
(0.075) (0.022)
12.86 7.24
LK5 = 0.96*LK, Errorvar.= 0.16 , R² = 0.70
(0.074) (0.022)
12.86 7.24
SQ1 = 1.00*SQ, Errorvar.= 0.18 , R² = 0.54
(0.024)
7.37
SQ2 = 1.08*SQ, Errorvar.= 0.19 , R² = 0.56
(0.12) (0.027)
8.98 7.25
SQ3 = 1.15*SQ, Errorvar.= 0.21 , R² = 0.57
(0.13) (0.029)
9.07 7.16
SQ4 = 1.15*SQ, Errorvar.= 0.17 , R² = 0.62
(0.12) (0.025)
9.42 6.79
SQ5 = 1.04*SQ, Errorvar.= 0.23 , R² = 0.50
(0.12) (0.030)
8.49 7.61
BI1 = 1.00*BI, Errorvar.= 0.21 , R² = 0.62
(0.026)
7.75
BI2 = 1.10*BI, Errorvar.= 0.14 , R² = 0.74
(0.090) (0.021)
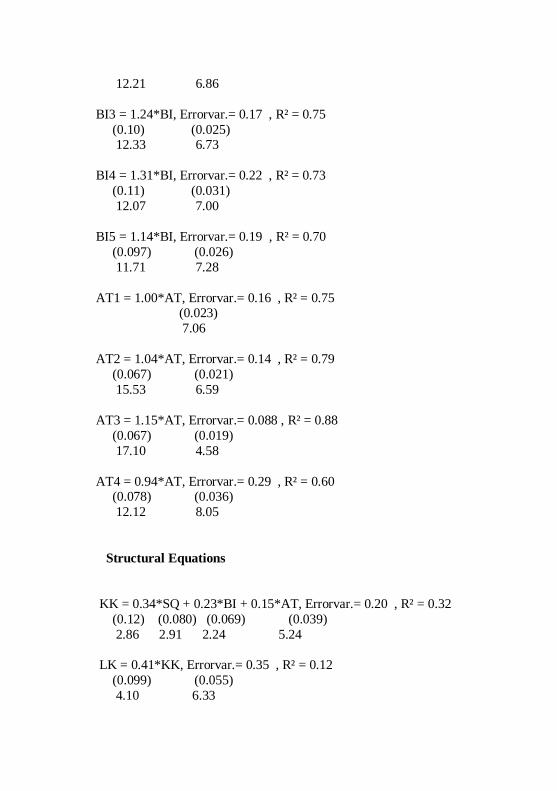
12.21 6.86
BI3 = 1.24*BI, Errorvar.= 0.17 , R² = 0.75
(0.10) (0.025) 12.33 6.73
BI4 = 1.31*BI, Errorvar.= 0.22 , R² = 0.73
(0.11) (0.031)
12.07 7.00
BI5 = 1.14*BI, Errorvar.= 0.19 , R² = 0.70
(0.097) (0.026)
11.71 7.28
AT1 = 1.00*AT, Errorvar.= 0.16 , R² = 0.75 (0.023)
7.06
AT2 = 1.04*AT, Errorvar.= 0.14 , R² = 0.79
(0.067) (0.021)
15.53 6.59
AT3 = 1.15*AT, Errorvar.= 0.088 , R² = 0.88
(0.067) (0.019)
17.10 4.58
AT4 = 0.94*AT, Errorvar.= 0.29 , R² = 0.60 (0.078) (0.036)
12.12 8.05
Structural Equations
KK = 0.34*SQ + 0.23*BI + 0.15*AT, Errorvar.= 0.20 , R² = 0.32
(0.12) (0.080) (0.069) (0.039)
2.86 2.91 2.24 5.24
LK = 0.41*KK, Errorvar.= 0.35 , R² = 0.12
(0.099) (0.055)
4.10 6.33
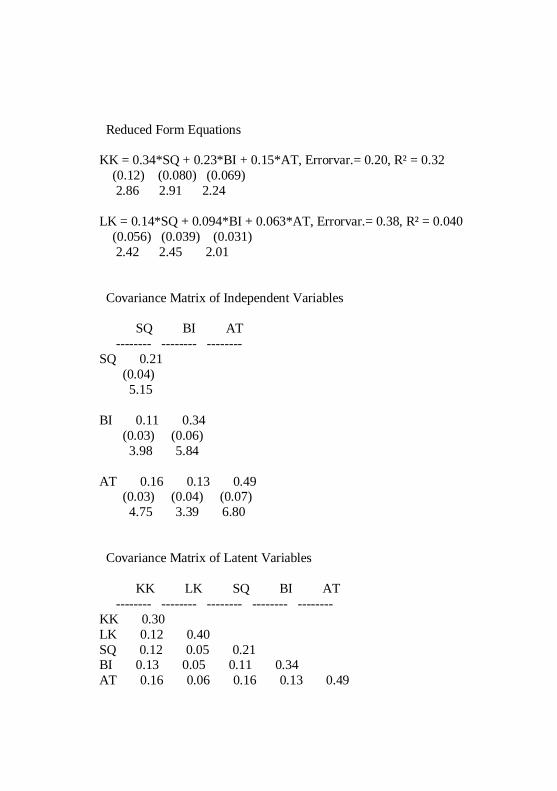
Reduced Form Equations
KK = 0.34*SQ + 0.23*BI + 0.15*AT, Errorvar.= 0.20, R² = 0.32
(0.12) (0.080) (0.069)
2.86 2.91 2.24
LK = 0.14*SQ + 0.094*BI + 0.063*AT, Errorvar.= 0.38, R² = 0.040
(0.056) (0.039) (0.031)
2.42 2.45 2.01
Covariance Matrix of Independent Variables
SQ BI AT
-------- -------- --------
SQ 0.21
(0.04)
5.15
BI 0.11 0.34
(0.03) (0.06)
3.98 5.84
AT 0.16 0.13 0.49 (0.03) (0.04) (0.07)
4.75 3.39 6.80
Covariance Matrix of Latent Variables
KK LK SQ BI AT
-------- -------- -------- -------- --------
KK 0.30
LK 0.12 0.40
SQ 0.12 0.05 0.21 BI 0.13 0.05 0.11 0.34
AT 0.16 0.06 0.16 0.13 0.49
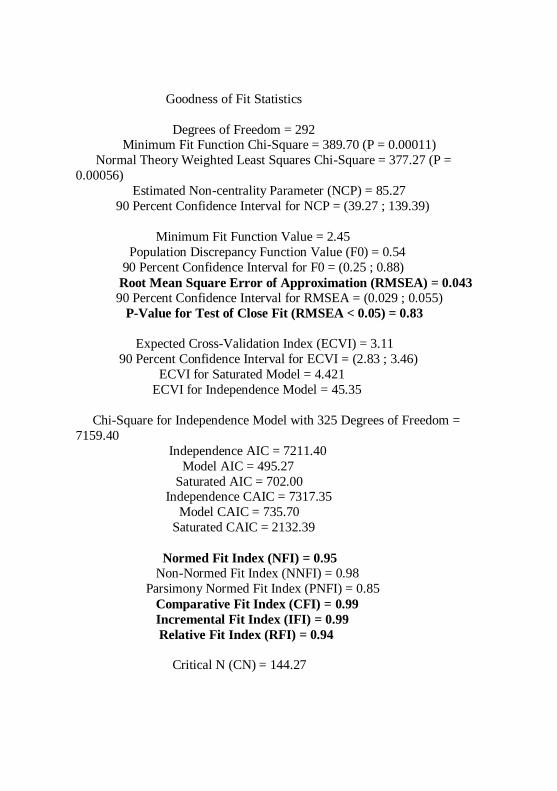
Goodness of Fit Statistics
Degrees of Freedom = 292 Minimum Fit Function Chi-Square = 389.70 (P = 0.00011)
Normal Theory Weighted Least Squares Chi-Square = 377.27 (P =
0.00056)
Estimated Non-centrality Parameter (NCP) = 85.27
90 Percent Confidence Interval for NCP = (39.27 ; 139.39)
Minimum Fit Function Value = 2.45
Population Discrepancy Function Value (F0) = 0.54
90 Percent Confidence Interval for F0 = (0.25 ; 0.88)
Root Mean Square Error of Approximation (RMSEA) = 0.043
90 Percent Confidence Interval for RMSEA = (0.029 ; 0.055)
P-Value for Test of Close Fit (RMSEA < 0.05) = 0.83
Expected Cross-Validation Index (ECVI) = 3.11
90 Percent Confidence Interval for ECVI = (2.83 ; 3.46)
ECVI for Saturated Model = 4.421
ECVI for Independence Model = 45.35
Chi-Square for Independence Model with 325 Degrees of Freedom =
7159.40
Independence AIC = 7211.40
Model AIC = 495.27
Saturated AIC = 702.00 Independence CAIC = 7317.35
Model CAIC = 735.70
Saturated CAIC = 2132.39
Normed Fit Index (NFI) = 0.95
Non-Normed Fit Index (NNFI) = 0.98
Parsimony Normed Fit Index (PNFI) = 0.85
Comparative Fit Index (CFI) = 0.99
Incremental Fit Index (IFI) = 0.99
Relative Fit Index (RFI) = 0.94
Critical N (CN) = 144.27
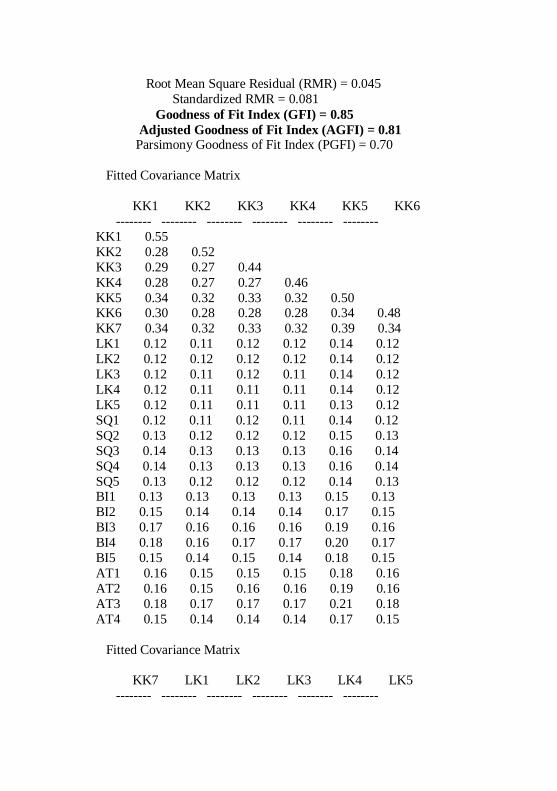
Root Mean Square Residual (RMR) = 0.045
Standardized RMR = 0.081
Goodness of Fit Index (GFI) = 0.85
Adjusted Goodness of Fit Index (AGFI) = 0.81 Parsimony Goodness of Fit Index (PGFI) = 0.70
Fitted Covariance Matrix
KK1 KK2 KK3 KK4 KK5 KK6
-------- -------- -------- -------- -------- --------
KK1 0.55
KK2 0.28 0.52
KK3 0.29 0.27 0.44
KK4 0.28 0.27 0.27 0.46
KK5 0.34 0.32 0.33 0.32 0.50 KK6 0.30 0.28 0.28 0.28 0.34 0.48
KK7 0.34 0.32 0.33 0.32 0.39 0.34
LK1 0.12 0.11 0.12 0.12 0.14 0.12
LK2 0.12 0.12 0.12 0.12 0.14 0.12
LK3 0.12 0.11 0.12 0.11 0.14 0.12
LK4 0.12 0.11 0.11 0.11 0.14 0.12
LK5 0.12 0.11 0.11 0.11 0.13 0.12
SQ1 0.12 0.11 0.12 0.11 0.14 0.12
SQ2 0.13 0.12 0.12 0.12 0.15 0.13
SQ3 0.14 0.13 0.13 0.13 0.16 0.14
SQ4 0.14 0.13 0.13 0.13 0.16 0.14
SQ5 0.13 0.12 0.12 0.12 0.14 0.13 BI1 0.13 0.13 0.13 0.13 0.15 0.13
BI2 0.15 0.14 0.14 0.14 0.17 0.15
BI3 0.17 0.16 0.16 0.16 0.19 0.16
BI4 0.18 0.16 0.17 0.17 0.20 0.17
BI5 0.15 0.14 0.15 0.14 0.18 0.15
AT1 0.16 0.15 0.15 0.15 0.18 0.16
AT2 0.16 0.15 0.16 0.16 0.19 0.16
AT3 0.18 0.17 0.17 0.17 0.21 0.18
AT4 0.15 0.14 0.14 0.14 0.17 0.15
Fitted Covariance Matrix
KK7 LK1 LK2 LK3 LK4 LK5
-------- -------- -------- -------- -------- --------
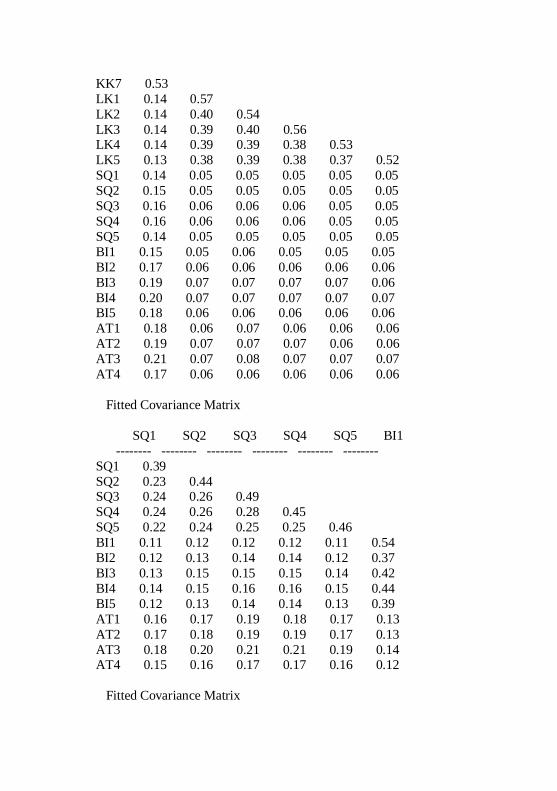
KK7 0.53
LK1 0.14 0.57
LK2 0.14 0.40 0.54
LK3 0.14 0.39 0.40 0.56 LK4 0.14 0.39 0.39 0.38 0.53
LK5 0.13 0.38 0.39 0.38 0.37 0.52
SQ1 0.14 0.05 0.05 0.05 0.05 0.05
SQ2 0.15 0.05 0.05 0.05 0.05 0.05
SQ3 0.16 0.06 0.06 0.06 0.05 0.05
SQ4 0.16 0.06 0.06 0.06 0.05 0.05
SQ5 0.14 0.05 0.05 0.05 0.05 0.05
BI1 0.15 0.05 0.06 0.05 0.05 0.05
BI2 0.17 0.06 0.06 0.06 0.06 0.06
BI3 0.19 0.07 0.07 0.07 0.07 0.06
BI4 0.20 0.07 0.07 0.07 0.07 0.07 BI5 0.18 0.06 0.06 0.06 0.06 0.06
AT1 0.18 0.06 0.07 0.06 0.06 0.06
AT2 0.19 0.07 0.07 0.07 0.06 0.06
AT3 0.21 0.07 0.08 0.07 0.07 0.07
AT4 0.17 0.06 0.06 0.06 0.06 0.06
Fitted Covariance Matrix
SQ1 SQ2 SQ3 SQ4 SQ5 BI1
-------- -------- -------- -------- -------- --------
SQ1 0.39
SQ2 0.23 0.44 SQ3 0.24 0.26 0.49
SQ4 0.24 0.26 0.28 0.45
SQ5 0.22 0.24 0.25 0.25 0.46
BI1 0.11 0.12 0.12 0.12 0.11 0.54
BI2 0.12 0.13 0.14 0.14 0.12 0.37
BI3 0.13 0.15 0.15 0.15 0.14 0.42
BI4 0.14 0.15 0.16 0.16 0.15 0.44
BI5 0.12 0.13 0.14 0.14 0.13 0.39
AT1 0.16 0.17 0.19 0.18 0.17 0.13
AT2 0.17 0.18 0.19 0.19 0.17 0.13
AT3 0.18 0.20 0.21 0.21 0.19 0.14 AT4 0.15 0.16 0.17 0.17 0.16 0.12
Fitted Covariance Matrix
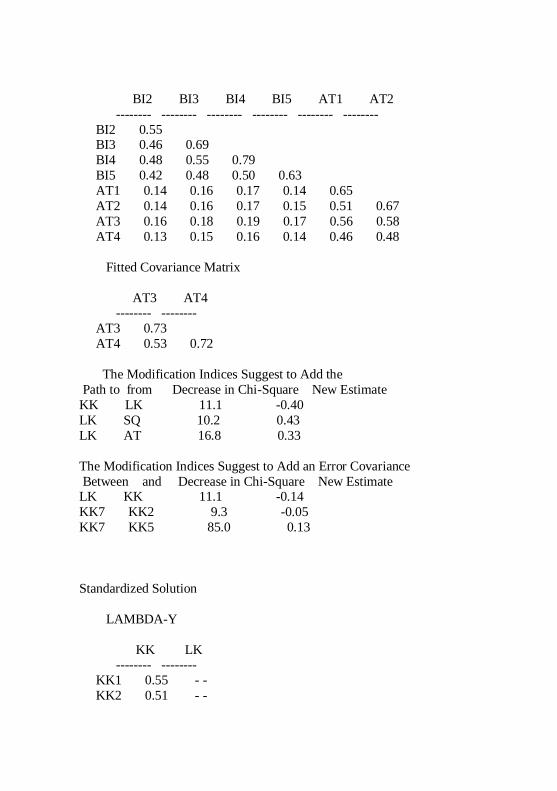
BI2 BI3 BI4 BI5 AT1 AT2
-------- -------- -------- -------- -------- --------
BI2 0.55 BI3 0.46 0.69
BI4 0.48 0.55 0.79
BI5 0.42 0.48 0.50 0.63
AT1 0.14 0.16 0.17 0.14 0.65
AT2 0.14 0.16 0.17 0.15 0.51 0.67
AT3 0.16 0.18 0.19 0.17 0.56 0.58
AT4 0.13 0.15 0.16 0.14 0.46 0.48
Fitted Covariance Matrix
AT3 AT4 -------- --------
AT3 0.73
AT4 0.53 0.72
The Modification Indices Suggest to Add the
Path to from Decrease in Chi-Square New Estimate
KK LK 11.1 -0.40
LK SQ 10.2 0.43
LK AT 16.8 0.33
The Modification Indices Suggest to Add an Error Covariance
Between and Decrease in Chi-Square New Estimate LK KK 11.1 -0.14
KK7 KK2 9.3 -0.05
KK7 KK5 85.0 0.13
Standardized Solution
LAMBDA-Y
KK LK -------- --------
KK1 0.55 - -
KK2 0.51 - -
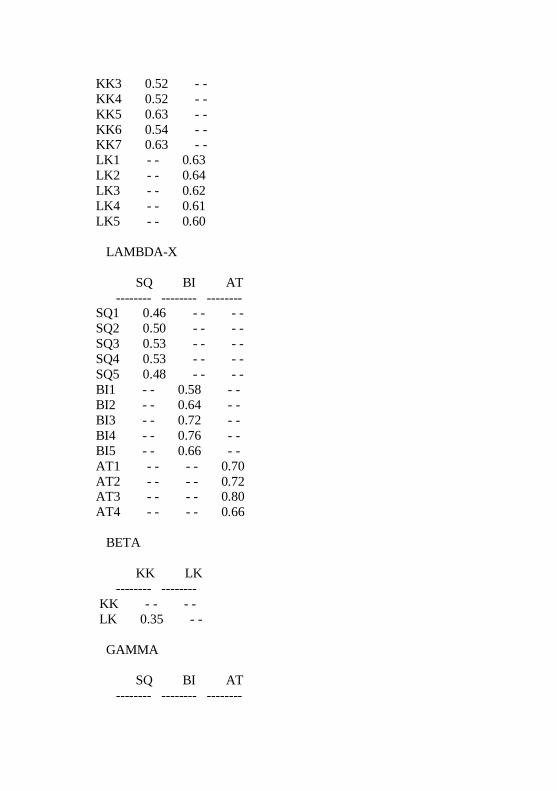
KK3 0.52 - -
KK4 0.52 - -
KK5 0.63 - -
KK6 0.54 - - KK7 0.63 - -
LK1 - - 0.63
LK2 - - 0.64
LK3 - - 0.62
LK4 - - 0.61
LK5 - - 0.60
LAMBDA-X
SQ BI AT
-------- -------- -------- SQ1 0.46 - - - -
SQ2 0.50 - - - -
SQ3 0.53 - - - -
SQ4 0.53 - - - -
SQ5 0.48 - - - -
BI1 - - 0.58 - -
BI2 - - 0.64 - -
BI3 - - 0.72 - -
BI4 - - 0.76 - -
BI5 - - 0.66 - -
AT1 - - - - 0.70
AT2 - - - - 0.72 AT3 - - - - 0.80
AT4 - - - - 0.66
BETA
KK LK
-------- --------
KK - - - -
LK 0.35 - -
GAMMA
SQ BI AT
-------- -------- --------
KK 0.28 0.25 0.20
LK - - - - - -
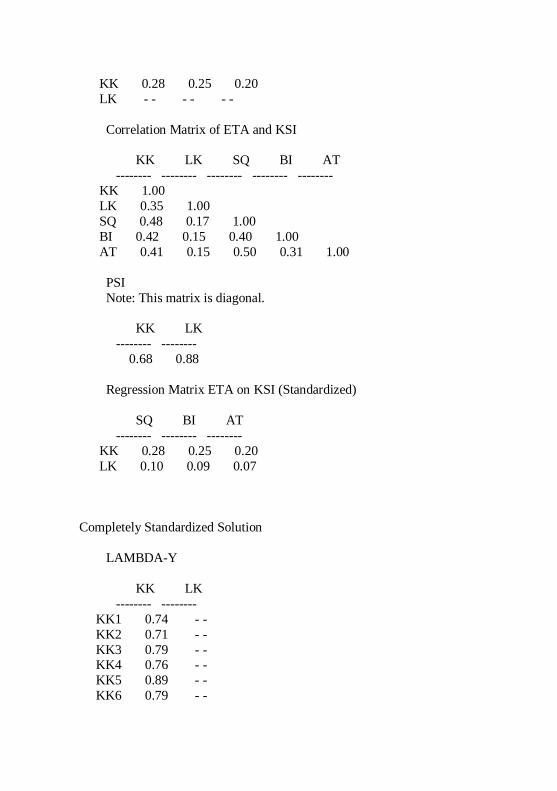
Correlation Matrix of ETA and KSI
KK LK SQ BI AT
-------- -------- -------- -------- --------
KK 1.00
LK 0.35 1.00
SQ 0.48 0.17 1.00
BI 0.42 0.15 0.40 1.00
AT 0.41 0.15 0.50 0.31 1.00
PSI
Note: This matrix is diagonal.
KK LK
-------- --------
0.68 0.88
Regression Matrix ETA on KSI (Standardized)
SQ BI AT
-------- -------- --------
KK 0.28 0.25 0.20
LK 0.10 0.09 0.07
Completely Standardized Solution
LAMBDA-Y
KK LK
-------- --------
KK1 0.74 - -
KK2 0.71 - -
KK3 0.79 - - KK4 0.76 - -
KK5 0.89 - -
KK6 0.79 - -
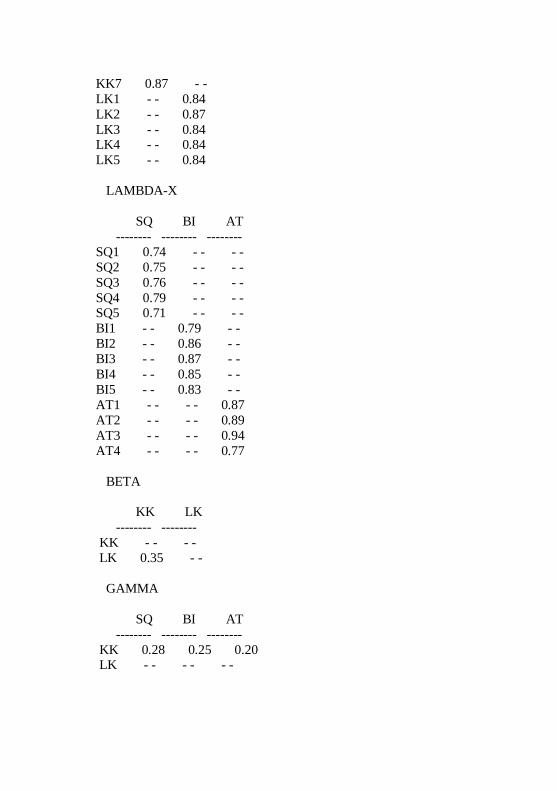
KK7 0.87 - -
LK1 - - 0.84
LK2 - - 0.87
LK3 - - 0.84 LK4 - - 0.84
LK5 - - 0.84
LAMBDA-X
SQ BI AT
-------- -------- --------
SQ1 0.74 - - - -
SQ2 0.75 - - - -
SQ3 0.76 - - - -
SQ4 0.79 - - - - SQ5 0.71 - - - -
BI1 - - 0.79 - -
BI2 - - 0.86 - -
BI3 - - 0.87 - -
BI4 - - 0.85 - -
BI5 - - 0.83 - -
AT1 - - - - 0.87
AT2 - - - - 0.89
AT3 - - - - 0.94
AT4 - - - - 0.77
BETA
KK LK
-------- --------
KK - - - -
LK 0.35 - -
GAMMA
SQ BI AT
-------- -------- --------
KK 0.28 0.25 0.20 LK - - - - - -
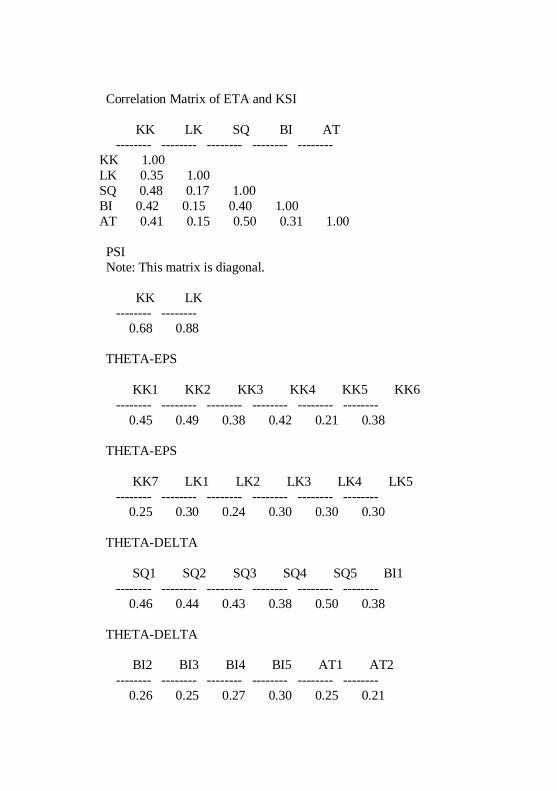
Correlation Matrix of ETA and KSI
KK LK SQ BI AT -------- -------- -------- -------- --------
KK 1.00
LK 0.35 1.00
SQ 0.48 0.17 1.00
BI 0.42 0.15 0.40 1.00
AT 0.41 0.15 0.50 0.31 1.00
PSI
Note: This matrix is diagonal.
KK LK -------- --------
0.68 0.88
THETA-EPS
KK1 KK2 KK3 KK4 KK5 KK6
-------- -------- -------- -------- -------- --------
0.45 0.49 0.38 0.42 0.21 0.38
THETA-EPS
KK7 LK1 LK2 LK3 LK4 LK5 -------- -------- -------- -------- -------- --------
0.25 0.30 0.24 0.30 0.30 0.30
THETA-DELTA
SQ1 SQ2 SQ3 SQ4 SQ5 BI1
-------- -------- -------- -------- -------- --------
0.46 0.44 0.43 0.38 0.50 0.38
THETA-DELTA
BI2 BI3 BI4 BI5 AT1 AT2
-------- -------- -------- -------- -------- --------
0.26 0.25 0.27 0.30 0.25 0.21
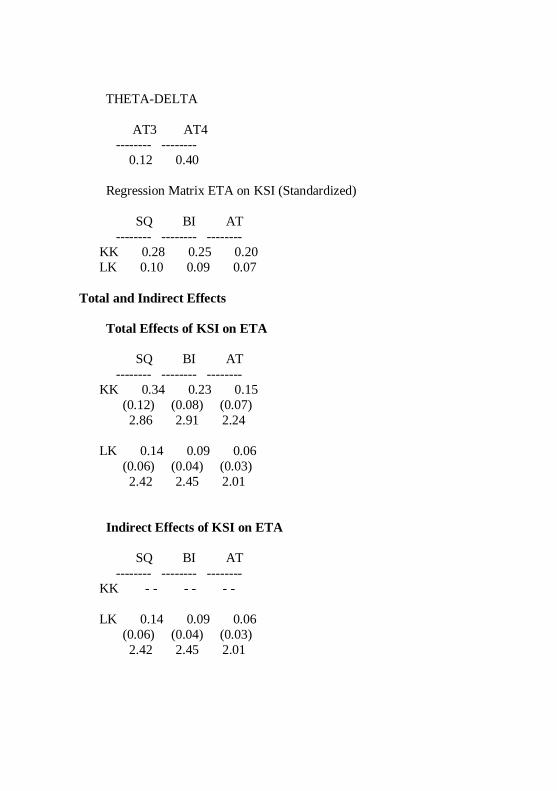
THETA-DELTA
AT3 AT4 -------- --------
0.12 0.40
Regression Matrix ETA on KSI (Standardized)
SQ BI AT
-------- -------- --------
KK 0.28 0.25 0.20
LK 0.10 0.09 0.07
Total and Indirect Effects
Total Effects of KSI on ETA
SQ BI AT
-------- -------- --------
KK 0.34 0.23 0.15
(0.12) (0.08) (0.07)
2.86 2.91 2.24
LK 0.14 0.09 0.06
(0.06) (0.04) (0.03)
2.42 2.45 2.01
Indirect Effects of KSI on ETA
SQ BI AT
-------- -------- --------
KK - - - - - -
LK 0.14 0.09 0.06
(0.06) (0.04) (0.03)
2.42 2.45 2.01
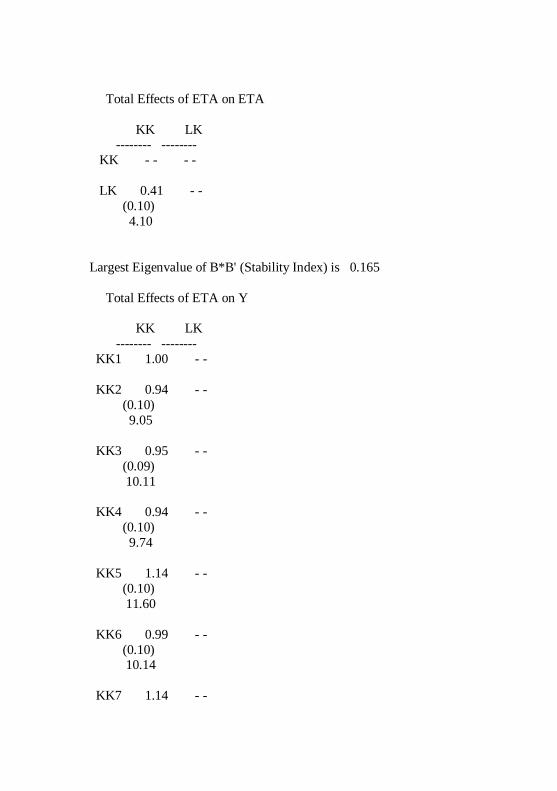
Total Effects of ETA on ETA
KK LK -------- --------
KK - - - -
LK 0.41 - -
(0.10)
4.10
Largest Eigenvalue of B*B' (Stability Index) is 0.165
Total Effects of ETA on Y
KK LK
-------- --------
KK1 1.00 - -
KK2 0.94 - -
(0.10)
9.05
KK3 0.95 - -
(0.09)
10.11
KK4 0.94 - -
(0.10)
9.74
KK5 1.14 - -
(0.10)
11.60
KK6 0.99 - -
(0.10) 10.14
KK7 1.14 - -
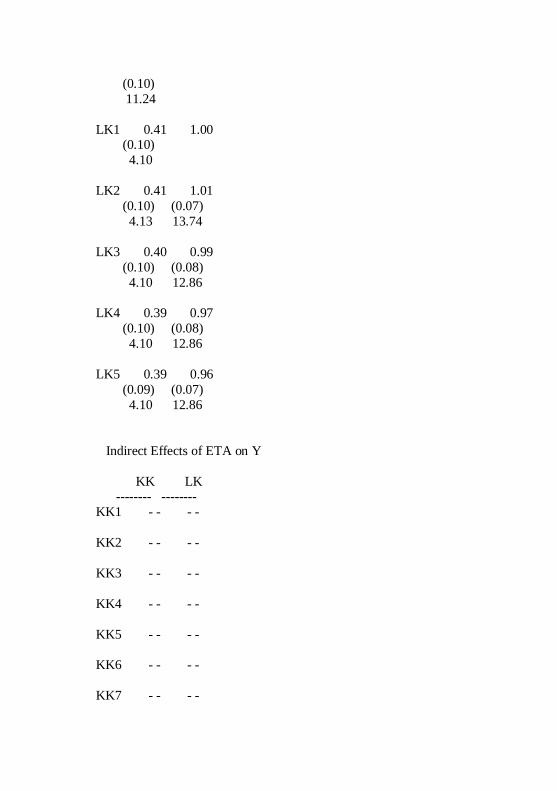
(0.10)
11.24
LK1 0.41 1.00 (0.10)
4.10
LK2 0.41 1.01
(0.10) (0.07)
4.13 13.74
LK3 0.40 0.99
(0.10) (0.08)
4.10 12.86
LK4 0.39 0.97
(0.10) (0.08)
4.10 12.86
LK5 0.39 0.96
(0.09) (0.07)
4.10 12.86
Indirect Effects of ETA on Y
KK LK -------- --------
KK1 - - - -
KK2 - - - -
KK3 - - - -
KK4 - - - -
KK5 - - - -
KK6 - - - -
KK7 - - - -
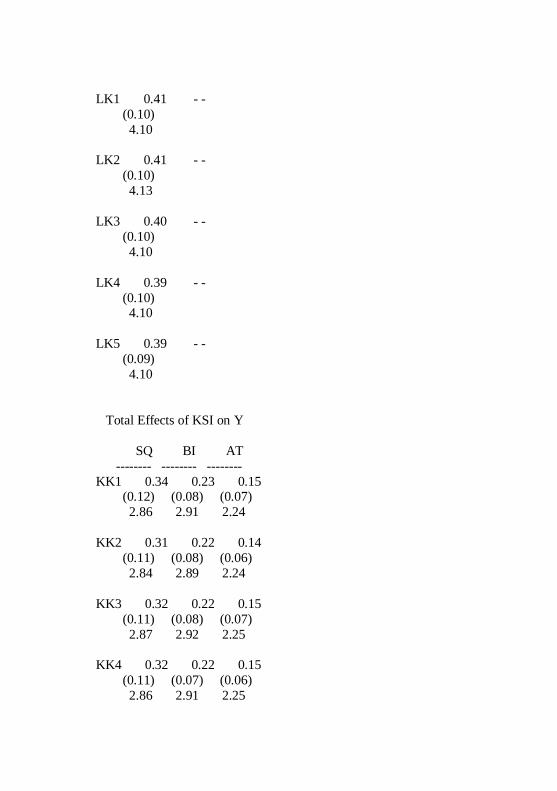
LK1 0.41 - -
(0.10)
4.10
LK2 0.41 - -
(0.10)
4.13
LK3 0.40 - -
(0.10)
4.10
LK4 0.39 - -
(0.10) 4.10
LK5 0.39 - -
(0.09)
4.10
Total Effects of KSI on Y
SQ BI AT
-------- -------- --------
KK1 0.34 0.23 0.15 (0.12) (0.08) (0.07)
2.86 2.91 2.24
KK2 0.31 0.22 0.14
(0.11) (0.08) (0.06)
2.84 2.89 2.24
KK3 0.32 0.22 0.15
(0.11) (0.08) (0.07)
2.87 2.92 2.25
KK4 0.32 0.22 0.15
(0.11) (0.07) (0.06)
2.86 2.91 2.25
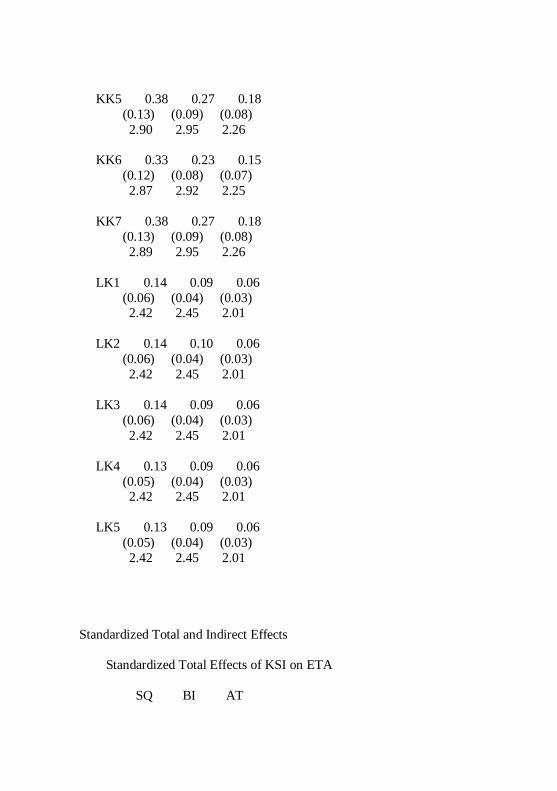
KK5 0.38 0.27 0.18
(0.13) (0.09) (0.08)
2.90 2.95 2.26
KK6 0.33 0.23 0.15
(0.12) (0.08) (0.07)
2.87 2.92 2.25
KK7 0.38 0.27 0.18
(0.13) (0.09) (0.08)
2.89 2.95 2.26
LK1 0.14 0.09 0.06
(0.06) (0.04) (0.03) 2.42 2.45 2.01
LK2 0.14 0.10 0.06
(0.06) (0.04) (0.03)
2.42 2.45 2.01
LK3 0.14 0.09 0.06
(0.06) (0.04) (0.03)
2.42 2.45 2.01
LK4 0.13 0.09 0.06
(0.05) (0.04) (0.03) 2.42 2.45 2.01
LK5 0.13 0.09 0.06
(0.05) (0.04) (0.03)
2.42 2.45 2.01
Standardized Total and Indirect Effects
Standardized Total Effects of KSI on ETA
SQ BI AT
-------- -------- --------
KK 0.28 0.25 0.20
LK 0.10 0.09 0.07
Standardized Indirect Effects of KSI on ETA
SQ BI AT
-------- -------- --------
KK - - - - - -
LK 0.10 0.09 0.07
Standardized Total Effects of ETA on ETA
KK LK
-------- -------- KK - - - -
LK 0.35 - -
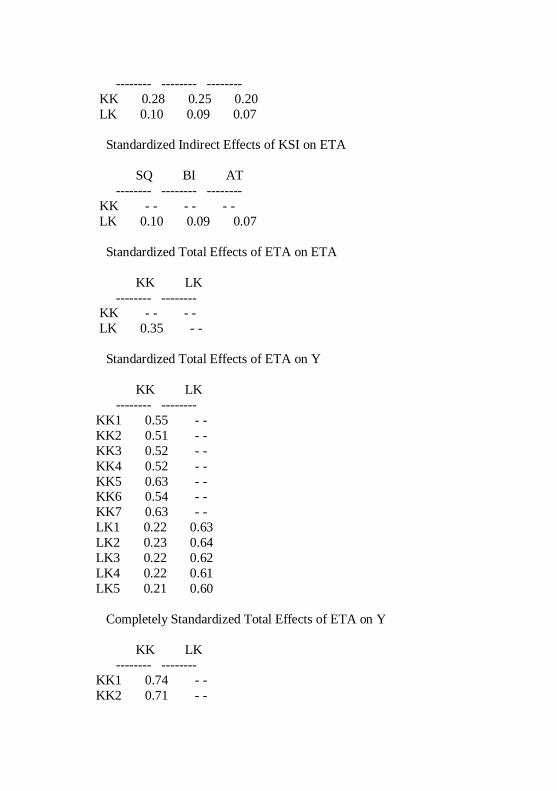
Standardized Total Effects of ETA on Y
KK LK
-------- --------
KK1 0.55 - -
KK2 0.51 - -
KK3 0.52 - -
KK4 0.52 - -
KK5 0.63 - - KK6 0.54 - -
KK7 0.63 - -
LK1 0.22 0.63
LK2 0.23 0.64
LK3 0.22 0.62
LK4 0.22 0.61
LK5 0.21 0.60
Completely Standardized Total Effects of ETA on Y
KK LK -------- --------
KK1 0.74 - -
KK2 0.71 - -
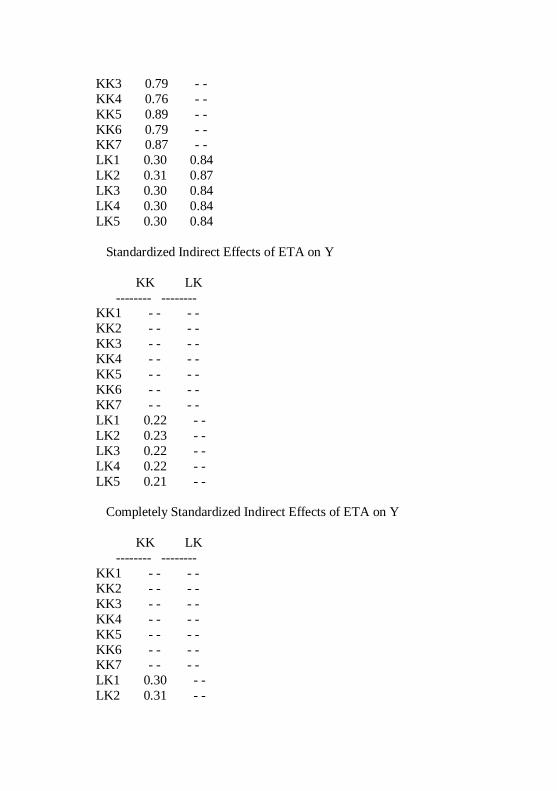
KK3 0.79 - -
KK4 0.76 - -
KK5 0.89 - -
KK6 0.79 - - KK7 0.87 - -
LK1 0.30 0.84
LK2 0.31 0.87
LK3 0.30 0.84
LK4 0.30 0.84
LK5 0.30 0.84
Standardized Indirect Effects of ETA on Y
KK LK
-------- -------- KK1 - - - -
KK2 - - - -
KK3 - - - -
KK4 - - - -
KK5 - - - -
KK6 - - - -
KK7 - - - -
LK1 0.22 - -
LK2 0.23 - -
LK3 0.22 - -
LK4 0.22 - -
LK5 0.21 - -
Completely Standardized Indirect Effects of ETA on Y
KK LK
-------- --------
KK1 - - - -
KK2 - - - -
KK3 - - - -
KK4 - - - -
KK5 - - - -
KK6 - - - - KK7 - - - -
LK1 0.30 - -
LK2 0.31 - -
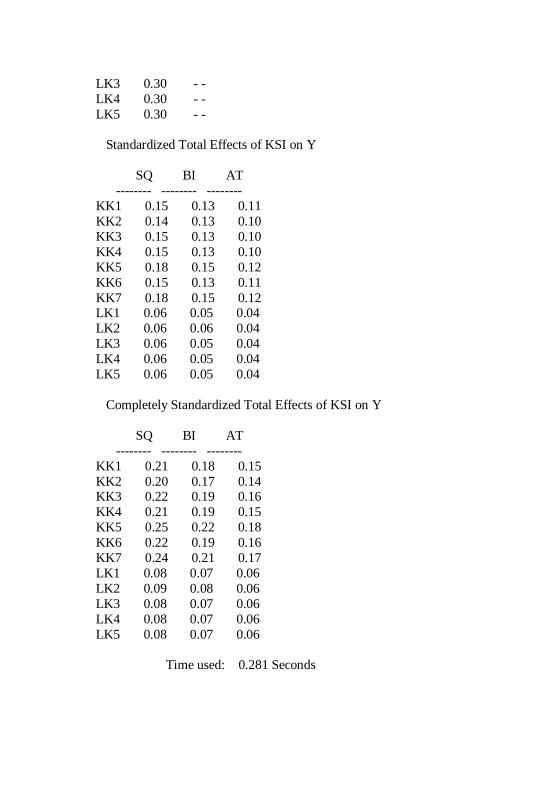
LK3 0.30 - -
LK4 0.30 - -
LK5 0.30 - -
Standardized Total Effects of KSI on Y
SQ BI AT
-------- -------- --------
KK1 0.15 0.13 0.11
KK2 0.14 0.13 0.10
KK3 0.15 0.13 0.10
KK4 0.15 0.13 0.10
KK5 0.18 0.15 0.12
KK6 0.15 0.13 0.11
KK7 0.18 0.15 0.12 LK1 0.06 0.05 0.04
LK2 0.06 0.06 0.04
LK3 0.06 0.05 0.04
LK4 0.06 0.05 0.04
LK5 0.06 0.05 0.04
Completely Standardized Total Effects of KSI on Y
SQ BI AT
-------- -------- --------
KK1 0.21 0.18 0.15
KK2 0.20 0.17 0.14 KK3 0.22 0.19 0.16
KK4 0.21 0.19 0.15
KK5 0.25 0.22 0.18
KK6 0.22 0.19 0.16
KK7 0.24 0.21 0.17
LK1 0.08 0.07 0.06
LK2 0.09 0.08 0.06
LK3 0.08 0.07 0.06
LK4 0.08 0.07 0.06
LK5 0.08 0.07 0.06
Time used: 0.281 Seconds
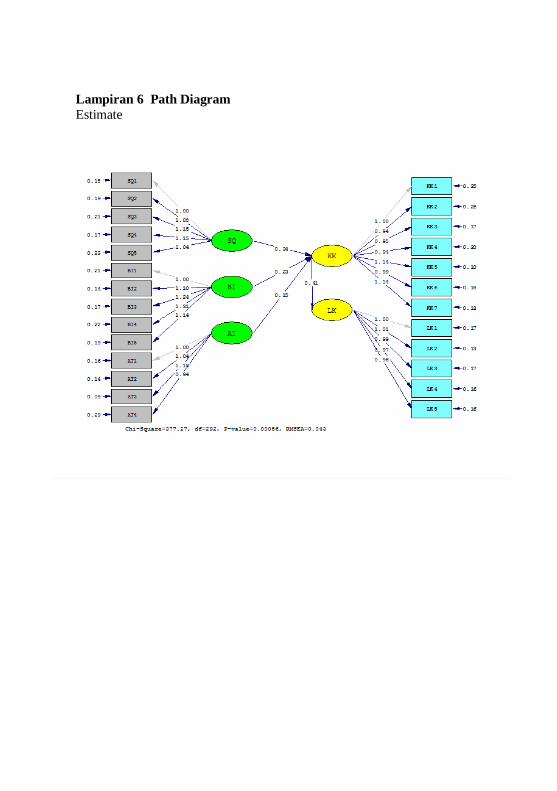
Lampiran 6 Path Diagram
Estimate
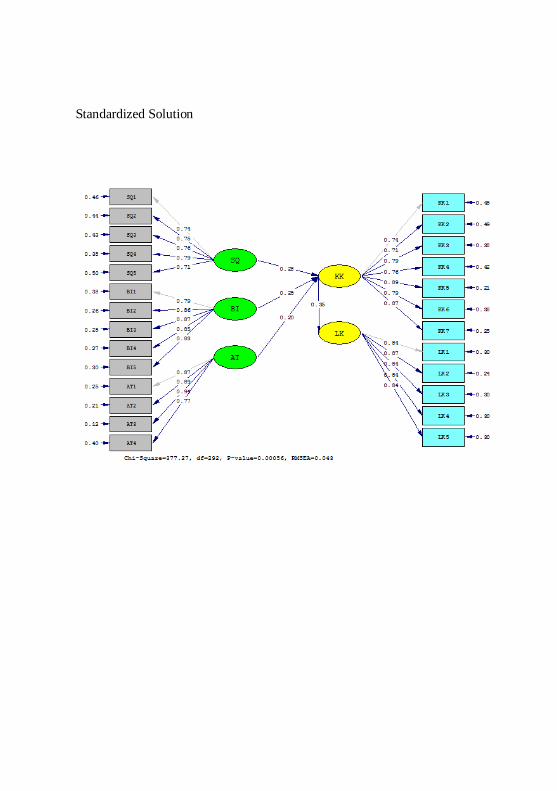
Standardized Solution
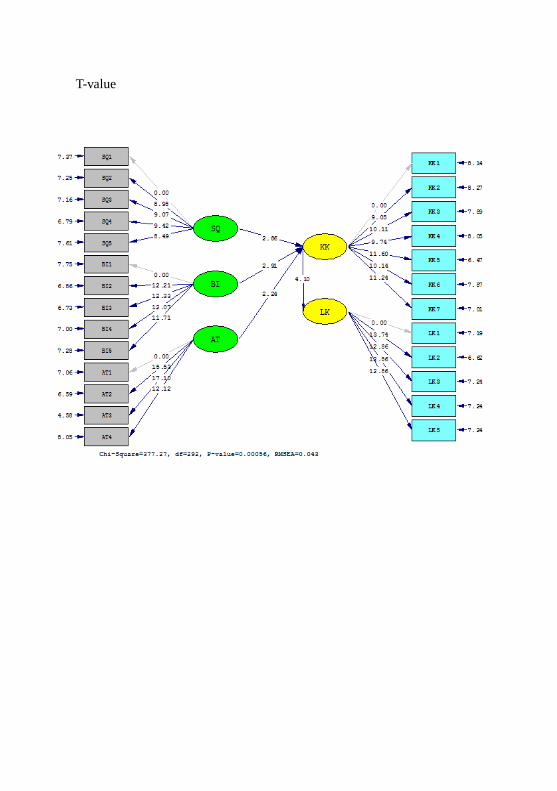
T-value