Neuro Imaging
41
PRINSIP DASAR NEUROIMAGING Oleh Edrial N. Eddin
-
Upload
farida-maksum-lz -
Category
Documents
-
view
59 -
download
2
description
modul neurosains
Transcript of Neuro Imaging

PRINSIP DASARNEUROIMAGING
Oleh
Edrial N. Eddin
PRINSIP DASARNEUROIMAGING
Oleh
Edrial N. Eddin

MRI
X-Ray
MEDICAL IMAGING
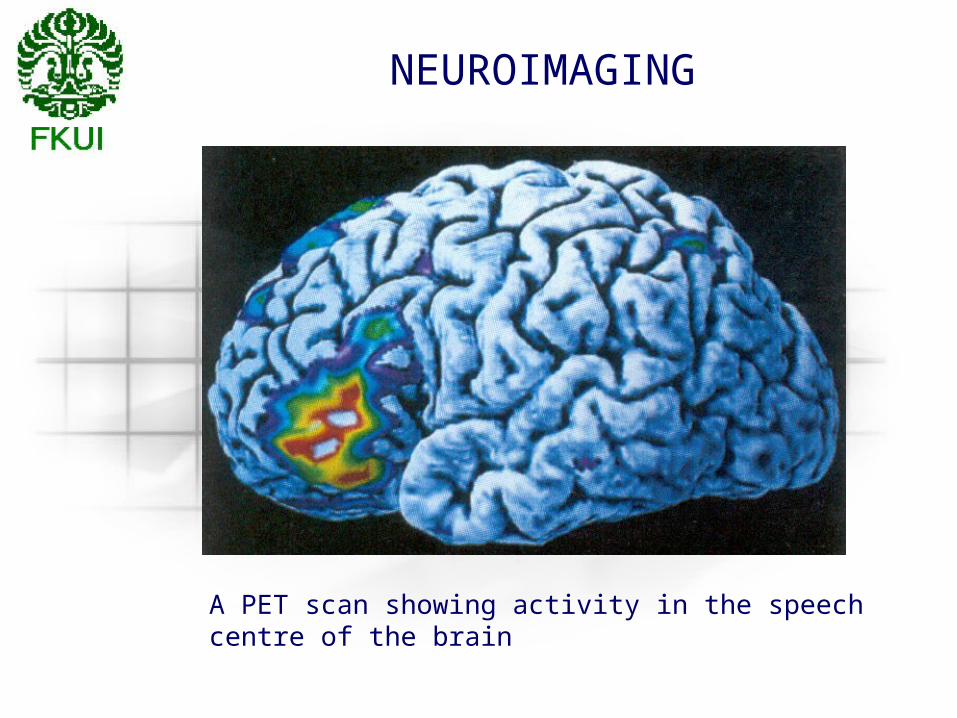
NEUROIMAGING
A PET scan showing activity in the speech centre of the brain
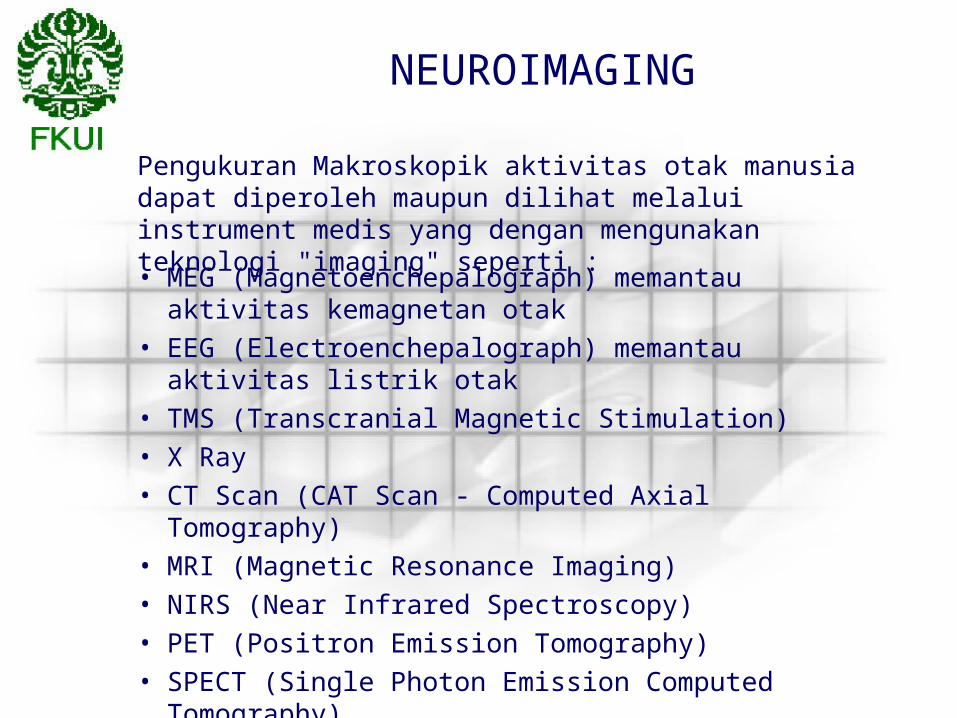
NEUROIMAGING
Pengukuran Makroskopik aktivitas otak manusia dapat diperoleh maupun dilihat melalui instrument medis yang dengan mengunakan teknologi "imaging" seperti :
• MEG (Magnetoenchepalograph) memantau aktivitas kemagnetan otak
• EEG (Electroenchepalograph) memantau aktivitas listrik otak
• TMS (Transcranial Magnetic Stimulation)• X Ray• CT Scan (CAT Scan - Computed Axial Tomography)• MRI (Magnetic Resonance Imaging)• NIRS (Near Infrared Spectroscopy)• PET (Positron Emission Tomography)• SPECT (Single Photon Emission Computed Tomography)

BIOMEDICAL IMAGING
GOAL : – Create images of the interior of the living human
body from the outside for diagnostic purposes.
Biomedical Imaging is a multi-disciplinary field involving :– Physics (matter, energy, radiation, etc.)– Math (linear algebra, calculus, statistics)– Biology/Physiology– Engineering (implementation)– Computer science (image reconstruction, signal
processing)

X-RAY IMAGING
• Year discovered: 1895 (Röntgen, NP 1905)
• Form of radiation: X-rays = electromagnetic radiation (photons)
• Energy / wavelength of radiation: 0.1 – 100 keV / 10 – 0.01 nm
(ionizing)
• Imaging principle: X-rays penetrate tissue and create "shadowgram" of differences in density.
• Imaging volume: Whole body
• Resolution: Very high (sub-mm)
• Applications: Mammography, lung diseases, orthopedics, dentistry, cardiovascular, gastro intestine

ELECTROMAGNETIC SPECTRUM

Contoh X-Ray Images
• What do you see?• What don’t you see?

X-Ray Computed Tomography
• Year discovered: 1972 (Hounsfield, NP 1979)• Form of radiation: X-rays• Energy / wavelength of radiation: 10 – 100 keV / 0.1 – 0.01 nm
(ionizing)• Imaging principle: X-ray images are taken under
many angles from which tomographic ("sliced") views are computed
• Imaging volume: Whole body• Resolution: High (mm)• Applications: Soft tissue imaging (brain,
cardiovascular, GI)

ELECTROMAGNETIC SPECTRUM

Contoh X-Ray CT Images
• What do you see?

Nuclear imaging (PET/SPECT)
• Year discovered: 1953 (PET), 1963 (SPECT)• Form of radiation: Gamma rays• Energy / wavelength of radiation: > 100 keV / < 0.01 nm
(ionizing)• Imaging principle: Accumulation or "washout"
of radioactive isotopes in the body are imaged with x-ray cameras.
• Imaging volume: Whole body• Resolution: Medium – Low (mm - cm)• Applications: Functional imaging (cancer
detection, metabolic processes, myocardial infarction)

ELECTROMAGNETIC SPECTRUM

Contoh SPECT/PET Images
• What do you see?PET
SPECT

Magnetic Resonance Imaging
• Year discovered: 1945 ([NMR] Bloch, NP 1952)1973 (Lauterbur, NP 2003)1977 (Mansfield, NP 2003) 1971 (Damadian, SUNY
DMS)• Form of radiation: Radio frequency (RF)
(non-ionizing)• Energy / wavelength of radiation: 10 – 100 MHz / 30 – 3 m
(~10-7 eV)• Imaging principle: Proton spin flips are induced,
and the RF emitted by their response (echo) is detected.
• Imaging volume: Whole body• Resolution: High (mm)• Applications: Soft tissue, functional imaging

ELECTROMAGNETIC SPECTRUM

Contoh MR Images
• What do you see?

Ultrasound Imaging
• Year discovered: 1952 (clinical: 1962)• Form of radiation: Sound waves (non-
ionizing)NOT EM radiation!
• Frequency / wavelength of radiation: 1 – 10 MHz / 1 – 0.1 mm
• Imaging principle: Echoes from discontinuities in tissue density/speed of sound are registered.
• Imaging volume: < 20 cm• Resolution: High (mm)• Applications: Soft tissue, blood flow
(Doppler)

ELECTROMAGNETIC SPECTRUM
For comparison, this is wavelength/frequency range of US, but US is NOT electromagnetic!

Contoh Ultrasound Images
• What do you see?
SPECT

Optical Tomography
• Year discovered: 1989 (Barbour)
• Form of radiation: Near-infrared light (non-ionizing)
• Energy / wavelength of radiation: ~1 eV/ 600 – 1000 nm• Imaging principle: Interaction (absorption,
scattering) of light w/ tissue. • Imaging volume: ~103 cm3
• Resolution: Low (~ 1cm)• Applications: Perfusion, functional imaging

ELECTROMAGNETIC SPECTRUM
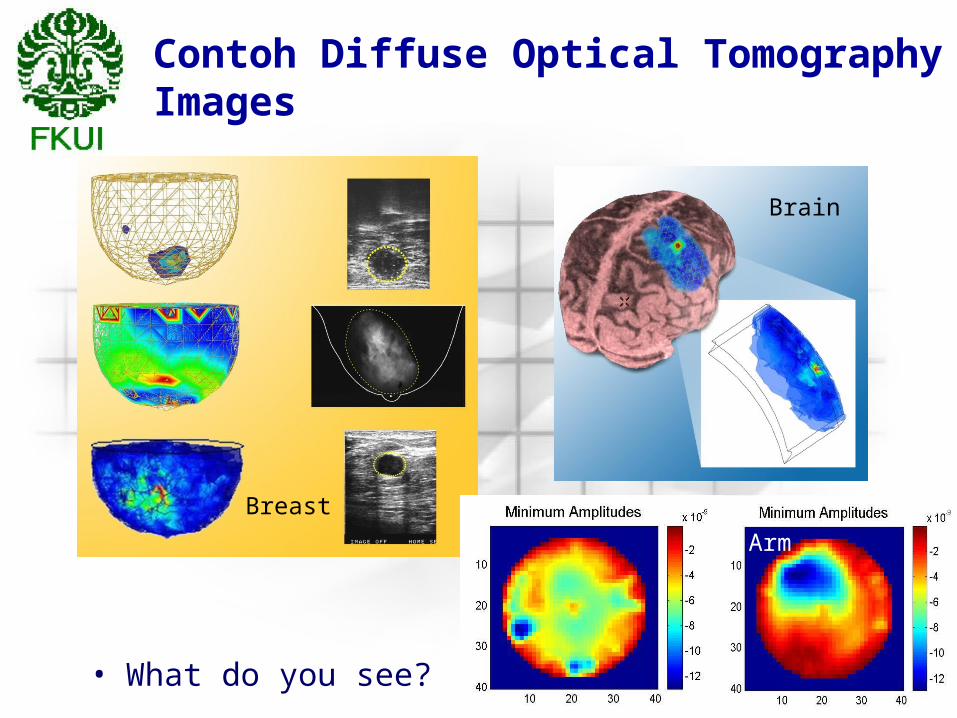
Contoh Diffuse Optical Tomography Images
• What do you see?
SPECTBrain
Arm
Breast


INSTRUMENTASI KEDOKTERAN
INSTRUMENTASI : Segala ikhwal yang menyangkut INSTRUMEN
INSTRUMEN :• alat yang menambah ketelitian,
memperdalam dan memperpanjang jangkauan manusia.
• membantu manusia untuk mengetahui besaran di sekitarnya.

PERALATAN ELEKTROMEDIK (1)
• PERALATAN ELEKTROMEDIK PADA DASARNYA DIGUNAKAN, UNTUK MEDICAL TREATMENT DAN DIAGNOSIS PASIEN.
• BIASANYA DILENGKAPI DENGAN INTRUKSI- INSTRUKSI YANG DIPERLUKAN TERHADAP PASIEN.
• DILENGKAPI DENGAN SISTEM PENGAMAN AGAR ALAT-ALAT TIDAK TERKONTAK LANGSUNG DENGAN TUBUH PASIEN.

PERALATAN ELEKTROMEDIK (2)
• SEMUA ORANG PERLU DIHINDARI TERHADAP MUATAN LISTRIK YANG BERASAL DARI PERALATAN ELEKTROMEDIK, DENGAN MEMBUAT STANDARD PENGAMANAN.
• MENGINGAT TINGKAT BAHAYA BAGI PASIEN DAN PENGGUNA ALAT LISTRIK YANG TERKONTAK DENGAN TUBUH MANUSIA, MAKA :

PERALATAN ELEKTROMEDIK (3)
1. ALAT YANG DIGUNAKAN ADALAH HARUS MEMENUHI STANDAR SERTA YANG AMAN.
2. ALAT YANG DIGUNAKAN TIDAK TERGOLONG TUA (KOMPONEN SUDAH TIDAK SESUAI DGN SPESIFIKASI TEKNISNYA),
3. KOMPONEN DENGAN UTILITAS RENDAH (SEPERTI TABUNG VAKUM), SEBAIKNYA DIGANTI.
4. BILA MUNGKIN HARUS ADA SEORANG AHLI LISTRIK UNTUK MENGATAKAN LAYAK TIDAKNYA PEMAKAIAN.
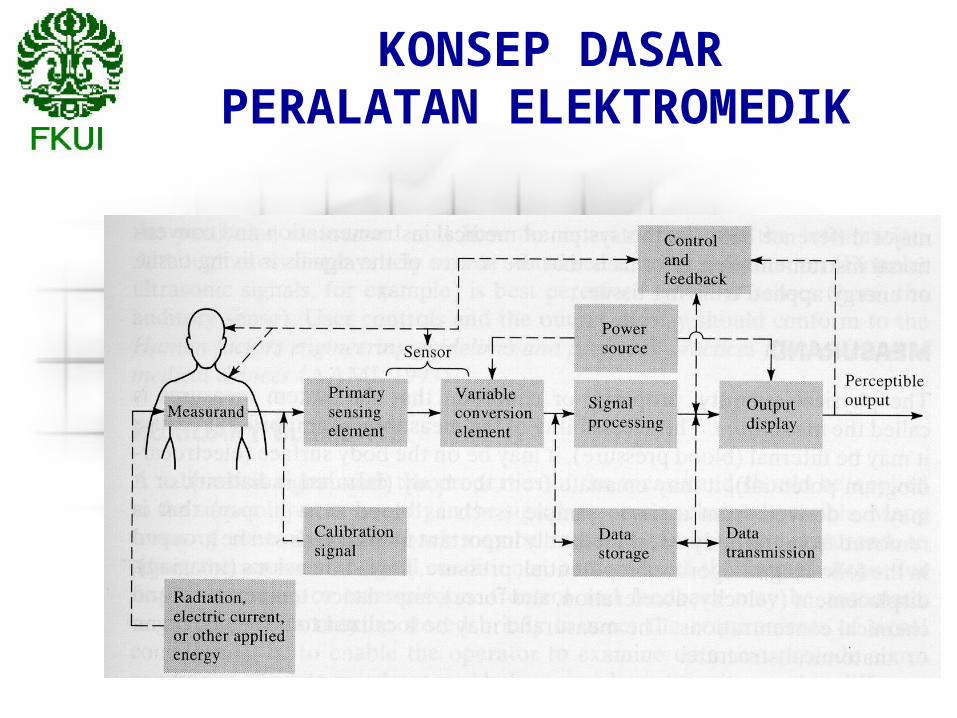
KONSEP DASARPERALATAN ELEKTROMEDIK

KONSEP DASARPERALATAN ELEKTROMEDIK

KONSEP DASARPERALATAN ELEKTROMEDIK
A/D Converter: Resolution

Resolution – Degree to which a measurand can be broken into identifiable adjacent parts ex pictures dpi (dots per square inch)
Another Example is the number of levels of resolution ex multimeter or binary data word
More Resolution Less Resolution
1
2
3
11.5
2.52
3
Binary Resolution if you have 8 Bit that will represent 10 V what is the resolution of the system? Resolution = 10 – 0 / 255 = 39 mV per bit8 bits gives you 28 = 256 values or 256 -1 = 255 segments
Implementasi pada Gambar Digital

• Sensitivity is the minimum input parameter that creates a detectable output change
• Precision is the degree of reproducibility of the measurements
• Resolution is the smallest detectable incremental input parameter that can be detected in the output signal
• Accuracy is the maximum difference between the actual value and the indicated value
Faktor-faktor yang mempengaruhi

Analog vs Digital
Gambar / citra yang dihasilkan peralatan medis dapat berupa gambar dalam bentuk analog ataupun digital.
Agar dapat diolah maupun diproses oleh komputer, gambar-gambar tersebut harus dalam bentuk digital.

Citra Digital
Definisi :
Citra digital adalah hasil penangkapan suatu objek fisik menggunakanperalatan pencitraan digital, dimana setiap bagian dari gambar tersebut direpresentasikan dalam bentuk piksel (picture elements) yang tersusun berdasarkan perbandingan kolom dan baris yang telah ditetapkan sebelumnya.
Keuntungan :
Suatu citra digital dapat diedit, dimanipulasi, dikirim, dihapus, dikopi atau dimasukkan ke berkas komputer lainnya atau ke halaman web.

Citra Digital
Kerugian :
Kualitas Pembesaran Gambar sangat tergantung dari resolusi pengambilan gambar.
Citra digital dapat berupa :• Black and White• Gray scale• Color

MEDICAL IMAGES
• One-dimentional Signals
• Two-dimentional Images
• Three-Dimentional Images
• Four-Dimentional Images
• Five- or Higher-Dimentional?

Konsep Dasar Pengambilan Gambar

MRI System Block Diagram

• The MRI is a medical diagnostic technique that creates images of the body using the principle of nuclear magnetic resonance.
Magnetic Resonance Image

• This system uses X rays and computers to produce three-dimensional images of the human body. It provides detailed views of the body’s soft tissues, including blood vessels, muscle tissue, and organs, such as the brain.
Computed Axial Tomography