Monnet Ispat, 1Q FY 2014
11
Please refer to important disclosures at the end of this report 1 Quarterly highlights (Standalone) Particulars ( ` cr) 1QFY14 1QFY13 yoy (%) 4QFY13 qoq (%) Net sales 470 521 (9.7) 432 8.7 EBITDA 115 136 (15.7) 107 7.3 EBITDA margin (%) 24.4 26.1 (171)bp 24.7 (32)bp Net profit 52 69 (23.4) 53 (1.0) Source: Compa ny, Angel Research For 1QFY2014, Monnet Ispat (MIL) reported a decline in operating profit due to lower realizations. We maintain our Buy rating on the stock. Lower realizations dent top-line: MIL’s net sales declined by 9.7% yoy to ` 470cr, mainly due to lower realizations from steel and sponge iron segments which although was partially offset by higher volumes. Sponge iron and steel sales volumes increased by 6.4% and 2.1% yoy to 173,084 tonne and 25,916 tonne, respectively. However, sponge iron and steel realisations declined by 17.5% and 14.5% yoy to ` 18,676/tonne and ` 29,574/tonne, respectively. EBITDA declines by 15.7% yoy: Despite net sales declining by 9.7% yoy, other expenditure increased 17.6% yoy to ` 50cr. This led to the EBITDA declining by 15.7% yoy to ` 115cr and EBITDA margin contracted by 171bp yoy to 24.4%. Interest and depreciation expenses grew by 29.5% and 20.2% yoy to ` 39cr and ` 26cr, respectively, on account of capitalization of various projects. Consequently, the net profit decreased by 23.4% yoy to ` 52cr. Outlook and valuation: MIL is on the verge of a massive expansion in its steel business. The long-term stock performance will be determined by the timely expansion of the 1.5mtpa steel plant and unlocking of value in Monnet Power, which is implementing the 1,050MW power project. Although there have been delays in the commencement of these projects, most of these projects would be backed by captive resources, thus ensuring robust profitability. Hence, we recommend Buy on the stock with a target price of ` 139, valuing the steel business at 4.0x FY2015E EV/EBITDA and investment in Monnet Power at 0.6x P/BV. Key financials (Standalone) Y/E March ( ` cr) FY2012 FY2013E FY2014E FY2015E Net sales 1,897 1,957 2,199 2,575 % chg 20.6 3.2 12.3 17.1 Adj. net profit 289 250 206 259 % chg 2.7 (13.3) (17.8) 25.7 EPS ( ` ) 44.9 37.4 30.7 38.6 EBITDA margin (%) 25.0 25.4 21.5 22.8 P/E (x) 2.1 2.6 3.1 2.5 P/BV (x) 0.3 0.2 0.2 0.2 RoE (%) 13.0 10.1 7.7 8.9 RoCE (%) 7.2 6.2 5.4 7.1 EV/Sales (x) 1.6 1.6 1.3 1.0 EV/EBITDA (x) 6.3 6.5 6.2 4.5 Source: Compa ny, Angel Research: N ote: CMP as of 19 th August 2013 BUY CMP ` 96 Target Price ` 139 Investment Period 12 Months Stock Info Sector Net Debt ( ` cr) 2,370 Bloomberg Code Shareholding Pattern (%) Promoters 49.9 MF / Banks / Indian Fls 1. 0 FII / NRIs / OCBs 38.9 Indian Public / Others 10.1 Abs. (%) 3m 1yr 3yr Sensex ( 9.8) 3.5 (0.8) MIL (48.7) ( 68.3) 3. 5 Face Value ( ` ) BSE Sensex Nifty Reuters Code 609 0.6 324/93 1,505 Steel Avg. D aily Volume Market Cap ( ` cr) Beta 52 Week High / Low MISP@IN 10 18,308 5,415 MNET.BO Bhavesh Chauhan Tel: 022- 39357800 Ext: 6821 [email protected] Vinay Rachh Tel: 022- 39357800 Ext: 6841 [email protected] Monnet Ispat Performance highlights 1QFY2014 Result Update | Steel August 20, 20 13
-
Upload
angel-broking -
Category
Documents
-
view
229 -
download
0
Transcript of Monnet Ispat, 1Q FY 2014
7/27/2019 Monnet Ispat, 1Q FY 2014
http://slidepdf.com/reader/full/monnet-ispat-1q-fy-2014 1/10
Please refer to important disclosures at the end of this report 1
Quarterly highlights (Standalone)
Particulars (` cr) 1QFY14 1QFY13 yoy (%) 4QFY13 qoq (%)
Net sales 470 521 (9.7) 432 8.7
EBITDA 115 136 (15.7) 107 7.3
EBITDA margin (%) 24.4 26.1 (171)bp 24.7 (32)bp
Net profit 52 69 (23.4) 53 (1.0)
Source: Company, Angel Research
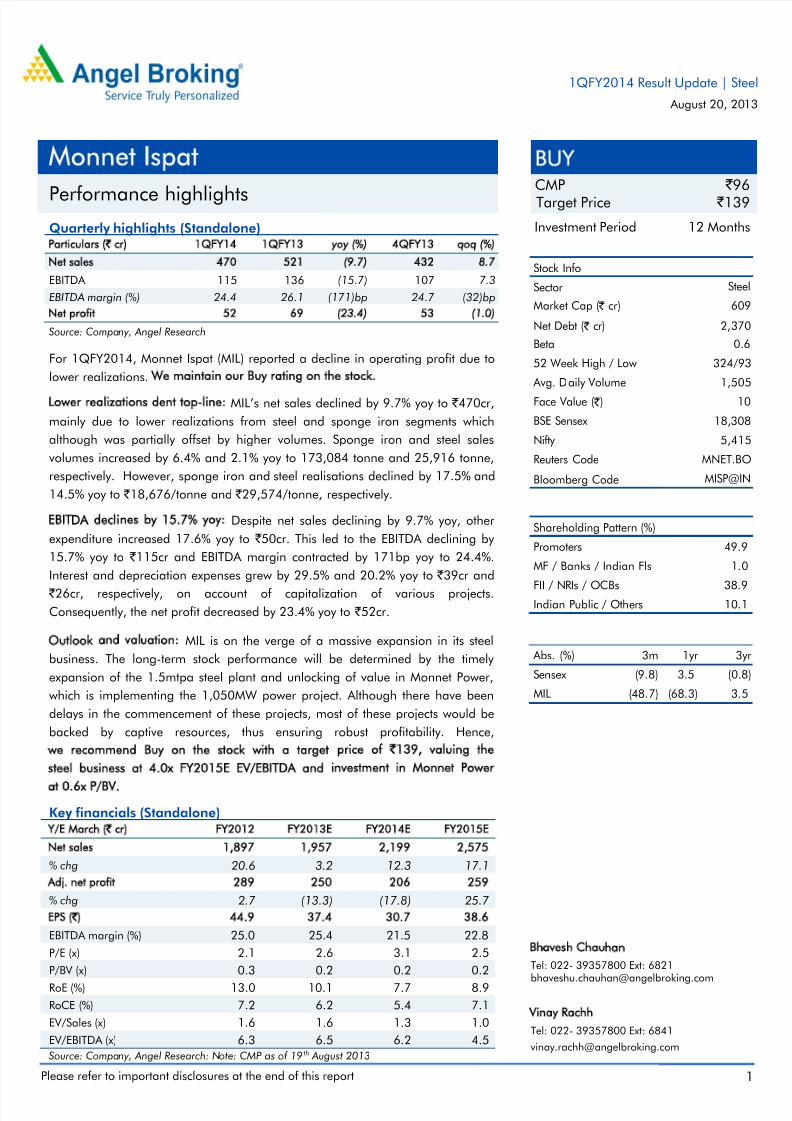
For 1QFY2014, Monnet Ispat (MIL) reported a decline in operating profit due to
lower realizations. We maintain our Buy rating on the stock.
Lower realizations dent top-line: MIL’s net sales declined by 9.7% yoy to ` 470cr,
mainly due to lower realizations from steel and sponge iron segments which
although was partially offset by higher volumes. Sponge iron and steel sales
volumes increased by 6.4% and 2.1% yoy to 173,084 tonne and 25,916 tonne,
respectively. However, sponge iron and steel realisations declined by 17.5% and
14.5% yoy to ` 18,676/tonne and ` 29,574/tonne, respectively.
EBITDA declines by 15.7% yoy: Despite net sales declining by 9.7% yoy, other
expenditure increased 17.6% yoy to ` 50cr. This led to the EBITDA declining by
15.7% yoy to ` 115cr and EBITDA margin contracted by 171bp yoy to 24.4%.
Interest and depreciation expenses grew by 29.5% and 20.2% yoy to ` 39cr and
` 26cr, respectively, on account of capitalization of various projects.
Consequently, the net profit decreased by 23.4% yoy to ` 52cr.
Outlook and valuation: MIL is on the verge of a massive expansion in its steel
business. The long-term stock performance will be determined by the timely
expansion of the 1.5mtpa steel plant and unlocking of value in Monnet Power,
which is implementing the 1,050MW power project. Although there have been
delays in the commencement of these projects, most of these projects would be
backed by captive resources, thus ensuring robust profitability. Hence,
we recommend Buy on the stock with a target price of `139, valuing the
steel business at 4.0x FY2015E EV/EBITDA and investment in Monnet Power
at 0.6x P/BV.
Key financials (Standalone)
Y/E March (` cr) FY2012 FY2013E FY2014E FY2015E
Net sales 1,897 1,957 2,199 2,575
% chg 20.6 3.2 12.3 17.1
Adj. net profit 289 250 206 259
% chg 2.7 (13.3) (17.8) 25.7
EPS (`) 44.9 37.4 30.7 38.6
EBITDA margin (%) 25.0 25.4 21.5 22.8
P/E (x) 2.1 2.6 3.1 2.5
P/BV (x) 0.3 0.2 0.2 0.2
RoE (%) 13.0 10.1 7.7 8.9
RoCE (%) 7.2 6.2 5.4 7.1
EV/Sales (x) 1.6 1.6 1.3 1.0
EV/EBITDA (x) 6.3 6.5 6.2 4.5
Source: Company, Angel Research: Note: CMP as of 19th August 2013
BUYCMP ` 96
Target Price ` 139
Investment Period 12 Months
Stock Info
Sector
Net Debt ( ` cr) 2,370
Bloomberg Code
Shareholding Pattern (%)
Promoters 49.9
MF / Banks / Indian Fls 1.0
FII / NRIs / OCBs 38.9 Indian Public / Others 10.1
Abs. (%) 3m 1yr 3yr
Sensex (9.8) 3.5 (0.8)
MIL (48.7) (68.3) 3.5
Face Value ( ` )
BSE Sensex
Nifty
Reuters Code
609
0.6
324/93
1,505
Steel
Avg. Daily Volume
Market Cap ( ` cr)
Beta
52 Week High / Low
MISP@IN
10
18,308
5,415
MNET.BO
Bhavesh Chauhan
Tel: 022- 39357800 Ext: 6821
Vinay Rachh
Tel: 022- 39357800 Ext: 6841
Monnet Ispat
Performance highlights
1QFY2014 Result Update | Steel
August 20, 2013
7/27/2019 Monnet Ispat, 1Q FY 2014
http://slidepdf.com/reader/full/monnet-ispat-1q-fy-2014 2/10
Monnet Ispat | 1QFY2014 Result Update
August 20, 2013 2
Exhibit 1: 1QFY2014 performance (Standalone)
(` cr) 1QFY14 1QFY13 % yoy 4QFY13 % qoq FY2013 FY2012 % yoy
Net sales 470 521 (9.7) 432 8.7 1,957 1,897 3.2
Raw material 289 323 (10.6) 257 12.3 1,174 1,142 2.9% of net sales 61.4 62.0 59.5 60.0 60.2
Staff cost 27 25 6.5 29 (6.1) 108 95 14.7
% of net sales 5.7 4.8 6.6 5.5 5.0
Other expenditure 50 42 17.6 45 10.6 199 186 6.7
% of net sales 10.6 8.2 10.5 10.2 9.8
Total expenditure 365 390 (6.4) 331 10.4 1,482 1,423 4.2
% of net sales 77.8 75.0 76.6 75.7 75.0
Operating profit 104 130 (19.7) 101 3.1 476 475 0.2
OPM (%) 22.2 25.0 23.4 24.3 25.0
Other operating income 10 6 75.3 6 - 22 0 -
EBIDTA 115 136 (15.7) 107 7.3 498 475 4.9
EBITDA margins (%) 24.4 26.1 24.7 25.4 25.0
Interest 39 30 29.5 30 31.1 119 87 37.5
Depreciation 26 22 20.2 23 16.8 89 74 20.0
Other income 24 6 329.5 25 (6.5) 49 63 (23.0)
Exceptional items 0 0 0 0 (1) (100.0)
Profit before tax 72 89 (18.6) 79 (8.8) 338 377 (10.2)
% of net sales 15.4 17.1 18.4 17.3 19.9
Tax 20 21 (2.8) 26 (24.5) 88 88 (0.1)
% of PBT 27.6 23.1 33.3 26.0 23.4
Profit after tax 52 69 (23.4) 53 (1.0) 250 289 (13.3)
Source: Company, Angel Research
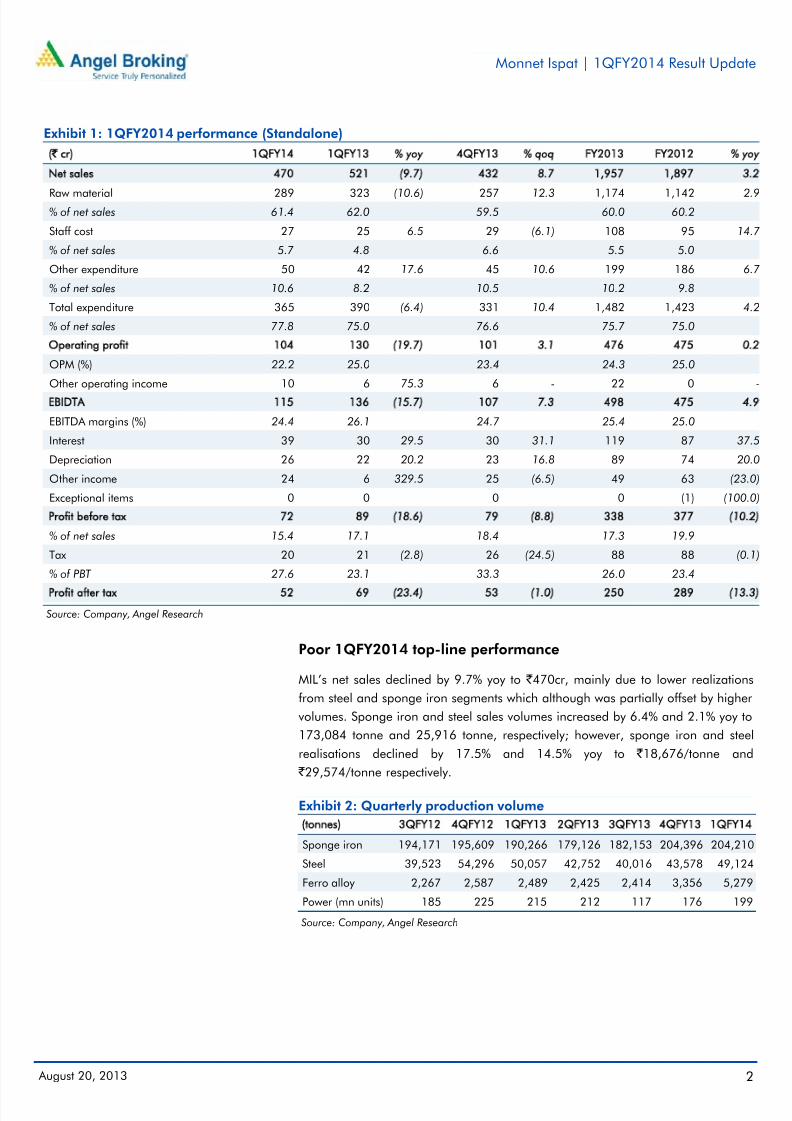
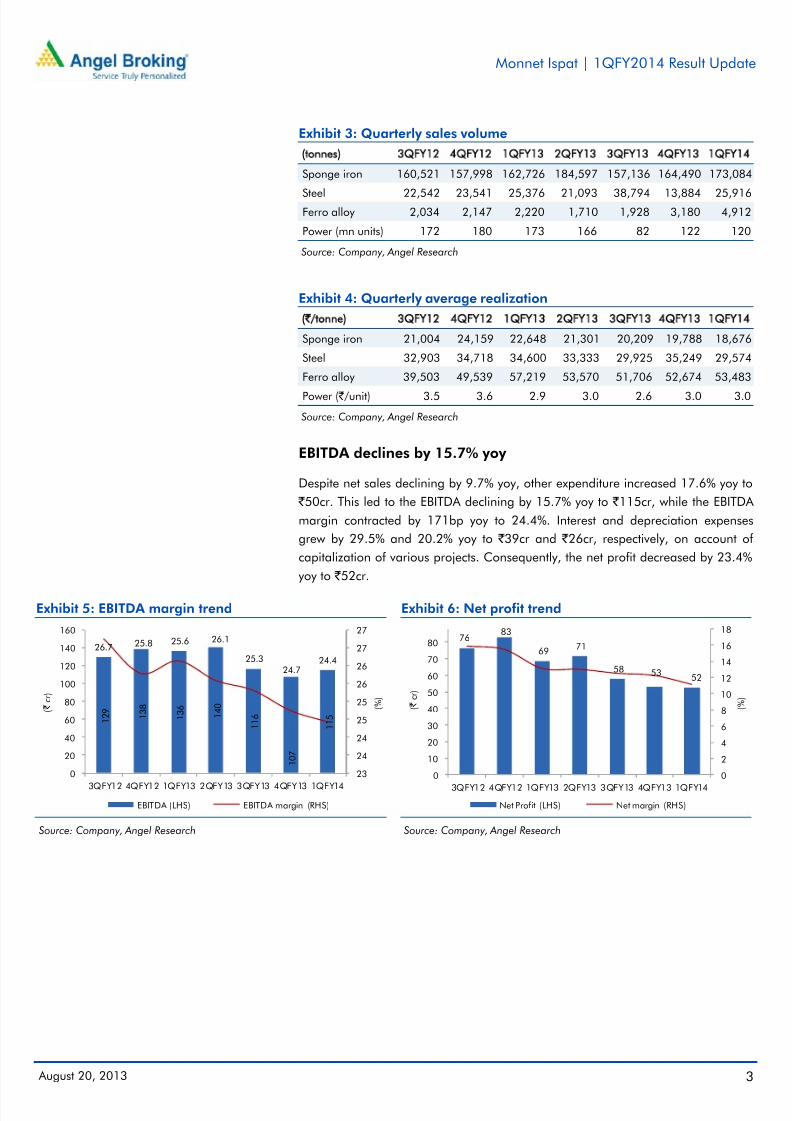
Poor 1QFY2014 top-line performance
MIL’s net sales declined by 9.7% yoy to ` 470cr, mainly due to lower realizations
from steel and sponge iron segments which although was partially offset by higher
volumes. Sponge iron and steel sales volumes increased by 6.4% and 2.1% yoy to
173,084 tonne and 25,916 tonne, respectively; however, sponge iron and steel
realisations declined by 17.5% and 14.5% yoy to ` 18,676/tonne and
` 29,574/tonne respectively.
Exhibit 2: Quarterly production volume
(tonnes) 3QFY12 4QFY12 1QFY13 2QFY13 3QFY13 4QFY13 1QFY14
Sponge iron 194,171 195,609 190,266 179,126 182,153 204,396 204,210
Steel 39,523 54,296 50,057 42,752 40,016 43,578 49,124
Ferro alloy 2,267 2,587 2,489 2,425 2,414 3,356 5,279
Power (mn units) 185 225 215 212 117 176 199
Source: Company, Angel Research
7/27/2019 Monnet Ispat, 1Q FY 2014
http://slidepdf.com/reader/full/monnet-ispat-1q-fy-2014 3/10
Monnet Ispat | 1QFY2014 Result Update
August 20, 2013 3
Exhibit 3: Quarterly sales volume
(tonnes) 3QFY12 4QFY12 1QFY13 2QFY13 3QFY13 4QFY13 1QFY14
Sponge iron 160,521 157,998 162,726 184,597 157,136 164,490 173,084
Steel 22,542 23,541 25,376 21,093 38,794 13,884 25,916Ferro alloy 2,034 2,147 2,220 1,710 1,928 3,180 4,912
Power (mn units) 172 180 173 166 82 122 120
Source: Company, Angel Research
Exhibit 4: Quarterly average realization
(`/tonne) 3QFY12 4QFY12 1QFY13 2QFY13 3QFY13 4QFY13 1QFY14
Sponge iron 21,004 24,159 22,648 21,301 20,209 19,788 18,676
Steel 32,903 34,718 34,600 33,333 29,925 35,249 29,574
Ferro alloy 39,503 49,539 57,219 53,570 51,706 52,674 53,483
Power ( ` /unit) 3.5 3.6 2.9 3.0 2.6 3.0 3.0
Source: Company, Angel Research
EBITDA declines by 15.7% yoy
Despite net sales declining by 9.7% yoy, other expenditure increased 17.6% yoy to
` 50cr. This led to the EBITDA declining by 15.7% yoy to ` 115cr, while the EBITDA
margin contracted by 171bp yoy to 24.4%. Interest and depreciation expenses
grew by 29.5% and 20.2% yoy to ` 39cr and ` 26cr, respectively, on account of
capitalization of various projects. Consequently, the net profit decreased by 23.4%
yoy to ` 52cr.
Exhibit 5: EBITDA margin trend
Source: Company, Angel Research
Exhibit 6: Net profit trend
Source: Company, Angel Research
1 2 9
1 3 8
1 3 6
1 4 0
1 1 6
1 0 7
1 1 5
26.7 25.8 26.125.6
25.3
24.724.4
23
24
24
25
25
26
26
27
27
0
20
40
60
80
100
120
140
160
3QFY12 4QFY12 1QFY13 2QFY13 3QFY13 4QFY13 1QFY14
( % )
( ` c
r )
EBITDA (LHS) EBITDA margin (RHS)
7683
6971
58 5352
0
2
4
6
8
10
12
14
16
18
0
10
20
30
40
50
60
70
80
3QFY12 4QFY12 1QFY13 2QFY13 3QFY13 4QFY13 1QFY14
( % )
( ` c
r )
Net Profit (LHS) Net margin (RHS)
7/27/2019 Monnet Ispat, 1Q FY 2014
http://slidepdf.com/reader/full/monnet-ispat-1q-fy-2014 4/10
Monnet Ispat | 1QFY2014 Result Update
August 20, 2013 4
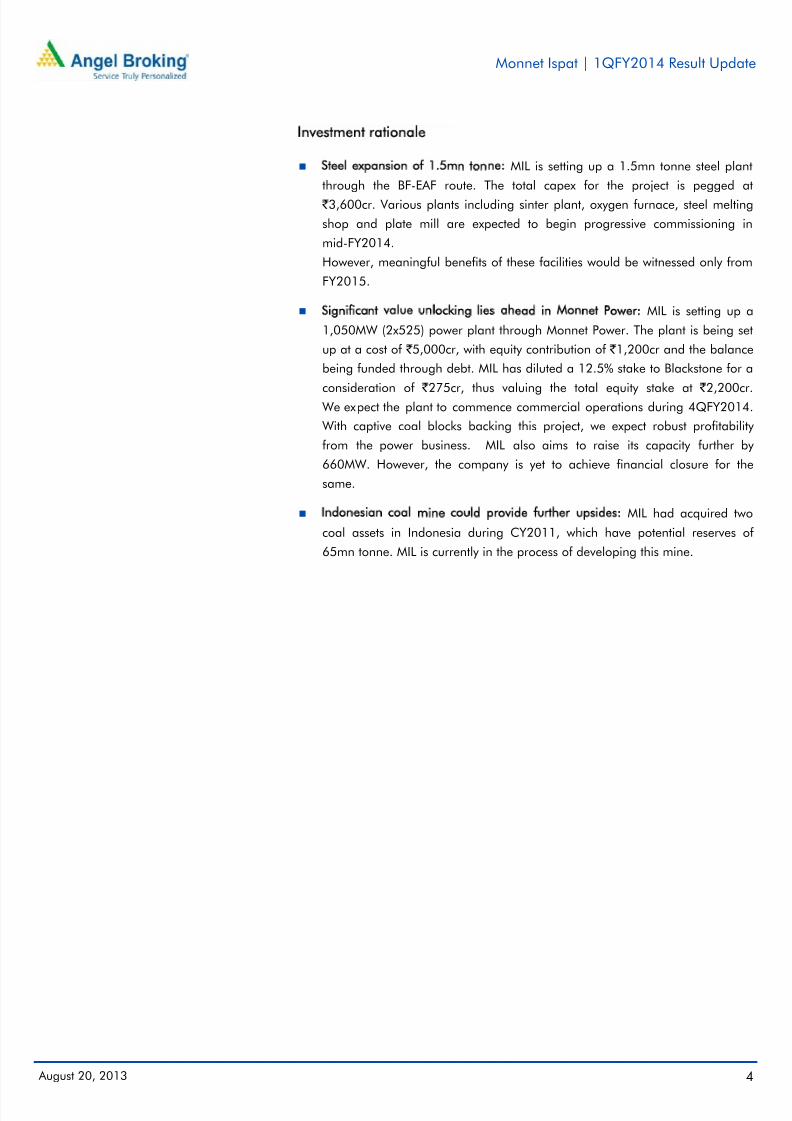
Investment rationale Steel expansion of 1.5mn tonne: MIL is setting up a 1.5mn tonne steel plant
through the BF-EAF route. The total capex for the project is pegged at
` 3,600cr. Various plants including sinter plant, oxygen furnace, steel melting
shop and plate mill are expected to begin progressive commissioning in
mid-FY2014.
However, meaningful benefits of these facilities would be witnessed only from
FY2015.
Significant value unlocking lies ahead in Monnet Power: MIL is setting up a
1,050MW (2x525) power plant through Monnet Power. The plant is being set
up at a cost of ` 5,000cr, with equity contribution of ` 1,200cr and the balance
being funded through debt. MIL has diluted a 12.5% stake to Blackstone for a
consideration of `
275cr, thus valuing the total equity stake at `
2,200cr. We expect the plant to commence commercial operations during 4QFY2014.
With captive coal blocks backing this project, we expect robust profitability
from the power business. MIL also aims to raise its capacity further by
660MW. However, the company is yet to achieve financial closure for the
same.
Indonesian coal mine could provide further upsides: MIL had acquired two
coal assets in Indonesia during CY2011, which have potential reserves of
65mn tonne. MIL is currently in the process of developing this mine.
7/27/2019 Monnet Ispat, 1Q FY 2014
http://slidepdf.com/reader/full/monnet-ispat-1q-fy-2014 5/10
Monnet Ispat | 1QFY2014 Result Update
August 20, 2013 5
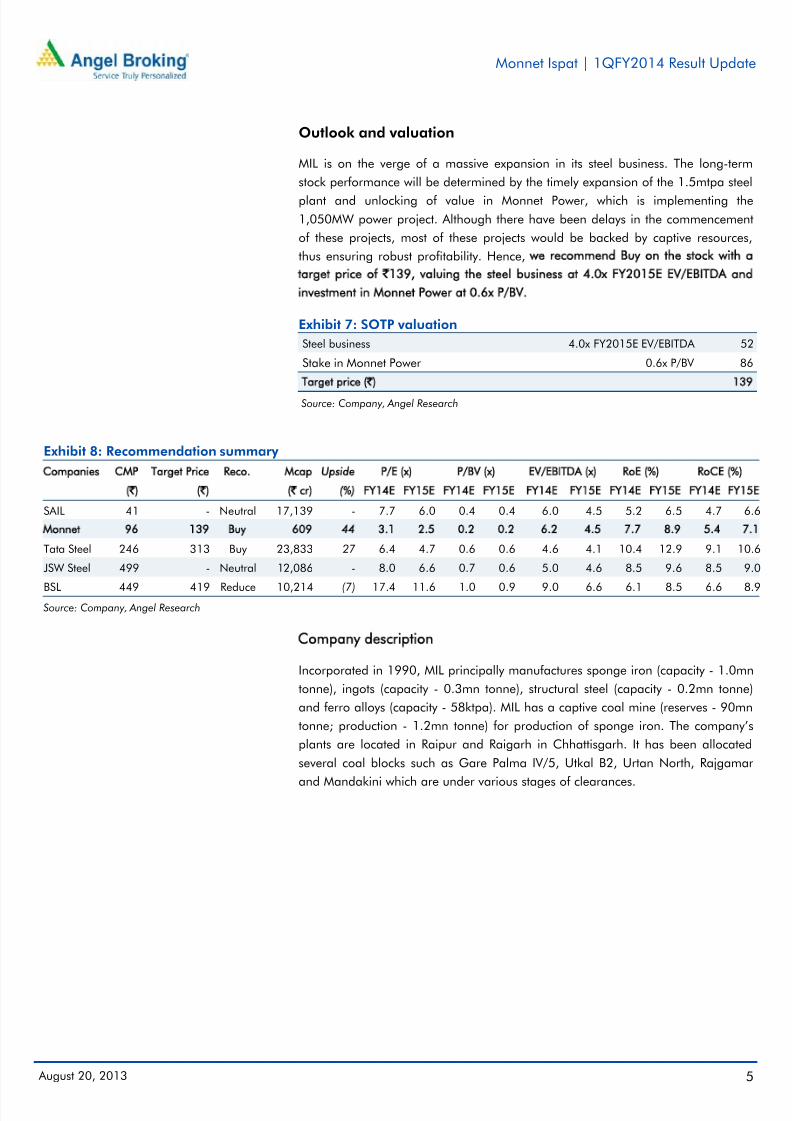
Outlook and valuation
MIL is on the verge of a massive expansion in its steel business. The long-term
stock performance will be determined by the timely expansion of the 1.5mtpa steel
plant and unlocking of value in Monnet Power, which is implementing the
1,050MW power project. Although there have been delays in the commencement
of these projects, most of these projects would be backed by captive resources,
thus ensuring robust profitability. Hence, we recommend Buy on the stock with a
target price of `139, valuing the steel business at 4.0x FY2015E EV/EBITDA and
investment in Monnet Power at 0.6x P/BV.
Exhibit 7: SOTP valuation
Steel business 4.0x FY2015E EV/EBITDA 52
Stake in Monnet Power 0.6x P/BV 86
Target price (`) 139
Source: Company, Angel Research
Exhibit 8: Recommendation summary
Companies CMP Target Price Reco. Mcap Upside P/E (x) P/BV (x) EV/EBITDA (x) RoE (%) RoCE (%)
(`) (`)
(` cr) (%) FY14E FY15E FY14E FY15E FY14E FY15E FY14E FY15E FY14E FY15E
SAIL 41 - Neutral 17,139 - 7.7 6.0 0.4 0.4 6.0 4.5 5.2 6.5 4.7 6.6
Monnet 96 139 Buy 609 44 3.1 2.5 0.2 0.2 6.2 4.5 7.7 8.9 5.4 7.1
Tata Steel 246 313 Buy 23,833 27 6.4 4.7 0.6 0.6 4.6 4.1 10.4 12.9 9.1 10.6
JSW Steel 499 - Neutral 12,086 - 8.0 6.6 0.7 0.6 5.0 4.6 8.5 9.6 8.5 9.0
BSL 449 419 Reduce 10,214 (7) 17.4 11.6 1.0 0.9 9.0 6.6 6.1 8.5 6.6 8.9
Source: Company, Angel Research
Company description
Incorporated in 1990, MIL principally manufactures sponge iron (capacity - 1.0mn
tonne), ingots (capacity - 0.3mn tonne), structural steel (capacity - 0.2mn tonne)
and ferro alloys (capacity - 58ktpa). MIL has a captive coal mine (reserves - 90mn
tonne; production - 1.2mn tonne) for production of sponge iron. The company’s
plants are located in Raipur and Raigarh in Chhattisgarh. It has been allocated
several coal blocks such as Gare Palma IV/5, Utkal B2, Urtan North, Rajgamar
and Mandakini which are under various stages of clearances.
7/27/2019 Monnet Ispat, 1Q FY 2014
http://slidepdf.com/reader/full/monnet-ispat-1q-fy-2014 6/10
Monnet Ispat | 1QFY2014 Result Update
August 20, 2013 6
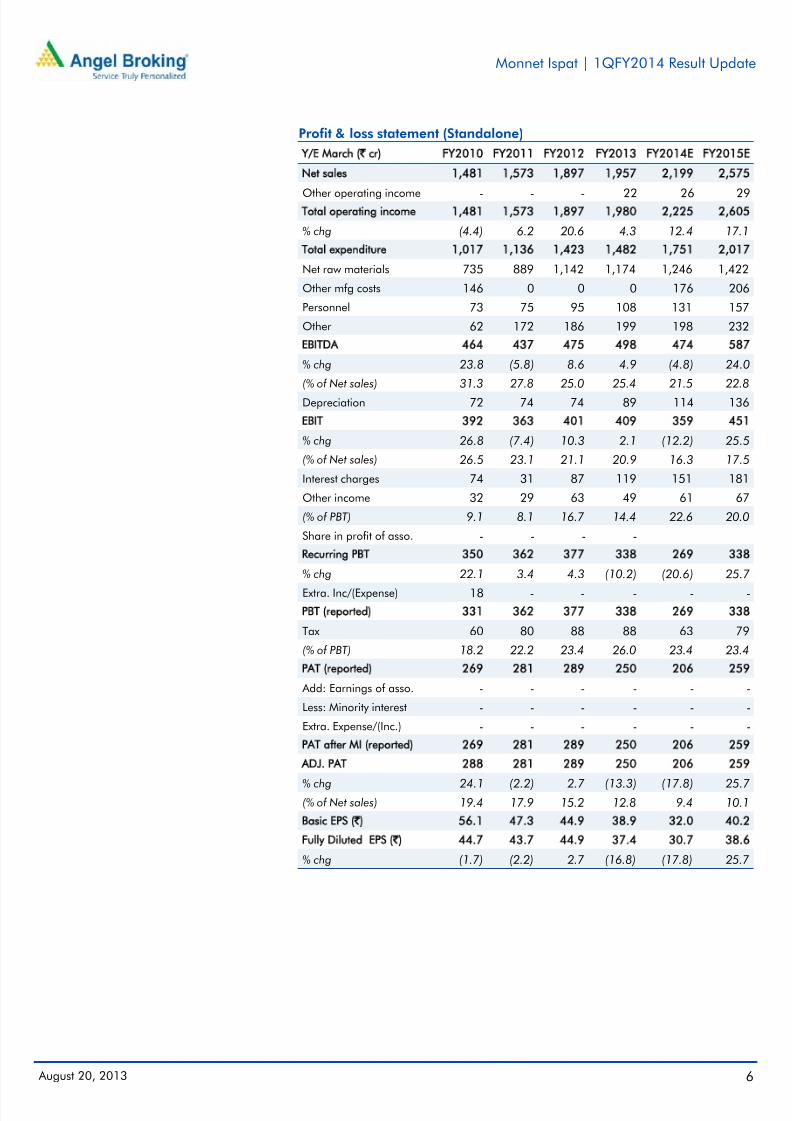
Profit & loss statement (Standalone)
Y/E March (` cr) FY2010 FY2011 FY2012 FY2013 FY2014E FY2015E
Net sales 1,481 1,573 1,897 1,957 2,199 2,575
Other operating income - - - 22 26 29Total operating income 1,481 1,573 1,897 1,980 2,225 2,605
% chg (4.4) 6.2 20.6 4.3 12.4 17.1
Total expenditure 1,017 1,136 1,423 1,482 1,751 2,017
Net raw materials 735 889 1,142 1,174 1,246 1,422
Other mfg costs 146 0 0 0 176 206
Personnel 73 75 95 108 131 157
Other 62 172 186 199 198 232
EBITDA 464 437 475 498 474 587
% chg 23.8 (5.8) 8.6 4.9 (4.8) 24.0
(% of Net sales) 31.3 27.8 25.0 25.4 21.5 22.8
Depreciation 72 74 74 89 114 136
EBIT 392 363 401 409 359 451
% chg 26.8 (7.4) 10.3 2.1 (12.2) 25.5
(% of Net sales) 26.5 23.1 21.1 20.9 16.3 17.5
Interest charges 74 31 87 119 151 181
Other income 32 29 63 49 61 67
(% of PBT) 9.1 8.1 16.7 14.4 22.6 20.0
Share in profit of asso. - - - -
Recurring PBT 350 362 377 338 269 338
% chg 22.1 3.4 4.3 (10.2) (20.6) 25.7
Extra. Inc/(Expense) 18 - - - - -
PBT (reported) 331 362 377 338 269 338
Tax 60 80 88 88 63 79
(% of PBT) 18.2 22.2 23.4 26.0 23.4 23.4
PAT (reported) 269 281 289 250 206 259
Add: Earnings of asso. - - - - - -
Less: Minority interest - - - - - -
Extra. Expense/(Inc.) - - - - - -
PAT after MI (reported) 269 281 289 250 206 259
ADJ. PAT 288 281 289 250 206 259
% chg 24.1 (2.2) 2.7 (13.3) (17.8) 25.7(% of Net sales) 19.4 17.9 15.2 12.8 9.4 10.1
Basic EPS (`) 56.1 47.3 44.9 38.9 32.0 40.2
Fully Diluted EPS (̀ ) 44.7 43.7 44.9 37.4 30.7 38.6
% chg (1.7) (2.2) 2.7 (16.8) (17.8) 25.7
7/27/2019 Monnet Ispat, 1Q FY 2014
http://slidepdf.com/reader/full/monnet-ispat-1q-fy-2014 7/10
Monnet Ispat | 1QFY2014 Result Update
August 20, 2013 7
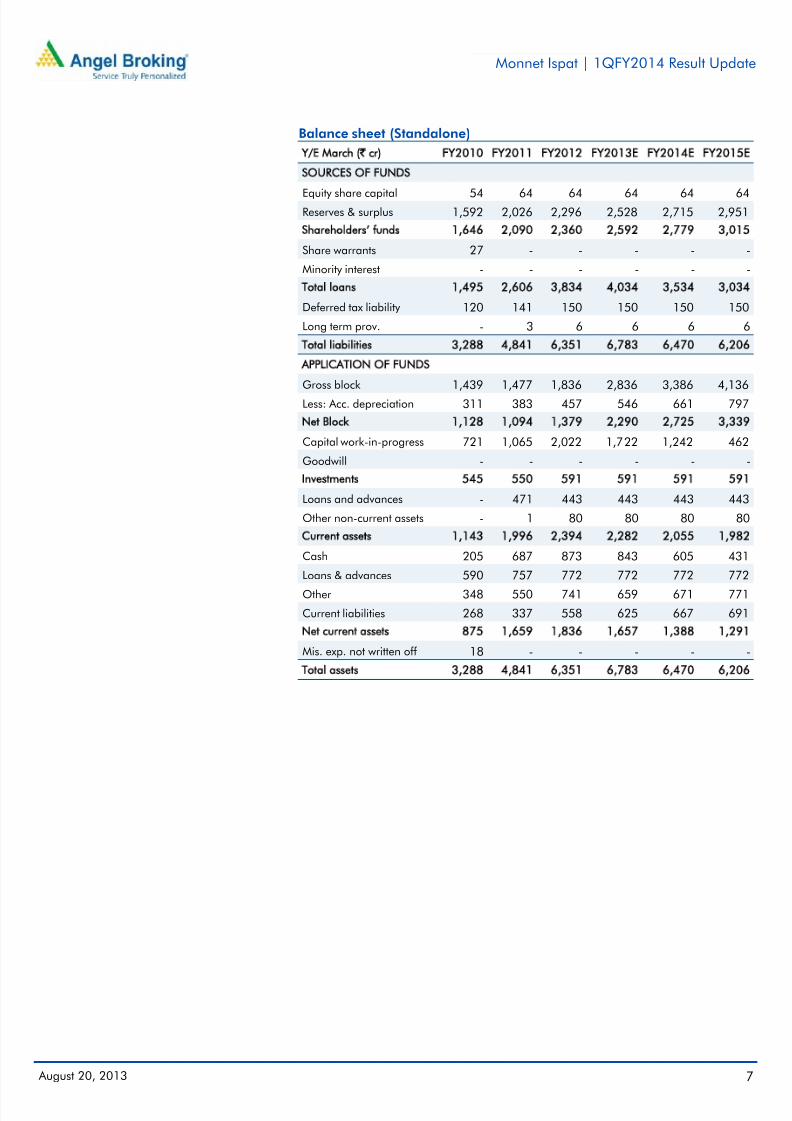
Balance sheet (Standalone)
Y/E March (` cr) FY2010 FY2011 FY2012 FY2013E FY2014E FY2015E
SOURCES OF FUNDS
Equity share capital 54 64 64 64 64 64Reserves & surplus 1,592 2,026 2,296 2,528 2,715 2,951
Shareholders’ funds 1,646 2,090 2,360 2,592 2,779 3,015
Share warrants 27 - - - - -
Minority interest - - - - - -
Total loans 1,495 2,606 3,834 4,034 3,534 3,034
Deferred tax liability 120 141 150 150 150 150
Long term prov. - 3 6 6 6 6
Total liabilities 3,288 4,841 6,351 6,783 6,470 6,206
APPLICATION OF FUNDS
Gross block 1,439 1,477 1,836 2,836 3,386 4,136
Less: Acc. depreciation 311 383 457 546 661 797
Net Block 1,128 1,094 1,379 2,290 2,725 3,339
Capital work-in-progress 721 1,065 2,022 1,722 1,242 462
Goodwill - - - - - -
Investments 545 550 591 591 591 591
Loans and advances - 471 443 443 443 443
Other non-current assets - 1 80 80 80 80
Current assets 1,143 1,996 2,394 2,282 2,055 1,982
Cash 205 687 873 843 605 431
Loans & advances 590 757 772 772 772 772
Other 348 550 741 659 671 771
Current liabilities 268 337 558 625 667 691
Net current assets 875 1,659 1,836 1,657 1,388 1,291
Mis. exp. not written off 18 - - - - -
Total assets 3,288 4,841 6,351 6,783 6,470 6,206
7/27/2019 Monnet Ispat, 1Q FY 2014
http://slidepdf.com/reader/full/monnet-ispat-1q-fy-2014 8/10
Monnet Ispat | 1QFY2014 Result Update
August 20, 2013 8
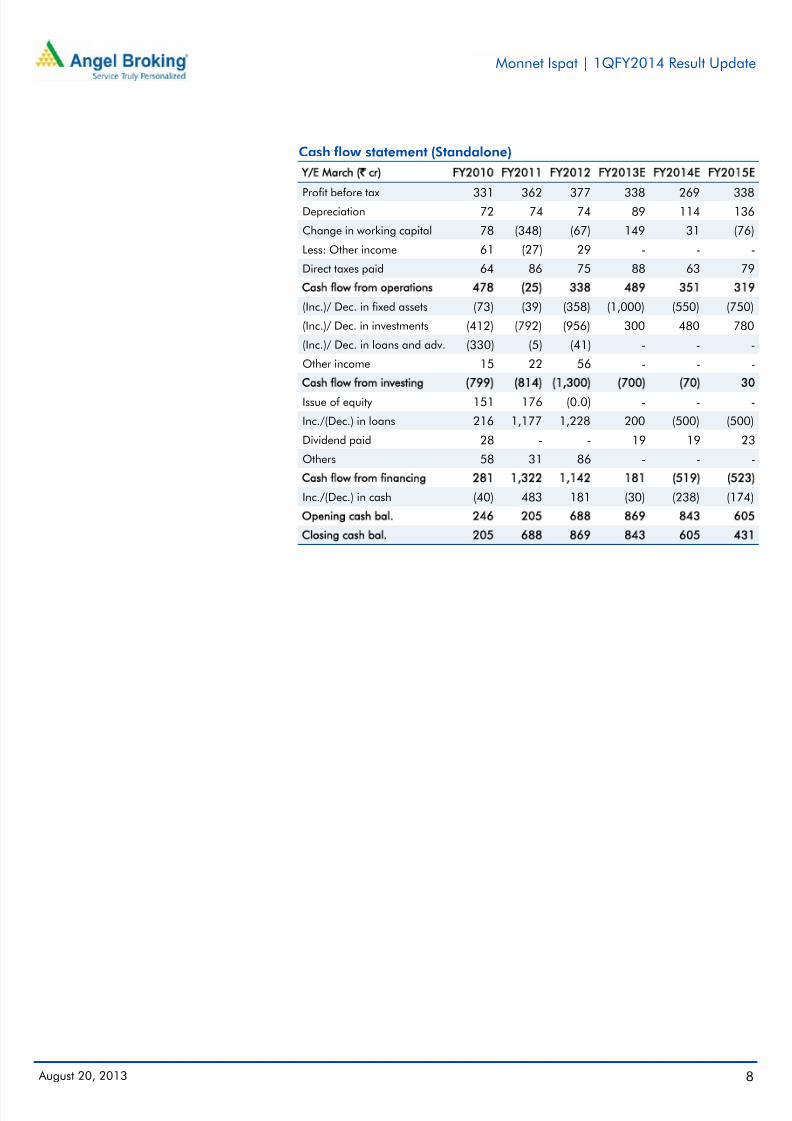
Cash flow statement (Standalone)
Y/E March (` cr) FY2010 FY2011 FY2012 FY2013E FY2014E FY2015E
Profit before tax 331 362 377 338 269 338Depreciation 72 74 74 89 114 136
Change in working capital 78 (348) (67) 149 31 (76)
Less: Other income 61 (27) 29 - - -
Direct taxes paid 64 86 75 88 63 79
Cash flow from operations 478 (25) 338 489 351 319
(Inc.)/ Dec. in fixed assets (73) (39) (358) (1,000) (550) (750)
(Inc.)/ Dec. in investments (412) (792) (956) 300 480 780
(Inc.)/ Dec. in loans and adv. (330) (5) (41) - - -
Other income 15 22 56 - - -
Cash flow from investing (799) (814) (1,300) (700) (70) 30
Issue of equity 151 176 (0.0) - - -
Inc./(Dec.) in loans 216 1,177 1,228 200 (500) (500)
Dividend paid 28 - - 19 19 23
Others 58 31 86 - - -
Cash flow from financing 281 1,322 1,142 181 (519) (523)
Inc./(Dec.) in cash (40) 483 181 (30) (238) (174)
Opening cash bal. 246 205 688 869 843 605
Closing cash bal. 205 688 869 843 605 431
7/27/2019 Monnet Ispat, 1Q FY 2014
http://slidepdf.com/reader/full/monnet-ispat-1q-fy-2014 9/10
Monnet Ispat | 1QFY2014 Result Update
August 20, 2013 9
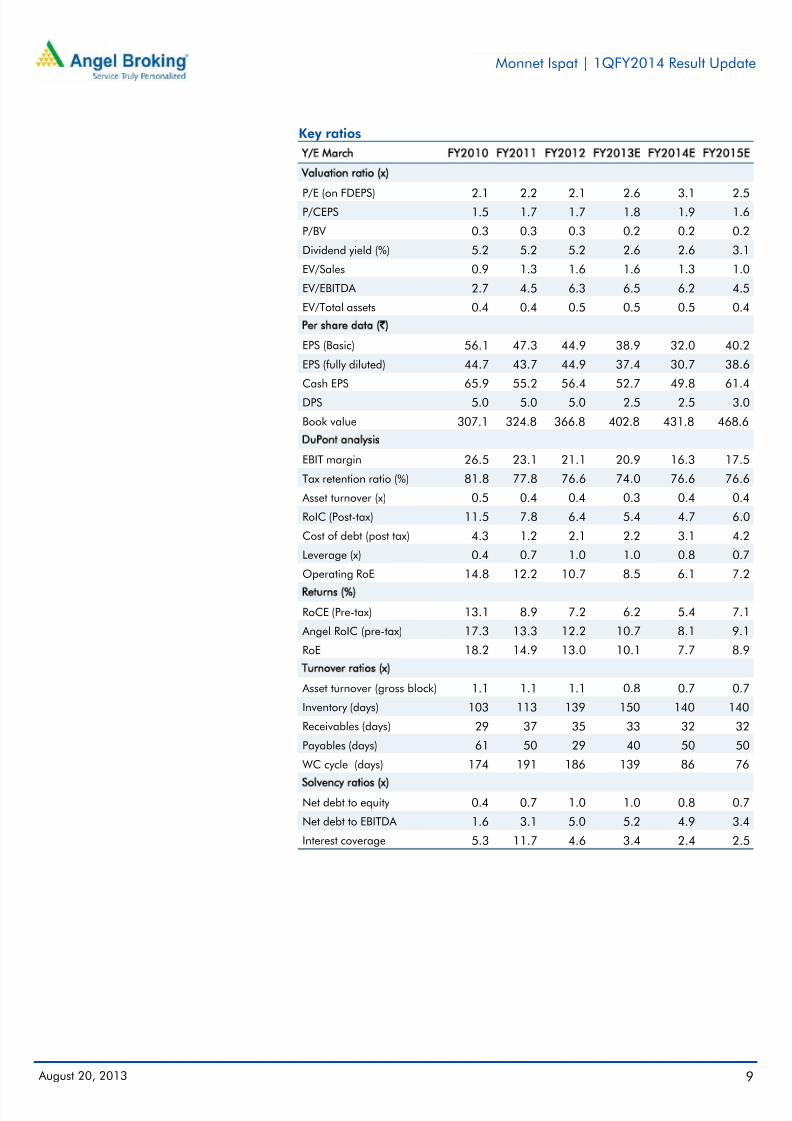
Key ratios
Y/E March FY2010 FY2011 FY2012 FY2013E FY2014E FY2015E
Valuation ratio (x)
P/E (on FDEPS) 2.1 2.2 2.1 2.6 3.1 2.5P/CEPS 1.5 1.7 1.7 1.8 1.9 1.6
P/BV 0.3 0.3 0.3 0.2 0.2 0.2
Dividend yield (%) 5.2 5.2 5.2 2.6 2.6 3.1
EV/Sales 0.9 1.3 1.6 1.6 1.3 1.0
EV/EBITDA 2.7 4.5 6.3 6.5 6.2 4.5
EV/Total assets 0.4 0.4 0.5 0.5 0.5 0.4
Per share data (`)EPS (Basic) 56.1 47.3 44.9 38.9 32.0 40.2
EPS (fully diluted) 44.7 43.7 44.9 37.4 30.7 38.6
Cash EPS 65.9 55.2 56.4 52.7 49.8 61.4
DPS 5.0 5.0 5.0 2.5 2.5 3.0
Book value 307.1 324.8 366.8 402.8 431.8 468.6
DuPont analysis
EBIT margin 26.5 23.1 21.1 20.9 16.3 17.5
Tax retention ratio (%) 81.8 77.8 76.6 74.0 76.6 76.6
Asset turnover (x) 0.5 0.4 0.4 0.3 0.4 0.4
RoIC (Post-tax) 11.5 7.8 6.4 5.4 4.7 6.0
Cost of debt (post tax) 4.3 1.2 2.1 2.2 3.1 4.2
Leverage (x) 0.4 0.7 1.0 1.0 0.8 0.7
Operating RoE 14.8 12.2 10.7 8.5 6.1 7.2
Returns (%)
RoCE (Pre-tax) 13.1 8.9 7.2 6.2 5.4 7.1
Angel RoIC (pre-tax) 17.3 13.3 12.2 10.7 8.1 9.1
RoE 18.2 14.9 13.0 10.1 7.7 8.9
Turnover ratios (x)
Asset turnover (gross block) 1.1 1.1 1.1 0.8 0.7 0.7
Inventory (days) 103 113 139 150 140 140
Receivables (days) 29 37 35 33 32 32
Payables (days) 61 50 29 40 50 50
WC cycle (days) 174 191 186 139 86 76
Solvency ratios (x)Net debt to equity 0.4 0.7 1.0 1.0 0.8 0.7
Net debt to EBITDA 1.6 3.1 5.0 5.2 4.9 3.4
Interest coverage 5.3 11.7 4.6 3.4 2.4 2.5
7/27/2019 Monnet Ispat, 1Q FY 2014
http://slidepdf.com/reader/full/monnet-ispat-1q-fy-2014 10/10
Monnet Ispat | 1QFY2014 Result Update
August 20, 2013 10
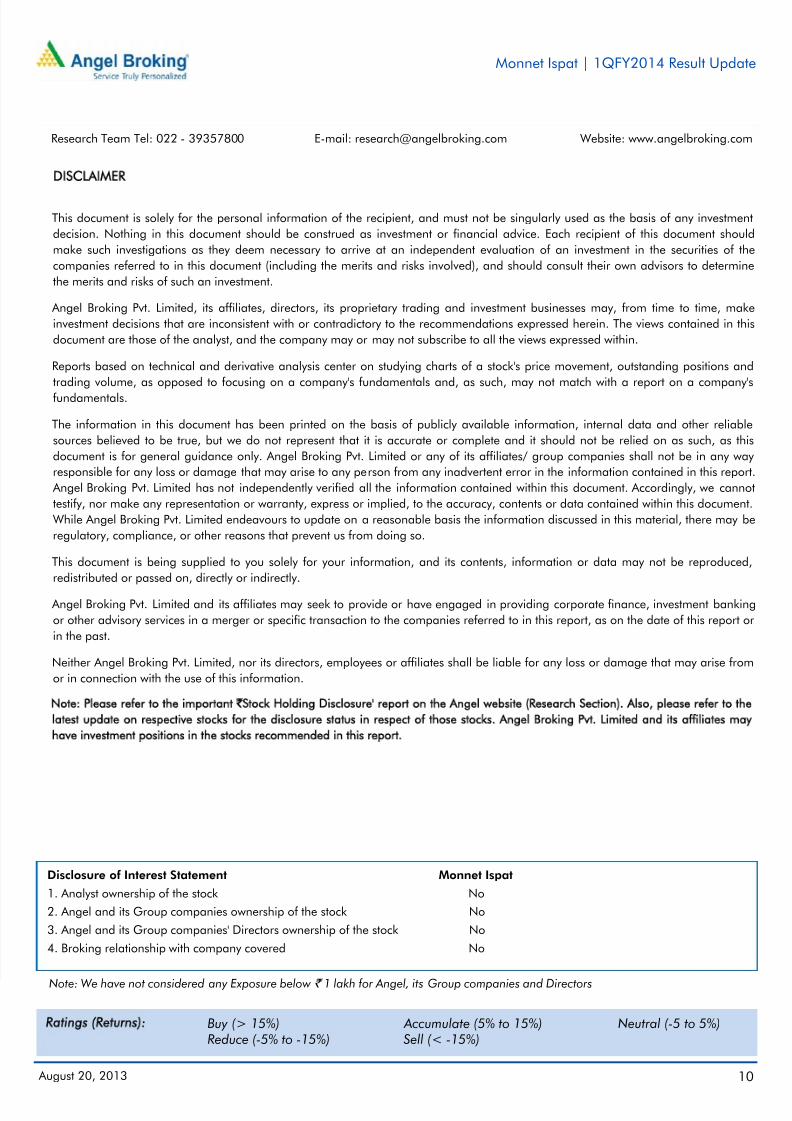
Research Team Tel: 022 - 39357800 E-mail: [email protected] Website: www.angelbroking.com
DISCLAIMER
This document is solely for the personal information of the recipient, and must not be singularly used as the basis of any investment
decision. Nothing in this document should be construed as investment or financial advice. Each recipient of this document should
make such investigations as they deem necessary to arrive at an independent evaluation of an investment in the securities of the
companies referred to in this document (including the merits and risks involved), and should consult their own advisors to determine
the merits and risks of such an investment.
Angel Broking Pvt. Limited, its affiliates, directors, its proprietary trading and investment businesses may, from time to time, make
investment decisions that are inconsistent with or contradictory to the recommendations expressed herein. The views contained in this
document are those of the analyst, and the company may or may not subscribe to all the views expressed within.
Reports based on technical and derivative analysis center on studying charts of a stock's price movement, outstanding positions and
trading volume, as opposed to focusing on a company's fundamentals and, as such, may not match with a report on a company's
fundamentals.
The information in this document has been printed on the basis of publicly available information, internal data and other reliable
sources believed to be true, but we do not represent that it is accurate or complete and it should not be relied on as such, as this
document is for general guidance only. Angel Broking Pvt. Limited or any of its affiliates/ group companies shall not be in any way
responsible for any loss or damage that may arise to any person from any inadvertent error in the information contained in this report.
Angel Broking Pvt. Limited has not independently verified all the information contained within this document. Accordingly, we cannot
testify, nor make any representation or warranty, express or implied, to the accuracy, contents or data contained within this document.
While Angel Broking Pvt. Limited endeavours to update on a reasonable basis the information discussed in this material, there may be
regulatory, compliance, or other reasons that prevent us from doing so.
This document is being supplied to you solely for your information, and its contents, information or data may not be reproduced,
redistributed or passed on, directly or indirectly.
Angel Broking Pvt. Limited and its affiliates may seek to provide or have engaged in providing corporate finance, investment banking
or other advisory services in a merger or specific transaction to the companies referred to in this report, as on the date of this report or
in the past.
Neither Angel Broking Pvt. Limited, nor its directors, employees or affiliates shall be liable for any loss or damage that may arise from
or in connection with the use of this information.
Note: Please refer to the important `Stock Holding Disclosure' report on the Angel website (Research Section). Also, please refer to the
latest update on respective stocks for the disclosure status in respect of those stocks. Angel Broking Pvt. Limited and its affiliates may
have investment positions in the stocks recommended in this report.
Disclosure of Interest Statement Monnet Ispat
1. Analyst ownership of the stock No
2. Angel and its Group companies ownership of the stock No
3. Angel and its Group companies' Directors ownership of the stock No
4. Broking relationship with company covered No
Ratings (Returns): Buy (> 15%) Accumulate (5% to 15%) Neutral (-5 to 5%)Reduce (-5% to -15%) Sell (< -15%)
Note: We have not considered any Exposure below ` 1 lakh for Angel, its Group companies and Directors