merchandise layout. layout 4.pdf · mallplln layout. Yaitll akan mempermlldah peritel untuk...
33
BAB4 SIMP ULAN Pembahasan yang telah diuraikan pad a bab sebelumnya, memberikan gambaran tentang pentingnya manajemen kategori dalam industri ritel sehingga dapat disimpulkan sebagai berikut: Manajcmen kategori memberikan manfaat yang bcsar bagi peritel. Pertama, memberikan kemudahan dalam perencanaan merchandise ( maupun hal-hal yang berkaitan dalam pengkategorian, misal pemilihan perahotan) mallplln layout. Yaitll akan mempermlldah peritel untuk menyuslIn rencana layout toko dan pcnanganan arlls konsllmcn di dalam toko hingga proses mengatllr/penataan barnag dalam tiap gondola. Kedlla, dalam hal strllktllr organisasi toko akan lebill efektif. Peri tel akan rnenjadikan strllktllr kategori sebagai rlljllkan bagi penYllsllsnan struktllr organisasi manajemen toko. Yaitll setiap tingkat kategori akan ditangani oleh pcrsonil tertentu sesuai dengan kemampllannya. Yang terakhir adalah kemlldahan bagi peritel itu sendiri dalam proses pengambilan keputllsan yang strategis yang didasarkan pada kategori barang dagangan tersebllt sehingga keplltllsan yang diimplernentasikan benar-benar tepat sasaran. Dalam mengimplementasikan category ini, peritel harus memahami bdul komponcn-komponcn apa saja yang diperlukan. Retailer mcmbuat sebuah sistem keragaman barang dagangan melallli klasifikasi barang seeara 26
Transcript of merchandise layout. layout 4.pdf · mallplln layout. Yaitll akan mempermlldah peritel untuk...

BAB4
SIMP ULAN
Pembahasan yang telah diuraikan pad a bab sebelumnya, memberikan
gambaran tentang pentingnya manajemen kategori dalam industri ritel
sehingga dapat disimpulkan sebagai berikut:
Manajcmen kategori memberikan manfaat yang bcsar bagi peritel.
Pertama, memberikan kemudahan dalam perencanaan merchandise ( maupun
hal-hal yang berkaitan dalam pengkategorian, misal pemilihan perahotan)
mallplln layout. Yaitll akan mempermlldah peritel untuk menyuslIn rencana
layout toko dan pcnanganan arlls konsllmcn di dalam toko hingga proses
mengatllr/penataan barnag dalam tiap gondola.
Kedlla, dalam hal strllktllr organisasi toko akan lebill efektif. Peri tel
akan rnenjadikan strllktllr kategori sebagai rlljllkan bagi penYllsllsnan struktllr
organisasi manajemen toko. Yaitll setiap tingkat kategori akan ditangani oleh
pcrsonil tertentu sesuai dengan kemampllannya.
Yang terakhir adalah kemlldahan bagi peritel itu sendiri dalam proses
pengambilan keputllsan yang strategis yang didasarkan pada kategori barang
dagangan tersebllt sehingga keplltllsan yang diimplernentasikan benar-benar
tepat sasaran.
Dalam mengimplementasikan category ini, peritel harus memahami
bdul komponcn-komponcn apa saja yang diperlukan. Retailer mcmbuat
sebuah sistem keragaman barang dagangan melallli klasifikasi barang seeara
26

27
diagram yang diciptakan dari foto, output komputer, atau gambaran arsitek
yang menggambarkan secara tepat dimana Stock Keeping Unit ( SKU) harus
ditempatkan. SKU adalah scbutan untuk itemlbarang-barang yang dijual di
toko.
Penting bagi retailer untuk menempatkan barang-barang di tempat
yang tepat karena mengurangi stack-out yaitu barang-barang yang dipajang di
lantai di depan rak lItama. Pengelompokkan barang yang tepat maupun
kelengkapan assortment, menjadi sebuah pain lebih yang akan semakin
menunjang keputllsan pembelian konsumen. Agar terciptanya susunan
merchandise assortment yang diharapkan agar menunjang terciptanya
keputllsan pembelian oleh konsumen maka peritel harus melakukan proses
penetapan dan pemeliharaan sistem klasifikasi barang secara hirarkis dan
sistematis. Jika hal di atas tidak tercipta maka hasil akhimya adalah konsllmen
akan mengurllngkan niatnya lIntuk membeli. Namun sebaliknya, jika hal ini
tercipta maka akan semakin menllnjang keputusan pembelian dari konsumen
dan akan menjadikan toko retailer sebagai tujuan berbelanja dan loyal untuk
berbelanja di toko retailer tersebut.

DAFTAR KEPUSTAKAAN
Amine A. dan Cadenat. S., (2003), Efficient Retailer Assortment: A Consumer Choice Evaluation, www.emeraldinsight.com.
Asep ST Sujana, (2003), Paradigma Baru Dalam Manajemen Ritel Modern, Yogyakarta: Graha Ilmu.
Barry Berman dan Joe R. Evans, (2004), Retail Management: A Strategy Approach, New Jersey: Prentice Hall.
Ch. Whidya Utami, (2006), Manajemen Ritel: Strategi Dan Implementasi Ritel Modern, Jakarta: Salemba Empat.
Levy, M., Weitz, B. A., (2001), Retailing Management, 4th ed., New York: McGraw-Hill Companies, Inc.
Ma'Ruf, I-Iendri., (2005), Jakarta: PT Gramedia Pustaka Utama.
Smaros .J., dan Hellstrom M., (2004), Using Assortment Forecasting Method To Enable Sales Force Invo!ment In Forecasting, www.emeraldinsight.com.
The Emeraid RL.,..-.rrrn Register for this joumal is available at 8 The CUlTent is>ue and full text archi.e 01 thi,; journal is available at www.emeraldinsighLcomfresearchregister www.emeraldinsighLcom/0960'()()35.htm
IjPDLM 342 ,
140
Using the assortment forecasting method to enable
sales force involvement in forecasting A case study Johanna Smaros
Department of Industrial Engineering and Management. Helsinki University of Technology, Helsinki. Finland, and
Markus Hellstrom Candyking Intemalional Ltd, Helsinki. Finland
Keywords Sales forecllsting, Collfectiolll'IY, PrOCl'SS ehicinzcy
Abstract The paper presmls how a European pick-muJ-mLf confediollC1)' company has employed (J new forecasting approadl ~ a.~S(Jrtnumt forecasting ~ to reduce signijiamt(y time spent on forecasling l~y workzizg with llll <~ztire assortmmt at II tinw instead of producing a forecast for each product i1uJividuaJ1y. The implementation ofa less iime-amsumillgforccasti1lg metlwd has etwlJled the company to involve ils salesjJe<>jJle itz forealstitzg lind in this way gain access 10 their product a1ld market kllowlNige. 11w case company's impleml'1ltatioll of tlw /lew forecasting 11wtJwd is desm"bed alld ils forecasting accuracy and lime sjJ('1!i all forecasting be/are rmd after the implenumtation are nwasured 11u, results Mmonstrah, a rCIIUlTkllbJe incm:lSe in fOT/~'llSling efficiellCY as wen liS impruved communimlirfll within the company.
Introduction Surveys examining corporate forecasting practices indicate continuing widespread use of judgmental and opinion-based fora-asting methods in parallel with or even in preference to quantitative methods (Sparkes and McHugh, 1984; Herbig et aI, 1993; Sanders and Manrodt, 1994)_ In the context of estimating future sales, surveys conducted by, for example, Dalrymple
I (1988) and Peterson and lun (1999) have demonstrated that judgment is the most important method of practical sales forecasting.
Although some researchers argue against the use of judgmental forecasting methods when statistical methods are available (Armstrong. 2001) and point
. . • out the risk of attaining biased results when using judgmental techniques (Makriclakis, 1988), authors such as Bm,\1 and Schroeder (1977), Edmundson
Interu"""'tlj",",",;J'hy"",j et aL (1988), and Fil~es (1991) ~ve. shown that judgmental fora-asts .usi?g [t,",ibutio,,& u", ... ,tic;hL""""",,", contextual data can, 111 fact, be SIgnificantly more accurate than quantItatIve YoJ. 34- No. 2. 2OY!-pp.140-157
t~=~d en,,,, )\"l~l;n" Jjn;t,'<l The authors wish to thank Tekrriikan Edistarnissaatio and Emil Aaltosen Slliitio for their lXlIIOJllll\<xmnnlJ[f>2lR12 financial support
forecasts. The importance of access to contextual infonnation, such as knowledge of competitor activities, is highlighted by Webby and O'Connor (1996); based on a literature review, they conclude that access to contextual information aPlX'ars to be the prime detenninant of judgmental superiority over statistical methods.
Assortment forecasting
method
Gaining access to contextual infonnation when developing sales forecasts 141 requires involvement of experts with market, product, and customer ______ _ knowledge. Often these experts can be found in a company's sales and marketing departments (Reese, 2(00). Involving sales and marketing people in forecasting is suggested not only to improve the quality of the sales forecast, but also to improve communication within the company and reduce the problem of every department working based on its own goals and forecasts (Fosnaught, 1999; Helms et al, 20(0).
Attaining sales force involvement in forecasting is, however, not easy. Many salespeople consider time spent on forecasting as time taken away from their real job of selling (Moon and Mentzer, 1999). There is a clear need for tools and methods that enable not only accurate, but also as quick and easy forecasting as possible.
In this paper, we use a case study approach to examine a new forecasting method - assortment forecasting - that has been proposed to support judgmental forl'Casting. The case company is a European pick-and-mix confectionery company that has recently implemented the assortment forecasting method ,vith the aim of shifting forecasting responsibility from the company's purchasing function to its sales llrnction.
The palX'r starts with a brief literature review. It continues by describing the methodology used. Next, the assortment forecasting approach and some results of its implementation at the case company are disl.:ussed. Finally, some conclusions and suggestions for further research are presented.
Literature review Existing literature looks at sales force involvement in forecasting from several angles: the need for involving the sales and marketing departments in forecasting, organizational and motivational problems related to involving salespeople in forecasting, and guidelines for setting up a working forecasting process that utilizes input from a company's sales force.
The need for sales force involvement in forecasting Although quantitative techniques are arguably very useful and often should be part of a company's forecasting process, they have certain weaknesses that can be counterbalanced by the use of qualitative forecasting. (Fulcher, 1998; Moon and Mentzer, 1999; Helms et aL, 2000). Quantitative time-series techniques are designed to identify and forecast trends and seasonal patterns in data and to adjust quickly to changes in these trends or patterns. Their limitation is that

IJPDLM 34,2
they do not consider contextual infonnation, such as price changes (Mentzer and Schroeter, 1994). Regression analysis makes it possible to take such factors into consideration, but the complexity of the method and its significant data requirements limit its u..'>e (Lapide, 1999). Neither of the methods does well in dealing with changes that have never happened before, or that have happened
142 before but for which no data e.'Cist in the system. This is where expert judgment _______ can add significant value to the forOC'4Sting process. (Mentzer and Bienstock,
1998). Situations in which expert judgmellt is needed include, in addition to tJle
price changes mentioned above, assortment cllanges, promotions, competitor activities, and product introductions. The best infommtion concerning these situations oftentimes resides with the company's marketing and sales personnel (Fulcher, 1998; Fosnaught, 1999; Moon and Mentzer, 1999; Helms et aL, 2000; Jain, 2000; Reese, 2(00).
Achieving sales force involvement in forecasting Although both researchers and practitioners seem to agree that sales force involvement in forecasting is important, benefiting from it in practice can be difficult. Several motivational, organizational, and tool·related obstacles have been identified.
In their in·depth study of the sales forecasting management practices at 33 companies, Moon and Mentzer (1999) found there to be some resistance from salespeople concerning their forecasting responsibilities in almost all of the companies studied. Many salespersons felt tlmt it was not their job to forecast and that time ,,-pent on forecasting was time taken away from their real job of managing customer relationships and selling products and services. Similar observations have been reported by Helms et al (2000) and Reese (2000). According to Reese (2000), these motivational problems are often aggravated by the lack of forecasting incentives; salespersons are seldom rewarded for producing accurate forecasts.
Moreover, Moon and Mentzer (1999) claim tlmt even when companies get salespeople to forecast, they tend to do a relatively poor job. As they put it
[ ... J even when the sale::,llL~)plc are provided with a history of their customers' demand patterns. they frequently will either see patterns that do not exist. or will fail to see patterns that do exist (Moon and Mentzer. 19(9).
Based on their research, Moon and Mentzer (1999) have compiled a set of guidelines for overcoming the baniers tlmt hinder companies from fully benefiting from sales force involvement in forecasting. They suggest tlmt companies should:
Make forecasting part of the salespeople's job by including forecasting as a part of their job descriptions, creating incentives for high perfonnance in forecasting, and providing feedback and training.

Minimize game playing by making forecasting accuracy an important outcome for salespeople and cle.vly separating sales quotas from forecasts.
• Keep it simple by asking salespeople only to adjust statistically generated forecasts rather than producing forecasts from scratch and by providing them with adequate tools that enable them to complete their forecasting work as efficiently as possible. Keep it focused by having the salespeople deal only with the products and customers that are truly important and where their input can significantly affect the company's supply chain
The first two recommendations COnCelll organizational and motivational factors, such as rewards, job descriptions, and training. The other two are about creating forocasting processes and tools that support sales force involvement by making forecasting simpler, more efficient, and more focused on the products and customers that really matter. These latter ones are the focus of this paper.
Methodology We examine a new forecasting approach - assortment forecasting - presented by Holmstrom (1998). The approach has been designed to support judgmental forecasting and make it more efficient Instead of producing a sales forecast for each product individually, the approach is ba..."l'Cl on working with an entire product range, an assortment, and adjusting the products' relative positions within this as..c.;ortment The product level sales forecasts are then derived based on the products' estimated positions within the assortment (We will present the approach in more detail in a later scction.)
When introducing the assortment forecasting method, Holmstrom (1998) also presented some initial test results. However, since the results were somewhat mixed and not derived from an actual forecasting situation, the practical applicability of the suggested forecasting method is still unknown.
The aim of tlus study is to further examine the usefulness of the assortment forecasting method and to answer the following research question: "Can the assortment forecasting approach be employed to facilitate successful sales fort-e involvement in forecasting?". The research is, thus, hypothesis testing in nature, a research design that, for example, Mentzer and Kahn (1995) strongly encourage.
The research follows a case study approach. The first known actual implementation of the assortment forecasting is documented, and the resulting impact on the case company's forecasting performance is measured.
Case company The C"lsecompany operates in several European COWl tries and is represented by a regional business unit in each of its markets. The company's business
ASSOltment fOfocdSting
method
143
IJPDLM 34,2
mooel is to provide sUpe!1narkets, video rentals, cinemas and the like with a broad assoliment of pick-and-mix sweets from several confectionery suppliers. The company also provides its customers with in-store display equipment and merchandising services, i.e. it runs the entire pick-and-mix category on behalf of its customers. .
144 The company works with an assortment consisting of some 200 different _______ products. The assortment is very dynamic. New prooucts are frequently
introduced and old ones delisttxl. In addition, t'<ill1paigns ,md seasons introduce fluctuations in demand.
Traditionally, the company's sales forecasts have been developed by the regional business units' purchasing departments to support their own purchasing decisions. Although the purchasing deparhnents have done a good job, the lack of sales force involvement has cau..."tXl noticeable problems. Poor communication between sales and purchasing has, for example. resulted in last minute deliveries when purchasing has been taken by surprise by unexpected product introductions. Similarly, late information concerning product delistings or campaigns has occasionally caused inventory management problem.s such as excess stock or stock-outs.
Although shifting the forecasting responsibility from purcha.<;ing to sales has been identified as a key improvement opportunity, the lack of suitable tools to slIPPOli sales force involvement in fort't<1Sting has hindered development. Since the sales pt'Ople do not, in generd~ have any experience of foretasting and have very limited tinle to spend on producing the forecast, the forecasting tools and the whole process should be very easy and quick to use. The company's traditional forecasting tools and methods have not been able to provide the necessary support.
In 2000, the company heard of the assortment forecasting approach. The same year, it conducted some initial data analyses and tests, which produced promising resulLc;, and concluded that the new forecasting approach presented an opportunity to streamline forecasting and shift the forecasting res-ponsibility from purchasing to sales. In ZOO1, a spreadsheet tool supporting the new forecasting approach was developed and tested. The first actual implementation took place in January 2002, when the sales force of the company's Swedish business unit started using the new forecast approach for producing sales forecasts. The comj)<illY is l1l1Tently expanding the use of the new forecasting approach to its other markets as well
Data coUcction and analysis Infolmation about how the assortment forecasting approach was implemented at the case company was attained by interviewing the company's logistics manager, who supervised the entire development process from initial tests and tool development to actual implementation. The logistics manager was interviewed on several occasions during the years ZQOO.Zoo3.
In addition to the interviews, quantitative analyses examining the impact of the new forecasting approach on the case company's forecasting accuracy as well as the time spent on forecasting were conducted. These two perfonnance measures were selected as they reflect the objectives of the company: to increase its forecasting efficiency by reducing time spent on forecasting and to increase its forecast accuracy by eliminating the problems cau..<.;ed by poor communication.
The company's forecast accuracy was calculated by comp2ling forecasts developed fOllr weeks in advance with the actual realized sales. The forecast aCCl.lrdCY before and after the implementation WdS measured in order to evaluate the impact of the new forecasting approach. The forecast and sales infonmtion was extracted from the company's enterprise r(SOurce planning (ERP) system.
The change in workload was calculated using estimates from the purchasing department who produced the forecasts before the implementation of the new forecasting approach and comparing them to estimates received from the sales personnel producing the forecasts after the implementation.
Access to information on the implementation and to the forecast perfonnance data needed for the analyses was vollmteered by the company. Due to the researcher's prior knowledge of the assortment forecasting method as well as her position as an "outsider", the company considered her a suitable observer, capable of producing an unbiased assessment of the implementation of the forecasting approach.
The assortment forecasting method The solution implemented by the case company builds on Holmstrom's (1998) original idea, but has been slightly adapted to better suit the company's neL'(}s.
The OIiginal iflca Holmstrom (1998) argues that traditional forecasting methods often are inefficient since the same forecasting operation - be it a time series calculation or eAvert judgment - needs to be repeated for each product separately. When there are many products and the forecasting process includes qualitative elements. this often means that forecasting requires much time and feels tedious. As an alternative. Holmstrom promotes the idea of working with an entire product range - an assortment of products catering to the same cllstomer need - at a time.
The suggested forecasting approach consists of the following steps: (1) Estimate ranks for products within the assortment, i.e. put them in
ascending order based on their expected unit sales. (2) Estimate the assortment's total unit sales. (3) Use a scaling function to divide the assortment's total unit sales between
the individual products based on their ranks.
Assortment forecasting
method
145
IjPDLM 34,2
------------- ---_. __ .. _----
According to Holmstrom (1998), the value of the assortment forecasting method is based on taking advantlge of the fact that it is easier to forecast the total saIL'S of an assortment than the sales of each individual product. The method also enables :-;ales and marketing people to give input in a fonnat, pnxiuct ranks, which is convenient and fits their way of thinking. When changing the ranks of selected products \vithin the a..<;sortment, ranks and, thus, foret<lSts are
_1_4_6 _____ automatically adjusted for the other products, as well. IL for example, the forecaster decides to change a product's rank from seventh to third in the assortment, the pnxluct's forecasted share of total assortment sales will automatically be increased, while the ranks of the products previously ranked third to sixth will be decreased, causing their forecasted shares to decrease. This means that product dependencies and cannibalisation effects (Cadeaux, 1997; Sai1.vi, 2000) are taken Cill'e of automatically. This makes it possible to fOLLIS on the most relevant products, the top sellers, and the most important events, such as campaigns and new products introductions, and in this way speed up the forecasting process.
As Holmstrom (1998) points out, the most critical part of the assortment forecasting method, and a key factor affecting its applicability, is the scaling function used to model the relationship between the products' rmlks and their share of toW a..<;SQrtment sales. Selecting the appropriate scaling fundion can be difficult. In his article, Holmstrom (1998) suggests that a logarithmic ftmction of the following form be used:
1 Share (rank) = . .
(rank + constant)Hp<J"'c" (1)
The relative weight of the higher ranks can be increased by decreasing the constilllt or increasing the power.
The scaling function would typically be calculated based on an assortment's historical sales data, but according to Holmstrom (1998) it may be net'essary to make judgment-based changes to tIle ftmction. As illl example, he presents a real-life situation where an assortment's second most selling article was removed, altering the sales distribution of the entire assortment. To produce accurate forecasts, the salespeople would, therefore, have needed to forecast total assortment sales, product ranks, as well as the shape of the scaling function.
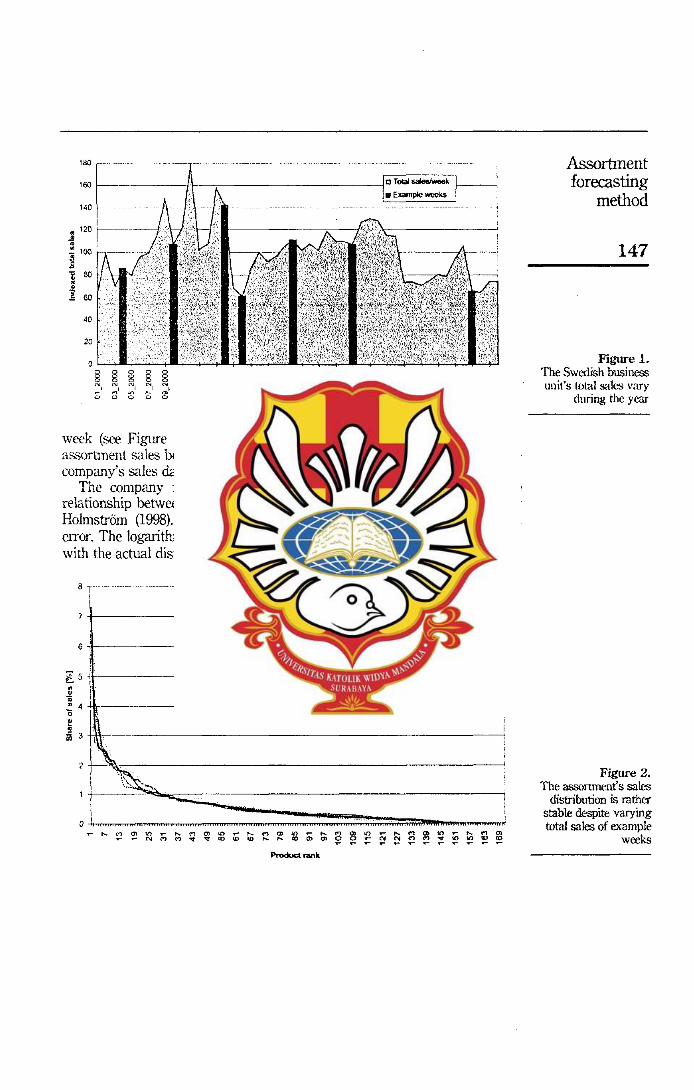
The case company's approach When the case company first got interested in the assortment forecasting method, it did some data analyses to examine what the sales distribution of its assortment looked like. By analysing historical sales data, the case company noticed that a relationship between the product ranks and their shares of total assortment sales could be identified. In additic\n, despite varying total sales, product changes, and shifting popularity of the individual products (Figure 1), the relationship, i.e. the scaling ftmction, looked rather similar from week to
180
180~---------,i'~-'----------------------1~
~~ 140
~ 120 r---.------f . . ,\--[ .., . ~ 100 h-----·--·-o,l
~ = 80 i 60
40
20
0 D
~ D D D
~ D D 0 0 0 0 0 0 0 0 0 0 0 8 0 0 8 0
8 8 8 8 8 8 8 ~ 8 8 8 8 8 8 ~ 8 8 ~ 8 8 N , , :;:, :' '" , ;:;, :;:, ~I , "', ;:;, '" , ~I "', '" , , :;:, ::1 "', , ;::, :;:, :' ~ m
, ~ ~ G :: ~ N m ;;; m :;
" " " " .. .. '" '" ,', M ., ... .. .. .. -week (see Figure 2). The idea of using a scaling function to divide total as.'>ortment sales benveen the individual products was thus supported by the company's sales data.
The company first tried to use a log-arithmic function to model the relationship benveen product rank and share of total sales, as suggested by Holmstrom (1998). This approximation, however, introduced a significant error. The logaritlunic function simply did not correspond accurately enough with the actual distribution.
7t-----------------------------------------:=======,---~
I······ 04_2000
--1o_2000 ~---------------------------------------~1--1~2OOO
1
-- '82000 ~ 5 i ---- ________________________________ ..., ...... 242000
: I 1-31- 2000 I :: 4 _____________________________________ J..I_··_·· ;;:46:;;_2:::000~'____
'0 E • tii 3
: "'" ::::; :;;; !iiI; .. ';"'il"""iI"~ ,... M ~ 10 ~ ,... M OJ ~ ~ ~ ~ ~ ~ ~ ~
Assortment forecasting
method
147
Figurel. The Swedish business unit's total sales vary
during the year
Figure 2. The assortment's sales
distribution is rather stable despite varying total sales of example
weeks
IJPDLM 34,2
The company, therefore, decided to try a different approach and use a historical sales distribution as the scaling function. The scaling function was fonned by calculating the average shares corresponding to different product nmks over a period of several rdndomly selected weeks. The historical distribution was then tested and, as it worked well, seleded to be the scaling fill1dion.
148 After identifying a suitable scaling flmction, the company started testing the ------- approach in pradice. After several steps of trial and enw, the company's
current forecasting process emerged: (1) Load sales and forecast data from the company's ERP system into the
spreadsheet tool. (2) Delist produds that will be removed from the as..'iOrtment (3) Update product ranks: start with top·selling products and move
downwards, focus on most important products and changes. Use products' historical ranks as an aid.
(4) Add and rdI1k new products. (5) SeleLi the scaling ftmction. (Although it is possible to select different
scaling nmctions, in practice usually the same one is always used.) (6) Estimate total assortment sales. (7) Use the tool to calculate product level sales forecasts and load the
forecast data into the ERP system.
The first step is very simple: the forecaster, i.e. the salesperson, just clicks on a button and all the necessary backgrolmd infonnation - realized sales and previous forecasts - are loaded from the company's ERP system into the spreadsheet used for forecasting.
Steps 2-4 concern the products' ranks. The salesperson first delists the products that will be removed from the assortment. Next he updates product ranks, starting with the top selling products and moving downwards. To make it easier to accurately estimate the ranks, the spreadsheet tool displays each product's ranks for three historical weeks selected by the user, as well as the average rank of the produd dUling these weeks. The salesperson can, for example, select three fairly recent weeks to look for potential trends in a product's demand or look at last year's ranks to examine seasonal iaLi:ofS. Finally, new products are added and r,mked.
When the ranking has been completed, it is time for Step 5, selecting the scaling function. The user can choose a predefined scaling function or he can create a new fill1ction based on the historical sales of a seleLied period, for example, Easter or Halloween. In prdctice, however, the salesperson currently only uses one predefined scaling ftmction, which has been found to be fairly accurate and is regularly updated based on historical data. In biep 6, the total weekly sales of the entire as..<;()rtment are forecasted.

When all the necessary infonnation has been inputted, the spreadsheet tool calculates the aetual prodlH.:t level sales forecasts, which are then loaded into the ERl' system.
The sales function at the Swedish business lUlit develops product level forKasts for a rolling 52 weeks each month. Although the forecast period is one
Assortment forecasting
method
year, greater emphasis is placed on the upcoming months than on the long term forecast. If new infonnation regarding, for example, promotions is attained, ______ 1_4_9_ fore<.asts C,ill be updated more frequently.
Implementation results Next, we will examine how the implementation of the <L..<:sortment forecasting method at the case company's Swedish business lIl1it has affected its forecasting peliormance and time spent on forecasting.
Time spent all forecasting When introducing the new forecasting approach, the main objective of the case company \'laS to shift the forecasting re::;ponsibility from its regional purchasing fW1ctions to its sales fW1ctions, where important business decisions concerning assortment changes and campaigns are made. However, to enable the shift, forecasting had to be made much simpler and quicker than it had previously been. Otherwise, the sales force would have neither the time nor the interest to forecast.
Before the implementation of the new forecasting method, it took the purchaser of the case company's Swedish business unit between one-and-a-half and two days per month to create the forecasts. The forecasts were developed product by product for a rolling 52 weeks on a monthly basis in the company's ERP system.
After the implementation of the assortment forecasting approach, time spent on forecasting has dropped to an average of two hours per month, although the salesperson producing the forecasts has no previous experience of forecasting. This means that forecasting only tdkes a small fraction of the salesperson's time, letting him concentrate on his main job - selling - ilie rest of the time.
The entire efficiency improvement cannot be credited to the new forecasting approach alone. Part of the improvemellt, corresponding to a few hours of work, is a R'Sult of replacing the inflexible ERP tool with a user-friendlier spreadsheet tool. However, the bulk of the improvement clearly comes from the opportunity of working with the entire a&.<;ortment at the sanle time, focusing on products and events that really lnatter and b1)ending very little time on the less impOltant products.
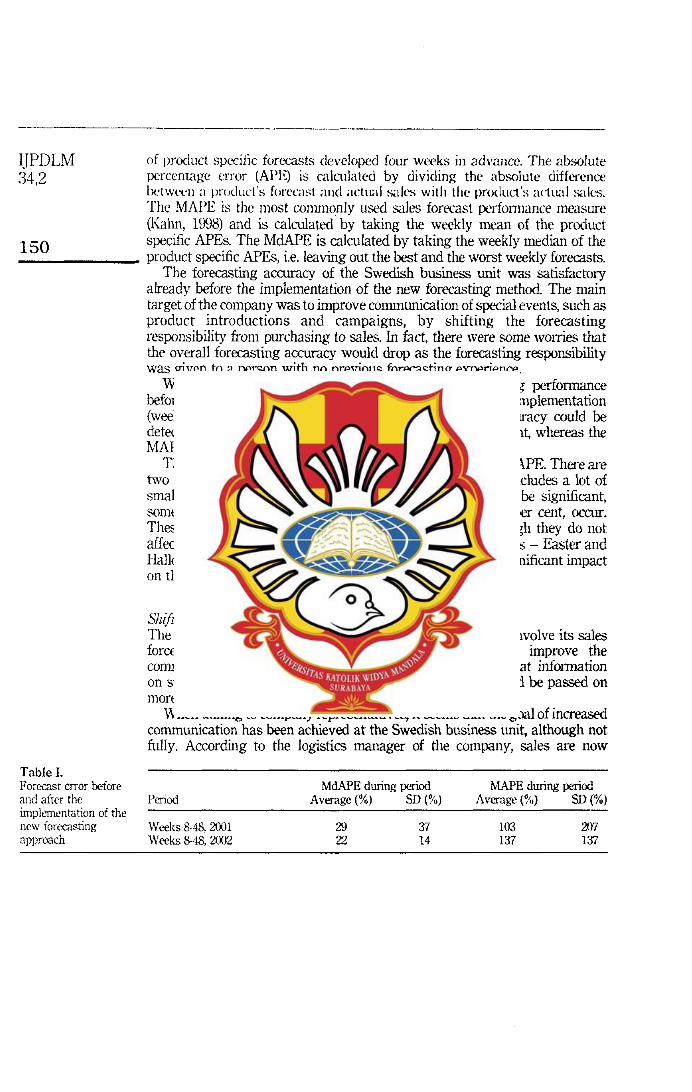
Impact on forecast accuracy In order to evaluate the Swedish business wlifs forecast accuracy before and after the implementation two measures were used: the weekly mean absolute percentage error (MAPE) and the median absolute percentage error (M:dAPE)
lJPDLM 34,2
---------------------
of prcx:luct speciilc fonX_4sts developed four weeks in ad\'aJlce_ The absolute percenhlge eITor (APE) is calculated by dividing the absolute diffe.rence betWt'l'1l a product's forecast alld actual sales with tht' product's actual sales. The MAl'E is the most commonly used sales forecast perfomlance measure (Kahn, 1998) aJld is calculated by taking the weekly mean of the product
o specific APEs. The MdAPE is calculated by taking the weekly median of the _1_5 ______ product specific APEs, i.e. leaving out the best and the worst weekly forecasts.
Table I.
The forecasting accuracy of the Swedish business unit was satisfactory ah-eady before the implementation of the new forecasting method. The main target of the cOI1lPaJly was to improve conmlunication of special events, such as product introductions and campaigns, by shifting the forecasting responsibility from purchasing to sales. In fact, there were some wOlnes that the overall forecasting accuracy would drop as the forecasting responsibility was given to a person with no previous forecasting experience.
When comparing the Swedish business unit's forecasting perfonllaJlce before the implementation (weeks 8 to 48 in 2001) and after the implementation (weeks 8 to 48 in 2(02) no obvious Chrulge in forecast accmacy could be detected. The MdAPE decreased from 29 per cent to 22 per cent, whereas the MAPE increased from 103 per cent to 137 per cent (Table 1).
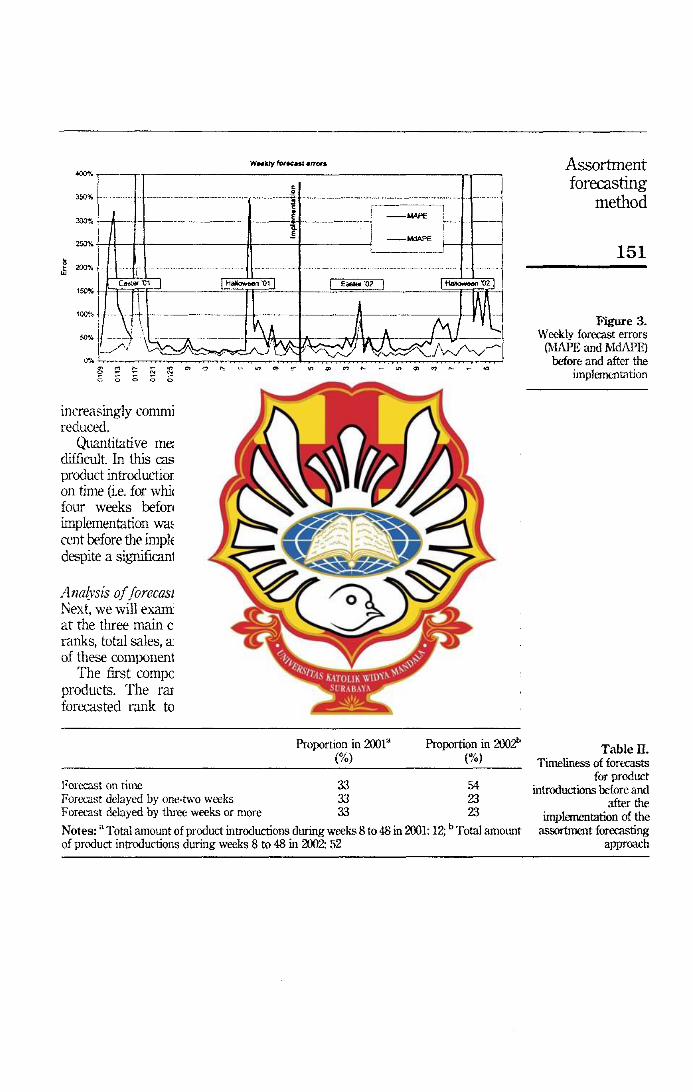
There is a notable difference between the MdAPE and the MAPE. There are two reasons for this_ First, since the COI1lPallY's assortment includes a lot of small products for which the weekly variation in sales CaJl be signifiCaJlt, sometimes extremely lru-ge forecast errors, even over 1,000 per cent, occur. These errors have a signifiCaJlt impact on the l\1APE, although they do not affect the company's operations in prdctice. Sa--cmd, two seasons - Easter and Halloween - are notOliously difficult to forecast aJld have a signifiCaJlt impact on the MAPE as CaJl be seen in Figure 3.
S7zijt in responsibility reducing communication lead time The main reason why the confectionery company WaJlted to involve its sales force in forecasting was that it hoped that this would improve the communication between sales and purchasing aJld ensme that infomlation on such events as product introductions and campaigns would be passed on more efficiently than before_
When talking to comPallY representatives, it seems that the goal of increased communication has been achieved at the Swedish business unit, although not fully. According to the logistics rtlaJlager of the company, sales are now
Forecast error lx10re MdAPE during period MAPE during period and after the Period Average (%) SD (%) Average (%) SD (%) implementation of the ------------=-~~--~------=-~----'--new forecasting Weeks 8-48. 2001 approach Weeks 8-48, 2(X)2
29 22
'51 14
103 2ffl 137 1'51
~,---.. -------------------------------------,.---, <
350% - .. ·····_···· __ ··_··········_···_·_·······1· ....... _ ...... _ ........ _ .. _ ... _ ..... . 300% - --- -
-MAP£
250% j _MdAPE
100%
-increasingly committed to availability and the communication gaps have been reduced.
Quantitative measurement of the change in cornmlUucation efficiency is difficult In this case, product introductions were monitored. The proportion of product introductions for which a forecast had been inputted into the ERP system on time (i.e. for which a forecast had been inputted into the ERP system at least four weeks before the product was introduced) before and after the implementation WaS calculated. The proportion of on-time forecasts was 33 per cellt before the implemelltation and 54 per cent after the implemelltation (fabJe II), despite a significantly larger nunlber of introductions in the latter period.
Analvsis offorecast accuracy Next, we will exanrine the forecast accuracy in somewhat more detail. We look at the three main components of the assortment forecast approach - product ranks, total sales, and the scaling iwlCtion - and examine the accuracy of each of these components.
The first component of the assortment foretasting is the ranking of the products. The rank error was calculated by comparing each product's forecasted rank to its actual rank and taking the absolute value of this
Proportion in 200e (%)
Proportion in 2002" (%)
Forecast on time 33 54 Forecast delayed by one·two weeks 33 23 Fora'3st delayed by three weeks or mOTe 33 23
Notes: a Total amount of product introductions during weeks 8 to 48 in 2001: 12; b Total amount of product introductions during weeks 8 to 48 in 2002: 52
Assortment forecasting
method
151
Figure 3. Weekly forecast errors
(MAPE and ~IdAPE) before and after the
implementation
Tablell. Timeliness of forecasts
for product introductions 1x1ore and
after the implementation of the
assortment forecasting approach
ITPDLM 34,2
152
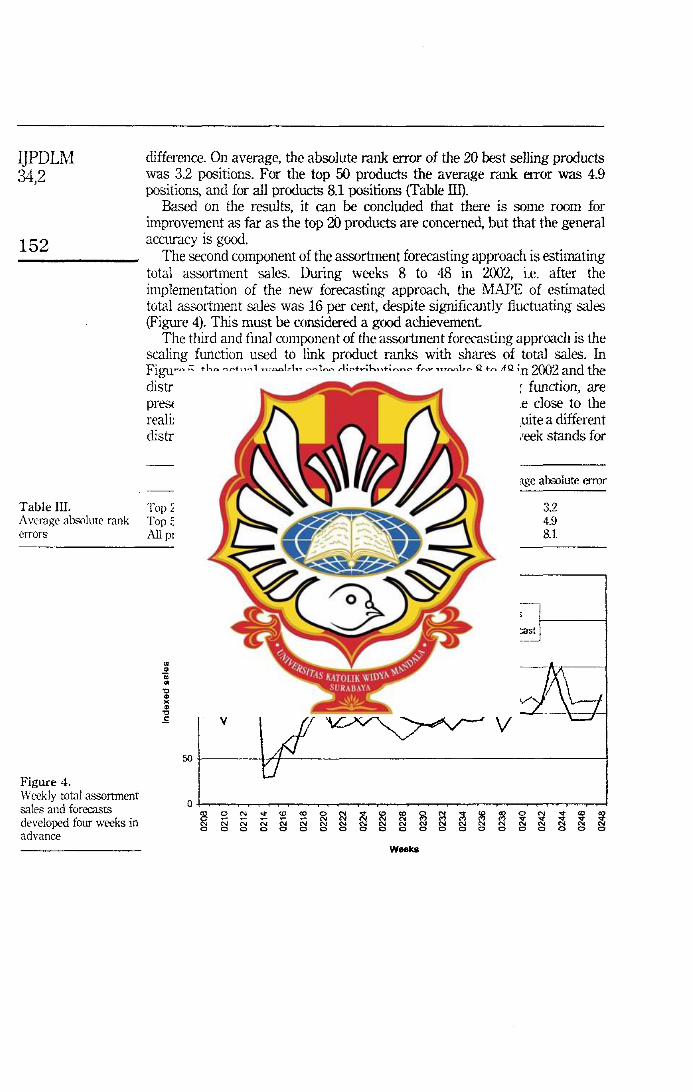
diffeTence. On average, the absolute rank error of the 20 best selling products was 3.2 positions. For the top 50 products the average rank error was 4.9 positions, and for all products 8.1 positions (Table Ill).
Based on the results, it am be concluded that there is some room for improvement as far as the top 20 products are concerned, but that the general aCCllrdCY is good.
The second component of the assortment forecasting approach is estimating total assortment sales. During weeks 8 to 48 in 2002, i.e. after the implementation of the new forecasting approach, the MAPE of estimated total aR."01tment sales was 16 per cent, despite significantly fluctuating sales (Figure 4). This must be considered a good achievement
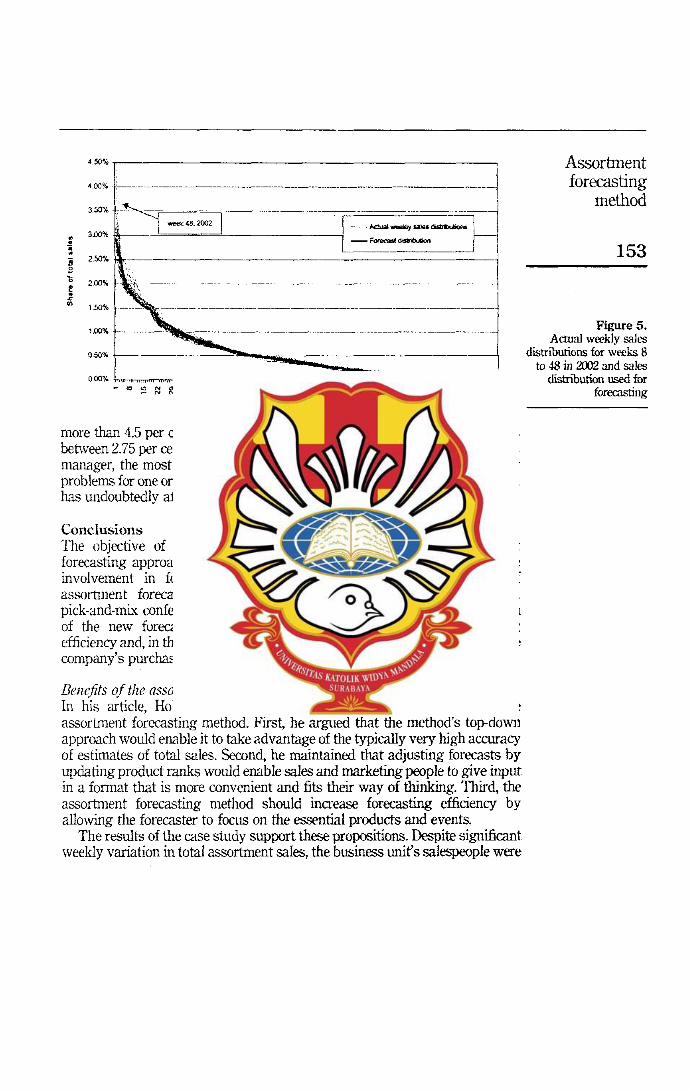
The third and final component of the assortment forecasting approach is the scaling function used to link product ranks with shares of total sales. In Figure 5, tlle actual weekly sales distributions for weeks 8 to 48 in 2002 and the distribution used for producing the forecasts, i.e. the scaling fWlction, are presented. As can be seen, the estimated distribution is quite close to the realized distributions. There is only one exception; week 48 has quite a different distribution than the other weeks. The top selling product this week stands for
A verage absolute error
Table III. Top 20 products 32 4.9 8.1
A wrage alk<.t1lute rank Top 50 produets errors All products
2~r--------------------------------------------------'
" 150 ~ ;; .. " ~ ~ ~
100 " E.
50
Figure 4. IV eekly total assortment a sales and forecasts
'" 0 N .. <D '" 0 N .,. '" <0 0 N ~ ~ ~ 0 N .,. '" ~ developed four weeks in ~ N N N N l:::: N N N 13 '" .. .. ~ ~ N N '" N '" N N N N N N N
advance 0 0 0 0 0 0 0 0 0 0 0 0 0 0 0 0 0 0 0 0 0
Weeks
4_50% ,-----__________________ ---,
-I -------ll ~~_F~_ CJ :: --------------------~~=-------~--j 1..50% -:------------------------------------------------------I
:c_ ====:::---:::-----:::;------;;;-----~---=-= .. ~ - ~ ~ ~ ~ ~ ~ S ~ $ ~ ~ ~ ~ ~ ~ E ~ ~ ~ ~ ~ ~ ~ ~ ~ ~ ~
Rank
more than 4.5 per cent of total sales, whereas the top seller usually represents between 2.75 per cent and 3.25 per cent of total sales. According to the logistics manager, the most likely reason for this lIDusual sales distribution is supply problems for one or more high-volume products. The lIDusual sales distribution has undoubtedly affected the forecast accuracy that week
Conclusions The objective of the research was to examine whether the a&.<';()rtment forecasting approach could be employed to facilitate successful sales force involvement in forecasting. Based on studying the implementation of assortment forecasting at the Swedish business unit (.f a European pick-and-mix confectionery company, the answer is yes. The implementation of the new forecasting approach has significantly increased forecasting efficiency and, in this way, enabled a shift of forecasting responsibility from the company's purchasing function to its sales function.
Benefits of the assortment forecasting metiwd In his article, Holmstrom (1998) attributed three major strengths to the assortment forecasting method. First, he argued that the method's top-down approach would enable it to take advantage of the typically very high accuracy of estimates of total sales. Second, he maintained that adjusting forecasts by updating product ranks would enable sales and marketing people to give input in a format that is more convenient and fits their way of thinking. Third, the assortment forecasting method should increase forecasting efficiency by allowing the forecaster to focus on the essential products and events.
The results of the case study support these propositions. De~;pite significant weekly variation in total assortment sales, the business unit's salespeople were
Assortment forocasting
method
153
Figure 5. Actual weekly sales
distributions for wt'eks 8 to 48 in 2002 and sales
distribution used for forecasting
---._---_.-._-_._. __ ._-------_.
ITPDLlVf 34,2
154
able to produce accurate estimates on the aggre.r,'<lte level. This supports the ideas presented by Hohnstrom (1998) as well as other researchers (Plossl, 1973; Muir, 1979) that estimating total produLi f,'roup sales is easier than ('Stimating sales of individual products. In addition, based on the results of the case study, updating forc'C<lsL<; by adjusting product ranks seenlS to work well. The product rank accuracy was in general good, although there was some room for improvement in the top 20 products. Furthermore, Holmstrom's (1998)
------- suggestion that working with an entire assortment at a time and focusing on the most important products and events could increase forecasting efficiency was clearly validated. The implementation of the new forecasting method resulted in a striking reduction in the time !,;pent on forecasting.
In his article, Holmstrom (1998) identifies the scaling function, i.e. the function modelling the relationship between a product's r<ulk ,mel its share of total assortment sales, as the weak point of the assortment forecasting method. However, in this case, the relationship between rank and share was very stable and, thus, easy to model, de!'>-pite varying sales and a d~Tnamic assortment.
Limitations of flw ass01tment forecasting method The results of employing the assortment forocdsting method in the case company's Swedish business unit can be considered velY promising. However, to be able to evaluate the generalisability of the results, the business conteAi: in which they have been attained needs to be discussed. Several characteristics of the Swedish business unit's situation make it a particularly attractive candidate for assortment forecasting and present potential limitations for its applicability in other business settings.
First, the business unit's assortment is very dynanlic with frequent product introductions, delistings, and seasonal products as well as significantly valying total sales. Traditional time-series methods are, therefore, rather ill suited, presenting al1 opportunity for qualitative forecasting methods. In less dynamic assortments, the benefits of assortment forocdsting in comparison to efficient, automated time-series methods are likely to be small or even non-existent.
Second, the confectionery company's assortment is very wide. This increases the stability of the a..',sortment's sales distribution, as individual produ<..is or events usually do not significantly affect the distribution.. In narrower assortments there is always the risk of a forceful Calnpaign or an importallt new product introduction shifting the whole sales distribution, thus hindering the application of the assortment forecasting approach.
Third, as the confectionery company's Swedish business unit uses diret-i store deliveries, it has access to very high-quality demand infonnation. There is no additional party, such as a wholesaler or customer warehouse in between introducing order batching in the demand infonnation. This means that the sales data aCl .. 'Ul'ately reflects actual produci: ranks and that products' ranks do not move up and down without reason. When introducing the assortment

forecasting method in new markets where the confectionery company's goods pass t}u'ough wholesalers, the company has noticed that produc1: ranks can behave ilTationally due to order batching. Although there are means to filter out the distorting effect of order batching, access to high-quality demand information obviously supports implementation of the assortment forecasting.
Connection to /lfevious findings Obviously, the value of a new fore<:asting approach cannot be conclusively established based on a single case study. However, even though the case study presented in this paper is the first knOV.1l implementation of assortment forecasting, analogous, although somewhat less sophisticated forecasting approaches have been inlplemented before.
McClelland et aL (2000) document how a Japanese apparel retailer's store managers and a.o;;sistants produce forecasts by giving garments ranks from 1 to 7, sorting the products according to their mean rank and rank standard deviation, and associating a certain share of sales with the uA", "B", uC", and "D" products identified based on the ranking process. Two large US corporations also successfully use similar, slot-based forecasting approaches to forecast sales of shoes, music CDs, and computer software (Freeland, 2003). Their approaches are based on having merchandisers allocate products to a handful of different segments, or slots, based on the products' estimated sales success.
These previous implementations support the assumption that the use of ranks and scaling fW1Ctions, rather than direct volLune estimates, can be very useful in situations where:
large assortments of produds catering to a similar need and competing for the same customer attention are offered; and
assortments are dynamic, having, for example, frequent product introductions.
Discussion and further research As many studies demonstrate, judgmental methods play an inlportant part in business forecasting (Dalrymple, 1988; Sanders and Manrodt, 1994). There is, thus, need for research on how the process of judgmental fore<:asting could be better supported and made more efficient
Holmstrom's (1998) work - the assortment forecasting method - is a new and interesting approach to judgmental forecasting. Based on the results of the case study presented in this paper, the assortment fore<:asting method has the potential to reduce significantly time spent on judgmental fore<:asting. As increased efficiency is an important element in attaining sales force involvement in forecasting, this is an intriguing result However, more testing and especially additional real-life implementations of the assortment
ASSOliment forecasting
method
155

IJPDLM 342 ,
156
forecasting approach or similar rank-based approaches are needed to ooderstand fully the method's potential benefits and limitations.
In addition, since foretasting efficiency is an important prerequisite for forecasting collaboration, an interesting line of research would be to test the applicability of tile assortment forecasting in inter-comp;.my collaboration.
Finally, there are several opportunities to develop further the as..o;;ortment forecasting method. In its ClUTent fonn, the method makes only limited use of traditional forecasting models. The performance of the as..o;;ortment forecasting approach could potentially be improved by using, for example, time-series forecasting to produce a first suggestion of product ranks and total assortment sales, and then let the forecaster make qualitative adju.':;tments. As the combination of judgmental and statistical forecasting is supported by several researchers (Blll1ll and Wright, 1991; Lim and O'Connor, 1996), it C'dIl be considered likely that by seizing this opportunity, a very useful new forecasting approach could be developed.
References
Armstrong, J-S. (2001). "Selecting forecasting methods", in Armstrong, .l.s. (Ed). Principles of Fore(llsting, Kluwer Academic Publishers, xorwell, ?vIA.
Basu, S. and Schroeder. R.G. (1977), "Incorporating judgments in sales forecasts: application of the Delphi method at American Hoist and Derrick", 1n/"'/I1""s, Vol. 7 1\0.3. pp. 18·27.
Bunn. D. and Wright, G. (1991). "Interaction of judgemt.'11tal and statistiml furl'casting methods: issues & analysis", Management Science, VoL ':r7 Ko. 5, pp. 501-18.
C1ckam::, J1v1. (1997), "A closer look at the intt'Tface between the prodU<."t lint'S of m,mufat'tUrers and the assortments of retailers", International journal 0/ Retail & DistriiJution Ml1lltlgenumf, Vol. 25 No.6, pp.I97-203.
Dalrymple, DJ. (1988). "Sales forecasting practiu'S",lnfenzalionalJounllll of Forecasting, Vol. 3 ~o. 3, pp. 379-91.
Edmundson, RJl, 1~1wrence, MJ. and O'Connor, MJ. (1988), "The use of non-time s..'1ies data in sales forecasting: a case study"./ournal of Forecasting, VoL 7 ~o. 3. pp. ;))1-11.
Fildes, R. (1991), "Efficient use of infonnation in the fonnation of subjective industry fom:-asts", joumal of Forecasting, VoL 10 No.5, pp. 5tJ7-617.
Fosnaught. K (1999), "The strategic power of consensus forecasting: setting your organization up to win",jounzlll 0/ Business Forecasting MetizOlL, & Systems, Vol. 18 xo. 3, pp. 3-7.
Freeland. K (2003), Personal communication, 14 August.
Fulcher,]' (1998), "A cOlJunon vision", Mallufacturing Syst.'ms, Vol. 16 No. 2, pp. 88-94-. Helms. ?vI.M., Attain, L.P. and Chapman, S. (2OOl), "Supply chain forecasting - collaborative
forecasting supports supply chain managl'rnent". Business Process Management joumal, Vol. 6 :\0. 5, pp. 392-407.
Herbig. P., Milewicz.]. and Golden,].E. (1993), "Forecasting: who, what. when and how"Journai of Business Forecasting Methods & SysmJls, Vol. 12 No. 2, pp. 16-21.
Holmstrom, ]. (1998), "Handling product range complexity: a case study on rc-engineering demand forecasting", Business Process Managementjounzai, VoL 4 Xo. 3, 1lP- 241-58.
Jain, C1.. (2000), "Editorial: which forecasting model should we use?", Journal of Busine,,,-, Forecasting Methods & Systems, VoL 19 No. 3, pp. 2-4.

Kahn, K.B. (1998), "Benchmarking sales forecasting performance measure",jollmal oj Bllsiness f'()rct!lsling Mclhods & Syslems, Vol. 17 :\0. 4, pp. 19·23.
Lapide, 1,. (1999). ""ew developments in businL'SS forecasting",joumlll ojBusiness Forews/ing Metlwds & Systems, VoL 18 ]\;0. 2, ])p. 13-14.
Lim, .1.5. and O'Connor, M. (1996). "Judgmental foreCasting with time series and causal infonnation", in/emllljonal jOUrJUI] of ForeCIIsting, Vol. 12 :\0. 1. ])p. 139·53.
McClelland. AS, Raman, A. and Fish('f, M. (2000), "Supply chain management at World Co Ltd.",
As..')ortment forecasting
method
157 I !arvard Business School Case :\9-601'()72. ---------
~lakridakis, S. (1988), "Mctaforecasting: v,ays of improving forl'(:asting accuracy and usefulness", Internaliol/al Jounw/ of Forecasting, Vol. 4 ~o. 3, pp. 467·91.
1I-lentzer, JT. and Bienstock, C.C. (1998), wflle S(>\'cn principles of sales·forecasting systems", Supp£v Chain MiUwgewml Review, Fall, pp. 76-83.
Melltzer. j.T. ;JIlt! K;i111l. 1\.1\. (19%), "/\ fr;lI1wwork of logistic; fl'-".mch",juumuI4 /lusilu·.~' Logistics. Vol. 16 No. 1. pp. 231·50.
Mentzer, ].1'. and Schroeter,]. (1994), "Integrating logistics forecasting techniques, systems, and administration: the multiple forecaSting system"Jounuzl of Business Logistics, Vol. 15 C\o. 2, pp. 205-26.
Moon, MA and Ment7A~r. ].T. (1999), "Improving salesforcc forecasting", founml of Business Forecasting, Vol. 18 C\o. 2, pp. 7·12.
l\luir, J,W. (1979), "The pyramid principle", Proceedings of 221111 Nmual Conjerence, Anwncatl Productioll and Imlt'ntor)' Control Soddy, pp. 105-7.
Peterson, RT. and Jun, 11-1. (1999), "Forecasting sales in wholesale industry",joumlll of BusitleSs Forecasting lvrclhods & Systems, Vol. 18 "0. 2, pp. 15-17.
1'10""1. G.W. (1973). "Getting the most from forecasts", Production and invmlor)' Mmlllgemenl, VoL 14),'0. l.pp. I·J6.
Rec&.\ S. (200()J .• '!lll' human aspects of coflaborative forecasting", Journal of Business I'()yteaslillg !lIe/hods & S:l'slems, VoL 19 :\0.4, pp. 3-9.
Safavi, iL (2000), "Choosing the right foret'W>1:ing software and system", jOl/mal oj /Jusiness ForeCIIsling J~lclhods & Systems. Vol. 19 ]\;0. 3. pp. 6-10.
Sanders, N. and Manroclt, K (1994), "FOfCl'<lSting practices in US corporations: survey results", inter/aces. Vol. 24 ),'0. 2, pp. 92·100.
Sparkes,].R and l\ldIugh, iLK (1984), "Awareness and use of forecasting techniques in British industry", }emma/ ((r Forecasting, VoL 3 No. 2, pp. 37-42.
Webby, R. and O'Connor, M. (1996), "Judgemental and statistical time series forecasting: a review of the literdt1.rre", II/Ie.maliow Journal of Forecasting, VoL 12 No. L pp. 91-118.
Efficient retailer assortment: a consumer choice evaluation perspective Abdelmajid Amine and Sandrine Cadena!
Abdelmajid Amine is Associate Profe5SOf of Marketing and Sandrin. Cadenat is Assistant Professor of Marketing, both at the University of Paris, IRG Research
Center, Creteil Cedex. France
W·§i·mi. Customer requirements, Retailers, Merchandising. Stores and supermarkets, France
This reseaIch shows that to reach their prime goal of
building an efficient assortment, retailers need, beside increasing the outlet's cost-efficiency, to evaluate shoppers' assortment perceptions so that what the store actually offers can be tailored to meet customers' needs and expectations. Our findings reveal that consumers' perceptions of the assortment range stems from the
combination of few indicators, mainly the number of stock-keeping units proposed and the availability of the lavorite brands, Also demons1Jates that consumers
evaluaiioo of the overall stOfe assortment draws 00 the perceived choice within the product categories where they are highly sensitive to the assortment rangt'.
fiMi"j,hiiU4i' The Emerald Research Register to< this journal is available at
http://www.erneraldinsight.comlresearchregister
The current issue and tull text archive at this journal is available at
http://www.erneraldinsightcoml0959-0552.htm
/mer",".",. JOlfnal of Ret>~ & Distributioo Management Volume 31 . NwrIler 10 ·1003 . PIl.486-497 i:' Mes UP Limlted • 155N 095~51
00110.1108109590550310497011
Introduction
The dense network of volwne retail outlets throughout France provides consumers with a
very wide choice of shopping opportunities.
Shoppers can competitively evaluate trade names with the same sales format (inttatype) against ttade names offering different sales formats (intertype competition) (Hansen,
2003). TIlls state of affairs makes it relevant
to take a global approach to the competition,
and is rdated to the acute COIlt.rut between
retailer trade names (Lambrey and Filser, 1992).
If volwne retatlers are to appreciate fully the stores that shoppers compare them to, their outlook must be broader than a mere intraryp.,..intertype approach. Mass merchandisers have to grasp how consumen
perceive their rctail outlets, based on the various consriruent factors of positioning.
In their :maIysis of tetail strategies, Belloun and Hclies.-Hassid (1995) break down the variables explaining retailers positioning into four heading:;: the stoTe (..,t-up, location, architecture, flow system, lighting), the assortment (size, product range, style, brand policy, presentation), pricing policy (overall price levels, price range) and services
(peUionnd, bw.iness hours, parking lot, after sales senice). The French grocery superstores have always focused on their conq>etirive advantage, resulting in practically the same prices at every superstore. As a result, volume retailers seek to gain their leading edge in the three other categories of variables. Considering the impact of the assortment
variable on the likelihood of store choice, studies dedicated [Q this topic remain relatively few compared to those devoted to price or location attributes. However, variety of as.ortment is progressively admitted beside the lIitter factors as the main reason why consumers patronize their favorite stores (Arnold d aI., 1983, 1996; SCcodip, 1997; Hoch tl aI., J 999).
It is widely recognized that traditional volume retailers have to control and limit the costs generated by ti,e size of their
assortment, namely by reducing low-selling
The authors grarefuliy acknowledge me IRG Res=ch Center, the D<panement TC de Cmeil and me FNEGE for meir financial mpport to this r""",ch. Thry also thank the anonymous review"", of me JownaJ for meir helpful rommentJ; and suggestions.
486
EffKient n-t ...... as.satment: a cmsuner dOce PYaluatioo per5pt'(lM
AbdeImajid Amine and 5andrilJe (adenal
stock-keeping wlits (SKUs) that curb d,e
cost-effectiveness of a product category or me
entire retail outle!. However, rna ..
merchandisers are obviously still relucUUlt to reduce meir SKUs lest they lose a share of
meir customers (Broniarczyk er oJ., 1998).
This observable fact clearly show. tIlat it is
rdc:V,mt to addle .. tile link hetwe<:n actual
assortment in a product category and tile
assortment perceived by the consumer. It also
raises the issue of the likely existence of an "efficient assortJllent range·t
., which can
respectively satisfy the needs, goals and constr..lints of both consumers and retailers
(Handelsman and MWlson, 1985). This
study focuses on how consumer assortment
image is formed, and proposes to enhance our
undersUUlding of shoppers' assortment range
perception of retail outlets and their store patronage.
Literature review and hypotheses
Assortment as a key variable of store
itnage and store patronage The image of a retail oudet is largely admitted
to be shaped from the combination of
cognitive and affective factors (lindquist,
1974; Zimmer and Golden, 1988; Finn and
Louviere, 1996). Assortment appears in a
good place beside price level, quality, services
and atmosphere. Since the initial work of Martineau (1958)
suggested that the store's image is the first factor that influences shopping behavior,
considerable research had establi .. Jied a link between store image and store patronage.
Monroe and Guiltinan (1975) and
Hirschman (1981) showed the importance
and impact of a store's image on some aspects of consumer behaviour such as selection or
patronage of a retail outlet. Arnold et aL
(1996, 1998) found dut if a retailer succeed
in being associated to the image of having a "strong community reputation" it may aff~ct
store choice and lower the inlpact of omer store attributes like price. Finn and Louviere
(1996) .howed that among a list of nine store
inlage attributes, wide assortment and low
prices accounted for 86 percent of the variance in share of choice. Bell (J 999) underlined significant relationships between
quality and range of products and stores and
consumers intent to patronize a retail center.
V ....... JI·_l0·]OOJ·~97
Besjdes me relationship between store inlage and store patronage, researches
fo~-used on identifying me most decisive factors for choosing a rerail outiet (Mazursky and Jacoby, 1986). Their finding> provided a reliable list of reasons why shoppers patronize a store:. Pric~, auortmcn( range" convenient
location, perceived product quality, and
customer service are the most commonly
cited factors.
Nevertheless, the weighting of price, assortment and products quality as most inlponant attributes in store choice, is not relevant uniformly across buying situations. Their weights can change radically. Van Kenhove er aL (1999) demonstrated that
store attnbutes salieJ1Ces varied significantly across task definitions. For instance, these authors showed that in case of an urgent purchase, consumers tend to value proximity of the store, quick service and product availabilit}, and to minor price, assortment range and even product quality.
In addition, the imponance of store choice
attributes seems to be store fonnat dependent. Hansen (2003) found that while high product quality and freshness of produC{S were ranked by specialty food ~-rores' conswners at the fIrSt two places, assortment
was number three, whereas low prices has
been ranked 17 (among 29 factors). Hov"ever, if we focus our analysis on
one-stop shopping, which represents for volume retailers fue purchasing situation of reference, me prevalence of price, assortment, location and quality cannot be avoided .... >hen choosing a retail oudet.
Providing customers wifu choice is fue same as altering the breadm or depth of the
assortment. However, since assorttnent size strictly depends on the available surface area in fue store, a volume rc:t:ailer will partially or fully meet consumer expectations, depending on outlet area. As a result, the smaller the outlet area, the more the retailer will have to choose between either providing a broad offering, meeting different types of needs wifu few variety wimin each type or having" more limited assortment wifu many choices wifuin each t}'Pc of need. In dlese conditions, the assortment range becomes a decisive factor of perceived positioning and, as a result, of retail outlet patronage.
Since me mid-l 990s, volume retailing has been trying to get a quart into a pint pot: consumers Want more asso.ro:nent; stores that
437

Wl(~'f" ,tt.iin Ol\I,4vtn .... "t "wfl~.nN dl(~r f"V.MlMtU:*'IIiII'f\lIill"Clivr
AJd-ImjjJd Amine j/,.} S.II,ilIilJe (ONkt..,r
do not nlect this expectation for variety arc
poorly perceived.. However, in the French
rctaillllarkctplacc for example, store arcOI hOI, nor gor much larger since rhe Ratfarin law[l] restricted superstores location.
If we take a Jook al the rc~u-icLions stemming from the non-growth of shelf
display area and from rhe cost-effectiveness
go"I, YOIUIIIC rctailers will have to lind a
balance between "'too many' and "not
enough" SKUs on sale. TIlls quandary is underscored by an empirical study (Chain,
1992) showing that, in some product
calegorics, an incrca!;4! in salc:\ L-; 35.:mctaled
with an incrcase in the number of SKU. (i.e. cereals, hair products). However, this study
also found lhat, in other producl calcgoric.."'S,
an increase in Sl{Us only confuses consumers and tcnds to detract from these products (i.c. scent water, best-sellers).
TIlls study suggests that there are factors that prompt a volume retailer to offer a
broader assortment to consumers as well as reasons that argue for a more limited assoranC'nt.
Factors in Javor oj increased asjortment
Several factors are likely to influence a volume retailer's choice of product variety (Lancaster,
1991). The first factor is a potential increase of demand following the offering of a broader
variety. Tangible evidence of this is higher
store patronage or an increase in the average
shopping cart. McKenna (1989) stated that consumers are living in an era of diversity where they "demand more variety and
assortment for aU sorts of products, ranging from cars to clothes". Consequently
consumer's need for variety affects the
quantitative and qualitative make-up of the a.»sortment. Koelemeijer and Oppewal (1999) showed that an increase in assortnlent size produces more additional purchases than changing/improving store ambience. In their
analysis of retailers' penomlance drivers, Dhar et ol. (2001) find out that the best
performing retailers are also those who offer
broader assortments. 'The second factor aile-cting assonment
growth involves the use of variety as a strategic dimension of retail store image. Wide assortment is viewed as an appealing
sCOre Ullage attribute valued by consumers because they are more likely to find ·what they
want when patronizing a score that offers more varied assortments (Hoch et ai., 1999).
LI'I1('fr..,-ciof'l." J(1Iurh01& of RM<* '" I)Klrib"hCln M"";~"fII"11 - -~ -------~---
ViJbrJ,t 31 . Hwnbtl 10' JooJ . ~97
Krishnan et ai. (2002) developed the notion of
assortment consistency, which is 3. tacit
COtUmi(lu\."t\{ of a n:tuikr (0 cany a give'll lSet
of brands, sizes, colors and flavors from one period to another, ~o that a con.<umer who looks for his preferred brands will be able to
find them for sure at that retail .ton:. The :lli.,o;tlTtnlent rang-= u. then used ali a
major di1Jcrclltiating (ac1ur ill the pusitloning
strategies of retail ouuets.
Factors promoting reduced assortnuml
The prime factor underl);ng the rductance to
broaden assoIlment ste.nJS from the limited
space in stores. Shelf space is not limitless. It is one of the scarcest resources in a retail
environment (Kahn, 1999). Mon: SKUs on
the shelf inevitably leads to poorer offering di.play readability. 'Dm incre.",,' rhe risk of shoppers confusion due to high variety
(Huffman and Kahn, 1998), thus heightening
me chances of negative consumer perception
of the store (Nielsen, 1999) . Research on product merchandising has
shown that optimum sales depend on a minimum shelf length for each item (Fady and Serer, 2000). TIlls concern of a minimum
occupancy argues for a repartition of the shelf
space among a limited number of brands
(wiul a sufficient number of SKUs each)
rather than to an atomization of the offering. MoreovCT, then: is an economic rationale (0
limited assortment, e.g. scale economies and
product cost-<iharing (Lancaster, 1991).
Volume retail strategy (low proln margins, high turnover) peculiar to mass
merchandlliing requires high sale potential for
each SKU and follows a rationale of limitUlg
their number. We can deduce from the analysis above that
market constraints (cons-umers and
competitors) are factors that prompt decisions
to broaden assoIlment whereas available shelf
space and the need for enough shelf facings per brand lead to the opposite trend.
Deeper insighr into the concept of
consumers" perceived assortment is key to
helping ~s merchandisers build their
assortment, and deal \\;th the abov<~
mentioned contradictions. However, in the literature few attempts have been made to
combine the consumers' and retailers'
assortment perspectives, whereas researchers
and marketers are increasingly aware of the
necessity to match consumer variety needs
lfrl(M'flt tl1 •• I" ;t\~"lm"'l1: .1 1I.,,\I.,n.., tI~"r rv •• hldlimllC1'\41N1M- 11I1"IIoifI~uJl'" 101.1,",.'11 vf R"~ • ~t"I"II~ ~"munnnl1 Al"Jdm.1jM Am}'11! .-1It) \.1I1~Ujl! l4tkl..." VlM,wH:' JI • Hurlll." HI, JOOJ ' "'-"~I -
with retailer assortment strategy Kapfercr and Laurent (1992) showed that
(Handelsman and Muson, 1985). "delight productsn such :a yogurt or jam tend
Research purposes and hypotheses Even if it i.s admittcd that whcn con5UnlCTti
shup, they arc exposed to a reality partially
controlled by the retailer (selection range, personnel, prices, colours, flavors, and s.o on), shoppen; du nut always evaluate variety mtionaUy (Williard Bishop Consulting,
1993). This result is consistent with the deformant property of the perception process
highlighted in COllSumer behavior literature
(Amine, 1999). In d,e perspective of testing d,e fit between consumers' and retailers' a,;sortrnent views, we hypothesize that
shoppers may perceive assortment range
differently from the effective assortment size. We formulate then the following hypothesis:
HI. The perceived assortment range "do
not" truly mirrored the actual offering
provided by the volume retailer.
Some research suggest that consumers' perceptions of the assonment range can
potentially be deduced from the presence of a set of indicators. For instance, a shopper, who is attached to a preferred brand shapes his/her
assortment range perception upon the availability of these brands at the retail outlet
(Bmniarczyck e1 aI., 1998). Moreover, one
can expect that for a shopper who is sensitive to the price variable, the perceived assortment
range in the store may depend on the availability of entl),-level priced items. Nevertheless, although there are several cues that can be potentially used by conSWlJers to form their assofUDent image, they are likely
\L~ing simplifying heuristics to make certain choices easier (Simonson, \999). Hence, we
suggest that, when forming their assortment perception, shoppers may use one or few
relevant indicators for evaluating choice variety, whatever the product category. Our second hypothesis C3l1 be fomlUlated as the
following: H2. Consumers may use one or very few
criteria to evaluate the assortment range at the product categury level.
Studies on shoppers variety seeking behaviors (McAlister and Pcssemier, 1982; Aurier, 1991; Simuru;un and \Viner, 1992) and on the na(Ure of product classes provide material for
theoretical research on the notion of the variety available to consumers. In a large study covering 20 product categoriesjI
to spur variety-sceking behavior. "Loyalty goods» like coffeeJ fOSle-I D)oderare or lukewarm need for variCl'Y4 However "utilitarian goods» like batteries or dish detergent do generate a low tendency to change behavior.
Therefore, a link can "'" made between consmners' level of need for variety and their assortment size expectations within the categories. Consequently, we can assume that the assortment image of the entire: store draws
on the consumer's perception of the assofUDent range on the shelves where the
need for variety is higher. We can then
express our third hypothesis: H3. Consumers draw on their perception
of the aV3l1able choice range in categories where they arc sensitive to
variety to form a global assoranent
image of the store.
Research method
In this research, we intend (0 oplore fir.;t what shoppers use to evaluate Ihe variety on
sale at the product category level and
throughout the smre. Then we will engage in
an evaluative approach of perceived assofUDent and how they shape choice range perceptions of retail stores. Hence, our data collection procedure covers both a qualitative and a quantitative phases.
Qualitative pilot study An c:xpl<.ratory qualitative study was conducted to clarifY what a wide assofUDent means for consumers, 3lld what cues they use to asses. choice range. This study serves also 10 know whether consumers' need for variety vary among product categories. A series of 14
semi-sttuctured interviews were performed involving consumers who do their own shopping or at least are actively committed to
this chore (including ten female and four male ,vilh different ages, marital status and occupations) .
Even if Ihe sample .-ize seems a priori limited, both of th~ exploratory nature of this research step and the principle of saturation (Glaser and Strauss, 1967) allow us to consider it as quite sufficient. According to this rule, the appropriate size for a sample in a qualitative study, is the (loe that permits to
489

[ffl<ient retai,", ~((l11Tl('1l1: a ({t1~""('r {hoin' t"V'ailMtim fl"~,p("(1iw
A1JjkJIII~jki Ami",,, ,MIJ _~.vIl.;'lr (.2(kiul
reach tllC theoretical saturation wherc any
additional observation do not more enrich or
improve significantly the alre:ody collected infonna rion.
The content analysis revealed that
respondents link the wide assortment in the produC[ calegories and throughout the storr.:
with an array of different indicators such as no
(visible) slOckout.ge, number of product
units (SKUs), availabiliTY of the favorite
brands, many brands, diverse produc"" products seen on TV, new products, atypical
products for limited targets, upmarket
products, different qualiTY levels, different color packagings, different price levels and
national brands. Hence, consumer assortment
perception initially seems fairly jumbled, .ince
it is potentially linked to a set of indicators
that can be used singly or together, depending
on the individual, and the shopping or usage
cirCUlllstances.
While certain cues have been mentioned
especially for a particular category (an
example of atypical product for limited target
would be ~light biscuits"), other indicators
have been cited for lUany product classes. The
larter cues arc mose thar have been rtrained
further for our quantirative investigation.
Interviews analysis also showed that
consumers' assortment size needs vary depending on the product category. They
gave us a firmer grasp on the product classes
where they have high, average and low needs for assortment variety. For instance,
respondents unanimously demand a large
assortment range at the yogurt counter, an average assortment at the shampoo, coffee,
and cookie counters, and express clearly less need for variety at the dish detergent or
battery counte ...
This apparent link between the need for
variery and dle assortment size expectations will be tested in the quantitative phase of the
research.
Quantitative research study This quantitative phase aims first to compare the perceived assortment range based on the
cues that emerge from the pilot study with
actual offering at two French volume retailers.
It looks also to assess in what extent these cues contribute to shape the perceived assoronent at the product category level and how tht: ovt:rall :itort: assortnlt:nt unage is built
by consumers.
IntftllJt,onill Joum<ll of Rt1f1iil A Oktribulloo a..imll9'-"f1M'01
vtJlunw JI • N""tLc. 10' Jool . 4at>-"~/
One type of large fonnat retailers was
selected: hyperrnarkets because of the role of
broad aSJ>ortments in dIe prevalence of
one-scop shopping (Messinger and Narsimhan, 1997). Consumers are supposed
to make a choice (of a hypermarket for
instance) on the basis of coM minimU.3tion
oyer transportation, e'Valuation and price
efforts (Krider and Weinberg, 2000).
Hypermarkets are big sized stores selling
food and non-food merchandises,
characterised by wide product assortments, low prices and high volume business (Arnold,
2000). This kind of large format: retailer has a
big econonUc weight in the French retail system .ince at the date of 1998, among more
than 1,100 hypermarkcL< counted in Prance,
over 100 of them realize about €153.5
millions in sales turnover each per yeo ... r
(Clique[, 2000). French hypermarkets sizes
ranged from 2,500m2 to 25,000m2 with an average surface of about 8,OOOm2 per store.
Owing to their large surface, hypennarkets are
(most likely to be) located in a suburban area
of towns, within large mopping centers that
improve multi-purpose purchases. We chose two average sized hypermarkets
belonging til two leading volume retailers
chains in France: Carrefour and Auchan.
These stores, located in the closed suburbs of
Paris at Porte Montrewl and Pone Bagnolet,
respectively, are 3km apart and their sius are
respectively about 8,500m2 and 10,OOOm2•
Based on the results of our qualitative
research, we decided to include in our
investigation three product categories while
dealing with high, moderate and low levels of
need for variety. Yogurt, coffee and dim
detergent categories were selected.
The questio1lnaire helped determine dle
aspects related to the evaluation of global
store assortment, and assess the assortment
range at the counters level. This was done by using either a single-item meahurement or
invariant indicators of assortment range
identified during the previous qualirative
phase. These cues cited commonly for various
product classes are: availability of natioJUl brands; favorite brands; new products; different price levels; multiple quality levels; and number of SKUs.
490
Eiflrient rrtaikr as.sffimefIt: a Cffi5OOlt'f <hoke ~UOJ(ioo petspecliw lrrlmlor1Km1 Journal of Retail & Di.s1,ibution Managemen1
AbtJeIm>jkl Am;n. >nd SiOl>dtkl< Cilderut V""" 31 • Number 10' 1003 • 486-497
nUlllks to a pretest with 60 shoppers, we Table I Number of SKU, per product (ali!gory (in-slore obse<vation,) ratified the questionnaire's items formulation and controlled the variance in aswrtrnent size <xpecrarions and need for variety at the three counters. Final data collection was carried out during the first tenn of 1999. A hybrid sampling procedure was used to select the
respondents. We first asked each third visitor leaving rhe checkout counter of rhe two
hypennarkcts to co-operate to the research.
We checked as we went along rhat we were close to French hypermarker customers distribution in terms of age and gender[2]. nle questionnaires were also spread across
the weekdays in order to cover the diversity of shoppers' profiles.
A total of 284 workable questionnaires was completed and processed. For methodological as well as managerial reasons, we found it relevant to break down shopper groups according to the nunlber of shopping
trips to Carrefour or Auchan during the last two months. This criterion was used as a
proxy for the respondent's familiarity with the assortment range and composition with.in
each hypermarket. Three shopper groups were identified: a first consumer sub-sample made nearly rhe same number of shopping
trips to both stores ("I = 90), a second group
shopped mosdy (more than 50 percent of
their purchases during the period) at Auchan
hypermarkct (112 = 96) and a third subs ample realized mainly their purchases at Carrefour (,,3 2= 98).
Each respondent was questioned on hislhcr perception and evaluation of the assonment range in the three product categories in the s[Ore that he or she regularly shopped (m
Aucllim or Carrefour for single shoppers
groups and in bodl stores for the two-store shoppers group).
Results discussion
The in-store observation of rhe number of SKUs in each product category gives the Aucllim store a clear advantage over the competing Carrefour, at the three counters. This can be seen in Table 1.
The aim of rhis first statistical analysis was [0 check whether the perceived differences between the two stores, at the counters and throughout the store (single item measurements) do or do not correspond with actual offering in these stores. Broniarczyk
Dish detergent Coffee
Auchan Superstore (AI 18 73 carrefour Superstore (0 13 62
Relative .,.,,(entage differences (A<)IA 27.8 15.1
et a1. (1998) found that consumers did not
perceive SKU, changes below 25 percent
threshold. According to this result and with
respect to the values contained in Table I we
can expect a significant difference of choice
perception betwcen d,e IWO storcs for d,c dish
detergent category.
Actual and perceived assortment range comparison
For the comparison purpose, the subsample
of two-store shoppers was used as a
benchmark to position the results in each of
the singlc-store shopper groups (Carrefour or
Auchan). The former group provides an
invariable assessment system of the two stores
since it is the same respondents who grade d,e
two outlets in which they regularly make their purchases.
Findings on Table II show that shoppers do
not perceive any difference in assonment
range between the two slores, at the dish
detergent counter whereas more SKUs are
actually sold and the devoted shelf space is 50
percellt bigger at Auchan. On the other hand,
they feel that Auchan, compared to
Carrefour, offers a wider variety at the coffee
and yogun counters, an observation
corroborated by actual offering (shelf space
differences are respectively 22 percent and 10
percent higher at Auchan). At this step of the
analysis, our results do not suppon rhe
variation's magnitude threshold of 25 percent suggested by Broniarczyk et a1. (1998).
Two l<:ssons should be drawn from these first findings: (l) Actual offering and perceived assortment
within the two stores are tightly coherent
at yogurT and coffee counters where cOIlSllmers' needs for variety are high.
Respondents were able to notice the fair
differences in assortment range at these
categories between the two s-cores. (2) There is an assimilation efkct of the gap
between actual and perceived assortment
in the dish detergent category where
choice sensitivity is low[3] whereas the
491
Yogurt
289
267
7.6
UfKietlt rt'tailef aswtmrot OJ (OIlSUInef choice evaluatioo JX'fst.)eftJvr
Abdelmajid Amine ill>II Sandrlne Cadenar
Illtefnatiooal Journal of Retail & [)jsuibotioo Management
Volume 31 • Numbet 10 • 1003 • ~9)
Table II Assortment range perceptions score< (two""tore shopp." group)·
Dish detergent (olfee Yogurt Overall store
Auchan Superstore (A) 3.64 4.05 4.18 4.37
(arrefour Superstore (e) 3.59 3.73 4.01 4.1 Paired I-test va)ue (A-C) n.s. 7.05'" 2.58" 2.13'
Notes: n, = 90; 'Average seores cairulated on fivei'oint Likert scal"" ranging from 1 (totally disagr.,.,j to 5 (completely agree) with assertions on the "assortment proposed"; • scores difference significant at p < 0.05;
•• scores difference significant at p < 0.01; ••• scores difference significant at p < 0.0001
effective offering in l'mchan was much
larger [han in Carrefour.
As a result, assortment management at product categories entails more than the
standard finaneial indicators of cost-effectiveness (i.e. items turnover). It gains to also involve c,)nrrolling a key variable - choice sensitivity - that is instrumental in deciding how much shelf space should be devoted to product families or subfamilies. TIlese conclusions suggest that the threshold below which consumers do not perceive as.sorUnr.:nl range variations should be
moderated by the choice sensitivity strength which is category specific.
Moreover, data in Table IT reveal that, for
the two-store shoppers, Auchan offers
broader overall assortment than Carrefour
(significant perceived difference at p < 0.05).
Their obsetvation i. substantiated by the real
offering at the two s(Ores either with the
number of SKU's proposed or the store size. Consumers seem to havC' an ovt:rall
representation of store space and product
offering that does mirror reality whereas, at the fragmented product class level, their sensitivity to choice range seems to shape the
perception they have of the assortment for
sale. Our first hypothesis seems to be rejected at the store level and partially supported at the category level.
Assortment range assesSIllent at the product category level We aimed here to assess to what extent variety indicaTors shape the assortment perception for the three shopper groups. Multiple regression analyses were perfonned using the
collected data about the six choice variety indicators (predictor variables) and the overall single item measurement of the asSOrUDc:nt
range per product class (the criterion variable).
Our statistical results (see Tables ill and IV show that for the three samples, assonment
range pl-rception at the di.-.h detergent, coffee
and yogurt categories can be almost solely
explained by dle cue of d,e perceived number
of SKUs available (t-values ranging from 3.4
to 9.23 all significant at p < 0.001). The regression models with e£Senrially this singk variable explain mainly 50 to 75 percent of the perceived assortment range variance
according to the store and shopper group. Two ocher indicators, the availability of leading national brands and the presence of
favorite brands, play an occasional but significant role in explaining perceived
assorunent evaluations in the categories under study. The three remaining items that were part of the multi-items mea"urement (for instance; new products availability,
different price levels and multiple quality
levels) were removed for parcimony and
collinearity reasuns[4]. On the one hand, the
cOlltnbutions of these variables were not
strong enough to be maintained within the
regression models. On the other hand, the latter two variables (price and quality levels)
were significantly correlated among
themselves .md with the number of SKU. and weakly related to the criterion variable.
Tn spite of the various a.sortment indicators identified during the qualitative phase, apparently consumers primarily use the
number of products proposed in the category and secondarily national brands and preferred brands availability when shaping their
assortment perception. TItis result supports
our second hypothesis. The analysis of the results at the three
counters show that the overall quality of fit in
the regres.ion models is dearly better for the yogurt (F statistics varying from 48 to 91.7) and coffee (F srati..rics ranging from 33 to 57.5) categories. This can be explained by the fact that these product classes foster quite high variety seeking bc:haviors, thus spurring
consumers to pay more attention to the wide range of available products.
492
EffKient r~ailer assatment: a COOSlnlt'f choi(t" evaluatirn petspectiw 1n''' .... ionaI Journal of R"'aiI A Distrilxrtim J.lanagemem
AbdeImajid Amine and Sandrine UJdenat Voiumo 31 . Numbet '0 • 1003 . ~97
Table III How choice range indicators contribute to assortment evaluation at product catego<y level (twCKtoce shOJlll'!f' group)
Product category Assortment range indicators /3 t-value Significance /'-statistic Ii
Auchan hypermarltet (n, = 90) Dish detergent National brands availabtlity 0.30 4.1 0.0001
Fav",ite brand availability 42.13 0.60 Num~er of SKU, propmed 0.64 8.61 0.0001
Coffee National brands availabijity 0.21 2.75 0.01 Fav",ite brand availability 0.20 2.65 0.01 57.5 0.67
Number of SKU, proposed 0.59 8.40 0.0001 Yogurt National brands availability
Fav",ite brands avaiiabUity 0.30 3.29 0.001 18.88 0.-40 Number of SKUs proposed 0.46 5.11 0.0001
Carrefour hypennarket (n, = 90)
Dish detergent National brands availaburty 0.22 2.56 0.01 Favorite brand availability 35.2 055
Number of SKUs proposed 0.57 6.54 0.0001 Coffee National brands availabUlly 0.20 2.46 0.01
Fav",ite brand availability 48.15 0.63
Number of SKUs proposed 0.62 7.96 0.0001 Yogurt National brands availabaity 0.20 2.26 0.05
Favorite brand availability 0.20 237 0.05 48.13 0.63
Number of SKUs proposed 0.51 5.91 0.0001
Notes: All F·tests ale significant at p < 0.0001
Table IV How choice range indiealOls conllibute to assortment assessment at counters level (single-sta<e shoppers group)
Product categOty Assortment range indicators f:J t-vaIue Significance 1'-statistic Ii
Auchan hyperrnarlcet (liz = 96) Dish detergent National brand, availability 0.23 3.08 0.005
fav",ite brand availability -40.1 0.57
Number of SKU, proposed 0.67 9.23 0.0001
Coffee Nalional brands availability 036 4.75 0.0001 Fav",ite brand availability 54.15 0.64
Number of SKUs proposed 0.51 6.85 0.0001
Yogurt National brands availabUlly 0.26 2.9 0.005 Favorite brand availability 0.14 2.17 0.05 91.7 0.75
Number of SKUs proposed 0.59 7.49 0.0001
CartefOUT hypmnarket (II] = 98) Dish detergent National brands availab~ity 0.44 4.16 0.0001
Favorite brand availability 24.56 0.44
Number of SKUs proposed 0.32 3.40 0.001
Coffee National brand, availability 0.39 4.43 0.0001 Fav",ite brand availability 32.93 0.51
Number of SKUs proposed 0.35 4.1 0.0001
Yogurt National brand, ava .. lability Favorite brand availability 0.24 2.n 0.01 51.79 0.62
Number of SKU, proposed 0.55 6.49 0.0001
Notes: All f.tests are signifi<ant at p < 0.0001
493
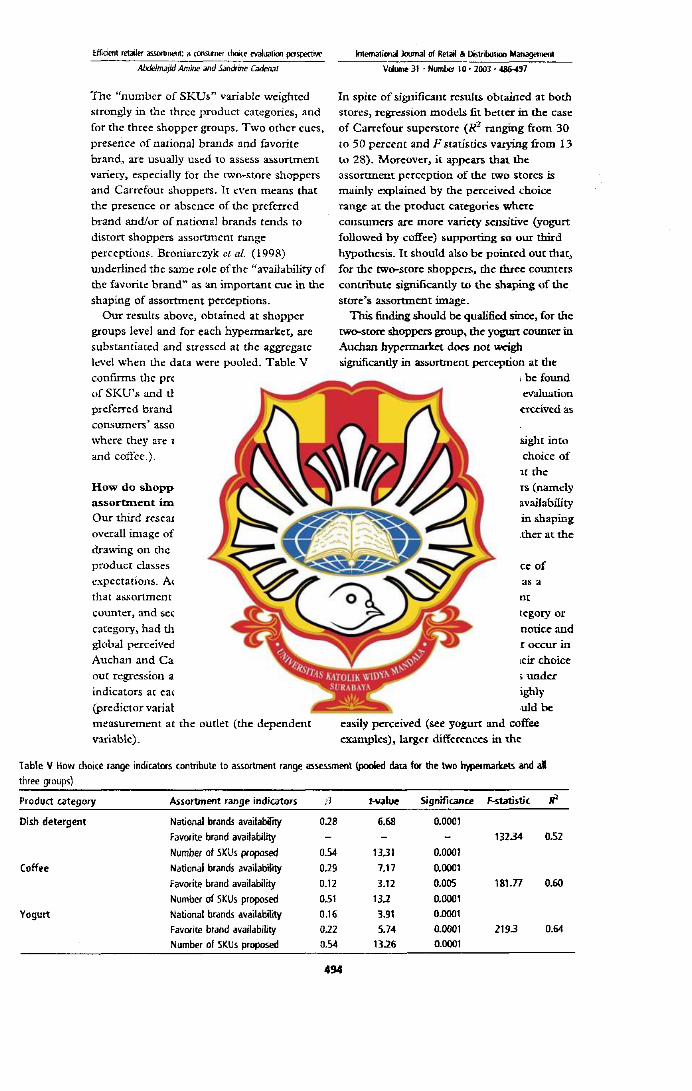
Hficient retaler as.sortmefIt: a consumer choke tv<duatioo pt'f5pe(11w
Abdeim.Jjid Amine and Simdrine eademt
11,e "number of SKUs" variable weighted strongly in the three product categories, and
for the three shopper groups. Two other cues,
presence of national brands and favorite brand, are usually used to assess assortment variery, especially for the two-store shoppers and Carrefour shoppers. It even means that the presence or absence of the preferred brand and/or of national brands tends to
distort shoppers assortment range perceptions. Broniarczyk el al. (l99R) underlined the same role of the "availability (If the favorite brand" as an important cue in the
shaping of assortment perceptions. Our results above, obtained at shopper
groups level and for each hypermarket, are substantiated and stressed at the aggregate level when the data were pooled. Table V confinns the prevailing weight of the number of SKU's and the significant role of the preferred brand availability in shaping
consumers' assortment in the categories where they are more choice sensitive (yogurt and cof}"ee.).
How do shoppers build the overall store assort:Jnent iJ:nage?
Our third research goal addressed how the overall ullage of store assort.nlent was shaped,
drawing on the perceived assortment at the product classes generating higlJ variety
expectations. According to H3, we expected that assortment perception at the yogun
counter, and .econdarily at the coffee product
category, had the most decisive impact on the global perceived image (If assortm=t at the Auchan and Carrefour stores. So, we carried
out regression analyses of assortment
indicators at each of the three categories
(predictor variables) on the overall assortment measurement at the outlet (the dependent variable).
vm.n. 31 . Number 10 ·1003 ·4l!6-497
In spite of significant results obtained at boch stores, regression modcls fit better in the case
of Carrefour superstore (J?! ranging from 30
to 50 percent and F scatistics varying from 13 to 28). Moreover, it appears that the assortment perception of the two stores is mainly explained by the perceived choice range at the product categories where
conSWl1ers are more variety sensitive (yogurt followed by coffee) supporting so our third
hypothesis. It should also be pointed out that, for the two-store shoppers, the three counters
contnbute significantly to the shaping of the store's assortment image~
This finding should be qualified since, for the two-store shoppers group, the yogurt counter in Auchan hypel1l1llrlcc-t does not wcigb significantly in assortment perception at the corporate level. The explanation can be found in the low v-.uiation in the assortlnent ev'dluation
of this counter, that is unanimously perceived as providing a wide range of variery[5].
Our findings provide a deeper insight into how the assortment image and the choice of
an outlet are shaped. They highlight the impact of few choice range indicators (namely
number of SKUs, national brands availability and presence of the favorite brand) in shaping the assomnent range pcccqJtions either at the
category or the store levels. We also demonstrate the relevance of
conSUlners choice range sensitivity as a
significant variable in the assortment
evaluation either at the product category or
the entire store levels. Shoppers do notice and react differently to the changes that occur in the assortment size according to their choice sensitivity at the product categories under
study. While small differences in higlJly
choice sensitive product classes would be easily perceived (see yogurr and coffee examples), larger differences in the
Table V How choice range indicators (ontribute to assortment range assessment (pooled data for the two hypetmarket5 and at three groups)
Product category Assortment range indicators I} ,-value Significance F-statistic 1i'
Dish detergent National brands availabifny 0.28 6.68 0.0001
Favlllite brand availability 132.34 0.52
Number of SKU, proposed 0.54 1331 0.0001
(off •• Nauonal brands availabifny 0.29 7.17 0.0001
Favorite brand availability 0.12 3.12 0.005 181.77 0.60
Number of SKU, proposed 0.51 13.2 0.0001
Yogurt National brands availability 0.16 3.'11 0.0001
Favlllite brand availability 0.22 5.74 0.0001 2193 0.64
Number of SKU, proposed 0.54 13.26 0.0001
494
EffKient rf'taler as.satment: a {(lJlSllllff dri<e evaluatim petSPt'(1Mo
AbdeITniJ[Id Amine and SanOOne CiJderot
assoruncnt size in less choice sensitive categories would not be noticeable by consumers (dish detergent).
Implications of these results for retailers' assortment policy are discussed below.
Condusions and implications for assortment management
This research shows, in the specific case or two French leading hypcrmarkcts, the
relevance of matching consumers' variety
needs wim retailers' assortment strategy. rt
establishes that the product classes proposed in a retail outlet do not contribute equally to the store's variety image and attractiveness from the customers point of view. It also demonstrates that consUlllcrsJ perceptions of the overall store assortment draws on me assonment range perceived at those categories where consumers are highly sensitive to choice range variety. These first findings are very interesting because they show that a retailer's assortment policy does not always payoff when the effort is focused on product classes where consumers do not expect to find a wide variety.
From a theoretical standpoint, this research can deepen our insight into consumers" assortment evaluation process. It shows that
the assortment evaluation at the category level sterns from the combination of few indicators,
such as me number of available products (SKUs) Or the presence of major brands. This result is in accordance with Koelmeijer and Oppewal (1999) experimental study on customers' assortment perceptions at a
flowers retail outlet. These authors find out that shoppers shape their assortment size perception by drawing on very few indicators, mainly the perceived number of aV3.11able SKUs. We also demonstrate that tile presence of the favorite brand plays a significant role in shaping the assortment perceptions especially when dealing with products where the consumer is much more committed to a particular brand. This finding supports Broniarczyck et aL's (1998) conclusion on the
positive impact of me preferred brand availability in forming consumers' perceptions of choice range variety.
Our work also identifies an explanatory variable - choice sensitivity - of the possible
distortions between real and perceived assorunent (in the sense of under- or
v ...... 31 • Number 10 • 1003 . 486-497
over-evaluating the acmal assortment range proposed). Hence an assimilation effect
occurs between perceived and actual
asso.rtJnent range when consumers are not highly choice sensitive at the product category even if there are significant effective
differences (dish detergent). On the other
hand high choice sensitivity can incur a
concrast effect e"en though me real differences or changes are weak (coffee and
yogurt).
This choice sensitivity key variable allows finally to sharpen Broniarczyk tl aL's (1998)
findings in the sense that the threshold's
magnitude under which the assortment variations are noticed by customers are category specific.
Since our outlook i. to further the guidelines for an efficient assortment policy, we can suggest some action levers for retail management. Our research shows that a store's assortment image is shaped from the perceived assortment at Ihe categories where variety expectations are the strongest. To help mass merchandisers allocate shelf spacc .• the choice sensitivity variable can serve to assess consumer expectations and can supplement the financial and economic ratio». It allows volume retailers adjust the number of SKU. on saJe without reducing custonlers'
assortment image or store patronage. Thus the product classes where shoppers are highly
choice sensitive can be used as a lever to
improve the patronage by offering a wide variety including the favorite brands. Inversely, retailers can reduce items number in the categories where consumers are less sensitive or have less assortment range expectatiom without altering neither the category nor the store attendance and sales.
So, evaluating shopper choice sensitivity contnbutes to streamlining retailers assortment range. How D1Uch assortnlen£ can be pared down by removing the lowest selling items without displeasing or losing a part of the store customers is to be determined per product category. We believe that experim=ts controlling assortm=t size and make-up to evaluate the impact on
assortment evaluation and oudet patronage could be productive.
Research limitations Some limitations to our investigation have to be pointed out. Our data collection procedure was not purely a probabilistic sampling and
495

urKk'tlt rl"tiiltof ~5«tmf1'Jt a {ltl<;1,.lIft' {huin' t"v.MlJ<ltN:ll pn!>r"~liw
Al"klllt.,IM A'lllfI,. ~"I ',,,/1 •• 11,,. (~,k-".JI
this might have influenced our data
processing results. 'This mu&( be solved by
involving retailers more tightly to the research
to access (0 Cllst0l11ers databa.ses and select
randomly the subjects for the study. Another potential limitation sterns in the number of product categoricfoi and srores sdected for this
research that are limitative in number and
nafure. Thus further research could he-of.:fir fr01l1 diven .. and large number of products, more retail stores and perhaps help [0
eslahlil;h houndary conditions for our ",suIts. Our contribution clears the way for
additional research to extend our knowledge and understanding of consumer reactions to
the available products at a store. We feel that
incorporating situational factors into the analysis of assortment perception is a productive avenue of research. A study with this outlook (Simonson and Winer, 1992) has already shown that the number of purchases in one product category, during the same .hopping trip, has an impact on perceived assortment. TIlt: 'more purchases there arc,
the mun: consumers an: prUlnpled to buy
diffc.rc.nt variants of the product., and as a
result, [0 look differently at the assortment available at the counter. Other situational fac(ors, such as time pressure or purchase urgency, are potentially interesting ro include
in further research since they seem to have an impact on the perceived assortment range and on the indicators marshaled by consumers for this purpose.
Notes
The Raffarin law on stores location (1996) requires from relailers who intend to open new stores of more than 300m' to ask for a special authori13tion. This French law has considerably reduced the number of new retail outlet> creations.
2 Our S<lmple presents the following distri:xrtion on the aiteria of gender (30 percent of males vs 70 perrent of lemales) and age (25 percent of the subjects were contained between (2().30 years), 27 percent induded in (31-40), 25 percent contained betweefl (41·50) and 23 pertent induded in (51-70)).
3 This concept of choice sensitivity can be defined as the importance given by the consumer to the choice range variety in his evaluation process.
4 The problem of multi-<ollinearity is said to be present in a multiple regression analysis where predictor variables are highly correlated among themselves. ~en it occurs, the multi-<oUinearity phenomenon alterates the efficiency and the meaning of the estimates for the regression
1I11f'fn.l1iorlfil ~ of Mt"t...s lit ~l,ibulion ManagE'mmt
l/u'Uf'lK' J J ' Nu",I .. , 111' JOtI J •• .II(,4'J/
parametl!fs. However, !he assumption of multHollinearity is ollen .. oIaled beause many Vilriables of interest in mneting V<1I"f together· (Cluchill, 1991 p. 843).
5 Mean score (M) ~ 4. I 8 (on a five-point Ukert scale ranging from 1 (totaUy disagree) to 5 (completely agree) with assertions on the ·assortment proposedi; standard deviation (SO) = 0.48; roeffkjent of variation ((SDIM)) x 100) = 11,5 percent This weak coefficient of variation (below 25 percenO indiGlles a low disper,,;on of the obsE!lVed values' distribution,
References
Amine, A (1999), Le comportement du CDIl50mmateut face aux variables d'ac!ion marketing. Editions Management et Societe. Caen.
Arnold, SJ, aOOO), ·Market impacts of large fonnat retailer5", Journal of Retailing and Consumer Services. Vol. 7 No 4, pp. il~v.
Amold, SJ., Oum, T.H. and Tig<'rt, OJ. (1983), "Oetennining attributes in retaa patronage: seasonal, temporal, regional, and international ~risons", Journal of Marketing Research, Vol. 20, May, pp. 14')·57.
Arnold, SJ, Handelman, J. and Tig.,~ OJ. (1996), "Organizational legitimacy and retail store patronage", Journal of Business Research. Vol. 35 No 3, pp. 22~39.
Arnold, 5.1 •• Handelman, J. and Tigert. 0.1 (1 ~B), "The impact of market spoil ... on consumer preference structures (or What happen' when WaJ·Mart COlnes to town)", Journal of Retailing and Consumer Services. Vol. 5 No 1, pp. 1-13.
Aurier, P. (1991), ·Recherche de variet.;: un concept majeur de Ia theone en marketing", Rechetr:he et AppIkations en Marketing. Vol. 6 No 2, pp. 85-106.
Bell, S.I. (1999), "Image and <OO5\Jmer attraction to " inl"",""", retail areas: an envirorwnentaJ psychology apprOilch", Joumal of Retailing and Consumer Services. Vol. 6 No 2, pp. 67-78.
Benoun, M. and Helies·Hassid.. M.·L (1995), Oislriburion: Adeurs et SlTategies, Economica. Paris,
Sroniarayk S.M., Hoyer, W.O. and McAlister, L (1998), ·Consumers' perceptions of the assortment offered in a 9f"""Y Gltegot}': tt... impact of item reduction·, Journal of Marketing Research. Vol. 35, May, pp. 166-76.
Chain, C. (1992), Distribution. La rfwIution Markeling 00
I'odjssee de I'enseigne, ~ditions liaisons, Paris. ChurchilL GA (1~1), Marketing Res&lKh.
Melhodologkal Foundations, The Otyden Press, Orlando, FL
diquet. G. aOOO), "Large format retailers: a French IJacition despite reactions", Jourrnl of Retailing and COIlSlIllI<'r Service<, Vol. 7 No 4, pp, 183·95.
Dhar, S.I(., Hoch, S.J. and Kumar. N. (2001), ·Effective GI1egoty management depends on the role of the GI1egoty", Joornal of Retailing, Vol. n No. 2, pp. 16544.
Fatly, A. and Seret M. (2000), I.e Merchandising: T echniqves modemes du commerce de detail, Vuibert. Paris.
496

Efficient ,{'tailer assat1JK'fn: a cmsumt'f choice Mualioo perspectivt
AlxJeImajid Amine aIld S."drine CJdenJt
Finn, A and louviere, J.1, (1996), "Shopping cenler image, coosideration and choice: anchor slore cootrilxItion", Journal of Business Re>earch, Vol. 35 No. 3, pp. 241-51.
Glaser, B.G. and Slrauss, AL (1967), The Discovery of Grounded Theory: Strategies fOf QuaJililtive Research, Aldine de Gluyter, New YOlk, NY.
Handelsman, M. and Muns.." l.M. (1985), "On integrating consumer needs for variety with retailer assortment dedsions", Proceedings of tire Association for Consumer Research, ACR, pp.l08-11.
Hansen, T. (2003), "Intertype competition: specialty food stores competing with supermarkets", 1oorna/ of Retailing and Consumer Services, Vol. 10 No.1, pp. 35-49.
Hirschman. E.e. (1981), "Relail research and theory", in Enis, B.M. and Roering. K.l. (Eds), Review of Marketing. American Marketing Association, Chicago, 1[, pp, 12()-33,
Huffman, C. and Kahn, B.L (1998), "Variety fOl sale: mass custornization or maSS confusion ?", Journal of Retailing, Vol. 74 No.4, pp. 491-514.
Hoch, 5.J., Bradlow, E.T. and Wansink, B. (1999), "The variety of an assortment", Marketing Sdence. Vol. 18 No.4, pp. 517-46.
Kahn, B.E. (1999), "IntroC:uction to the special issue: assortment planning", Journal of Retailing. Vol. 75 No.3, pp. 2SS-93.
Kapferer, l.-N. and Laurent G. (1992), La SffiSibilit,; aux marques, Editions d'Organisation, Paris.
Koelmeijer, I( and OppewaJ, H. (1999), "Assessing the effects of assortment and ambience: a choice experimental approach", Journal of Retailing. Vol. 75 No 3, pp. 319-45.
Krider, R,E. and Weinberg, CB, (2000), "Product perishability and multistore grocery shopping", Journal of Retailing and (onsumer Services, Vol. 7 No, I, pp, 1-18.
Krishnan, T" Koelemeijer, I( and Rao, R. (2002), "'Consistent assortment provision and service provision in a retail environment", Marketing 5dence, Vol, 21, No I, pp, 54-73.
lambrf)', B. and Filser, M. (1992), "la polari1l' per~e des enseignes en distribution: une analyse dynamique", Ades du Berne Congres de I'MM, lyon, pp. 367-79.
lancaster, I( (1991), "l'analyse economiQue de la variete de produits: une revue de la litterature", Redrer,he
Volume 31 'Number 10' lOO3 '4B0-497
el Applications en M.rketing, Vii. 6 No. I, pp.53-84,
lindquist, J.D. (1974), "Meaning of image", Journal of RelaiTmg, Vol 50 No. 4, pp. 2S-38.
McAlister, L and Pessemier, E. (1982), "Variety seeking behavior. an interdisciplinary review", JoumaJ of (onsmner Research, Vol. 9 No 3, pp. 311-22.
Martineau, P. (1958), "The personality of the retail store", /Jaward BUSiness Review, Vii. 36, JanuarylFebruary, pp.47-55,
Mazursky, D. and Jacoby, J. (1986), "Exploring the dewlopment of store images", Journal of Retailing. Vol. 62 No.2, pp. 14~S.
McKenna, R. (1989), "Marketing in age of diversity", Hatvard Business Review, September-October. pp. 25-6.
Messinger, P.R. and Narsimhan, C. (1991), "A model of ",tail fannats based on consumers' economising time", Marketing Science, Vol. 16 No. 1, pp. 1-23.
Monroe, 1(8. and Guiltinan, J.P. (1975), "A path analytic exploratioo of retail patronage inlb!nces", Journal of Marketing Research, vii. 2, Jme, pp. 1 H8.
Nielsen (1999), "Evolution de I'offre marchande en GMS de 1994 a 1999", 27 emes Joume.s Annuelles de I'IFM (Institute Fran{ais du MerchanalSing), December, Paris.
~codip (1991), Marketing HantIJook, Paris. Simonson, I. (1999\, "The effects of product assortment on
buying preferences", Joomaf of Retairrng, Vol. 75 No.3, pp, 347-70,
Simonson, I. and Winer, RS. (1992), "The influfll(e of purchase quantity and display format 00 consumer preference for variety", loutnal of (oosurner Research, Vol. 19 No. I, pp. 133-8.
Van Kenhove, P" De Wulf, K. and Van Waterschoo~ W. (1999), "The impact of tasI: definition on stortS!ttribute saliences and store choice", Journal of Retailing, Vol. 7S No. I, pp, 125-48.
Williard Bishop Consulting ltd and Informaton Resources Inc. (1993), "Variety 01 Wplication: a process to know where you stand", report prepared for tire Food Millketing Institute.
Zimmer, M.R. and Golden, LL (1988). "Impressions of mail stores: a (()lItent analysis 01 consumer images", Joutrnl of Retailillg. Vol. 64 No.3, pp.26S-93.
" ,,,- I'f )
... -";. ,,~ .... ~~- ~
, ~ .... l:ir..;.(& -~-,.-. ~.--... ---.-----.....I
497