Manajemen Frekuensi dan Manajemen Mobilitas pada...
61
Manajemen Frekuensi dan Manajemen Mobilitas pada Teknologi Seluler ALFIN HIKMATUROKHMAN., ST.,MT S1 TEKNIK TELEKOMUNIKASI SEKOLAH TINGGI TEKNOLOGI TELEMATIKA TELKOM PURWOKERTO 2016 http://alfin.dosen.st3telkom.ac.id/profile/
Transcript of Manajemen Frekuensi dan Manajemen Mobilitas pada...

Manajemen Frekuensi dan Manajemen Mobilitas pada
Teknologi SelulerALFIN HIKMATUROKHMAN., ST.,MT
S1 TEKNIK TELEKOMUNIKASISEKOLAH TINGGI TEKNOLOGI TELEMATIKA TELKOM
PURWOKERTO 2016http://alfin.dosen.st3telkom.ac.id/profile/
Cluster
2
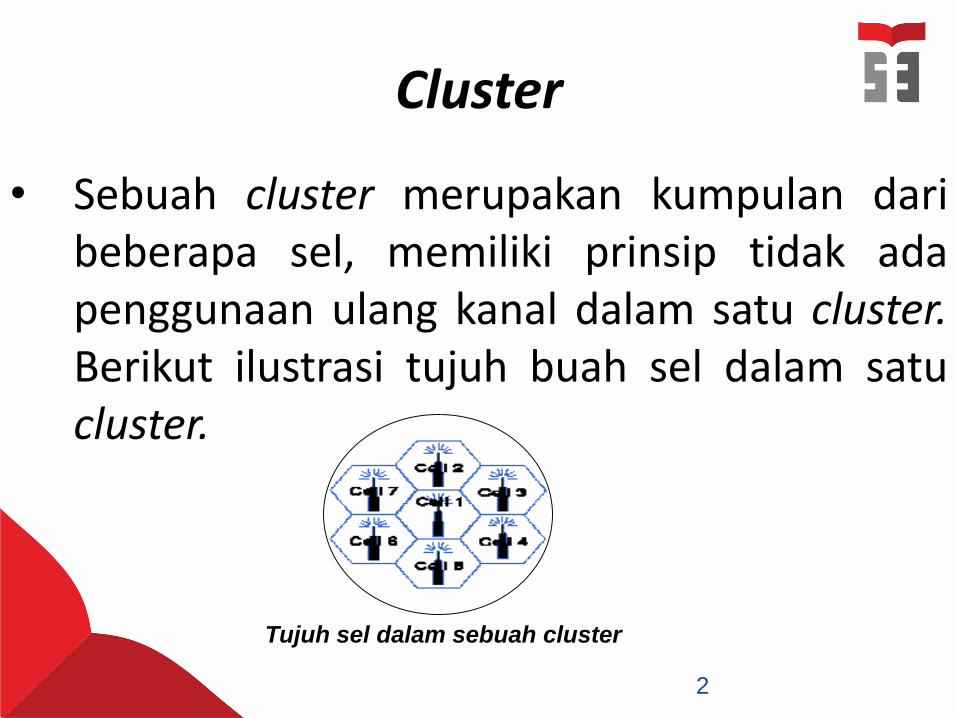
• Sebuah cluster merupakan kumpulan daribeberapa sel, memiliki prinsip tidak adapenggunaan ulang kanal dalam satu cluster.Berikut ilustrasi tujuh buah sel dalam satucluster.
Tujuh sel dalam sebuah cluster
3
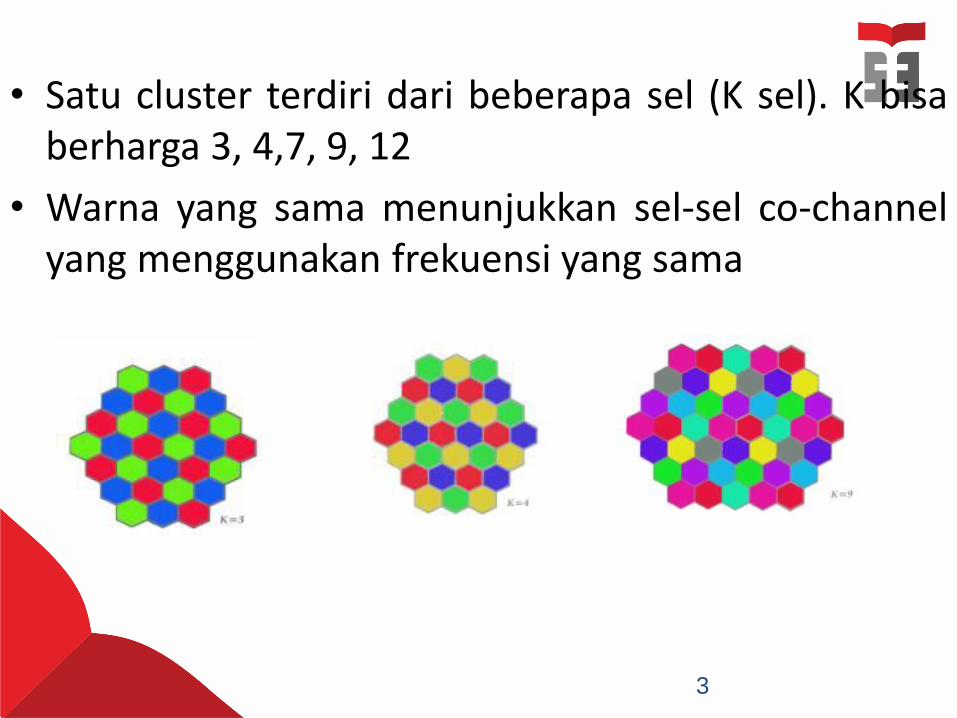
• Satu cluster terdiri dari beberapa sel (K sel). K bisaberharga 3, 4,7, 9, 12
• Warna yang sama menunjukkan sel-sel co-channelyang menggunakan frekuensi yang sama
4
Parameter Geser
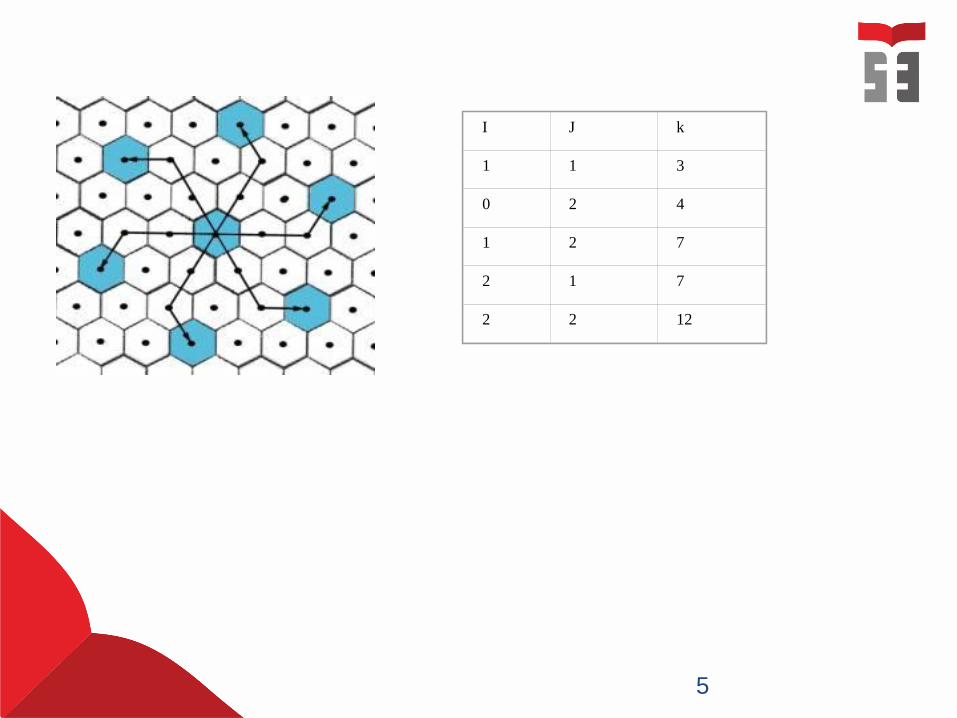
• K pada bentuk sel heksagonal ditentukan oleh parameter geser I dan J.
• Persamaan : K = I2 + IJ + J2
• Penentuan sel dengan frekuensi sama (cochannel sel) adalah sbb. :
• Pilih salah satu sel, namakan (misalnya sel A)
• Tarik garis lurus sejauh I melalui salah satu sisi sel A
• Berhenti di pusat sel, lalu putar 60o
• Tarik lagi garis tersebut sejauh J, berhenti di pusat sel.
• Namai sel tersebut sel A.
• Lakukan cara tersebut di atas melalui sisi yang lain dari sel A
pertama tadi
5
I J k
1 1 3
0 2 4
1 2 7
2 1 7
2 2 12
Alfin Hikmaturokhman, MT
http://sinauonline.org
6
Ilustrasi Menentukan Sel Cochannel
I J K
1 1 3
0 2 4
1 2 7
2 1 72 2 12
A
60 o
A
A
A
A
AA
7
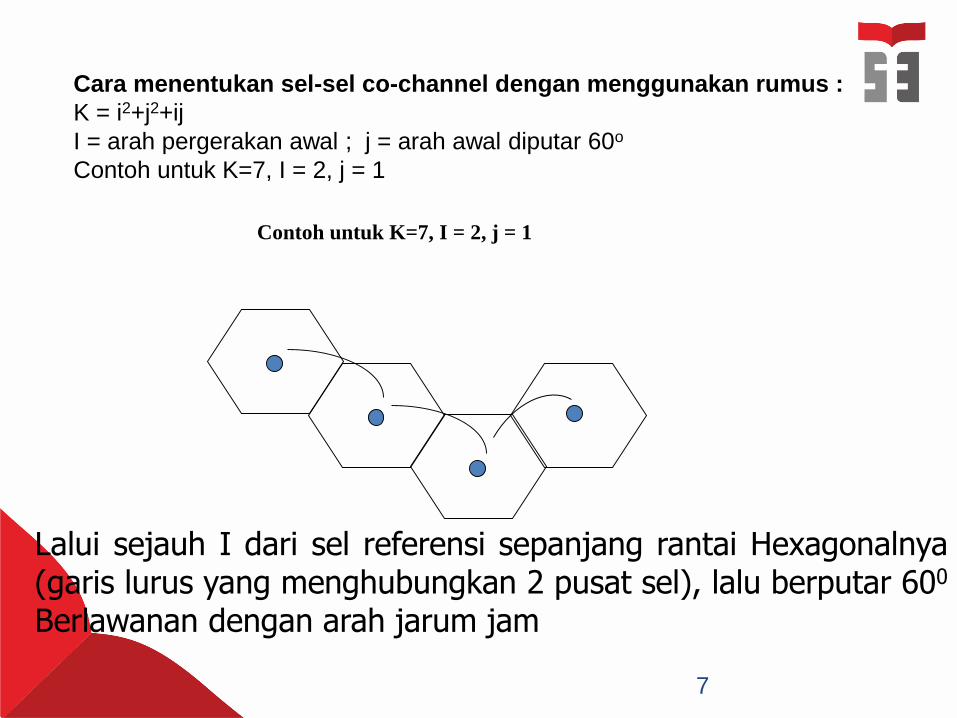
Contoh untuk K=7, I = 2, j = 1
Lalui sejauh I dari sel referensi sepanjang rantai Hexagonalnya(garis lurus yang menghubungkan 2 pusat sel), lalu berputar 600
Berlawanan dengan arah jarum jam
Cara menentukan sel-sel co-channel dengan menggunakan rumus :
K = i2+j2+ij
I = arah pergerakan awal ; j = arah awal diputar 60o
Contoh untuk K=7, I = 2, j = 1
8
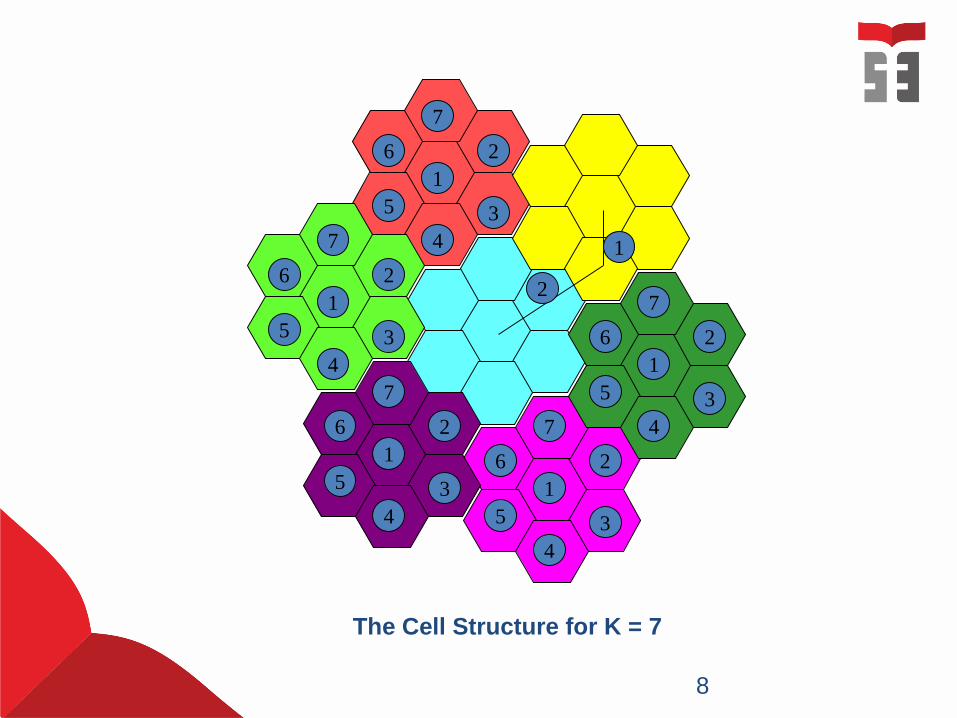
The Cell Structure for K = 7
1
2
3
4
5
6
7
1
2
3
4
5
6
7
2
1
1
2
3
4
5
6
7
1
2
3
4
5
6
7
1
2
3
4
5
6
7
9
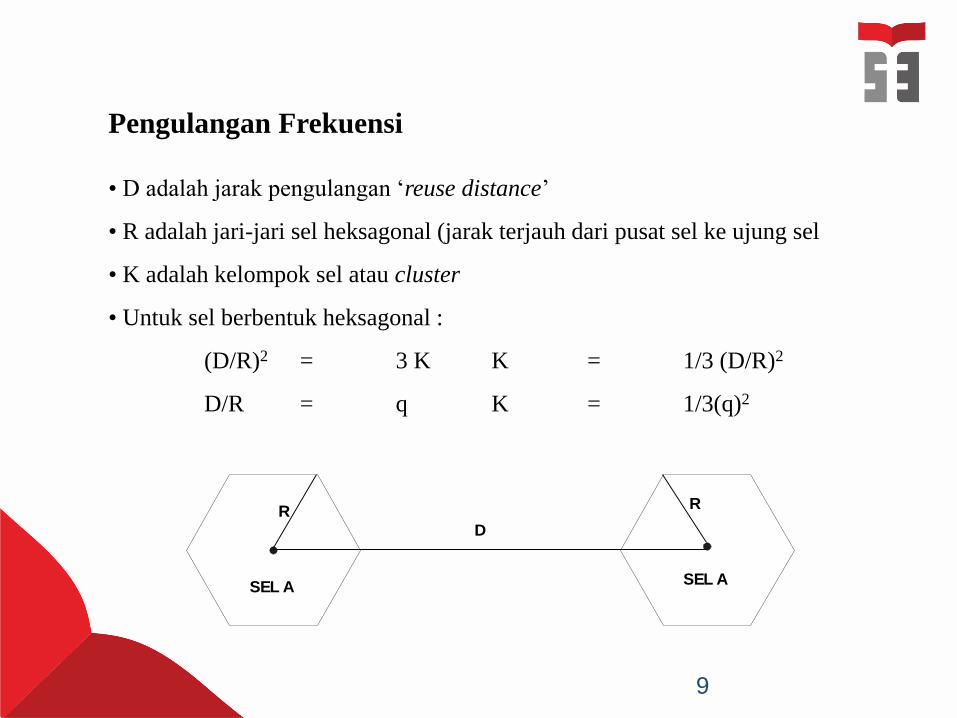
Pengulangan Frekuensi
• D adalah jarak pengulangan ‘reuse distance’
• R adalah jari-jari sel heksagonal (jarak terjauh dari pusat sel ke ujung sel
• K adalah kelompok sel atau cluster
• Untuk sel berbentuk heksagonal :
(D/R)2 = 3 K K = 1/3 (D/R)2
D/R = q K = 1/3(q)2
D
R
SEL ASEL A
R
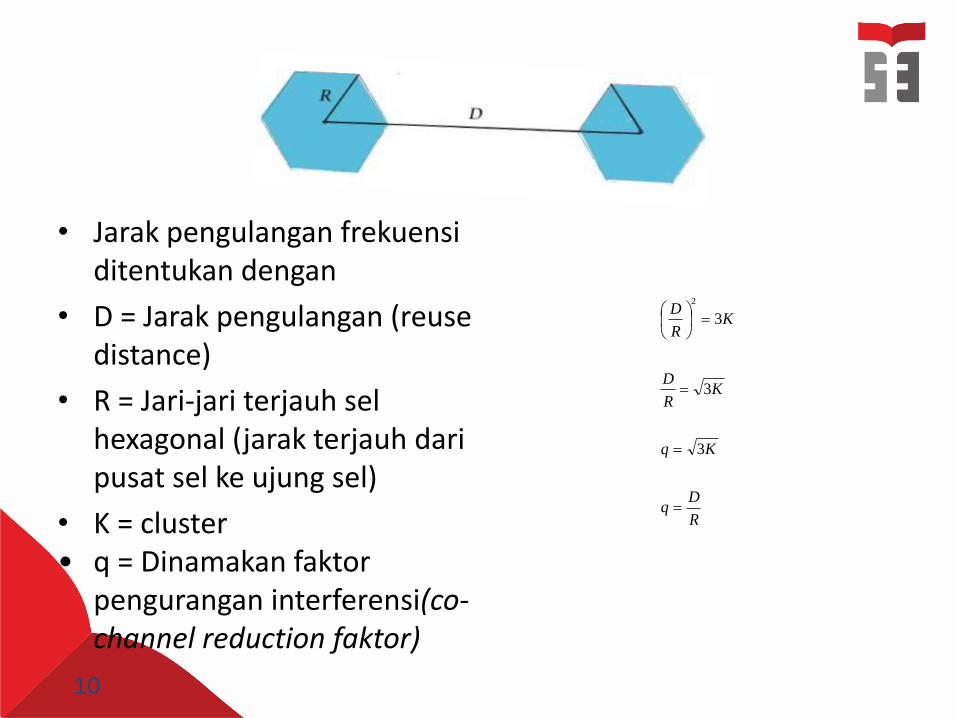
• Jarak pengulangan frekuensi ditentukan dengan
• D = Jarak pengulangan (reuse distance)
• R = Jari-jari terjauh sel hexagonal (jarak terjauh dari pusat sel ke ujung sel)
• K = cluster • q = Dinamakan faktor
pengurangan interferensi(co-channel reduction faktor)
R
Dq
Kq
KR
D
KR
D
3
3
3
2
10

EFISIENSI SPEKTRUM
Jumlah maksimum kanal yang dapat dialokasikan pada lebar pita frekuensi
yang disediakan.
selkelompoksetiappadaselJumlahK
kanalsatufrekuensipitaLebarB
disediakanyangtotalspektrumLebarB
sel/kanalK.B
Bm
c
t
c
t
I
C
3
2K
6
q
I
C
q6
1
I
C
3
qKK3q
4
4
2
sel/kanal
I
C
3
2.B
Bm
c
t
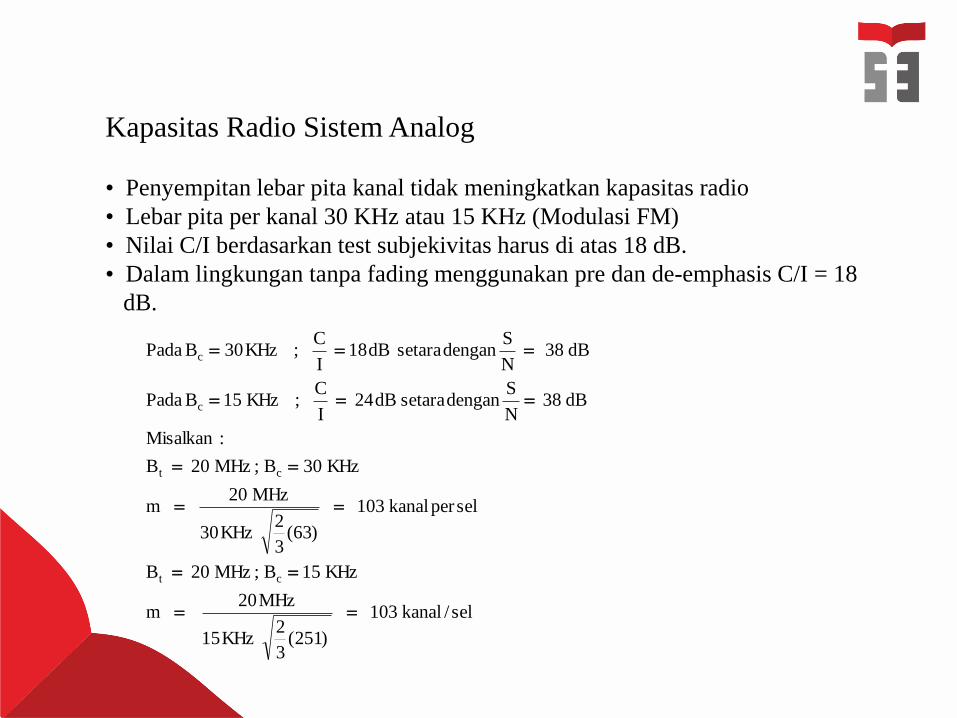
Kapasitas Radio Sistem Analog
• Penyempitan lebar pita kanal tidak meningkatkan kapasitas radio
• Lebar pita per kanal 30 KHz atau 15 KHz (Modulasi FM)
• Nilai C/I berdasarkan test subjekivitas harus di atas 18 dB.
• Dalam lingkungan tanpa fading menggunakan pre dan de-emphasis C/I = 18
dB.
sel/kanal103
)251(3
2KHz15
MHz20m
KHz15B;MHz20B
selperkanal103
)63(3
2KHz30
MHz20m
KHz30B;MHz20B
:Misalkan
dB38N
SdengansetaradB24
I
C;KHz15BPada
dB38N
SdengansetaradB18
I
C;KHz30BPada
ct
ct
c
c
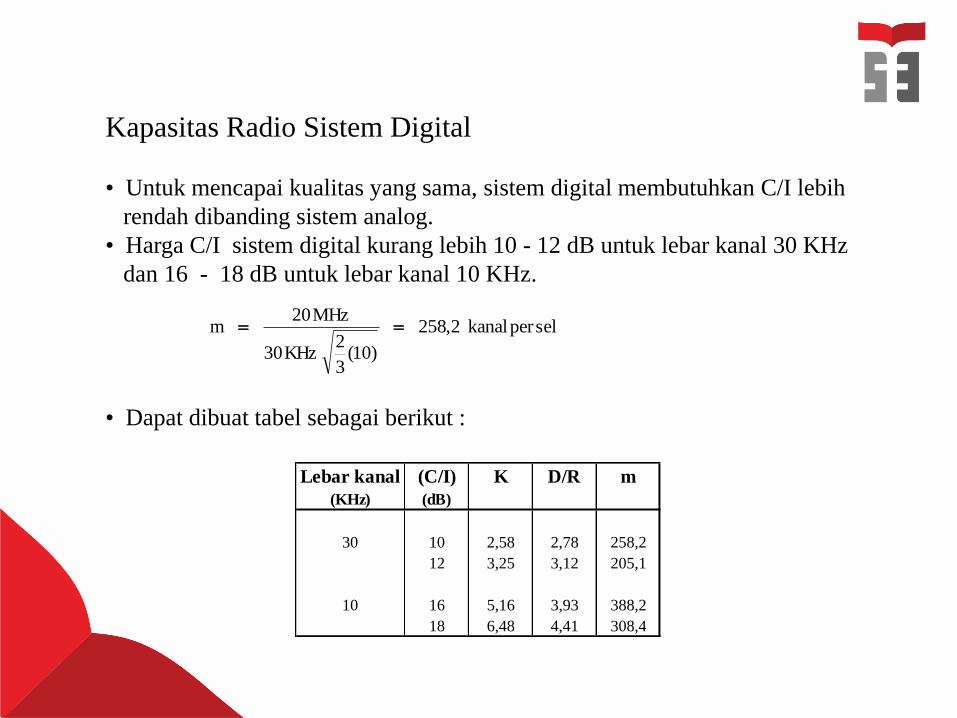
Kapasitas Radio Sistem Digital
• Untuk mencapai kualitas yang sama, sistem digital membutuhkan C/I lebih
rendah dibanding sistem analog.
• Harga C/I sistem digital kurang lebih 10 - 12 dB untuk lebar kanal 30 KHz
dan 16 - 18 dB untuk lebar kanal 10 KHz.
• Dapat dibuat tabel sebagai berikut :
selperkanal2,258
)10(3
2KHz30
MHz20m
Lebar kanal (C/I) K D/R m
(KHz) (dB)
30 10 2,58 2,78 258,2
12 3,25 3,12 205,1
10 16 5,16 3,93 388,2
18 6,48 4,41 308,4
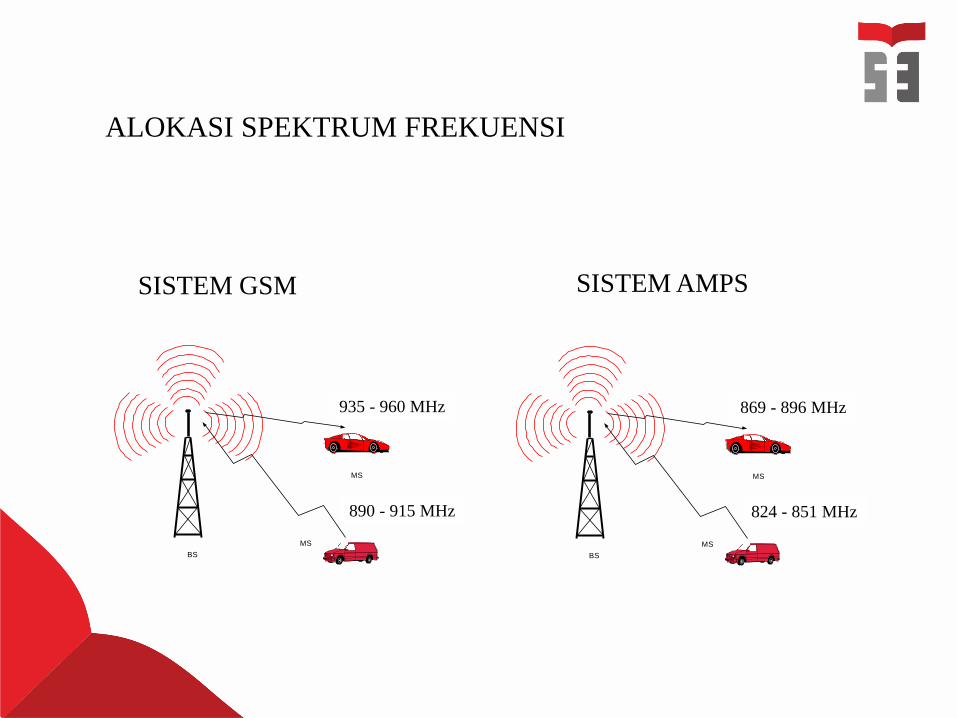
ALOKASI SPEKTRUM FREKUENSI
SISTEM GSM SISTEM AMPS
935 - 960 MHz
890 - 915 MHz
MS
MS
BS
824 - 851 MHz
869 - 896 MHz935 - 960 MHz
890 - 915 MHz
MS
MS
BS
935 - 960 MHz
890 - 915 MHz
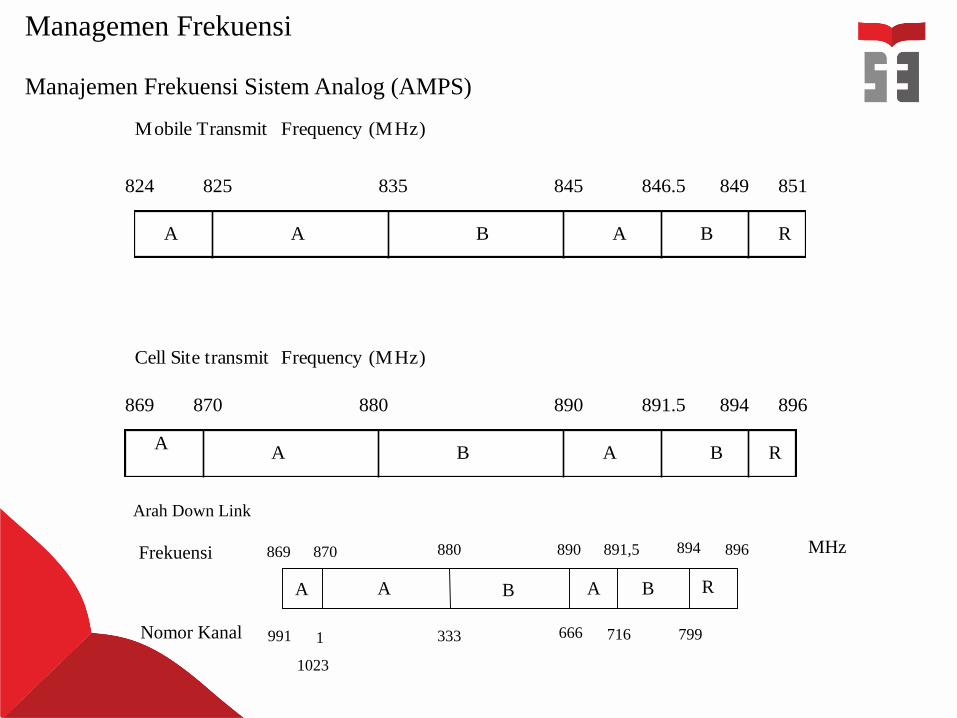
Managemen Frekuensi
Manajemen Frekuensi Sistem Analog (AMPS)
A A B A B R
Arah Down Link
Frekuensi
Nomor Kanal
869 870 880 890 891,5 894 896 MHz
991 1 333 666 716 799
1023
A A B A B R
824 825 835 845 846.5 849 851
Mobile Transmit
AA B A B
Cell Site transmit
869 870 880 890 891.5 894 896
Frequency (MHz)
Frequency (MHz)
R
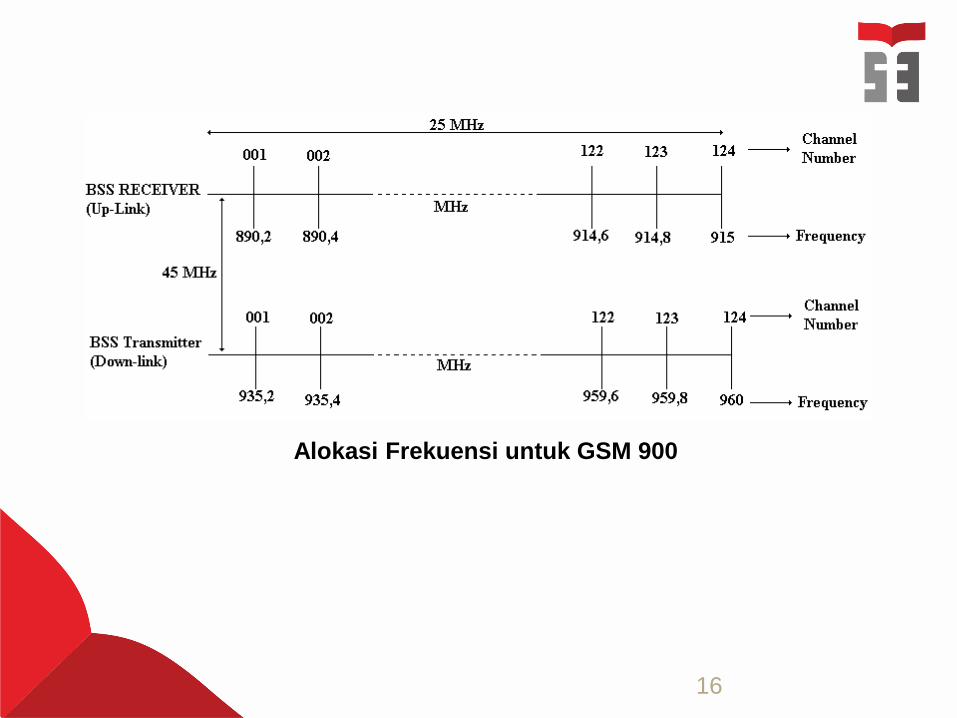
16
Alokasi Frekuensi untuk GSM 900
17
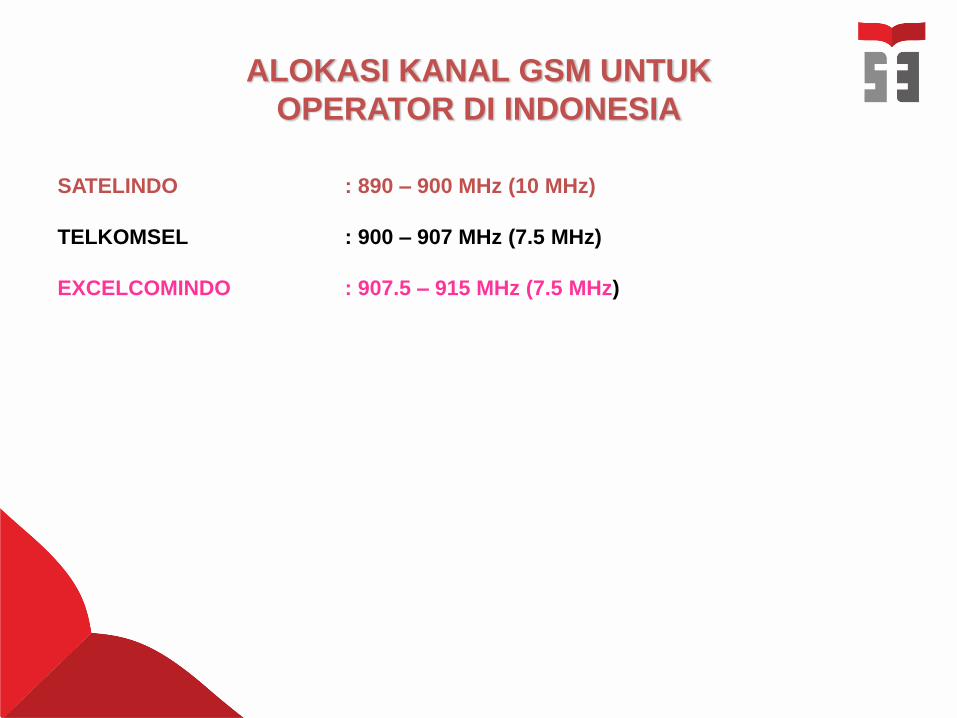
ALOKASI KANAL GSM UNTUK
OPERATOR DI INDONESIA
SATELINDO : 890 – 900 MHz (10 MHz)
TELKOMSEL : 900 – 907 MHz (7.5 MHz)
EXCELCOMINDO : 907.5 – 915 MHz (7.5 MHz)
19
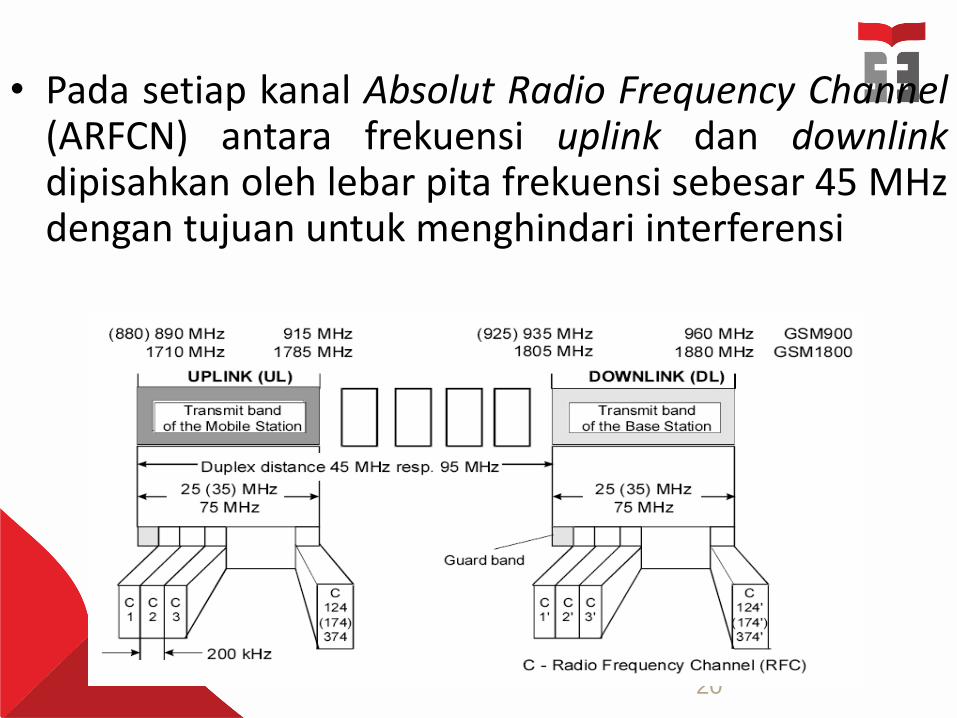
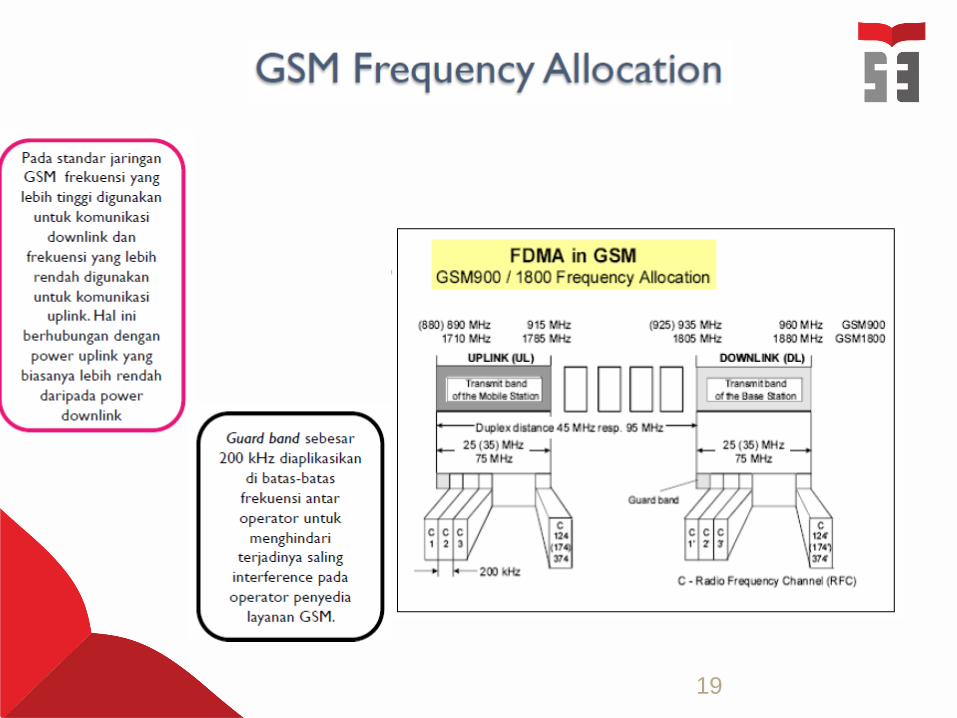
• Pada setiap kanal Absolut Radio Frequency Channel(ARFCN) antara frekuensi uplink dan downlinkdipisahkan oleh lebar pita frekuensi sebesar 45 MHzdengan tujuan untuk menghindari interferensi
20
Alokasi frekuensi GSM berada pada 890 – 960 MHz. Uplink (spektrum frekuensi pembawa yang digunakan MS
untuk mengirim informasi ke BTS) sebesar 890 – 915 MHz
Downlink (spektrum frekuensi pembawa yang digunakan BTSuntuk mengirim informasi ke MS), sebesar 936 – 960 MHzyang terdiri dari 124 kanal radio GSM yang dikenal dengannama ARFCN (Absolut Radio Frequency Channel) denganmasing-masing kanal memiliki lebar pita 200 KHz
Satu kanal pada GSM terdiri dari 8 time slot yang mempunyai lebar band 200 KHz.
Jumlah Kanal pada sistem GSM 124 Kanal. Kanal No 1 dg frekuensi pancar utk Tx- Mobil 890,20 MHz dan
untuk Tx-RBS 935,20 MHz. Kanal No. 124 dg frekuensi pancar utk untuk Tx-mobil 914,80
MHz dan untuk Tx-RBS 959,80 MHz
21
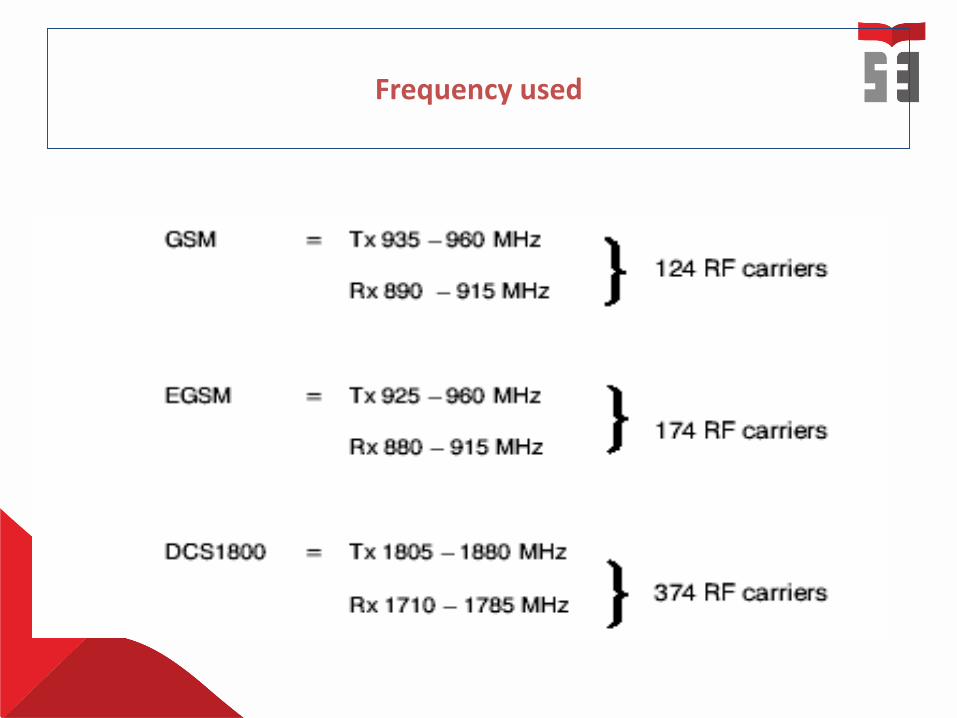
Frequency used
23
24
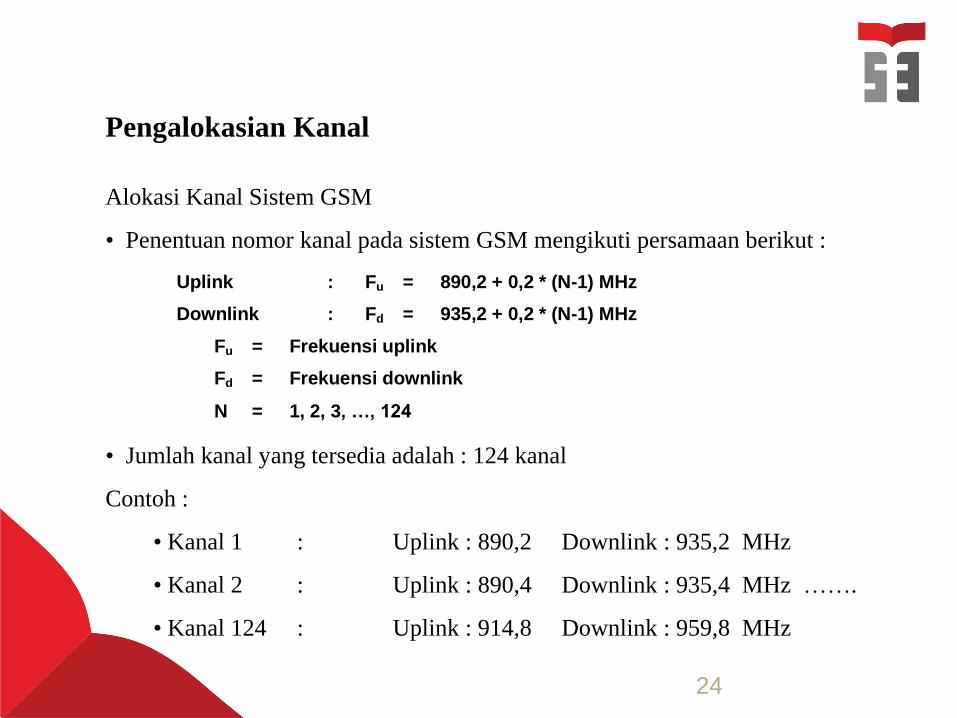
Pengalokasian Kanal
Alokasi Kanal Sistem GSM
• Penentuan nomor kanal pada sistem GSM mengikuti persamaan berikut :
• Jumlah kanal yang tersedia adalah : 124 kanal
Contoh :
• Kanal 1 : Uplink : 890,2 Downlink : 935,2 MHz
• Kanal 2 : Uplink : 890,4 Downlink : 935,4 MHz …….
• Kanal 124 : Uplink : 914,8 Downlink : 959,8 MHz
Uplink : Fu = 890,2 + 0,2 * (N-1) MHz
Downlink : Fd = 935,2 + 0,2 * (N-1) MHz
Fu = Frekuensi uplink
Fd = Frekuensi downlink
N = 1, 2, 3, …, 124
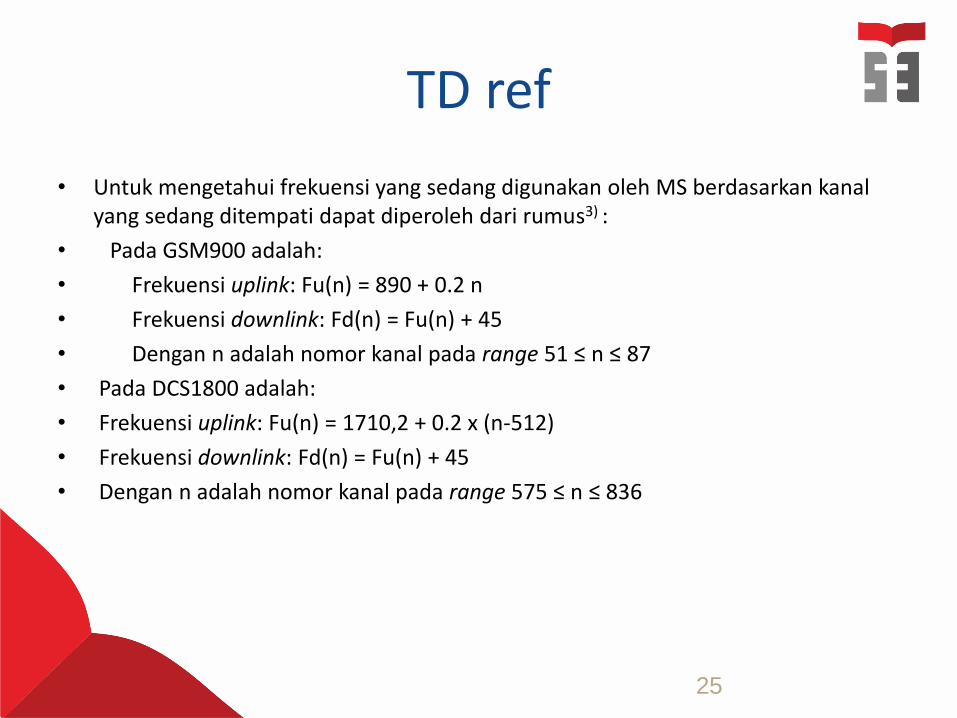
TD ref
• Untuk mengetahui frekuensi yang sedang digunakan oleh MS berdasarkan kanal yang sedang ditempati dapat diperoleh dari rumus3) :
• Pada GSM900 adalah:
• Frekuensi uplink: Fu(n) = 890 + 0.2 n
• Frekuensi downlink: Fd(n) = Fu(n) + 45
• Dengan n adalah nomor kanal pada range 51 ≤ n ≤ 87
• Pada DCS1800 adalah:
• Frekuensi uplink: Fu(n) = 1710,2 + 0.2 x (n-512)
• Frekuensi downlink: Fd(n) = Fu(n) + 45
• Dengan n adalah nomor kanal pada range 575 ≤ n ≤ 836
25
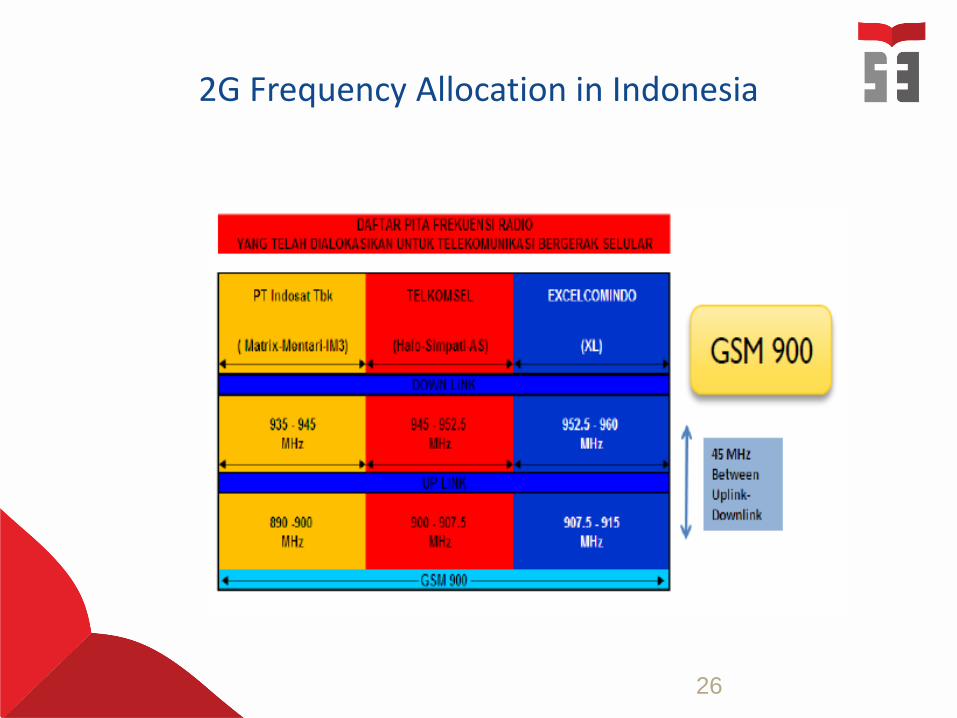
2G Frequency Allocation in Indonesia
26
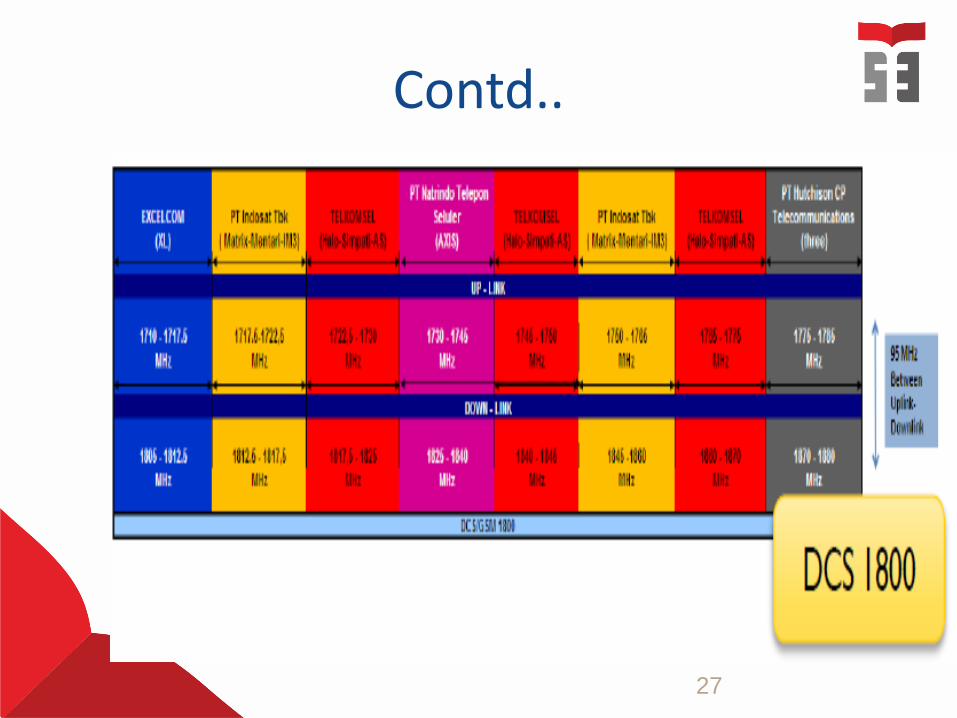
Contd..
27
900M
1800M
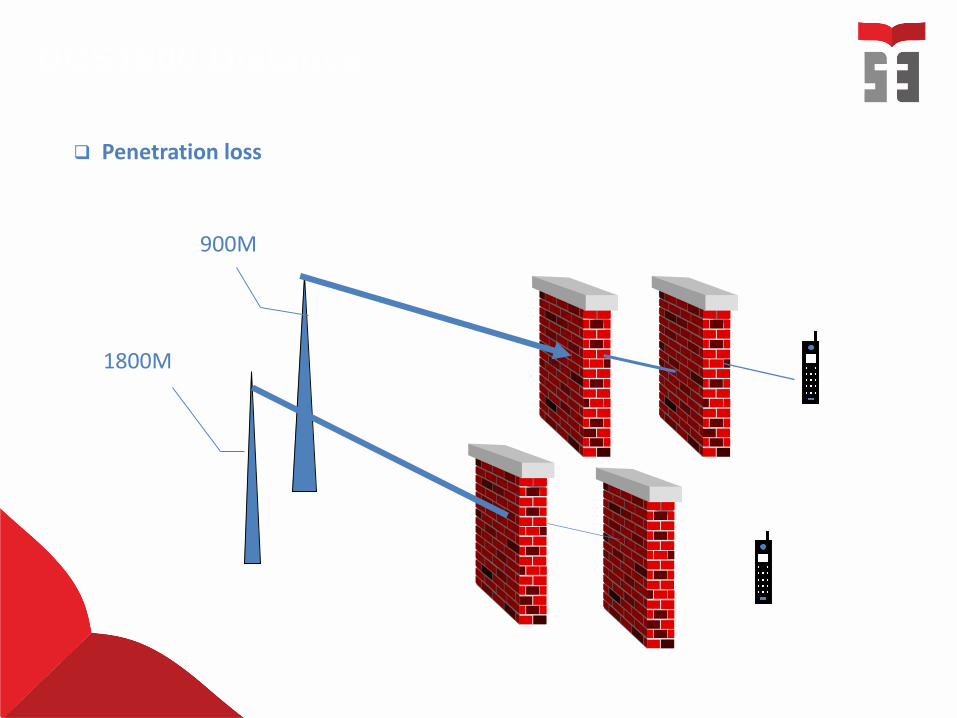
Penetration loss
DCS1800 Distance
UMTS frequency bands
• In telecommunications, UMTS frequencybands are the radio spectrum frequenciesdesignated for the operation of the UniversalMobile Telecommunications System (UMTS) /High-Speed Downlink Packet Access (HSDPA) /High-Speed Uplink Packet Access (HSUPA) /HSPA+ / system for mobile phones.
UARFCN
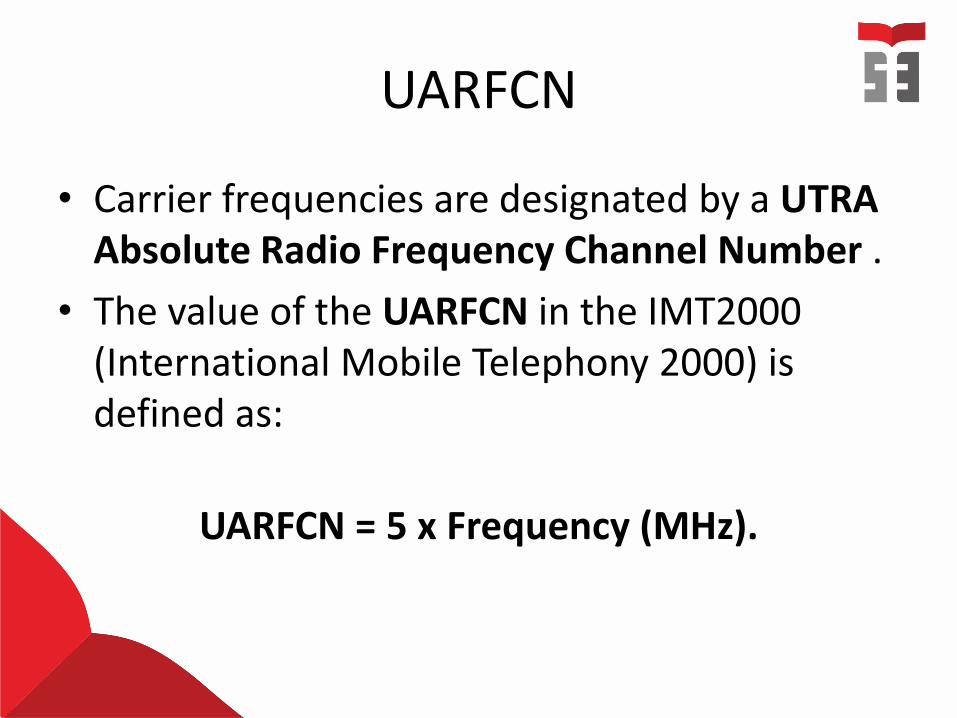
• Carrier frequencies are designated by a UTRA Absolute Radio Frequency Channel Number .
• The value of the UARFCN in the IMT2000 (International Mobile Telephony 2000) is defined as:
UARFCN = 5 x Frequency (MHz).
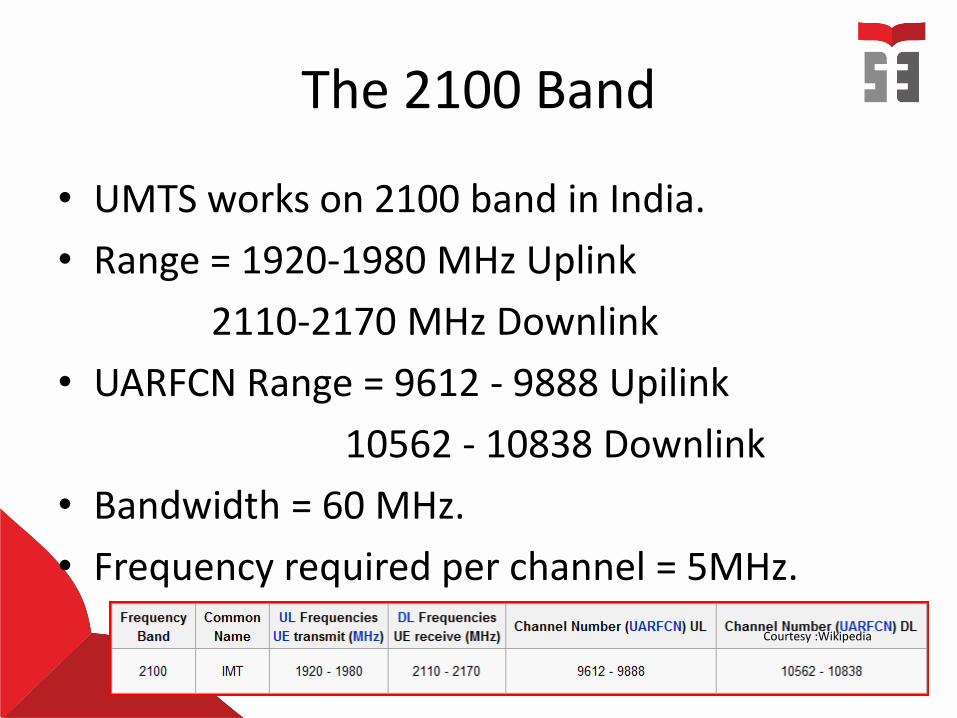
The 2100 Band
• UMTS works on 2100 band in India.
• Range = 1920-1980 MHz Uplink
2110-2170 MHz Downlink
• UARFCN Range = 9612 - 9888 Upilink
10562 - 10838 Downlink
• Bandwidth = 60 MHz.
• Frequency required per channel = 5MHz.
Courtesy :Wikipedia
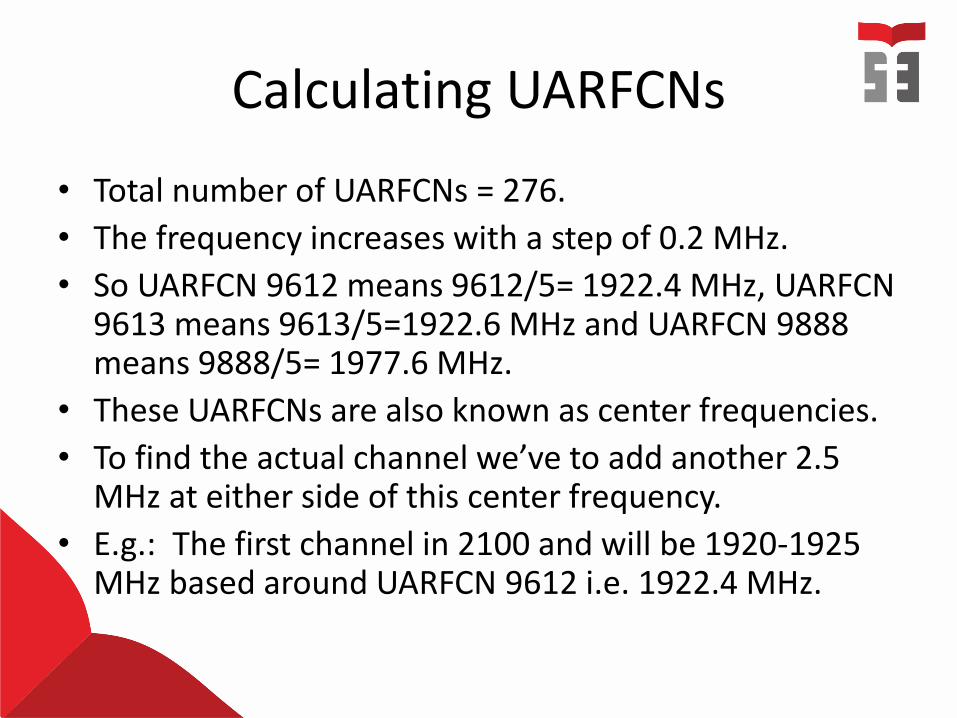
Calculating UARFCNs
• Total number of UARFCNs = 276.
• The frequency increases with a step of 0.2 MHz.
• So UARFCN 9612 means 9612/5= 1922.4 MHz, UARFCN 9613 means 9613/5=1922.6 MHz and UARFCN 9888 means 9888/5= 1977.6 MHz.
• These UARFCNs are also known as center frequencies.
• To find the actual channel we’ve to add another 2.5 MHz at either side of this center frequency.
• E.g.: The first channel in 2100 and will be 1920-1925 MHz based around UARFCN 9612 i.e. 1922.4 MHz.
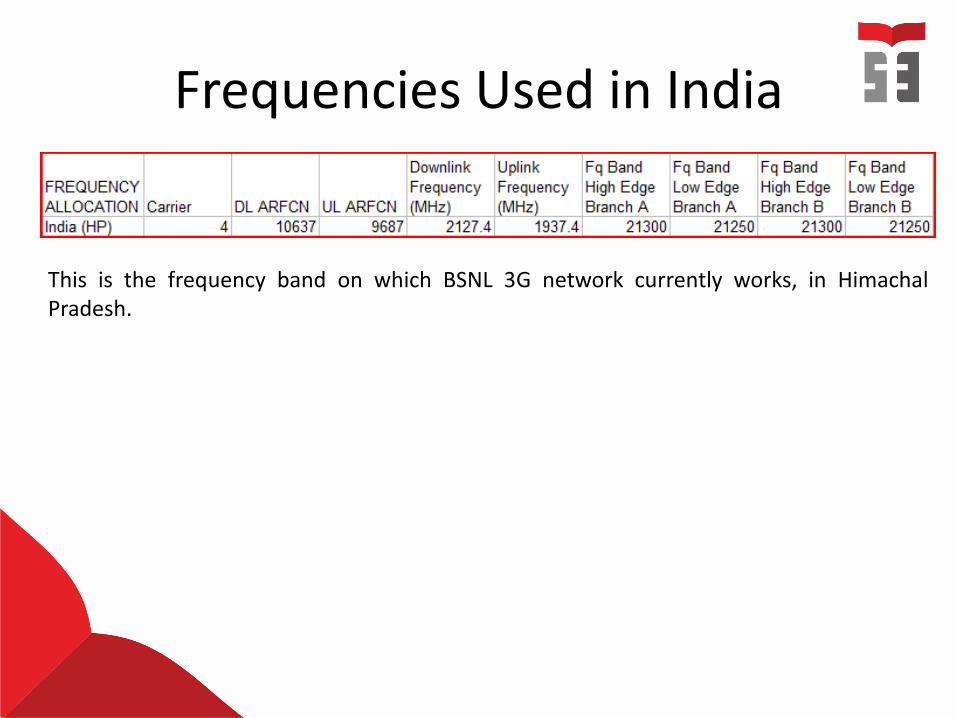
Frequencies Used in India
This is the frequency band on which BSNL 3G network currently works, in HimachalPradesh.
3G
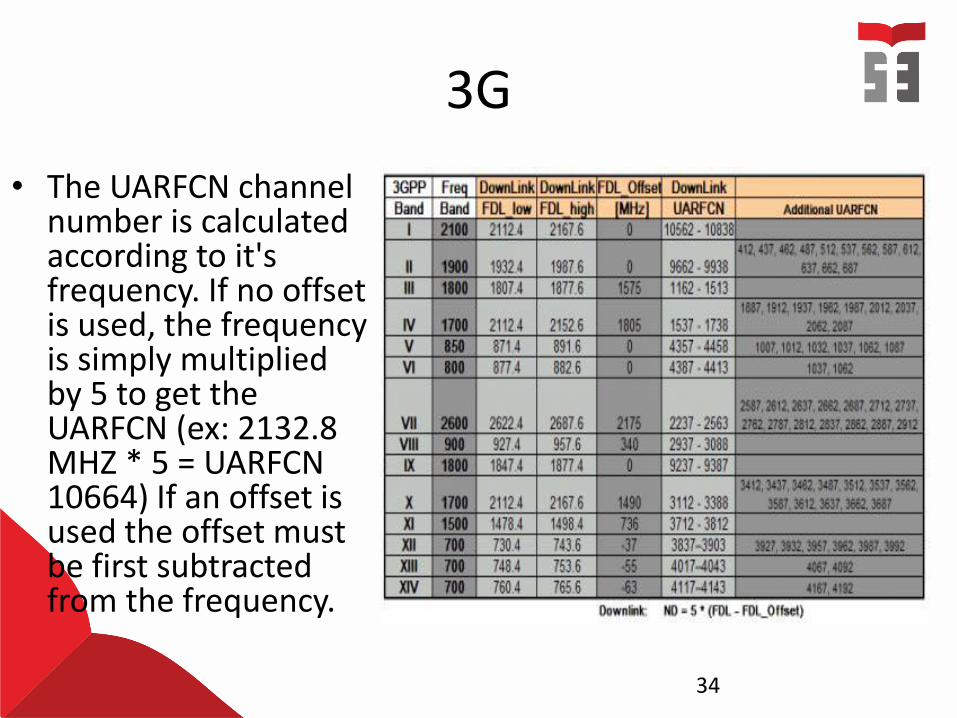
• The UARFCN channel number is calculated according to it's frequency. If no offset is used, the frequency is simply multiplied by 5 to get the UARFCN (ex: 2132.8 MHZ * 5 = UARFCN 10664) If an offset is used the offset must be first subtracted from the frequency.
34
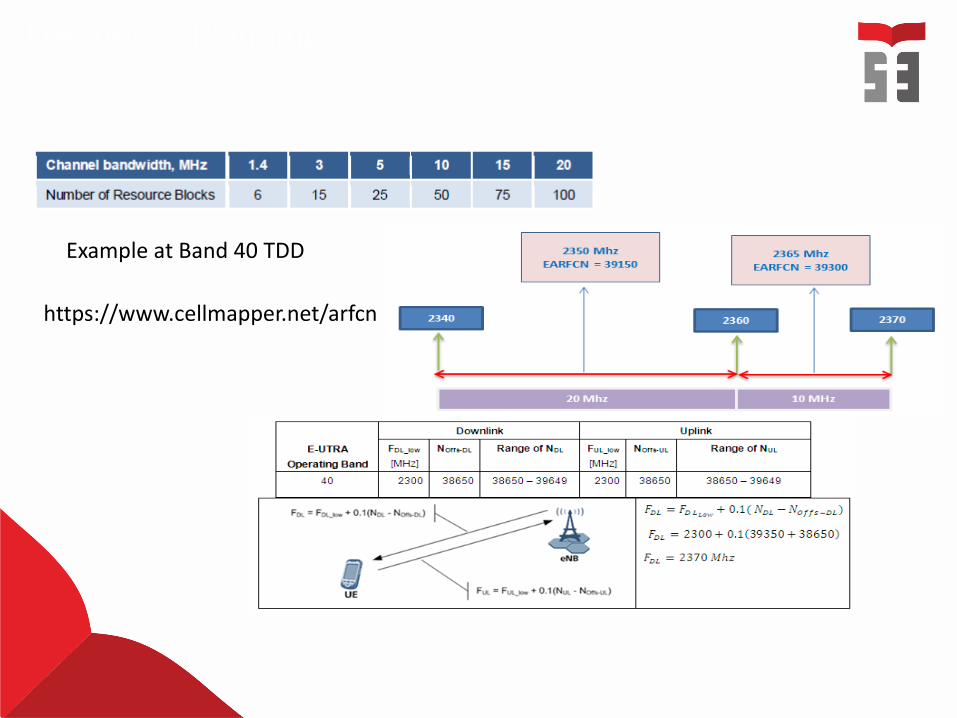
Frequency Planning
Example at Band 40 TDD
https://www.cellmapper.net/arfcn
Mobility Management
• Handover is a key technology of mobilecommunication system and make continuedconversation possible.
http://alfin.dosen.st3telkom.ac.id/profile/ 37
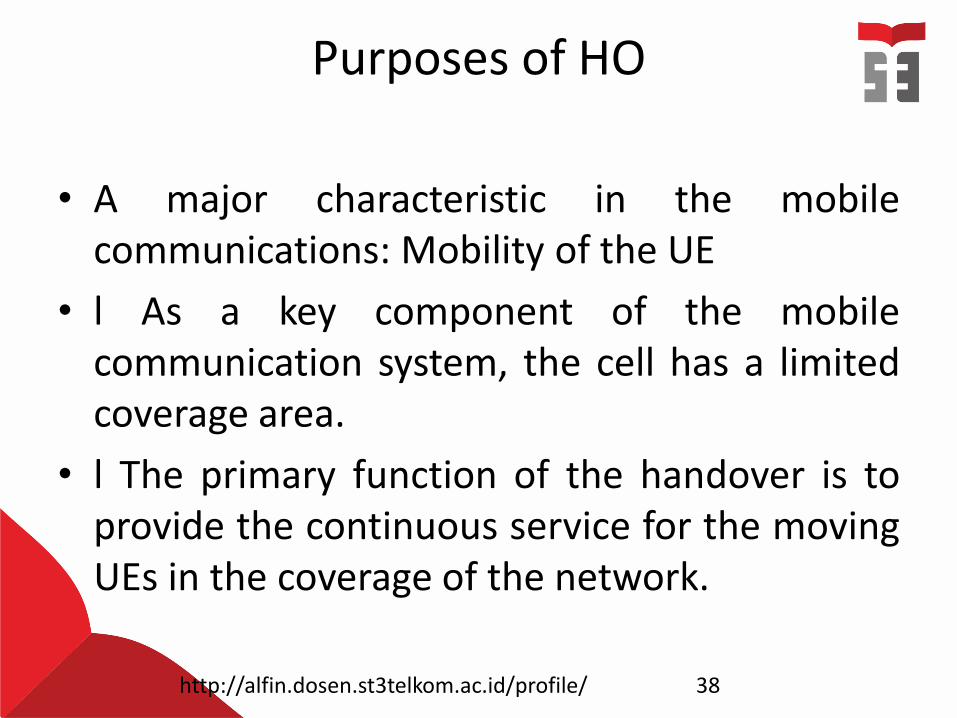
Purposes of HO
• A major characteristic in the mobilecommunications: Mobility of the UE
• l As a key component of the mobilecommunication system, the cell has a limitedcoverage area.
• l The primary function of the handover is toprovide the continuous service for the movingUEs in the coverage of the network.
http://alfin.dosen.st3telkom.ac.id/profile/ 38
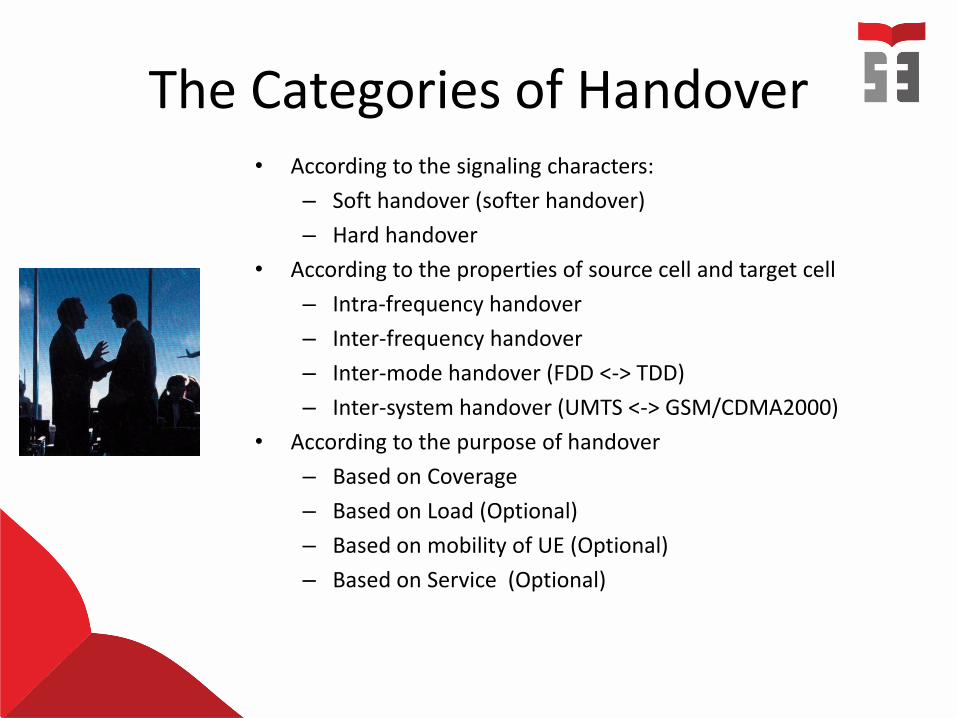
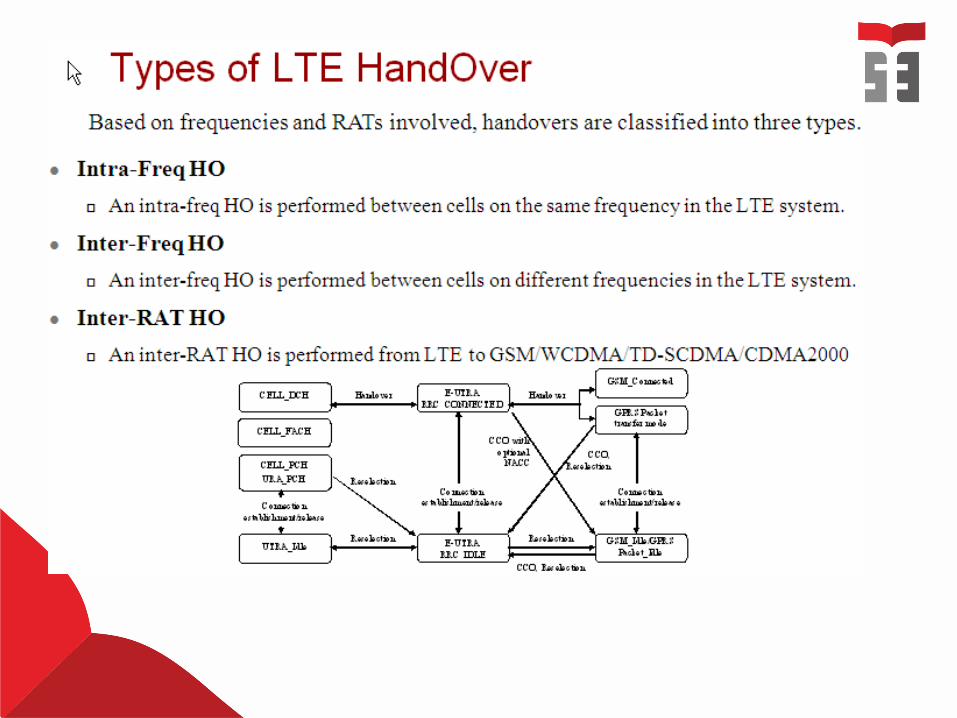
The Categories of Handover• According to the signaling characters:
– Soft handover (softer handover)
– Hard handover
• According to the properties of source cell and target cell
– Intra-frequency handover
– Inter-frequency handover
– Inter-mode handover (FDD <-> TDD)
– Inter-system handover (UMTS <-> GSM/CDMA2000)
• According to the purpose of handover
– Based on Coverage
– Based on Load (Optional)
– Based on mobility of UE (Optional)
– Based on Service (Optional)
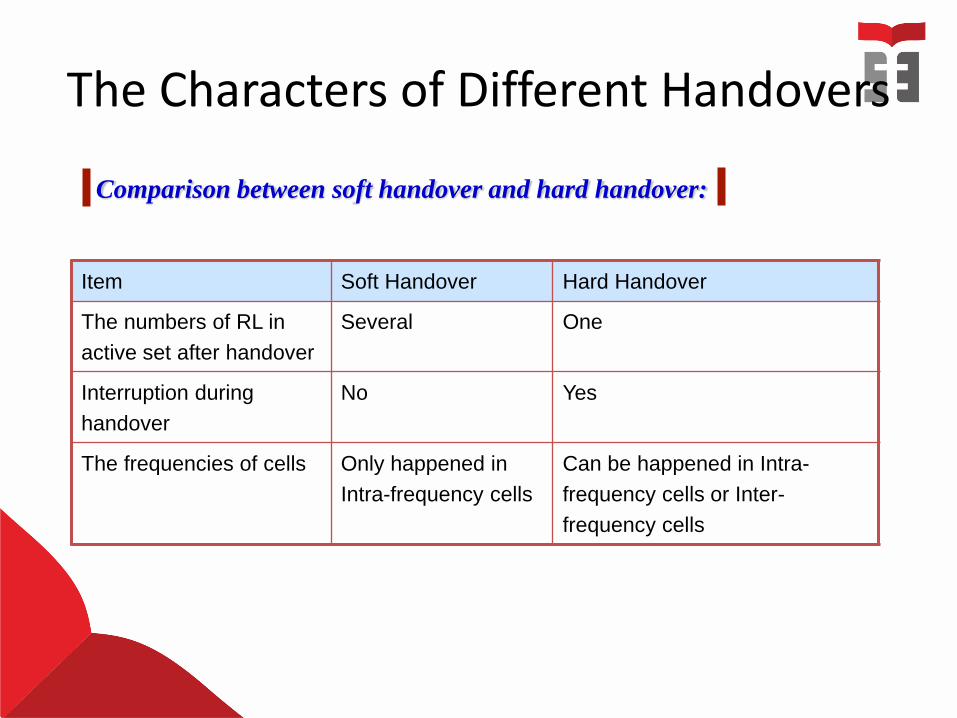
The Characters of Different Handovers
Comparison between soft handover and hard handover:
Item Soft Handover Hard Handover
The numbers of RL in
active set after handover
Several One
Interruption during
handover
No Yes
The frequencies of cells Only happened in
Intra-frequency cells
Can be happened in Intra-
frequency cells or Inter-
frequency cells
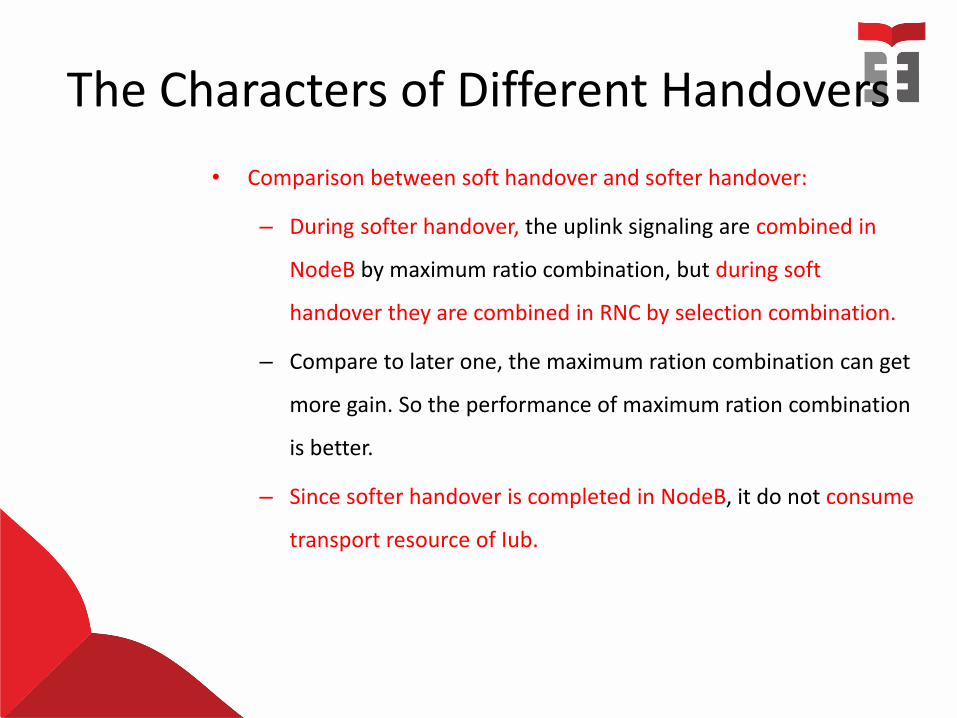
The Characters of Different Handovers
• Comparison between soft handover and softer handover:
– During softer handover, the uplink signaling are combined in
NodeB by maximum ratio combination, but during soft
handover they are combined in RNC by selection combination.
– Compare to later one, the maximum ration combination can get
more gain. So the performance of maximum ration combination
is better.
– Since softer handover is completed in NodeB, it do not consume
transport resource of Iub.
42
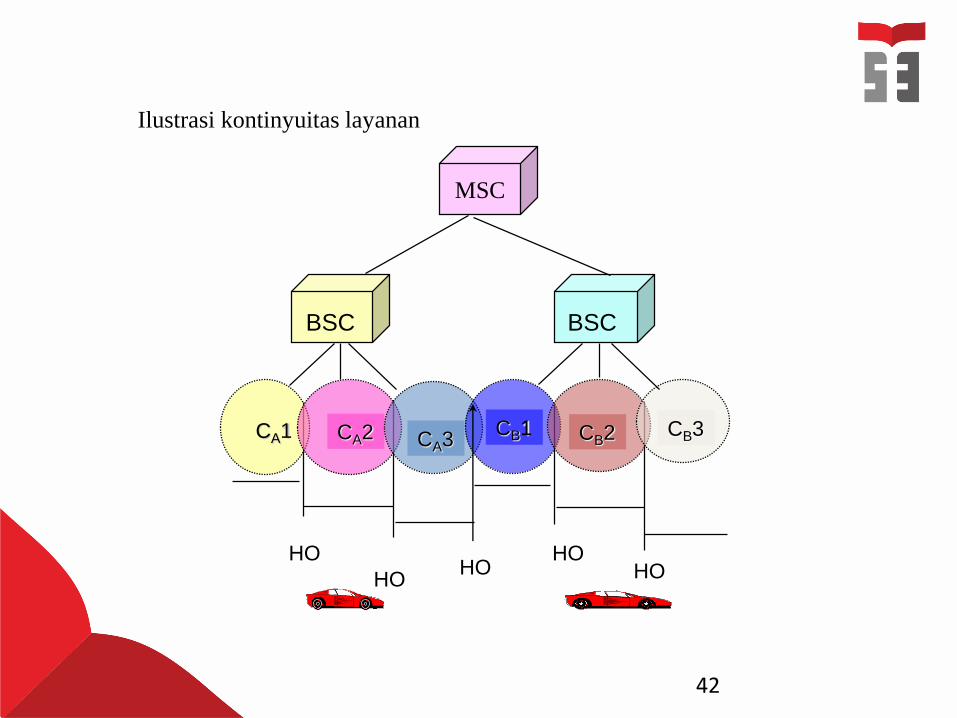
BSC BSC
CA1 CA2 CA3CB1 CB2 CB3
HO
HO
HOHOHO
MSC
Ilustrasi kontinyuitas layanan
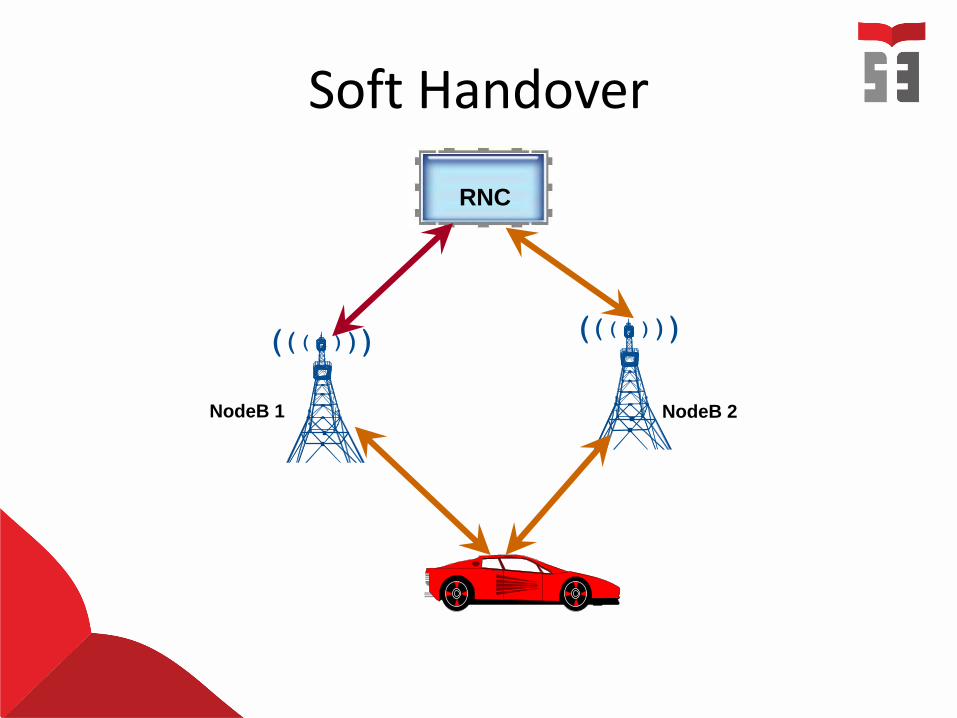
RNC
NodeB 2NodeB 1
Soft Handover
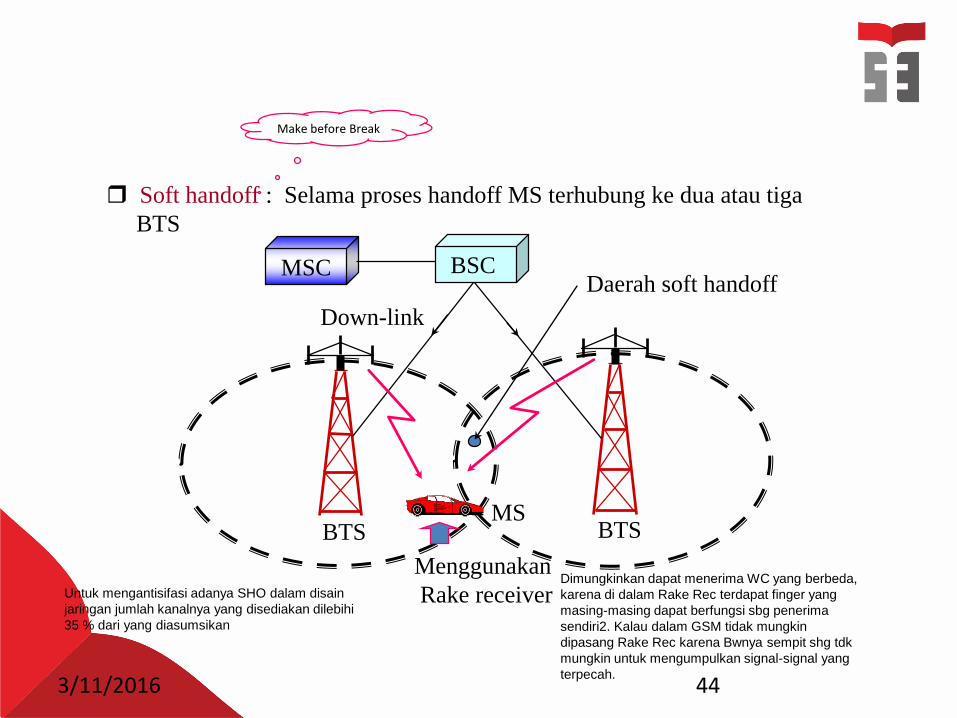
3/11/2016 44
Soft handoff : Selama proses handoff MS terhubung ke dua atau tiga
BTS
BSC
Menggunakan
Rake receiver
Down-link
BTS BTS MS
Daerah soft handoff MSC
Dimungkinkan dapat menerima WC yang berbeda,
karena di dalam Rake Rec terdapat finger yang
masing-masing dapat berfungsi sbg penerima
sendiri2. Kalau dalam GSM tidak mungkin
dipasang Rake Rec karena Bwnya sempit shg tdk
mungkin untuk mengumpulkan signal-signal yang
terpecah.
Untuk mengantisifasi adanya SHO dalam disain
jaringan jumlah kanalnya yang disediakan dilebihi
35 % dari yang diasumsikan
Make before Break
3/11/2016 45
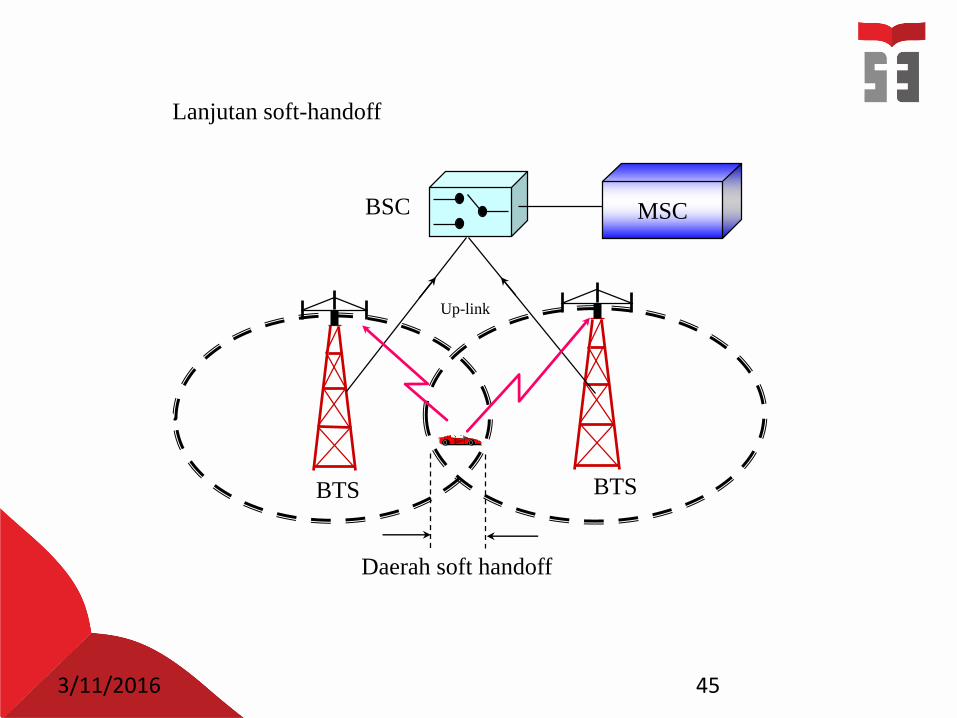
Lanjutan soft-handoff
Up-link
BSC
BTS BTS
Daerah soft handoff
MSC
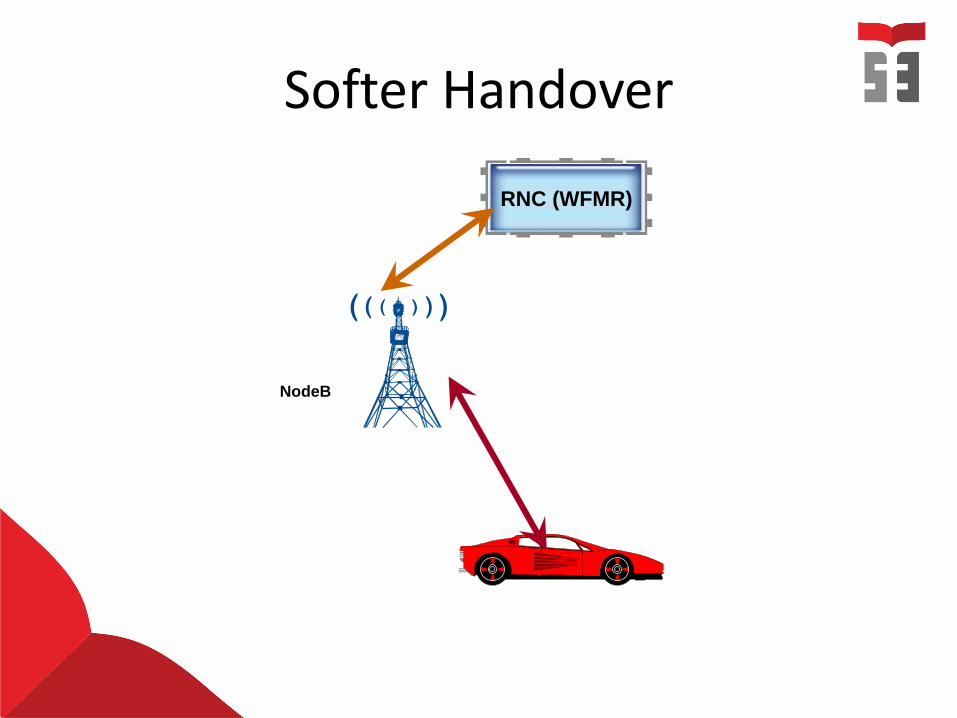
RNC (WFMR)
NodeB
Softer Handover
3/11/2016 47
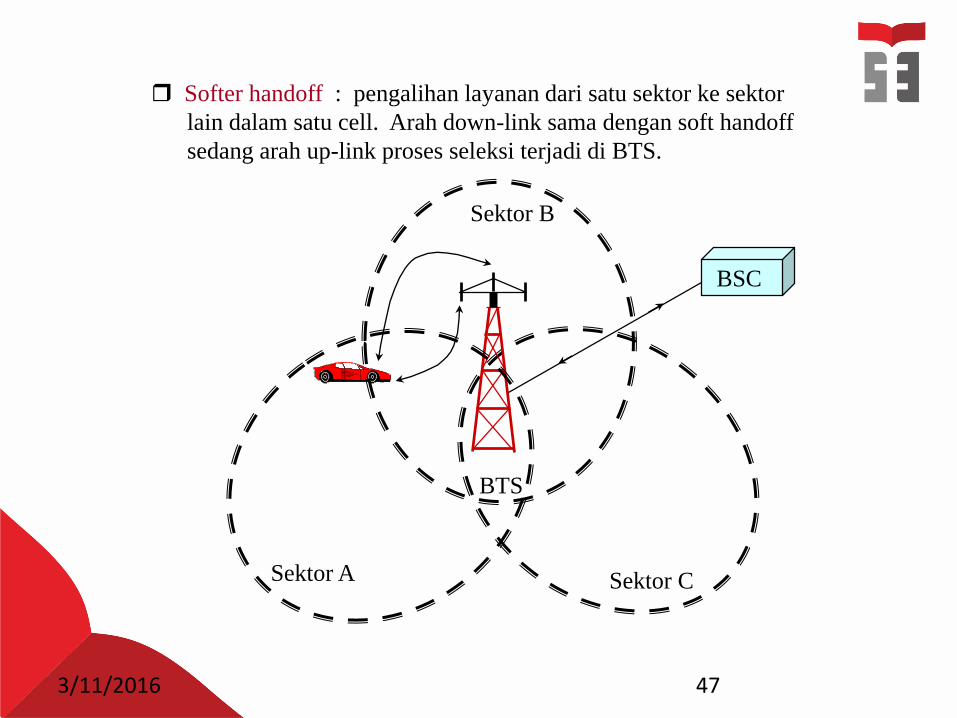
BSC
Sektor A
Sektor B
Sektor C
Softer handoff : pengalihan layanan dari satu sektor ke sektor
lain dalam satu cell. Arah down-link sama dengan soft handoff
sedang arah up-link proses seleksi terjadi di BTS.
BTS
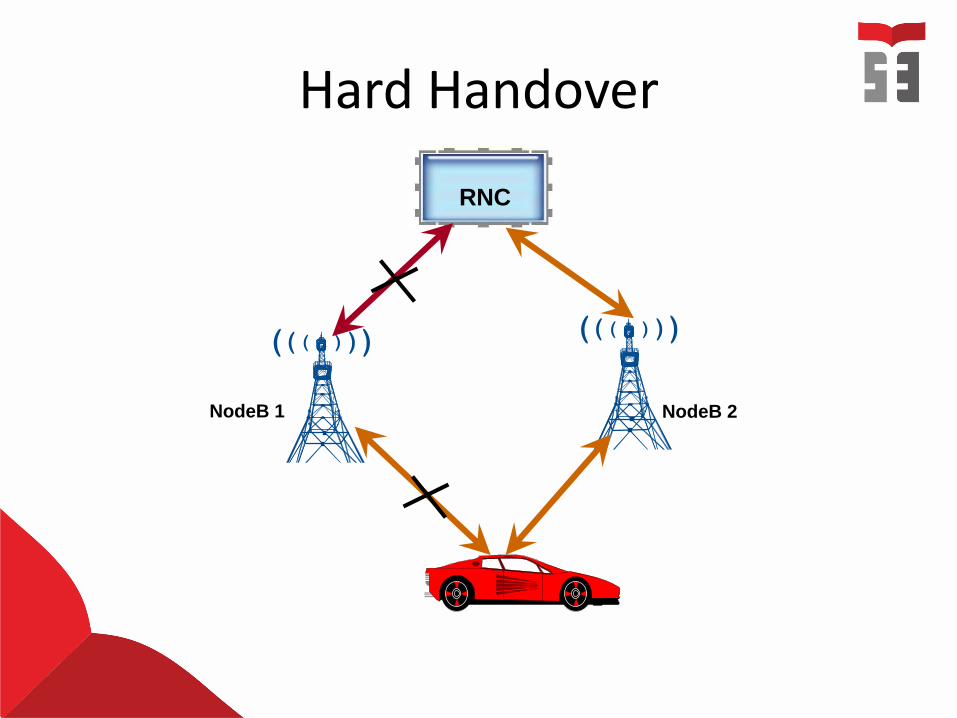
Hard Handover
RNC
NodeB 2NodeB 1
49
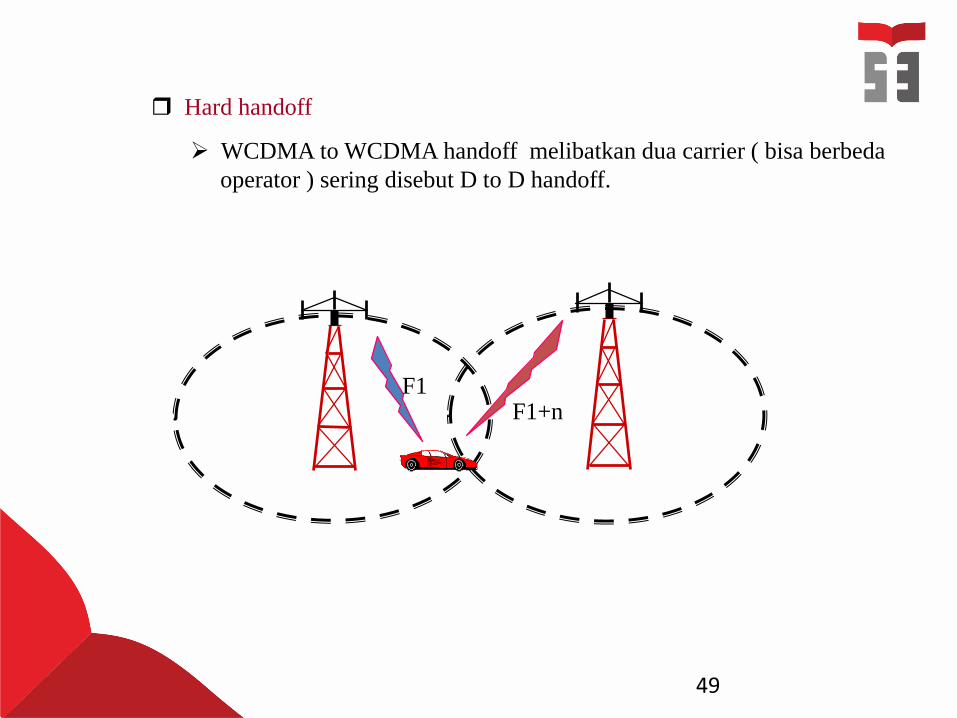
Hard handoff
WCDMA to WCDMA handoff melibatkan dua carrier ( bisa berbeda
operator ) sering disebut D to D handoff.
F1 F1+n
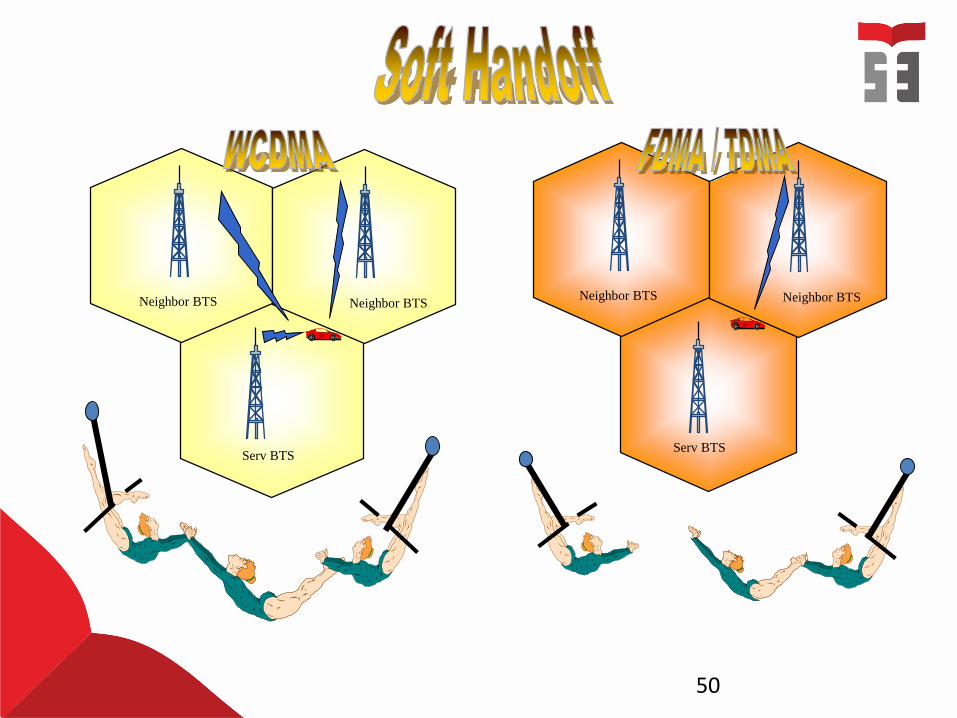
50
Serv BTS
Neighbor BTS Neighbor BTS Neighbor BTS Neighbor BTS
Serv BTS
Page 51
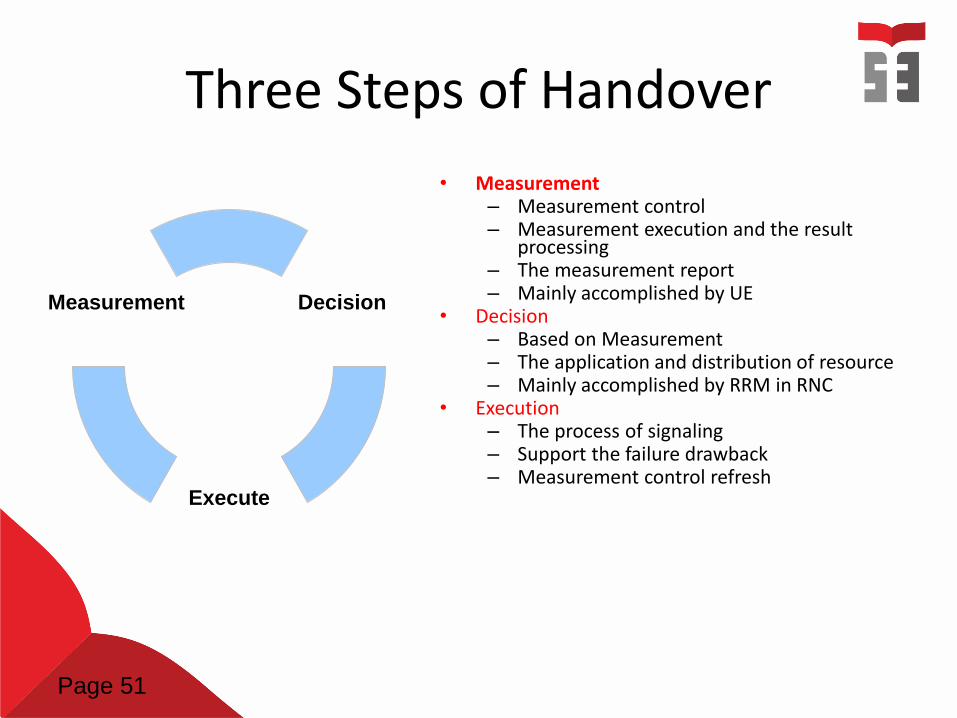
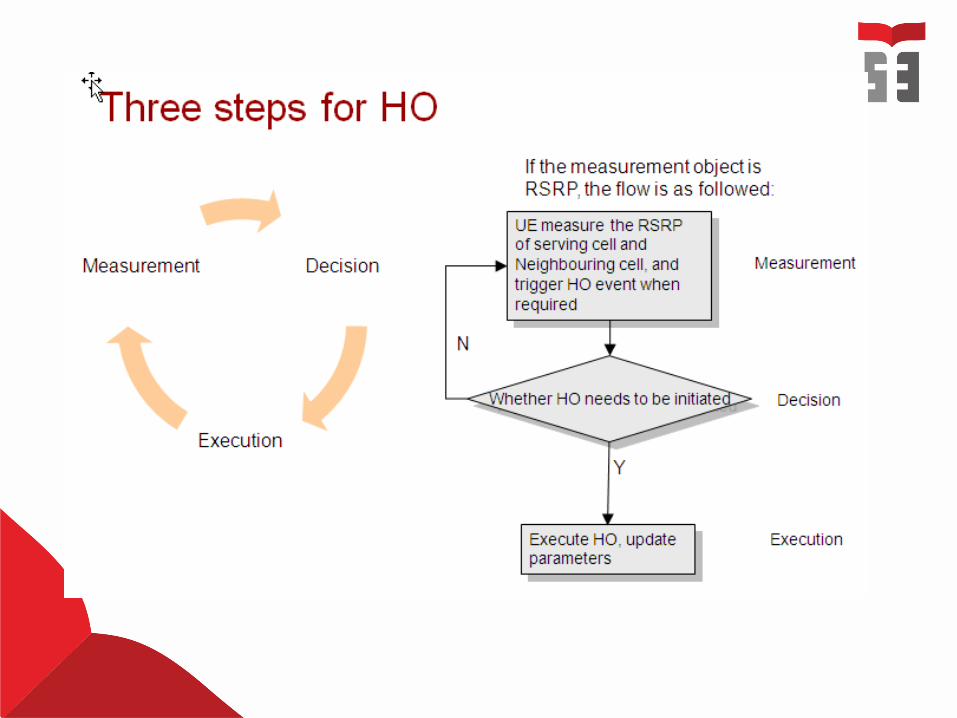
Three Steps of Handover
• Measurement– Measurement control– Measurement execution and the result
processing– The measurement report– Mainly accomplished by UE
• Decision– Based on Measurement– The application and distribution of resource– Mainly accomplished by RRM in RNC
• Execution– The process of signaling– Support the failure drawback – Measurement control refresh
Decision
Execute
Measurement
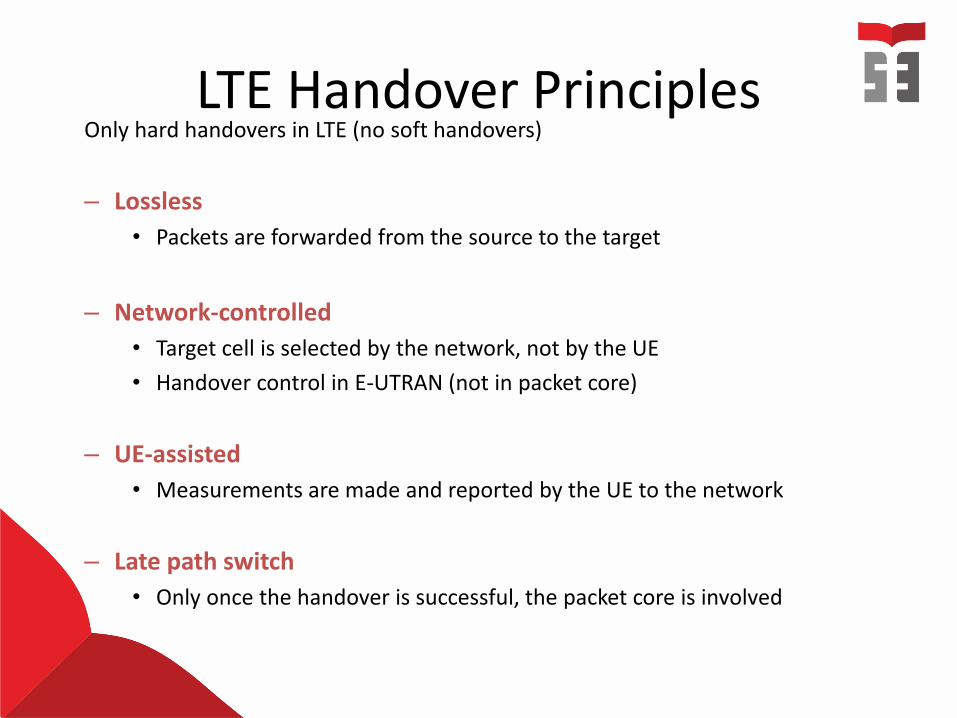
LTE Handover PrinciplesOnly hard handovers in LTE (no soft handovers)
– Lossless
• Packets are forwarded from the source to the target
– Network-controlled
• Target cell is selected by the network, not by the UE
• Handover control in E-UTRAN (not in packet core)
– UE-assisted
• Measurements are made and reported by the UE to the network
– Late path switch
• Only once the handover is successful, the packet core is involved
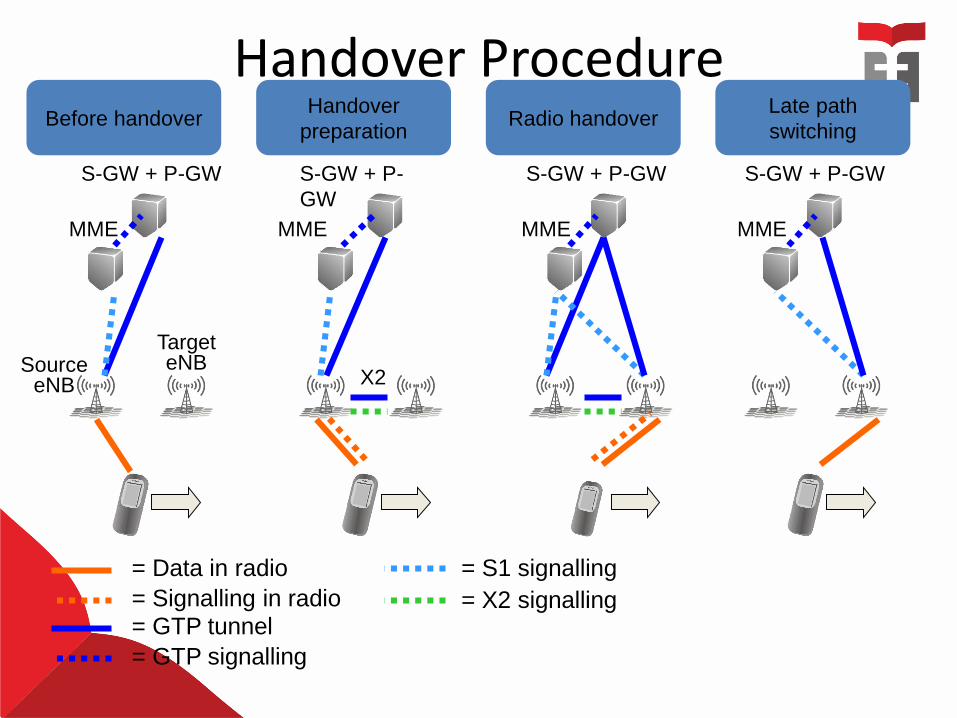
Handover Procedure
S-GW + P-GW
MME
Source eNB
Target eNB
MME MME MME
= Data in radio
= Signalling in radio= GTP tunnel
= GTP signalling
= S1 signalling
= X2 signalling
Before handoverHandover
preparationRadio handover
Late path
switching
S-GW + P-
GW
S-GW + P-GW S-GW + P-GW
X2
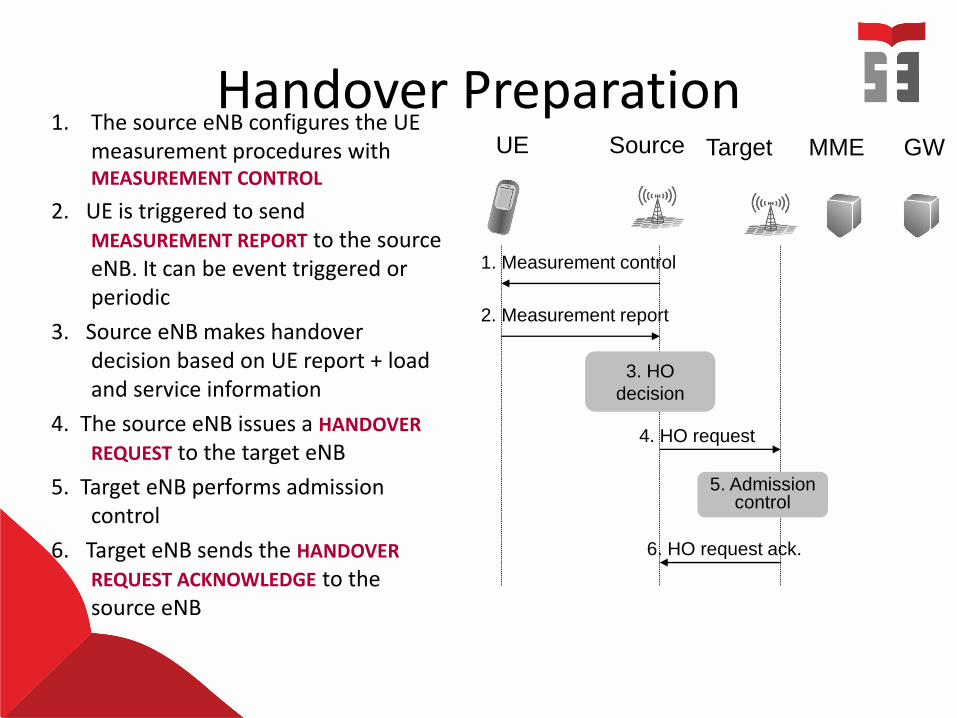
Handover PreparationUE Source Target MME GW
1. Measurement control
2. Measurement report
3. HO
decision
4. HO request
5. Admission control
6. HO request ack.
1. The source eNB configures the UE measurement procedures with MEASUREMENT CONTROL
2. UE is triggered to send MEASUREMENT REPORT to the source eNB. It can be event triggered or periodic
3. Source eNB makes handover decision based on UE report + load and service information
4. The source eNB issues a HANDOVER
REQUEST to the target eNB
5. Target eNB performs admission control
6. Target eNB sends the HANDOVER
REQUEST ACKNOWLEDGE to the source eNB
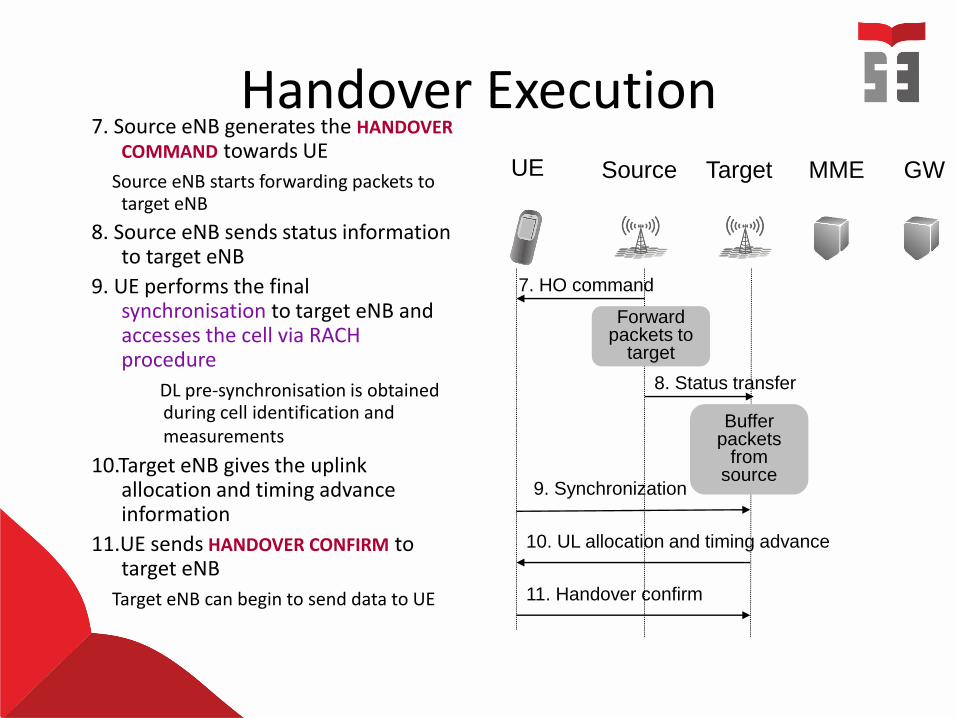
Handover ExecutionUE Source Target MME GW
7. HO command
8. Status transfer
Forward packets to
target
Buffer packets
from source
9. Synchronization
10. UL allocation and timing advance
11. Handover confirm
7. Source eNB generates the HANDOVER COMMAND towards UE
Source eNB starts forwarding packets to target eNB
8. Source eNB sends status information to target eNB
9. UE performs the final synchronisation to target eNB and accesses the cell via RACH procedure
DL pre-synchronisation is obtained during cell identification and measurements
10.Target eNB gives the uplink allocation and timing advance information
11.UE sends HANDOVER CONFIRM to target eNB
Target eNB can begin to send data to UE
Presentation /
Author / Date
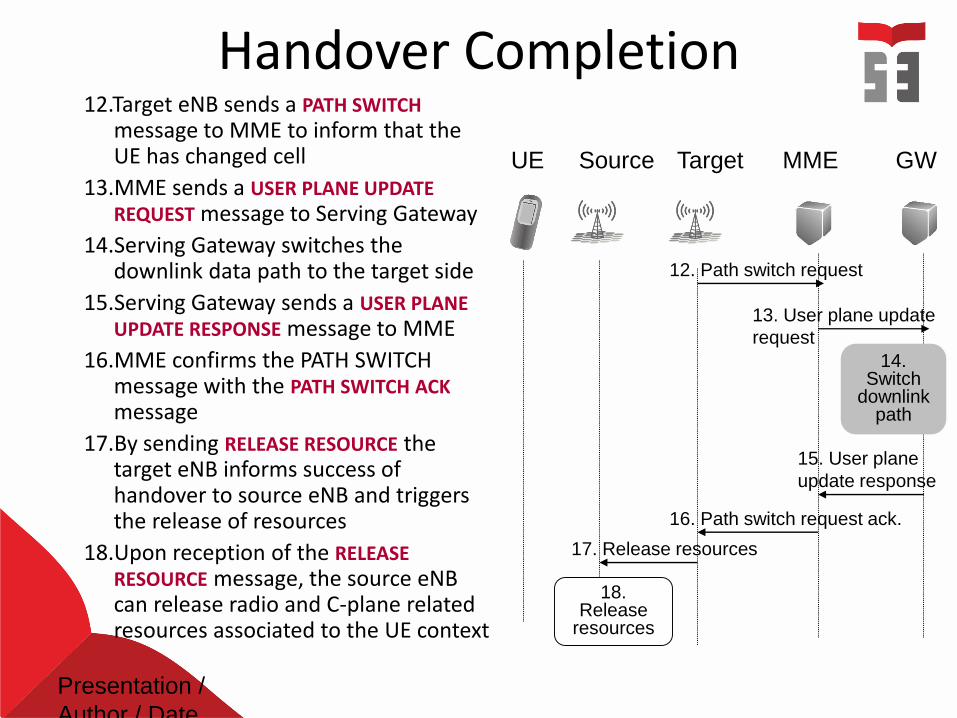
Handover Completion
UE Source Target MME GW
12. Path switch request
13. User plane update
request
14. Switch
downlink path
15. User plane
update response
16. Path switch request ack.
17. Release resources
18. Release
resources
12.Target eNB sends a PATH SWITCHmessage to MME to inform that the UE has changed cell
13.MME sends a USER PLANE UPDATE REQUEST message to Serving Gateway
14.Serving Gateway switches the downlink data path to the target side
15.Serving Gateway sends a USER PLANE UPDATE RESPONSE message to MME
16.MME confirms the PATH SWITCH message with the PATH SWITCH ACKmessage
17.By sending RELEASE RESOURCE the target eNB informs success of handover to source eNB and triggers the release of resources
18.Upon reception of the RELEASE RESOURCE message, the source eNBcan release radio and C-plane related resources associated to the UE context
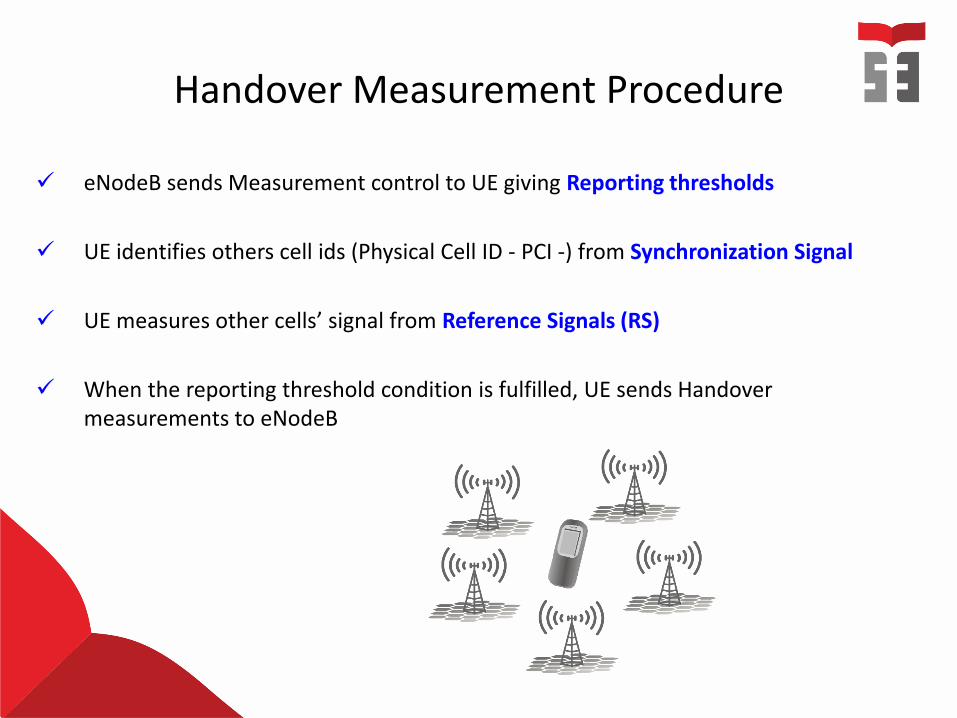
Handover Measurement Procedure
eNodeB sends Measurement control to UE giving Reporting thresholds
UE identifies others cell ids (Physical Cell ID - PCI -) from Synchronization Signal
UE measures other cells’ signal from Reference Signals (RS)
When the reporting threshold condition is fulfilled, UE sends Handover measurements to eNodeB
POWER POINT SYNDROME
60

TERIMA KASIH