LESSON PLAN 1-acreditation · PDF fileTeaching Set Physic for ... 2010/2011 1. Annual Program...
38
0 Teaching Set Physic for class 10 Semester 1 2010/2011 1. Annual Program 2. Semester Program 3. Lesson Plan 4. The minimum Passing Score Arranged by TEAM OF PHYSICS TEACHERS SMA NEGERI 5 KOTA BEKASI Jl. Gamprit Jatiwaringin Asri Pondok Gede Bekasi Telp. 021.8460810 Fax.021.8475507
Transcript of LESSON PLAN 1-acreditation · PDF fileTeaching Set Physic for ... 2010/2011 1. Annual Program...
0
Teaching Set
Physic for class 10 Semester 1 2010/2011
1. Annual Program 2. Semester Program 3. Lesson Plan 4. The minimum Passing Score
Arranged by TEAM OF PHYSICS TEACHERS
SMA NEGERI 5 KOTA BEKASI Jl. Gamprit Jatiwaringin Asri Pondok Gede Bekasi
Telp. 021.8460810 Fax.021.8475507
1
LESSON PLAN 1 School : 5 Senior High School Bekasi Subject : Physics Year/semester : 10/1 Duration : 6x45 minutes Numbers of meeting : 3 Standard of competence:
1. Apply the concept of physic quantities and measurement
Basic competence: 1.1 Measure physics quantities (mass,length and time)
Indicators: 1.1.1. Use some instruments to measure the length, mass and time (adapt from
IGCSE 'A' level) 1.1.2. Read the measurement result by instrument according to significant figures 1.1.3. Define the significant figures 1.1.4. Use the common prefixes for International Unit (Adapt from IGCSE 'A'
level)
Objectives By the end of the lesson, students should be able to:
1. Show an understanding that all physical quantities consist of a numerical magnitude and a unit.
2. Recall the following base quantities and their units: mass (kg), length (m), time (s), current (A), temperature (K), amount of substance (mol).
3. Use prefixes like nano (n), micro (µ), milli (m), centi (c), deci (d), kilo (k), mega (M), to indicate decimal sub-multiples and multiples of the SI units.
4. Measure the mass, length and time 5. Find the dimension of some physical quantities 6. Use the rule of significant figure
Fundamental lesson Quantity is something can be measured and expressed in values. Quantity can be distinguished into basic quantities and derived quantities.
Unit is the standard comparison in measuring activity.
Num. Physical quantities
The units used MKS CGS FPS
1 Length Meter Centimeter Feet 2 Mass Kilogram Gram Pound 3 Time Second Second Second
3.Prefixes are commonly used to express smaller or larger quantities. Symbol Prefix Factor Symbol Prefix Factor n nano 10-9 d 10-1 10-1 µ micro 10-6 K Kilo 103 m mili 10-3 M Mega 106
2
c centi 10-2 G Giga 109
Dimension is the symbol to show how a quantity is arranged from basic quantity Dimension of Basic quantities: M, L, T, I, J, N and Ө Dimension of Derivative quantities Steps: 1. Find the formula 2. Find the units (basic quantity) 3. Find the dimension Example: Find the dimension of force
1. the formula : F = m.a 2. the units : = kg. m/s2 3. the dimension : = M. L/T2
Scientific notation is the way to write smaller and larger number.
a x 10n , with 1‹ a ‹ 10 and n is the integer Example: 0.000036 = 3.6 x 10⁻⁵
76800000= 7.68 x 10⁷
Significant number is the number that gets from measurement. The rules 1. All figures (but zero) are significant number
Example: 213.6 gram (4 significant number) 45.7 cm (3 significant number)
2. All zeros lie between non-zero figures are significant number Example: 201.06 m (5 significant number) 4.008 Kg (4 significant number)
3. All zeros number at the right hand side of nnon-zero figure are significant number, unless there is a special explanation with underlined
Example: 5280 cm (4 significant number) 5280 cm (3 significant number)
4. All zeros used to determine the position of the decimal point are not significant number
Example: 0.0067 mm (2 significant number) 0.0308 gr (3 significant number)
The mathematical operation of significant numbers 1. Addition and subtraction
Example: 29 500 + 6 950 = 36 450 ≈ 36 500 530 – 287 = 243 ≈ 240
2. Multiplication and division Example: 796 x 320 = 254 720 ≈ 255 000 5.63 x 0.8 = 4.504 ≈ 5 0.428 : 0.7 = 0.6114 ≈ 0.6
3
3. Power and roots Example: 3.283 = 35.287552 ≈ 35.3 3.28 = 10995.116 ≈ 11 000 √196 = 14.0
Teaching methods • Experiment • Discussion • Problem solving
Procedures 1. First Meeting ( 2 x 45 minutes)
a. Pre-activities (15 minutes) • Introduce myself and communicate my expectations:
- in routines and habits during lesson, - in work procedures, - quality and quantity of work, - behaviour in the classroom.
• Recall the basic principle such as what is Physics and what physics a for. b. Main activities (65 minutes)
• Teacher shows understanding that all physical quantities consist of a numerical magnitude and a unit
• Recall base quantities, their units, their dimension and their measuring tools
• Recall base quantities and derived quantities • Ask the the student to find the commonly prefixes in SI unit • use prefixes and their symbols to indicate decimal sub-multiples and
multiples of the SI units • Read the scale on the calipers and micrometer helped by multimedia
c. Closing (10 minutes) • Conclude the lesson about quantities and their units • Review how to read measuring result and least count of calipers and
micrometer • Teacher give homework from textbook page 15 number 1-2.
2. Second meeting ( 2 x 45 minutes) a. Pre-activities (10 minutes)
• Recall quantities and their units • Discuss the homework for difficult questions • Divide the students into 8 groups
b. Main activities (70 minutes)
• Teacher describes how to measure a variety of lengths with appropriate accuracy by means of tapes, rules, micrometers and calipers, using a vernier scale as necessary
• Student use measuring tools for some quantities in a group • Every group has their own tools • Students do the activity based on the procedures in student worksheet
4
• After 15 minutes, they have to explain what they do to their friends in front of the class.
c. Closing (10 minutes)
• Conclude the lesson by mention the measuring tools and the functions • review how to find the least count of some measuring tool
3. Third Meeting ( 2 x 45 minutes)
a. Pre-activities (5 minutes) • Recall base quantities and derived quantities • Recall measuring tools, how to find the zero error and the least count of
some measuring tool
b. Main activities (75 minutes) • Student search the information about the dimension of base quantities
from textbook
• Teacher give an example how to find out the dimensions of derived quantities
• show an understanding of the orders of magnitude of the sizes of common objects ranging from a typical atom to the Earth
• Discuss the scientific notation to appear small quantity and large quantity • Distinguish between calculating and measuring result • Understanding the meaning of significant figure in order to communicate
the data and find the accuracy in measuring. • Student apply the concepts to solve the problem in students workbook
page 19.
c. Closing (10 minutes) • Recall the dimension of base quantities and some derived quantities • Recall the rule of significant notation • Recall the rules of significant figures
Evaluation • Cognitif aspect
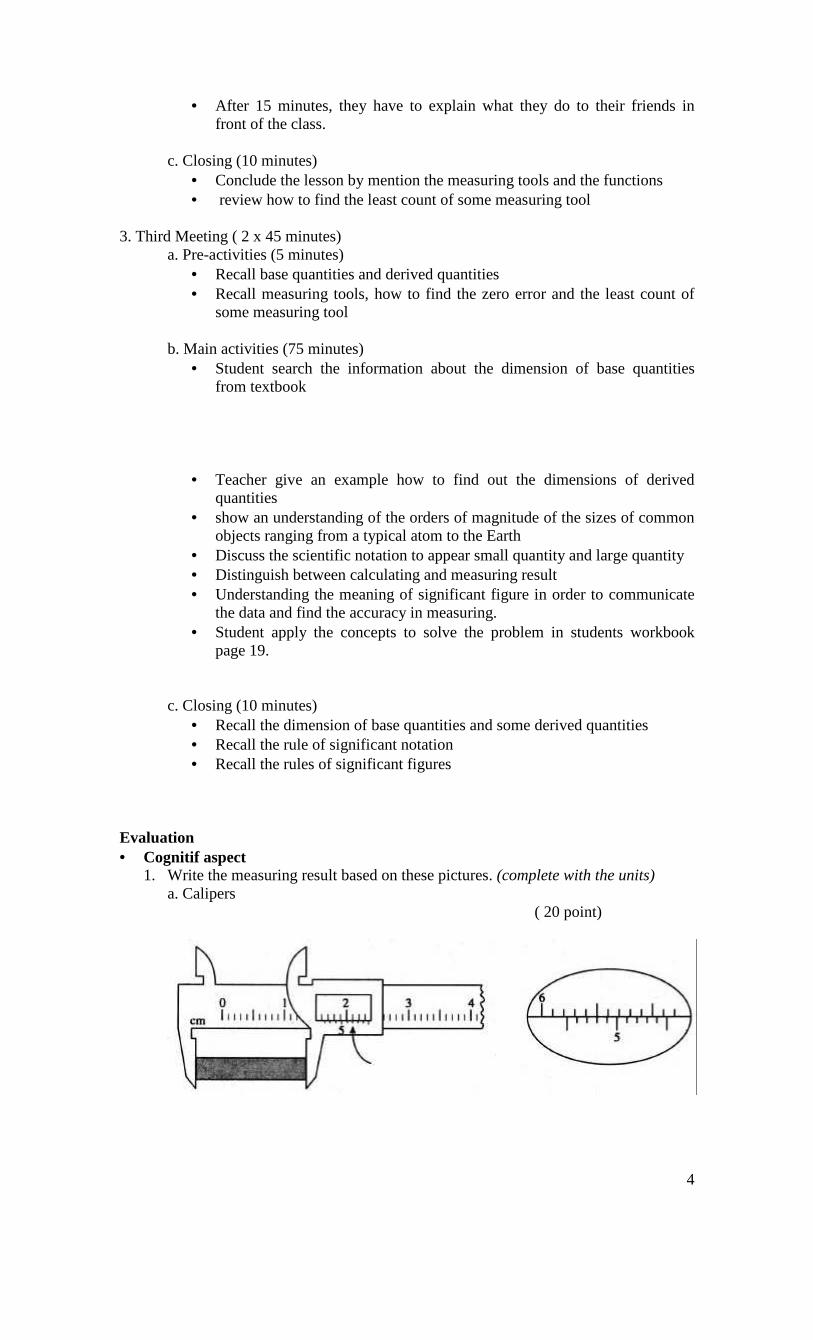
1. Write the measuring result based on these pictures. (complete with the units) a. Calipers ( 20 point)
5
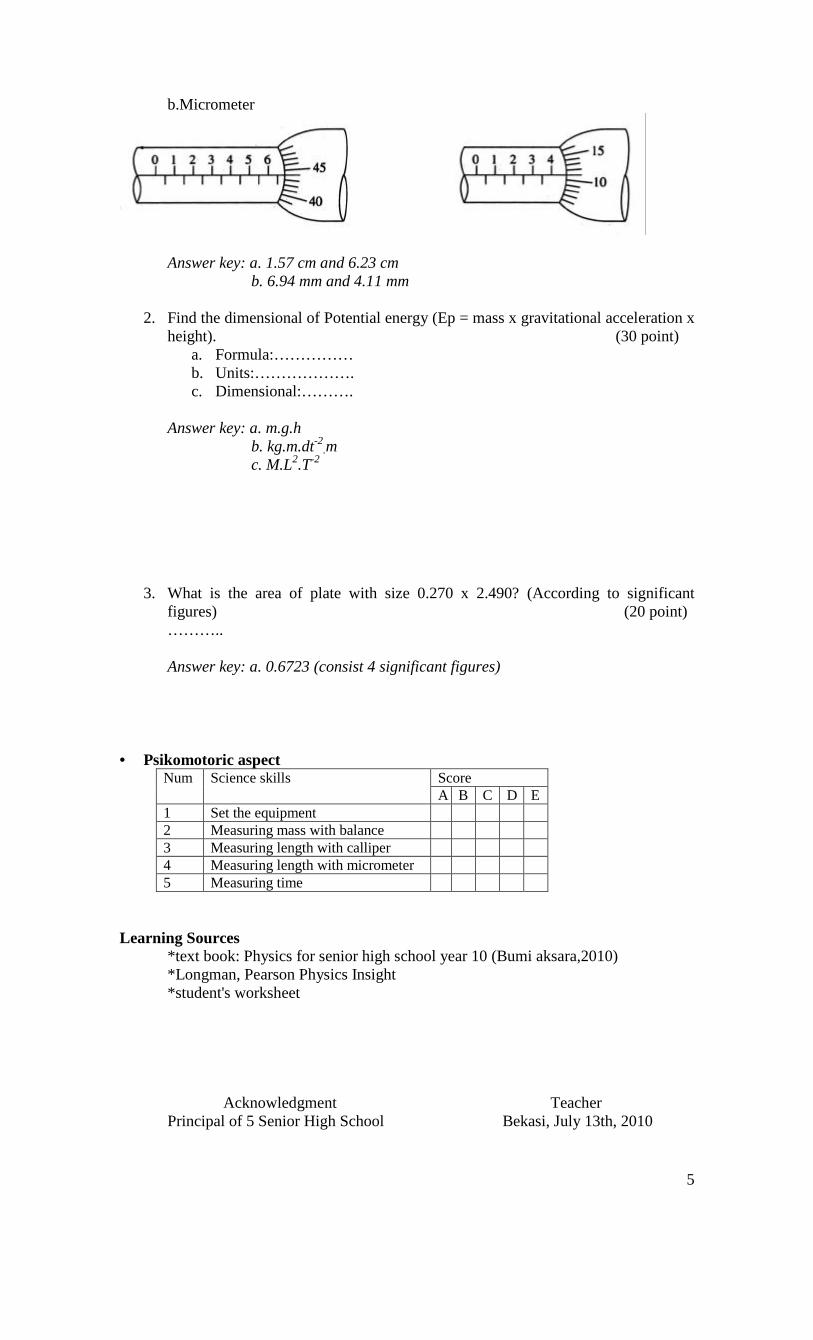
b.Micrometer
Answer key: a. 1.57 cm and 6.23 cm b. 6.94 mm and 4.11 mm
2. Find the dimensional of Potential energy (Ep = mass x gravitational acceleration x
height). (30 point) a. Formula:…………… b. Units:………………. c. Dimensional:……….
Answer key: a. m.g.h b. kg.m.dt-2
.m c. M.L2.T-2
3. What is the area of plate with size 0.270 x 2.490? (According to significant figures) (20 point) ……….. Answer key: a. 0.6723 (consist 4 significant figures)
• Psikomotoric aspect
Num Science skills Score A B C D E 1 Set the equipment 2 Measuring mass with balance 3 Measuring length with calliper 4 Measuring length with micrometer 5 Measuring time
Learning Sources *text book: Physics for senior high school year 10 (Bumi aksara,2010) *Longman, Pearson Physics Insight *student's worksheet Acknowledgment Teacher Principal of 5 Senior High School Bekasi, July 13th, 2010

6
Drs. Sri Susanti, MM Sukrini, S.Pd NIP.131 623 411 NIP. 198007082006042025
7
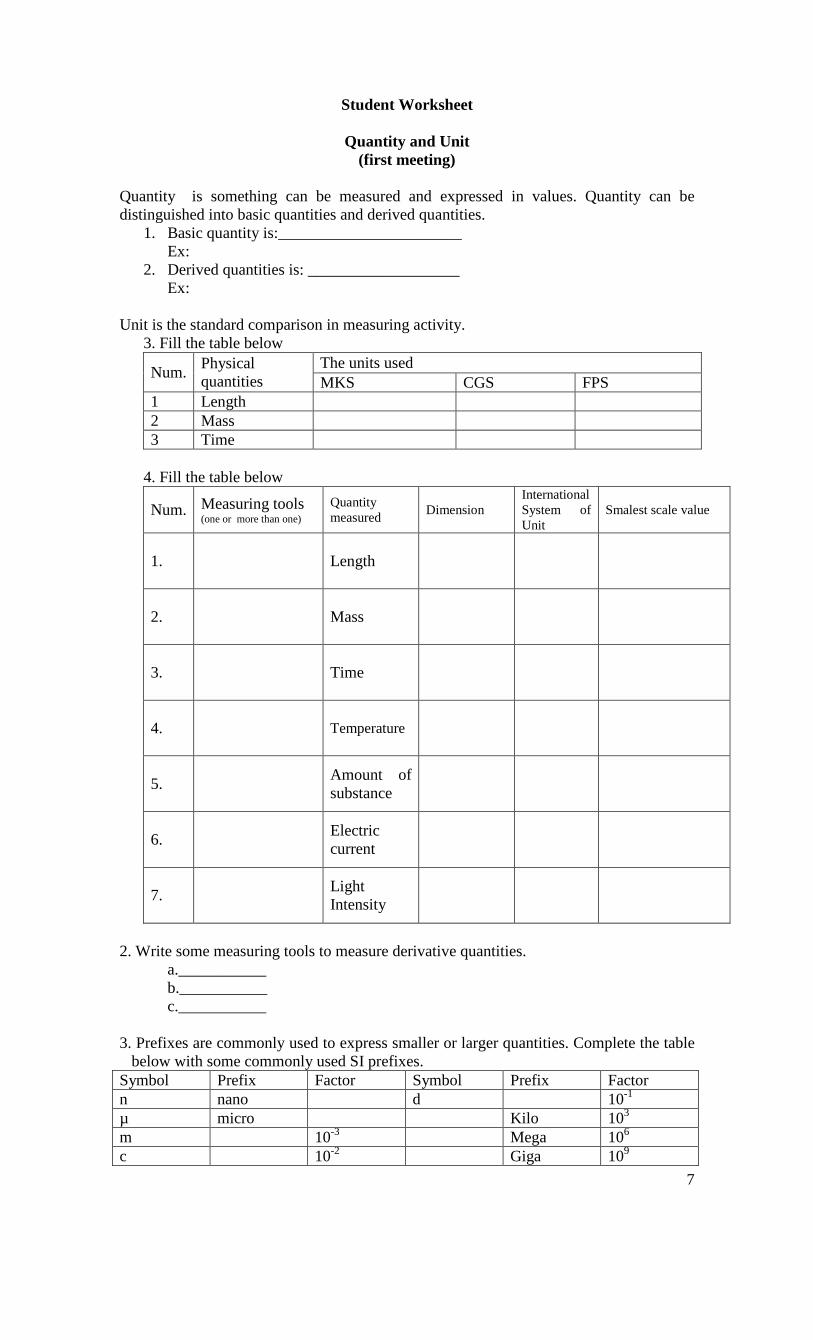
Student Worksheet
Quantity and Unit (first meeting)
Quantity is something can be measured and expressed in values. Quantity can be distinguished into basic quantities and derived quantities.
1. Basic quantity is:_______________________ Ex:
2. Derived quantities is: ___________________ Ex:
Unit is the standard comparison in measuring activity. 3. Fill the table below
Num. Physical quantities
The units used MKS CGS FPS
1 Length 2 Mass 3 Time
4. Fill the table below
Num. Measuring tools (one or more than one)
Quantity measured
Dimension International System of Unit
Smalest scale value
1.
Length
2.
Mass
3.
Time
4.
Temperature
5.
Amount of substance
6.
Electric current
7.
Light Intensity
2. Write some measuring tools to measure derivative quantities.
a.___________ b.___________ c.___________
3. Prefixes are commonly used to express smaller or larger quantities. Complete the table below with some commonly used SI prefixes.
Symbol Prefix Factor Symbol Prefix Factor n nano d 10-1 µ micro Kilo 103 m 10-3 Mega 106 c 10-2 Giga 109
8
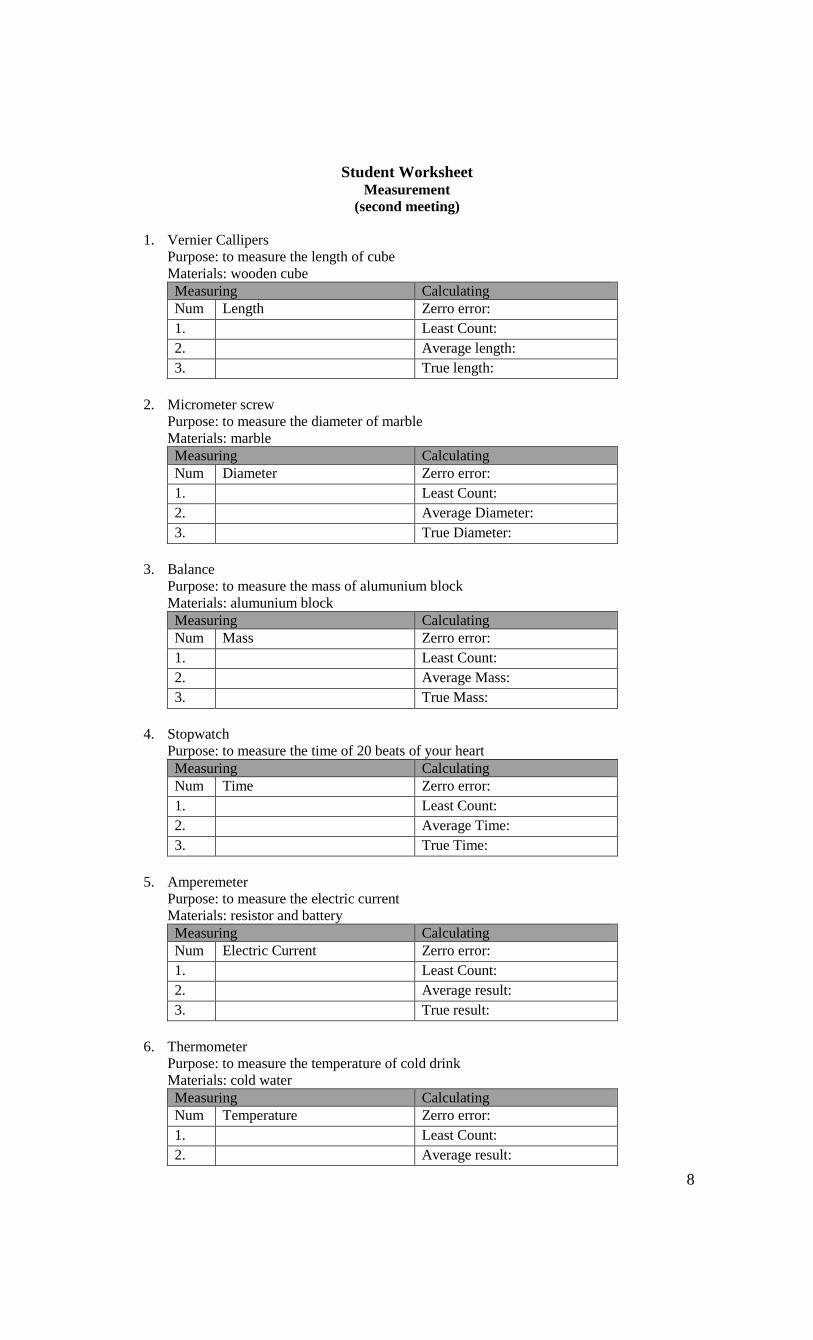
Student Worksheet Measurement
(second meeting)
1. Vernier Callipers Purpose: to measure the length of cube Materials: wooden cube Measuring Calculating Num Length Zerro error: 1. Least Count: 2. Average length: 3. True length:
2. Micrometer screw
Purpose: to measure the diameter of marble Materials: marble Measuring Calculating Num Diameter Zerro error: 1. Least Count: 2. Average Diameter: 3. True Diameter:
3. Balance
Purpose: to measure the mass of alumunium block Materials: alumunium block Measuring Calculating Num Mass Zerro error: 1. Least Count: 2. Average Mass: 3. True Mass:
4. Stopwatch
Purpose: to measure the time of 20 beats of your heart Measuring Calculating Num Time Zerro error: 1. Least Count: 2. Average Time: 3. True Time:
5. Amperemeter
Purpose: to measure the electric current Materials: resistor and battery Measuring Calculating Num Electric Current Zerro error: 1. Least Count: 2. Average result: 3. True result:
6. Thermometer
Purpose: to measure the temperature of cold drink Materials: cold water Measuring Calculating Num Temperature Zerro error: 1. Least Count: 2. Average result:
9
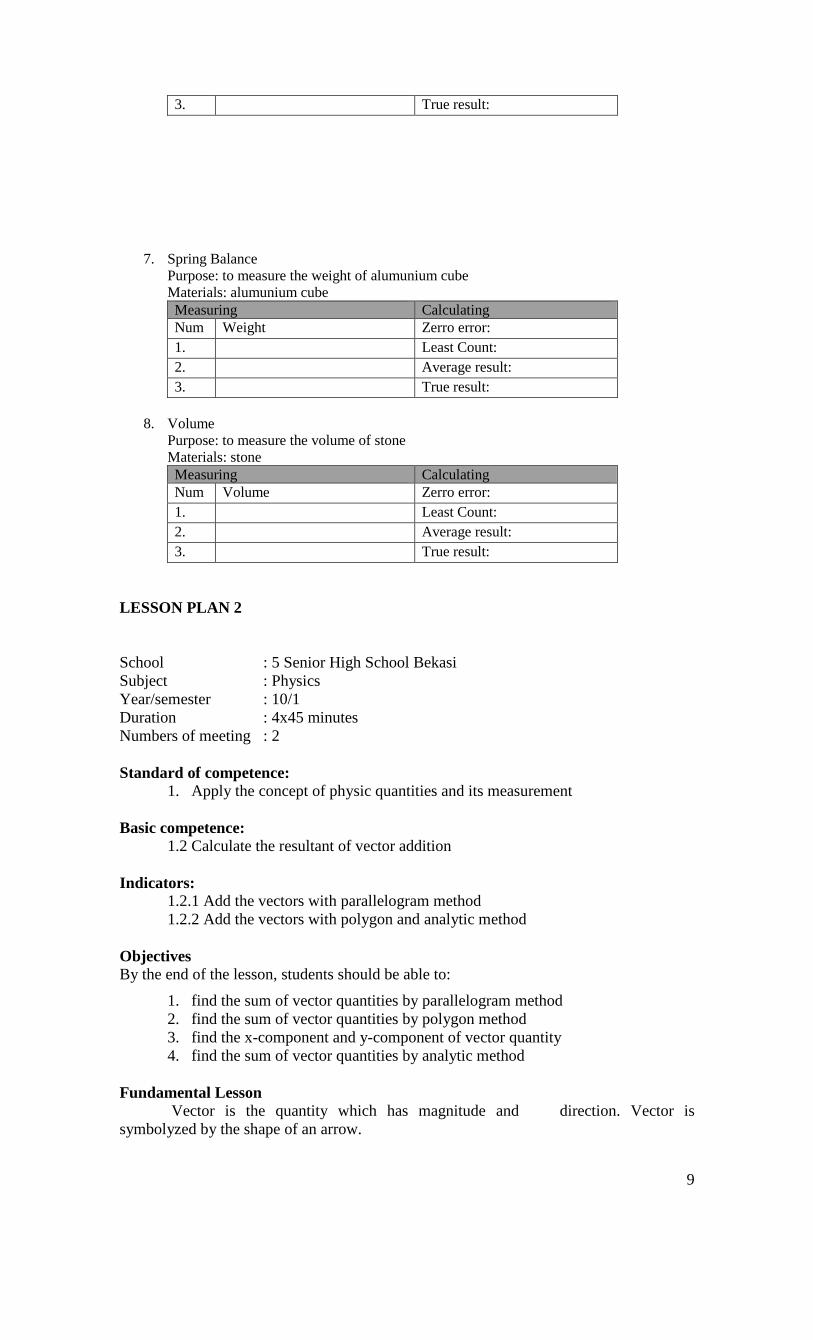
3. True result: 7. Spring Balance
Purpose: to measure the weight of alumunium cube Materials: alumunium cube Measuring Calculating Num Weight Zerro error: 1. Least Count: 2. Average result: 3. True result:
8. Volume
Purpose: to measure the volume of stone Materials: stone Measuring Calculating Num Volume Zerro error: 1. Least Count: 2. Average result: 3. True result:
LESSON PLAN 2 School : 5 Senior High School Bekasi Subject : Physics Year/semester : 10/1 Duration : 4x45 minutes Numbers of meeting : 2 Standard of competence:
1. Apply the concept of physic quantities and its measurement
Basic competence: 1.2 Calculate the resultant of vector addition
Indicators: 1.2.1 Add the vectors with parallelogram method 1.2.2 Add the vectors with polygon and analytic method
Objectives By the end of the lesson, students should be able to:
1. find the sum of vector quantities by parallelogram method 2. find the sum of vector quantities by polygon method 3. find the x-component and y-component of vector quantity 4. find the sum of vector quantities by analytic method
Fundamental Lesson Vector is the quantity which has magnitude and direction. Vector is symbolyzed by the shape of an arrow.
10
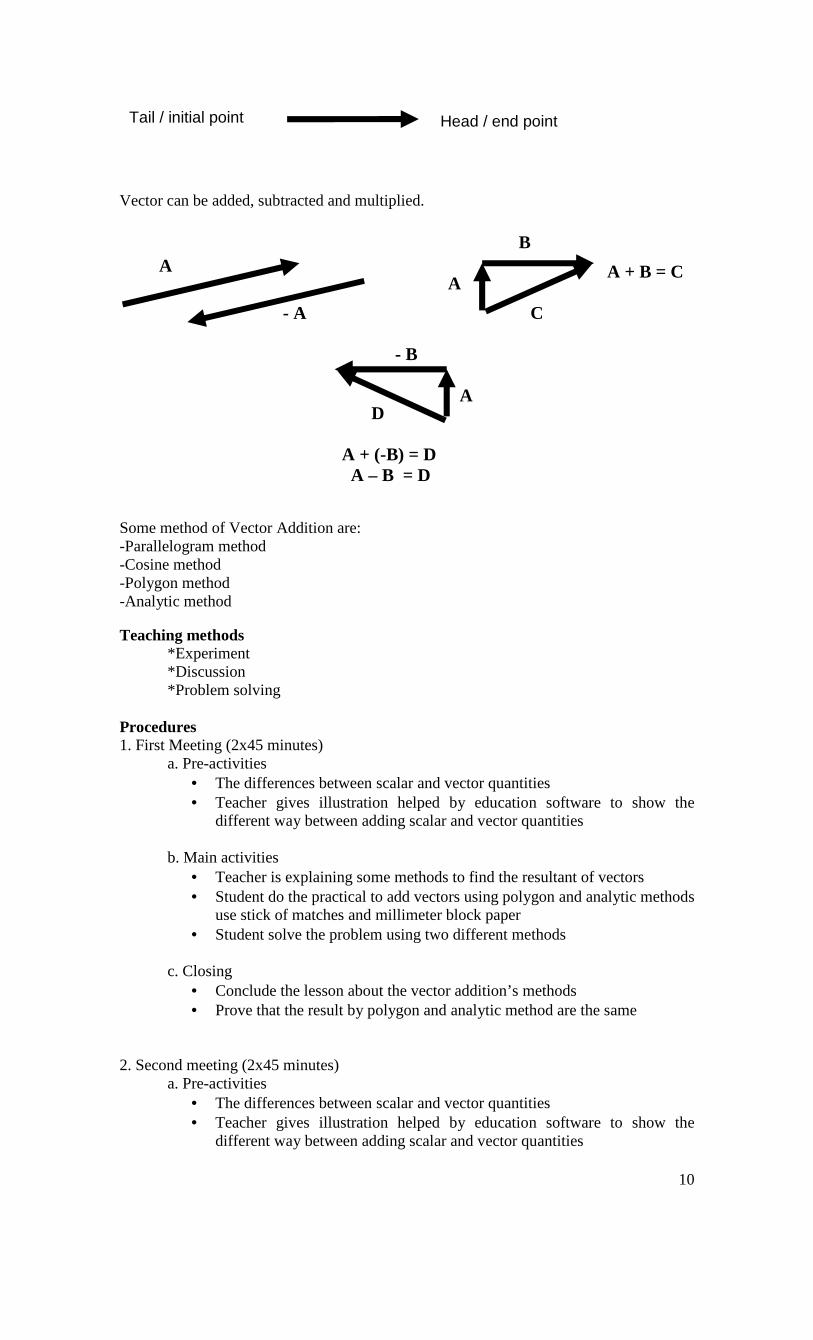
Vector can be added, subtracted and multiplied.
Some method of Vector Addition are: -Parallelogram method -Cosine method -Polygon method -Analytic method Teaching methods *Experiment *Discussion *Problem solving Procedures 1. First Meeting (2x45 minutes)
a. Pre-activities • The differences between scalar and vector quantities • Teacher gives illustration helped by education software to show the
different way between adding scalar and vector quantities b. Main activities
• Teacher is explaining some methods to find the resultant of vectors • Student do the practical to add vectors using polygon and analytic methods
use stick of matches and millimeter block paper • Student solve the problem using two different methods
c. Closing
• Conclude the lesson about the vector addition’s methods • Prove that the result by polygon and analytic method are the same
2. Second meeting (2x45 minutes) a. Pre-activities
• The differences between scalar and vector quantities • Teacher gives illustration helped by education software to show the
different way between adding scalar and vector quantities
Head / end point Tail / initial point
A
- A
A
B
C
A + B = C
A D
A + (-B) = D A – B = D
- B
11
b. Main activities • Teacher is explaining some methods to find the resultant of vectors • Student do the practical to add vectors using polygon and analytic methods
use match and millimeter block paper • Student solve the problem using two different methods
c. Closing
• Conclude the lesson about the vector addition’s methods • Prove that the result by polygon and analytic method are the same
Evaluation • Cognitif aspect
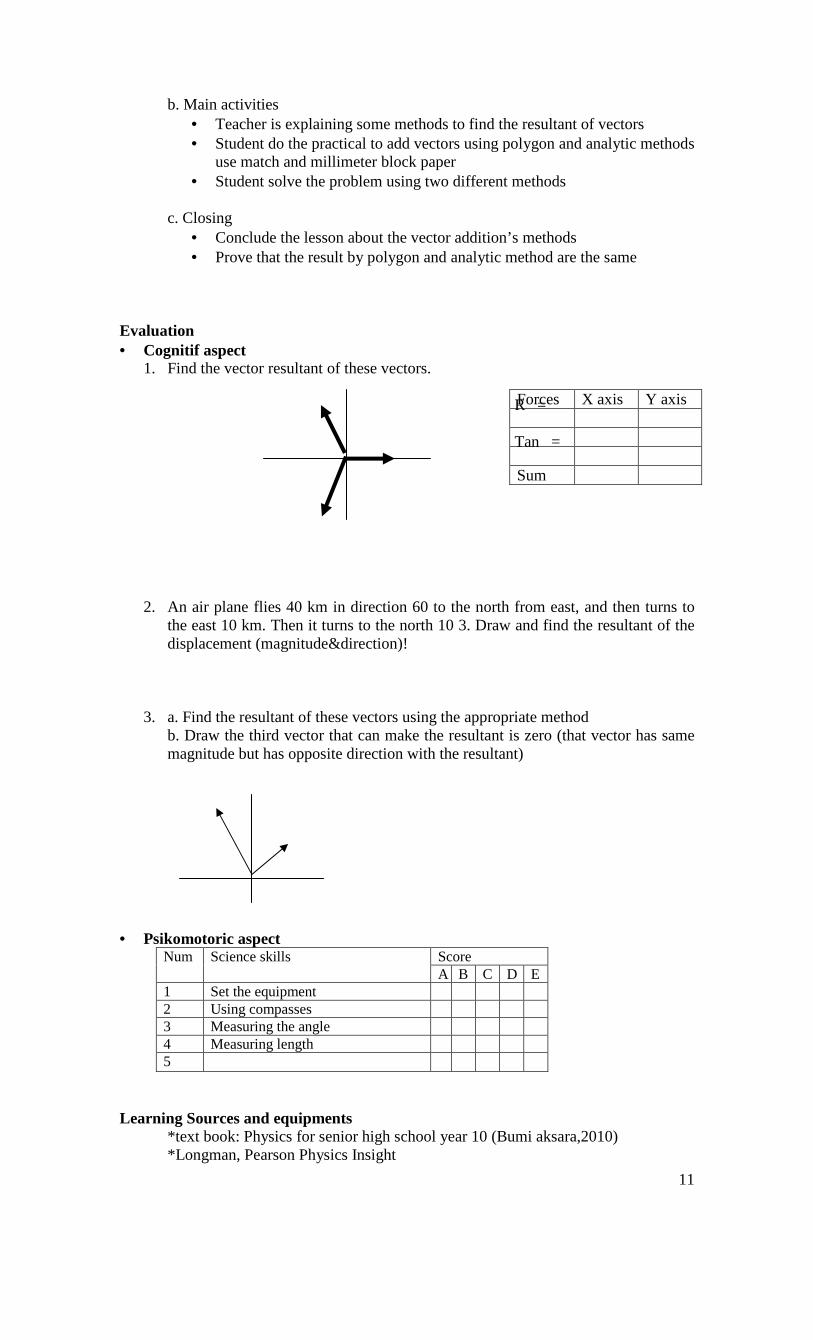
1. Find the vector resultant of these vectors. R = Tan =
2. An air plane flies 40 km in direction 60 to the north from east, and then turns to the east 10 km. Then it turns to the north 10 3. Draw and find the resultant of the displacement (magnitude&direction)!
3. a. Find the resultant of these vectors using the appropriate method b. Draw the third vector that can make the resultant is zero (that vector has same magnitude but has opposite direction with the resultant)
• Psikomotoric aspect
Num Science skills Score A B C D E 1 Set the equipment 2 Using compasses 3 Measuring the angle 4 Measuring length 5
Learning Sources and equipments
*text book: Physics for senior high school year 10 (Bumi aksara,2010) *Longman, Pearson Physics Insight
Forces X axis Y axis Sum
12
*student's worksheet *millimeter block paper, stick of match, glue, protractor, ruler Acknowledgment Teacher Principal of 5 Senior High School Bekasi, July 13th, 2010 Drs. Sri Susanti, MM Sukrini, S.Pd NIP.131 623 411 NIP. 198007082006042025
Student Worksheet Vectors addition (first meeting)
Purpose : Add vectors by polygon and analytic methods Materials : millimeter block paper, stick of match, glue, protractor, ruler Prosedure: A. Polygon method
1. Sketch horizontal dot line and measure the angle of 300 with anticlockwise direction then draw guide line and put 2 sticks of matches with glue. 2. Sketch horizontal dot line at the end of the matches and create the angle of 600 with clockwise direction then put 2 sticks of matches with glue. 3. Measure the angle of 300 then put 1 stick of matches with glue 4. Sketch the coloured line from first vector to the end of third vector. 5. Write the length of the coloured line in cm.
B. Metode analytic 1. Put 5 sticks of matches at coordinate Cartesian in millimeter block paper as figure below. 2. Draw the vector component of each vector with different colour Answer: F1+F2+F3=… cm 4. Measure the length of component in cm and record in table below. 1(orange) + … .c m + ….cm 2(green ) - … . c m + ….cm 3(blue) - … . c m - ….cm
13
sum Rx cm Ry cm 5. Use the phytagoras formula to find the resultant.
R = 22 Ry Rx +
Conclusion: How is the result from polygon and analytic method? Are they the same?
LESSON PLAN 3 School : 5 Senior High School Bekasi Subject : Physics Year/semester : 10/1 Duration : 4x45 minutes Numbers of meeting : 2 Standard of competence:
2. Apply the kinematics and dynamic concepts of a particle
Basic competence: Analyze physics quantities in rectilinear motion both of no acceleration & constant acceleration
Indicators:
*Identify physic quantities of rectilinear motion *Analyze physic quantities of rectilinear motion with no acceleration * Analyze physic quantities of rectilinear motion with constant acceleration *Analyze the graphic of rectilinear motion with no acceleration and constant acceleration. (Adapt from IGCSE 'A' level)
Objectives
Can define and apply the concepts of kinematics and dynamic concepts of an object in physics problems
Fundamental lesson
14
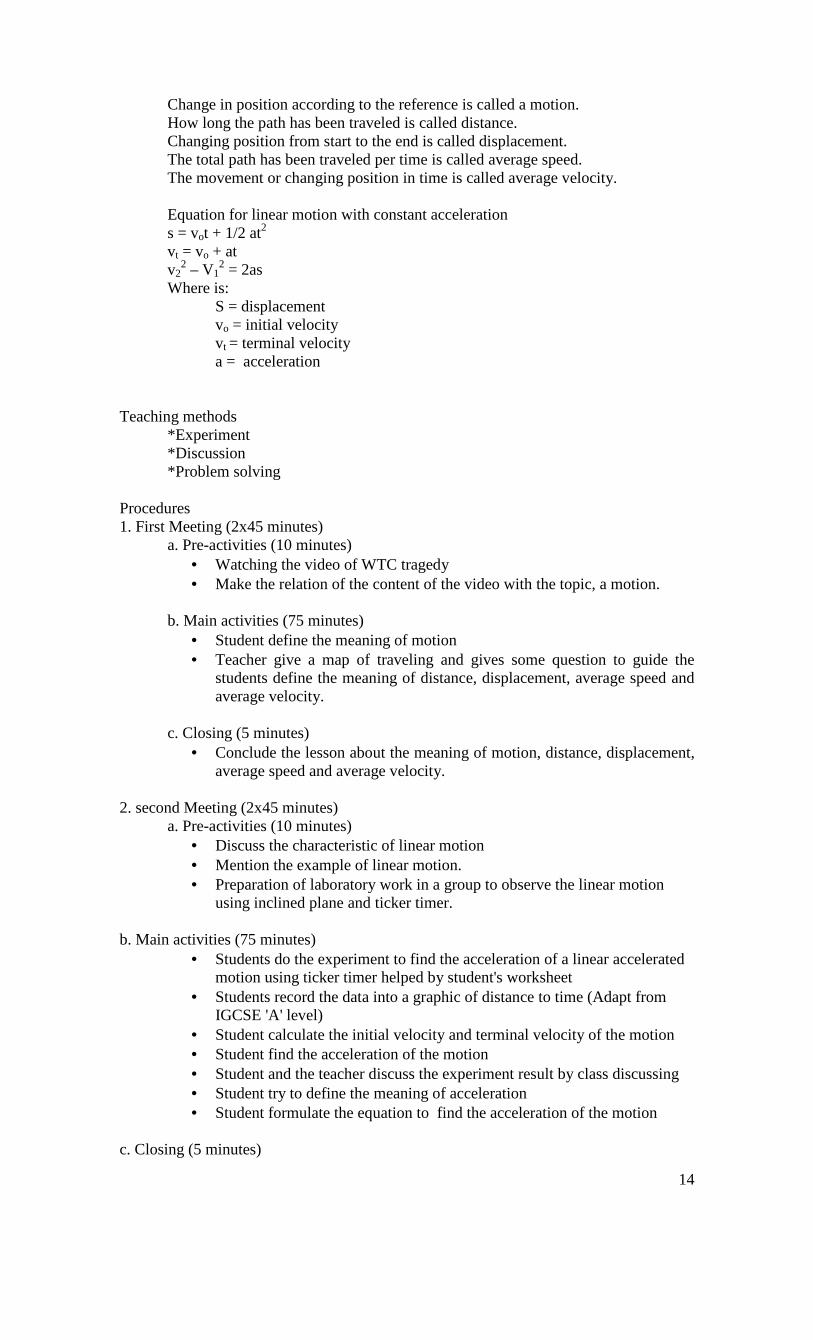
Change in position according to the reference is called a motion. How long the path has been traveled is called distance. Changing position from start to the end is called displacement. The total path has been traveled per time is called average speed. The movement or changing position in time is called average velocity.
Equation for linear motion with constant acceleration s = vot + 1/2 at2 vt = vo + at v2
2 – V12 = 2as
Where is: S = displacement vo = initial velocity vt = terminal velocity a = acceleration
Teaching methods *Experiment *Discussion *Problem solving Procedures 1. First Meeting (2x45 minutes)
a. Pre-activities (10 minutes) • Watching the video of WTC tragedy • Make the relation of the content of the video with the topic, a motion.
b. Main activities (75 minutes)
• Student define the meaning of motion • Teacher give a map of traveling and gives some question to guide the
students define the meaning of distance, displacement, average speed and average velocity.
c. Closing (5 minutes)
• Conclude the lesson about the meaning of motion, distance, displacement, average speed and average velocity.
2. second Meeting (2x45 minutes)
a. Pre-activities (10 minutes) • Discuss the characteristic of linear motion • Mention the example of linear motion. • Preparation of laboratory work in a group to observe the linear motion
using inclined plane and ticker timer. b. Main activities (75 minutes)
• Students do the experiment to find the acceleration of a linear accelerated motion using ticker timer helped by student's worksheet
• Students record the data into a graphic of distance to time (Adapt from IGCSE 'A' level)
• Student calculate the initial velocity and terminal velocity of the motion • Student find the acceleration of the motion • Student and the teacher discuss the experiment result by class discussing • Student try to define the meaning of acceleration • Student formulate the equation to find the acceleration of the motion
c. Closing (5 minutes)
15
• Conclude the lesson about the meaning and the formula of initial velocity, terminal velocity and acceleration.
Evaluation • Cognitif aspect
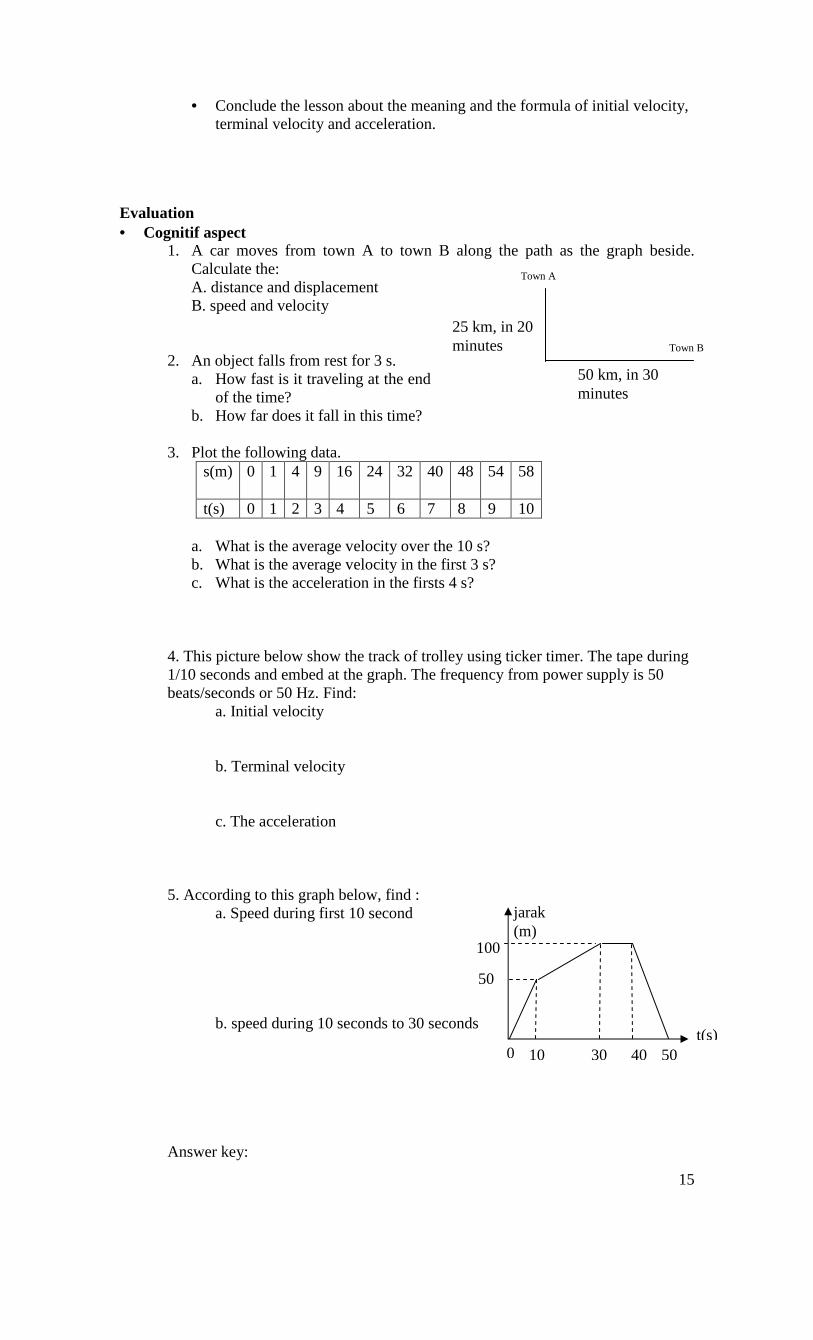
1. A car moves from town A to town B along the path as the graph beside. Calculate the: A. distance and displacement B. speed and velocity
2. An object falls from rest for 3 s.
a. How fast is it traveling at the end of the time?
b. How far does it fall in this time? 3. Plot the following data.
s(m) 0 1 4 9 16 24 32
40 48 54 58
t(s) 0 1 2 3 4 5 6 7 8 9 10
a. What is the average velocity over the 10 s? b. What is the average velocity in the first 3 s? c. What is the acceleration in the firsts 4 s?
4. This picture below show the track of trolley using ticker timer. The tape during 1/10 seconds and embed at the graph. The frequency from power supply is 50 beats/seconds or 50 Hz. Find:
a. Initial velocity b. Terminal velocity c. The acceleration
5. According to this graph below, find : a. Speed during first 10 second
b. speed during 10 seconds to 30 seconds
Answer key:
25 km, in 20 minutes
50 km, in 30 minutes
Town A
Town B
0 10 30 40 50
jarak(m)
t(s)
100
50
16
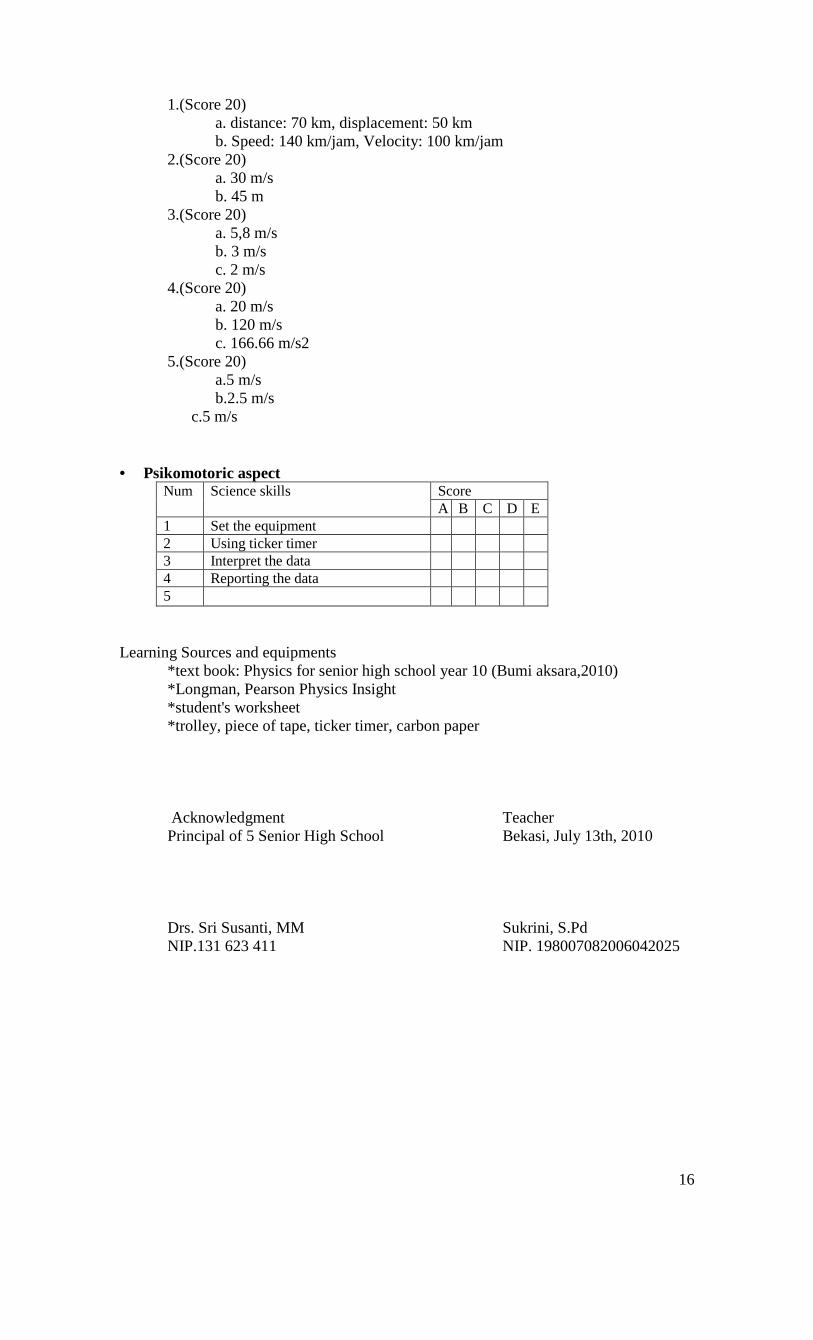
1.(Score 20) a. distance: 70 km, displacement: 50 km b. Speed: 140 km/jam, Velocity: 100 km/jam
2.(Score 20) a. 30 m/s b. 45 m
3.(Score 20) a. 5,8 m/s b. 3 m/s c. 2 m/s
4.(Score 20) a. 20 m/s b. 120 m/s c. 166.66 m/s2
5.(Score 20) a.5 m/s b.2.5 m/s
c.5 m/s • Psikomotoric aspect
Num Science skills Score A B C D E 1 Set the equipment 2 Using ticker timer 3 Interpret the data 4 Reporting the data 5
Learning Sources and equipments
*text book: Physics for senior high school year 10 (Bumi aksara,2010) *Longman, Pearson Physics Insight *student's worksheet *trolley, piece of tape, ticker timer, carbon paper Acknowledgment Teacher Principal of 5 Senior High School Bekasi, July 13th, 2010 Drs. Sri Susanti, MM Sukrini, S.Pd NIP.131 623 411 NIP. 198007082006042025
17
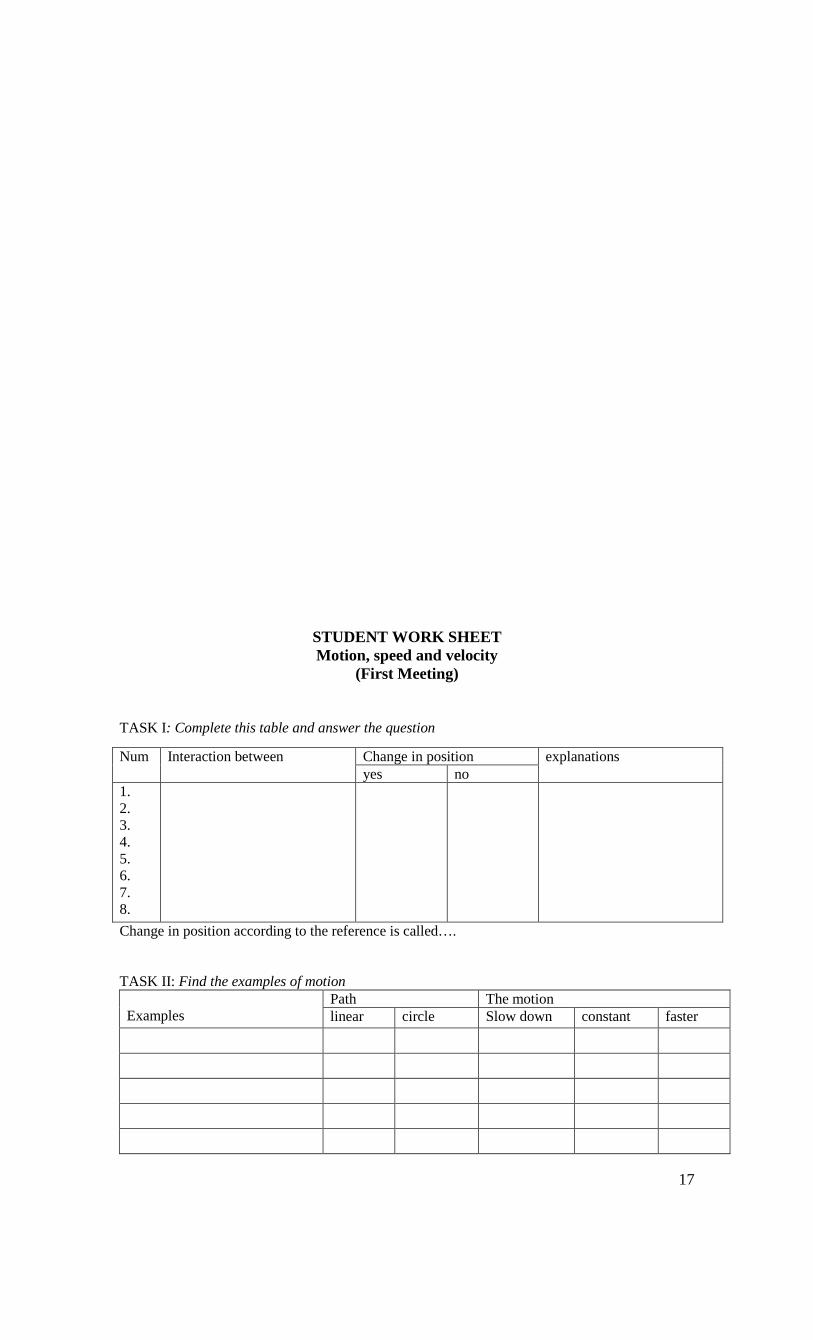
STUDENT WORK SHEET Motion, speed and velocity
(First Meeting) TASK I: Complete this table and answer the question
Change in position according to the reference is called…. TASK II: Find the examples of motion Examples
Path The motion linear circle Slow down constant faster
Num Interaction between Change in position explanations yes no
1. 2. 3. 4. 5. 6. 7. 8.
18
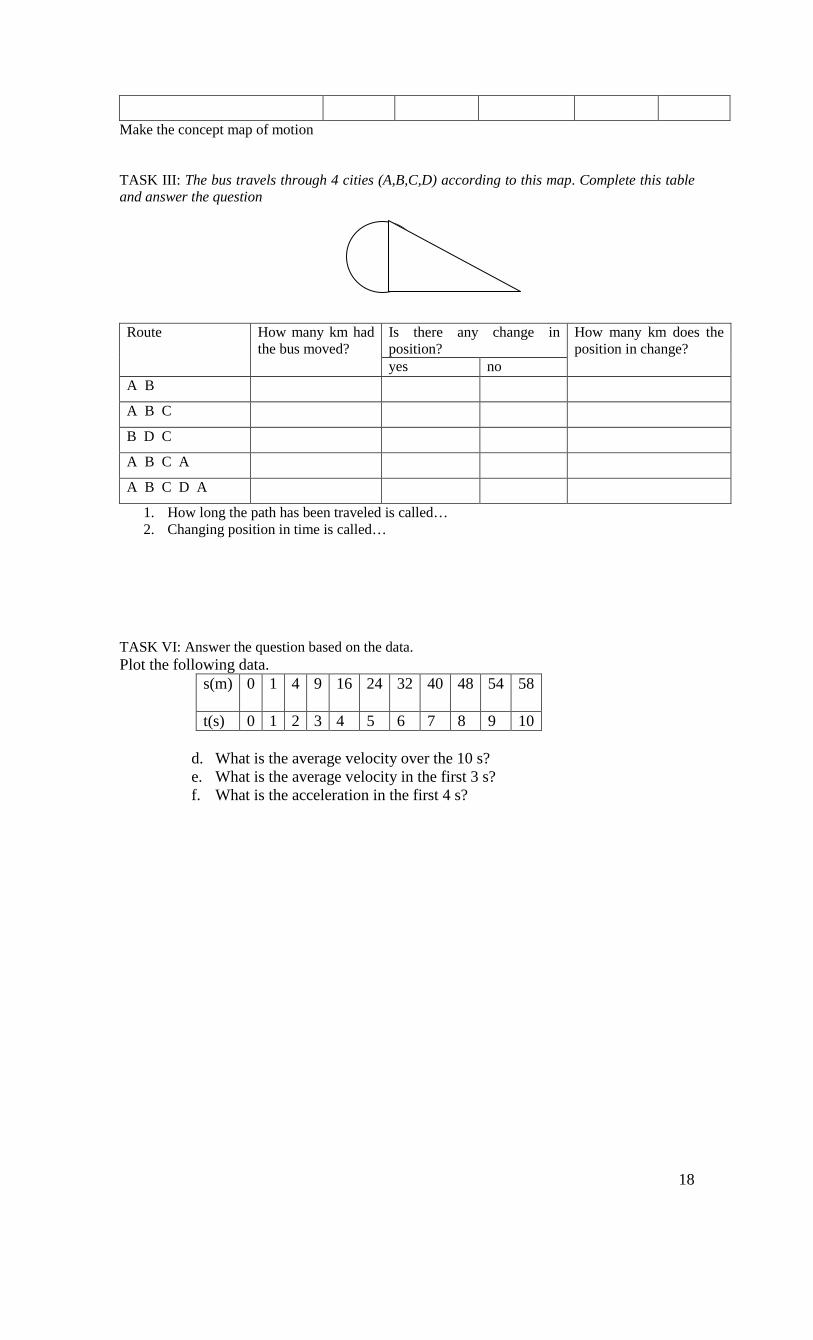
Make the concept map of motion TASK III: The bus travels through 4 cities (A,B,C,D) according to this map. Complete this table and answer the question Route How many km had
the bus moved? Is there any change in position?
How many km does the position in change?
yes no A B
A B C
B D C
A B C A
A B C D A
1. How long the path has been traveled is called… 2. Changing position in time is called…
TASK VI: Answer the question based on the data. Plot the following data.
s(m) 0 1 4 9 16 24 32
40 48 54 58
t(s) 0 1 2 3 4 5 6 7 8 9 10
d. What is the average velocity over the 10 s? e. What is the average velocity in the first 3 s? f. What is the acceleration in the first 4 s?
19
STUDENT WORK SHEET Velocity and Acceleration of Linear Motion
(Second Meeting)
PRACTICAL WORK Activity 2.1 To calibrate a ticker tape timer Equipment Ticker tape timer, piece of tape 60 cm long, power supply, glue, scissor, carbon paper Procedure 1. Set up the apparatus as shown in figure 2. Pull the tape through the timer with uniform speed for 2 seconds 3. Count the number of time interval between the formation of successive dots Recording data
Time Time for tape to Number of time
A • • • • • • • • • • B 1 2 3 4 5 6 7 8 9 10
20
between successive recordings t1(s)
move from A-B (seconds)
interval between A and B
0,2 2 10 Example
… … … Your data
Conclusion The time between the formation of successive dots by ticker tape timer is…seconds Activity 2.2 To measure and record the position of a moving tape at various times. Equipment As for activity 2.1 plus 1 m ruler, three pieces of ticker tape each 30 cm long Procedure
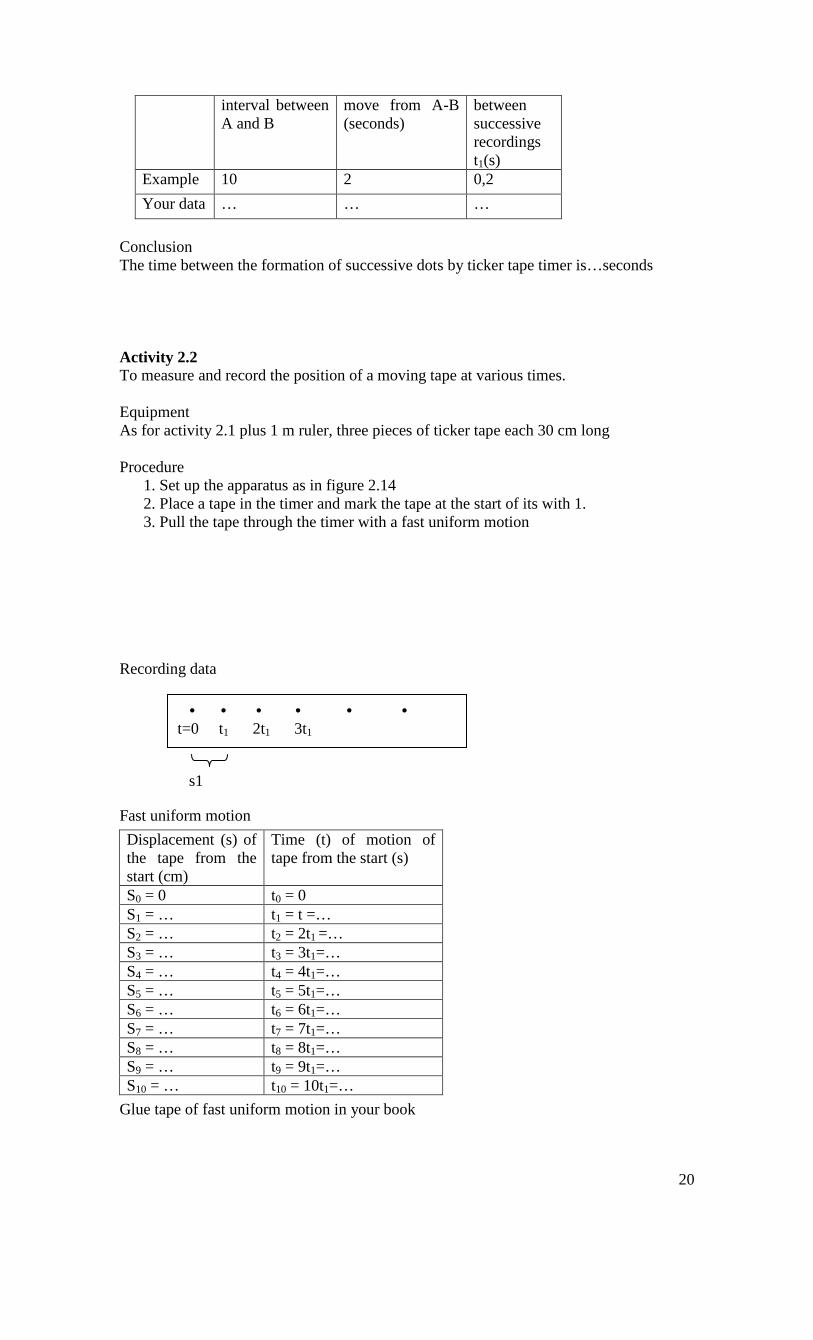
1. Set up the apparatus as in figure 2.14 2. Place a tape in the timer and mark the tape at the start of its with 1. 3. Pull the tape through the timer with a fast uniform motion
Recording data Fast uniform motion
Glue tape of fast uniform motion in your book
Time (t) of motion of tape from the start (s)
Displacement (s) of the tape from the start (cm)
t0 = 0 S0 = 0 t1 = t =… S1 = … t2 = 2t1 =… S2 = … t3 = 3t1=… S3 = … t4 = 4t1=… S4 = … t5 = 5t1=… S5 = … t6 = 6t1=… S6 = … t7 = 7t1=… S7 = … t8 = 8t1=… S8 = … t9 = 9t1=… S9 = … t10 = 10t1=… S10 = …
• • • • • • t=0 t1 2t1 3t1
s1
21
Activity 2.3 To plot graphs of displacement against time for various types of motion Equipment As for activity 2.2 plus three sheets of 2mm graph paper, 25 cmx18cm, 150 g mass carrier, adhesive tape. Procedure 1. Use the data from activity 2.2 and plot a graph of displacement (s) of the tapes on the vertical axis against time (t) of motion of the tape on horizontal axis. Your graph should
a. Have a heading, e.g. Displacement of the ticker tape through a ticker tape timer against time of motion of the tape b. Be constructed using a suitable scale, so that the graph covers most of the graph paper c. Describe the quantity plotted on each axis by name, symbol and unit
2. Repeat Activity 2.2 and 2.3 for tapes pulled through the timer with
a. slow uniform motion b. the ticker tape timer clamped in the vertical position and a 50 g mass
carrier taped to the ticker tape so that it falls freely under the influence of gravity
Recording data
a. slow uniform motion
Glue tape of slow motion in your book
b. Accelerated motion
Time (t) of motion of tape from the start (s)
Displacement (s) of the tape from the start (cm)
t0 = 0 S0 = 0 t1 = t =… S1 = … t2 = 2t1 =… S2 = … t3 = 3t1=… S3 = … t4 = 4t1=… S4 = … t5 = 5t1=… S5 = … t6 = 6t1=… S6 = … t7 = 7t1=… S7 = … t8 = 8t1=… S8 = … t9 = 9t1=… S9 = … t10 = 10t1=… S10 = …
Time (t) of motion of tape from the start (s)
Displacement (s) of the tape from the start (cm)
t0 = 0 S0 = 0 t1 = t =… S1 = …
22
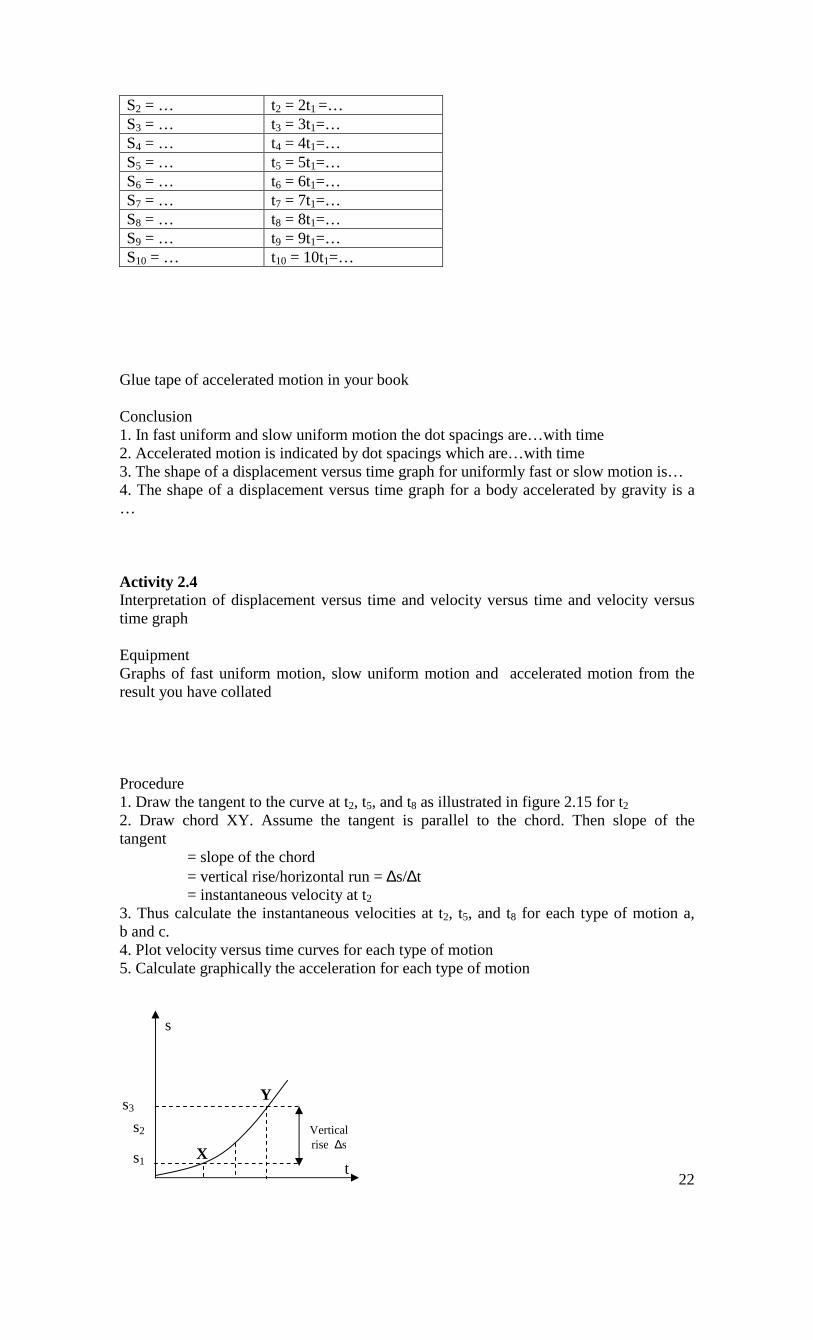
Glue tape of accelerated motion in your book Conclusion 1. In fast uniform and slow uniform motion the dot spacings are…with time 2. Accelerated motion is indicated by dot spacings which are…with time 3. The shape of a displacement versus time graph for uniformly fast or slow motion is… 4. The shape of a displacement versus time graph for a body accelerated by gravity is a … Activity 2.4 Interpretation of displacement versus time and velocity versus time and velocity versus time graph Equipment Graphs of fast uniform motion, slow uniform motion and accelerated motion from the result you have collated Procedure 1. Draw the tangent to the curve at t2, t5, and t8 as illustrated in figure 2.15 for t2 2. Draw chord XY. Assume the tangent is parallel to the chord. Then slope of the tangent = slope of the chord = vertical rise/horizontal run = ∆s/∆t = instantaneous velocity at t2 3. Thus calculate the instantaneous velocities at t2, t5, and t8 for each type of motion a, b and c. 4. Plot velocity versus time curves for each type of motion 5. Calculate graphically the acceleration for each type of motion
t2 = 2t1 =… S2 = … t3 = 3t1=… S3 = … t4 = 4t1=… S4 = … t5 = 5t1=… S5 = … t6 = 6t1=… S6 = … t7 = 7t1=… S7 = … t8 = 8t1=… S8 = … t9 = 9t1=… S9 = … t10 = 10t1=… S10 = …
s
t
s3
s2
s1 X
Y
Vertical rise ∆s
23
Recording data
t8 vt8 t5 vt5 t2 vt2 Instantaneous velocity(∆s/t)
Fast uniform motion
Slow uniform motion
Accelerated motion
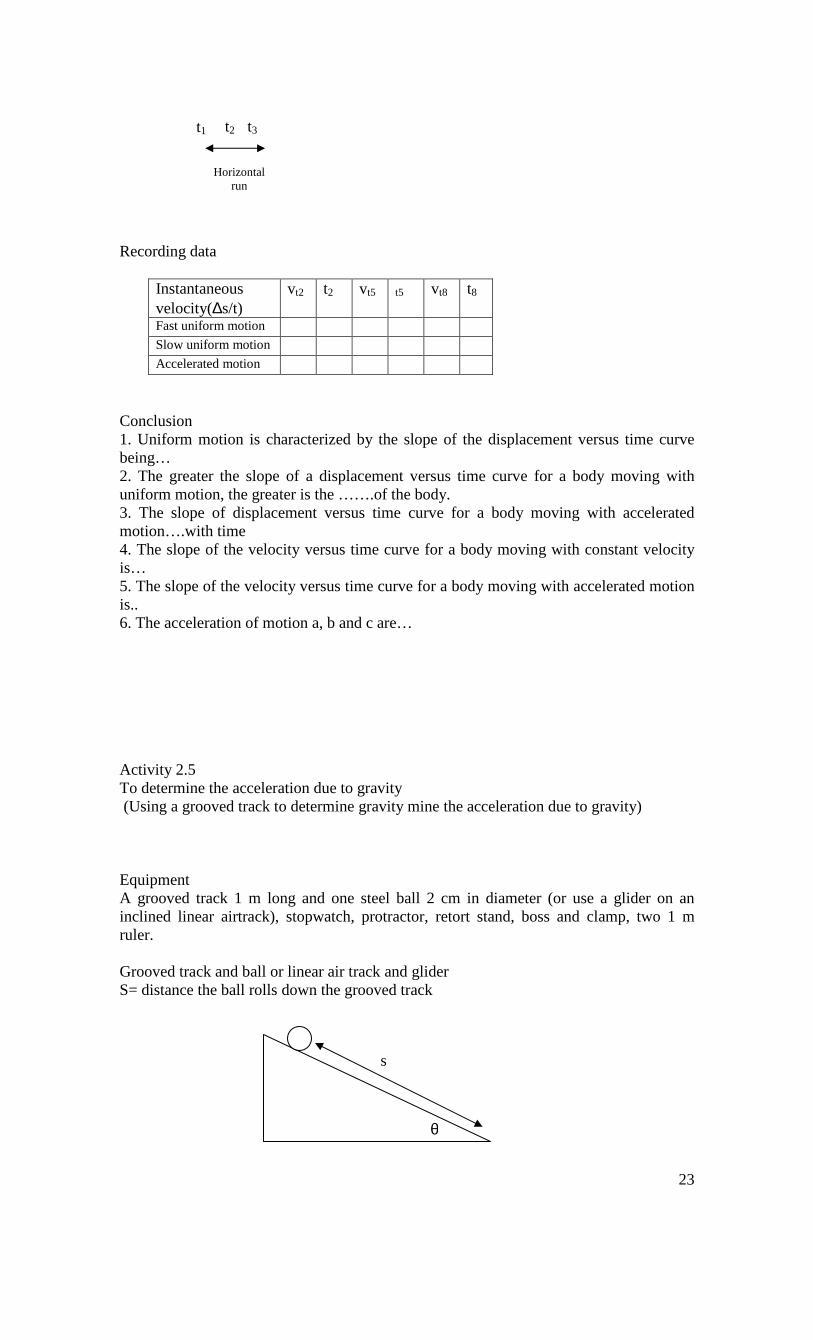
Conclusion 1. Uniform motion is characterized by the slope of the displacement versus time curve being… 2. The greater the slope of a displacement versus time curve for a body moving with uniform motion, the greater is the …….of the body. 3. The slope of displacement versus time curve for a body moving with accelerated motion….with time 4. The slope of the velocity versus time curve for a body moving with constant velocity is… 5. The slope of the velocity versus time curve for a body moving with accelerated motion is.. 6. The acceleration of motion a, b and c are… Activity 2.5 To determine the acceleration due to gravity (Using a grooved track to determine gravity mine the acceleration due to gravity) Equipment A grooved track 1 m long and one steel ball 2 cm in diameter (or use a glider on an inclined linear airtrack), stopwatch, protractor, retort stand, boss and clamp, two 1 m ruler. Grooved track and ball or linear air track and glider S= distance the ball rolls down the grooved track
s
θ
t1 t2
t3
Horizontal run
24
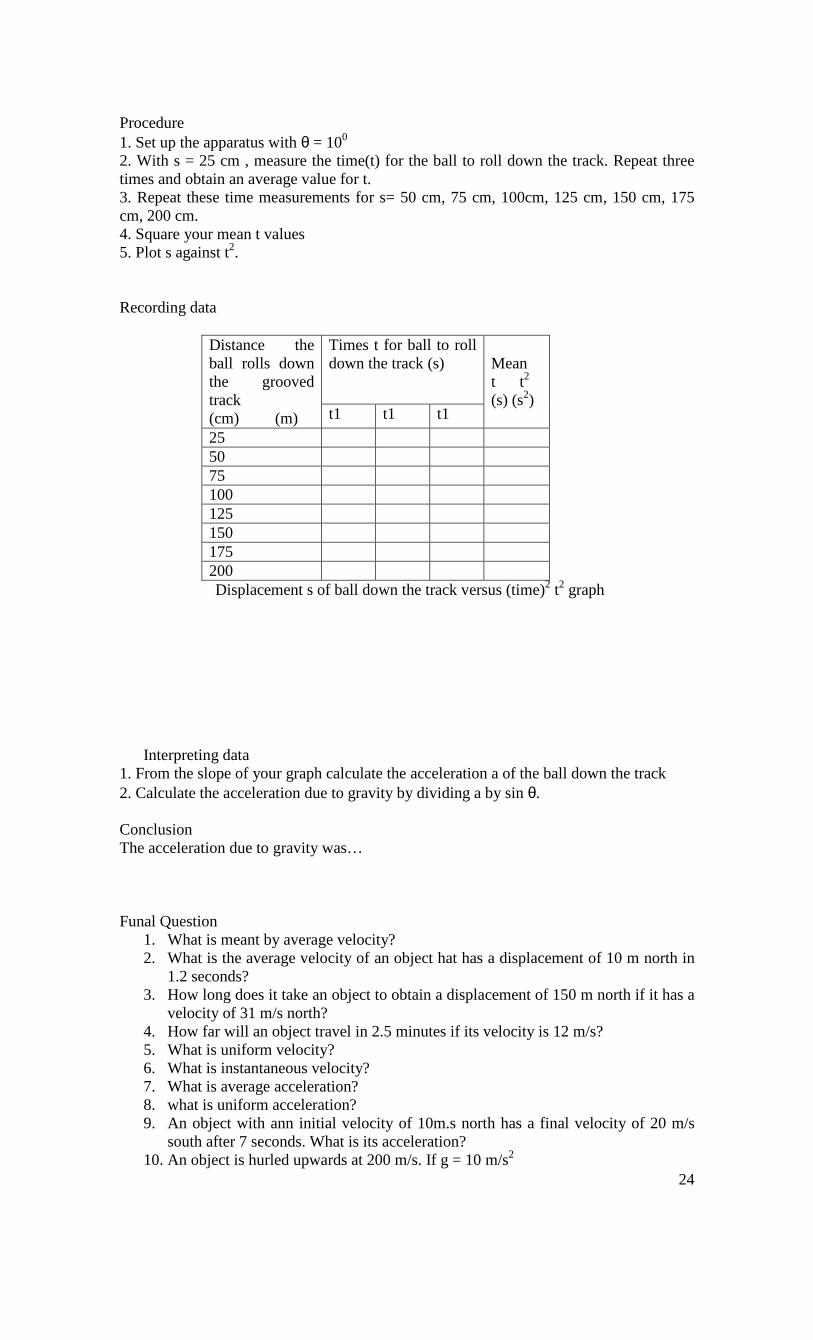
Procedure 1. Set up the apparatus with θ = 100 2. With s = 25 cm , measure the time(t) for the ball to roll down the track. Repeat three times and obtain an average value for t. 3. Repeat these time measurements for s= 50 cm, 75 cm, 100cm, 125 cm, 150 cm, 175 cm, 200 cm. 4. Square your mean t values 5. Plot s against t2. Recording data
Mean t t2
(s) (s2)
Times t for ball to roll down the track (s)
Distance the ball rolls down the grooved track (cm) (m) t1 t1 t1
25 50 75 100 125 150 175 200
Displacement s of ball down the track versus (time)2 t2 graph
Interpreting data
1. From the slope of your graph calculate the acceleration a of the ball down the track 2. Calculate the acceleration due to gravity by dividing a by sin θ. Conclusion The acceleration due to gravity was… Funal Question
1. What is meant by average velocity? 2. What is the average velocity of an object hat has a displacement of 10 m north in
1.2 seconds? 3. How long does it take an object to obtain a displacement of 150 m north if it has a
velocity of 31 m/s north? 4. How far will an object travel in 2.5 minutes if its velocity is 12 m/s? 5. What is uniform velocity? 6. What is instantaneous velocity? 7. What is average acceleration? 8. what is uniform acceleration? 9. An object with ann initial velocity of 10m.s north has a final velocity of 20 m/s
south after 7 seconds. What is its acceleration? 10. An object is hurled upwards at 200 m/s. If g = 10 m/s2
25
a. what is the change in velocity after 3.3 seconds? b. what is the velocity after 3.3 seconds?
LESSON PLAN 4 School : 5 Senior High School Bekasi Subject : Physics Year/semester : 10/1 Duration : 2x45 minutes Numbers of meeting : 1 Standard of competence:
2. Apply the kinematics and dynamic concepts of a particle
Basic competence: 2.2 Analyze physics quantities in circular motion with constant speed
Indicators: *Identify the frequency, period, and angular displacement in circular motion with constant speed *Analyze physics quantities & its relationship between rectilinear motion & circular motion with constant speed * Apply the physics quantities in joining wheels system
Objectives

26
Can define and apply the concepts of kinematics in circular motion Fundamental lesson
Two important physical quantities in studies of circular motion are periods and frequency. T = t/n and f = n/t Where is:
T = Periods f = frequency n = number of rotation t = time elapsed
As the particle moves along the circle, it travels an arc length s, which becomes related to the angular position through the relationship:
Angular displacement is measured in radians rather than degrees. This is because it provides a very simple relationship between distance traveled around the circle and the distance r from the centre.
For example if an object rotates 360 degrees around a circle radius r the angular displacement is given by the distance traveled the circumference which is 2πr
Divided by the radius in: which easily simplifies to θ = 2π. Therefore 1 revolution is 2π radians.
When object travels from point P to point Q, as it does in the illustration to the left, over δt the radius of the circle goes around a change in angle. ∆θ = ∆θ2 − ∆θ1 which equals the Angular Displacement.
The angular velocity is a ratio of the total angular measurement through which a particle rotates in a given unit of time. If we use w to stand for angular velocity, we have
Where is: w= angular velocity θ = angular displacement t = time Teaching methods *Discussion *Problem solving Procedures 1. First Meeting (2x45 minutes)
a. Pre-activities (10 minutes) • Mention the example of circular motion in daily life • Make the concept map of circular motion division
27
b. Main activities (75 minutes)
• Teacher explain to convert degrees into radian units • Student find out the definition of angular velocity, angular displacement,
frequency and periods in circular motion. • Student find the relationship between the quantities in rectilinear and
circular motion • Student find out the differences between circular motion with no
acceleration and constant acceleration • Student find out the relationship between 2 wheels system, helped by
educational software • Student find the formula in every types of joining wheels system • Student apply the new concept in another physics problems
c. Closing (5 minutes)
• Conclude the lesson about the quantities in circular motion • Conclude the lesson about the formula in every types of joining wheels
system • Teacher gives group task to find the article from internet about
applications of joining wheels system in industrial world
Evaluation • Cognitif aspect
1. An angle is subtended at the center of a circle of radius 5 m by an arc of 1.6 m. How many radians are there in this angle?
2. The earth orbits the sun with a radius of 150 million km once every 365¼ days. What is the angular velocity of the earth? (rad/s).What is the linear velocity in m/s? What is the centripetal acceleration in m/s?
3. A boy rides the bicycle with constant speed. The wheels have radius of 35 cm. If the wheels has linear velocity of 20 m/s? How far does the boy has moved?
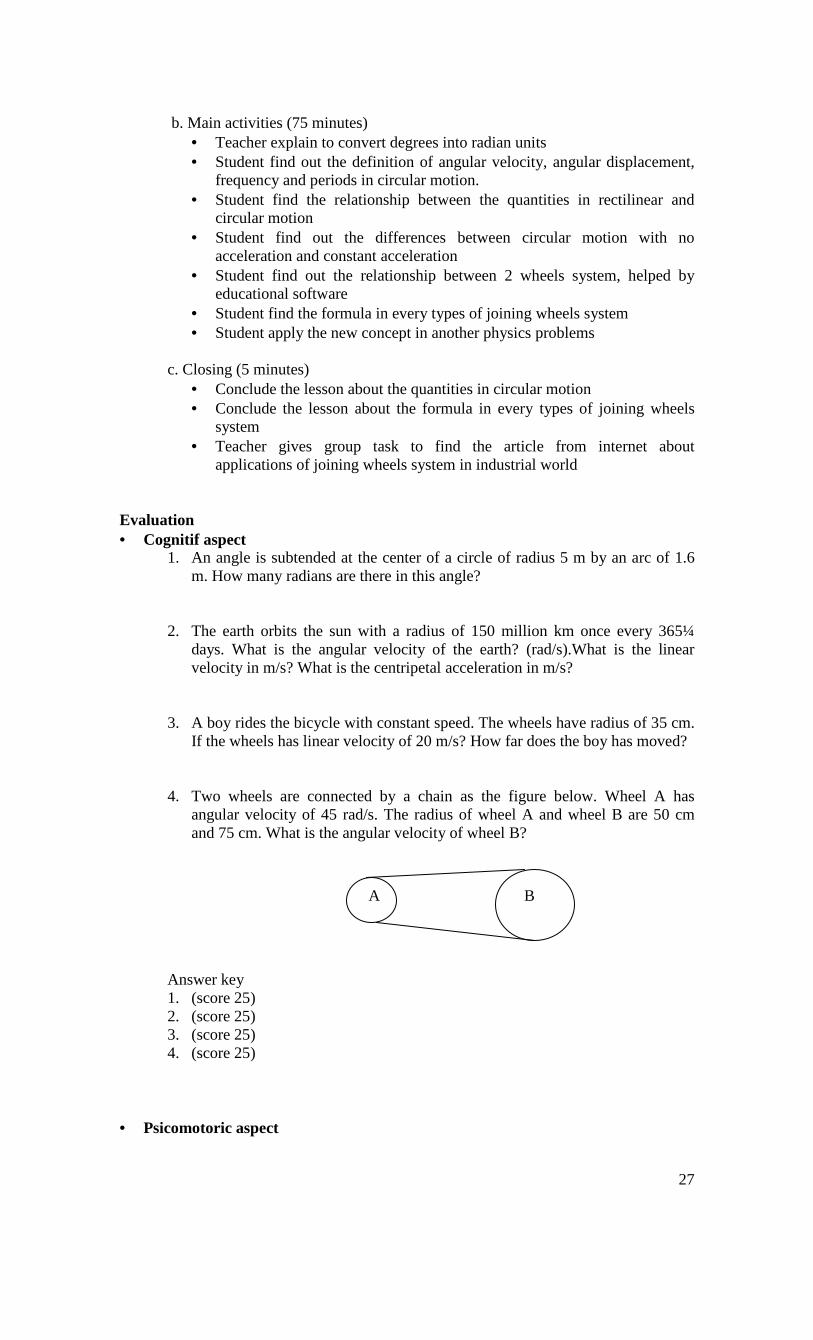
4. Two wheels are connected by a chain as the figure below. Wheel A has angular velocity of 45 rad/s. The radius of wheel A and wheel B are 50 cm and 75 cm. What is the angular velocity of wheel B?
Answer key
1. (score 25) 2. (score 25) 3. (score 25) 4. (score 25)
• Psicomotoric aspect
A B
28
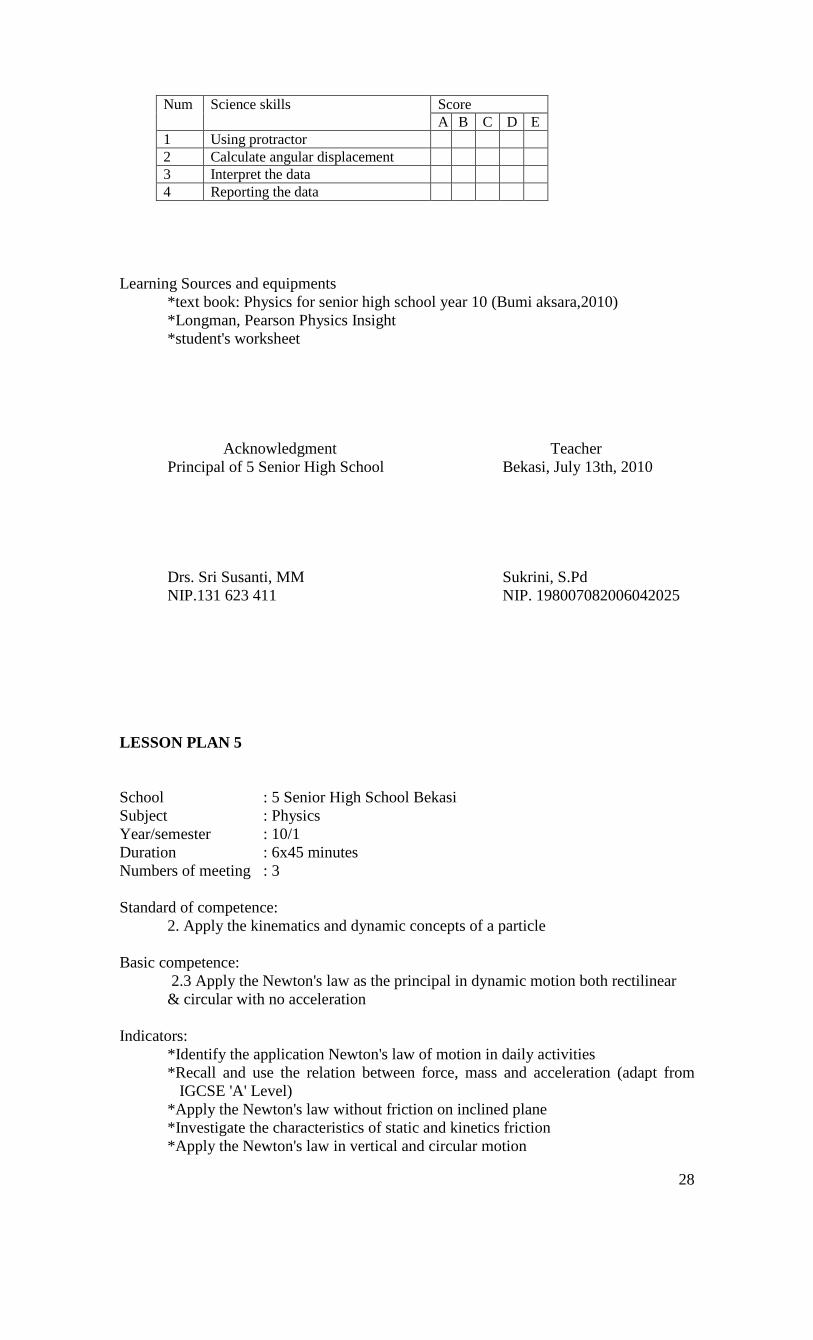
Num Science skills Score A B C D E 1 Using protractor 2 Calculate angular displacement 3 Interpret the data 4 Reporting the data
Learning Sources and equipments
*text book: Physics for senior high school year 10 (Bumi aksara,2010) *Longman, Pearson Physics Insight *student's worksheet Acknowledgment Teacher Principal of 5 Senior High School Bekasi, July 13th, 2010 Drs. Sri Susanti, MM Sukrini, S.Pd NIP.131 623 411 NIP. 198007082006042025
LESSON PLAN 5 School : 5 Senior High School Bekasi Subject : Physics Year/semester : 10/1 Duration : 6x45 minutes Numbers of meeting : 3 Standard of competence:
2. Apply the kinematics and dynamic concepts of a particle
Basic competence: 2.3 Apply the Newton's law as the principal in dynamic motion both rectilinear & circular with no acceleration
Indicators: *Identify the application Newton's law of motion in daily activities *Recall and use the relation between force, mass and acceleration (adapt from
IGCSE 'A' Level) *Apply the Newton's law without friction on inclined plane *Investigate the characteristics of static and kinetics friction *Apply the Newton's law in vertical and circular motion
29
Objectives:
Can define and apply the Newton's law as the principal in dynamic motion both rectilinear & circular with no acceleration
Fundamental lesson:
Newton's law of motion and frictional force
Teaching methods *Experiment *Discussion *Problem solving Procedures 1. First Meeting (2x45 minutes)
a. Pre-activities (10 minutes) • Recall the vector addition’s methods • Discuss the definition of forces and types of forces
b. Main activities (75 minutes)
• Explain the Newton’s law of motion • Analyze the examples of body system with Newton’s law of motion (adapt
from IGCSE 'A' Level) • Sketch the forces diagram of many system • Explain the agreement about vector direction in motion based on
Newton’s law of motion
c. Closing (5 minutes) • conclude the lesson about Newton’s law of motion • The teacher gives the homework
2. Second meeting (2x45 minutes) a. Pre-activities (10 minutes)
• Recall how to find the component of vector • Recall the types of forces
b. Main activities (75 minutes) • Teacher explain Newton’s second law of motion with demonstration of
accelerated motion • Student practical to find the characteristic of static and kinetic friction
forces • Student find the factors that effect the frictional forces • Student record the data and make interpretation
c. Closing (5 minutes)
• discuss the experimental result • conclude the lesson about frictional force • collect the practical report
3. Third Meeting (2x45 minutes)
a. Pre-activities (10 minutes) • Recall the quantities in circular motion • Recall the Newton’s law of motion in rectilinear motion
b. Main activities (75 minutes)
• Student sketch the net force of some circular motion
30
• Teacher explain the formula of Newton’s law in circular motion • Student apply the new concept of Dynamic motion in circular path in
another physics problems c. Closing (5 minutes)
• Conclude the lesson about Newton’s law in circular motion • Teacher gives homework
Evaluation • Cognitif aspect
1. Three forces acting through a point hold a body in a state of equilibrium. If two of the forces are 60 N 300 east of north and 104 N 600 east of south, what is the magnitude and direction of the third force?
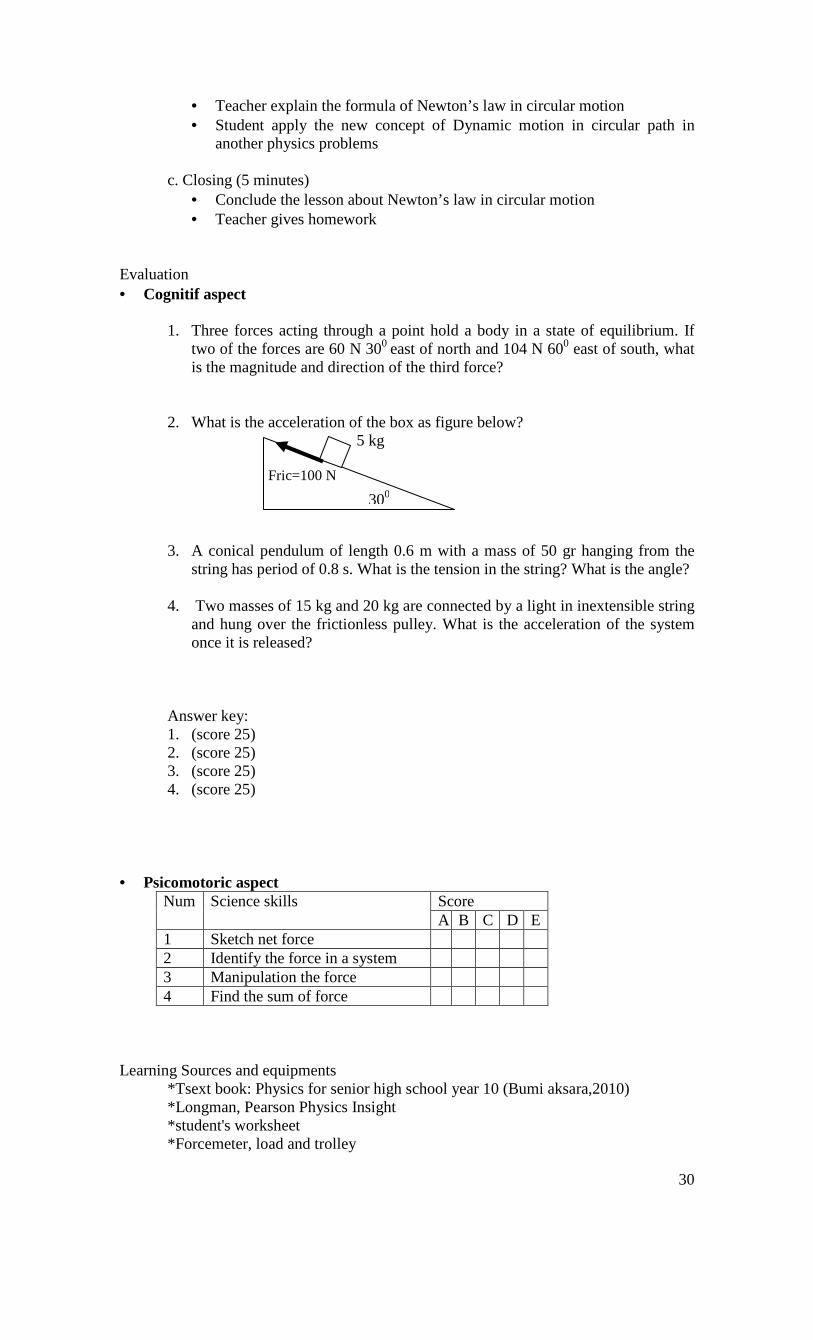
2. What is the acceleration of the box as figure below? 3. A conical pendulum of length 0.6 m with a mass of 50 gr hanging from the
string has period of 0.8 s. What is the tension in the string? What is the angle? 4. Two masses of 15 kg and 20 kg are connected by a light in inextensible string
and hung over the frictionless pulley. What is the acceleration of the system once it is released?
Answer key: 1. (score 25) 2. (score 25) 3. (score 25) 4. (score 25)
• Psicomotoric aspect Num Science skills Score A B C D E 1 Sketch net force 2 Identify the force in a system 3 Manipulation the force 4 Find the sum of force
Learning Sources and equipments *Tsext book: Physics for senior high school year 10 (Bumi aksara,2010) *Longman, Pearson Physics Insight *student's worksheet *Forcemeter, load and trolley
300
5 kg
Fric=100 N
31
Acknowledgment Teacher Principal of 5 Senior High School Bekasi, July 13th, 2010 Drs. Sri Susanti, MM Sukrini, S.Pd NIP.131 623 411 NIP. 198007082006042025
32
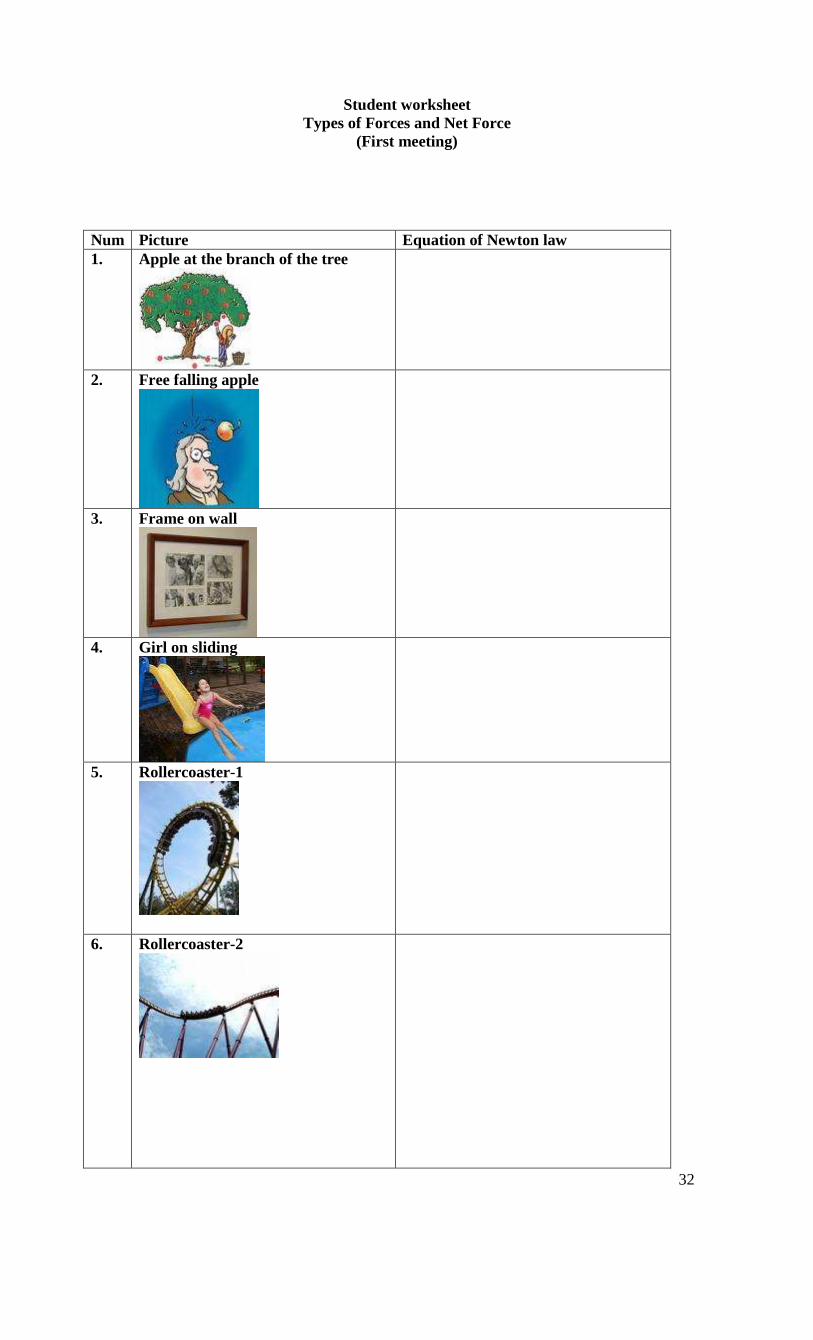
Student worksheet Types of Forces and Net Force
(First meeting)
Num Picture Equation of Newton law 1. Apple at the branch of the tree
2. Free falling apple
3. Frame on wall
4. Girl on sliding
5. Rollercoaster-1
6. Rollercoaster-2
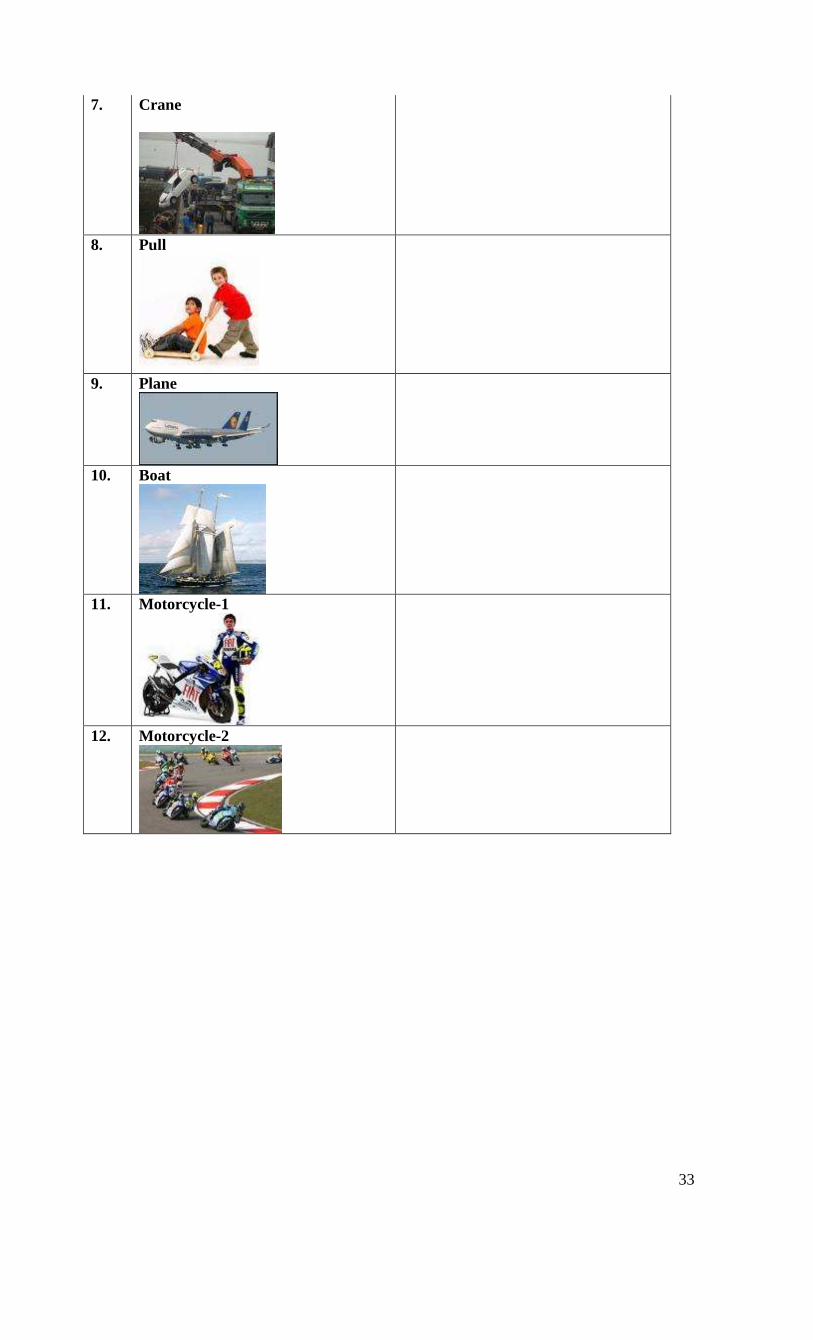
33
7.
Crane
8. Pull
9. Plane
10. Boat
11. Motorcycle-1
12. Motorcycle-2
34
Students worksheet
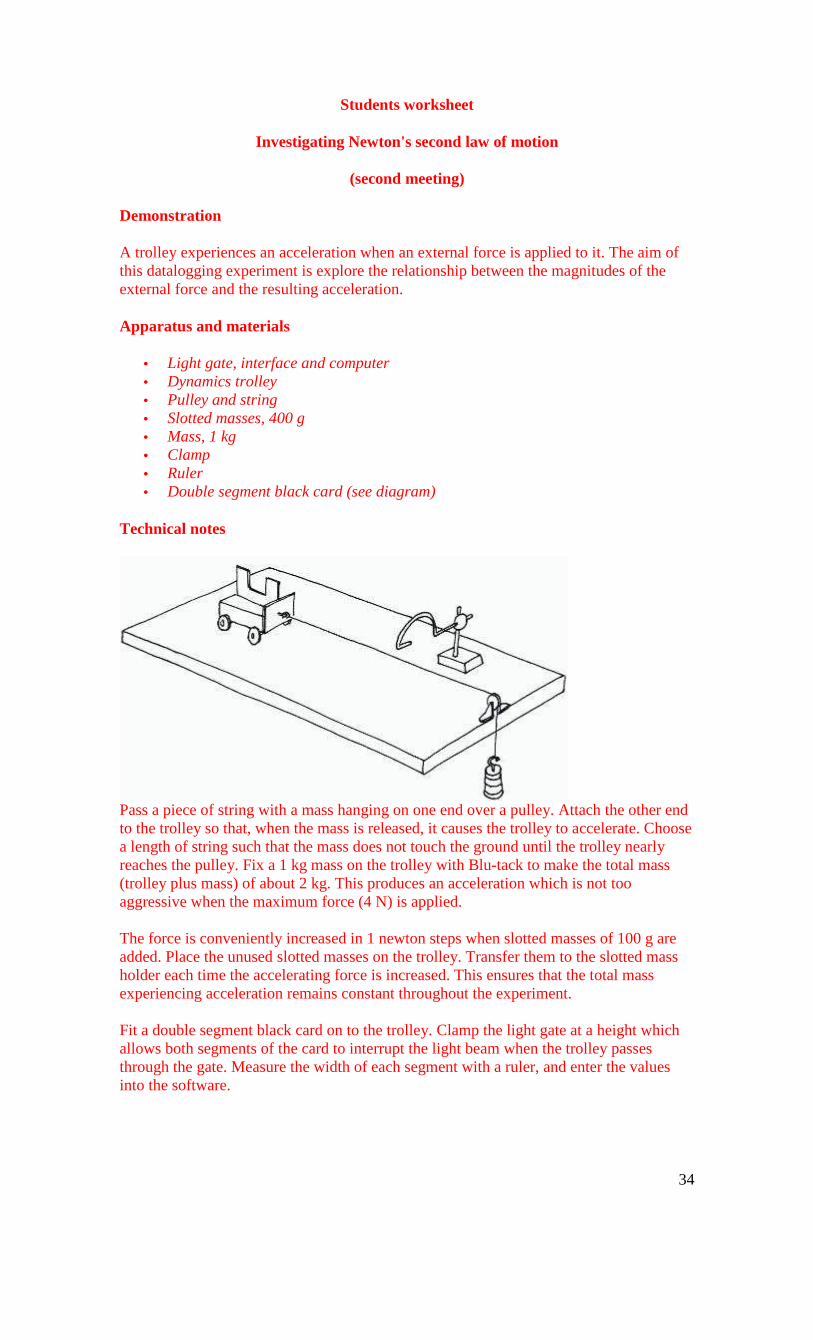
Investigating Newton's second law of motion
(second meeting)
Demonstration
A trolley experiences an acceleration when an external force is applied to it. The aim of this datalogging experiment is explore the relationship between the magnitudes of the external force and the resulting acceleration.
Apparatus and materials
• Light gate, interface and computer • Dynamics trolley • Pulley and string • Slotted masses, 400 g • Mass, 1 kg • Clamp • Ruler • Double segment black card (see diagram)
Technical notes
Pass a piece of string with a mass hanging on one end over a pulley. Attach the other end to the trolley so that, when the mass is released, it causes the trolley to accelerate. Choose a length of string such that the mass does not touch the ground until the trolley nearly reaches the pulley. Fix a 1 kg mass on the trolley with Blu-tack to make the total mass (trolley plus mass) of about 2 kg. This produces an acceleration which is not too aggressive when the maximum force (4 N) is applied. The force is conveniently increased in 1 newton steps when slotted masses of 100 g are added. Place the unused slotted masses on the trolley. Transfer them to the slotted mass holder each time the accelerating force is increased. This ensures that the total mass experiencing acceleration remains constant throughout the experiment. Fit a double segment black card on to the trolley. Clamp the light gate at a height which allows both segments of the card to interrupt the light beam when the trolley passes through the gate. Measure the width of each segment with a ruler, and enter the values into the software.
35
Connect the light gate via an interface to a computer running data-logging software. The program should be configured to obtain measurements of acceleration derived from the double interruptions of the light beam by the card. The internal calculation within the program involves using the interruption times for the two segments to obtain two velocities. The difference between these, divided by the time between them, yields the acceleration. A series of results is accumulated in a table. This should also include a column for the manual entry of values for 'force' in newtons. It is informative to display successive measurements on a simple bar chart.
Safety
Take care when masses fall to the floor. Use a box or tray lined with bubble wrap (or similar) under heavy objects being lifted. This will prevent toes or fingers from being in the danger zone.
Procedure
Data collectiona Select the falling mass to be 100 g. Pull the trolley back so that the mass is raised to just below the pulley. Position the light gate so that it will detect the motion of the trolley soon after it has started moving. Set the software to record data, then release the trolley. Observe the measurement for the acceleration of the trolley. b Repeat this measurement from the same starting position for the trolley several times. Enter from the keyboard '1'( 1 newton) in the force column of the table. c Transfer 100 g from the trolley to the slotted mass, to increase it to 200 g. Release the trolley from the same starting point as before. Repeat this several times. Enter '2' (2 newtons) in the force column of the table. d Repeat the above procedure for slotted masses of 300 g and 400 g. Analysis Depending upon the software, the results may be displayed on a bar chart as the experiment proceeds. Note the relative increase in values of acceleration as the slotted mass is increased. The relationship between acceleration and applied force is investigated more precisely by plotting an XY graph of these two quantities. (Y axis: acceleration; X axis: force.) Use a curve-matching tool to identify the algebraic form of the relationship. This is usually of the form 'acceleration is proportional to the applied force'. This relationship is indicative of Newton's second law of motion.
This experiment was submitted by Laurence Rogers, Senior Lecturer in Education at Leicester University
36
Student Worksheet
Friction between solid surfaces
(second meeting)
Demonstration
This is an exploration of which factors affect the force of friction when one surface slides across another and which do not.
Apparatus and materials
• Forcemeter, 50 N, large size for easy class viewing • Plank with screw eye (1 m x 15 cm x 1 cm), smooth • Block with screw eye (25 cm x 12 cm x 1 cm), smooth • Blocks without screw eye (25 cm x 12 cm x 1 cm), 3 • Rollers, 1 cm diameter and 20 cm long, 10 • Crank assembly • G-clamp to fix crank assembly to bench
Technical notes
Dimensions are for guidance and are approximate. The faces of the block must be of equal smoothness.
Safety
Read our standard health & safety guidance
Procedure
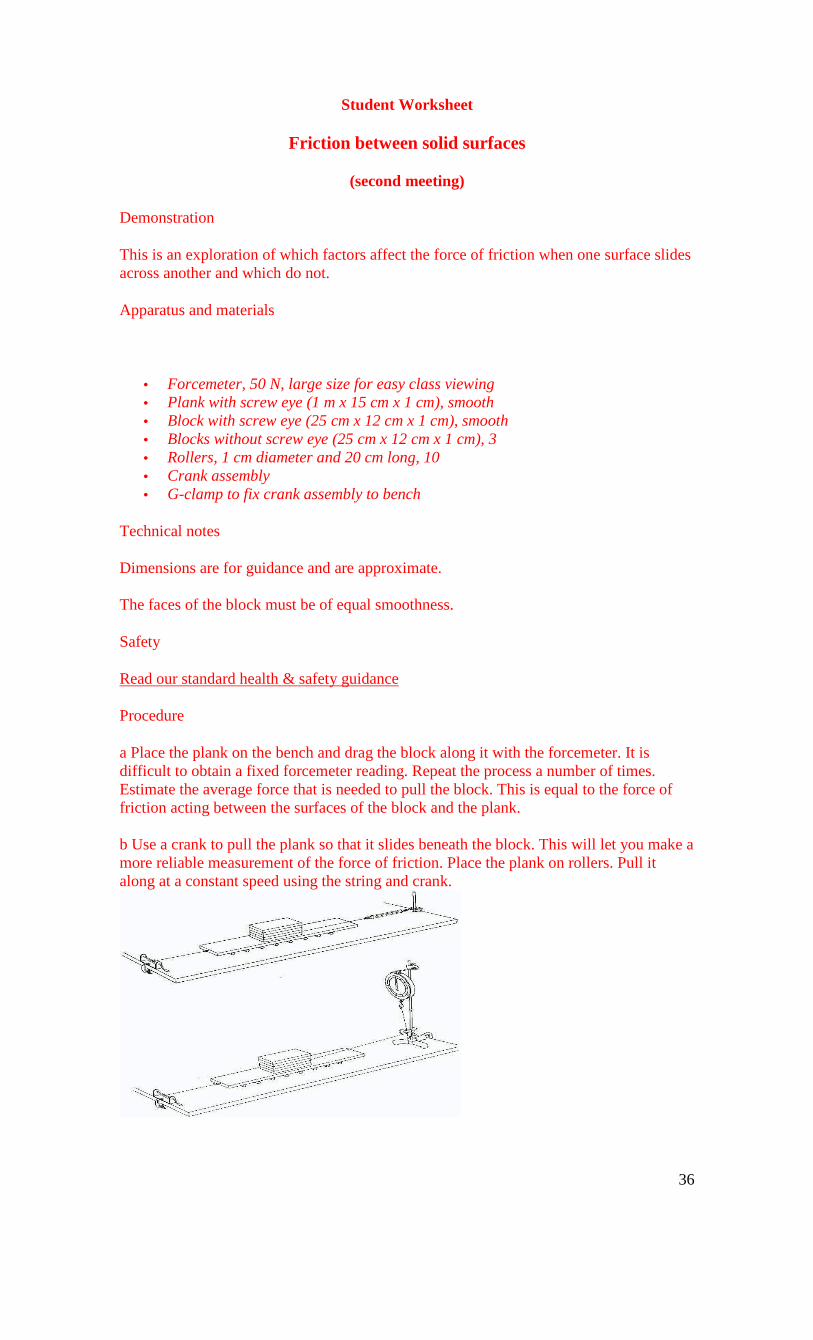
a Place the plank on the bench and drag the block along it with the forcemeter. It is difficult to obtain a fixed forcemeter reading. Repeat the process a number of times. Estimate the average force that is needed to pull the block. This is equal to the force of friction acting between the surfaces of the block and the plank. b Use a crank to pull the plank so that it slides beneath the block. This will let you make a more reliable measurement of the force of friction. Place the plank on rollers. Pull it along at a constant speed using the string and crank.

37
c Ask students to predict the effect of dragging the surfaces across each other at different speeds. Show them what happens. d Press down against the plank with a finger and again drag the plank along. This increases the frictional force between the surfaces of the plank and block. The forcemeter shows an increased force. e Add an equal block on top of the first so that the force pushing the block on to the plank is doubled. This force acts at 90° to the surfaces. Call it the 'normal' force. Measure the frictional force. Increase the load with two, three and four blocks and see how the frictional force increases. f Ask students to predict the effect of change in contact area of the surfaces. Turn the block on its side and drag it as before to demonstrate what happens.