Lampiran.pdf
9
Lampiran 1. Sampel Perusahaan No. Kode Nama Perusahaan 1. ASII Astra International Tbk. 2. BRAM Indo Kordsa Tbk. 3. CTBN Citra Tubindo Tbk. 4. ETWA Eterindo Wahanatama Tbk 5. GGRM Gudang Garam Tbk. 6. KAEF Kimia Farma Tbk. 7. KDSI Kedawung Setia Industrial Tbk. 8. KICI Kedaung Indah Can Tbk 9. KLBF Kalbe Farma Tbk. 10. LION Lion Metal Works Tbk. 11. LMSH Lionmesh Prima Tbk. 12. MERK Merck Tbk. 13. PBRX Pan Brothers Tbk. 14. PICO Pelangi Indah Canindo Tbk 15. PRAS Prima Alloy Steel Universal Tbk. 16. PSDN Prasidha Aneka Niaga Tbk 17. SKLT Sekar Laut Tbk. 18. TCID Mandom Indonesia Tbk. 19. ULTJ Ultra Jaya Milk Industry & Trading 20. UNVR Unilever Indonesia Tbk. 21. VOKS Voksel Electric Tbk. Lampiran 2. Data Penelitian NO KODE TAHUN MANJ OWN INST OWN LEV SIZE 1 ASII 2011 0.0004 0.5011 0.5077 32.5448 ASII 2012 0.0004 0.5011 0.5292 32.7755 ASII 2013 0.0004 0.5011 0.5038 32.9970 2 BRAM 2011 0.2810 0.6582 0.2629 28.2713 BRAM 2012 0.2777 0.6582 0.2623 28.4301 BRAM 2013 0.2777 0.6582 0.3187 28.6989 3 CTBN 2011 0.0003 0.4200 0.4100 28.4343 CTBN 2012 0.0003 0.4200 0.4789 28.4377 CTBN 2013 0.0004 0.4200 0.4496 28.8441
Transcript of Lampiran.pdf
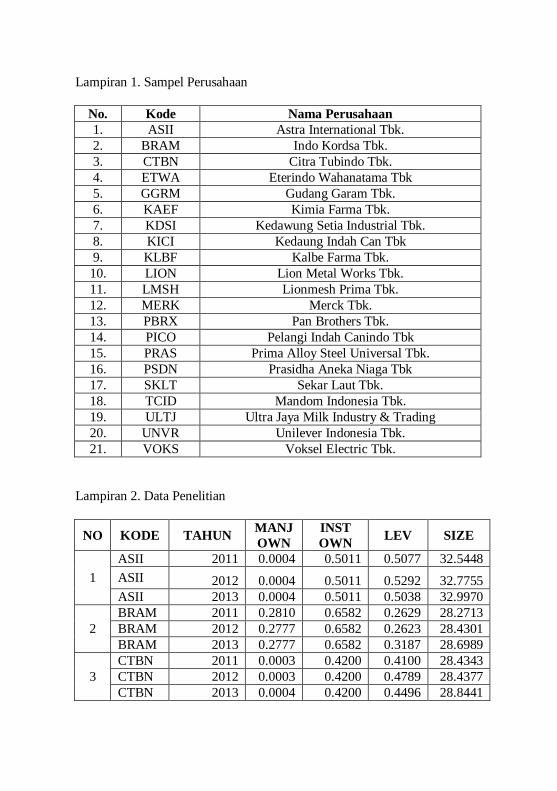
Lampiran 1. Sampel Perusahaan
No. Kode Nama Perusahaan
1. ASII Astra International Tbk.
2. BRAM Indo Kordsa Tbk.
3. CTBN Citra Tubindo Tbk.
4. ETWA Eterindo Wahanatama Tbk
5. GGRM Gudang Garam Tbk.
6. KAEF Kimia Farma Tbk.
7. KDSI Kedawung Setia Industrial Tbk.
8. KICI Kedaung Indah Can Tbk
9. KLBF Kalbe Farma Tbk.
10. LION Lion Metal Works Tbk.
11. LMSH Lionmesh Prima Tbk.
12. MERK Merck Tbk.
13. PBRX Pan Brothers Tbk.
14. PICO Pelangi Indah Canindo Tbk
15. PRAS Prima Alloy Steel Universal Tbk.
16. PSDN Prasidha Aneka Niaga Tbk
17. SKLT Sekar Laut Tbk.
18. TCID Mandom Indonesia Tbk.
19. ULTJ Ultra Jaya Milk Industry & Trading
20. UNVR Unilever Indonesia Tbk.
21. VOKS Voksel Electric Tbk.
Lampiran 2. Data Penelitian
NO KODE TAHUN MANJ
OWN
INST
OWN LEV SIZE
1
ASII 2011 0.0004 0.5011 0.5077 32.5448
ASII 2012 0.0004 0.5011 0.5292 32.7755
ASII 2013 0.0004 0.5011 0.5038 32.9970
2
BRAM 2011 0.2810 0.6582 0.2629 28.2713
BRAM 2012 0.2777 0.6582 0.2623 28.4301
BRAM 2013 0.2777 0.6582 0.3187 28.6989
3
CTBN 2011 0.0003 0.4200 0.4100 28.4343
CTBN 2012 0.0003 0.4200 0.4789 28.4377
CTBN 2013 0.0004 0.4200 0.4496 28.8441
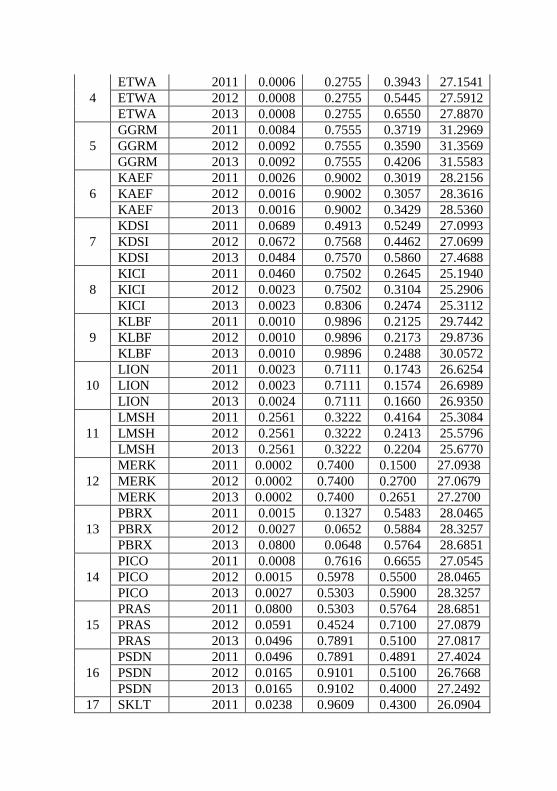
4
ETWA 2011 0.0006 0.2755 0.3943 27.1541
ETWA 2012 0.0008 0.2755 0.5445 27.5912
ETWA 2013 0.0008 0.2755 0.6550 27.8870
5
GGRM 2011 0.0084 0.7555 0.3719 31.2969
GGRM 2012 0.0092 0.7555 0.3590 31.3569
GGRM 2013 0.0092 0.7555 0.4206 31.5583
6
KAEF 2011 0.0026 0.9002 0.3019 28.2156
KAEF 2012 0.0016 0.9002 0.3057 28.3616
KAEF 2013 0.0016 0.9002 0.3429 28.5360
7
KDSI 2011 0.0689 0.4913 0.5249 27.0993
KDSI 2012 0.0672 0.7568 0.4462 27.0699
KDSI 2013 0.0484 0.7570 0.5860 27.4688
8
KICI 2011 0.0460 0.7502 0.2645 25.1940
KICI 2012 0.0023 0.7502 0.3104 25.2906
KICI 2013 0.0023 0.8306 0.2474 25.3112
9
KLBF 2011 0.0010 0.9896 0.2125 29.7442
KLBF 2012 0.0010 0.9896 0.2173 29.8736
KLBF 2013 0.0010 0.9896 0.2488 30.0572
10
LION 2011 0.0023 0.7111 0.1743 26.6254
LION 2012 0.0023 0.7111 0.1574 26.6989
LION 2013 0.0024 0.7111 0.1660 26.9350
11
LMSH 2011 0.2561 0.3222 0.4164 25.3084
LMSH 2012 0.2561 0.3222 0.2413 25.5796
LMSH 2013 0.2561 0.3222 0.2204 25.6770
12
MERK 2011 0.0002 0.7400 0.1500 27.0938
MERK 2012 0.0002 0.7400 0.2700 27.0679
MERK 2013 0.0002 0.7400 0.2651 27.2700
13
PBRX 2011 0.0015 0.1327 0.5483 28.0465
PBRX 2012 0.0027 0.0652 0.5884 28.3257
PBRX 2013 0.0800 0.0648 0.5764 28.6851
14
PICO 2011 0.0008 0.7616 0.6655 27.0545
PICO 2012 0.0015 0.5978 0.5500 28.0465
PICO 2013 0.0027 0.5303 0.5900 28.3257
15
PRAS 2011 0.0800 0.5303 0.5764 28.6851
PRAS 2012 0.0591 0.4524 0.7100 27.0879
PRAS 2013 0.0496 0.7891 0.5100 27.0817
16
PSDN 2011 0.0496 0.7891 0.4891 27.4024
PSDN 2012 0.0165 0.9101 0.5100 26.7668
PSDN 2013 0.0165 0.9102 0.4000 27.2492
17 SKLT 2011 0.0238 0.9609 0.4300 26.0904
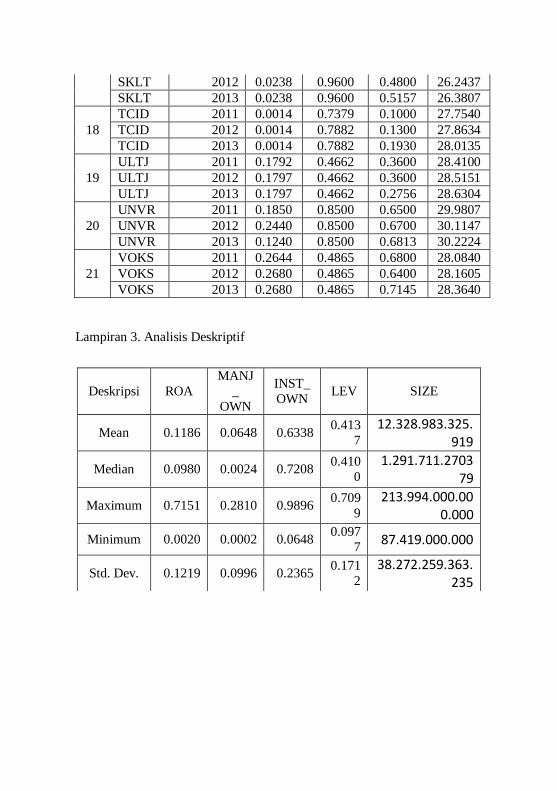
SKLT 2012 0.0238 0.9600 0.4800 26.2437
SKLT 2013 0.0238 0.9600 0.5157 26.3807
18
TCID 2011 0.0014 0.7379 0.1000 27.7540
TCID 2012 0.0014 0.7882 0.1300 27.8634
TCID 2013 0.0014 0.7882 0.1930 28.0135
19
ULTJ 2011 0.1792 0.4662 0.3600 28.4100
ULTJ 2012 0.1797 0.4662 0.3600 28.5151
ULTJ 2013 0.1797 0.4662 0.2756 28.6304
20
UNVR 2011 0.1850 0.8500 0.6500 29.9807
UNVR 2012 0.2440 0.8500 0.6700 30.1147
UNVR 2013 0.1240 0.8500 0.6813 30.2224
21
VOKS 2011 0.2644 0.4865 0.6800 28.0840
VOKS 2012 0.2680 0.4865 0.6400 28.1605
VOKS 2013 0.2680 0.4865 0.7145 28.3640
Lampiran 3. Analisis Deskriptif
Deskripsi ROA
MANJ
_
OWN
INST_
OWN LEV SIZE
Mean 0.1186 0.0648 0.6338 0.413
7
12.328.983.325.919
Median 0.0980 0.0024 0.7208 0.410
0
1.291.711.270379
Maximum 0.7151 0.2810 0.9896 0.709
9
213.994.000.000.000
Minimum 0.0020 0.0002 0.0648 0.097
7 87.419.000.000
Std. Dev. 0.1219 0.0996 0.2365 0.171
2
38.272.259.363.235
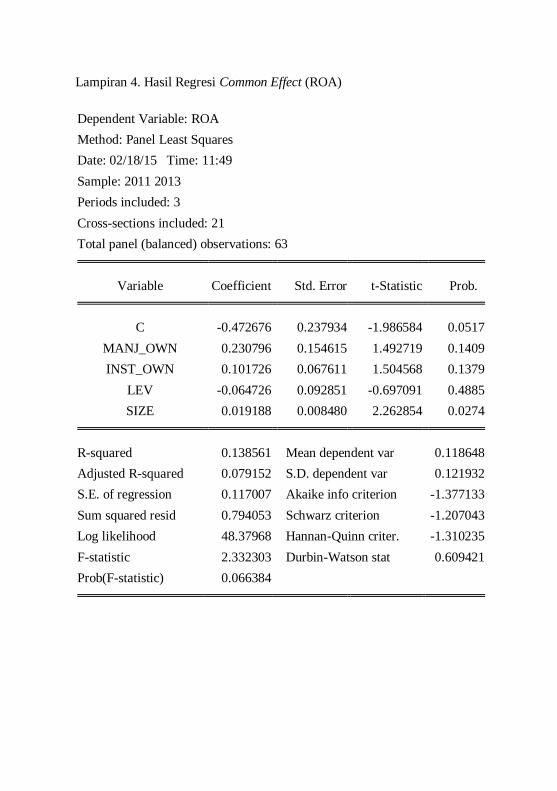
Lampiran 4. Hasil Regresi Common Effect (ROA)
Dependent Variable: ROA
Method: Panel Least Squares
Date: 02/18/15 Time: 11:49
Sample: 2011 2013
Periods included: 3
Cross-sections included: 21
Total panel (balanced) observations: 63
Variable Coefficient Std. Error t-Statistic Prob.
C -0.472676 0.237934 -1.986584 0.0517
MANJ_OWN 0.230796 0.154615 1.492719 0.1409
INST_OWN 0.101726 0.067611 1.504568 0.1379
LEV -0.064726 0.092851 -0.697091 0.4885
SIZE 0.019188 0.008480 2.262854 0.0274
R-squared 0.138561 Mean dependent var 0.118648
Adjusted R-squared 0.079152 S.D. dependent var 0.121932
S.E. of regression 0.117007 Akaike info criterion -1.377133
Sum squared resid 0.794053 Schwarz criterion -1.207043
Log likelihood 48.37968 Hannan-Quinn criter. -1.310235
F-statistic 2.332303 Durbin-Watson stat 0.609421
Prob(F-statistic) 0.066384
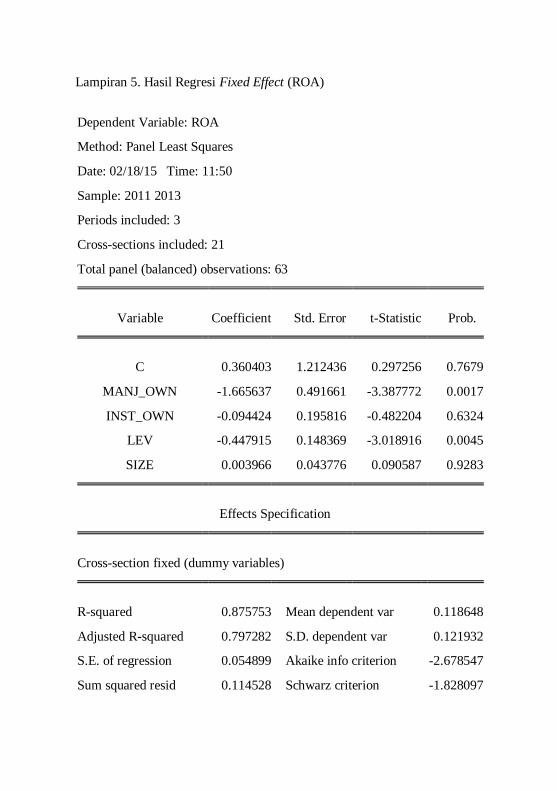
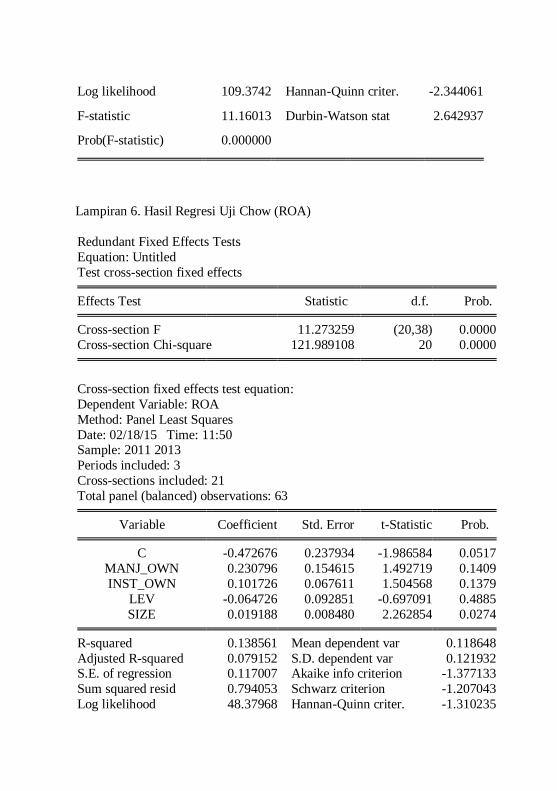
Lampiran 5. Hasil Regresi Fixed Effect (ROA)
Dependent Variable: ROA
Method: Panel Least Squares
Date: 02/18/15 Time: 11:50
Sample: 2011 2013
Periods included: 3
Cross-sections included: 21
Total panel (balanced) observations: 63
Variable Coefficient Std. Error t-Statistic Prob.
C 0.360403 1.212436 0.297256 0.7679
MANJ_OWN -1.665637 0.491661 -3.387772 0.0017
INST_OWN -0.094424 0.195816 -0.482204 0.6324
LEV -0.447915 0.148369 -3.018916 0.0045
SIZE 0.003966 0.043776 0.090587 0.9283
Effects Specification
Cross-section fixed (dummy variables)
R-squared 0.875753 Mean dependent var 0.118648
Adjusted R-squared 0.797282 S.D. dependent var 0.121932
S.E. of regression 0.054899 Akaike info criterion -2.678547
Sum squared resid 0.114528 Schwarz criterion -1.828097
Log likelihood 109.3742 Hannan-Quinn criter. -2.344061
F-statistic 11.16013 Durbin-Watson stat 2.642937
Prob(F-statistic) 0.000000
Lampiran 6. Hasil Regresi Uji Chow (ROA)
Redundant Fixed Effects Tests
Equation: Untitled
Test cross-section fixed effects
Effects Test Statistic d.f. Prob.
Cross-section F 11.273259 (20,38) 0.0000
Cross-section Chi-square 121.989108 20 0.0000
Cross-section fixed effects test equation:
Dependent Variable: ROA
Method: Panel Least Squares
Date: 02/18/15 Time: 11:50 Sample: 2011 2013
Periods included: 3
Cross-sections included: 21
Total panel (balanced) observations: 63
Variable Coefficient Std. Error t-Statistic Prob.
C -0.472676 0.237934 -1.986584 0.0517
MANJ_OWN 0.230796 0.154615 1.492719 0.1409
INST_OWN 0.101726 0.067611 1.504568 0.1379
LEV -0.064726 0.092851 -0.697091 0.4885
SIZE 0.019188 0.008480 2.262854 0.0274
R-squared 0.138561 Mean dependent var 0.118648
Adjusted R-squared 0.079152 S.D. dependent var 0.121932 S.E. of regression 0.117007 Akaike info criterion -1.377133
Sum squared resid 0.794053 Schwarz criterion -1.207043
Log likelihood 48.37968 Hannan-Quinn criter. -1.310235
F-statistic 2.332303 Durbin-Watson stat 0.609421
Prob(F-statistic) 0.066384
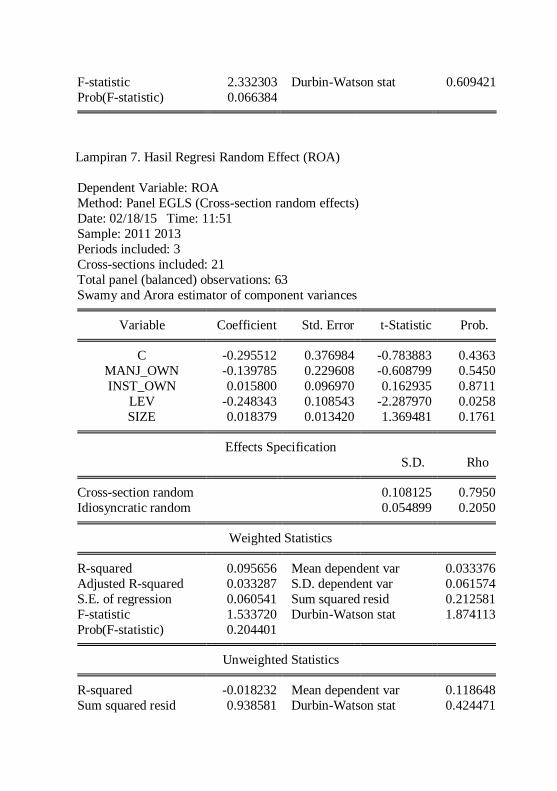
Lampiran 7. Hasil Regresi Random Effect (ROA)
Dependent Variable: ROA
Method: Panel EGLS (Cross-section random effects)
Date: 02/18/15 Time: 11:51
Sample: 2011 2013
Periods included: 3
Cross-sections included: 21
Total panel (balanced) observations: 63
Swamy and Arora estimator of component variances
Variable Coefficient Std. Error t-Statistic Prob.
C -0.295512 0.376984 -0.783883 0.4363
MANJ_OWN -0.139785 0.229608 -0.608799 0.5450
INST_OWN 0.015800 0.096970 0.162935 0.8711
LEV -0.248343 0.108543 -2.287970 0.0258
SIZE 0.018379 0.013420 1.369481 0.1761
Effects Specification
S.D. Rho
Cross-section random 0.108125 0.7950
Idiosyncratic random 0.054899 0.2050
Weighted Statistics
R-squared 0.095656 Mean dependent var 0.033376
Adjusted R-squared 0.033287 S.D. dependent var 0.061574
S.E. of regression 0.060541 Sum squared resid 0.212581
F-statistic 1.533720 Durbin-Watson stat 1.874113
Prob(F-statistic) 0.204401 Unweighted Statistics
R-squared -0.018232 Mean dependent var 0.118648
Sum squared resid 0.938581 Durbin-Watson stat 0.424471
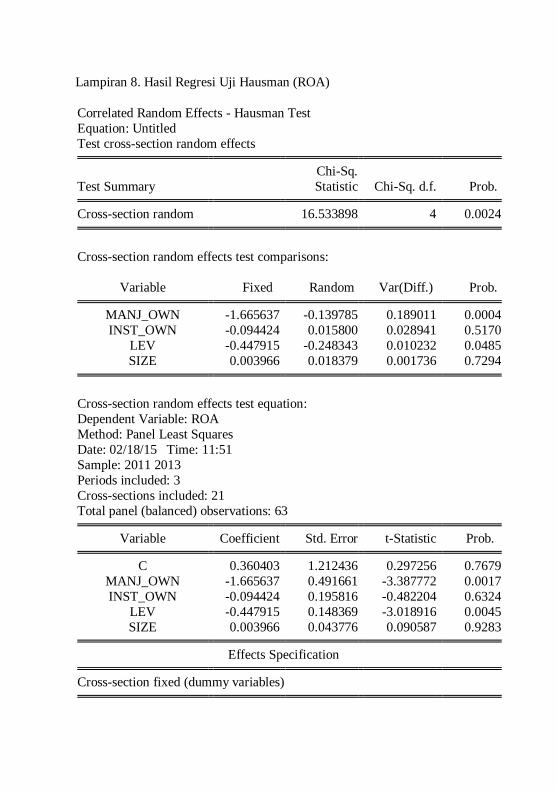
Lampiran 8. Hasil Regresi Uji Hausman (ROA)
Correlated Random Effects - Hausman Test
Equation: Untitled
Test cross-section random effects
Test Summary
Chi-Sq.
Statistic Chi-Sq. d.f. Prob.
Cross-section random 16.533898 4 0.0024
Cross-section random effects test comparisons:
Variable Fixed Random Var(Diff.) Prob.
MANJ_OWN -1.665637 -0.139785 0.189011 0.0004
INST_OWN -0.094424 0.015800 0.028941 0.5170
LEV -0.447915 -0.248343 0.010232 0.0485
SIZE 0.003966 0.018379 0.001736 0.7294
Cross-section random effects test equation:
Dependent Variable: ROA
Method: Panel Least Squares
Date: 02/18/15 Time: 11:51
Sample: 2011 2013
Periods included: 3
Cross-sections included: 21
Total panel (balanced) observations: 63
Variable Coefficient Std. Error t-Statistic Prob.
C 0.360403 1.212436 0.297256 0.7679
MANJ_OWN -1.665637 0.491661 -3.387772 0.0017
INST_OWN -0.094424 0.195816 -0.482204 0.6324
LEV -0.447915 0.148369 -3.018916 0.0045
SIZE 0.003966 0.043776 0.090587 0.9283
Effects Specification
Cross-section fixed (dummy variables)
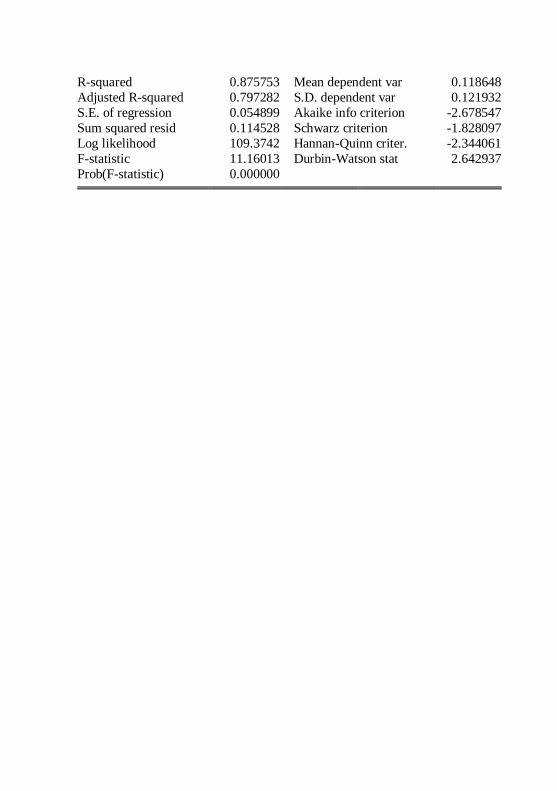
R-squared 0.875753 Mean dependent var 0.118648
Adjusted R-squared 0.797282 S.D. dependent var 0.121932
S.E. of regression 0.054899 Akaike info criterion -2.678547
Sum squared resid 0.114528 Schwarz criterion -1.828097
Log likelihood 109.3742 Hannan-Quinn criter. -2.344061
F-statistic 11.16013 Durbin-Watson stat 2.642937
Prob(F-statistic) 0.000000