Lampiran 1 Kuesioner Universitas Esa Unggul Fakultas ... fileLampiran 1 Kuesioner Universitas Esa...
26
63 Lampiran 1 Kuesioner Universitas Esa Unggul Fakultas Ekonomi Progam Studi Manajemen Jl. Arjuna Utara 9, Tol Tomang Kebon Jeruk Jakbar Telp / Fax Telp. ( 021 ) 5682510, 5674152 Fax. (021) 567 4248 KUESIONER Responden Yth, Saya, mahasiswa Fakultas Ekonomi Universitas Esa Unggul dengan Progam studi Manajemen Sumber Daya Manusia. Saya sedang meneliti pengaruh kompensasi terhadap kepuasan kerja karyawan melalui mediasi motivasi kerja di PT. Resik Gunamaju untuk menyelesaikan Skripsi saya. Semua jawaban benar, tidak ada jawaban yang salah. Pernyataan dan data responden hanya akan digunakan untuk keperluan penelitian dan sangat terjamin kerahasiaannya. Terimakasih atas bantuan dan kerjasamanya. Atas kesediaan dan partisipasi dari Bapak/Ibu saya ucapkan terima kasih. Hormat saya, Uswatun Khasanah
Transcript of Lampiran 1 Kuesioner Universitas Esa Unggul Fakultas ... fileLampiran 1 Kuesioner Universitas Esa...
63
Lampiran 1 Kuesioner
Universitas Esa Unggul
Fakultas Ekonomi Progam Studi Manajemen
Jl. Arjuna Utara 9, Tol Tomang Kebon Jeruk Jakbar Telp / Fax
Telp. ( 021 ) 5682510, 5674152
Fax. (021) 567 4248
KUESIONER
Responden Yth,
Saya, mahasiswa Fakultas Ekonomi Universitas Esa Unggul dengan Progam studi Manajemen
Sumber Daya Manusia. Saya sedang meneliti pengaruh kompensasi terhadap kepuasan kerja karyawan
melalui mediasi motivasi kerja di PT. Resik Gunamaju untuk menyelesaikan Skripsi saya.
Semua jawaban benar, tidak ada jawaban yang salah. Pernyataan dan data responden hanya akan digunakan
untuk keperluan penelitian dan sangat terjamin kerahasiaannya. Terimakasih atas bantuan dan kerjasamanya.
Atas kesediaan dan partisipasi dari Bapak/Ibu saya ucapkan terima kasih.
Hormat saya,
Uswatun Khasanah
64
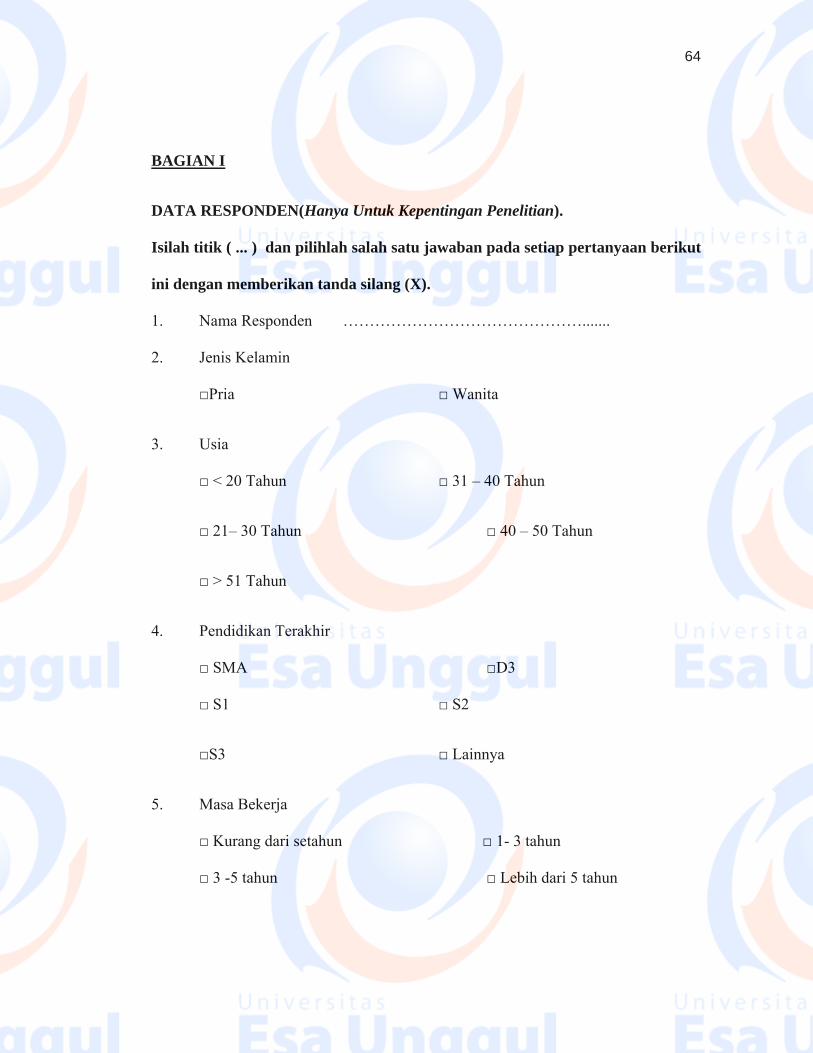
BAGIAN I
DATA RESPONDEN(Hanya Untuk Kepentingan Penelitian).
Isilah titik ( ... ) dan pilihlah salah satu jawaban pada setiap pertanyaan berikut
ini dengan memberikan tanda silang (X).
1. Nama Responden ……………………………………….......
2. Jenis Kelamin
□Pria □ Wanita
3. Usia
□ < 20 Tahun □ 31 – 40 Tahun
□ 21– 30 Tahun □ 40 – 50 Tahun
□ > 51 Tahun
4. Pendidikan Terakhir
□ SMA □D3
□ S1 □ S2
□S3 □ Lainnya
5. Masa Bekerja
□ Kurang dari setahun □ 1- 3 tahun
□ 3 -5 tahun □ Lebih dari 5 tahun
65
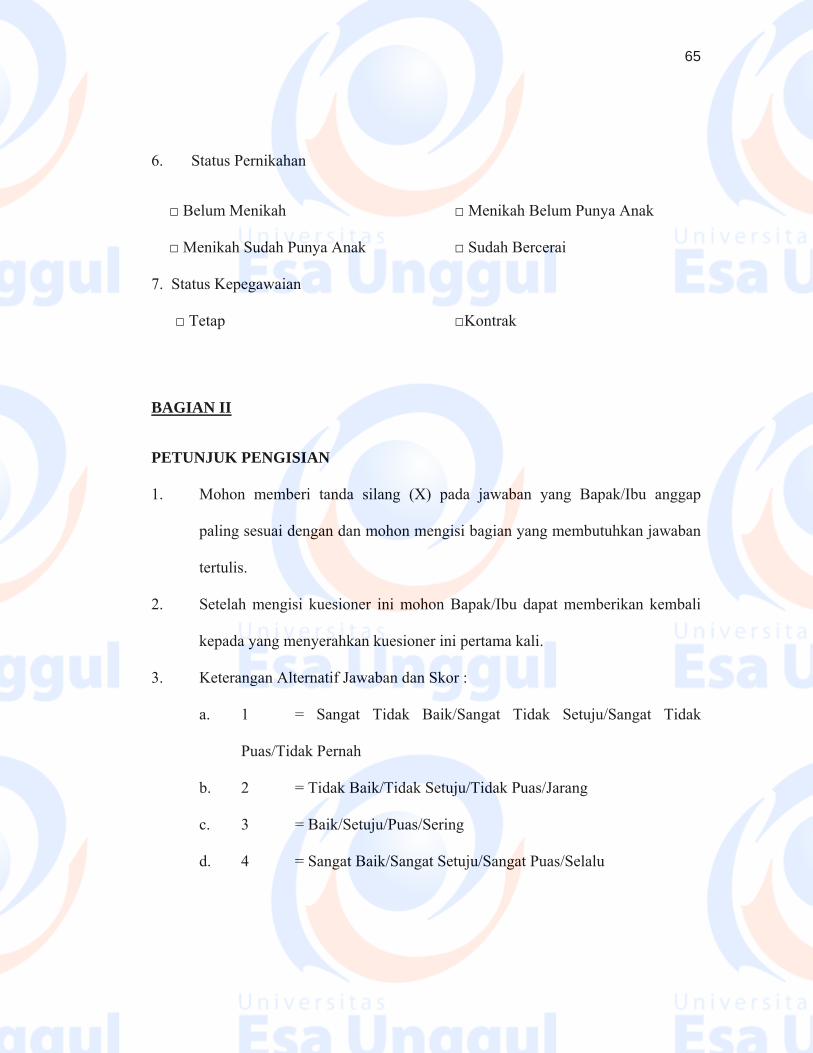
6. Status Pernikahan
□ Belum Menikah □ Menikah Belum Punya Anak
□ Menikah Sudah Punya Anak □ Sudah Bercerai
7. Status Kepegawaian
□ Tetap □Kontrak
BAGIAN II
PETUNJUK PENGISIAN
1. Mohon memberi tanda silang (X) pada jawaban yang Bapak/Ibu anggap
paling sesuai dengan dan mohon mengisi bagian yang membutuhkan jawaban
tertulis.
2. Setelah mengisi kuesioner ini mohon Bapak/Ibu dapat memberikan kembali
kepada yang menyerahkan kuesioner ini pertama kali.
3. Keterangan Alternatif Jawaban dan Skor :
a. 1 = Sangat Tidak Baik/Sangat Tidak Setuju/Sangat Tidak
Puas/Tidak Pernah
b. 2 = Tidak Baik/Tidak Setuju/Tidak Puas/Jarang
c. 3 = Baik/Setuju/Puas/Sering
d. 4 = Sangat Baik/Sangat Setuju/Sangat Puas/Selalu
66
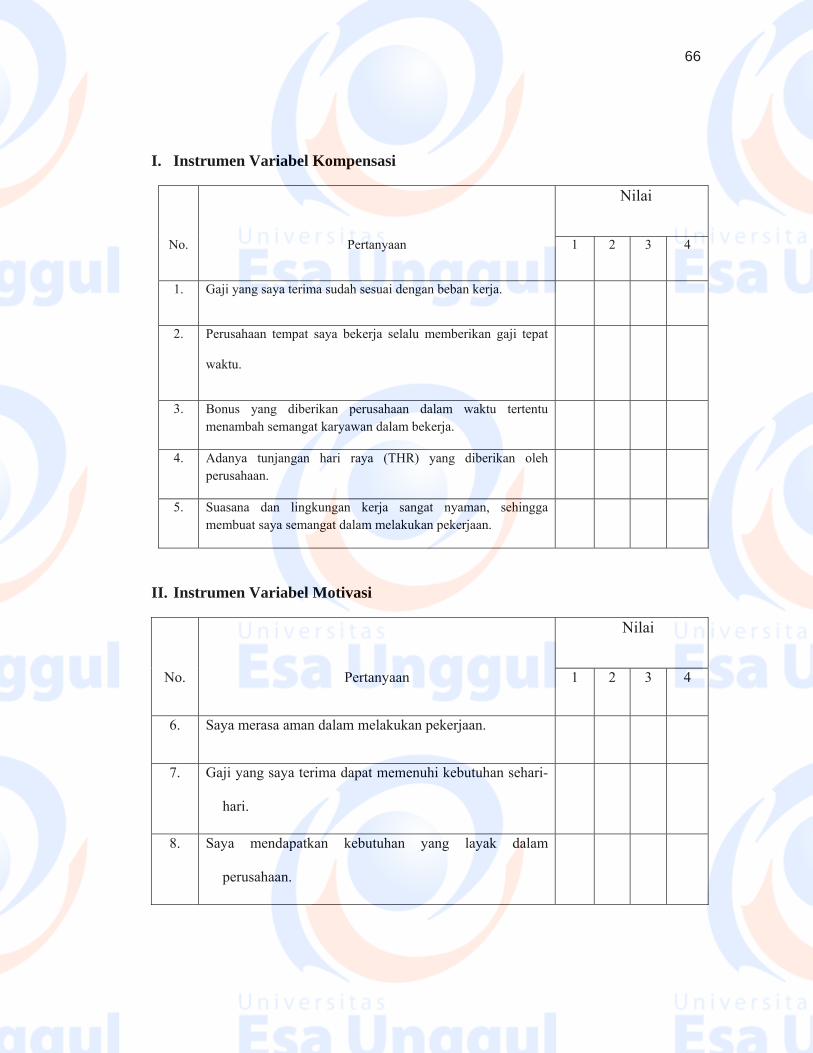
I. Instrumen Variabel Kompensasi
Nilai
No. Pertanyaan 1 2 3 4
1. Gaji yang saya terima sudah sesuai dengan beban kerja.
2. Perusahaan tempat saya bekerja selalu memberikan gaji tepat
waktu.
3. Bonus yang diberikan perusahaan dalam waktu tertentu menambah semangat karyawan dalam bekerja.
4. Adanya tunjangan hari raya (THR) yang diberikan oleh perusahaan.
5. Suasana dan lingkungan kerja sangat nyaman, sehingga membuat saya semangat dalam melakukan pekerjaan.
II. Instrumen Variabel Motivasi
Nilai
No. Pertanyaan 1 2 3 4
6. Saya merasa aman dalam melakukan pekerjaan.
7. Gaji yang saya terima dapat memenuhi kebutuhan sehari-
hari.
8. Saya mendapatkan kebutuhan yang layak dalam
perusahaan.
67
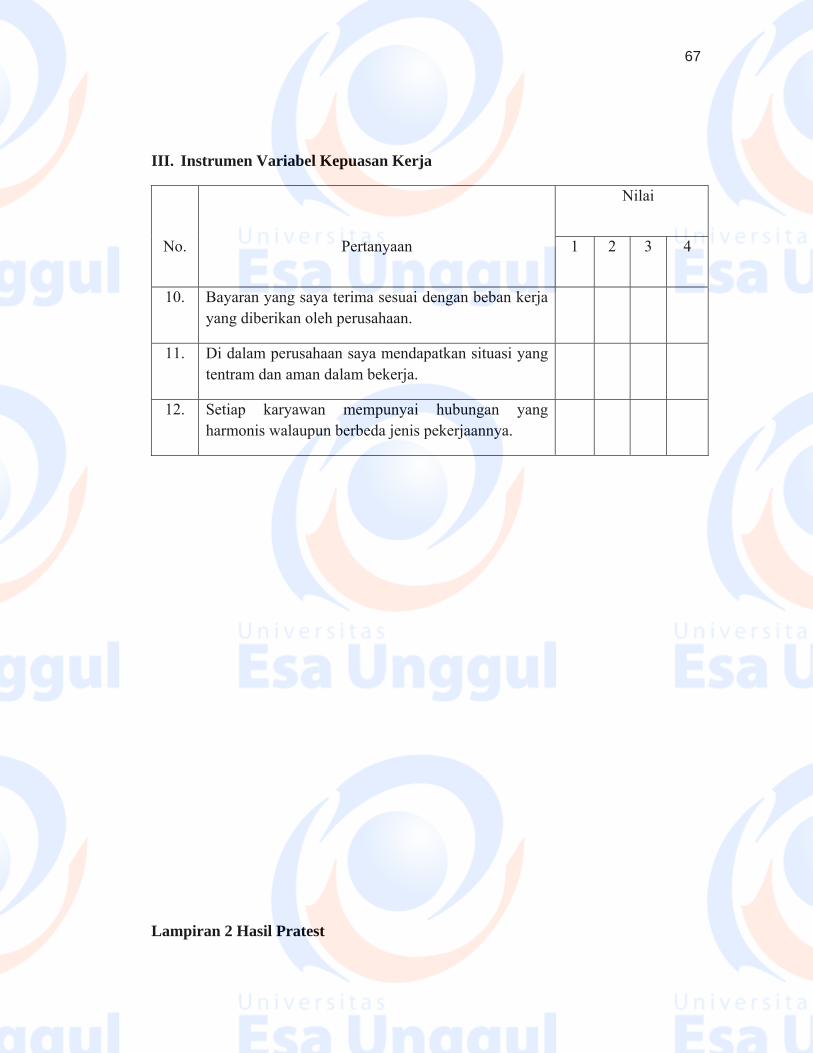
III. Instrumen Variabel Kepuasan Kerja
Nilai
No. Pertanyaan 1 2 3 4
10. Bayaran yang saya terima sesuai dengan beban kerja yang diberikan oleh perusahaan.
11. Di dalam perusahaan saya mendapatkan situasi yang tentram dan aman dalam bekerja.
12. Setiap karyawan mempunyai hubungan yang harmonis walaupun berbeda jenis pekerjaannya.
Lampiran 2 Hasil Pratest
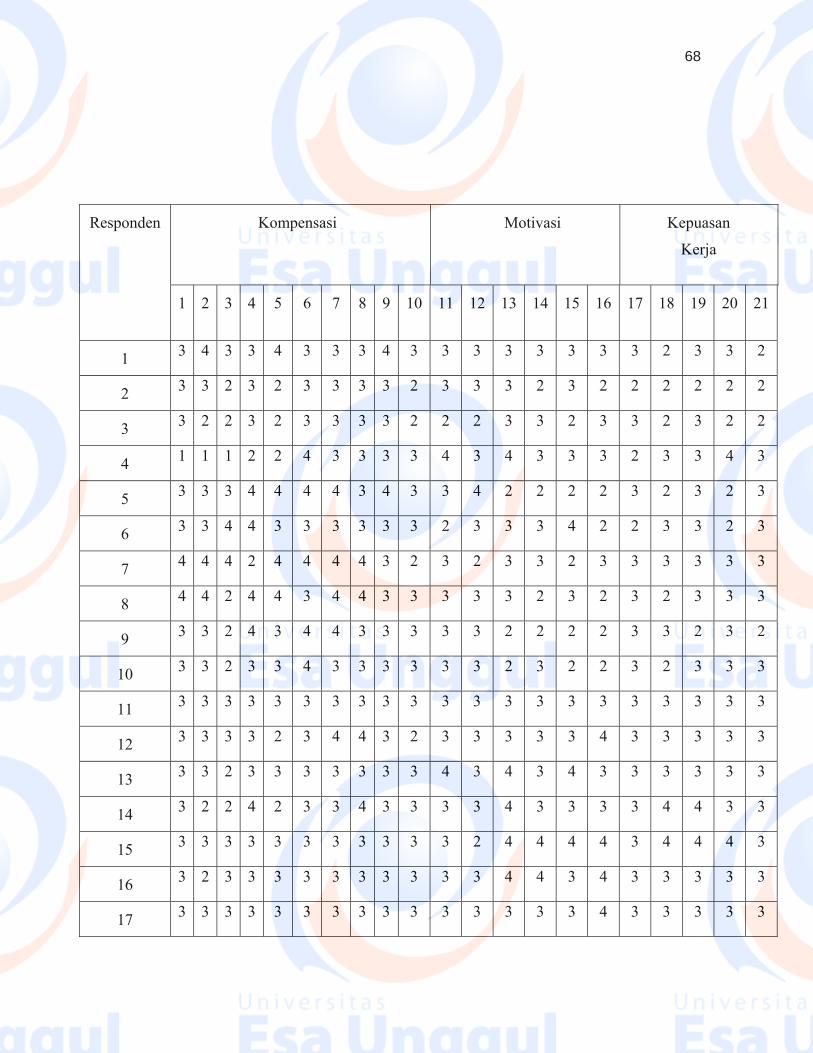
68
Responden Kompensasi
Motivasi Kepuasan
Kerja
1 2 3 4 5 6 7 8 9 10 11 12 13 14 15 16 17 18 19 20 21
1 3 4 3 3 4 3 3 3 4 3 3 3 3 3 3 3 3 2 3 3 2
2 3 3 2 3 2 3 3 3 3 2 3 3 3 2 3 2 2 2 2 2 2
3 3 2 2 3 2 3 3 3 3 2 2 2 3 3 2 3 3 2 3 2 2
4 1 1 1 2 2 4 3 3 3 3 4 3 4 3 3 3 2 3 3 4 3
5 3 3 3 4 4 4 4 3 4 3 3 4 2 2 2 2 3 2 3 2 3
6 3 3 4 4 3 3 3 3 3 3 2 3 3 3 4 2 2 3 3 2 3
7 4 4 4 2 4 4 4 4 3 2 3 2 3 3 2 3 3 3 3 3 3
8 4 4 2 4 4 3 4 4 3 3 3 3 3 2 3 2 3 2 3 3 3
9 3 3 2 4 3 4 4 3 3 3 3 3 2 2 2 2 3 3 2 3 2
10 3 3 2 3 3 4 3 3 3 3 3 3 2 3 2 2 3 2 3 3 3
11 3 3 3 3 3 3 3 3 3 3 3 3 3 3 3 3 3 3 3 3 3
12 3 3 3 3 2 3 4 4 3 2 3 3 3 3 3 4 3 3 3 3 3
13 3 3 2 3 3 3 3 3 3 3 4 3 4 3 4 3 3 3 3 3 3
14 3 2 2 4 2 3 3 4 3 3 3 3 4 3 3 3 3 4 4 3 3
15 3 3 3 3 3 3 3 3 3 3 3 2 4 4 4 4 3 4 4 4 3
16 3 2 3 3 3 3 3 3 3 3 3 3 4 4 3 4 3 3 3 3 3
17 3 3 3 3 3 3 3 3 3 3 3 3 3 3 3 4 3 3 3 3 3
69
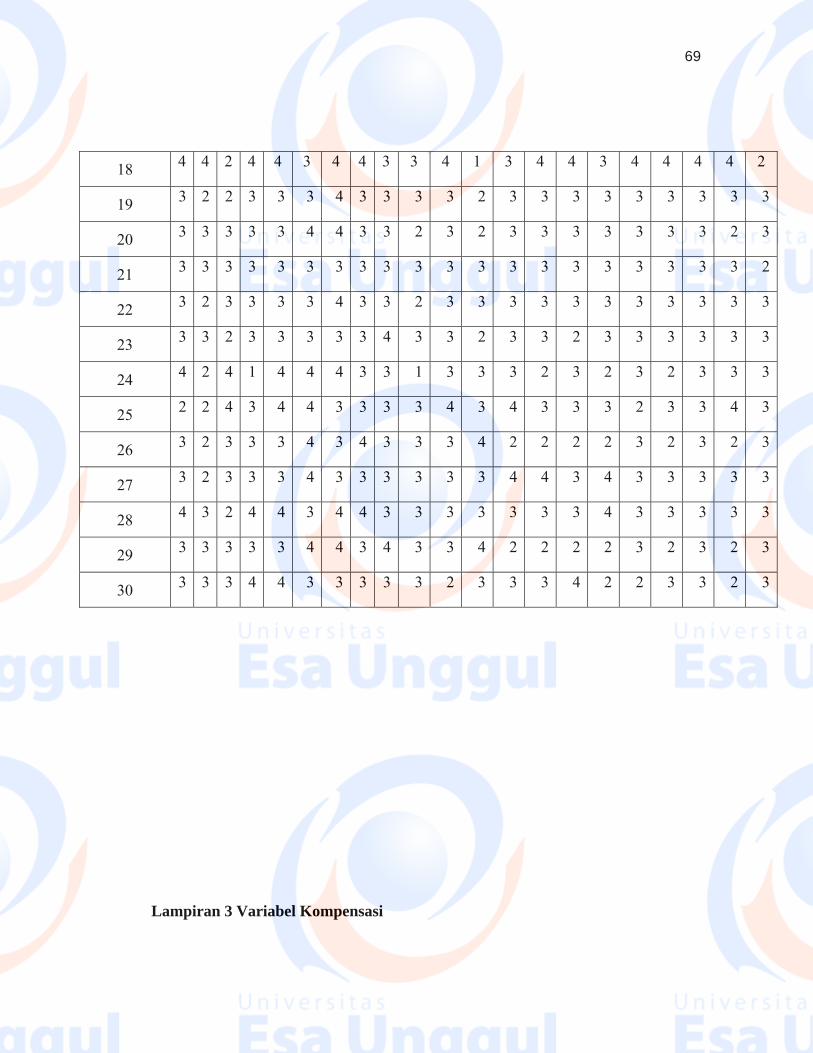
18 4 4 2 4 4 3 4 4 3 3 4 1 3 4 4 3 4 4 4 4 2
19 3 2 2 3 3 3 4 3 3 3 3 2 3 3 3 3 3 3 3 3 3
20 3 3 3 3 3 4 4 3 3 2 3 2 3 3 3 3 3 3 3 2 3
21 3 3 3 3 3 3 3 3 3 3 3 3 3 3 3 3 3 3 3 3 2
22 3 2 3 3 3 3 4 3 3 2 3 3 3 3 3 3 3 3 3 3 3
23 3 3 2 3 3 3 3 3 4 3 3 2 3 3 2 3 3 3 3 3 3
24 4 2 4 1 4 4 4 3 3 1 3 3 3 2 3 2 3 2 3 3 3
25 2 2 4 3 4 4 3 3 3 3 4 3 4 3 3 3 2 3 3 4 3
26 3 2 3 3 3 4 3 4 3 3 3 4 2 2 2 2 3 2 3 2 3
27 3 2 3 3 3 4 3 3 3 3 3 3 4 4 3 4 3 3 3 3 3
28 4 3 2 4 4 3 4 4 3 3 3 3 3 3 3 4 3 3 3 3 3
29 3 3 3 3 3 4 4 3 4 3 3 4 2 2 2 2 3 2 3 2 3
30 3 3 3 4 4 3 3 3 3 3 2 3 3 3 4 2 2 3 3 2 3
Lampiran 3 Variabel Kompensasi
70
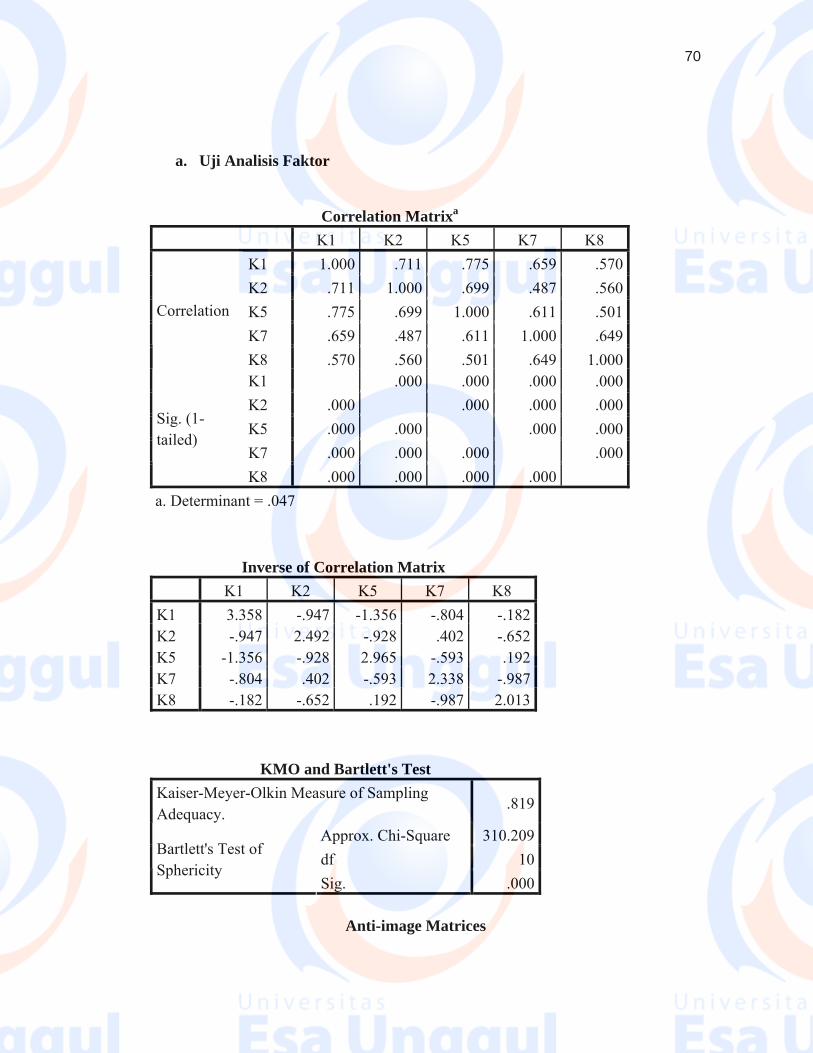
a. Uji Analisis Faktor
Correlation Matrixa
K1 K2 K5 K7 K8 K1 1.000 .711 .775 .659 .570 K2 .711 1.000 .699 .487 .560 K5 .775 .699 1.000 .611 .501 K7 .659 .487 .611 1.000 .649
Correlation
K8 .570 .560 .501 .649 1.000 K1 .000 .000 .000 .000 K2 .000 .000 .000 .000 K5 .000 .000 .000 .000 K7 .000 .000 .000 .000
Sig. (1-tailed)
K8 .000 .000 .000 .000
a. Determinant = .047
Inverse of Correlation Matrix K1 K2 K5 K7 K8 K1 3.358 -.947 -1.356 -.804 -.182K2 -.947 2.492 -.928 .402 -.652K5 -1.356 -.928 2.965 -.593 .192K7 -.804 .402 -.593 2.338 -.987K8 -.182 -.652 .192 -.987 2.013
KMO and Bartlett's Test Kaiser-Meyer-Olkin Measure of Sampling Adequacy.
.819
Approx. Chi-Square 310.209df 10
Bartlett's Test of Sphericity
Sig. .000
Anti-image Matrices
71
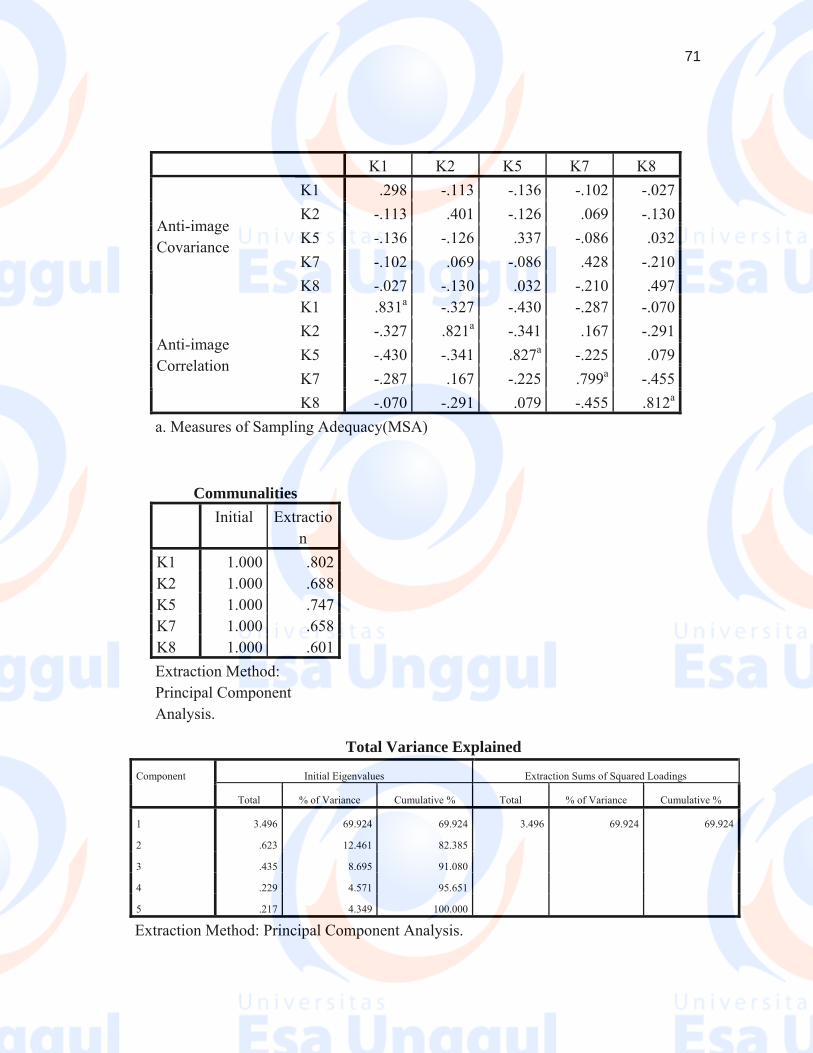
K1 K2 K5 K7 K8 K1 .298 -.113 -.136 -.102 -.027K2 -.113 .401 -.126 .069 -.130K5 -.136 -.126 .337 -.086 .032K7 -.102 .069 -.086 .428 -.210
Anti-image Covariance
K8 -.027 -.130 .032 -.210 .497K1 .831a -.327 -.430 -.287 -.070K2 -.327 .821a -.341 .167 -.291K5 -.430 -.341 .827a -.225 .079K7 -.287 .167 -.225 .799a -.455
Anti-image Correlation
K8 -.070 -.291 .079 -.455 .812a
a. Measures of Sampling Adequacy(MSA)
Communalities Initial Extractio
n K1 1.000 .802K2 1.000 .688K5 1.000 .747K7 1.000 .658K8 1.000 .601Extraction Method: Principal Component Analysis.
Total Variance Explained
Initial Eigenvalues Extraction Sums of Squared Loadings Component
Total % of Variance Cumulative % Total % of Variance Cumulative %
1 3.496 69.924 69.924 3.496 69.924 69.924
2 .623 12.461 82.385
3 .435 8.695 91.080
4 .229 4.571 95.651
5 .217 4.349 100.000
Extraction Method: Principal Component Analysis.
72
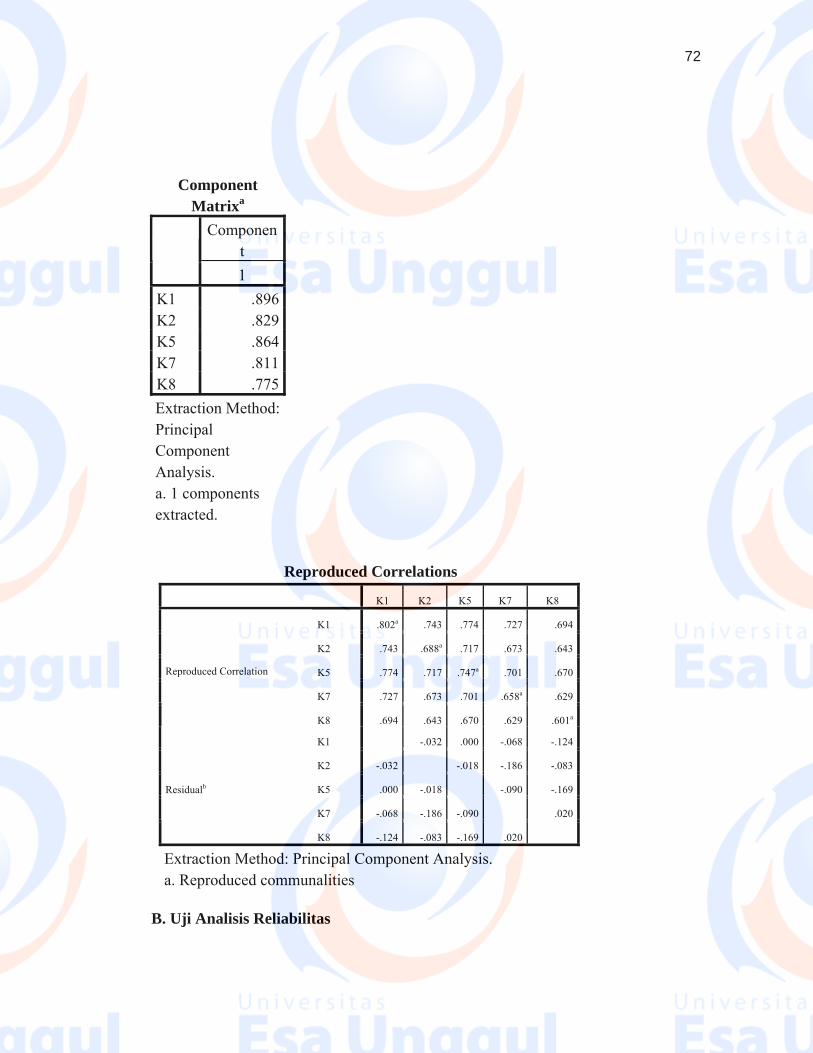
Component
Matrixa Componen
t
1 K1 .896 K2 .829 K5 .864 K7 .811 K8 .775 Extraction Method: Principal Component Analysis. a. 1 components extracted.
B. Uji Analisis Reliabilitas
Reproduced Correlations
K1 K2 K5 K7 K8
K1 .802a .743 .774 .727 .694
K2 .743 .688a .717 .673 .643
K5 .774 .717 .747a .701 .670
K7 .727 .673 .701 .658a .629
Reproduced Correlation
K8 .694 .643 .670 .629 .601a
K1
-.032 .000 -.068 -.124
K2 -.032
-.018 -.186 -.083
K5 .000 -.018
-.090 -.169
K7 -.068 -.186 -.090
.020
Residualb
K8 -.124 -.083 -.169 .020
Extraction Method: Principal Component Analysis. a. Reproduced communalities
73
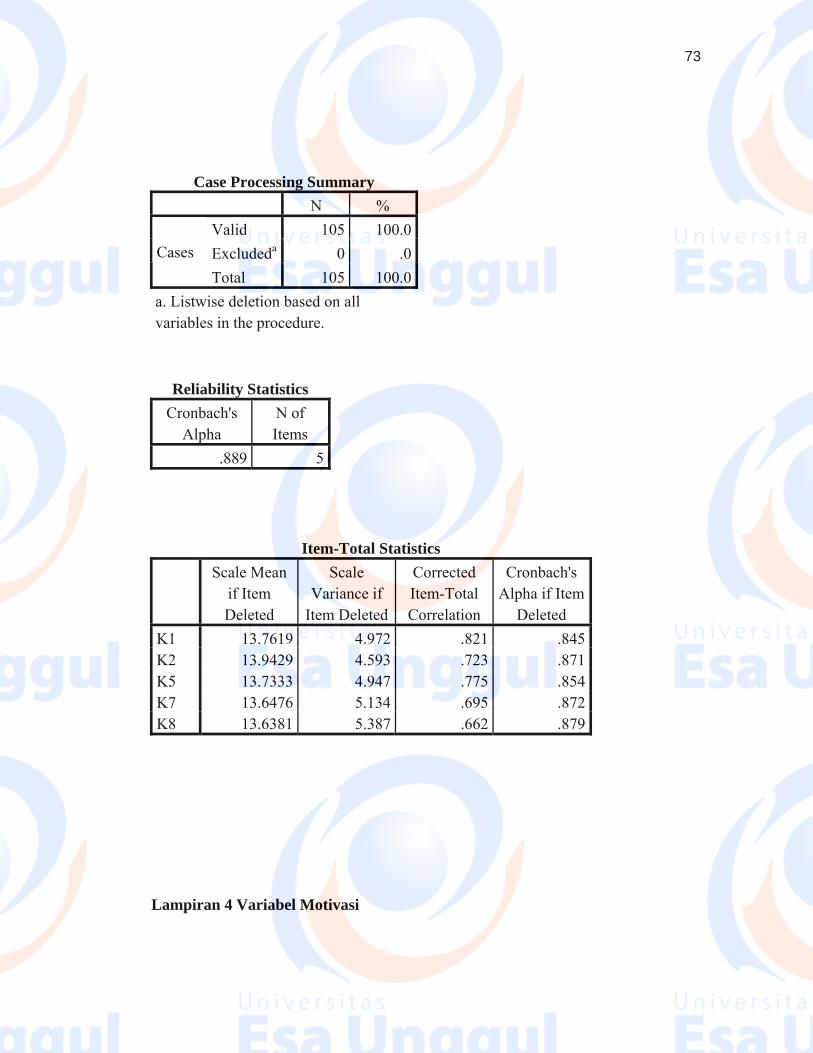
Case Processing Summary
N % Valid 105 100.0Excludeda 0 .0Cases Total 105 100.0
a. Listwise deletion based on all variables in the procedure.
Reliability Statistics Cronbach's
Alpha N of Items
.889 5
Item-Total Statistics
Scale Mean if Item Deleted
Scale Variance if
Item Deleted
Corrected Item-Total Correlation
Cronbach's Alpha if Item
Deleted K1 13.7619 4.972 .821 .845 K2 13.9429 4.593 .723 .871 K5 13.7333 4.947 .775 .854 K7 13.6476 5.134 .695 .872 K8 13.6381 5.387 .662 .879
Lampiran 4 Variabel Motivasi
74
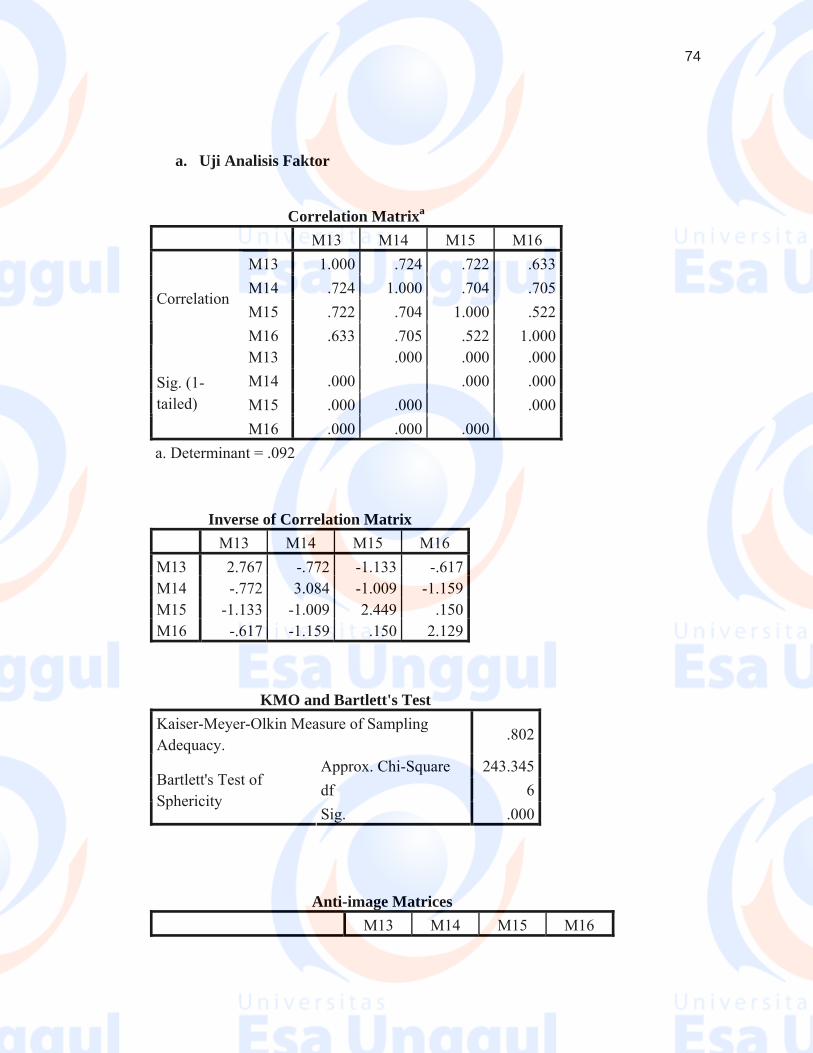
a. Uji Analisis Faktor
Correlation Matrixa
M13 M14 M15 M16 M13 1.000 .724 .722 .633M14 .724 1.000 .704 .705M15 .722 .704 1.000 .522
Correlation
M16 .633 .705 .522 1.000M13 .000 .000 .000M14 .000 .000 .000M15 .000 .000 .000
Sig. (1-tailed)
M16 .000 .000 .000
a. Determinant = .092
Inverse of Correlation Matrix M13 M14 M15 M16 M13 2.767 -.772 -1.133 -.617M14 -.772 3.084 -1.009 -1.159M15 -1.133 -1.009 2.449 .150M16 -.617 -1.159 .150 2.129
KMO and Bartlett's Test Kaiser-Meyer-Olkin Measure of Sampling Adequacy.
.802
Approx. Chi-Square 243.345df 6
Bartlett's Test of Sphericity
Sig. .000
Anti-image Matrices M13 M14 M15 M16
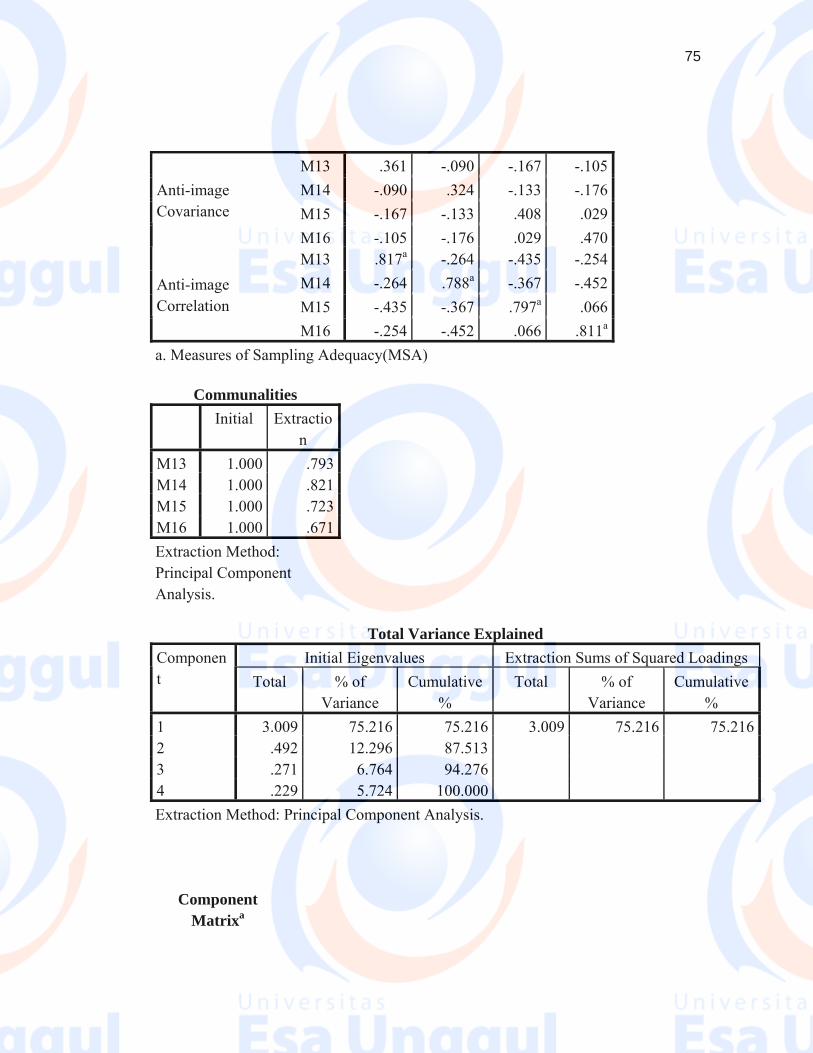
75
M13 .361 -.090 -.167 -.105 M14 -.090 .324 -.133 -.176 M15 -.167 -.133 .408 .029
Anti-image Covariance
M16 -.105 -.176 .029 .470 M13 .817a -.264 -.435 -.254 M14 -.264 .788a -.367 -.452 M15 -.435 -.367 .797a .066
Anti-image Correlation
M16 -.254 -.452 .066 .811a a. Measures of Sampling Adequacy(MSA)
Communalities Initial Extractio
n M13 1.000 .793M14 1.000 .821M15 1.000 .723M16 1.000 .671Extraction Method: Principal Component Analysis.
Total Variance Explained Initial Eigenvalues Extraction Sums of Squared Loadings Componen
t Total % of Variance
Cumulative %
Total % of Variance
Cumulative %
1 3.009 75.216 75.216 3.009 75.216 75.2162 .492 12.296 87.513 3 .271 6.764 94.276 4 .229 5.724 100.000
Extraction Method: Principal Component Analysis.
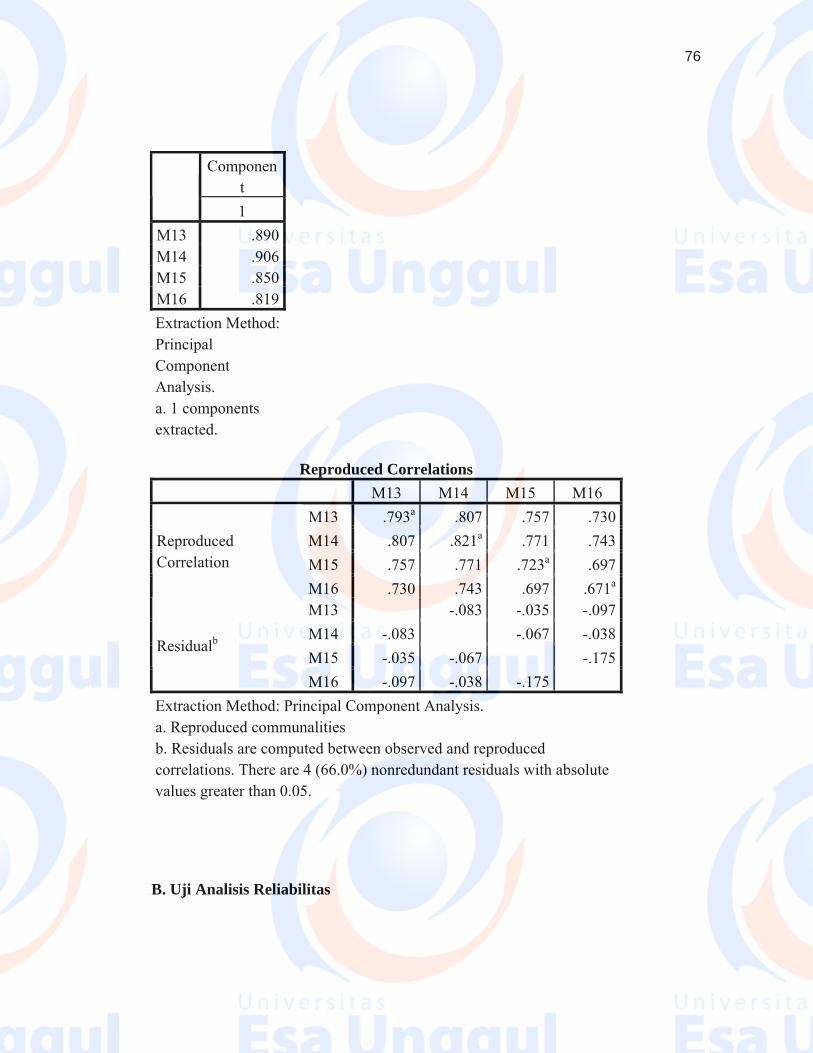
Component Matrixa
76
Component
1 M13 .890 M14 .906 M15 .850 M16 .819 Extraction Method: Principal Component Analysis. a. 1 components extracted.
Reproduced Correlations M13 M14 M15 M16
M13 .793a .807 .757 .730 M14 .807 .821a .771 .743 M15 .757 .771 .723a .697
Reproduced Correlation
M16 .730 .743 .697 .671a M13 -.083 -.035 -.097 M14 -.083 -.067 -.038 M15 -.035 -.067 -.175
Residualb
M16 -.097 -.038 -.175
Extraction Method: Principal Component Analysis. a. Reproduced communalities b. Residuals are computed between observed and reproduced correlations. There are 4 (66.0%) nonredundant residuals with absolute values greater than 0.05.
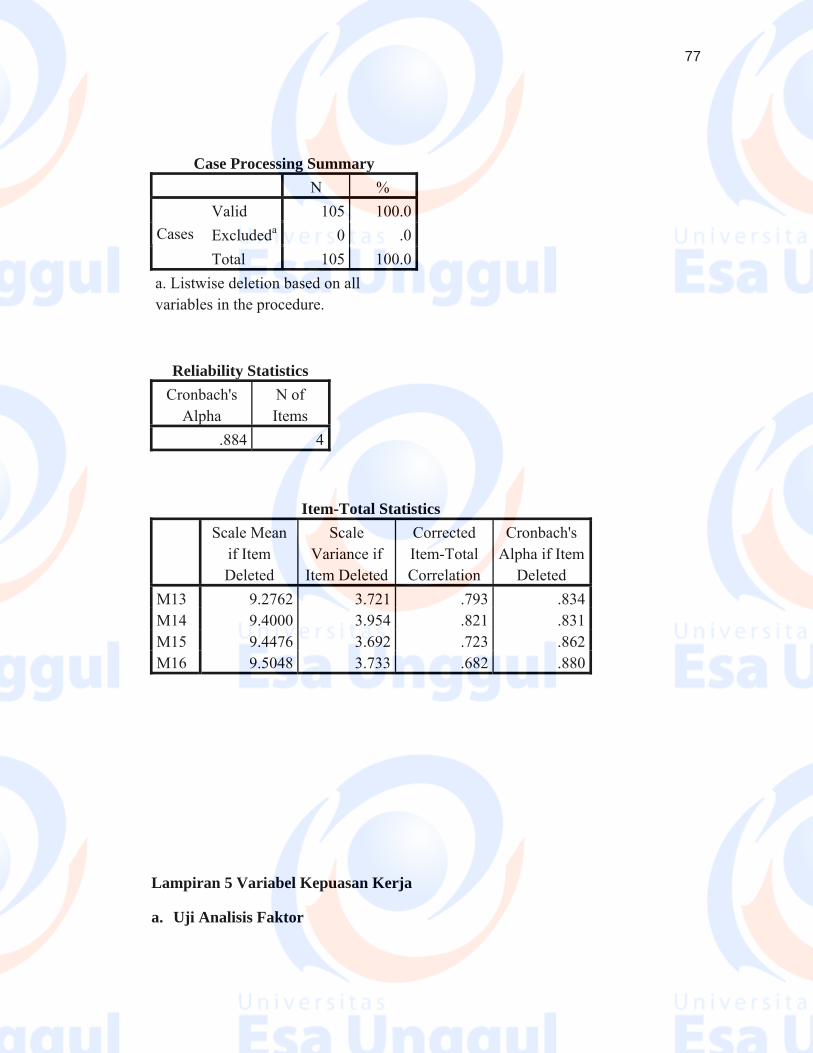
B. Uji Analisis Reliabilitas
77
Case Processing Summary N %
Valid 105 100.0Excludeda 0 .0Cases Total 105 100.0
a. Listwise deletion based on all variables in the procedure.
Reliability Statistics Cronbach's
Alpha N of Items
.884 4
Item-Total Statistics Scale Mean
if Item Deleted
Scale Variance if
Item Deleted
Corrected Item-Total Correlation
Cronbach's Alpha if Item
Deleted M13 9.2762 3.721 .793 .834 M14 9.4000 3.954 .821 .831 M15 9.4476 3.692 .723 .862 M16 9.5048 3.733 .682 .880
Lampiran 5 Variabel Kepuasan Kerja
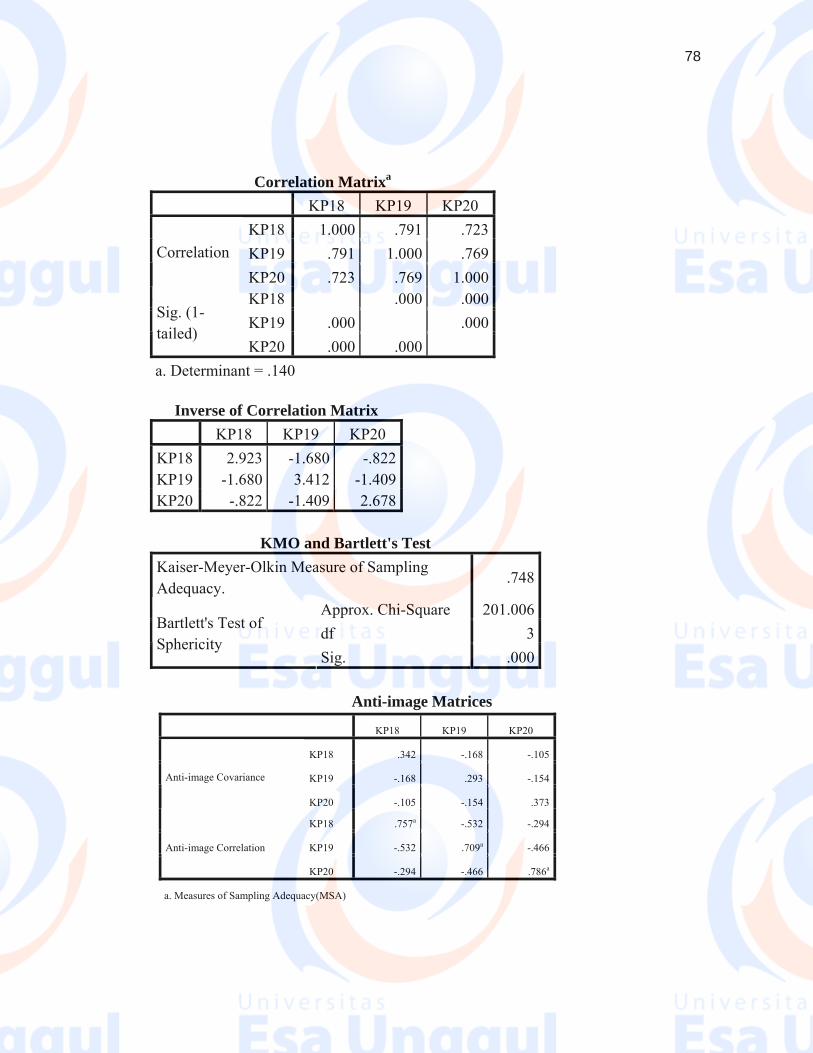
a. Uji Analisis Faktor
78
Correlation Matrixa
KP18 KP19 KP20 KP18 1.000 .791 .723KP19 .791 1.000 .769Correlation KP20 .723 .769 1.000KP18 .000 .000KP19 .000 .000
Sig. (1-tailed)
KP20 .000 .000
a. Determinant = .140
Inverse of Correlation Matrix KP18 KP19 KP20 KP18 2.923 -1.680 -.822KP19 -1.680 3.412 -1.409KP20 -.822 -1.409 2.678
KMO and Bartlett's Test
Kaiser-Meyer-Olkin Measure of Sampling Adequacy.
.748
Approx. Chi-Square 201.006df 3
Bartlett's Test of Sphericity
Sig. .000
Anti-image Matrices
Anti-image Matrices
KP18 KP19 KP20
KP18 .342 -.168 -.105
KP19 -.168 .293 -.154Anti-image Covariance
KP20 -.105 -.154 .373
KP18 .757a -.532 -.294
KP19 -.532 .709a -.466Anti-image Correlation
KP20 -.294 -.466 .786a
a. Measures of Sampling Adequacy(MSA)
79
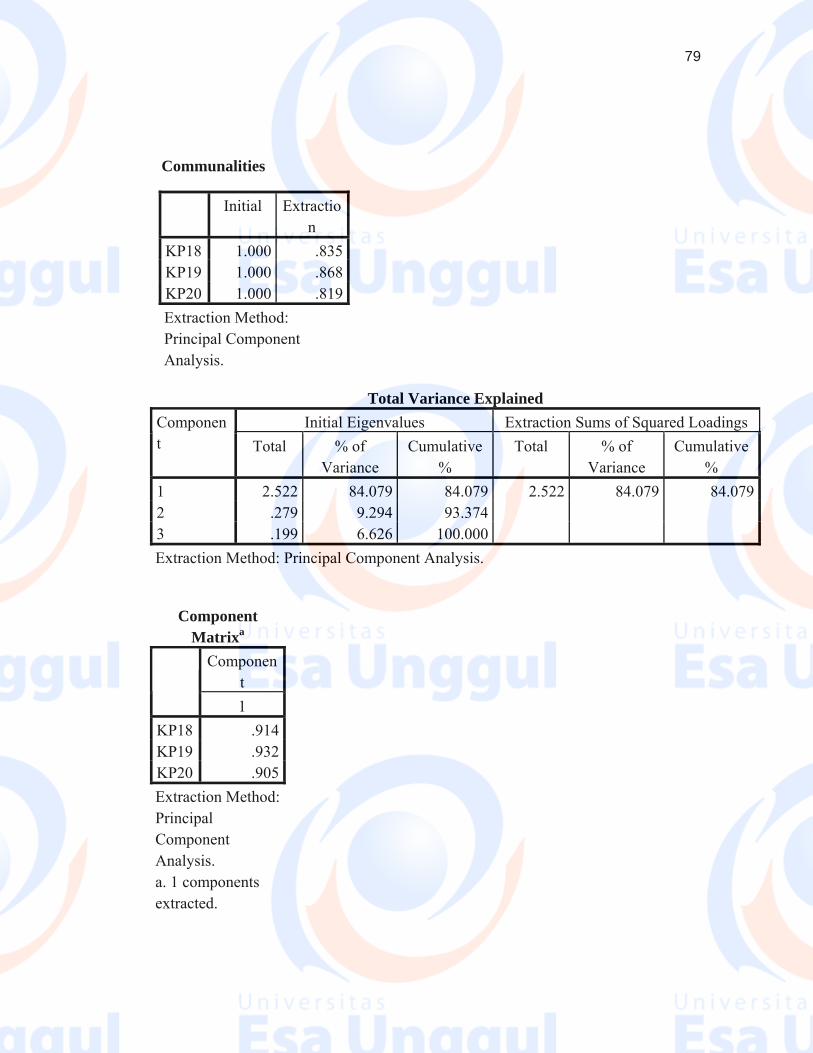
Total Variance Explained
Initial Eigenvalues Extraction Sums of Squared Loadings Component Total % of
Variance Cumulative
% Total % of
Variance Cumulative
% 1 2.522 84.079 84.079 2.522 84.079 84.0792 .279 9.294 93.374 3 .199 6.626 100.000
Extraction Method: Principal Component Analysis.
Component Matrixa
Component
1 KP18 .914 KP19 .932 KP20 .905 Extraction Method: Principal Component Analysis. a. 1 components extracted.
Communalities
Initial Extraction
KP18 1.000 .835KP19 1.000 .868KP20 1.000 .819Extraction Method: Principal Component Analysis.
80
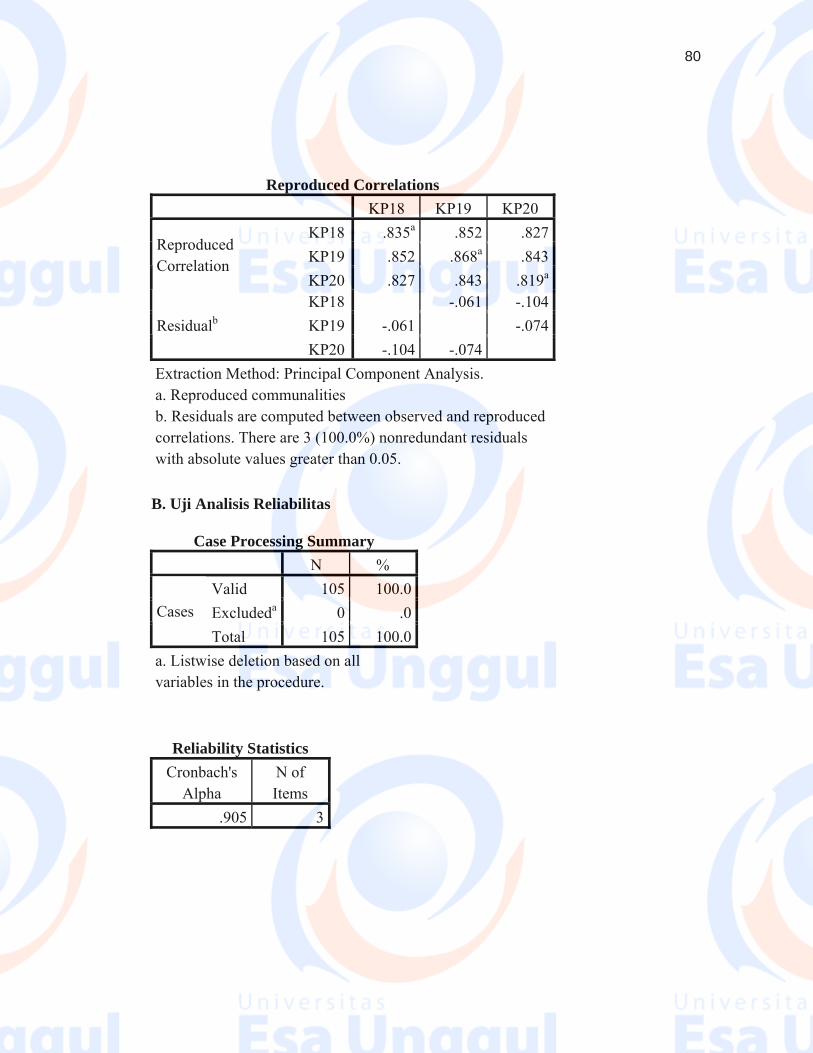
Reproduced Correlations
KP18 KP19 KP20 KP18 .835a .852 .827KP19 .852 .868a .843
Reproduced Correlation
KP20 .827 .843 .819a
KP18 -.061 -.104KP19 -.061 -.074Residualb KP20 -.104 -.074
Extraction Method: Principal Component Analysis. a. Reproduced communalities b. Residuals are computed between observed and reproduced correlations. There are 3 (100.0%) nonredundant residuals with absolute values greater than 0.05.
B. Uji Analisis Reliabilitas
Case Processing Summary N %
Valid 105 100.0Excludeda 0 .0Cases Total 105 100.0
a. Listwise deletion based on all variables in the procedure.
Reliability Statistics Cronbach's
Alpha N of Items
.905 3
81
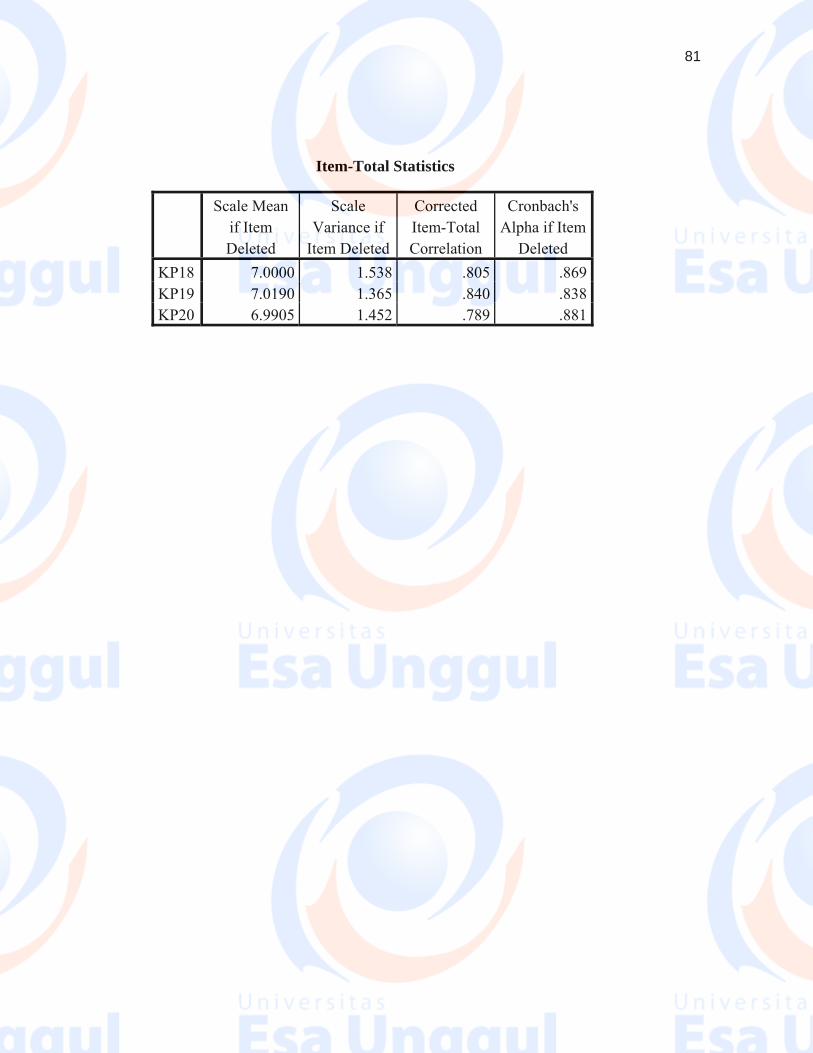
Item-Total Statistics
Scale Mean if Item Deleted
Scale Variance if
Item Deleted
Corrected Item-Total Correlation
Cronbach's Alpha if Item
Deleted KP18 7.0000 1.538 .805 .869 KP19 7.0190 1.365 .840 .838 KP20 6.9905 1.452 .789 .881
82
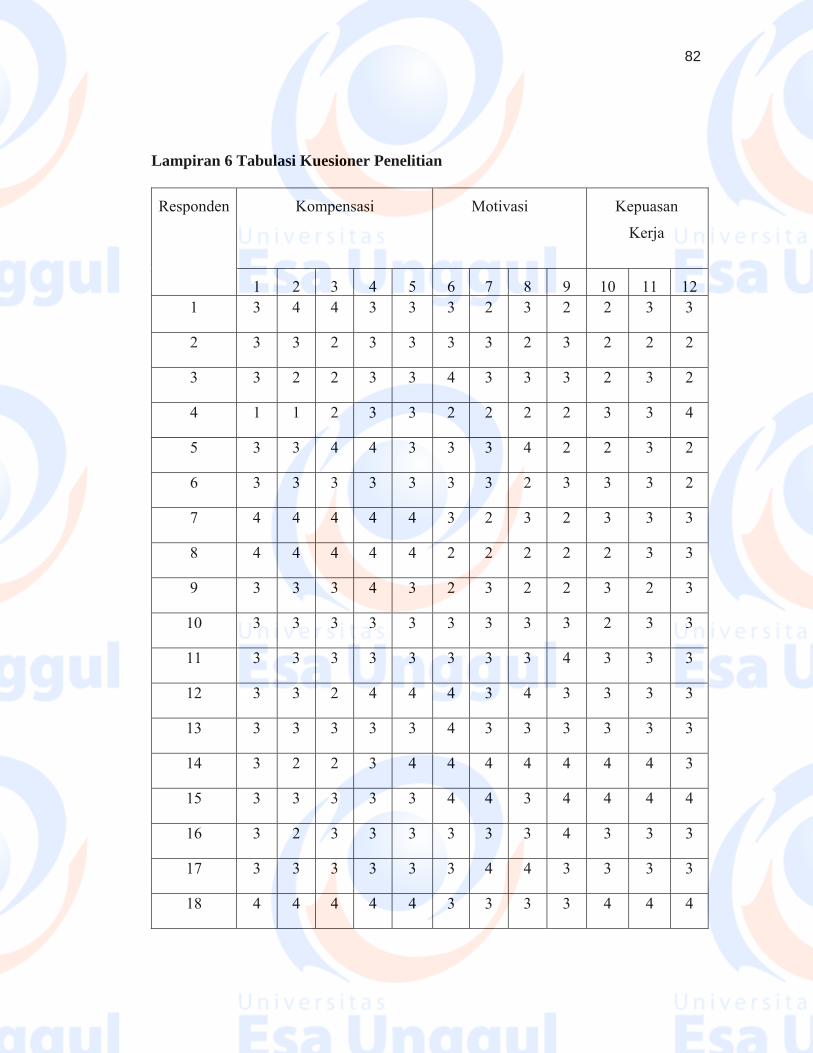
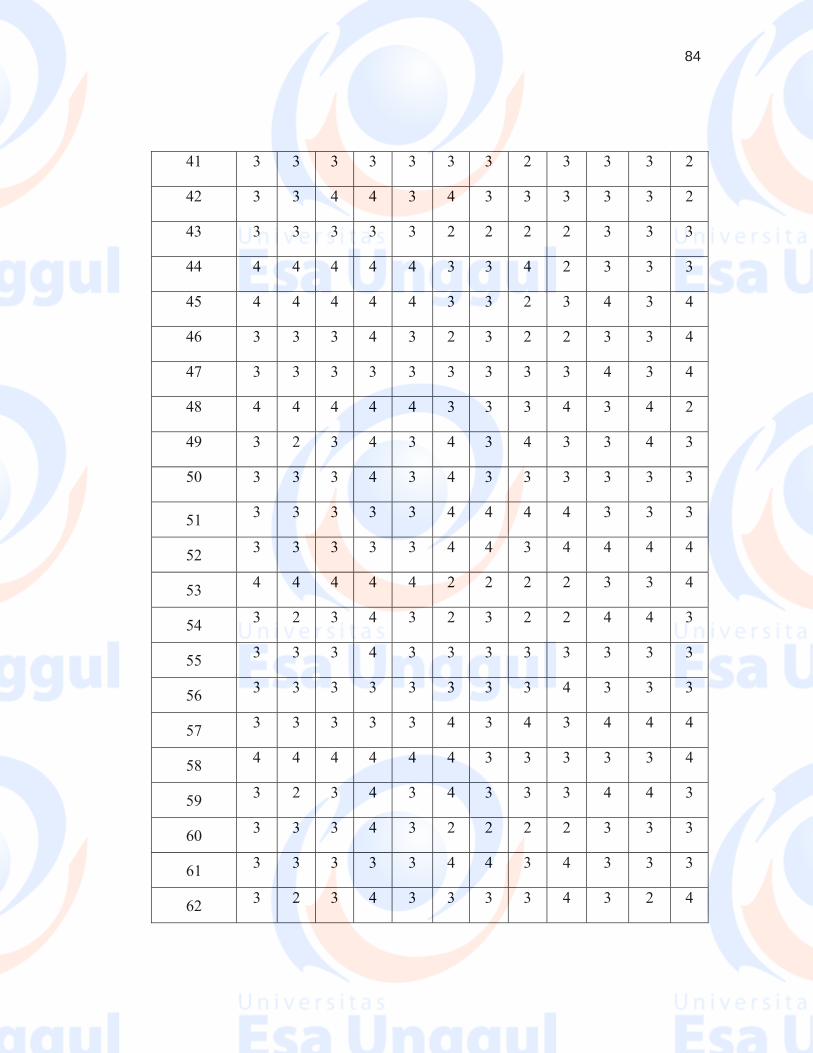
Lampiran 6 Tabulasi Kuesioner Penelitian
Responden Kompensasi Motivasi Kepuasan
Kerja
1 2 3 4 5 6 7 8 9 10 11 12 1 3 4 4 3 3 3 2 3 2 2 3 3
2 3 3 2 3 3 3 3 2 3 2 2 2
3 3 2 2 3 3 4 3 3 3 2 3 2
4 1 1 2 3 3 2 2 2 2 3 3 4
5 3 3 4 4 3 3 3 4 2 2 3 2
6 3 3 3 3 3 3 3 2 3 3 3 2
7 4 4 4 4 4 3 2 3 2 3 3 3
8 4 4 4 4 4 2 2 2 2 2 3 3
9 3 3 3 4 3 2 3 2 2 3 2 3
10 3 3 3 3 3 3 3 3 3 2 3 3
11 3 3 3 3 3 3 3 3 4 3 3 3
12 3 3 2 4 4 4 3 4 3 3 3 3
13 3 3 3 3 3 4 3 3 3 3 3 3
14 3 2 2 3 4 4 4 4 4 4 4 3
15 3 3 3 3 3 4 4 3 4 4 4 4
16 3 2 3 3 3 3 3 3 4 3 3 3
17 3 3 3 3 3 3 4 4 3 3 3 3
18 4 4 4 4 4 3 3 3 3 4 4 4
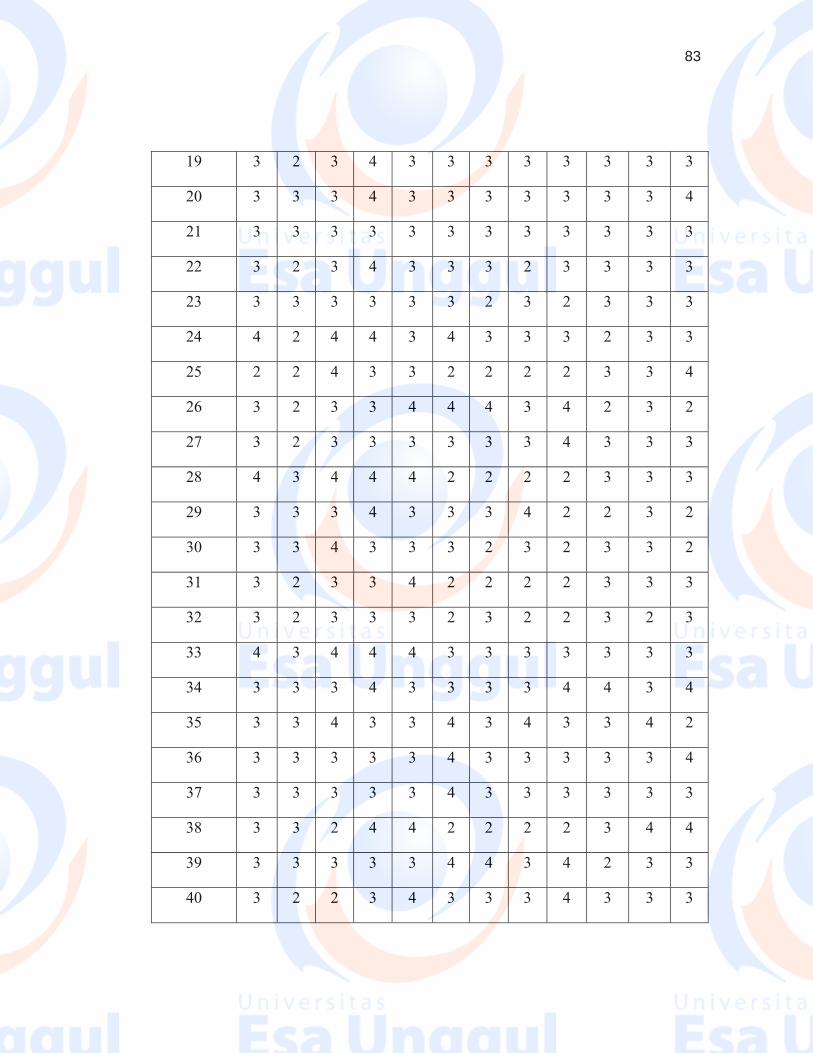
83
19 3 2 3 4 3 3 3 3 3 3 3 3
20 3 3 3 4 3 3 3 3 3 3 3 4
21 3 3 3 3 3 3 3 3 3 3 3 3
22 3 2 3 4 3 3 3 2 3 3 3 3
23 3 3 3 3 3 3 2 3 2 3 3 3
24 4 2 4 4 3 4 3 3 3 2 3 3
25 2 2 4 3 3 2 2 2 2 3 3 4
26 3 2 3 3 4 4 4 3 4 2 3 2
27 3 2 3 3 3 3 3 3 4 3 3 3
28 4 3 4 4 4 2 2 2 2 3 3 3
29 3 3 3 4 3 3 3 4 2 2 3 2
30 3 3 4 3 3 3 2 3 2 3 3 2
31 3 2 3 3 4 2 2 2 2 3 3 3
32 3 2 3 3 3 2 3 2 2 3 2 3
33 4 3 4 4 4 3 3 3 3 3 3 3
34 3 3 3 4 3 3 3 3 4 4 3 4
35 3 3 4 3 3 4 3 4 3 3 4 2
36 3 3 3 3 3 4 3 3 3 3 3 4
37 3 3 3 3 3 4 3 3 3 3 3 3
38 3 3 2 4 4 2 2 2 2 3 4 4
39 3 3 3 3 3 4 4 3 4 2 3 3
40 3 2 2 3 4 3 3 3 4 3 3 3
84
41 3 3 3 3 3 3 3 2 3 3 3 2
42 3 3 4 4 3 4 3 3 3 3 3 2
43 3 3 3 3 3 2 2 2 2 3 3 3
44 4 4 4 4 4 3 3 4 2 3 3 3
45 4 4 4 4 4 3 3 2 3 4 3 4
46 3 3 3 4 3 2 3 2 2 3 3 4
47 3 3 3 3 3 3 3 3 3 4 3 4
48 4 4 4 4 4 3 3 3 4 3 4 2
49 3 2 3 4 3 4 3 4 3 3 4 3
50 3 3 3 4 3 4 3 3 3 3 3 3
51 3 3 3 3 3 4 4 4 4 3 3 3
52 3 3 3 3 3 4 4 3 4 4 4 4
53 4 4 4 4 4 2 2 2 2 3 3 4
54 3 2 3 4 3 2 3 2 2 4 4 3
55 3 3 3 4 3 3 3 3 3 3 3 3
56 3 3 3 3 3 3 3 3 4 3 3 3
57 3 3 3 3 3 4 3 4 3 4 4 4
58 4 4 4 4 4 4 3 3 3 3 3 4
59 3 2 3 4 3 4 3 3 3 4 4 3
60 3 3 3 4 3 2 2 2 2 3 3 3
61 3 3 3 3 3 4 4 3 4 3 3 3
62 3 2 3 4 3 3 3 3 4 3 2 4
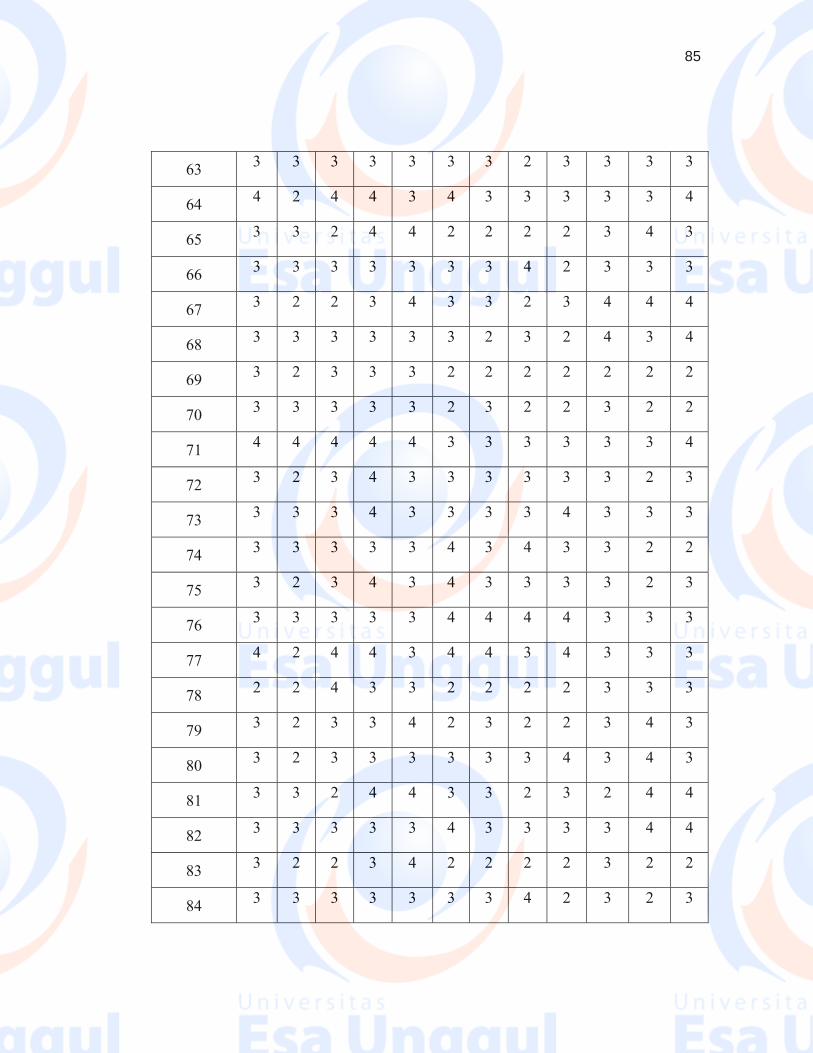
85
63 3 3 3 3 3 3 3 2 3 3 3 3
64 4 2 4 4 3 4 3 3 3 3 3 4
65 3 3 2 4 4 2 2 2 2 3 4 3
66 3 3 3 3 3 3 3 4 2 3 3 3
67 3 2 2 3 4 3 3 2 3 4 4 4
68 3 3 3 3 3 3 2 3 2 4 3 4
69 3 2 3 3 3 2 2 2 2 2 2 2
70 3 3 3 3 3 2 3 2 2 3 2 2
71 4 4 4 4 4 3 3 3 3 3 3 4
72 3 2 3 4 3 3 3 3 3 3 2 3
73 3 3 3 4 3 3 3 3 4 3 3 3
74 3 3 3 3 3 4 3 4 3 3 2 2
75 3 2 3 4 3 4 3 3 3 3 2 3
76 3 3 3 3 3 4 4 4 4 3 3 3
77 4 2 4 4 3 4 4 3 4 3 3 3
78 2 2 4 3 3 2 2 2 2 3 3 3
79 3 2 3 3 4 2 3 2 2 3 4 3
80 3 2 3 3 3 3 3 3 4 3 4 3
81 3 3 2 4 4 3 3 2 3 2 4 4
82 3 3 3 3 3 4 3 3 3 3 4 4
83 3 2 2 3 4 2 2 2 2 3 2 2
84 3 3 3 3 3 3 3 4 2 3 2 3
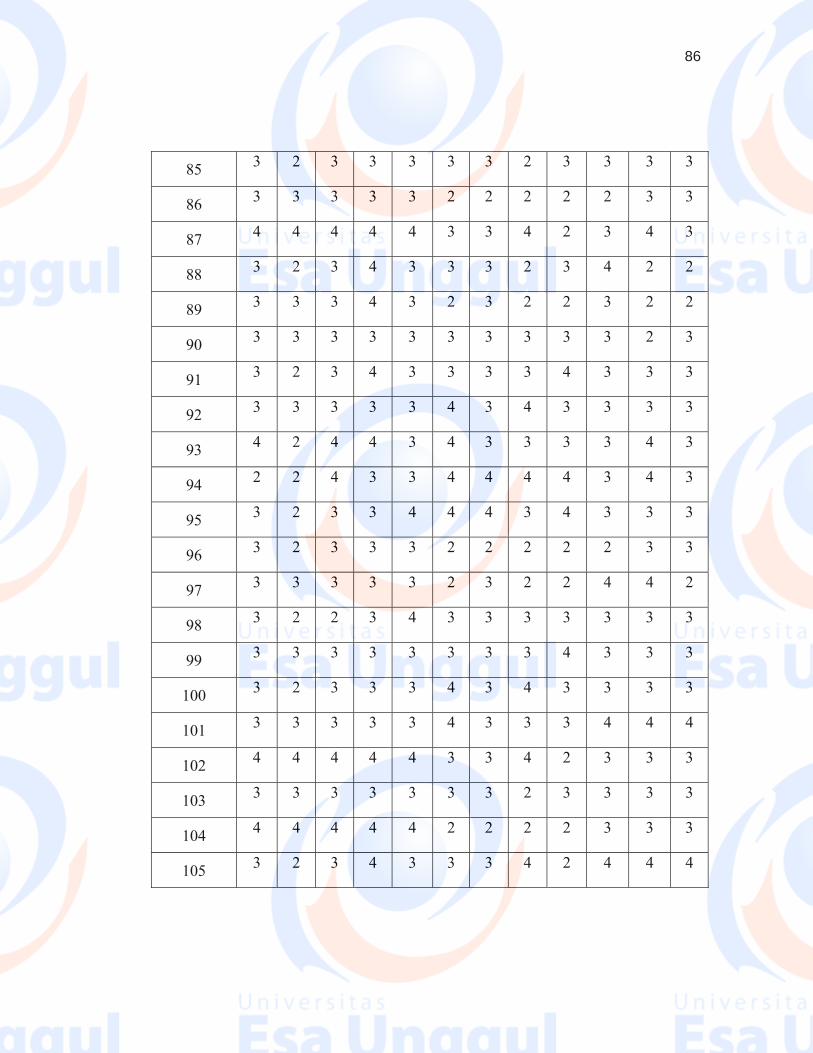
86
85 3 2 3 3 3 3 3 2 3 3 3 3
86 3 3 3 3 3 2 2 2 2 2 3 3
87 4 4 4 4 4 3 3 4 2 3 4 3
88 3 2 3 4 3 3 3 2 3 4 2 2
89 3 3 3 4 3 2 3 2 2 3 2 2
90 3 3 3 3 3 3 3 3 3 3 2 3
91 3 2 3 4 3 3 3 3 4 3 3 3
92 3 3 3 3 3 4 3 4 3 3 3 3
93 4 2 4 4 3 4 3 3 3 3 4 3
94 2 2 4 3 3 4 4 4 4 3 4 3
95 3 2 3 3 4 4 4 3 4 3 3 3
96 3 2 3 3 3 2 2 2 2 2 3 3
97 3 3 3 3 3 2 3 2 2 4 4 2
98 3 2 2 3 4 3 3 3 3 3 3 3
99 3 3 3 3 3 3 3 3 4 3 3 3
100 3 2 3 3 3 4 3 4 3 3 3 3
101 3 3 3 3 3 4 3 3 3 4 4 4
102 4 4 4 4 4 3 3 4 2 3 3 3
103 3 3 3 3 3 3 3 2 3 3 3 3
104 4 4 4 4 4 2 2 2 2 3 3 3
105 3 2 3 4 3 3 3 4 2 4 4 4
87
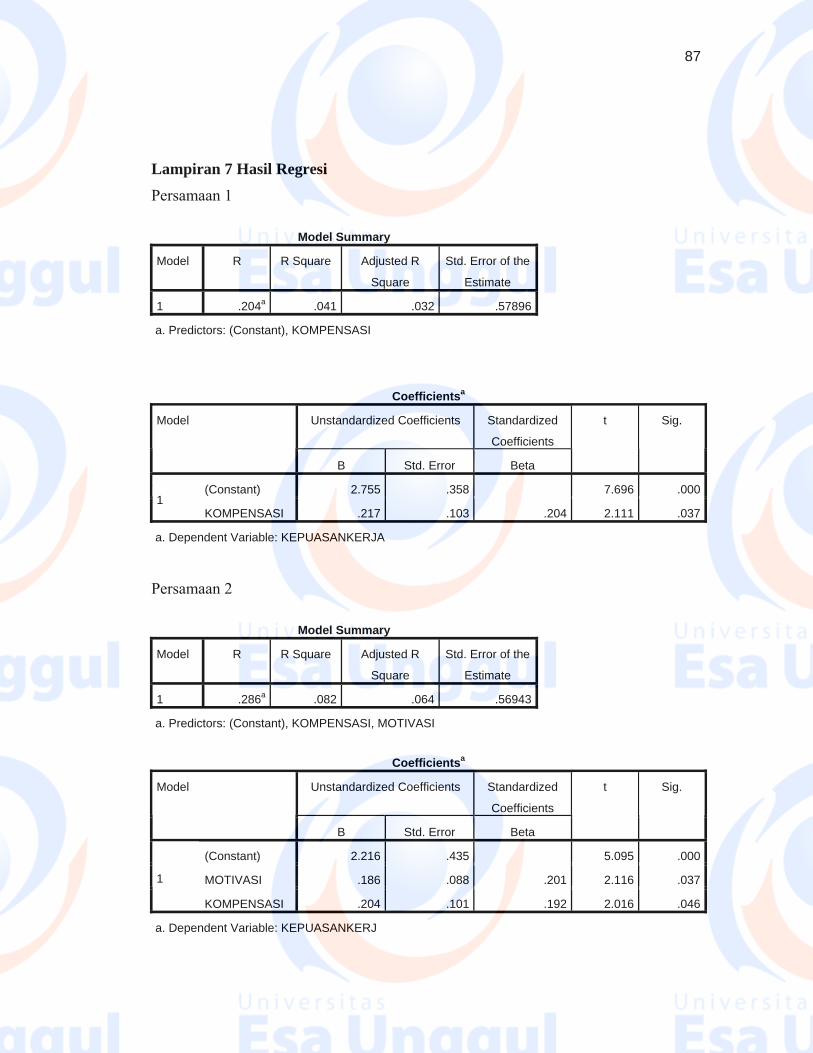
Lampiran 7 Hasil Regresi
Persamaan 1
Model Summary
Model R R Square Adjusted R
Square
Std. Error of the
Estimate
1 .204a .041 .032 .57896
a. Predictors: (Constant), KOMPENSASI
Coefficientsa
Unstandardized Coefficients Standardized
Coefficients
Model
B Std. Error Beta
t Sig.
(Constant) 2.755 .358 7.696 .0001
KOMPENSASI .217 .103 .204 2.111 .037
a. Dependent Variable: KEPUASANKERJA
Persamaan 2
Model Summary
Model R R Square Adjusted R
Square
Std. Error of the
Estimate
1 .286a .082 .064 .56943
a. Predictors: (Constant), KOMPENSASI, MOTIVASI
Coefficientsa
Unstandardized Coefficients Standardized
Coefficients
Model
B Std. Error Beta
t Sig.
(Constant) 2.216 .435 5.095 .000
MOTIVASI .186 .088 .201 2.116 .0371
KOMPENSASI .204 .101 .192 2.016 .046
a. Dependent Variable: KEPUASANKERJ

88