LAMPIRAN 1 KUESIONER Analisis Perbandingan Peran …eprints.umpo.ac.id/3174/8/LAMPIRAN...
24
LAMPIRAN 1 KUESIONER Analisis Perbandingan Peran Persepsi Harga, Selera Konsumen, Keadaan Ekonomi, dan Promosi terhadap Keputusan Pembeliaan antara Honda Vario dengan Honda Beat pada PT. Niaga Utama Sejahtera Ponorogo Selamat Pagi/Siang Kami, mahasiswa UNMUH Ponorogo sedang melakukan penelitian dalam penyusunan skripsi yang berjudul: “Analisis Perbandingan Peran Persepsi Harga, Selera Konsumen, Keadaan Ekonomi, dan Promosi terhadap Keputusan Pembelian antara Honda Vario dengan Honda Beat dapa PT. Niaga Utama Sejahtera Ponorogo” yang merupakan salah satu syarat bagi peneliti untuk dapat menyelesaikan Studi Program S1 Jurusan Fakultas Ekonomi Universitas Muhammadiyah Ponorogo. Kami harap saudara bersedia meluangkan waktu untuk mengisi daftar pertanyaan/pernyataan dari kuesioner. Terimakasih. I. Identifikasi Responden a. Nama Responden : b. Usia : …………. Tahun c. Jenis Kelamin : 1) Laki-laki, 2) Perempuan d. Jenis Motor Matic : 1) Honda Vario, 2) Honda Beat
Transcript of LAMPIRAN 1 KUESIONER Analisis Perbandingan Peran …eprints.umpo.ac.id/3174/8/LAMPIRAN...

LAMPIRAN 1
KUESIONER
Analisis Perbandingan Peran Persepsi Harga, Selera Konsumen, Keadaan Ekonomi, dan
Promosi terhadap Keputusan Pembeliaan antara Honda Vario dengan Honda Beat pada
PT. Niaga Utama Sejahtera Ponorogo
Selamat Pagi/Siang
Kami, mahasiswa UNMUH Ponorogo sedang melakukan penelitian dalam penyusunan
skripsi yang berjudul: “Analisis Perbandingan Peran Persepsi Harga, Selera Konsumen, Keadaan
Ekonomi, dan Promosi terhadap Keputusan Pembelian antara Honda Vario dengan Honda Beat
dapa PT. Niaga Utama Sejahtera Ponorogo” yang merupakan salah satu syarat bagi peneliti
untuk dapat menyelesaikan Studi Program S1 Jurusan Fakultas Ekonomi Universitas
Muhammadiyah Ponorogo.
Kami harap saudara bersedia meluangkan waktu untuk mengisi daftar
pertanyaan/pernyataan dari kuesioner. Terimakasih.
I. Identifikasi Responden
a. Nama Responden :
b. Usia : …………. Tahun
c. Jenis Kelamin : 1) Laki-laki, 2) Perempuan
d. Jenis Motor Matic : 1) Honda Vario, 2) Honda Beat
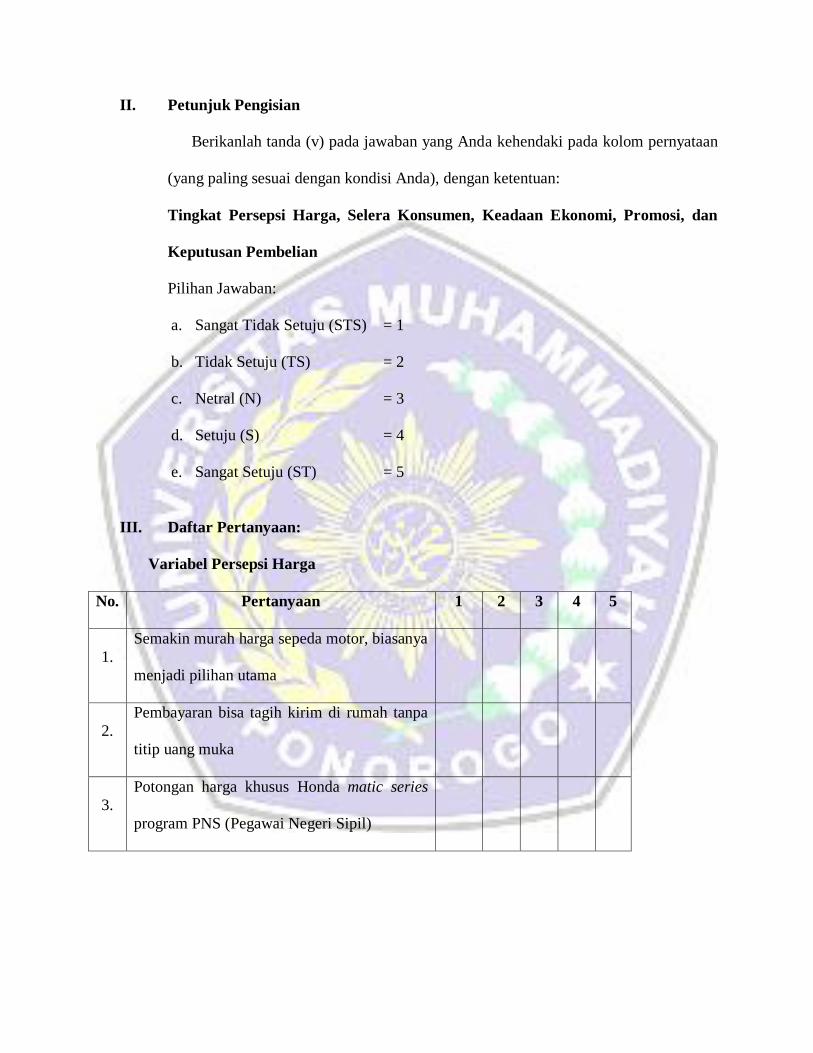
II. Petunjuk Pengisian
Berikanlah tanda (v) pada jawaban yang Anda kehendaki pada kolom pernyataan
(yang paling sesuai dengan kondisi Anda), dengan ketentuan:
Tingkat Persepsi Harga, Selera Konsumen, Keadaan Ekonomi, Promosi, dan
Keputusan Pembelian
Pilihan Jawaban:
a. Sangat Tidak Setuju (STS) = 1
b. Tidak Setuju (TS) = 2
c. Netral (N) = 3
d. Setuju (S) = 4
e. Sangat Setuju (ST) = 5
III. Daftar Pertanyaan:
Variabel Persepsi Harga
No. Pertanyaan 1 2 3 4 5
1.
Semakin murah harga sepeda motor, biasanya
menjadi pilihan utama
2.
Pembayaran bisa tagih kirim di rumah tanpa
titip uang muka
3.
Potongan harga khusus Honda matic series
program PNS (Pegawai Negeri Sipil)
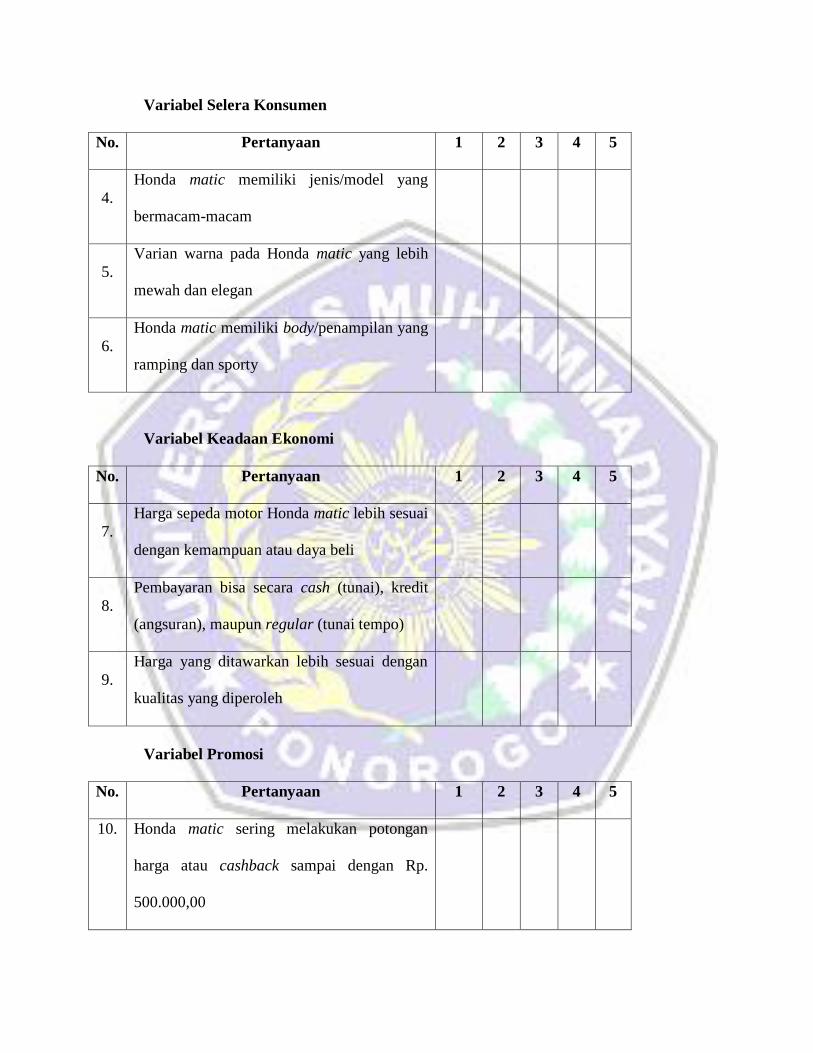
Variabel Selera Konsumen
No. Pertanyaan 1 2 3 4 5
4.
Honda matic memiliki jenis/model yang
bermacam-macam
5.
Varian warna pada Honda matic yang lebih
mewah dan elegan
6.
Honda matic memiliki body/penampilan yang
ramping dan sporty
Variabel Keadaan Ekonomi
No. Pertanyaan 1 2 3 4 5
7.
Harga sepeda motor Honda matic lebih sesuai
dengan kemampuan atau daya beli
8.
Pembayaran bisa secara cash (tunai), kredit
(angsuran), maupun regular (tunai tempo)
9.
Harga yang ditawarkan lebih sesuai dengan
kualitas yang diperoleh
Variabel Promosi
No. Pertanyaan 1 2 3 4 5
10. Honda matic sering melakukan potongan
harga atau cashback sampai dengan Rp.
500.000,00

11. Honda matic sering mengadakan program
khusus uang muka ringan dan angsuran
murah
12. Honda matic mengenalkan produk kepada
konsumen melalui spanduk, brosur, dan
banner
Variabel Keputusan Pembelian
No. Pertanyaan 1 2 3 4 5
13. Spesifikasi dari segi ukuran dan dimensi
Honda matic cocok untuk orang Indonesia
14. Honda matic cocok digunakan untu anak
remaja
15. Purna jual Honda matic lebih cepat dan
tidak terlalu mengalami penurunan harga
jual kembali
TERIMA KASIH

Lampiran 5
UJI INSTRUMEN (VALIDITAS DAN RELIABILITAS)
RELIABILITY
/VARIABLES=P1 P2 P3 X1 (PersepsiHarga)
/SCALE('ALL VARIABLES') ALL
/MODEL=ALPHA
/STATISTICS=CORR.
Reliability
[DataSet0]
Scale: ALL VARIABLES
Case Processing Summary
N %
Cases Valid 30 100.0
Excludeda 0 .0
Total 30 100.0
a. Listwise deletion based on all variables in the
procedure.
Reliability Statistics
Cronbach's
Alpha
Cronbach's
Alpha Based on
Standardized
Items N of Items
.620 .563 4
Inter-Item Correlation Matrix
P1 P2 P3 PersepsiHarga
P1 1.000 -.160 .000 .594
P2 -.160 1.000 .000 .522
P3 .000 .000 1.000 .507
PersepsiHarga .594 .522 .507 1.000
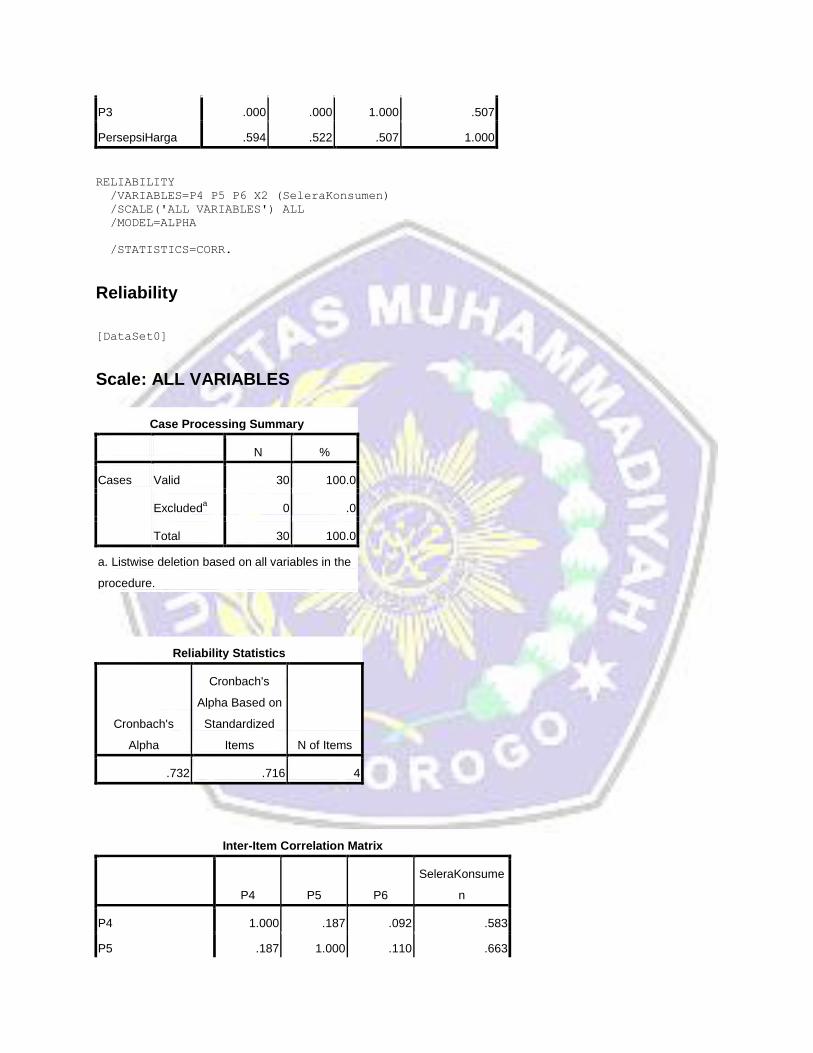
RELIABILITY
/VARIABLES=P4 P5 P6 X2 (SeleraKonsumen)
/SCALE('ALL VARIABLES') ALL
/MODEL=ALPHA
/STATISTICS=CORR.
Reliability
[DataSet0]
Scale: ALL VARIABLES
Case Processing Summary
N %
Cases Valid 30 100.0
Excludeda 0 .0
Total 30 100.0
a. Listwise deletion based on all variables in the
procedure.
Reliability Statistics
Cronbach's
Alpha
Cronbach's
Alpha Based on
Standardized
Items N of Items
.732 .716 4
Inter-Item Correlation Matrix
P4 P5 P6
SeleraKonsume
n
P4 1.000 .187 .092 .583
P5 .187 1.000 .110 .663
P6 .092 .110 1.000 .686
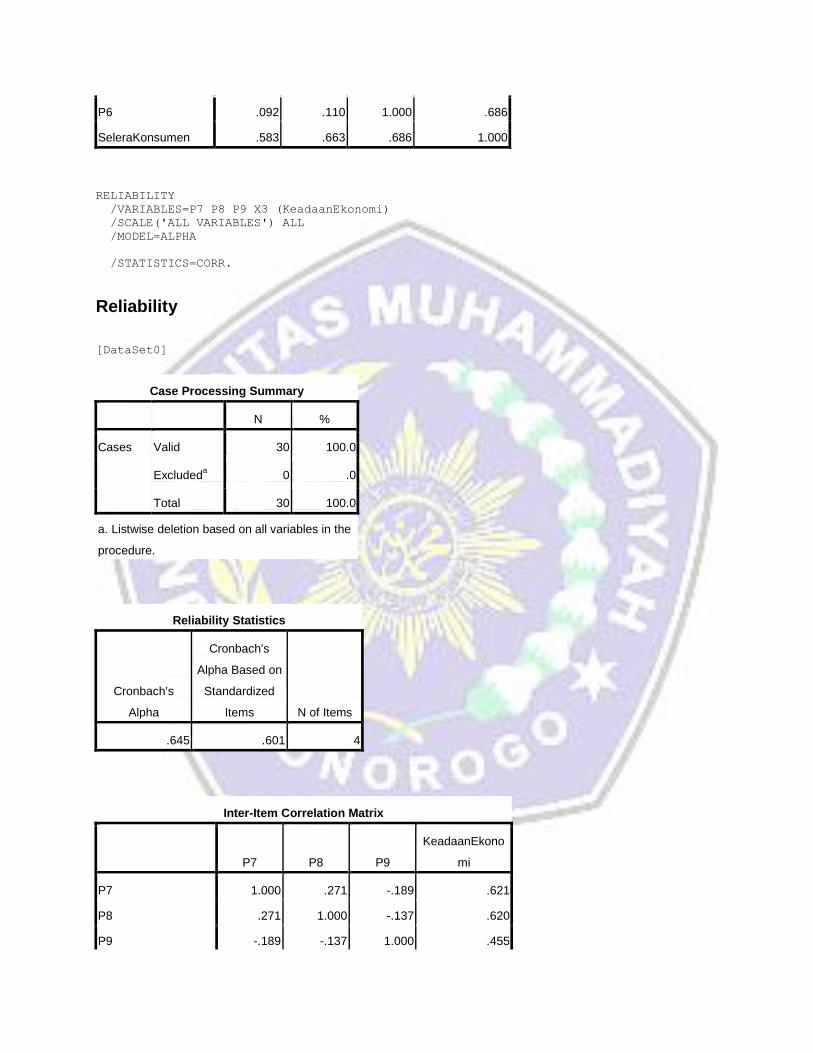
SeleraKonsumen .583 .663 .686 1.000
RELIABILITY
/VARIABLES=P7 P8 P9 X3 (KeadaanEkonomi)
/SCALE('ALL VARIABLES') ALL
/MODEL=ALPHA
/STATISTICS=CORR.
Reliability
[DataSet0]
Case Processing Summary
N %
Cases Valid 30 100.0
Excludeda 0 .0
Total 30 100.0
a. Listwise deletion based on all variables in the
procedure.
Reliability Statistics
Cronbach's
Alpha
Cronbach's
Alpha Based on
Standardized
Items N of Items
.645 .601 4
Inter-Item Correlation Matrix
P7 P8 P9
KeadaanEkono
mi
P7 1.000 .271 -.189 .621
P8 .271 1.000 -.137 .620
P9 -.189 -.137 1.000 .455
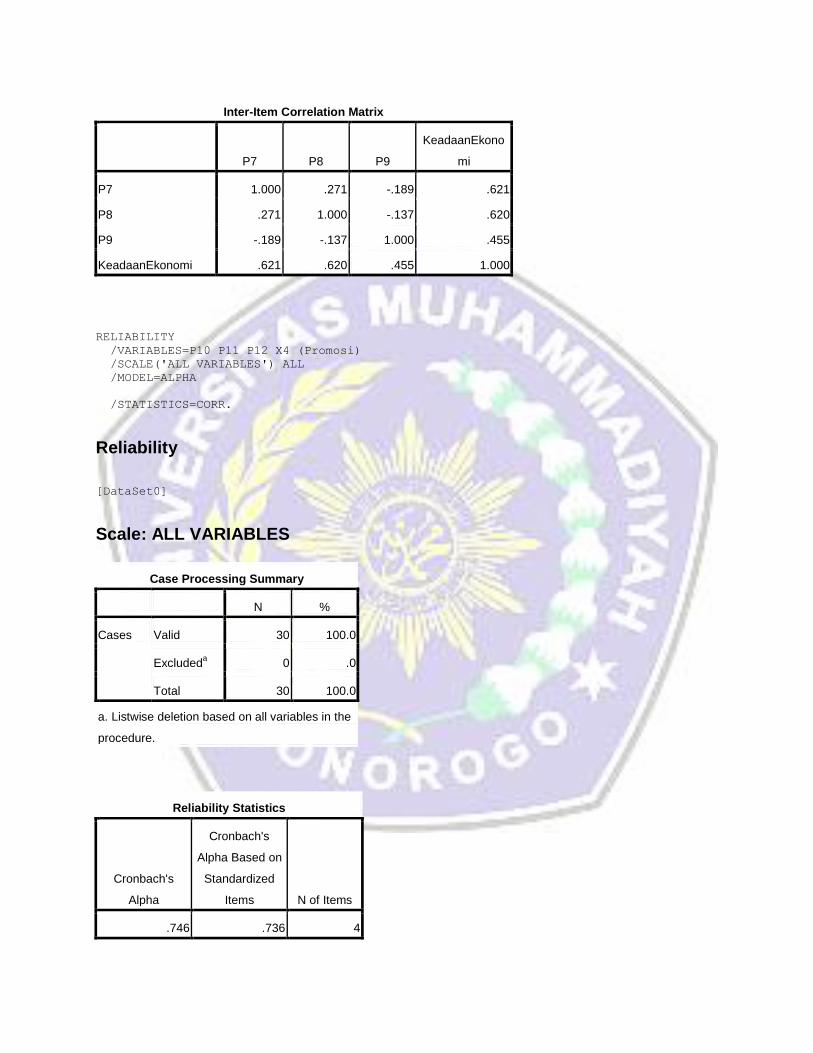
Inter-Item Correlation Matrix
P7 P8 P9
KeadaanEkono
mi
P7 1.000 .271 -.189 .621
P8 .271 1.000 -.137 .620
P9 -.189 -.137 1.000 .455
KeadaanEkonomi .621 .620 .455 1.000
RELIABILITY
/VARIABLES=P10 P11 P12 X4 (Promosi)
/SCALE('ALL VARIABLES') ALL
/MODEL=ALPHA
/STATISTICS=CORR.
Reliability
[DataSet0]
Scale: ALL VARIABLES
Case Processing Summary
N %
Cases Valid 30 100.0
Excludeda 0 .0
Total 30 100.0
a. Listwise deletion based on all variables in the
procedure.
Reliability Statistics
Cronbach's
Alpha
Cronbach's
Alpha Based on
Standardized
Items N of Items
.746 .736 4

Inter-Item Correlation Matrix
P10 P11 P12 Promosi
P10 1.000 .241 -.018 .514
P11 .241 1.000 .268 .735
P12 -.018 .268 1.000 .727
Promosi .514 .735 .727 1.000
RELIABILITY
/VARIABLES=P13 P14 P15 Y (KeputusanPembelian)
/SCALE('ALL VARIABLES') ALL
/MODEL=ALPHA
/STATISTICS=CORR.
Reliability
[DataSet0]
Scale: ALL VARIABLES
Case Processing Summary
N %
Cases Valid 30 100.0
Excludeda 0 .0
Total 30 100.0
a. Listwise deletion based on all variables in the
procedure.
Reliability Statistics
Cronbach's
Alpha
Cronbach's
Alpha Based on
Standardized
Items N of Items
.760 .757 4
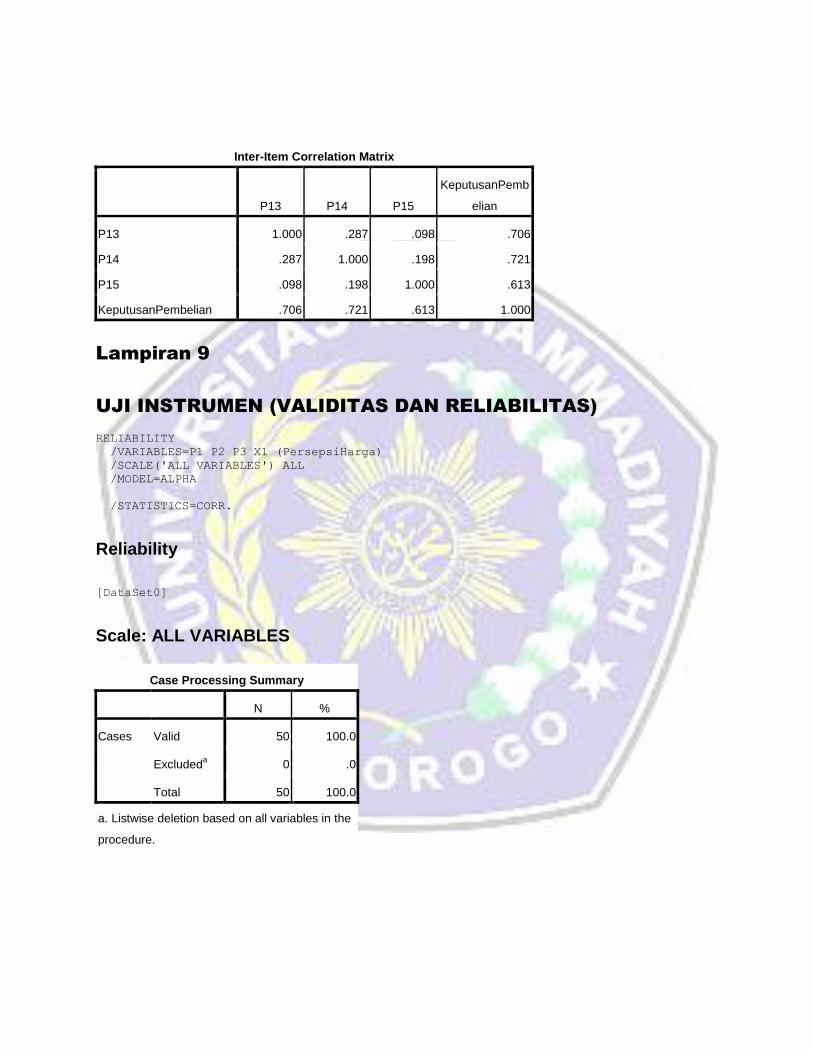
Inter-Item Correlation Matrix
P13 P14 P15
KeputusanPemb
elian
P13 1.000 .287 .098 .706
P14 .287 1.000 .198 .721
P15 .098 .198 1.000 .613
KeputusanPembelian .706 .721 .613 1.000
Lampiran 9
UJI INSTRUMEN (VALIDITAS DAN RELIABILITAS)
RELIABILITY
/VARIABLES=P1 P2 P3 X1 (PersepsiHarga)
/SCALE('ALL VARIABLES') ALL
/MODEL=ALPHA
/STATISTICS=CORR.
Reliability
[DataSet0]
Scale: ALL VARIABLES
Case Processing Summary
N %
Cases Valid 50 100.0
Excludeda 0 .0
Total 50 100.0
a. Listwise deletion based on all variables in the
procedure.
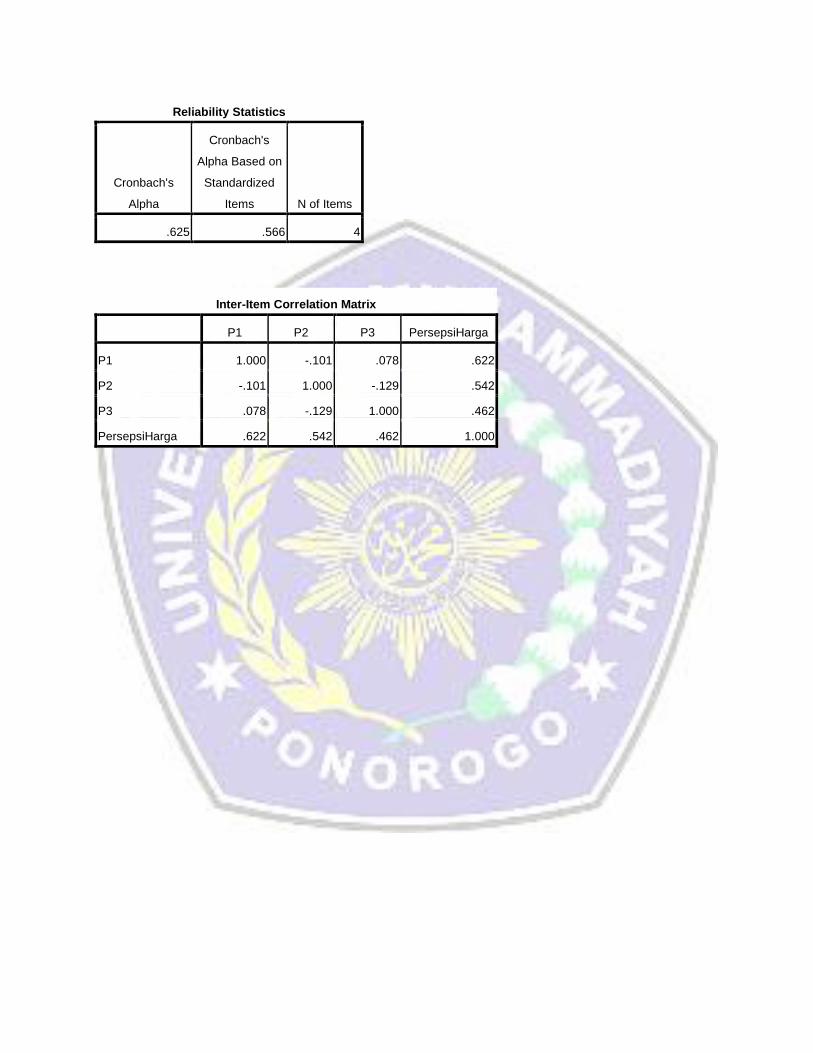
Reliability Statistics
Cronbach's
Alpha
Cronbach's
Alpha Based on
Standardized
Items N of Items
.625 .566 4
Inter-Item Correlation Matrix
P1 P2 P3 PersepsiHarga
P1 1.000 -.101 .078 .622
P2 -.101 1.000 -.129 .542
P3 .078 -.129 1.000 .462
PersepsiHarga .622 .542 .462 1.000

RELIABILITY
/VARIABLES=P4 P5 P6 X2 (SeleraKonsumen)
/SCALE('ALL VARIABLES') ALL
/MODEL=ALPHA
/STATISTICS=CORR.
Reliability
[DataSet0]
Scale: ALL VARIABLES
Case Processing Summary
N %
Cases Valid 50 100.0
Excludeda 0 .0
Total 50 100.0
a. Listwise deletion based on all variables in the
procedure.
Reliability Statistics
Cronbach's
Alpha
Cronbach's
Alpha Based on
Standardized
Items N of Items
.748 .742 4
Inter-Item Correlation Matrix
P4 P5 P6
SeleraKonsume
n
P4 1.000 .211 .210 .648
P5 .211 1.000 .092 .625
P6 .210 .092 1.000 .722
SeleraKonsumen .648 .625 .722 1.000
RELIABILITY
/VARIABLES=P7 P8 P9 X3 (KeadaanEkonomi)
/SCALE('ALL VARIABLES') ALL
/MODEL=ALPHA
/STATISTICS=CORR.
Reliability
[DataSet0]
Scale: ALL VARIABLES
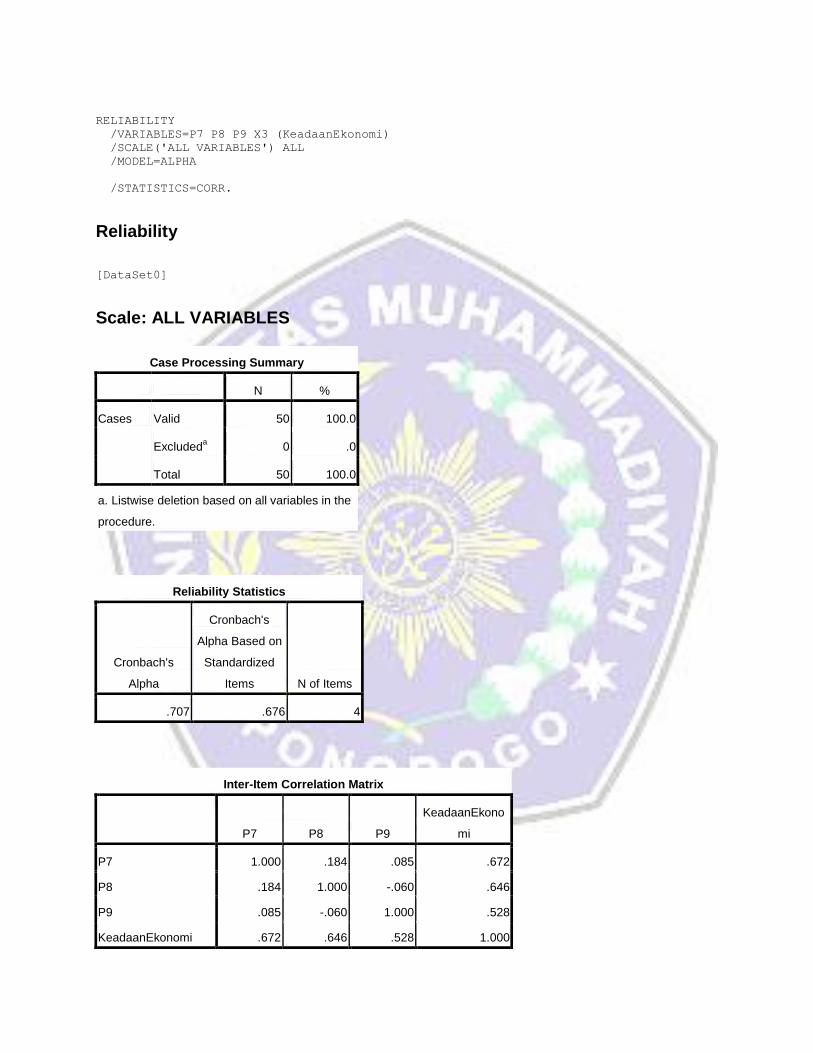
Case Processing Summary
N %
Cases Valid 50 100.0
Excludeda 0 .0
Total 50 100.0
a. Listwise deletion based on all variables in the
procedure.
Reliability Statistics
Cronbach's
Alpha
Cronbach's
Alpha Based on
Standardized
Items N of Items
.707 .676 4
Inter-Item Correlation Matrix
P7 P8 P9
KeadaanEkono
mi
P7 1.000 .184 .085 .672
P8 .184 1.000 -.060 .646
P9 .085 -.060 1.000 .528
KeadaanEkonomi .672 .646 .528 1.000
RELIABILITY
/VARIABLES=P10 P11 P12 X4 (Promosi)
/SCALE('ALL VARIABLES') ALL
/MODEL=ALPHA
/STATISTICS=CORR.
Reliability
[DataSet0]
Scale: ALL VARIABLES
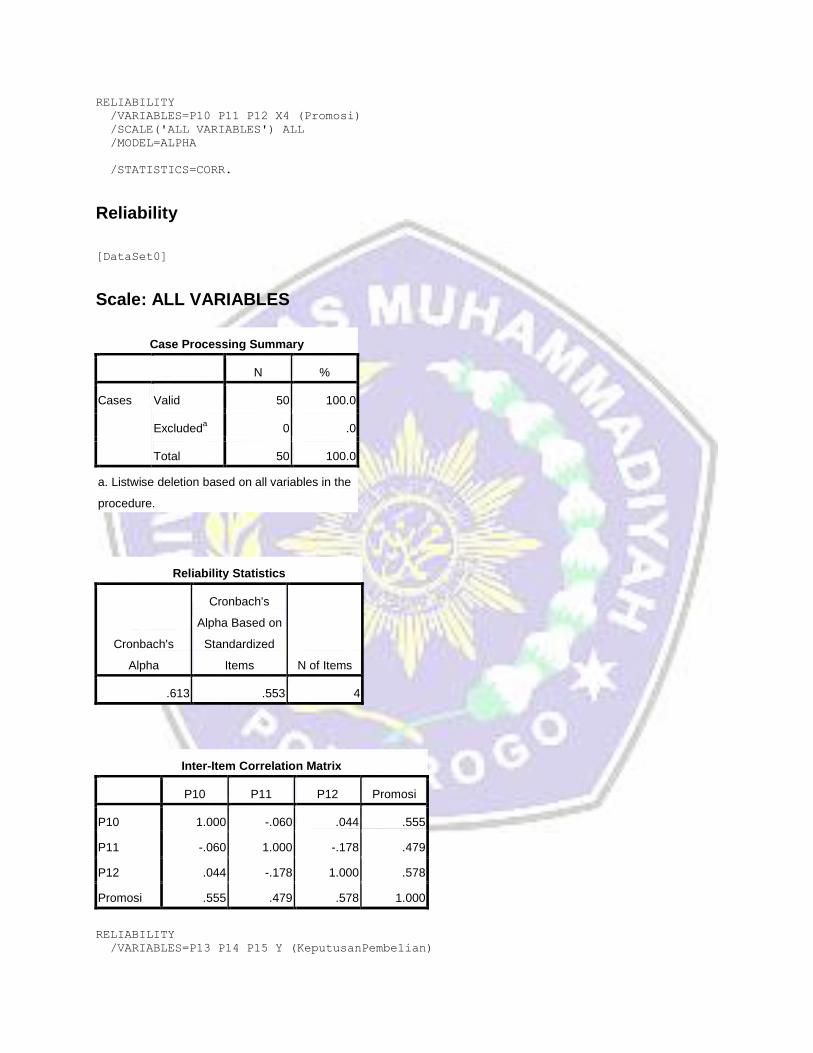
Case Processing Summary
N %
Cases Valid 50 100.0
Excludeda 0 .0
Total 50 100.0
a. Listwise deletion based on all variables in the
procedure.
Reliability Statistics
Cronbach's
Alpha
Cronbach's
Alpha Based on
Standardized
Items N of Items
.613 .553 4
Inter-Item Correlation Matrix
P10 P11 P12 Promosi
P10 1.000 -.060 .044 .555
P11 -.060 1.000 -.178 .479
P12 .044 -.178 1.000 .578
Promosi .555 .479 .578 1.000
RELIABILITY /VARIABLES=P13 P14 P15 Y (KeputusanPembelian)
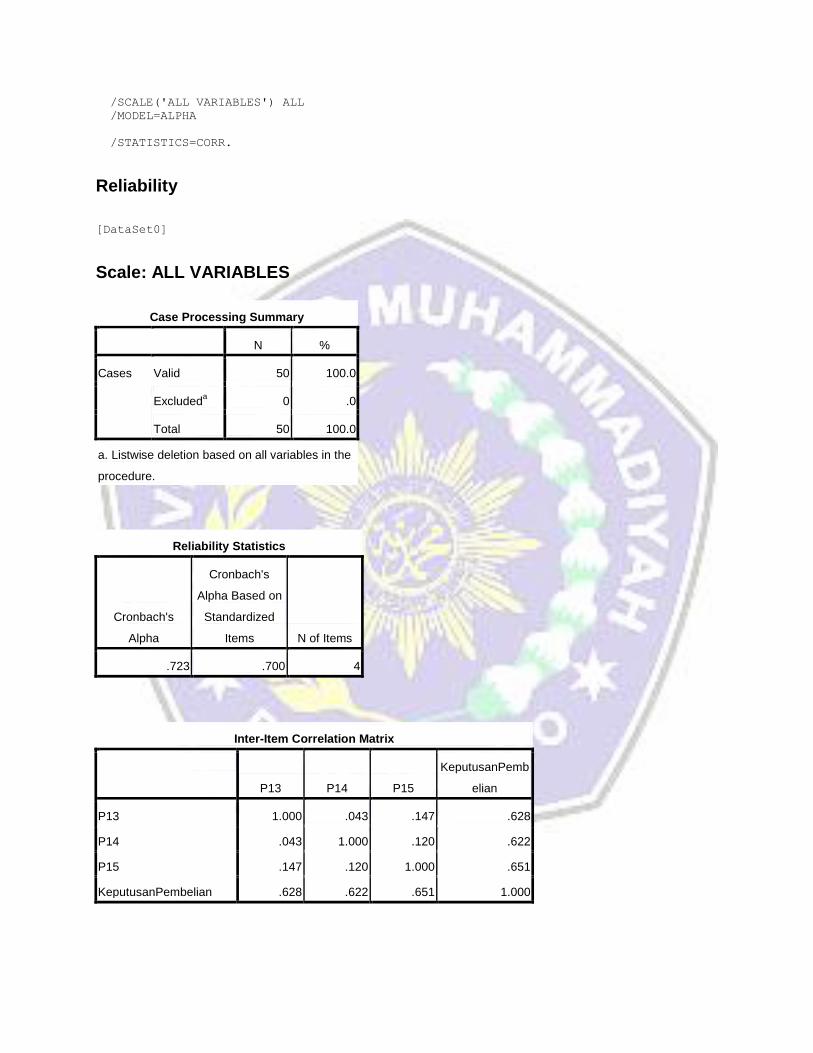
/SCALE('ALL VARIABLES') ALL
/MODEL=ALPHA
/STATISTICS=CORR.
Reliability
[DataSet0]
Scale: ALL VARIABLES
Case Processing Summary
N %
Cases Valid 50 100.0
Excludeda 0 .0
Total 50 100.0
a. Listwise deletion based on all variables in the
procedure.
Reliability Statistics
Cronbach's
Alpha
Cronbach's
Alpha Based on
Standardized
Items N of Items
.723 .700 4
Inter-Item Correlation Matrix
P13 P14 P15
KeputusanPemb
elian
P13 1.000 .043 .147 .628
P14 .043 1.000 .120 .622
P15 .147 .120 1.000 .651
KeputusanPembelian .628 .622 .651 1.000

Lampiran 11
UJI CHI SQUARE
CROSSTABS
/TABLES=Persepsi Selera Ekonomi Promosi BY Keputusan BY Honda
/FORMAT=AVALUE TABLES
/STATISTICS=CHISQ
/CELLS=EXPECTED
/COUNT ROUND CELL.
Crosstabs
[DataSet1] G:\data print Skrips 17\spss chiq.sav
Case Processing Summary
Cases
Keterangan Valid Missing Total
N Percent N Percent N Percent
Persepsi Harga * Keputusan
Pembelian * Tipe 80 100.0% 0 .0% 80 100.0%
Selera Konsumen *
Keputusan Pembelian * Tipe 80 100.0% 0 .0% 80 100.0%
Keadaan Ekonomi *
Keputusan Pembelian * Tipe 80 100.0% 0 .0% 80 100.0%
Promosi * Keputusan
Pembelian * Tipe 80 100.0% 0 .0% 80 100.0%
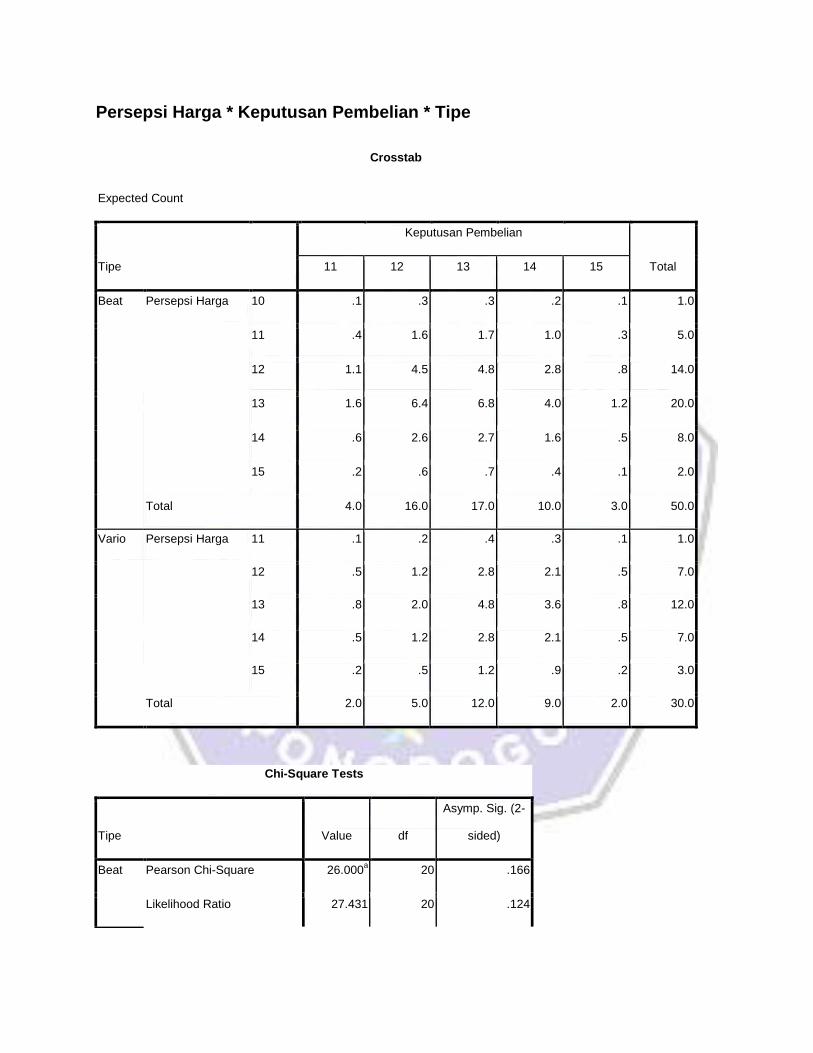
Persepsi Harga * Keputusan Pembelian * Tipe
Crosstab
Expected Count
Tipe
Keputusan Pembelian
Total 11 12 13 14 15
Beat Persepsi Harga 10 .1 .3 .3 .2 .1 1.0
11 .4 1.6 1.7 1.0 .3 5.0
12 1.1 4.5 4.8 2.8 .8 14.0
13 1.6 6.4 6.8 4.0 1.2 20.0
14 .6 2.6 2.7 1.6 .5 8.0
15 .2 .6 .7 .4 .1 2.0
Total 4.0 16.0 17.0 10.0 3.0 50.0
Vario Persepsi Harga 11 .1 .2 .4 .3 .1 1.0
12 .5 1.2 2.8 2.1 .5 7.0
13 .8 2.0 4.8 3.6 .8 12.0
14 .5 1.2 2.8 2.1 .5 7.0
15 .2 .5 1.2 .9 .2 3.0
Total 2.0 5.0 12.0 9.0 2.0 30.0
Chi-Square Tests
Tipe Value df
Asymp. Sig. (2-
sided)
Beat Pearson Chi-Square 26.000a 20 .166
Likelihood Ratio 27.431 20 .124

Linear-by-Linear Association .985 1 .321
N of Valid Cases 50
Vario Pearson Chi-Square 14.165b 16 .586
Likelihood Ratio 14.355 16 .572
Linear-by-Linear Association 1.862 1 .172
N of Valid Cases 30
a. 28 cells (93.3%) have expected count less than 5. The minimum expected
count is .06.
b. 25 cells (100.0%) have expected count less than 5. The minimum expected
count is .07.
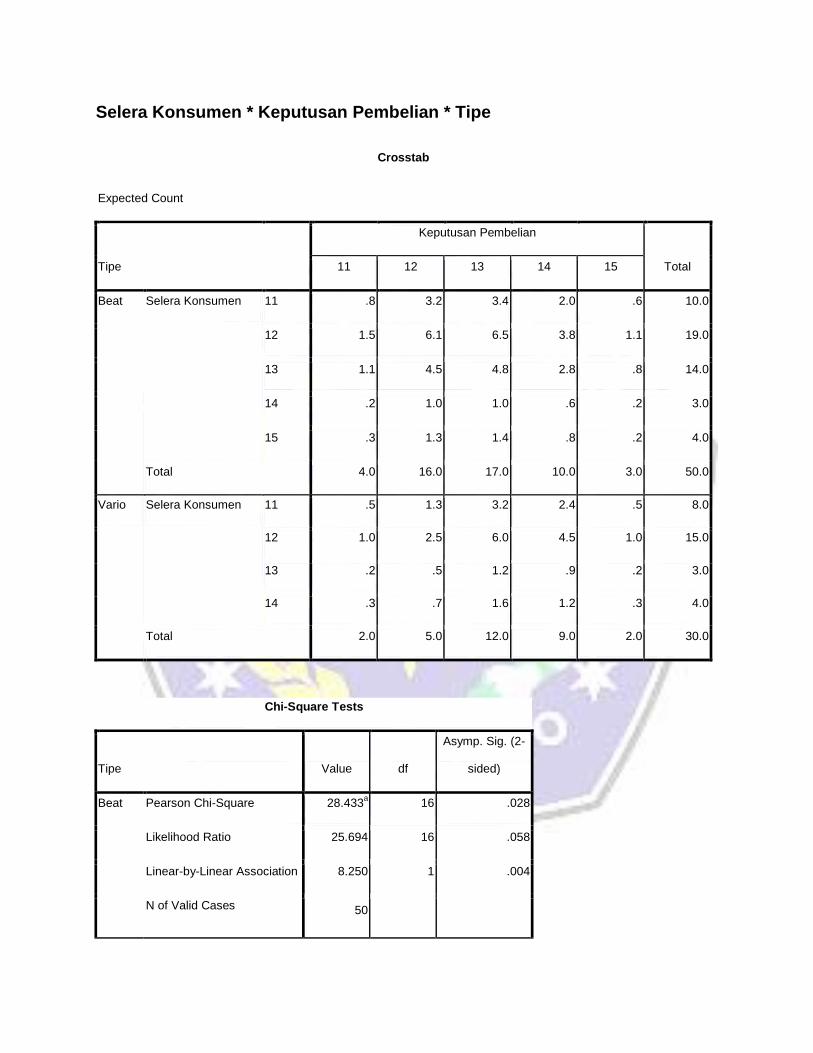
Selera Konsumen * Keputusan Pembelian * Tipe
Crosstab
Expected Count
Tipe
Keputusan Pembelian
Total 11 12 13 14 15
Beat Selera Konsumen 11 .8 3.2 3.4 2.0 .6 10.0
12 1.5 6.1 6.5 3.8 1.1 19.0
13 1.1 4.5 4.8 2.8 .8 14.0
14 .2 1.0 1.0 .6 .2 3.0
15 .3 1.3 1.4 .8 .2 4.0
Total 4.0 16.0 17.0 10.0 3.0 50.0
Vario Selera Konsumen 11 .5 1.3 3.2 2.4 .5 8.0
12 1.0 2.5 6.0 4.5 1.0 15.0
13 .2 .5 1.2 .9 .2 3.0
14 .3 .7 1.6 1.2 .3 4.0
Total 2.0 5.0 12.0 9.0 2.0 30.0
Chi-Square Tests
Tipe Value df
Asymp. Sig. (2-
sided)
Beat Pearson Chi-Square 28.433a 16 .028
Likelihood Ratio 25.694 16 .058
Linear-by-Linear Association 8.250 1 .004
N of Valid Cases 50

Vario Pearson Chi-Square 7.190b 12 .845
Likelihood Ratio 8.595 12 .737
Linear-by-Linear Association .013 1 .908
N of Valid Cases 30
a. 23 cells (92.0%) have expected count less than 5. The minimum expected
count is .18.
b. 19 cells (95.0%) have expected count less than 5. The minimum expected
count is .20.
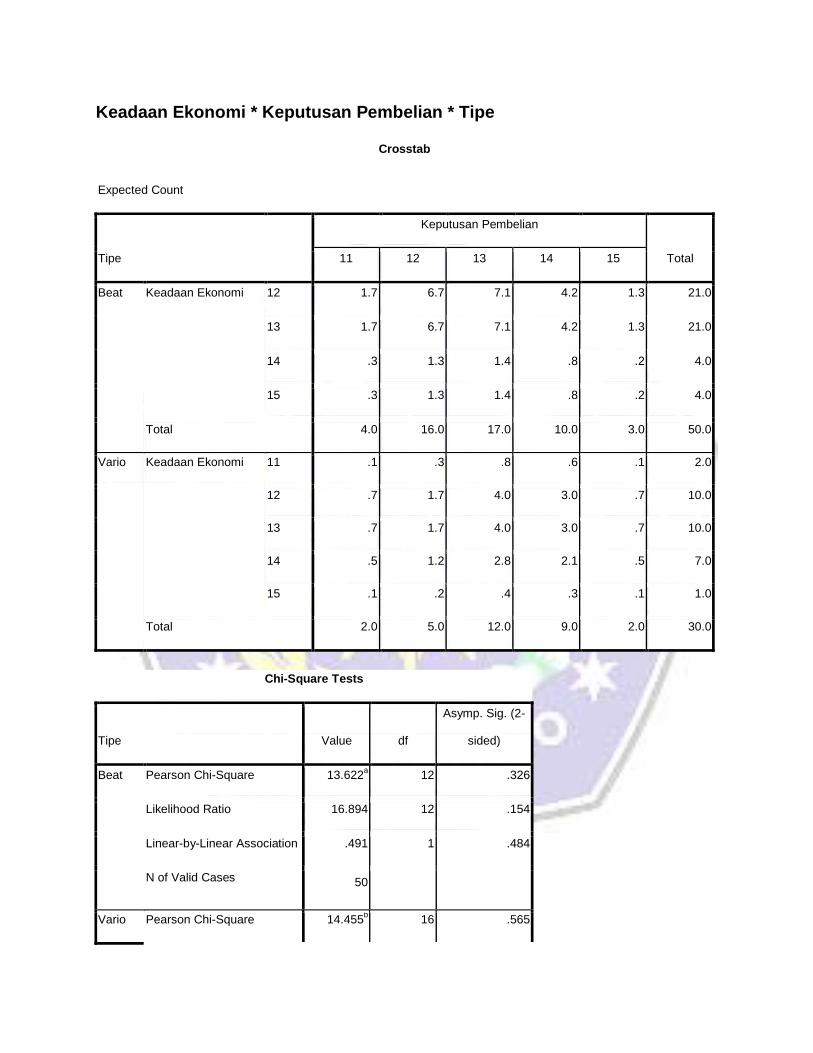
Keadaan Ekonomi * Keputusan Pembelian * Tipe
Crosstab
Expected Count
Tipe
Keputusan Pembelian
Total 11 12 13 14 15
Beat Keadaan Ekonomi 12 1.7 6.7 7.1 4.2 1.3 21.0
13 1.7 6.7 7.1 4.2 1.3 21.0
14 .3 1.3 1.4 .8 .2 4.0
15 .3 1.3 1.4 .8 .2 4.0
Total 4.0 16.0 17.0 10.0 3.0 50.0
Vario Keadaan Ekonomi 11 .1 .3 .8 .6 .1 2.0
12 .7 1.7 4.0 3.0 .7 10.0
13 .7 1.7 4.0 3.0 .7 10.0
14 .5 1.2 2.8 2.1 .5 7.0
15 .1 .2 .4 .3 .1 1.0
Total 2.0 5.0 12.0 9.0 2.0 30.0
Chi-Square Tests
Tipe Value df
Asymp. Sig. (2-
sided)
Beat Pearson Chi-Square 13.622a 12 .326
Likelihood Ratio 16.894 12 .154
Linear-by-Linear Association .491 1 .484
N of Valid Cases 50
Vario Pearson Chi-Square 14.455b 16 .565
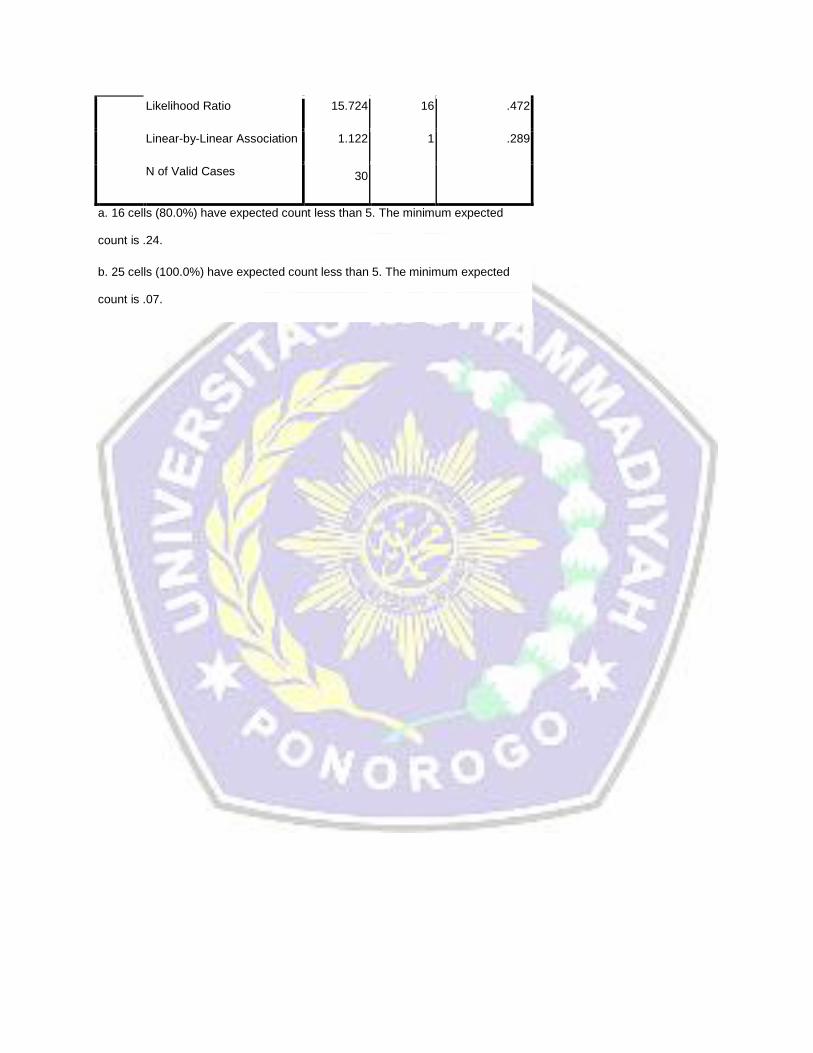
Likelihood Ratio 15.724 16 .472
Linear-by-Linear Association 1.122 1 .289
N of Valid Cases 30
a. 16 cells (80.0%) have expected count less than 5. The minimum expected
count is .24.
b. 25 cells (100.0%) have expected count less than 5. The minimum expected
count is .07.
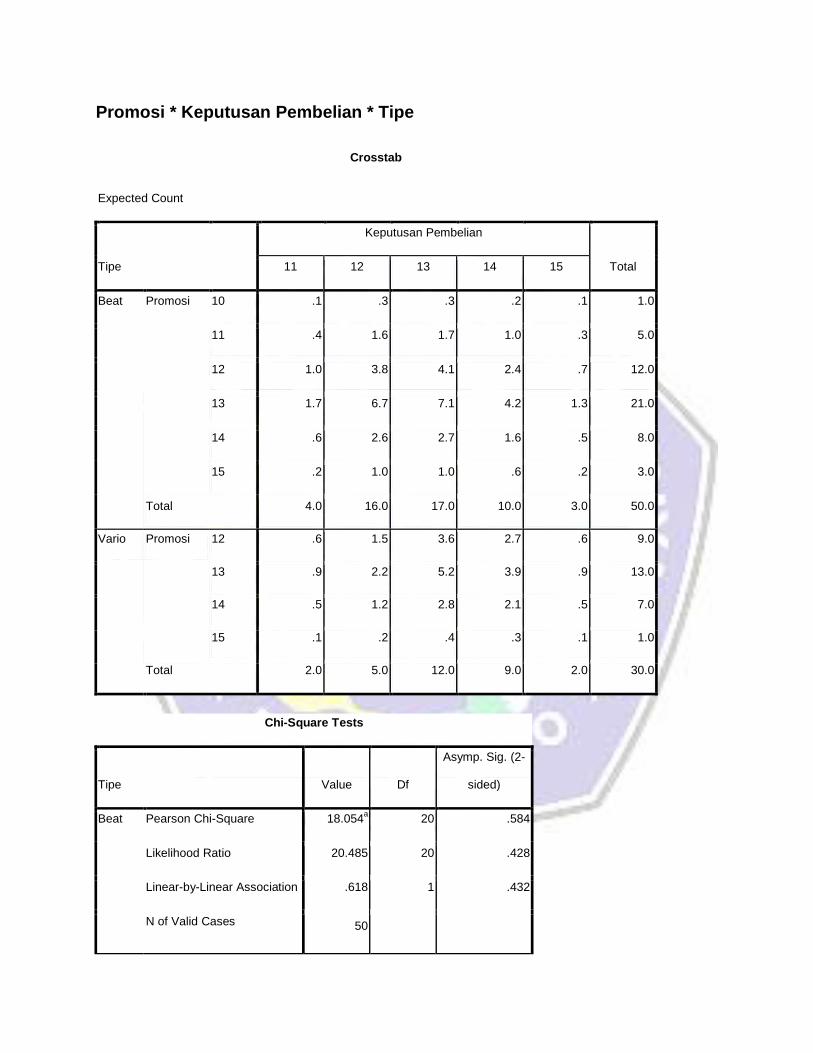
Promosi * Keputusan Pembelian * Tipe
Crosstab
Expected Count
Tipe
Keputusan Pembelian
Total 11 12 13 14 15
Beat Promosi 10 .1 .3 .3 .2 .1 1.0
11 .4 1.6 1.7 1.0 .3 5.0
12 1.0 3.8 4.1 2.4 .7 12.0
13 1.7 6.7 7.1 4.2 1.3 21.0
14 .6 2.6 2.7 1.6 .5 8.0
15 .2 1.0 1.0 .6 .2 3.0
Total 4.0 16.0 17.0 10.0 3.0 50.0
Vario Promosi 12 .6 1.5 3.6 2.7 .6 9.0
13 .9 2.2 5.2 3.9 .9 13.0
14 .5 1.2 2.8 2.1 .5 7.0
15 .1 .2 .4 .3 .1 1.0
Total 2.0 5.0 12.0 9.0 2.0 30.0
Chi-Square Tests
Tipe Value Df
Asymp. Sig. (2-
sided)
Beat Pearson Chi-Square 18.054a 20 .584
Likelihood Ratio 20.485 20 .428
Linear-by-Linear Association .618 1 .432
N of Valid Cases 50

Vario Pearson Chi-Square 12.861b 12 .379
Likelihood Ratio 15.084 12 .237
Linear-by-Linear Association .000 1 1.000
N of Valid Cases 30
a. 28 cells (93.3%) have expected count less than 5. The minimum expected
count is .06.
b. 19 cells (95.0%) have expected count less than 5. The minimum expected
count is .07.