Lampiran 1. Ethical clearance - core.ac.uk · kalsifikasi intrakranial, ventrikulomegali, atrofi...
20
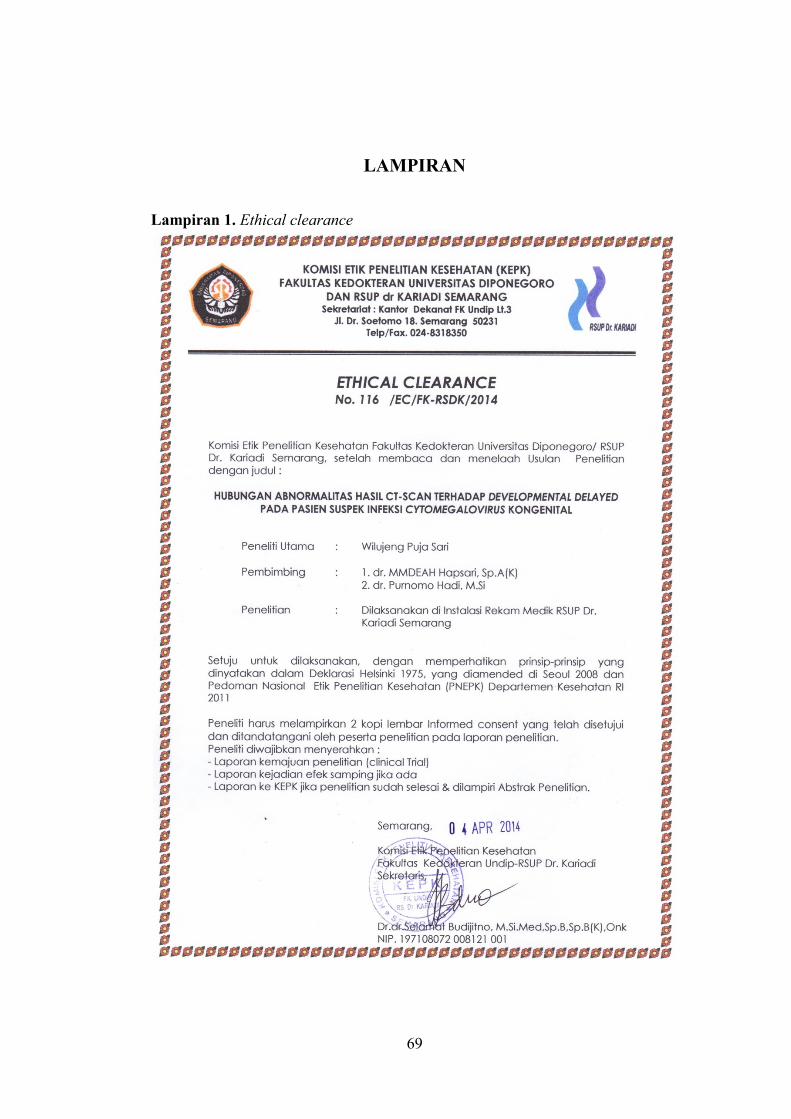
69 LAMPIRAN Lampiran 1. Ethical clearance
-
Upload
nguyenhanh -
Category
Documents
-
view
237 -
download
0
Transcript of Lampiran 1. Ethical clearance - core.ac.uk · kalsifikasi intrakranial, ventrikulomegali, atrofi...
69
LAMPIRAN
Lampiran 1. Ethical clearance
70
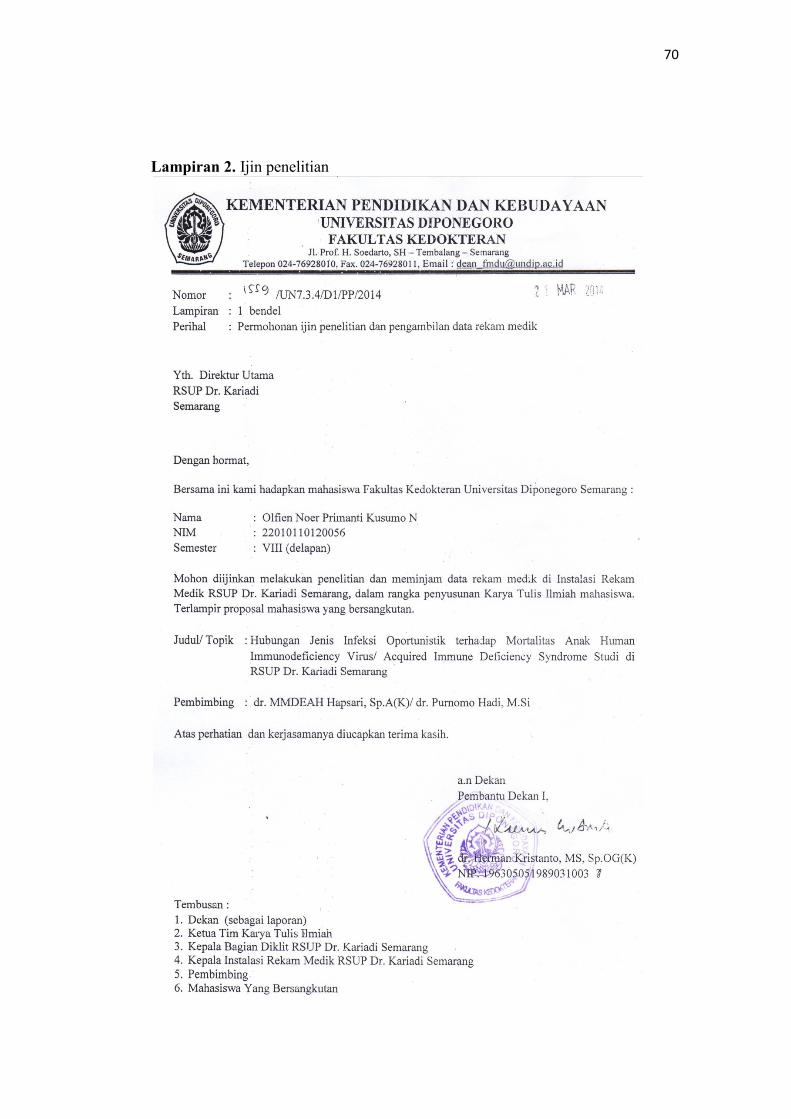
Lampiran 2. Ijin penelitian
71
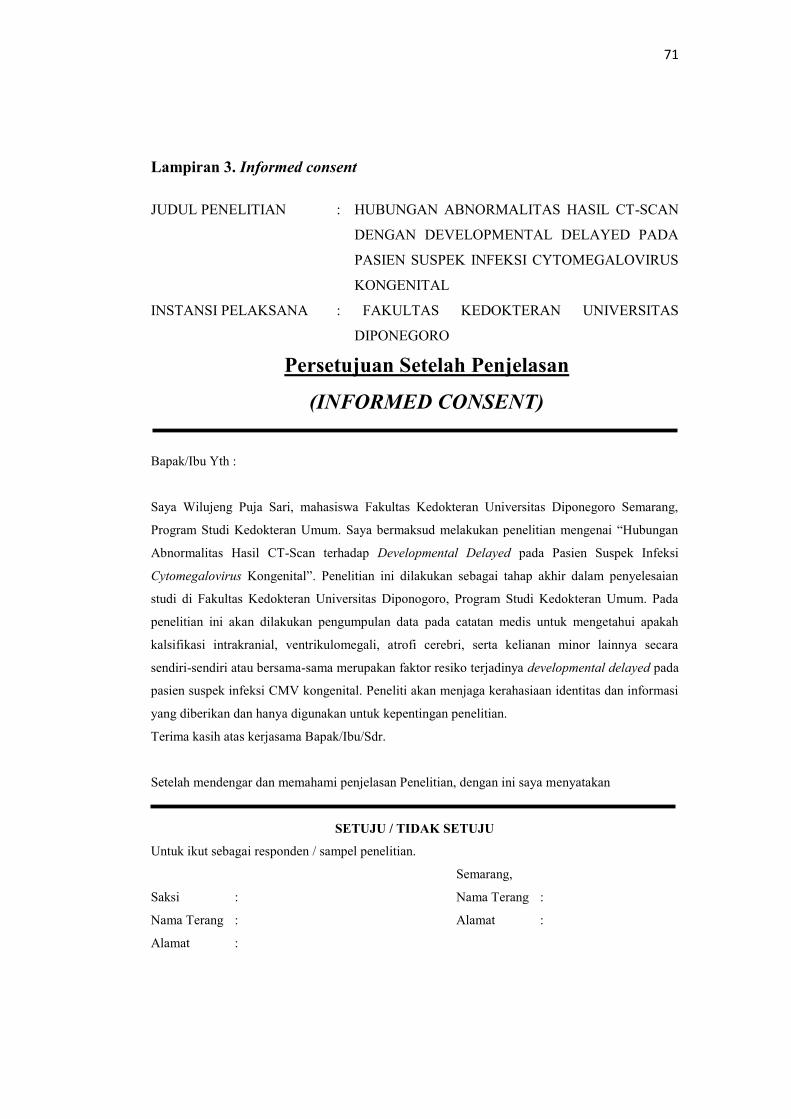
Lampiran 3. Informed consent
JUDUL PENELITIAN : HUBUNGAN ABNORMALITAS HASIL CT-SCAN
DENGAN DEVELOPMENTAL DELAYED PADA
PASIEN SUSPEK INFEKSI CYTOMEGALOVIRUS
KONGENITAL
INSTANSI PELAKSANA : FAKULTAS KEDOKTERAN UNIVERSITAS
DIPONEGORO
Persetujuan Setelah Penjelasan
(INFORMED CONSENT)
Bapak/Ibu Yth :
Saya Wilujeng Puja Sari, mahasiswa Fakultas Kedokteran Universitas Diponegoro Semarang,
Program Studi Kedokteran Umum. Saya bermaksud melakukan penelitian mengenai “Hubungan
Abnormalitas Hasil CT-Scan terhadap Developmental Delayed pada Pasien Suspek Infeksi
Cytomegalovirus Kongenital”. Penelitian ini dilakukan sebagai tahap akhir dalam penyelesaian
studi di Fakultas Kedokteran Universitas Diponogoro, Program Studi Kedokteran Umum. Pada
penelitian ini akan dilakukan pengumpulan data pada catatan medis untuk mengetahui apakah
kalsifikasi intrakranial, ventrikulomegali, atrofi cerebri, serta kelianan minor lainnya secara
sendiri-sendiri atau bersama-sama merupakan faktor resiko terjadinya developmental delayed pada
pasien suspek infeksi CMV kongenital. Peneliti akan menjaga kerahasiaan identitas dan informasi
yang diberikan dan hanya digunakan untuk kepentingan penelitian.
Terima kasih atas kerjasama Bapak/Ibu/Sdr.
Setelah mendengar dan memahami penjelasan Penelitian, dengan ini saya menyatakan
SETUJU / TIDAK SETUJU
Untuk ikut sebagai responden / sampel penelitian.
Semarang,
Saksi : Nama Terang :
Nama Terang : Alamat :
Alamat :
72
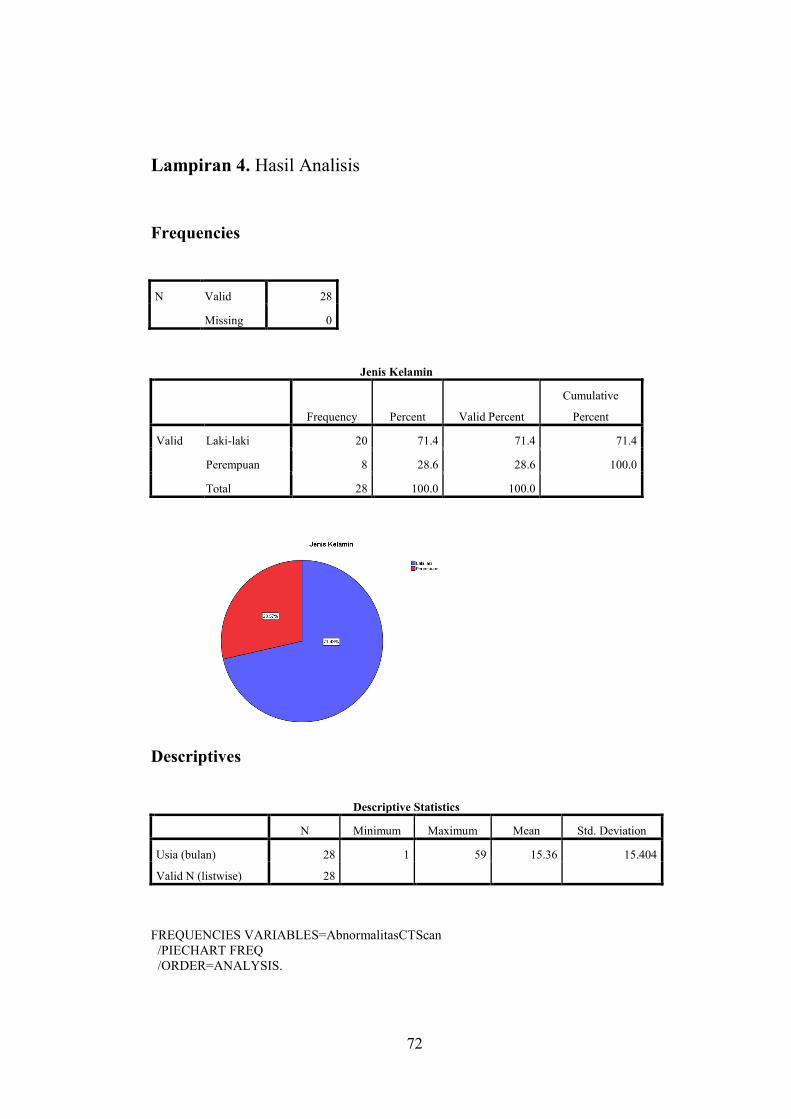
Lampiran 4. Hasil Analisis
Frequencies
Jenis Kelamin
Frequency Percent Valid Percent
Cumulative
Percent
Valid Laki-laki 20 71.4 71.4 71.4
Perempuan 8 28.6 28.6 100.0
Total 28 100.0 100.0
Descriptives
Descriptive Statistics
N Minimum Maximum Mean Std. Deviation
Usia (bulan) 28 1 59 15.36 15.404
Valid N (listwise) 28
FREQUENCIES VARIABLES=AbnormalitasCTScan
/PIECHART FREQ
/ORDER=ANALYSIS.
N Valid 28
Missing 0
73
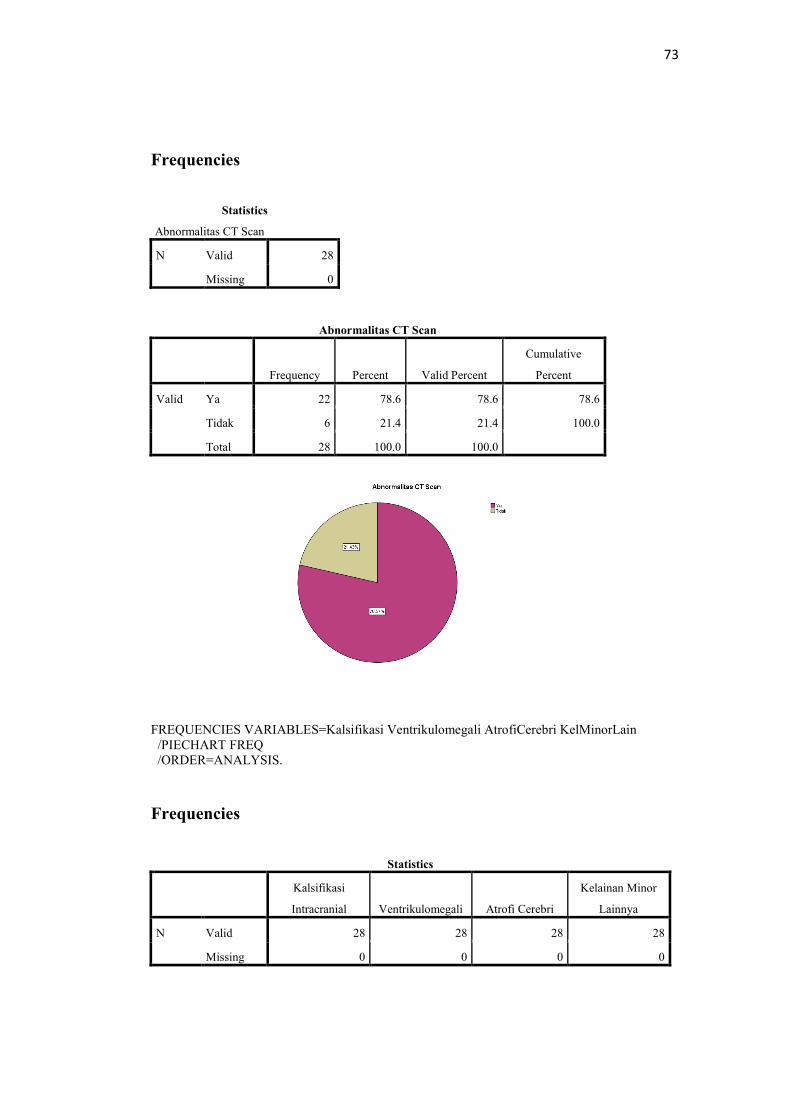
Frequencies
Statistics
Abnormalitas CT Scan
N Valid 28
Missing 0
Abnormalitas CT Scan
Frequency Percent Valid Percent
Cumulative
Percent
Valid Ya 22 78.6 78.6 78.6
Tidak 6 21.4 21.4 100.0
Total 28 100.0 100.0
FREQUENCIES VARIABLES=Kalsifikasi Ventrikulomegali AtrofiCerebri KelMinorLain
/PIECHART FREQ
/ORDER=ANALYSIS.
Frequencies
Statistics
Kalsifikasi
Intracranial Ventrikulomegali Atrofi Cerebri
Kelainan Minor
Lainnya
N Valid 28 28 28 28
Missing 0 0 0 0
74
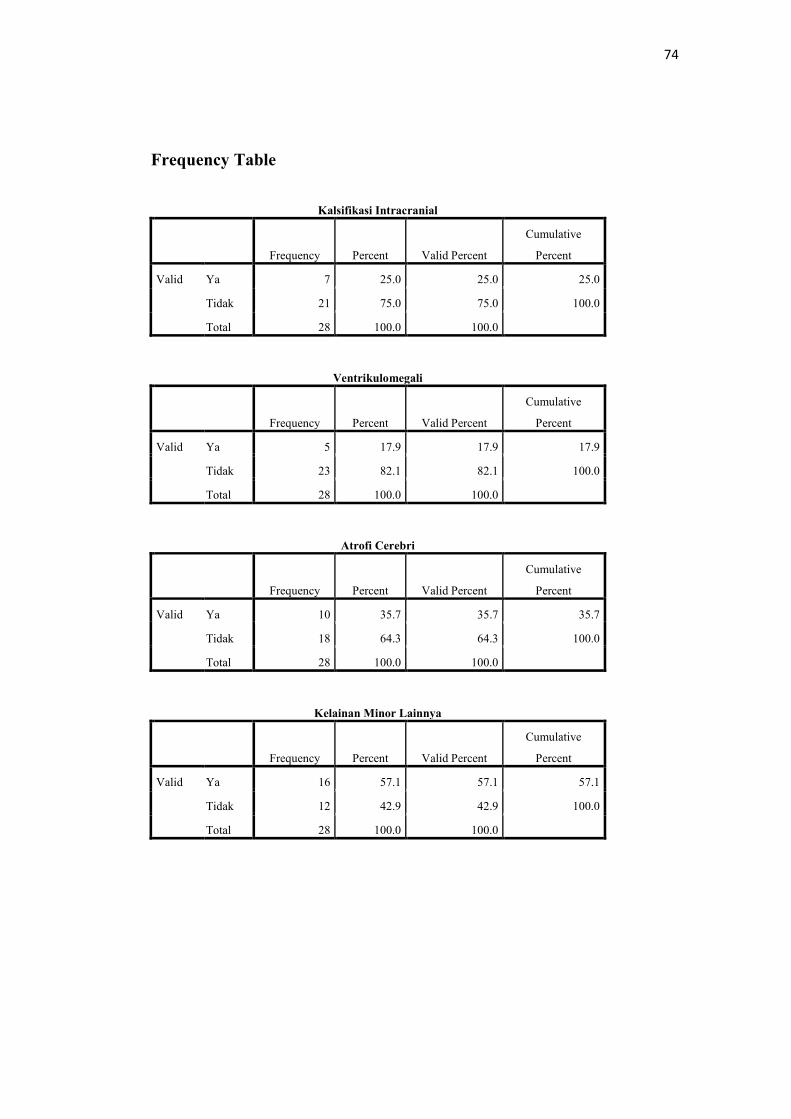
Frequency Table
Kalsifikasi Intracranial
Frequency Percent Valid Percent
Cumulative
Percent
Valid Ya 7 25.0 25.0 25.0
Tidak 21 75.0 75.0 100.0
Total 28 100.0 100.0
Ventrikulomegali
Frequency Percent Valid Percent
Cumulative
Percent
Valid Ya 5 17.9 17.9 17.9
Tidak 23 82.1 82.1 100.0
Total 28 100.0 100.0
Atrofi Cerebri
Frequency Percent Valid Percent
Cumulative
Percent
Valid Ya 10 35.7 35.7 35.7
Tidak 18 64.3 64.3 100.0
Total 28 100.0 100.0
Kelainan Minor Lainnya
Frequency Percent Valid Percent
Cumulative
Percent
Valid Ya 16 57.1 57.1 57.1
Tidak 12 42.9 42.9 100.0
Total 28 100.0 100.0
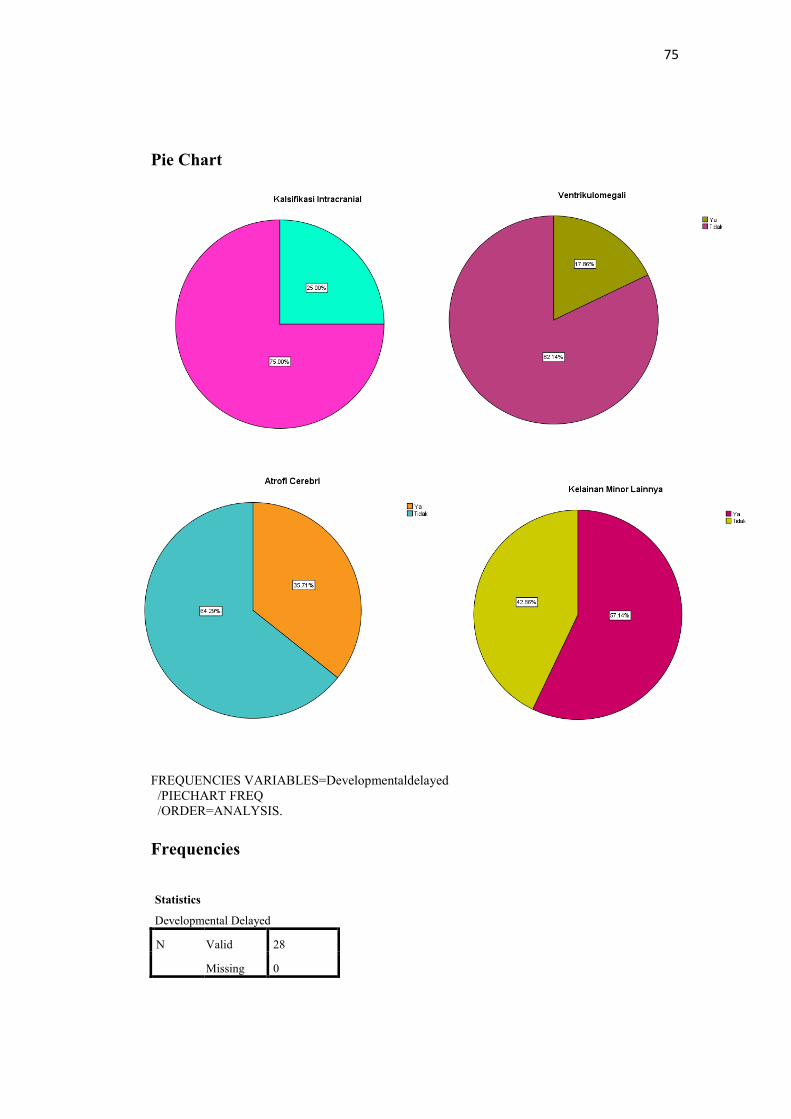
75
Pie Chart
FREQUENCIES VARIABLES=Developmentaldelayed
/PIECHART FREQ
/ORDER=ANALYSIS.
Frequencies
Statistics
Developmental Delayed
N Valid 28
Missing 0
76
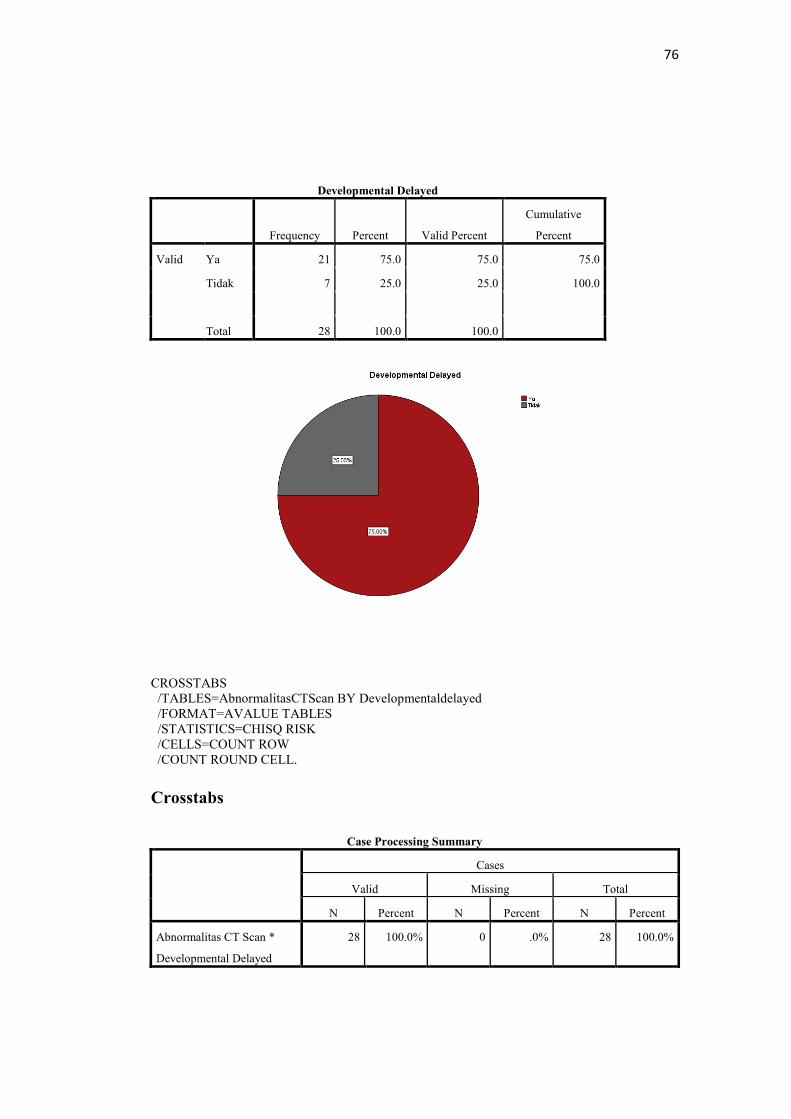
Developmental Delayed
Frequency Percent Valid Percent
Cumulative
Percent
Valid Ya 21 75.0 75.0 75.0
Tidak 7 25.0 25.0 100.0
Total 28 100.0 100.0
CROSSTABS
/TABLES=AbnormalitasCTScan BY Developmentaldelayed
/FORMAT=AVALUE TABLES
/STATISTICS=CHISQ RISK
/CELLS=COUNT ROW
/COUNT ROUND CELL.
Crosstabs
Case Processing Summary
Cases
Valid Missing Total
N Percent N Percent N Percent
Abnormalitas CT Scan *
Developmental Delayed
28 100.0% 0 .0% 28 100.0%
77
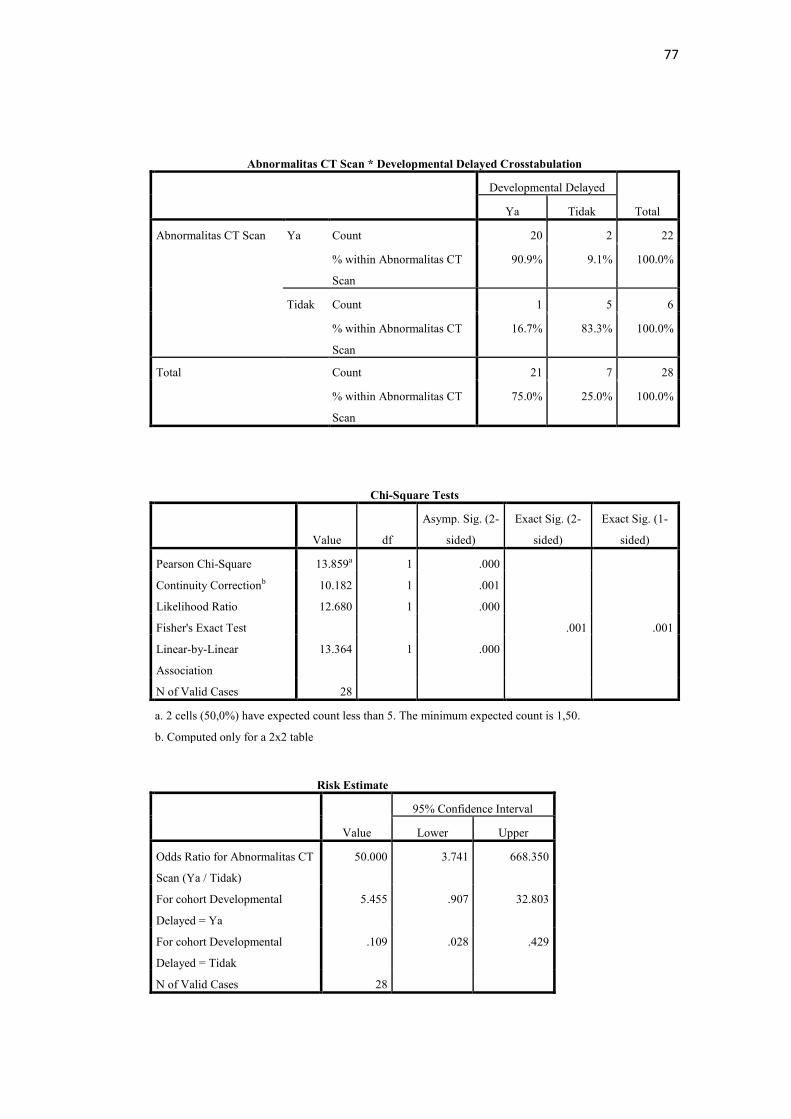
Abnormalitas CT Scan * Developmental Delayed Crosstabulation
Developmental Delayed
Total Ya Tidak
Abnormalitas CT Scan Ya Count 20 2 22
% within Abnormalitas CT
Scan
90.9% 9.1% 100.0%
Tidak Count 1 5 6
% within Abnormalitas CT
Scan
16.7% 83.3% 100.0%
Total Count 21 7 28
% within Abnormalitas CT
Scan
75.0% 25.0% 100.0%
Chi-Square Tests
Value df
Asymp. Sig. (2-
sided)
Exact Sig. (2-
sided)
Exact Sig. (1-
sided)
Pearson Chi-Square 13.859a 1 .000
Continuity Correctionb 10.182 1 .001
Likelihood Ratio 12.680 1 .000
Fisher's Exact Test .001 .001
Linear-by-Linear
Association
13.364 1 .000
N of Valid Cases 28
a. 2 cells (50,0%) have expected count less than 5. The minimum expected count is 1,50.
b. Computed only for a 2x2 table
Risk Estimate
Value
95% Confidence Interval
Lower Upper
Odds Ratio for Abnormalitas CT
Scan (Ya / Tidak)
50.000 3.741 668.350
For cohort Developmental
Delayed = Ya
5.455 .907 32.803
For cohort Developmental
Delayed = Tidak
.109 .028 .429
N of Valid Cases 28
78
CROSSTABS
/TABLES=Kalsifikasi BY Developmentaldelayed
/FORMAT=AVALUE TABLES
/STATISTICS=CHISQ RISK
/CELLS=COUNT ROW
/COUNT ROUND CELL.
Crosstabs
Case Processing Summary
Cases
Valid Missing Total
N Percent N Percent N Percent
Kalsifikasi Intracranial *
Developmental Delayed
28 100.0% 0 .0% 28 100.0%
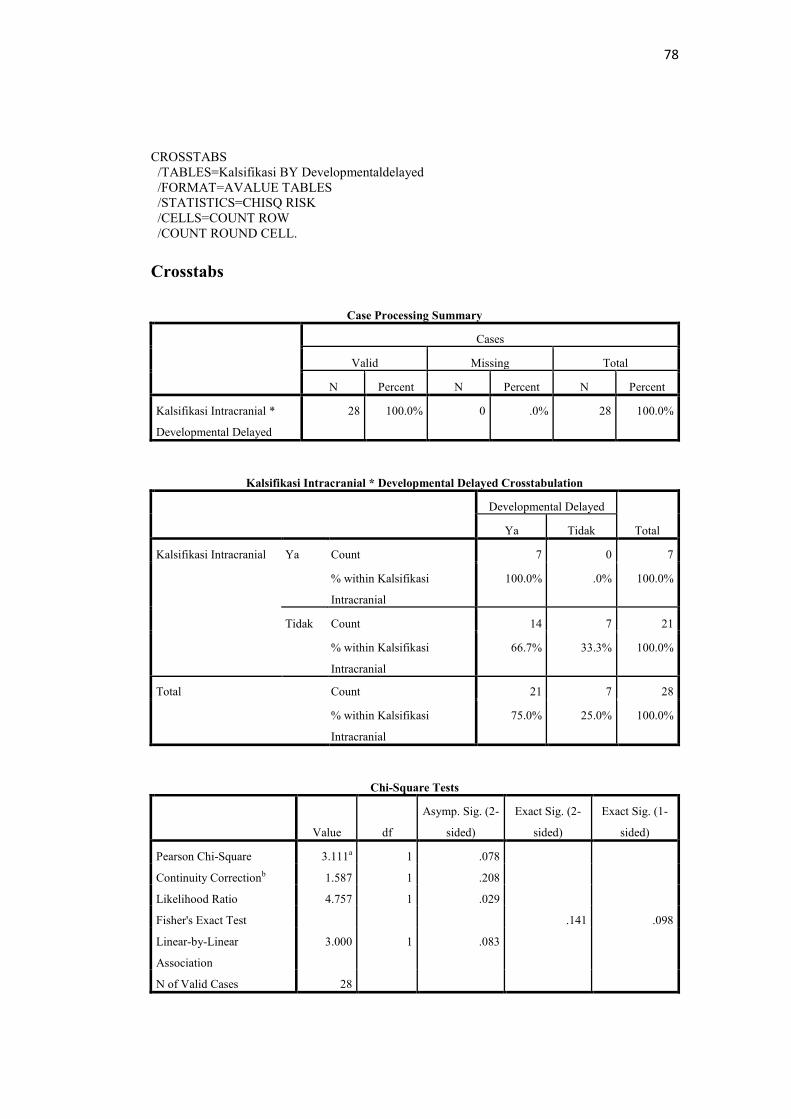
Kalsifikasi Intracranial * Developmental Delayed Crosstabulation
Developmental Delayed
Total Ya Tidak
Kalsifikasi Intracranial Ya Count 7 0 7
% within Kalsifikasi
Intracranial
100.0% .0% 100.0%
Tidak Count 14 7 21
% within Kalsifikasi
Intracranial
66.7% 33.3% 100.0%
Total Count 21 7 28
% within Kalsifikasi
Intracranial
75.0% 25.0% 100.0%
Chi-Square Tests
Value df
Asymp. Sig. (2-
sided)
Exact Sig. (2-
sided)
Exact Sig. (1-
sided)
Pearson Chi-Square 3.111a 1 .078
Continuity Correctionb 1.587 1 .208
Likelihood Ratio 4.757 1 .029
Fisher's Exact Test .141 .098
Linear-by-Linear
Association
3.000 1 .083
N of Valid Cases 28
79
a. 1 cells (25,0%) have expected count less than 5. The minimum expected count is 1,75.
b. Computed only for a 2x2 table
CROSSTABS
/TABLES=Ventrikulomegali BY Developmentaldelayed
/FORMAT=AVALUE TABLES
/STATISTICS=CHISQ RISK
/CELLS=COUNT ROW
/COUNT ROUND CELL
Crosstabs
Case Processing Summary
Cases
Valid Missing Total
N Percent N Percent N Percent
Ventrikulomegali *
Developmental Delayed
28 100.0% 0 .0% 28 100.0%
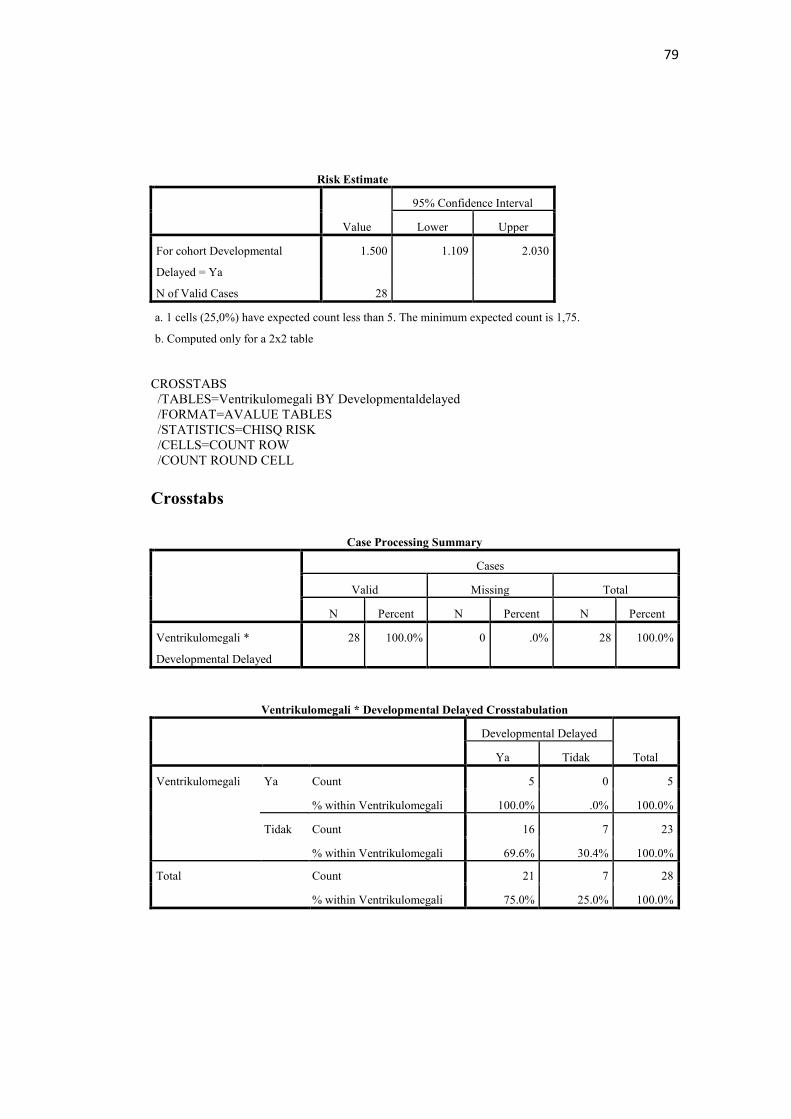
Ventrikulomegali * Developmental Delayed Crosstabulation
Developmental Delayed
Total Ya Tidak
Ventrikulomegali Ya Count 5 0 5
% within Ventrikulomegali 100.0% .0% 100.0%
Tidak Count 16 7 23
% within Ventrikulomegali 69.6% 30.4% 100.0%
Total Count 21 7 28
% within Ventrikulomegali 75.0% 25.0% 100.0%
Risk Estimate
Value
95% Confidence Interval
Lower Upper
For cohort Developmental
Delayed = Ya
1.500 1.109 2.030
N of Valid Cases 28
80
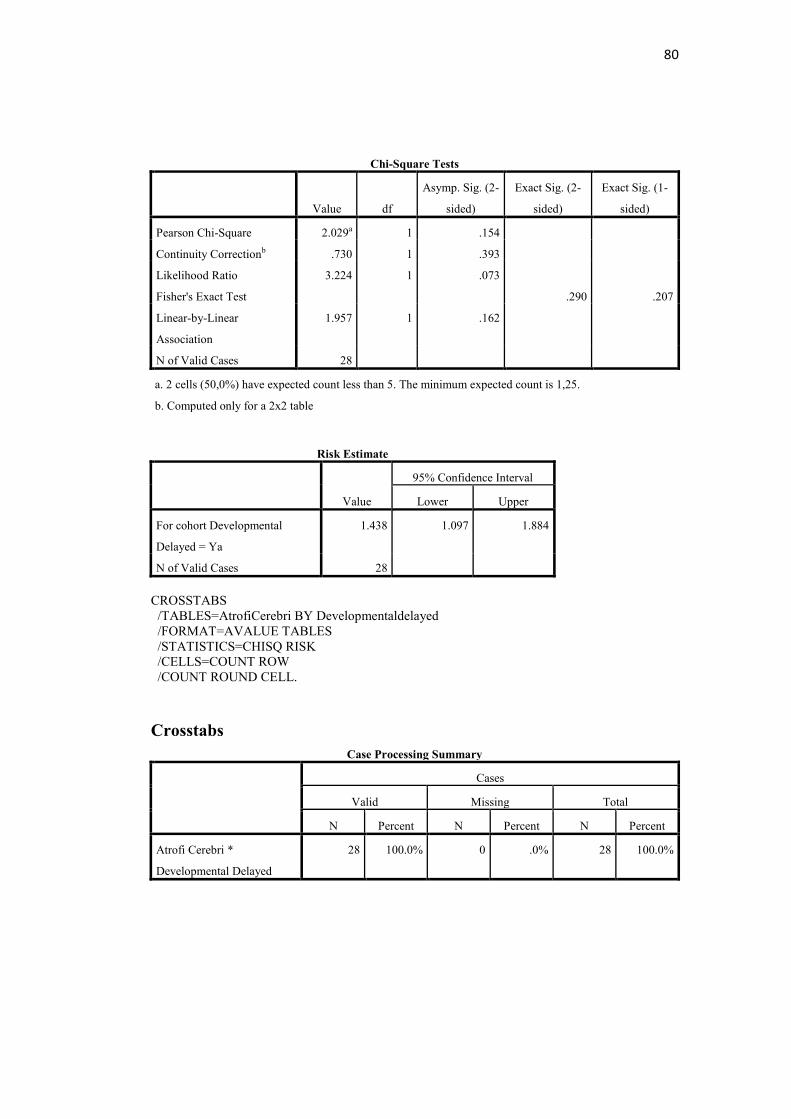
Chi-Square Tests
Value df
Asymp. Sig. (2-
sided)
Exact Sig. (2-
sided)
Exact Sig. (1-
sided)
Pearson Chi-Square 2.029a 1 .154
Continuity Correctionb .730 1 .393
Likelihood Ratio 3.224 1 .073
Fisher's Exact Test .290 .207
Linear-by-Linear
Association
1.957 1 .162
N of Valid Cases 28
a. 2 cells (50,0%) have expected count less than 5. The minimum expected count is 1,25.
b. Computed only for a 2x2 table
Risk Estimate
Value
95% Confidence Interval
Lower Upper
For cohort Developmental
Delayed = Ya
1.438 1.097 1.884
N of Valid Cases 28
CROSSTABS
/TABLES=AtrofiCerebri BY Developmentaldelayed
/FORMAT=AVALUE TABLES
/STATISTICS=CHISQ RISK
/CELLS=COUNT ROW
/COUNT ROUND CELL.
Crosstabs
Case Processing Summary
Cases
Valid Missing Total
N Percent N Percent N Percent
Atrofi Cerebri *
Developmental Delayed
28 100.0% 0 .0% 28 100.0%
81
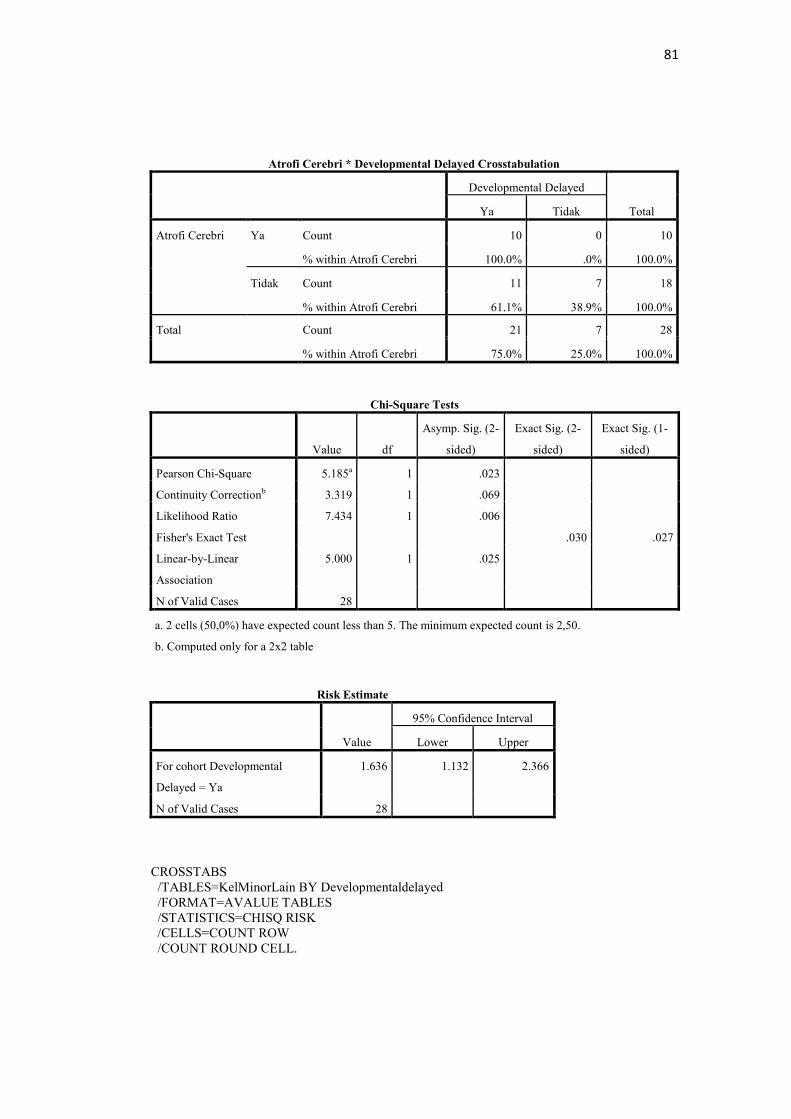
Atrofi Cerebri * Developmental Delayed Crosstabulation
Developmental Delayed
Total Ya Tidak
Atrofi Cerebri Ya Count 10 0 10
% within Atrofi Cerebri 100.0% .0% 100.0%
Tidak Count 11 7 18
% within Atrofi Cerebri 61.1% 38.9% 100.0%
Total Count 21 7 28
% within Atrofi Cerebri 75.0% 25.0% 100.0%
Chi-Square Tests
Value df
Asymp. Sig. (2-
sided)
Exact Sig. (2-
sided)
Exact Sig. (1-
sided)
Pearson Chi-Square 5.185a 1 .023
Continuity Correctionb 3.319 1 .069
Likelihood Ratio 7.434 1 .006
Fisher's Exact Test .030 .027
Linear-by-Linear
Association
5.000 1 .025
N of Valid Cases 28
a. 2 cells (50,0%) have expected count less than 5. The minimum expected count is 2,50.
b. Computed only for a 2x2 table
Risk Estimate
Value
95% Confidence Interval
Lower Upper
For cohort Developmental
Delayed = Ya
1.636 1.132 2.366
N of Valid Cases 28
CROSSTABS
/TABLES=KelMinorLain BY Developmentaldelayed
/FORMAT=AVALUE TABLES
/STATISTICS=CHISQ RISK
/CELLS=COUNT ROW
/COUNT ROUND CELL.
82
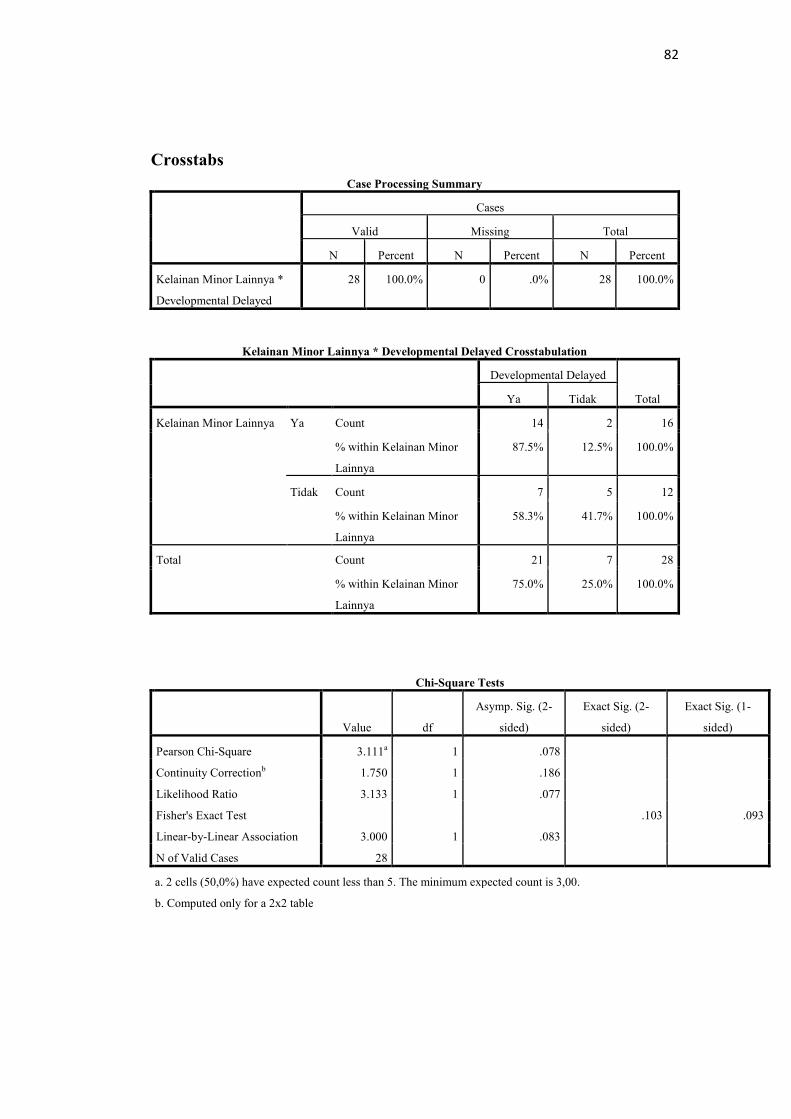
Crosstabs
Case Processing Summary
Cases
Valid Missing Total
N Percent N Percent N Percent
Kelainan Minor Lainnya *
Developmental Delayed
28 100.0% 0 .0% 28 100.0%
Kelainan Minor Lainnya * Developmental Delayed Crosstabulation
Developmental Delayed
Total Ya Tidak
Kelainan Minor Lainnya Ya Count 14 2 16
% within Kelainan Minor
Lainnya
87.5% 12.5% 100.0%
Tidak Count 7 5 12
% within Kelainan Minor
Lainnya
58.3% 41.7% 100.0%
Total Count 21 7 28
% within Kelainan Minor
Lainnya
75.0% 25.0% 100.0%
Chi-Square Tests
Value df
Asymp. Sig. (2-
sided)
Exact Sig. (2-
sided)
Exact Sig. (1-
sided)
Pearson Chi-Square 3.111a 1 .078
Continuity Correctionb 1.750 1 .186
Likelihood Ratio 3.133 1 .077
Fisher's Exact Test .103 .093
Linear-by-Linear Association 3.000 1 .083
N of Valid Cases 28
a. 2 cells (50,0%) have expected count less than 5. The minimum expected count is 3,00.
b. Computed only for a 2x2 table
83
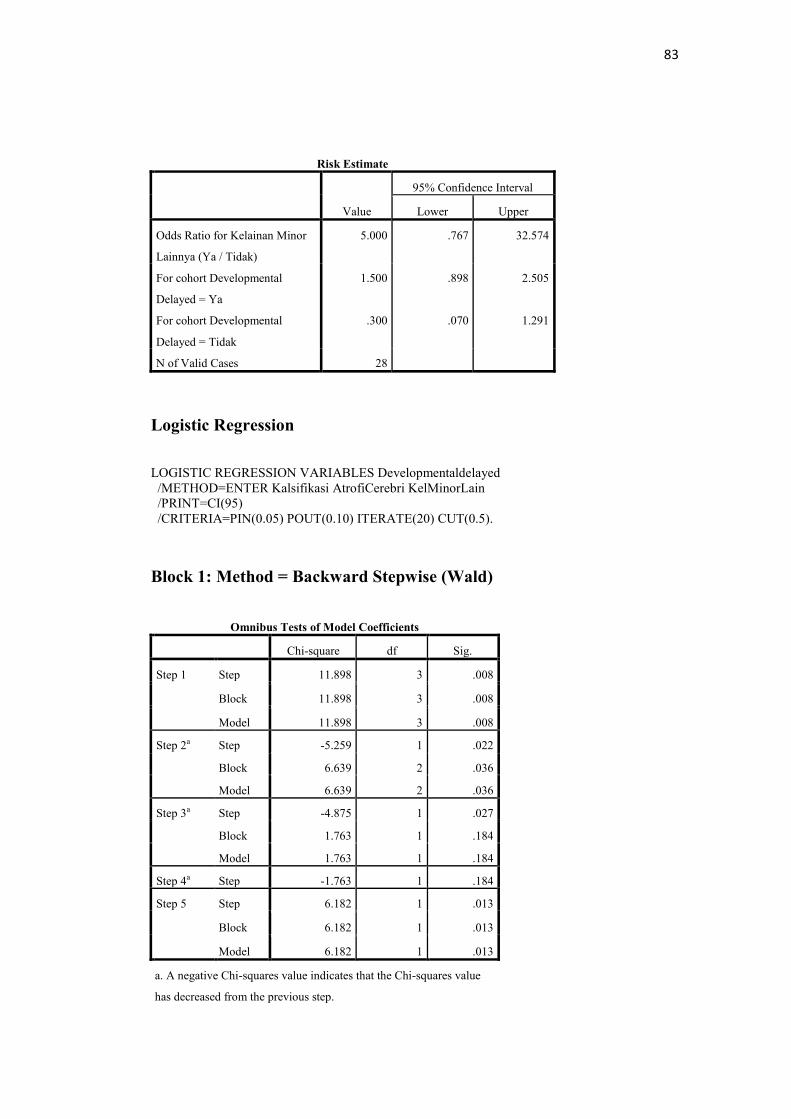
Risk Estimate
Value
95% Confidence Interval
Lower Upper
Odds Ratio for Kelainan Minor
Lainnya (Ya / Tidak)
5.000 .767 32.574
For cohort Developmental
Delayed = Ya
1.500 .898 2.505
For cohort Developmental
Delayed = Tidak
.300 .070 1.291
N of Valid Cases 28
Logistic Regression
LOGISTIC REGRESSION VARIABLES Developmentaldelayed
/METHOD=ENTER Kalsifikasi AtrofiCerebri KelMinorLain
/PRINT=CI(95)
/CRITERIA=PIN(0.05) POUT(0.10) ITERATE(20) CUT(0.5).
Block 1: Method = Backward Stepwise (Wald)
Omnibus Tests of Model Coefficients
Chi-square df Sig.
Step 1 Step 11.898 3 .008
Block 11.898 3 .008
Model 11.898 3 .008
Step 2a Step -5.259 1 .022
Block 6.639 2 .036
Model 6.639 2 .036
Step 3a Step -4.875 1 .027
Block 1.763 1 .184
Model 1.763 1 .184
Step 4a Step -1.763 1 .184
Step 5 Step 6.182 1 .013
Block 6.182 1 .013
Model 6.182 1 .013
a. A negative Chi-squares value indicates that the Chi-squares value
has decreased from the previous step.
84
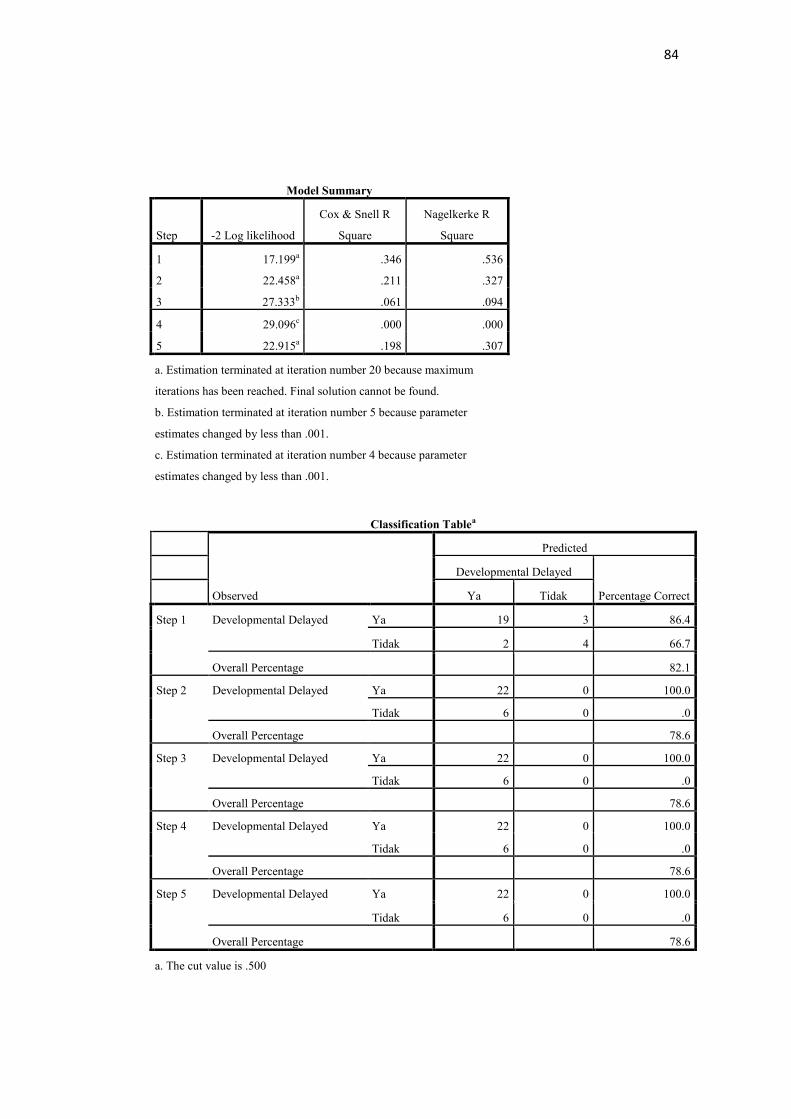
Model Summary
Step -2 Log likelihood
Cox & Snell R
Square
Nagelkerke R
Square
1 17.199a .346 .536
2 22.458a .211 .327
3 27.333b .061 .094
4 29.096c .000 .000
5 22.915a .198 .307
a. Estimation terminated at iteration number 20 because maximum
iterations has been reached. Final solution cannot be found.
b. Estimation terminated at iteration number 5 because parameter
estimates changed by less than .001.
c. Estimation terminated at iteration number 4 because parameter
estimates changed by less than .001.
Classification Tablea
Observed
Predicted
Developmental Delayed
Percentage Correct
Ya Tidak
Step 1 Developmental Delayed Ya 19 3 86.4
Tidak 2 4 66.7
Overall Percentage 82.1
Step 2 Developmental Delayed Ya 22 0 100.0
Tidak 6 0 .0
Overall Percentage 78.6
Step 3 Developmental Delayed Ya 22 0 100.0
Tidak 6 0 .0
Overall Percentage 78.6
Step 4 Developmental Delayed Ya 22 0 100.0
Tidak 6 0 .0
Overall Percentage 78.6
Step 5 Developmental Delayed Ya 22 0 100.0
Tidak 6 0 .0
Overall Percentage 78.6
a. The cut value is .500
85
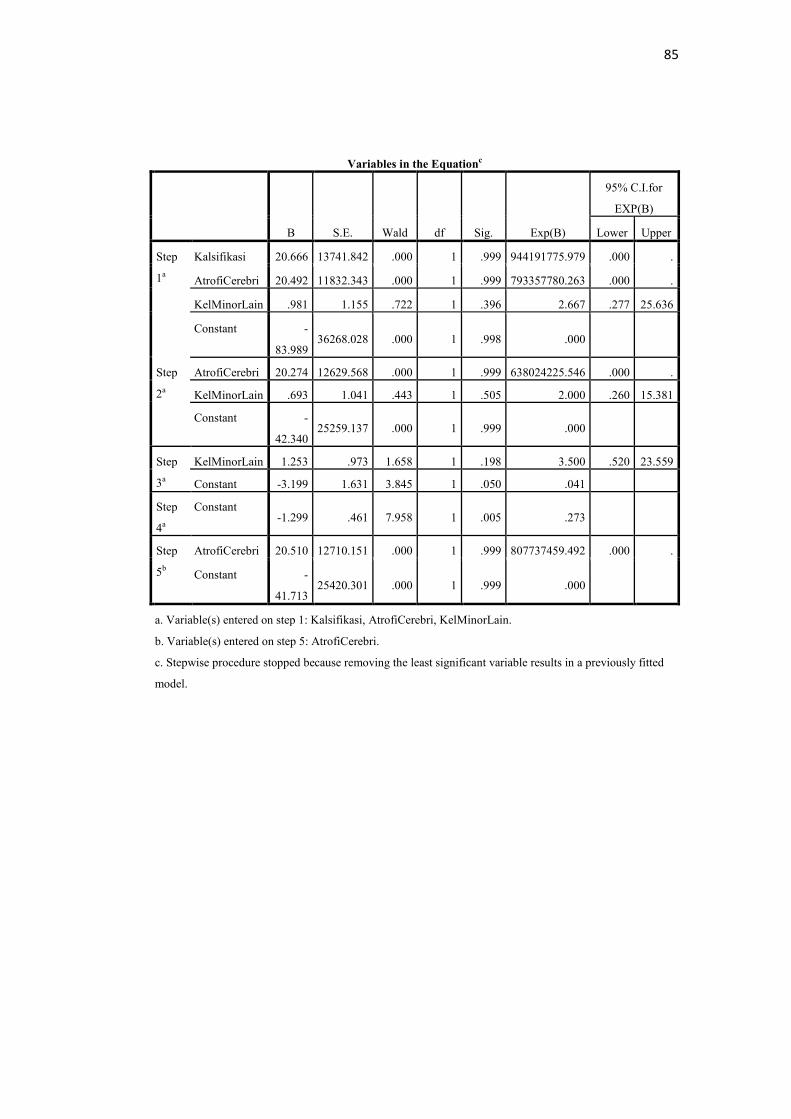
Variables in the Equationc
B S.E. Wald df Sig. Exp(B)
95% C.I.for
EXP(B)
Lower Upper
Step
1a
Kalsifikasi 20.666 13741.842 .000 1 .999 944191775.979 .000 .
AtrofiCerebri 20.492 11832.343 .000 1 .999 793357780.263 .000 .
KelMinorLain .981 1.155 .722 1 .396 2.667 .277 25.636
Constant -
83.989 36268.028 .000 1 .998 .000
Step
2a
AtrofiCerebri 20.274 12629.568 .000 1 .999 638024225.546 .000 .
KelMinorLain .693 1.041 .443 1 .505 2.000 .260 15.381
Constant -
42.340 25259.137 .000 1 .999 .000
Step
3a
KelMinorLain 1.253 .973 1.658 1 .198 3.500 .520 23.559
Constant -3.199 1.631 3.845 1 .050 .041
Step
4a
Constant -1.299 .461 7.958 1 .005 .273
Step
5b
AtrofiCerebri 20.510 12710.151 .000 1 .999 807737459.492 .000 .
Constant -
41.713 25420.301 .000 1 .999 .000
a. Variable(s) entered on step 1: Kalsifikasi, AtrofiCerebri, KelMinorLain.
b. Variable(s) entered on step 5: AtrofiCerebri.
c. Stepwise procedure stopped because removing the least significant variable results in a previously fitted
model.
86
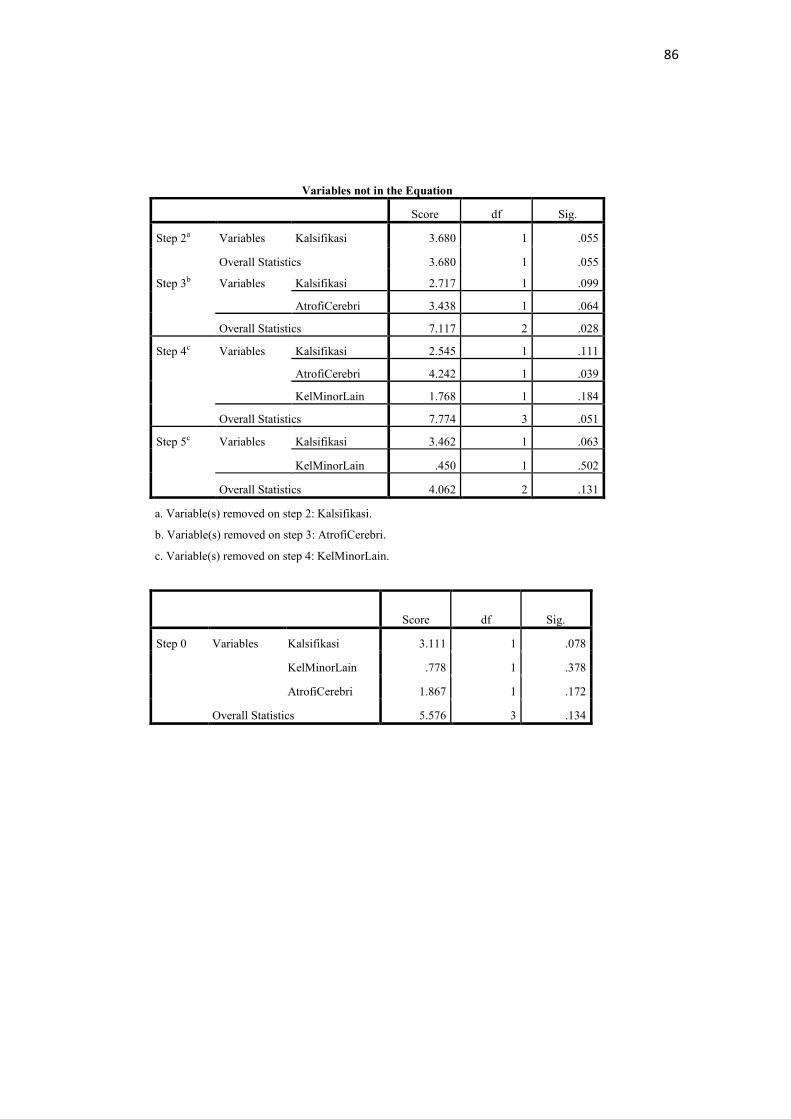
Variables not in the Equation
Score df Sig.
Step 2a Variables Kalsifikasi 3.680 1 .055
Overall Statistics 3.680 1 .055
Step 3b Variables Kalsifikasi 2.717 1 .099
AtrofiCerebri 3.438 1 .064
Overall Statistics 7.117 2 .028
Step 4c Variables Kalsifikasi 2.545 1 .111
AtrofiCerebri 4.242 1 .039
KelMinorLain 1.768 1 .184
Overall Statistics 7.774 3 .051
Step 5c Variables Kalsifikasi 3.462 1 .063
KelMinorLain .450 1 .502
Overall Statistics 4.062 2 .131
a. Variable(s) removed on step 2: Kalsifikasi.
b. Variable(s) removed on step 3: AtrofiCerebri.
c. Variable(s) removed on step 4: KelMinorLain.
Score df Sig.
Step 0 Variables Kalsifikasi 3.111 1 .078
KelMinorLain .778 1 .378
AtrofiCerebri 1.867 1 .172
Overall Statistics 5.576 3 .134
87
Lampiran 5. Biodata
Identitas
Nama : Wilujeng Puja Sari
NIM : 22010110110042
Tempat / tanggal lahir : Samarinda / 30 Agustus 1992
Jenis Kelamin : Perempuan
Alamat : Jalan Panglima Batur Gg. 2 No. 31 Samarinda
Nomor HP : 085742470742
e-mail : [email protected]
Riwayat Pendidikan Formal
1. SD : SD Negeri 004 Samarinda Lulus tahun : 2004
2. SMP : SMP Negeri 1 Samarinda Lulus tahun : 2007
3. SMA : SMA Negeri 1 Samarinda Lulus tahun : 2010
4. Pendidikan Dokter – Fak. Kedokteran UNDIP Masuk tahun : 2010
88
Keanggotaan Organisasi
1. RISET - BEM KU FK UNDIP Tahun 2010 s/d 2011
2. RISET - HIMA KU UNDIP Tahun 2011 s/d 2012
3. PROJECT AFFAIR - HIMA KU UNDIP Tahun 2012 s/d 2013
4. MER-C SEMARANG Tahun 2013 s/d sekarang