KPI DAN BSC DEPLOYMENT - Riza Radyanto's … TRAINING BALANCED SCORECARD – PT INDONESIA POWER...
14
MATERI TRAINING BALANCED SCORECARD – PT INDONESIA POWER KPI DAN BSC DEPLOYMENT M Riza Radyanto – Management Consultant / LEPKIN
Transcript of KPI DAN BSC DEPLOYMENT - Riza Radyanto's … TRAINING BALANCED SCORECARD – PT INDONESIA POWER...

MATERI TRAINING BALANCED SCORECARD – PT INDONESIA POWER
KPI DAN BSC DEPLOYMENT
M Riza Radyanto – Management Consultant / LEPKIN
2
MATERI TRAINING BALANCED SCORECARD – PT INDONESIA POWER
Bila anda dapat mengukur apa yang sedang anda bicarakan dan kerjakan dan menyatakannya dalam bentuk angka angka , maka anda mengetahui sesuatu tentang itu .
Bila anda tidak dapat mengukurnya dan tidak dapat menyatakannya dalam bentuk angka , maka pengetahuan anda tidak lengkapLord Kelvin , Ilmuwan Fisika Inggris - 1891
PERFORMANCE MEASUREMENT MODEL
Kinerja Keseluruhan
Keadaan Sekarang
Keadaan Akan Datang
BASELINE TARGET
KondisiSekarang
KPI KPI
PENENTUAN KPI
M Riza Radyanto - LEPKIN

3
MATERI TRAINING BALANCED SCORECARD – PT INDONESIA POWER
Perspektif :Keuangan / Pelanggan / Bisnis Internal / PembelajaranStrategic Objective: Tujuan strategis ?Measurement Type: Lag indicator or Leading Indicator
Frequency of Update: hourly,daily,weekly,yearly
Units of Measure:Rp , $ , menit , meter , kg
Measurement Definition/Formula: Definisi atau penjelasan dari formula
Source For and Approach to Setting Targets: Identifies the report, document, system or individual from which the information will be obtained Target Setting Responsibility:Person
Tracking / Reporting Responsibility:Person
Measure Availability: dateTarget: date
Accountability for Meeting Target: Person
Notes/Assumptions: • Clarifies terms in the formula as necessary• Highlights key assumptions underlying the
formula
Measurement Information Is:___ Currently Available___ Available With Minor Changes
Data Elements and Sources: The data elements required to calculate this measure and the source systems, databases, documents, etc. of those data elements
2006 Actual 2006 Proj. 2007 2008
Lists numerical targets by year for the various component of the formula where relevant. For 2000 list targets by quarter and year.
1Q2Q3Q4QFull Year
Target
Next Steps: Describes the plan to overcome any deficiencies in getting the required data
PENENTUAN KPILANGKAH LANGKAH DALAM MELAKUKAN PENGUKURAN BSC:
1. Mendefinisikan pengukuran setiap tujuan strategis – strategic objectives2. Mendefinisikan data sumber pengukuran3. Mendefinisikan bagaimana pengukuran itu dihasilkan
M Riza Radyanto - LEPKIN
MATERI TRAINING BALANCED SCORECARD – PT INDONESIA POWER PENJABARAN B.S.C
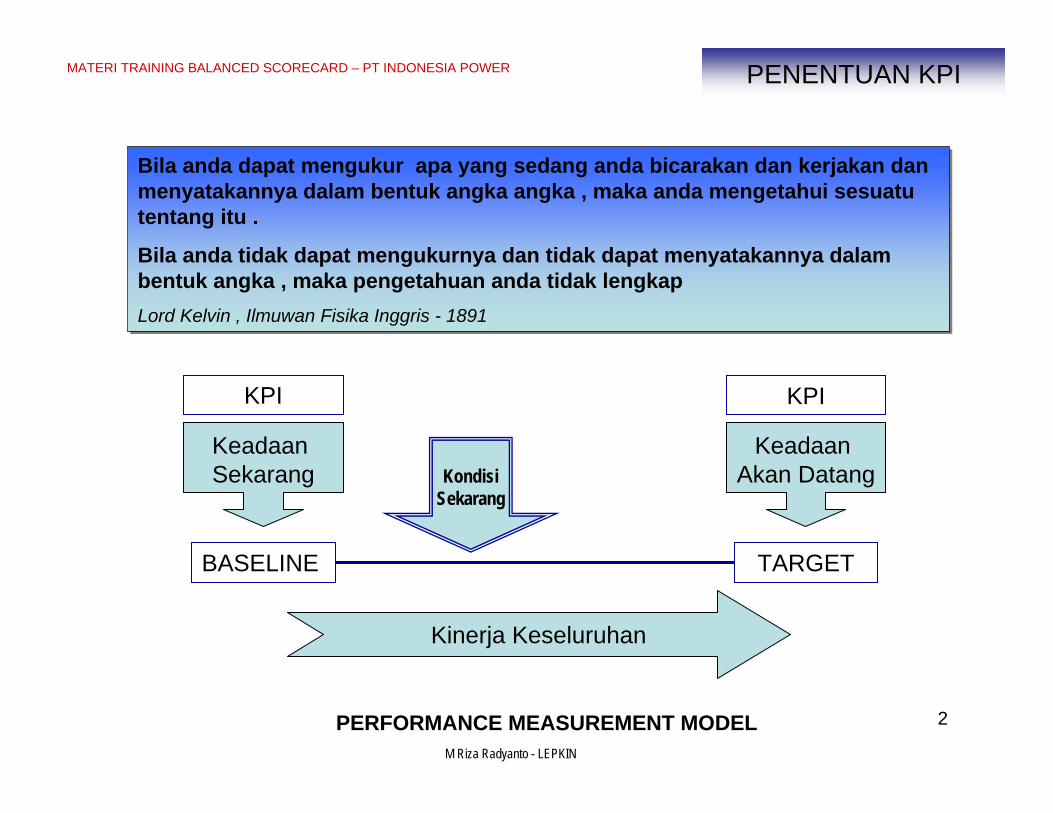
TEAM / INDIVIDUAL
SCORECARD
DEPARTMENT SCORECARD
BUSINESS UNIT
CORPORATE
REVIEWIMPLEMENTASIINTEGRASIRENCANASTRATEGIBALANCED SCORECARD
BALANCED SCORECARD DEPLOYMENT – PENJABARAN BSC
Rencana strategik korporat
Program utama,proyek
peningkatan kinerja
Visi ,Misi rencana trategis
Target Korporat
Business Unit Scorecard
Revisi & Persetujuan
Department Scorecard
Revisi & Persetujuan
Individual Scorecard
Revisi & Persetujuan
Review & Perbaikan
Berkelanjutan
Review & Perbaikan
Berkelanjutan
Review & Perbaikan
Berkelanjutan
Review & Perbaikan
Berkelanjutan
Program Manajemen – TQM , ISO etc
Program Manajemen – TQM , ISO etc
Program Manajemen – TQM , ISO etc
M Riza Radyanto - LEPKIN4
5
MATERI TRAINING BALANCED SCORECARD – PT INDONESIA POWER
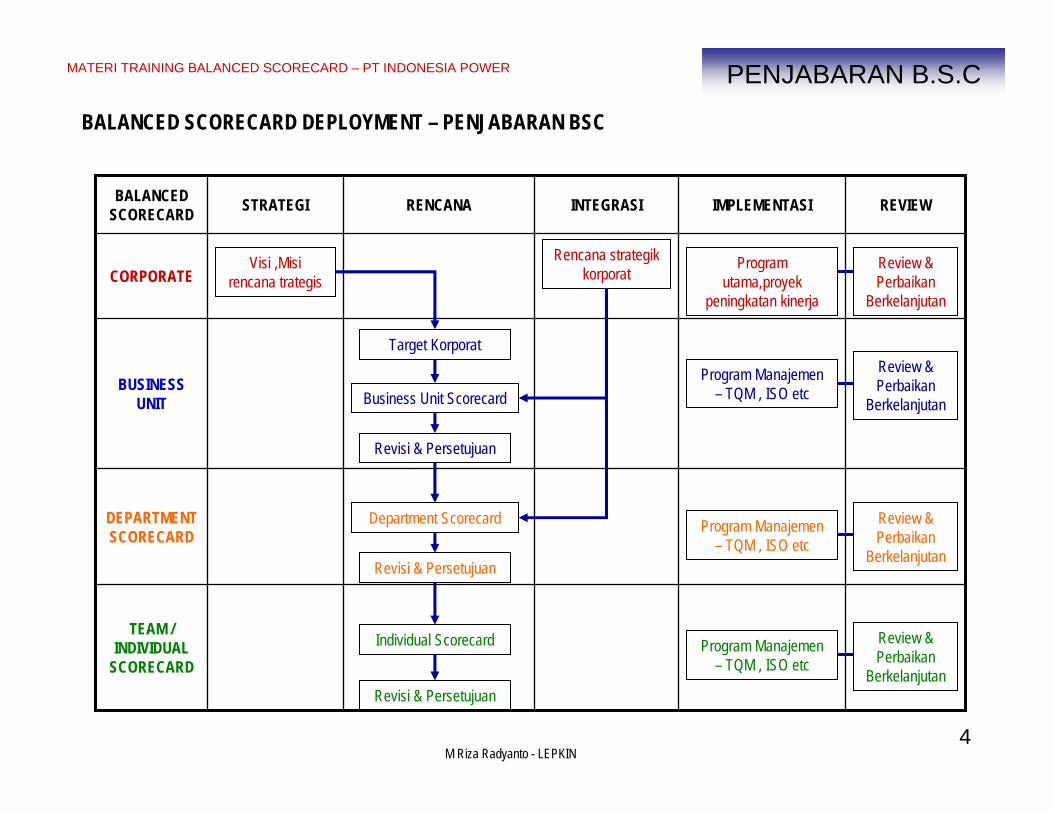
• Customer retention
• First Pass Yield• Schedule
Adherence
• Line Availability• Schedule adherence
• On time delivery
Customer Perspective Financial PerspectiveCorporate
Division
VP of Operations
• Operating Margin
Plant Manager
Shift Supervisor
• Variable Costs• Manufacturing Overhead
• Scrap rate• Labor/Unit
• CustomerSatisfaction
• Variable Costs• Period Expenses
• Operating Margin
•Sasaran dan tujuan individual harus selaras dan konsisten dengan sasaran korporat secara menyeluruh ,seperti skema di bawah yang terdiri dari 2 perspektif .
•‘Garis merah ‘ menunjukkan keselerasan mulai dari korporat hingga individual untuk perspektif pelanggan dan finansial .
PENJABARAN B.S.C

MATERI TRAINING BALANCED SCORECARD – PT INDONESIA POWER
Corporate Measures Balanced Scorecard Business Unit Measures Individual Goals
2003 2004 2005 2006 2007
100 120 160 180 250
100 450 200 210 225
100 85 80 75 70
100 75 73 70 64
100 97 93 90 82
100 105 108 109 110
Targets
Targets Financial
Operating
2003 2004 2005 2006 2007
Targets
Targets
•Earnings / Penerimaan
•Net Cash Flow / Arus Kas
•Overhead & Operating Expense / Total Biaya
•Overhead & Operating Costs
•Finding & Development Costs
•Total Annual Production (Indexed: 1993=100)
And Near Term Action Steps
1.
2.
3.
4.
5.
Corporate Objectives Individual Measures
1.2.3.
4.5.
•Double our value in 10 years.• Increase our earnings by an average of 20% a year
•Achieve an internal rate of return 2% above the cost of capital.
•Reduce our overhead & operating costs by a further 30% by 2007
•Reduce our 5-year average finding & development costs by 20%.
•Reach the top quartile of industry profitability by 2007
• Increase production by 10% by 2007
Name:
Location:
SCORECARD YANG MENGAITKAN SASARAN KORPORAT DENGAN TUJUAN TIM / INDIVIDUAL
PENJABARAN B.S.C
6M Riza Radyanto - LEPKIN
MATERI TRAINING BALANCED SCORECARD – PT INDONESIA POWER
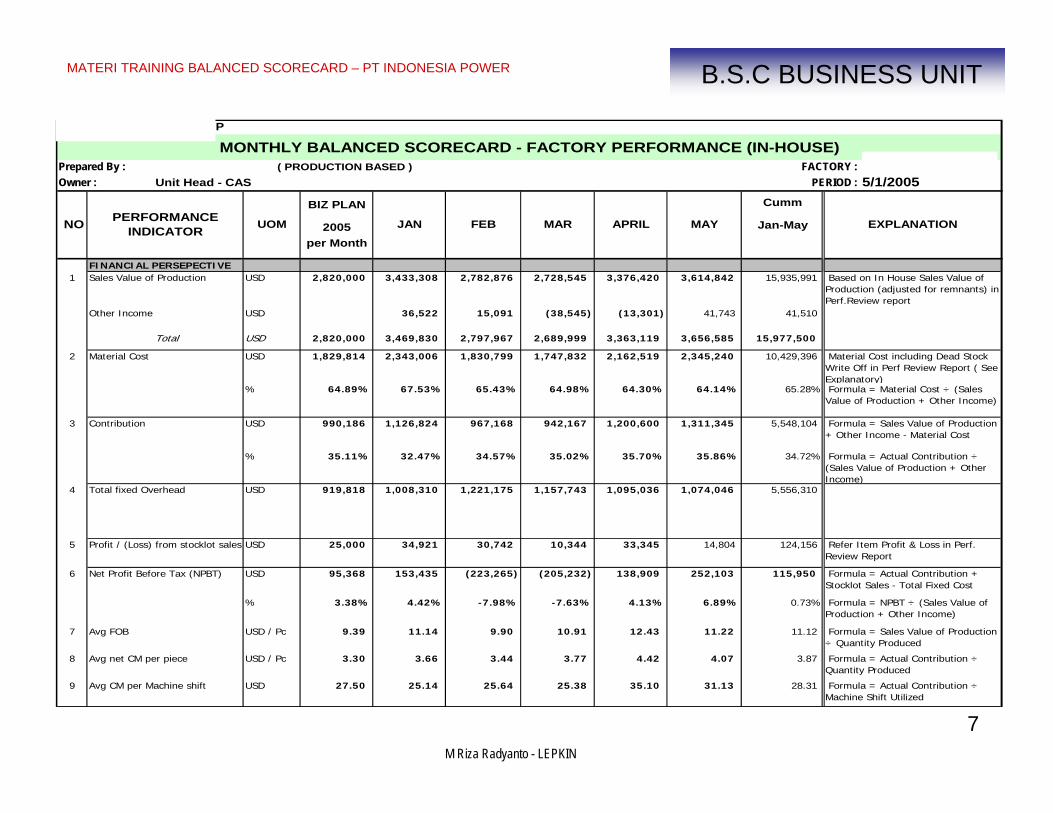
MONTHLY BALANCED SCORECARD - FACTORY PERFORMANCE (IN-HOUSE)Prepared By : FACTORY : CITRA ABADI SEJATIOwner : Unit Head - CAS PERIOD : 5/1/2005
BIZ PLAN Cumm
2005 Jan-Mayper Month
FINANCIAL PERSEPECTIVE1 Sales Value of Production USD 2,820,000 3,433,308 2,782,876 2,728,545 3,376,420 3,614,842 15,935,991
Other Income USD 36,522 15,091 (38,545) (13,301) 41,743 41,510
Total USD 2,820,000 3,469,830 2,797,967 2,689,999 3,363,119 3,656,585 15,977,500
2 Material Cost USD 1,829,814 2,343,006 1,830,799 1,747,832 2,162,519 2,345,240 10,429,396
% 64.89% 67.53% 65.43% 64.98% 64.30% 64.14% 65.28%
3 Contribution USD 990,186 1,126,824 967,168 942,167 1,200,600 1,311,345 5,548,104
% 35.11% 32.47% 34.57% 35.02% 35.70% 35.86% 34.72%
4 Total fixed Overhead USD 919,818 1,008,310 1,221,175 1,157,743 1,095,036 1,074,046 5,556,310
5 USD 25,000 34,921 30,742 10,344 33,345 14,804 124,156
6 Net Profit Before Tax (NPBT) USD 95,368 153,435 (223,265) (205,232) 138,909 252,103 115,950
% 3.38% 4.42% -7.98% -7.63% 4.13% 6.89% 0.73%
7 Avg FOB USD / Pc 9.39 11.14 9.90 10.91 12.43 11.22 11.12
8 Avg net CM per piece USD / Pc 3.30 3.66 3.44 3.77 4.42 4.07 3.87
9 Avg CM per Machine shift USD 27.50 25.14 25.64 25.38 35.10 31.13 28.31
Formula = NPBT ÷ (Sales Value of Production + Other Income)
Formula = Sales Value of Production ÷ Quantity Produced
Formula = Actual Contribution ÷ Quantity Produced
Formula = Actual Contribution ÷ Machine Shift Utilized
Based on In House Sales Value of Production (adjusted for remnants) in Perf.Review report
Material Cost including Dead Stock Write Off in Perf Review Report ( See Explanatory) Formula = Material Cost ÷ (Sales Value of Production + Other Income)
Formula = Sales Value of Production + Other Income - Material Cost
Formula = Actual Contribution ÷ (Sales Value of Production + Other Income)
Refer Item Profit & Loss in Perf. Review Report
Formula = Actual Contribution + Stocklot Sales - Total Fixed Cost
FEB MAR APRIL
Profit / (Loss) from stocklot sales
BUSANA APPAREL GROUP
NO PERFORMANCE INDICATOR JANUOM
( PRODUCTION BASED )
EXPLANATIONMAY
B.S.C BUSINESS UNIT
7M Riza Radyanto - LEPKIN

MATERI TRAINING BALANCED SCORECARD – PT INDONESIA POWER
MONTHLY BALANCED SCORECARD - FACTORY PERFORMANCE (IN-HOUSE)Prepared By : FACTORY : CITRA ABADI SEJATIOwner : Unit Head - CAS PERIOD : 5/1/2005
BIZ PLAN Cumm
2005 Jan-Mayper Month
FINANCIAL PERSEPECTIVE10 Avg Cost per Machine Shift USD 25.54 22.50 32.37 31.19 32.01 25.50 28.35
11 Avg Cost per Machine Minutes US¢ 5.32 4.69 6.74 6.50 6.67 5.31 5.91
12 Profit Margin per Machine Shift USD 1.95 2.64 (6.73) (5.81) 3.09 5.63 (0.04)
13 Account Receiveable
(overdue) USD -
14 Contribution Confirmed Order USD - See Note
Shipping Stage USD - See Note
CUSTOMER PERSEPECTIVE - 15 %/ Pcs 33% 24% 50% 54% 66%
pcs 5.60 4.72 6.00 4.80 6.76
16 Order On Time Delivery %
Order Not Meeting Original DeliveNos
17 Nos 292,444 264,492 269,601 295,000 299,856 274,033
USD 2,776,336 2,740,011 3,038,360 3,167,902 3,148,488 3,288,396
July 05 Nos 316,814 284,824 298,603 300,000 319,011 377,911
USD 2,980,695 2,887,020 2,812,100 3,474,480 3,509,121 4,920,407
August 05 Nos 316,814 233,097 292,444 300,000 256,134 153,750
USD 2,980,695 2,330,717 2,924,440 4,077,378 3,073,608 1,843,310
Nos - 0 0
USD 0.00 0
Factory Booking Plan
Factory Booking Plan
Shipment On Time Delivery Based on Final Revised Ship date
Shipment On Time Delivery Based on Original Ship Date in Marketing Plan
Factory Booking Plan
Factory Booking Plan
Contribution at Confirmed Order Receipt Stage, based on Order Qty Contribution at Shipment stage Based on shipped Qty
Sample Balanced Scorecard Report / factory Sample room Reports
Sample Balanced ScorecardReport / factory Sample Room Reports
Formula = Total Fixed Cost ÷ Machine Shift Utilized
Formula = Avg Cost per MC Shift ÷ ___ minutes x 100
Formula : Avg CM per MC shift - Avg Cost per MC Shift
As per Books of account-info from HO Finance
More than 3 months
Confirmed Order
Next Month - June 05
FEB MAR APRIL
Sample On Time Delivery (Within 7 days)
Sample Productivity (pcs produced per operator per week)
BUSANA APPAREL GROUP
NO PERFORMANCE INDICATOR JANUOM
( PRODUCTION BASED )
EXPLANATIONMAY
B.S.C BUSINESS UNIT
8M Riza Radyanto - LEPKIN

9
MATERI TRAINING BALANCED SCORECARD – PT INDONESIA POWER
MONTHLY BALANCED SCORECARD - FACTORY PERFORMANCE (IN-HOUSE)Prepared By : FACTORY : CITRA ABADI SEJATIOwner : Unit Head - CAS PERIOD : 5/1/2005
BIZ PLAN Cumm
2005 Jan-Mayper Month
CUSTOMER PERSEPECTIVE - 18 Complaints Nos 4 -
0%
19 Claims USD 1,000 300 68 43,426 15,861 750 60,406
Discounts USD 0 0 0
Air Freight Cost USD 10,000 1,491 17,609 20,002 8,949 6,875 54,926
INTERNAL BIZ PERSEPECTIVE 020 Nos 300,313 308,069 281,153 250,049 271,740 322,252 1,433,263
21 Pcs / MCS 9.34 6.87 7.45 6.74 7.94 7.65 7.31
22 All Pcs / PPL 48 35 43 42 52 44
Blazer
Non - Blazer23 % 65.00% 47.00% 51.00% 50.54% 55.20% 59.00% 52.55%
24 MC Shift Utilized MCShift 36,008 44,822 37,721 37,122 34,209 42,124 195,998
25 Rejects % 1.57 1.06% 2.31%
26 Remnants % 0.00% 2.81% 3.05% 2.11% 2.46% 1.67% 2.42%
27 Defects (Re-worked) % 12.00% 16.00% 11.23% 8.90% 9.63%
(Refer to Cost per Machine Shift - After Regrouping HO Expense in Perf. Review Report) Not Repairable , Based on production report
Refer to Summary of Remnants Stock - Month Wise (In house) in Perf Review report End Line Rework, Based on Quality report / Factory Reports
Formula = Pieces produced ÷ Equivalent person for the month
Equivalent Person = Present Head Count + Conversion of OT into Head Count
Based on production report / Factory reports
Based on production report / Factory Reports
From actual discounts if any as per books of accountsPertains to sanction note on Batamtex relating to previous years.
Based on Daily Order Status Report (sewn quantity) - (adjusted for remnant) Formula = Production Quantity (at sewing) ÷ Machine Shift Utilized
Customer Service Report / Based on Factory Records of Complaints
From actual claim for the month as per books of accounts
% Efficiency based on SMV at Sewing
Manpower Productivity - Pcs produced per eqv person
Production - Good Garments at sewing section
MC Shift Productivity - Pcs produced per MC Shift
FEB MAR APRIL
BUSANA APPAREL GROUP
NO PERFORMANCE INDICATOR JANUOM
( PRODUCTION BASED )
EXPLANATIONMAY
B.S.C BUSINESS UNIT
M Riza Radyanto - LEPKIN

10
MATERI TRAINING BALANCED SCORECARD – PT INDONESIA POWER
MONTHLY BALANCED SCORECARD - FACTORY PERFORMANCE (IN-HOUSE)Prepared By : FACTORY : CITRA ABADI SEJATIOwner : Unit Head - CAS PERIOD : 5/1/2005
BIZ PLAN Cumm
2005 Jan-Mayper Month
INTERNAL BIZ PERSEPECTIVE 028 Inventory Days of Cover # DAYS 70 68 61 60 66 66
Raw Materials # DAYS 32 28 31 28 29 29
WIP # DAYS 38 40 30 32 37 37
Finish Goods # DAYS - 0 0 -
29 USD - 1,390,422 1,473,404 1,500,860 1,584,237 1,525,909 1,525,909
30 Pcs
USD
LEARNING AND GROWTH
31 Meeting 70% efficiency
# of super'r 1 5 15
Between 70% - 60%
# of super'r 8 11 12
Between 60% - 55%
# of super'r 8 13 4
Below 55% # of super'r 33 26 23
32 Hrs
Hrs 150 446 446 359
Based on efficiency and ranking assessment if made / training programe conducted
Based on efficiency and ranking assessment if made / training programe conducted
Based on efficiency and ranking assessment if made / training programe conducted Based on efficiency and ranking assessment if made / training programe conducted Based on efficiency and ranking assessment if made / training programe conducted Based on efficiency and ranking assessment if made / training programe conducted
Based on guidelines issuesd by HO Finance Department
Based on Stock Report / Factory Report
Based on Garment ready to ship but on hold due to any reason
Based on Garment Ready to ship but on hold due to any reason
Hrs spend in Learning workshop for ALL supervisory staff
Raw Material (Non Moving / Dead Stock)
Hrs spend in Learning workshop for line supervisors
Supervisor Learning
performance capability (
No. of supervisors)
Good Garments not shipped more than 7 days in store
FEB MAR APRIL
BUSANA APPAREL GROUP
NO PERFORMANCE INDICATOR JANUOM
( PRODUCTION BASED )
EXPLANATIONMAY
B.S.C BUSINESS UNIT
M Riza Radyanto - LEPKIN

11
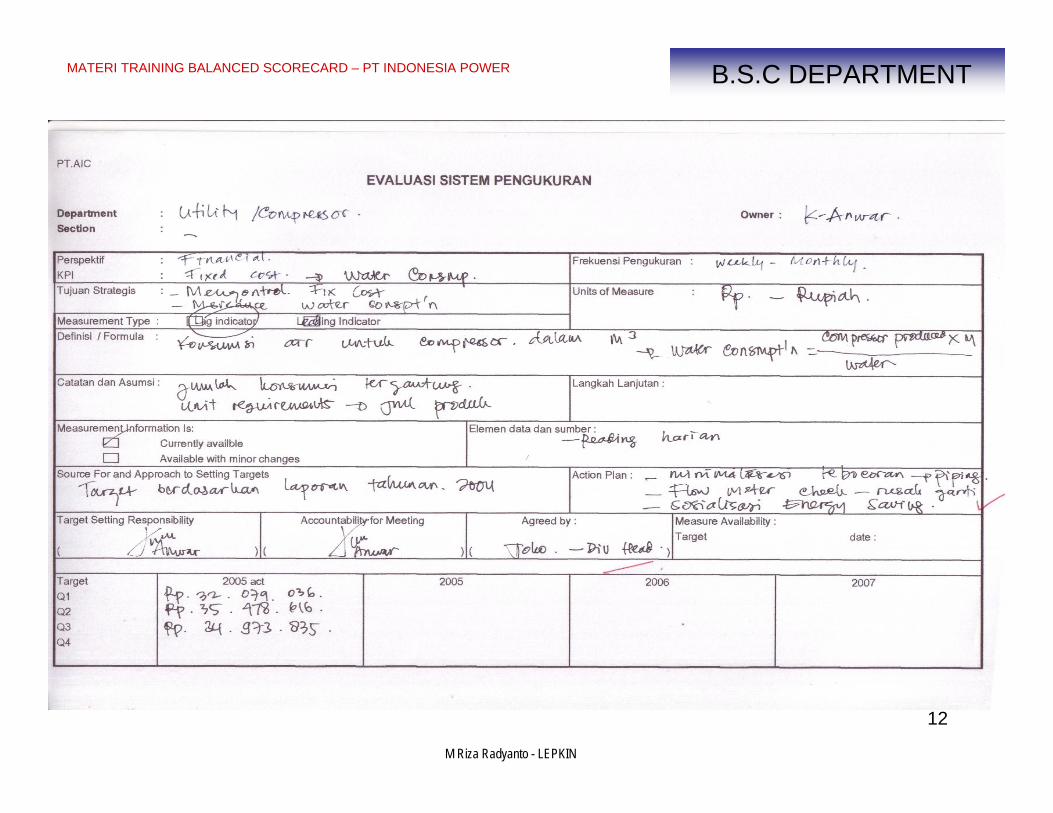
MATERI TRAINING BALANCED SCORECARD – PT INDONESIA POWER B.S.C DEPARTMENT
PT.AIC
DEPARTMENT Utility (CompressOWNER K. Anwar
January February March
31 28 31
1 FIXED COST- Salary & Wages Rp 37,907,111 36,255,234 34,616,193 - Electric Cost Rp 3,275,950,003 3,351,882,436 2,740,879,813 3,087,043,040
VDH Rp 3,351,882,436 2,740,879,813 3,087,043,040 PLN Rp
- Water Rp 33,968,990 26,655,134 18,933,231 19,734,113 - Spareparts & Oil Cost Rp 43,539,390 84,163,194 49,805,056 - Chemical Rp 9,983,476 9,923,592 9,419,167 7,933,453
Rp 3,469,907,664 2,889,650,639 3,199,131,855 2 COST PER m3 AIR Rp 85.01 103.26 96.95 106.35
1 AVAILABILTY % 85 82 87 2 NO OF COMPLAIN AIR PRESS SHORTAGE times 0 0 0
1 COMPRESSOR EFFICIENCY (EFF FAD) % 85.00% 94.02% 96.34%2 Compressor Produced m3 44,333,494 39,534,160 31,701,558 31,226,214
- Station 1 m3 8,386,790.4 5,727,801.6 26,231,724.0 - Station 2 m3 27,646,963.2 22,217,428.8 4,517,089.2 - Station 3 m3 3,096,918.0 3,278,167.2 476,105.0 - Station 4 m3 478,160.3 1,296.0 - SPINNING V m3 403,488.0 - SPINNING II m3
3 ELECTRIC KWH 4,559,750 3,510,192 2,863,106 3,081,312 - VDH KWH 3,510,192 2,863,106 3,081,311.8 - PLN KWH
4 Electric Consumption m3/Kwh 9.75 9.57 10.41 9.76 5 WATER m3 8,885 6,666 4,507 4,354 6 Water Consumption m3/m3 5,041 6,613 6,909 7 UTILIZATION %8 OVERTIME hours
1 NO OF TRAINING GIVEN times/month 4 2 42 DURATION OF TRAINING hrs 8 6 12
LEARNING AND GROWTH
FINANCIAL PERSPECTIVE
TOTAL
CUSTOMER PERSPECTIVE
INTERNAL PERSPECTIVE
MONTHLY BALANCED SCORECARD
PERFORMANCE INDICATORNo AVG Last YearUNIT OF MEASURE
M Riza Radyanto - LEPKIN
12
MATERI TRAINING BALANCED SCORECARD – PT INDONESIA POWER B.S.C DEPARTMENT
M Riza Radyanto - LEPKIN
13
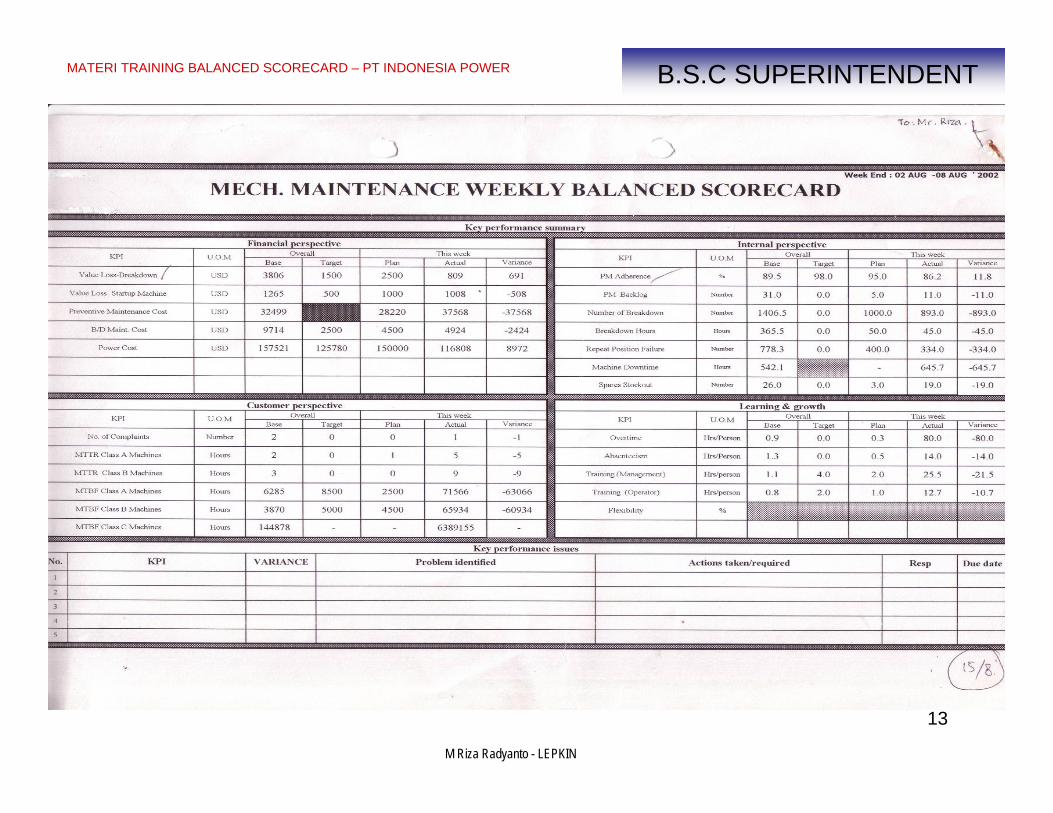
MATERI TRAINING BALANCED SCORECARD – PT INDONESIA POWER B.S.C SUPERINTENDENT
M Riza Radyanto - LEPKIN

14
MATERI TRAINING BALANCED SCORECARD – PT INDONESIA POWER
1 2 3 4 5 6 7 8 9 10 11 12 13 14 15 16 17 18 19 20 21 22 23 24
MONTH
awal tahun ketiga dan seterusnya
TAHAPAN IMPLEMENTASI BSC
Klarifikasi visi,misi,nilai organisasi dan memakai BSC untuk Tim Eksekutif / Manajemen Puncak
menerjemahkannya ke dalam strategi agar mudah dipahami .
a.Mengkomunikasikan strategi organisasi ke manajemen Tim Manajemen Puncak,Menengah
menengah,puncak.BSC sebagai alat komunikasi dan bawah
b.Mengembangkan SBU scorecard Tim Manajemen Unit Bisnis
a.Memakai corporate scorecard untuk mengidentifikasi program Tim Manajemen Puncak,Menengah
yang tdk berkontribusi secara signifikan thd tujuan strategis dan bawah
Tim Eksekutif / Manajemen Puncak
Tim Manajemen Unit Bisnis
Tim Eksekutif / Manajemen Puncak
Tim Manajemen Unit Bisnis
Tim Eksekutif / Manajemen Puncak
a. Mengkomunikasikan BSC ke seluruh organisasi Tim Manajemen Puncak,Menengah
b.Menetapkan tujuan kinerja tim / individual dan bawah
Tim Eksekutif / Manajemen Puncak
Tim Manajemen Unit Bisnis
Tim Eksekutif / Manajemen Puncak
Tim Manajemen Puncak,Menengah
dan bawah
Tim Manajemen Puncak,Menengah
dan bawah
Memperbaharui Corporate Scorecard
b.Mengumumkan program perubahan korporat
3
Review SBU scorecard
5
RESPONSIBILITYDESCRIPTIONSTEP
1
2
4
7
6
10Mengaitkan kinerja tim , individu dengan BSC.Semua karyawan harus memiliki individual scorecard.Sistem kompensasi insentif dikaitkan secara langsung dengan individual scorecard
Memperbaharui rencana jangka panjang dan program manajemen
8Melakukan peninjauan ulang setiap bulan dan 3 bulan,setelah SBU scorecard disetujui oleh manajemen puncak , proses peninjauan ulang ini dilakukan sebagai tambahan
9Melakukan peninjauan ulang setiap tahun .Tim eksekutif - manajemen puncak mendaftarkan isu2 strategis dan menanyakan ke setiap SBU tentang posisi mereka


![Pertemuan4[Pengenalan BSC]](https://static.fdokumen.com/doc/165x107/5479760e5806b562048b46bf/pertemuan4pengenalan-bsc.jpg)