KEP pada anak berak celana
44
Mother and Child Nutrition in the Tropics and Subtropics Chapter 7 Protein-energy Malnutrition 237 Chapter 7 Protein-Energy Malnutrition Chapter 7 Protein-Energy Malnutrition .......................................................................................... 237 CLASSIFICATION AND DEFINITION ....................................................................................241 Mild-to-moderate malnutrition ....................................................................................... .............2 41 The Need for S implification ........................................................................................................244 CLINICAL FEATURES..............................................................................................................250 ASSOCIATED DEFICIENCIES........................................ .........................................................252 Xerophthalmia (Se e fig. 7.10) ......................................................................................................252 Rickets (See Fig. 7.11) ................................................................................................................. 253 Anaemia ....................................................................................................................................... 254 PATHOLOGICAL FEATURES AND CHANGES IN METABOLISM .......................................254 Changes in the digestive system .................................................................................................. 255 Liver (See fig. 7.13) ..................................................................................................................... 255 PANCREAS.................................................................................................................................255 GASTROINTESTIN AL TRACT (See fig. 7.14) ........................................................................ 256 HEART (See Fig. 7 .15)............................. ...................................................................................257 HAEMOPOIETIC SYSTEM.......................................................................................................257 Immune System............................................................................................................................ 258 MUSCLE (See Fig. 7.16)..................................... ........................................................................ 258 BRAIN AND THE NERVOUS SYSTEM ..................................................................................259 Metabolic changes..................................... .......................................................................................261 CARBOHYDRATE METABOILISM ........................................................................................ 261 FAT METABOLISM................................................................................................................... 261 PROTEIN METABOLISM .........................................................................................................261 Defense mechanisms ........................................................................................................................ 262 Management of Severe Malnutrition ............................................................................................... 263 Feeding during the initial phase of stabilization. ......................................................................... 264 Vitamin supplements.................................... ................................................................................2 69 The Catch up phase ............................................................................................................. .............2 69 Frequency of feeds ....................................................................................................................... 270 Monitoring growth in the catch up phase.....................................................................................270 Nutrition Rehabilitati on phase .........................................................................................................271 Daily diet in the nutrition rehabilitation centre............................................................................274 Outpatient care for severely malnourished children. ................................................................... 276 Community Centred appro aches .................................................................................................. 277 Monitoring the nutrition of the community .................................................................................277 Making a community diagnosis of malnutrition..........................................................................278 FURTHER READING ................................................................................................................ 280 237
Transcript of KEP pada anak berak celana

7/23/2019 KEP pada anak berak celana
http://slidepdf.com/reader/full/kep-pada-anak-berak-celana 1/44
Mother and Child Nutrition in the Tropics and Subtropics
Chapter 7 Protein-energy Malnutrition237
Chapter 7 Protein-Energy Malnutrition
Chapter 7 Protein-Energy Malnutrition ..........................................................................................237
CLASSIFICATION AND DEFINITION....................................................................................241Mild-to-moderate malnutrition ....................................................................................................241The Need for Simplification ........................................................................................................244CLINICAL FEATURES..............................................................................................................250ASSOCIATED DEFICIENCIES.................................................................................................252Xerophthalmia (See fig. 7.10)......................................................................................................252Rickets (See Fig. 7.11) .................................................................................................................253Anaemia .......................................................................................................................................254
PATHOLOGICAL FEATURES AND CHANGES IN METABOLISM .......................................254Changes in the digestive system ..................................................................................................255Liver (See fig. 7.13) .....................................................................................................................255
PANCREAS.................................................................................................................................255GASTROINTESTINAL TRACT (See fig. 7.14) ........................................................................256HEART (See Fig. 7.15)................................................................................................................257HAEMOPOIETIC SYSTEM.......................................................................................................257Immune System............................................................................................................................258MUSCLE (See Fig. 7.16).............................................................................................................258BRAIN AND THE NERVOUS SYSTEM ..................................................................................259
Metabolic changes............................................................................................................................261CARBOHYDRATE METABOILISM ........................................................................................261FAT METABOLISM...................................................................................................................261PROTEIN METABOLISM .........................................................................................................261
Defense mechanisms........................................................................................................................262Management of Severe Malnutrition ...............................................................................................263
Feeding during the initial phase of stabilization. .........................................................................264Vitamin supplements....................................................................................................................269
The Catch up phase ..........................................................................................................................269Frequency of feeds. ......................................................................................................................270Monitoring growth in the catch up phase.....................................................................................270
Nutrition Rehabilitation phase .........................................................................................................271Daily diet in the nutrition rehabilitation centre............................................................................274Outpatient care for severely malnourished children. ...................................................................276Community Centred approaches ..................................................................................................277Monitoring the nutrition of the community .................................................................................277Making a community diagnosis of malnutrition..........................................................................278FURTHER READING ................................................................................................................280
237

7/23/2019 KEP pada anak berak celana
http://slidepdf.com/reader/full/kep-pada-anak-berak-celana 2/44
Mother and Child Nutrition in the Tropics and Subtropics
Chapter 7 Protein-energy Malnutrition238
Figure 7.1 Distribution of Malnutrition by Regions .......................................................................240Figure 7.2 Weight Chart for International Use ...............................................................................245Figure 7.3 The mid-arm circumference as a measure of nutritional status.....................................246Figure 7.4 Quac Stick in use in Biafra ............................................................................................247
Figure 7.5 Measuring mid-arm circumference ...............................................................................248Figure 7.6 Mortality by age for weight ...........................................................................................248Figure 7.7 Mortality rates by arm circumference for age and weight for age ................................249Figure 7.8 Kwashiorkor ..................................................................................................................250Figure 7.9 Marasmus.......................................................................................................................252Figure 7.10 Xerophthalmia with keratomalacia..............................................................................252Figure 7.11 Rickets in malnutrition ................................................................................................253Figure 7.12Angular stomatitis of Vitamin B deficiency..................................................................253Figure 7.13 Fatty degeneration in the section on the right with normal liver tissue on the left for
comparison. ..............................................................................................................................255Figure 7.14 Villous atrophy in malnutrition seen in section on the right. Normal gut tissue for
comparison on the left. .............................................................................................................256Figure 7.15 Normal myocardium on the left for comparison with section of heart muscle obtained
at post mortem in a child who died of kwashiorkor.................................................................257Figure 7.16 Skeletal muscle in severe malnutrition on the right hand section. ..............................258Figure 7.17 MRI scan in kwashiorkor .............................................................................................260Figure 7.18 MRI scans after 90 days of treatment. .........................................................................260Figure 7.19 Feeding with nasogastric tube. ....................................................................................265Figure 7.20 Nutrition Rehabilitation Unit with Pediatric wards in the distance .............................273Figure 7.21 Mothers learning to cook a nutritious meal..................................................................273Figure 7.22 A group discussion with vegetable garden in background ...........................................273Figure 7.23 (left) Weights on admission.........................................................................................274Figure 7.24 (right Weights at the time of discharge .......................................................................274
Table 7.1 Prevalence of childhood malnutrition.............................................................................239Table 7.2 Geographical distribution of childhood malnutrition .....................................................240Table 7.3 Formula for ReSoMal .....................................................................................................264Table 7.4 Composition of concentrated electrolyte-mineral solution.............................................266Table 7.5 Starter milk formula for treating malnutrition ................................................................266Table 7.6 Volume of Starter formula per feed by child’s weight. ..................................................268Table 7.7 Recipe for catch up formula............................................................................................269Table 7.8 Weight for Length (WHO/NCHS standard) ...................................................................271
Table 7.9 A specimen daily diet in the nutrition rehabilitation centre............................................275Table 7.10 Number of children to be included in a survey of households for assessing................278
238
7/23/2019 KEP pada anak berak celana
http://slidepdf.com/reader/full/kep-pada-anak-berak-celana 3/44
Mother and Child Nutrition in the Tropics and Subtropics
Chapter 7 Protein-energy Malnutrition239
Protein-energy malnutrition (PEM) is currently the most widespread and serious health problem ofchildren in the world. At any time approximately 100 million children suffer from the moderate orsevere forms of PEM. In the 1990s, the number of underweight children in developing countriesdeclined from 177 million to 149 million. The prevalence of severe malnutrition also declined, buteven then severe malnutrition remains an important problem. In any one country the prevalence
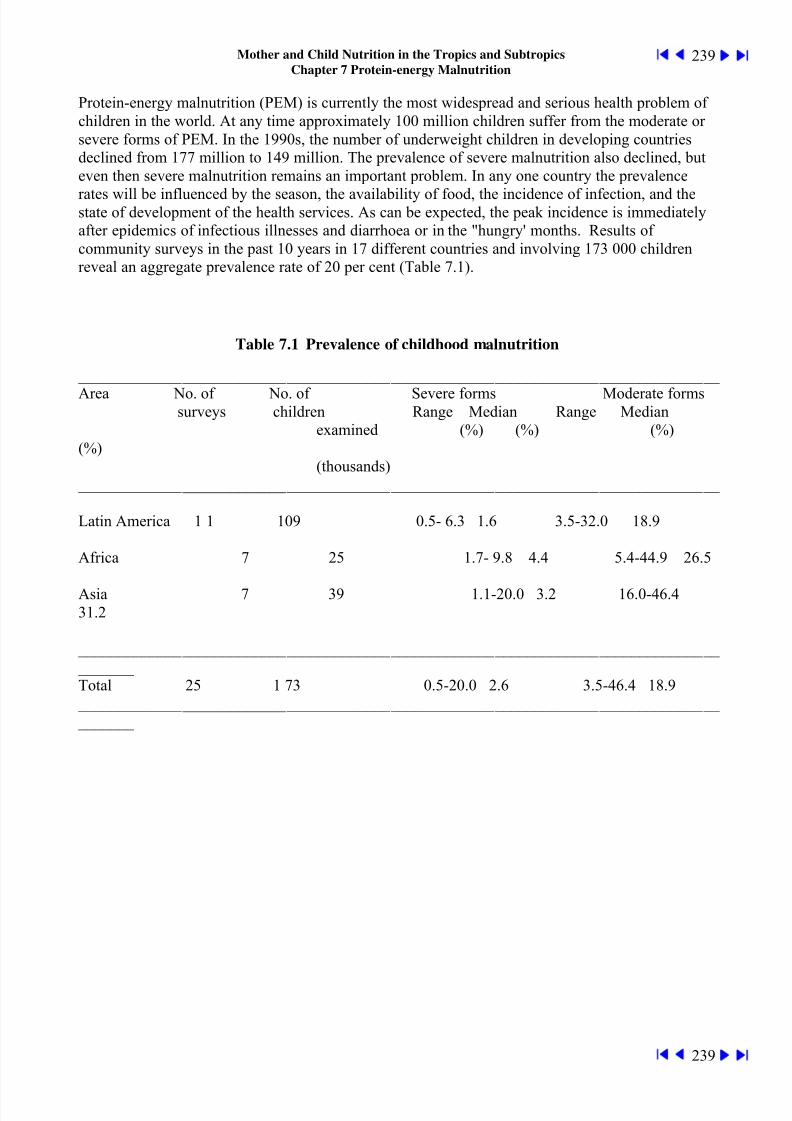
rates will be influenced by the season, the availability of food, the incidence of infection, and thestate of development of the health services. As can be expected, the peak incidence is immediatelyafter epidemics of infectious illnesses and diarrhoea or in the "hungry' months. Results ofcommunity surveys in the past 10 years in 17 different countries and involving 173 000 childrenreveal an aggregate prevalence rate of 20 per cent (Table 7.1).
Table 7.1 Prevalence of childhood malnutrition
________________________________________________________________________________
Area No. of No. of Severe forms Moderate formssurveys children Range Median Range Median
examined (%) (%) (%)(%)
(thousands) ________________________________________________________________________________
Latin America 1 1 109 0.5- 6.3 1.6 3.5-32.0 18.9
Africa 7 25 1.7- 9.8 4.4 5.4-44.9 26.5
Asia 7 39 1.1-20.0 3.2 16.0-46.431.2
________________________________________________________________________________ _______Total 25 1 73 0.5-20.0 2.6 3.5-46.4 18.9
________________________________________________________________________________ _______
239
7/23/2019 KEP pada anak berak celana
http://slidepdf.com/reader/full/kep-pada-anak-berak-celana 4/44
Mother and Child Nutrition in the Tropics and Subtropics
Chapter 7 Protein-energy Malnutrition240
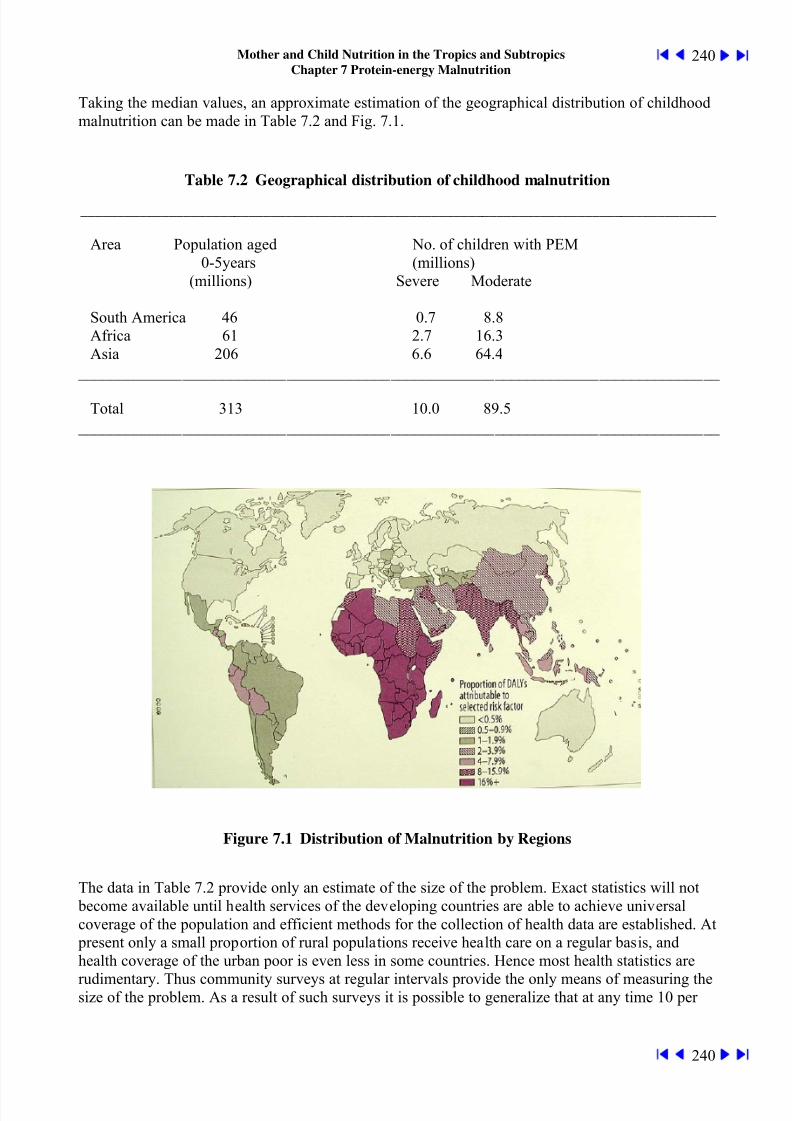
Taking the median values, an approximate estimation of the geographical distribution of childhoodmalnutrition can be made in Table 7.2 and Fig. 7.1.
Table 7.2 Geographical distribution of childhood malnutrition
_______________________________________________________________________________________
Area Population aged No. of children with PEM0-5years (millions)
(millions) Severe Moderate
South America 46 0.7 8.8Africa 61 2.7 16.3Asia 206 6.6 64.4
________________________________________________________________________________
Total 313 10.0 89.5 ________________________________________________________________________________
Figure 7.1 Distribution of Malnutrition by Regions
The data in Table 7.2 provide only an estimate of the size of the problem. Exact statistics will not become available until health services of the developing countries are able to achieve universalcoverage of the population and efficient methods for the collection of health data are established. At
present only a small proportion of rural populations receive health care on a regular basis, andhealth coverage of the urban poor is even less in some countries. Hence most health statistics are
rudimentary. Thus community surveys at regular intervals provide the only means of measuring thesize of the problem. As a result of such surveys it is possible to generalize that at any time 10 per
240
7/23/2019 KEP pada anak berak celana
http://slidepdf.com/reader/full/kep-pada-anak-berak-celana 5/44
Mother and Child Nutrition in the Tropics and Subtropics
Chapter 7 Protein-energy Malnutrition241
cent of children in an average rural community in the developing world will show signs of growthfailure and some of them will have clinical signs of malnutrition. Only 24 per cent of children insuch communities show adequate growth, and the remaining 66 per cent experience faltering ofgrowth from time to time.
The level of preschool (1-5 years) mortality in a country may also indicate the prevalence ofchildhood malnutrition. This is because of the well-known synergism between undernutrition andinfection. The preschool mortality in the average developing country is about 40 times that ofwestern countries, which again reveals the size of the problem of malnutrition. In a study of the
patterns of childhood mortality in 13 areas in South America, sponsored by the Pan AmericanHealth Organization, 7318 deaths in children between the ages of 1 and 4 years were studied.Malnutrition was found to be the primary cause of death in 9 per cent (range 0-18 per cent) and anassociated cause of death in 48.4 per cent (range 0-61 per cent). The general conclusion was thatmalnutrition was directly or indirectly responsible for 57.4 per cent of deaths of children aged 1-4years.
CLASSIFICATION AND DEFINITION
It is paradoxical that such a widespread, serious and extensively studied form of nutritional disorderstill continues to be a controversial subject in almost every aspect. This is especially so with regardto classification and pathogenesis. The reason is that the presenting features of nutritionaldeficiency vary from one part of the world to another, due mainly to the great variation in thenutrient content of the diet, the prevalence of antecedent illnesses, the variability of the host, andthe time over which the causative factors operate. Two distinct clinical syndromes have beendescribed, viz. kwashiorkor and marasmus, and represent the severe forms of PEM. They occupy
the two ends of a spectrum with a mixture of the clinical features of both in between. Biochemicalfeatures also form a spectrum though they are more evident in kwashiorkor than in marasmus. It isnot unusual to find that a child diagnosed as suffering from kwashiorkor shows the typical featuresof marasmus after the oedema (see "Clinical features') subsides, while a child with nutritionalmarasmus often develops oedema and progresses to marasmic kwashiorkor.
Of the two classical syndromes, kwashiorkor has received a great deal of interest and attention because of its striking clinical features and extensive changes in the body's chemistry. However,there are now clear indications that marasmus is on the increase, especially in the city slums andshanty towns of the developing countries. The rapid decline in breast feeding has a great deal to dowith this. Moreover, since marasmus usually occurs at a younger age than kwashiorkor its long-
term effects are more severe. I n both forms of malnutrition, recognition at an early stage isimportant in order to avoid the serious after-effects of established malnutrition. Hence there has
been great interest in accurate classification and especially in identifying early signs.
Mild-to-moderate malnutrition
In defining the stages of malnutrition, two processes have to be taken into account. These are: (1)the period over which malnutrition occurs, so as to decide whether it is acute or chronic, or acute onchronic. Acute forms chiefly affect body weight more than height, whereas in the chronic form both
height and weight are affected. (2) The aetiological factors. The classical explanation thatkwashiorkor is due to protein deficiency with relatively adequate energy supply while marasmus is
241
7/23/2019 KEP pada anak berak celana
http://slidepdf.com/reader/full/kep-pada-anak-berak-celana 6/44
Mother and Child Nutrition in the Tropics and Subtropics
Chapter 7 Protein-energy Malnutrition242
due to the overall deficiency of proteins and calories arose out of the observations that in countrieswhere roots, tubers and plantain (all with 1-2 per cent protein) form the staple foods kwashiorkor ismore common. This view has been challenged, as we saw in the previous chapter, and the role ofinfection has come to be emphasized in the aetiology as well as treatment of severe malnutrition.
In every locality the identification of the important aetiological factors is necessary for institutingearly intervention. When food is inadequate, the organism adapts first of all by reducing growth andthe clinical signs are those of such adaptation. Thus, weight gain slows down, and so weight forage has been commonly used to assess the degree of mild to moderate malnutrition. Those childrenwho weigh less than the mean weights of children in their age group are thus called "wasted ' and thedegree of wasting is an indication of the degree of malnutrition they have suffered. A commondifficulty is that in most cases parents do not know the ages of their children. Height for age alsosuffers from the same difficulty. Thus there is a need for age-independent criteria of malnutrition. Ithas been suggested that the ratio weight/ height may overcome this difficulty besides providing asensitive measure of wasting. Refinements have been added to this measure in the form ofregression lines and various indices like weight/height2 or weight/ height1.6. One may question the
value of these complexities which require mathematical manipulation.
Reduced growth as a consequence of adaptation to lack of food also affects height. Weight canswing up and down, but obviously this is not the case with height. All that happens is that growth inheight slows down and the individual will end up short. Those children whose heights are less thanthe mean heights of children in their age group are called 'stunted'. Catch-up growth in both heightand weight can occur if the slowing of growth was temporary, as for example after an acute illness.If dietary deficiency is prolonged, full catch-up does not occur and the deficit in height becomesfixed and permanent. Thus deficits of height indicate long-standing malnutrition. Children whogrow slowly in an adverse environment and retain normal weight for height may be adapting to theenvironment compared to those who are wasted or have developed oedema.
Deficits in weight for height and in height for age can be put together in a 2x2 table for communitysurveys or for triage in emergencies. This manoevure helps to identify four groups of children asfollows:
242

7/23/2019 KEP pada anak berak celana
http://slidepdf.com/reader/full/kep-pada-anak-berak-celana 7/44
Mother and Child Nutrition in the Tropics and Subtropics
Chapter 7 Protein-energy Malnutrition243
Normal No intervention
WastedSelect for rehabilitation
Stunted but not
wasted
Past malnutrition
Stunted and
WastedSelect for urgent
treatment
100%80%
Wt/Ht
90%
80%
Ht/Age
60%
Besides growth in height and weight, the body compartments most affected in malnutrition are
those of energy reserve - subcutaneous fat and the protein store of skeletal muscle. Measuring thesetwo body compartments can shed extra light on the pathophysiological mechanisms. Thus, inmalnutrition muscle is wasted not only because of lack of protein in the diet, but because muscle isused up to supply energy. Deficient muscle with adequate body fat will be one indication of proteindeficiency. Conversely, adequate muscle with lack of fat suggests lack of energy reserve.
The adaptive changes to dietary deficiency are not always successful. For example, we know thatundernourished individuals have a predisposition to infectious illnesses. Diarrhoeal disease is notonly more prevalent in undernourished children, but also tends to be more severe. In one study ofvillage children aged between 6 and 32 months in Nigeria it was found that the frequency ofdiarrhoea during the rainy season was greatest amongst children who were described as "wasted”
(i.e. < 80 per cent of weight for height). Such children suffered 47 per cent more episodes ofdiarrhoea. Pre-existing malnutrition affected the duration of diarrhoea which was 79 per cent longerin "wasted' children compared to well-nourished controls. In children who were under-weight (< 75
per cent weight for age) the duration of diarrhoea was 33 per cent longer and in stunted (< 90 percent height for age) children it was 37 per cent longer compared to those who were well-nourished.In Zaire, childhood infections, especially measles, had occurred in more than half the children in theweeks immediately preceding an outbreak of kwashiorkor. Associated deficiencies besides those of
protein and calories also occur with malnutrition. Hence in identifying early malnutrition it is usefulto remember that the differing proportions of protein and calories in the diet, the duration ofmalnutrition, the associated deficiency of other nutrients, and the effects of infectious illnessestogether give rise to a wide spectrum of signs and symptoms. The presence of intestinal parasites
may also contribute to the typical pattern of malnutrition encountered in a given locality. Forexample, heavy hookworm infection may contribute to loss of iron as well as protein in the gut;
243

7/23/2019 KEP pada anak berak celana
http://slidepdf.com/reader/full/kep-pada-anak-berak-celana 8/44
Mother and Child Nutrition in the Tropics and Subtropics
Chapter 7 Protein-energy Malnutrition244
Strongyloides infection also acts in a similar manner with added malabsorption, and giardiasiscauses impaired absorption. In recent years the epidemic of HIV / AIDS has resulted in a harrowing
picture of severe malnutrition associated with gastro-intestinal infection with cryptosporidium.
A further twist has been added to a complex situation by the trend of urban migration and rapid
urban growth in most developing countries. The new social problems of unemployment, the need tochange from subsistence to cash economy and a deteriorating family life, added to the promotion ofa variety of "junk' foods and beverages, means that multiple deficiencies occur on a background of
protein and energy lack.
The Need for Simplification
Such a complex situation has led to a variety of methods of classification. Such methods, howeveruseful as research tools, cannot be easily taught to auxiliaries and village health workers, for whoma more simplified and action-oriented approach is necessary. With this need in mind, several simplemethods of measuring nutritional status have been evolved. The Wellcome classification is one suchsimple method for the diagnosis of clinical malnutrition.
Wellcome classification
Weight Oedema
(% of standard) Present Absent _______________________________________________________________
80-60 Kwashiorkor Undernourished
< 60 Marasmic kwashiorkor Marasmus
For children within the community who are at risk of mild-moderate malnutrition a similar simpletool for the selection of early cases is required. The Gomez classification was first suggested in thelate 1950s as a method of diagnosing mild-moderate forms of malnutrition in the community andfor the early identification of marasmus. The classification is based on weights of healthy Americanchildren under the age of 5 years, and the fiftieth percentile is taken as the standard. Malnutrition isgraded into three degrees of increasing severity according to the percentage reduction in weight
from the standard.
244
7/23/2019 KEP pada anak berak celana
http://slidepdf.com/reader/full/kep-pada-anak-berak-celana 9/44
Mother and Child Nutrition in the Tropics and Subtropics
Chapter 7 Protein-energy Malnutrition245
Gomez Classification
First-degree malnutrition < 80% of the standard
Second-degree malnutrition < 70% of the standard
Third-degree malnutrition < 60% of the standard
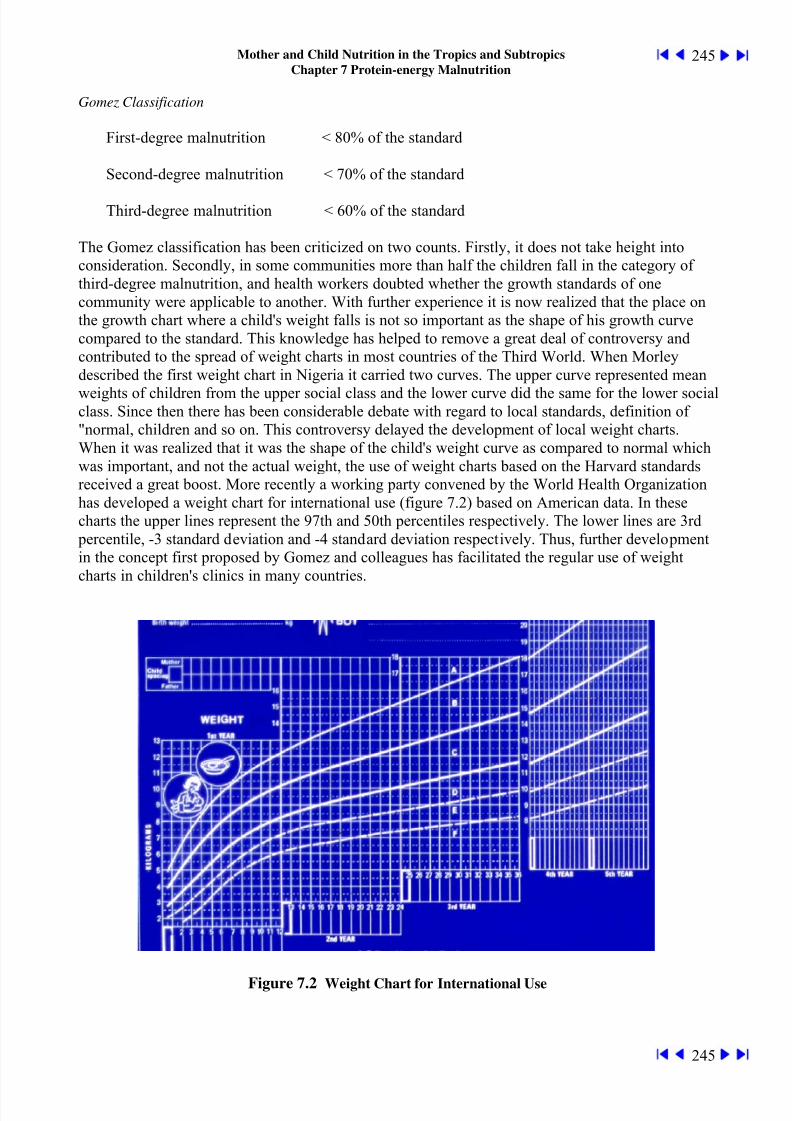
The Gomez classification has been criticized on two counts. Firstly, it does not take height intoconsideration. Secondly, in some communities more than half the children fall in the category ofthird-degree malnutrition, and health workers doubted whether the growth standards of onecommunity were applicable to another. With further experience it is now realized that the place onthe growth chart where a child's weight falls is not so important as the shape of his growth curvecompared to the standard. This knowledge has helped to remove a great deal of controversy andcontributed to the spread of weight charts in most countries of the Third World. When Morleydescribed the first weight chart in Nigeria it carried two curves. The upper curve represented mean
weights of children from the upper social class and the lower curve did the same for the lower socialclass. Since then there has been considerable debate with regard to local standards, definition of"normal, children and so on. This controversy delayed the development of local weight charts.When it was realized that it was the shape of the child's weight curve as compared to normal whichwas important, and not the actual weight, the use of weight charts based on the Harvard standardsreceived a great boost. More recently a working party convened by the World Health Organizationhas developed a weight chart for international use (figure 7.2) based on American data. In thesecharts the upper lines represent the 97th and 50th percentiles respectively. The lower lines are 3rd
percentile, -3 standard deviation and -4 standard deviation respectively. Thus, further developmentin the concept first proposed by Gomez and colleagues has facilitated the regular use of weightcharts in children's clinics in many countries.
Figure 7.2 Weight Chart for International Use
245

7/23/2019 KEP pada anak berak celana
http://slidepdf.com/reader/full/kep-pada-anak-berak-celana 10/44
Mother and Child Nutrition in the Tropics and Subtropics
Chapter 7 Protein-energy Malnutrition246
Present experience shows that it is possible to train auxiliaries and even lesser-trained health personnel in the charting and interpretation of growth records. In the present state of developmentof health services even these are not available in all areas and the new trend is to train part-timevillage health workers who are not always literate. A yet simpler way of assessing nutritional status
of children is therefore required. Circumference of the mid-arm as an indicator of muscle mass has been used as one of the parameters for measuring nutritional status. It is known that in the normalchild between the ages of 1 and 5 years the arm circumference changes very little. Here then is a
parameter which is age-independent. (Fig.7.3).
Figure 7.3 The mid-arm
circumference as a measure of
nutritional status
The first practical use of this concept was made during the Biafran war for selecting malnourishedindividuals in the refugee camps for intensive rehabilitation. The arm circumference was comparedwith the height of the individual and grades of malnutrition were identified in accordance with the
percentage reduction in the arm circumference. A height measuring stick is marked off in armcircumference measurements (80% and 85% of normal) against height. The method came to beknown as the Quac Stick. It compares mid-arm circumference with the height of the child. (See fig.7.4)
246

7/23/2019 KEP pada anak berak celana
http://slidepdf.com/reader/full/kep-pada-anak-berak-celana 11/44
Mother and Child Nutrition in the Tropics and Subtropics
Chapter 7 Protein-energy Malnutrition247
Figure 7.4 Quac Stick in use in Biafra
More recently, Shakir has shown in Baghdad children that measurement of the arm circumferencewas a useful tool for diagnosing malnutrition. Children whose arm circumference was less than 75
per cent of the standard also had a body weight less than 60 per cent of the Harvard standard in ninecases out of ten in his series. The practical value of this observation is that primary-school childrenand illiterate village health workers can be trained to use a string or a strip of plastic with a markand colours in green (over 14.0 cm), yellow (12.5-14.0 cm) and red (less than 12.5 cm) forassessing malnutrition in village children (figure 7.5)
247

7/23/2019 KEP pada anak berak celana
http://slidepdf.com/reader/full/kep-pada-anak-berak-celana 12/44
Mother and Child Nutrition in the Tropics and Subtropics
Chapter 7 Protein-energy Malnutrition248
Figure 7.5 Measuring mid-arm circumference
Experience in several countries has shown the practical usefulness (Figure 7.4). of the abovemethods of measuring less severe forms of malnutrition. In the Narangwal study conducted infourteen villages in the Punjab, North India, 3000 children aged 1-36 months were observed
regularly for several years. It was found that taking weight for age as the parameter according to theGomez classification, the risk of death for a child between 70 and 80 per cent of the Harvard meanwas more than For a child between 60 and 70 per cent it was more than 10 times. When annualmortality rates were computed for each nutritional level it was found that an approximate doublingof mortality occurred with each 10 per cent drop in nutritional status. (See fig. 7.6).
Figure 7.6 Mortality by
age for weight
248
7/23/2019 KEP pada anak berak celana
http://slidepdf.com/reader/full/kep-pada-anak-berak-celana 13/44
Mother and Child Nutrition in the Tropics and Subtropics
Chapter 7 Protein-energy Malnutrition249
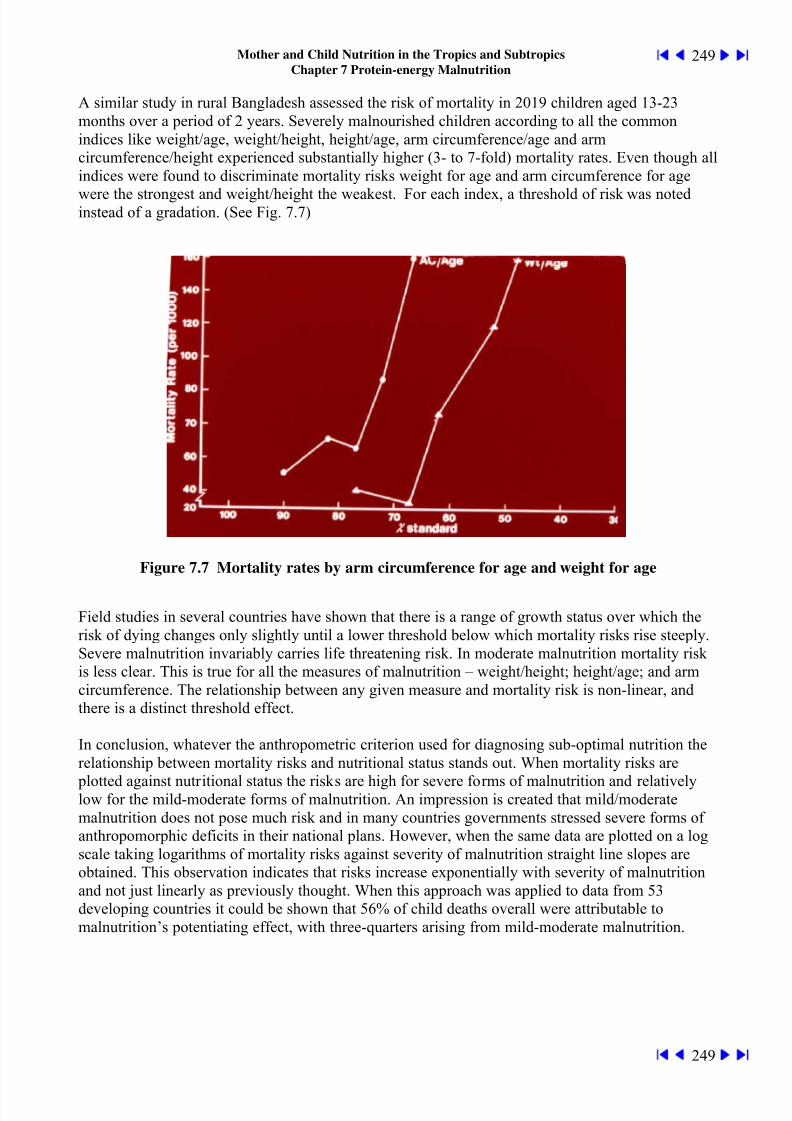
A similar study in rural Bangladesh assessed the risk of mortality in 2019 children aged 13-23months over a period of 2 years. Severely malnourished children according to all the commonindices like weight/age, weight/height, height/age, arm circumference/age and armcircumference/height experienced substantially higher (3- to 7-fold) mortality rates. Even though allindices were found to discriminate mortality risks weight for age and arm circumference for age
were the strongest and weight/height the weakest. For each index, a threshold of risk was notedinstead of a gradation. (See Fig. 7.7)
Figure 7.7 Mortality rates by arm circumference for age and weight for age
Field studies in several countries have shown that there is a range of growth status over which therisk of dying changes only slightly until a lower threshold below which mortality risks rise steeply.Severe malnutrition invariably carries life threatening risk. In moderate malnutrition mortality riskis less clear. This is true for all the measures of malnutrition – weight/height; height/age; and armcircumference. The relationship between any given measure and mortality risk is non-linear, andthere is a distinct threshold effect.
In conclusion, whatever the anthropometric criterion used for diagnosing sub-optimal nutrition therelationship between mortality risks and nutritional status stands out. When mortality risks are
plotted against nutritional status the risks are high for severe forms of malnutrition and relativelylow for the mild-moderate forms of malnutrition. An impression is created that mild/moderatemalnutrition does not pose much risk and in many countries governments stressed severe forms ofanthropomorphic deficits in their national plans. However, when the same data are plotted on a logscale taking logarithms of mortality risks against severity of malnutrition straight line slopes areobtained. This observation indicates that risks increase exponentially with severity of malnutritionand not just linearly as previously thought. When this approach was applied to data from 53developing countries it could be shown that 56% of child deaths overall were attributable tomalnutrition’s potentiating effect, with three-quarters arising from mild-moderate malnutrition.
249
7/23/2019 KEP pada anak berak celana
http://slidepdf.com/reader/full/kep-pada-anak-berak-celana 14/44
Mother and Child Nutrition in the Tropics and Subtropics
Chapter 7 Protein-energy Malnutrition250
In the case of the newborn, birth weight is a useful indicator of mortality risks in the neonatal periodand the first half of infancy. In the first 3 years of life, weight for age can effectively identify thosechildren who are at risk of death. After the age of 1 year and up to the age of 5, the armcircumference is a useful quick technique for identifying those at risk. Children who are bothwasted and stunted face greatly increased danger and should be carefully supervised.
CLINICAL FEATURES
In the early stage of malnutrition clinical signs are few and even absent, and diagnosis requires both biochemical tests and anthropometric measurements.
In the severe forms, growth failure is obvious. In addition, activity is reduced so that the child islistless and apathetic or irritable. Because of this irritability communication between the child andthe parents is minimal, and often resentment builds up. There is also discoloration of hair and skin,anaemia of varying severity, signs of associated deficiencies and presence of infection.
Kwashiorkor
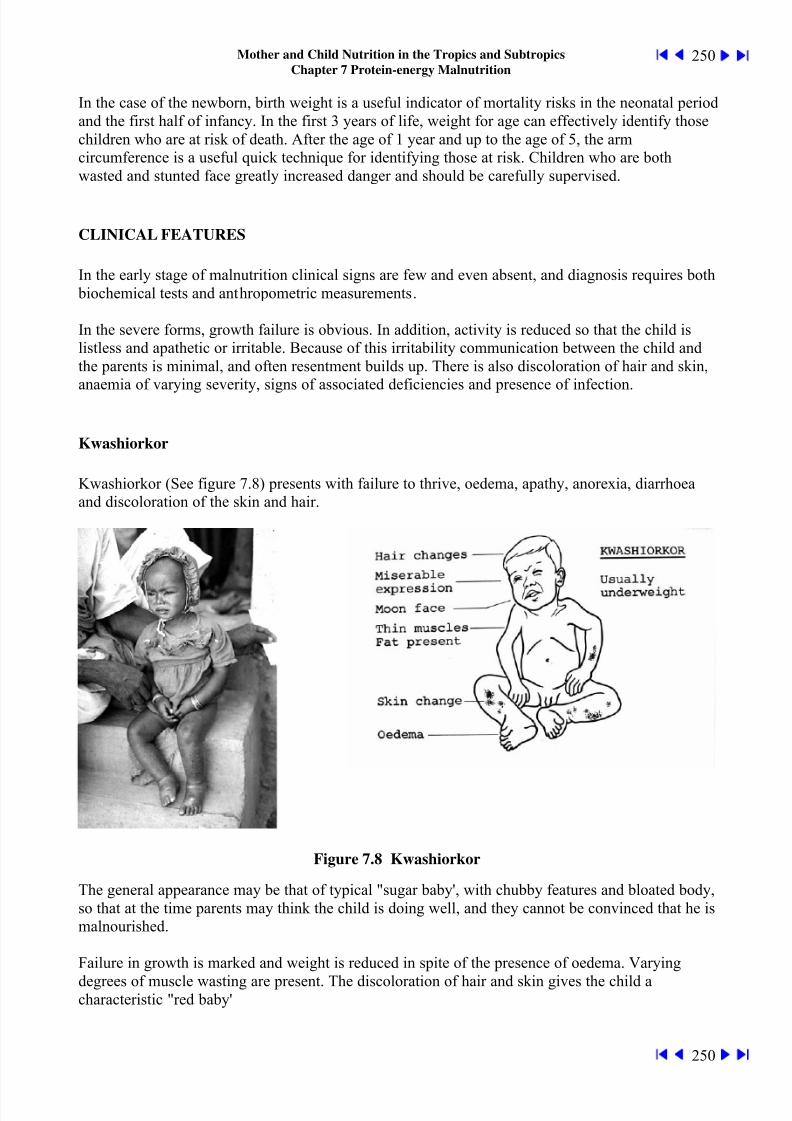
Kwashiorkor (See figure 7.8) presents with failure to thrive, oedema, apathy, anorexia, diarrhoeaand discoloration of the skin and hair.
Figure 7.8 Kwashiorkor
The general appearance may be that of typical "sugar baby', with chubby features and bloated body,so that at the time parents may think the child is doing well, and they cannot be convinced that he ismalnourished.
Failure in growth is marked and weight is reduced in spite of the presence of oedema. Varying
degrees of muscle wasting are present. The discoloration of hair and skin gives the child acharacteristic "red baby'
250

7/23/2019 KEP pada anak berak celana
http://slidepdf.com/reader/full/kep-pada-anak-berak-celana 15/44
Mother and Child Nutrition in the Tropics and Subtropics
Chapter 7 Protein-energy Malnutrition251
appearance. In addition, various forms of skin disorder can also occur. These can vary from thecharacteristic "flaky paint' dermatoses to fissures and at times raw ulcerating areas chiefly at theflexures and the buttocks.
Oedema is the characteristic clinical sign of kwashiorkor. It appears first on the dorsum of the feet
and ankles and spreads upwards to involve the rest of the body. Oedema fluid can represent 5-20 per cent of body weight so that change in the appearance of the child when the fluid is lost can bestriking.
Another major characteristic is the change in personality. Most children with kwashiorkor areapathetic or extremely irritable and miserable. Marked improvement in temperament occurs ontreatment, and many clinicians stress that the return of the smile is the first sign of improvement.
Physiological functions of the various systems are markedly disturbed, with diarrhoea, electrolytedisturbance, circulatory insufficiency, metabolic imbalance and poor renal function. Hence the childwith kwashiorkor should be thought of as an emergency in need of intensive medical and nursing
care, and not just simply malnourished.
Marasmus (See figure 7.9)
This usually occurs in younger children, with failure to thrive. Affected children are short and lightfor their age. In appearance they are shrunken and wizened due to lack of subcutaneous fat. Untilrecently kwashiorkor had aroused maximum interest and attention, but it is now increasinglyrealized that marasmus is a fast-growing disease of the large urban slums and shanty towns in thecities of the Third World. The sharp increase in bottle feeding amongst the urban poor and the new
migrants to the cities is largely responsible for the increase in the incidence of marasmus. Since theslums and shanty towns are also the "septic fringes' of the cities, the marasmic child commonlysuffers from infections of all sorts, though more commonly respiratory and diarrhoeal illnesses.
251
7/23/2019 KEP pada anak berak celana
http://slidepdf.com/reader/full/kep-pada-anak-berak-celana 16/44
Mother and Child Nutrition in the Tropics and Subtropics
Chapter 7 Protein-energy Malnutrition252
Figure 7.9 Marasmus
ASSOCIATED DEFICIENCIES
Nutritional deficiency is very rarely restricted to just one or two nutrients. As a rule the deficiency
is generalized so that, besides clinical signs of protein and calorie deficiency, there also exist signsof vitamin and other deficiencies.
Many of the illnesses which precipitate protein-calorie malnutrition also provoke loss of nutrientsfrom the body in the same way as they cause a negative nitrogen balance. The type of local foodstaple, the age of the child, and the time over which the child's diet has been insufficient also help todetermine the severity and the nature of associated deficiencies, the most common of which arethose of the fat-soluble and water-soluble vitamins and of iron.
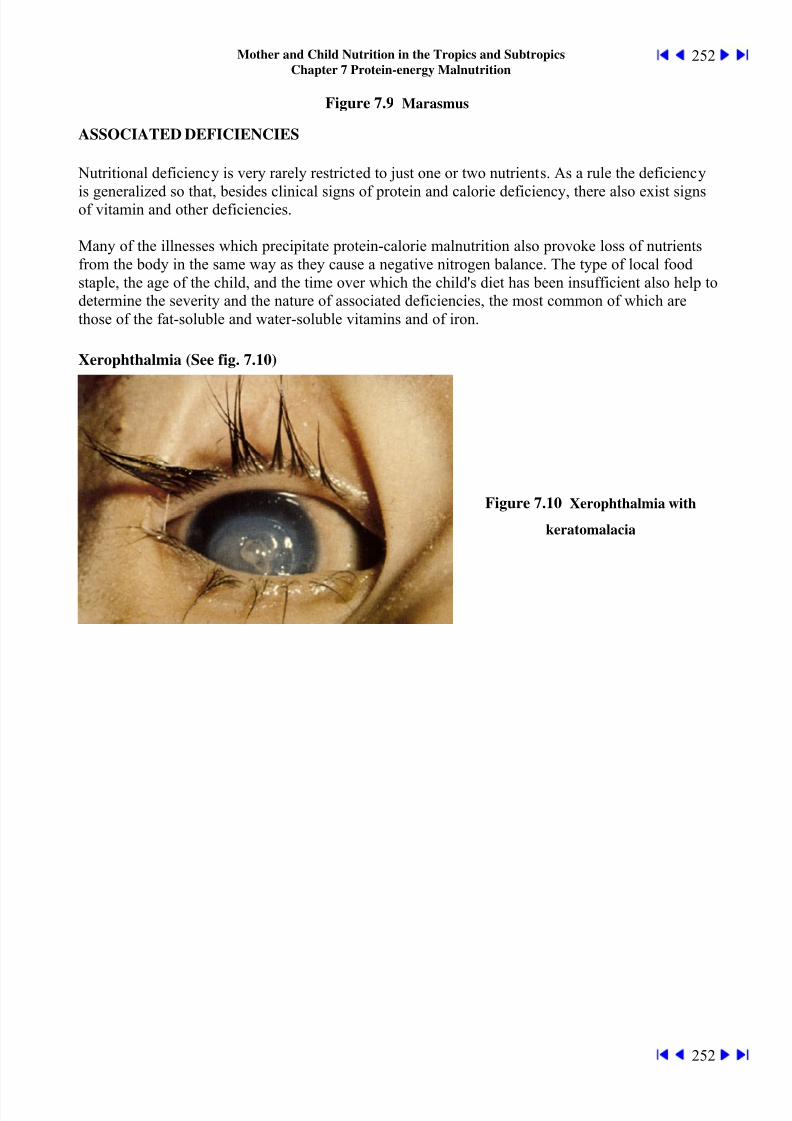
Xerophthalmia (See fig. 7.10)
Figure 7.10 Xerophthalmia with
keratomalacia
252

7/23/2019 KEP pada anak berak celana
http://slidepdf.com/reader/full/kep-pada-anak-berak-celana 17/44
Mother and Child Nutrition in the Tropics and Subtropics
Chapter 7 Protein-energy Malnutrition253
In the rice-eating countries of South East Asia, deficiency of vitamin A is endemic and iscommonly associated with protein-energy malnutrition. In Indonesia about three-quarters of allcases of kwashiorkor are reported to also have xerophthalmia. In Thailand the incidence is 40 percent, but in East and West Africa and in the West Indies the reported incidence is only about 1 percent. Clinical deficiency is only the tip of the iceberg, because in endemic areas children with PEM
but no clinical eye signs invariably have low levels of vitamin A and depleted liver stores of thevitamin. Presence of eye lesions therefore indicates a long-standing deficiency and is often a dangersignal, since the mortality from PEM in such cases is about four times that of children who have noocular lesions.
Rickets (See Fig. 7.11)
Figure 7.11 Rickets in malnutrition
Rickets is a common finding in cases of PEM from the urban slums and inner-city areas. It is morecommon in the younger child suffering from marasmus than in the older child suffering fromkwashiorkor.Rickets, like xerophthalmia, has been more commonly reported from South East Asia, where
prevalence rates of 15- 18 per cent have been recorded. It is a rare finding in East and West Africaand in the West Indies. In endemic areas malnourished children without clinical rickets have low
blood levels of the active form of vitamin D.
Vitamin B deficiency (See fig. 7.12)
Figure 7.12Angular
stomatitis of
Vitamin B deficiency
Laboratory testsshow that children
253

7/23/2019 KEP pada anak berak celana
http://slidepdf.com/reader/full/kep-pada-anak-berak-celana 18/44
Mother and Child Nutrition in the Tropics and Subtropics
Chapter 7 Protein-energy Malnutrition254
with PEM have depleted stores of the water-soluble vitamins, chiefly those of the B group. In manycases there are visible manifestations of deficiency disease. The effects of protein deficiency on themucosal lining of the mouth, skin and gastrointestinal tract may alter the classic manifestations ofB-complex deficiency. Many vitamins act as co-enzymes in several key metabolic reactions in thecell. Their deficiency, together with the deficiency of protein and calories, can seriously disrupt cell
function. Supplementation with vitamins during treatment is essential in order to replenish tissuestores and to ensure optimal function of the new tissue generated during growth.
Anaemia
Anaemia is also a common accompaniment of protein-calorie malnutrition. The commonest form ofanaemia is of the iron deficiency type, which is as expected, since iron deficiency is so widespreadin the tropics. But there is very little response to iron therapy until such time as recovery frommalnutrition also begins. In several countries the anaemia is reported to respond better to folic acidand B 12 than to iron. Hence during recovery it is important to administer several haematinics, themore so because treatment is usually based on an artificial formula containing high energy and
protein, and not on a complete food as such.
PATHOLOGICAL FEATURES AND CHANGES IN METABOLISM
As the fat stores of the body are consumed and muscle tissue depleted total body water increases asa percentage of body weight. A direct relationship can be demonstrated between weight deficit andtotal body water. A proportionate increase occurs in the extra cellular fluid. On recovery, some ofthe excess extra cellular fluid is taken up by the re-generating cells and some is lost by diuresis.
As the tissue cells break down, potassium and nitrogen are lost in equal proportions initially. Laterthere is increased loss of potassium in diarrhoeal stools causing a cellular deficit of potassium. Thetotal body protein is severely reduced, ranging from 55 to 80 per cent (average 59 per cent) ofnormal. Non-collagen protein is depleted more than collagen protein. Muscle mass is greatlydiminished and may be only 30 per cent of normal for age. Similarly, in marasmus, body fat mayfall as low as 5 per cent of total body weight, compared to the normal of 19 percent.
254

7/23/2019 KEP pada anak berak celana
http://slidepdf.com/reader/full/kep-pada-anak-berak-celana 19/44
Mother and Child Nutrition in the Tropics and Subtropics
Chapter 7 Protein-energy Malnutrition255
Changes in the digestive system
Liver (See fig. 7.13)
Figure 7.13 Fatty
degeneration in the
section on the right with
normal liver tissue on the
left for comparison.
(Note the wide separation of the nuclei in the section on the right due to accumulation of lipid in the cells.)
Fatty liver is characteristic of kwashiorkor. The fat content of the liver may be as high as 50 percent of the total wet weight. As recovery occurs, fat gradually disappears. Electron microscopy ofliver tissue obtained by biopsy reveals that after 3 weeks of treatment on a balanced diet the liver
cells are still not visibly normal, even though serum protein levels have reached normal levels.Recognizable liver pathology can be identified even after 10-12 weeks of treatment. Total recoveryeventually occurs and liver biopsy 5 years later on light microscopy has shown no signs of residualdamage. There are two obvious reasons for the fatty liver. There is an increased flux of fatty acidsfrom adipose tissue for the production of energy. At the same time there is decreased hepaticsynthesis of P-lipoproteins which normally transport triglycerides from the liver. The synthesis ofthe apo-protein part of this fat transporting mechanism is particularly sensitive to lack of protein inthe diet.
PANCREAS
There is a marked atrophy of the acinar cells, and exocrine secretion is reduced in keeping with theatrophic changes. Enzyme activity of the pancreatic juice has been reported to be as low as 50 percent of normal.Recovery takes place within the first few days of instituting treatment. Investigationof B cell function reveals that in both kwashiorkor and marasmus insulin secretion is abnormallylow after oral administration of glucose. Improvement occurs after 3-6 weeks of treatment, thoughthere are instances where an abnormal response persisted up to 10 months after recovery frommalnutrition.
255

7/23/2019 KEP pada anak berak celana
http://slidepdf.com/reader/full/kep-pada-anak-berak-celana 20/44
Mother and Child Nutrition in the Tropics and Subtropics
Chapter 7 Protein-energy Malnutrition256
GASTROINTESTINAL TRACT (See fig. 7.14)
Figure 7.14 Villous atrophy in malnutrition seen in section on the right. Normal gut tissue for
comparison on the left.
(Note the long feathery villi in the normal gut as compared to the blunted villi in the section on the right
Striking morphological changes occur in the jejunum, especially in kwashiorkor. In particular,villous atrophy may be severe. Enzyme activity is reduced within the cells in keeping with themorphological changes. The enzymes most affected are the ones located in the brush border. Ofthese, lactase has been studied extensively because it is more severely affected and because mostdiets used for recovery are based on milk and contain large quantities of lactose. Besides thesemorphological changes, the small intestine also suffers from bacterial overgrowth with invasion ofthe proximal gut by the bacterial flora of the distal part of the small intestine. Malabsorption of fathas been correlated with bacterial degradation of bile salts so that the concentration of conjugated
bile salts in the gut lumen falls below the critical level necessary for forming micelles with fat.Intestinal permeability is increased as measured by the inert sugars lactulose and L-rhamnose.Decreased L-rhamnose recovery in urine indicating malabsorption, and increased lactulose recoveryindicating permeability serve as independent predictors of mortality. Improvement in intestinal
permeability is slow to occur with nutritional therapy, and can lag much behind improvement inweight.
Some atrophy of the gastric mucosa is common in the majority of cases. Fasting gastric pH is oftenin the neutral range. Thus the function of the stomach acid as a barrier to intestinal contamination ismuch reduced. This is supported by the observation that fasting stomach contents in childrensuffering from PEM have high bacterial and fungal counts.
The changes in gut morphology, together with reduction in the amounts of pancreatic enzymes and bacterial overgrowth of the small gut as well as parasitic disease, are together responsible for thecommon occurrence of diarrhoea in malnutrition. Impairment of absorption is also likely, but, inmost cases, is not severe enough to interfere with recovery. For example, up to 33 g of fatcontaining unsaturated fatty acids is tolerated daily by malnourished children. Clinical experience
with diets containing large quantities of vegetable fat supports this observation and cottonseed oil is
256

7/23/2019 KEP pada anak berak celana
http://slidepdf.com/reader/full/kep-pada-anak-berak-celana 21/44
Mother and Child Nutrition in the Tropics and Subtropics
Chapter 7 Protein-energy Malnutrition257
now a common ingredient of many dietary regimens. With regard to protein digestion, it has beenfound that even though faecal nitrogen excretion in malnourished children ison average twice the normal, there is no serious malabsorption of nitrogen. More than three-quartersof the nitrogen in the diet is absorbed and is usually sufficient to allow the initiation of a cure exceptin very severe diarrhoea. Intolerance of lactose can present a serious problem at times, but even here
the incidence of practical difficulties with feeding is small (less than 10 per cent). Thus, knowledgeof the alteration indigestion and absorption is helpful in dealing with complications when they arise,
but these are rare and in most cases it is possible to treat and rehabilitate children suffering frommalnutrition without the need for sophisticated laboratory support.
HEART (See Fig. 7.15)
Figure 7.15 Normal myocardium on the left for comparison with section of heart muscle
obtained at post mortem in a child who died of kwashiorkor.
(Note the degenerative changes with, intense vacuolation and cells of varying size in the section on theright).
The heart muscle suffers in the general atrophy of all muscle tissue. Cardiac output is reduced inaccord with the reduced body metabolism. Doppler echocardiograms show reduced thickness of
septum and posterior cardiac wall compared to age matched controls. The total left ventricular massand cardiac output are reduced in proportion to decrease in body size. Institution of treatment, bystimulating metabolism, can often precipitate congestive cardiac failure. The salt content of thetherapeutic diet and presence of anaemia may contribute to congestive cardiac failure.
HAEMOPOIETIC SYSTEM
A mild to moderate anaemia is a common accompaniment of PEM. Deficiency of nutrients such as protein, iron and folic acid, in addition to bone marrow depression due to infection, are allundoubtedly involved in the aetiology of the anaemia. Parasitic infections such as malaria and
hookworm are also of relative importance in the tropics where childhood malnutrition is common.The fall in haemoglobin is related to reduction in the erythrocyte mass which commences with
257

7/23/2019 KEP pada anak berak celana
http://slidepdf.com/reader/full/kep-pada-anak-berak-celana 22/44
Mother and Child Nutrition in the Tropics and Subtropics
Chapter 7 Protein-energy Malnutrition258
tissue wasting and loss of body weight. Megaloblastic changes in the bone marrow frequently occurand in some areas, e.g. the Sudan, the anaemia is reported to respond to folic acid administration. Inthe first few days of treatment, with regeneration of plasma proteins and the expansion of plasmavolume, the concentration of haemoglobin may fall further, thereby accentuating the anaemia.
Immune System
Profound changes occur in cell-mediated immunity, the complement system, and in the function of polymorphonuclear lymphocytes. The thymus is consistently reduced in size. Seroconversion inresponse to vaccination seems to be preserved. The complement system shows consistentabnormality with decreased C3 levels. Alterations in defense mechanisms are further discussed
below.
MUSCLE (See Fig. 7.16)
Figure 7.16 Skeletal muscle in severe malnutrition on the right hand section.
(Note the nuclei are concentrated in the right hand section indicating loss of cytoplasm from thecells. Both specimens show striations which are typical of skeletal muscle)
The muscle compartment of the body comprises a large mass of protein which is both labile andsensitive to dietary changes. Muscle wasting is an early result of PEM. Electron microscopy showsdepletion of myofibrils, mitochondrial swelling, glycogen depletion and disorganization ofsarcomere. At recovery the average muscle mass is usually about twice that during themalnourished state. Muscle and fat biopsies in malnourished Peruvian infants at the time ofadmission and again 4-9 months later, after recovery, show that there is a gross reduction of musclecell size in malnourished infants. Improvement takes place with recovery, but the cell size continuesto remain subnormal after recovery. Thus clinical recovery does not always reflect cellular maturity.
258

7/23/2019 KEP pada anak berak celana
http://slidepdf.com/reader/full/kep-pada-anak-berak-celana 23/44
Mother and Child Nutrition in the Tropics and Subtropics
Chapter 7 Protein-energy Malnutrition259
BRAIN AND THE NERVOUS SYSTEM
Research in the effects of malnutrition on the brain encounters severe difficulties. There is thevirtual inaccessibility of the brain for study. Secondly, our ignorance of the physical basis of higher
mental function is such that it is impossible to relate structural change to function Thirdly, theimportant effect of environmental stimulation on intellectual ability makes it difficult to untanglethe effects of lack of stimulation from that of undernutrition, since often the two co-exist. However,animal experiments together with observations on long-term effects of malnutrition in children havehelped to identify several basic principles. The vulnerability of the growing brain to periods ofmalnutrition is now widely accepted. The period of growth of the human brain corresponding to a"vulnerable period' in animal experiments would seem to extend from about mid-pregnancy to thesecond birth day.
The type of damage suffered is closely related to the timetable of development, and will dependupon the developmental events at the time of the insult. Growth impairment is more in the form offailure of assembly of certain components (or their sizes or numbers) rather than destructive lesions.Thus, the mature product may turn out to be not only deficient or small, but also distorted.Metabolic and biochemical functions of the brain may be altered, and several of these, like catecholamine metabolism, are related to higher mental functions. Hence at a time when a large number ofcomponents are being formed and assembled, the vulnerability is greatly increased, as for exampleduring the period of the growth spurt of the brain.
The timetable of brain development is such that many of the event have possibly only a singleopportunity to occur. If conditions are no optimal at a given time, that opportunity is lost andcompensation may be difficult. This means that different parts of the brain may be affected to a
variable extent by the same insult. The cerebellum, for example, is selectively affected and withinthe cerebellum certain structures bear the major brunt.
How do the above principles derived from laboratory studies an animal experiments relate to thesituation in the human? In one study 74 J Jamaican school-age boys, who had suffered severemalnutrition in the first 2 years of life, were compared with male siblings closest in age andclassmates or neighbours matched for age and sex. The IQ was found to be significantly lower in allaspects of measurements in the index cases, and in particular the full scale and verbal IQ. In thisstudy, however, no relationship could be established between the level of IQ and the age at whichmalnutrition occurred. Another study from South Africa followed up 20 children who were grosslyu undernourished in infancy, until they were 15-18 years old. All the children scored low on full
scale and verbal quotient. Other tests showed a marked disturbance of visual-motor perception in17 of these children. Even though a catch-up in height had occurred in all the children, thedifference in head circumference as compared to controls got worse. The persistence of low IQ wellinto the teens indicates the permanence of damage to mental function. Similar studies from Ugandahave confirmed these observations and have related the mental deficit to the chronic undernutritionsuffered by such children.
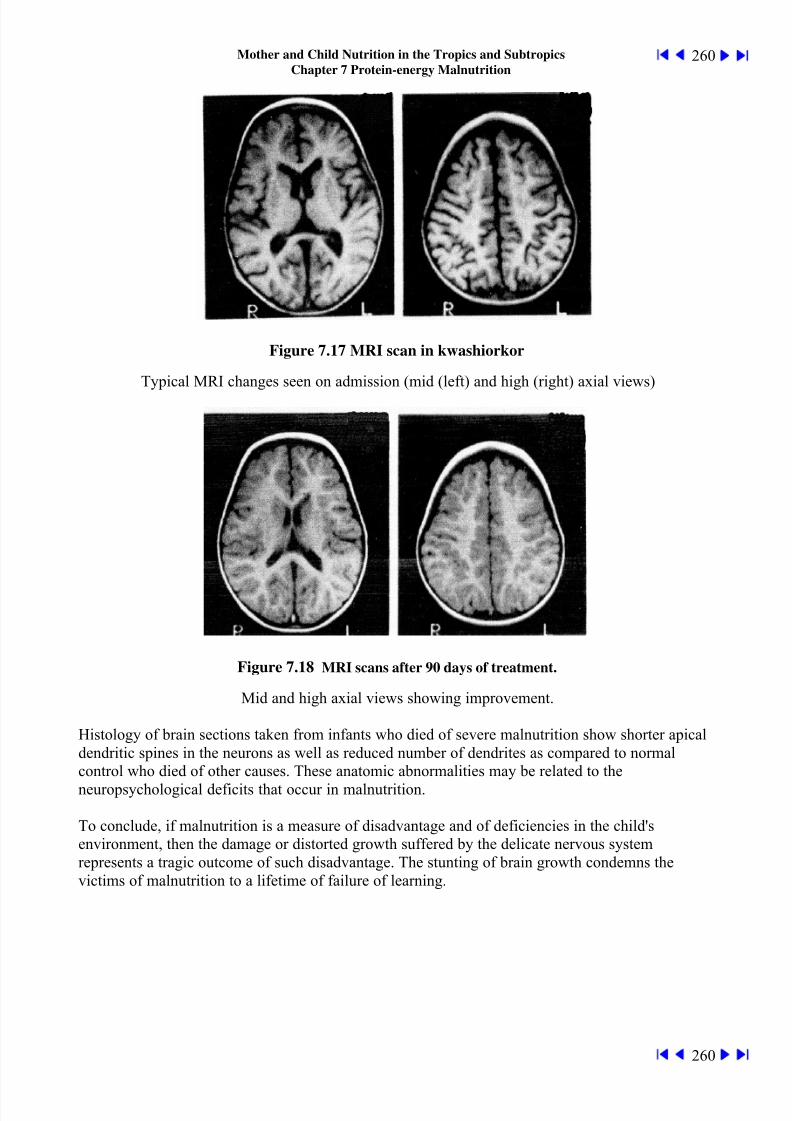
When magnetic resonance imaging technique was applied to children admitted with severekwashiorkor brain shrinkage was found in every one of those investigated. White and grey matterwere found to be equally affected. Following three months of treatment the changes in brain showimprovement in keeping with gain in weight and improvement in serum protein levels. (See Figs.
7.17 and 7.18)
259
7/23/2019 KEP pada anak berak celana
http://slidepdf.com/reader/full/kep-pada-anak-berak-celana 24/44
Mother and Child Nutrition in the Tropics and Subtropics
Chapter 7 Protein-energy Malnutrition260
Figure 7.17 MRI scan in kwashiorkor
Typical MRI changes seen on admission (mid (left) and high (right) axial views)
Figure 7.18 MRI scans after 90 days of treatment.
Mid and high axial views showing improvement.
Histology of brain sections taken from infants who died of severe malnutrition show shorter apicaldendritic spines in the neurons as well as reduced number of dendrites as compared to normalcontrol who died of other causes. These anatomic abnormalities may be related to the
neuropsychological deficits that occur in malnutrition.
To conclude, if malnutrition is a measure of disadvantage and of deficiencies in the child'senvironment, then the damage or distorted growth suffered by the delicate nervous systemrepresents a tragic outcome of such disadvantage. The stunting of brain growth condemns thevictims of malnutrition to a lifetime of failure of learning.
260

7/23/2019 KEP pada anak berak celana
http://slidepdf.com/reader/full/kep-pada-anak-berak-celana 25/44
Mother and Child Nutrition in the Tropics and Subtropics
Chapter 7 Protein-energy Malnutrition261
Metabolic changes
CARBOHYDRATE METABOILISM
Low blood sugar is a common accompaniment of PEM. Two types of hypoglycemia have beenidentified - asymptomatic, from which recovery occurs with feeding; and the profound irreversibletype, associated with severe mal nutrition, hypothermia or infection. As a general rule, if the childhas hypothermia it is almost certain that hypoglycemia is also present.
FAT METABOLISM
Fat malabsorption is common in PEM, but the degree is rarely serious enough to cause steatorrhoea.Probably the most serious result of fat malabsorption is the impairment of absorption of fat-solublevitamins.It has been found that vegetable fats are better absorbed than animal fats and this is the rationale
behind the use of cottonseed oil as a source of energy in the treatment of kwashiorkor.
PROTEIN METABOLISM
Protein digestion, though inefficient because of low levels of pancreatic trypsin is sufficient forrecovery to occur when an adequate diet is being fed. On average, absorption of nitrogen from amilk-based diet is 70-80 per cent as compared to 90 per cent in the normal child. Similarly, in theabsence of complicating infection, nitrogen is well retained, being in the range of 20-40 per cent ofthe intake. Thus, protein repletion through a greatly enhanced anabolism is usual as soon assufficient protein is given. Nitrogen retention continues to be high until a normal growth rate has
been attained.
Albumin synthesis and its level in plasma are very sensitive to protein intake. There is an immediatefall when dietary deficiency occurs, and a rise when the deficiency is corrected. Serum albumin
levels are also sensitive to infection. The longitudinal study of Ugandan children referred to earliershowed that a combination of respiratory infection, diarrhoea and malaria caused a dramatic fall inserum albumin.
261
7/23/2019 KEP pada anak berak celana
http://slidepdf.com/reader/full/kep-pada-anak-berak-celana 26/44
Mother and Child Nutrition in the Tropics and Subtropics
Chapter 7 Protein-energy Malnutrition262
Defense mechanisms
The child with malnutrition is susceptible to infection. The body's defenses are unable to mount an
adequate response to microbial challenge so that the mildest infection tends to spread and becomegeneralized. In severe cases the clinical response to infection, like fever and phagocytosis, may beabsent and the first sign of widespread infection may be sudden deterioration in the generalcondition, refusal to take food and hypothermia.
Studies of the body's defense mechanisms reveal adequate capacity for humoral immunity. Thusimmunoglobulin levels in the blood are normal and there are normal numbers and proportions of Blymphocytes, which produce immunoglobulins. Secretory IgA in salivary and naso-pharyngealsecretions, and in the gastrointestinal tract, is reduced and does not rise in response to antigenicchallenge. This impairment of secretory antibody response in malnourished children explains theirslow recovery from enteric infections and viral illnesses like measles. In contrast to humoral
immunity, cellular immunity (T-cell function) is profoundly impaired. T-lymphocytes are reducedin number to about a third of normal and various tests of their functions also show impairment. Inkeeping with the lowered cellular immunity, all lymphoid organs show atrophy, especially thethymus. Several studies have now established that in protein-energy malnutrition and/or deficiencyof single nutrients that take part in nucleic acid metabolism generally there is atrophy of lymphoidtissue and dysfunction of cell mediated immunity. Deficiencies of single nutrients can impair the
production of key proteins. A useful clinical sign for assessing the involution of lymphoid organs isthe size of the tonsils in malnourished children. Phagocytic function is also inefficient and severalworkers have emphasized its correlation with iron deficiency, especially lower levels of serumtransferrin.
Accompanying deficiency of micronutrients often compounds the difficulty. Of the micronutrientsvitamins A, C, E and B6 and folic acid are important to consider. Metals like zinc, selenium, iron,copper have influences on immune response, and many are deficient in severe malnutrition.
Immunological recovery in response to treatment lags much behind improvement in weight. Hencethe child remains prone to cross infection for a long time after clinical recovery and discharge fromhospital.
262

7/23/2019 KEP pada anak berak celana
http://slidepdf.com/reader/full/kep-pada-anak-berak-celana 27/44
Mother and Child Nutrition in the Tropics and Subtropics
Chapter 7 Protein-energy Malnutrition263
Management of Severe Malnutrition
Severe malnutrition is a serious disease. The median case fatality from the disease has remainedunchanged over several decades at 20 – 30 per cent. A likely cause could be faulty case
management with diets that are high in protein, energy and sodium as well deficient inmicronutrients placing undue stress on run down enzyme systems. Updated treatment guidelineshave been issued by the World Health Organization on which the following description is based.
The objectives of treatment are:
To achieve stabilization and institute correction of chemical imbalances.
To treat complications and reduce case fatality - the present mortality rates as high as 20-30 per centcan be reduced by careful reversal of the metabolic and physiologic slowdown in the organ systems.
To achieve rehabilitation on a well-balanced diet;
To prevent relapse and future deterioration through education of the parents;
To achieve long-term follow-up with a view to restoring the child to full health.
The initial requirement is to carefully assess for and treat complications like shock, dehydration,hypoglycemia, hypothermia, and infection. The early days are critical as the child is desperately illand the body's metabolic processes are at an ebb. Suspect shock if the child is lethargic orunconscious in addition to the other clinical signs of shock like cold extremities and thready pulse.Shock from dehydration and sepsis is likely to coexist, and what is more, response to intravenous
therapy in septic shock is slow. While preparing for intravenous fluids for treatment of shock checkfor and treat hypoglycemia and hypothermia.Hypoglycemia is an ever present risk for all severely malnourished children. Immediately onadmission they should receive oral glucose or sucrose solution or a feed if it is quickly available. Ifa feed cannot be made quickly available, dissolve 1 rounded teaspoon of sugar in 3 ½ tablespoonsof water and feed it to the child to be followed by the first feed as soon as possible. If the child isunconscious 5 ml/kg of 10% glucose should be given by a nasogastric tube. Testing forhypoglycemia (blood sugar < 3 mmol/L or < 54 mg/dl) by dextrostix should be carried outimmediately on admission for all patients.
Hypothermia, if present with hypoglycemia, is often a sign of serious infection and associated withhigh fatality. Axillary temperature of < 350C or rectal temperature <35.50C indicates hypothermia.Treatment includes immediate feeding with 10% glucose or sucrose as above, followed by oralfeeds, covering with bed clothes and nursing in close proximity to a source of heat includingmother’s body heat.
Infection. The usual signs of infection are not present, and yet prevalence of pneumonia, bacteraemia, and urinary tract infection is high. WHO advises empirical treatment with broadspectrum antibiotics for the first seven days. Intravenous administration of antibiotics isrecommended if hypothermia or hypoglycemia is present, or the child is lethargic or appears verytoxic and ill. It is the usual experience that the majority of children have some or all of the
following: malaria, worm infestation, respiratory infection some with tuberculosis, skin sepsis, or
263
7/23/2019 KEP pada anak berak celana
http://slidepdf.com/reader/full/kep-pada-anak-berak-celana 28/44
Mother and Child Nutrition in the Tropics and Subtropics
Chapter 7 Protein-energy Malnutrition264
urinary infection. Screening for, and treating these conditions if present, is an essential part ofmanagement.
Dehydration. If the child is passing watery stools one should assume some dehydration and the useof oral rehydration is recommended. The WHO ORS solution has a high sodium and low potassium
content and is not considered suitable for severely malnourished children. Instead WHOrecommends a modified solution named ReSoMal, to be administered at the rate of 5 ml/kg every30 minutes for the first 2 hours and 5 ml/kg/hour for the next 4 to 10 hours. ReSoMal is prepared asshown in Table 7.3:
Table 7.3 Formula for ReSoMal
Ingredient Amount
WaterWHO – ORS
Sugar (Sucrose)KCl solution*
orElectrolyte-mineral solution**
2litresOne 1-litre packet
50g45 ml
or40 ml
* KCl solution is prepared by dissolving 100g of KCl in 1 litre of water** Electrolyte-mineral solution is prepared according to the formula in Table 7.4 below.
If shock has been diagnosed, intravenous treatment with any of the following should becommenced:
Ringer’s lactate with 5% glucoseor
half-strength Darrow’s solution with 5% glucoseor
half normal saline with 5% glucose.
A careful and measured approach is necessary bearing in mind the weakened state of themyocardium and of the cardio vascular system as a whole. In the first hour 15 ml/kg of the fluid is
administered to be repeated if the child shows improvement. If there is no change consider septicshock.
Feeding during the initial phase of stabilization.
Feeding should commence as soon as possible after admission. If the child is breast feeding itshould be continued. Initial feeds should provide just enough energy and protein to maintain
physiologic processes, bearing in mind the run-down state of metabolic processes. Too much food, particularly protein, in the initial phase aggravates the metabolic imbalance. Hence a cautiousapproach is needed to begin with, and once the initial crisis is over intake of energy and protein can
be increased to make up the shortfall. Initial feeds should be:
264

7/23/2019 KEP pada anak berak celana
http://slidepdf.com/reader/full/kep-pada-anak-berak-celana 29/44
Mother and Child Nutrition in the Tropics and Subtropics
Chapter 7 Protein-energy Malnutrition265
low in osmolality and lactose provide 100 kcal/g/day, and 1 to 1.5 g/kg protein per day in 130ml/kg/day of fluid frequent and small if the child can take by mouth; if not, administered bynasogastric tube.(see Fig. 7.19)
Figure 7.19 Feeding with nasogastric tube.
In addition to protein and energy severely malnourished children are often deficient in a number ofmicronutrients like zinc, iron, copper and selenium as well as vitamins A, B complex, folic acid,and so on. These need to be provided with the feeds to help replenish body stores. Many of them areimportant constituents of cells. Moreover, deficiencies in zinc and vitamin A impair the function ofthe immune system, and are needed for the structure and function of mucosa. Zinc supplementationreduces the incidence of diarrhoea and pneumonia, and improves growth. Vitamin Asupplementation is known to reduce mortality and morbidity due to diarrhoea and measles. Ironsupplementation improves cognition and growth. Finally, many of the trace metals like copper and
selenium are important constituents of body cells, and would be needed as tissue regenerationcommences.
Electrolyte imbalance is common in severe malnutrition. Potassium and magnesium are importantconstituents of cells. As the patient recovers in response to diet and homeostasis gets established,electrolyte imbalance gets corrected but over a period of two weeks or more. WHO recommendssupplying extra potassium at the rate of 3 to 4 mmol/kg daily, and magnesium at the rate of 0.4 to0.6 mmol/kg daily. In the early stage of stabilization when only milk based feed are toleratedminerals and electrolytes can be supplemented together in the form of an electrolyte-mineralsolution added to the feeds. A concentrated form of electrolyte-mineral solution can be made up toserve as a stock solution. When stored in a fridge the stock solution has a shelf life of about 1
month. It should be discarded if it turns cloudy, and a fresh stock solution be made. Add 20 ml of
265

7/23/2019 KEP pada anak berak celana
http://slidepdf.com/reader/full/kep-pada-anak-berak-celana 30/44
Mother and Child Nutrition in the Tropics and Subtropics
Chapter 7 Protein-energy Malnutrition266
the concentrated solution to each 1000 ml of milk feed. The formulae for the electrolyte-mineralsolution and the starter milk feeds are given below in tables 7.4 and 7.5.
Table 7.4 Composition of concentrated electrolyte-mineral solution
Ingredient Weight (g)
Potassium chloride (KCl)Tripotassium citrateMagnesium chloride
Zinc acetateCopper sulphate
Water to make up
22481768.21.4
2500 ml
Add 20 ml of the above concentrated electrolyte-mineral solution to each 1000 ml of milk feed.
Each 20 ml of the solution contains the following:Potassium chloride 24 mmolTripotassium citrate 2 mmolMagnesium chloride 3 mmolZinc acetate 300 μmolCopper sulphate 45 μmol
Use 40 ml of the concentrated electrolyte-mineral solution for the ReSoMal solution described inTable 7.3
Table 7.5 Starter milk formula for treating malnutrition
Starter formula using
skimmed milk powder
Starter formula using cereal
flour* and skimmed milkDried skimmed milk (g) 25 25
Sugar (g) 100 70
Cereal flour (g) - 35
Vegetable oil (g) 27 27
Electrolyte-mineral solution (ml) 20 20
Water to make up final solution to (ml) 1000 1000
* The advantage of adding cereal flour is that of low osmolality which is of benefit for childrenwith persistent diarrhoea. The disadvantage is that it needs to be cooked for 4 minutes.
266

7/23/2019 KEP pada anak berak celana
http://slidepdf.com/reader/full/kep-pada-anak-berak-celana 31/44
Mother and Child Nutrition in the Tropics and Subtropics
Chapter 7 Protein-energy Malnutrition267
A comparable starter formula based on dried full cream milk powder can be made from:
Whole dried milk powder (g) 35Sugar (g) 100
Oil (g) 20Electrolyte-mineral solution (ml) 20
Water to make (ml) 1000 ml
If using fresh cow’s milk, the dried whole milk powder in the above list of ingredients may bereplaced with 300 ml milk.
The above formulae provide nutrients per 1000 ml as follows:
Nutrient per 1000 ml Starter formula using skimmed
milk
Starter formula using cereal flour
and skimmed milk
Energy (kcal) 75 75Protein (g) 0.9 1.1
Lactose (g) 1.3 1.3Potassium (mmol) 4.0 4.2
Sodium (mmol) 0.6 0.6Magnesium (mmol) 0.43 0.46
Zinc (mg) 2.0 2.0Copper (mg) 0.25 0.25
% energy from protein 5 6% energy from fat 32 32
Osmolality (mosmol/l) 413 334
Feeding Schedule.
A recommended feeding schedule with gradual increase in the volume and a proportional decreasein frequency of feeds is as follows:
Days Frequency Volume /kg/feed Volume/kg/day
1 – 2 2 hourly 11 ml 130 ml
3 – 5 3 hourly 16 ml 130 ml
6 onwards 4 hourly 22 ml 130 ml
Night feeds are essential. If there is staff shortage or if the carer accompanying the child cannot be
trained a nasogastric tube may be the only option. It is important, however, not to exceed100 kcal/kg/day in this critical initial phase. The volume of feed to be administered by the child’sweight is given in Table 7.6 below.
267

7/23/2019 KEP pada anak berak celana
http://slidepdf.com/reader/full/kep-pada-anak-berak-celana 32/44
Mother and Child Nutrition in the Tropics and Subtropics
Chapter 7 Protein-energy Malnutrition268
Table 7.6 Volume of Starter formula per feed by child’s weight.
Child’s weight 2-hourly 3-hourly 4-hourly(kg) (ml / feed) (ml / feed) (ml/feed)
2.0 20 30 452.2 25 35 50
2.4 25 40 55
2.6 30 45 55
2.8 30 45 60
3.0 35 50 65
3.2 35 55 70
3.4 35 55 75
3.6 40 60 80
3.8 40 60 85
4.0 45 65 90
4.2 45 70 90
4.4 50 70 95
4.6 50 75 100
4.8 55 80 105
5.0 55 80 110
5.2 55 85 115
5.4 60 90 120
5.6 60 90 125
5.8 65 95 130
6.0 65 100 130
6.2 70 100 1356.4 70 105 140
6.6 75 110 145
6.8 75 110 150
7.0 75 115 155
7.2 80 120 160
7.4 80 120 160
7.6 85 125 165
7.8 85 130 170
8.0 90 130 175
8.2 90 135 180
8.4 90 140 185
8.6 95 140 190
8.8 95 145 195
9.0 100 145 200
9.2 100 150 200
9.4 105 155 205
9.6 105 155 210
9.8 110 160 215
10.0 110 160 220
268

7/23/2019 KEP pada anak berak celana
http://slidepdf.com/reader/full/kep-pada-anak-berak-celana 33/44
Mother and Child Nutrition in the Tropics and Subtropics
Chapter 7 Protein-energy Malnutrition269
Vitamin supplements.
Protein energy malnutrition is a multi nutrient deficiency. In addition to minerals and electrolytessupplementation with vitamins is important since many of them serve as co-factors in the chemical
reactions within cells. WHO recommends particular attention to vitamin A (50 000 i.u. for childrenless than 6 months old; 100 000 i.u. for those aged 6 to 12 months; and 200 000 i.u. for olderchildren) on day 1.Folic acid 5 mg. should be administered on day 1 then, 1 mg daily.A multivitamin preparation to provide vitamins of the B complex group should also beadministered daily.
The Catch up phase
Return of appetite and improvement in the mental state of the patient signals that the critical early phase has been effectively dealt with, and the time for catching up on lost ground has come. This isapproximately a week or so after admission. The goal of treatment now is to regenerate tissuegrowth and to achieve weight gain greater than 10g/kg/day. The energy cost of laying down 1g ofmuscle tissue is 2kcal/g body weight, and that of laying down 1g of fat is between 8 to 10kcal/g/body weight. Thus catch up growth will depend on the provision of calories, protein andother nutrients in excess of normal requirements. Even then a cautious approach is needed for fearof stressing the slowly recovering physiological processes. Frequent feeds, amount depending uponthe patient’s appetite help to achieve energy and protein intake of 150 – 220 kcal/kg/day and
4 to 6 g /kg/day of protein. A switch over to a stronger formula for catch up growth that provides100 kcal and 2.9 g protein per 100 ml can now be considered. The recipe for such a formula is inTable 7.7 below.
Table 7.7 Recipe for catch up formula
Ingredients Formula based on dried
skimmed milk powder
Formula based on dried
whole milk powder
Formula based on fresh
cow’s milk
Milk (g) 80 110 880 mlSugar (g) 50 50 75
Vegetable oil (g) 60 30 20
Electrolyte-mineralsolution (ml)
20 20 20
Water to make up finalvolume (ml)
1000 1000 1000
269
7/23/2019 KEP pada anak berak celana
http://slidepdf.com/reader/full/kep-pada-anak-berak-celana 34/44
Mother and Child Nutrition in the Tropics and Subtropics
Chapter 7 Protein-energy Malnutrition270
The catch up formula provides nutrients as follows:
Nutrient / 100 ml
Energy (kcal) 100Protein (g) 2.9Lactose (g) 4.2
Potassium (mmol) 6.3Sodium (mmol) 1.9
Magnesium (mmol) 0.73Zinc (mg) 2.3
Copper (mg) 0.25% energy from protein 12
% energy from fat 53Osmolality (mosmol/l) 419
Daily administration of the multivitamin supplement and folic acid must continue in the catch up
phase. Modified porridge and other foods may be offered additionally. These can be modified asappropriate to provide energy and protein content as in the catch up formula. The catch up phase isalso the time for providing iron supplement orally if indicated.
Frequency of feeds.
The feeding schedule should continue as in the initial stabilization phase for the first 2 or 3 days, theonly difference being that the catch up formula now replaces the previous starter formula. Iftolerated each successive feed can be increased by 10 ml until some feed remains unconsumed,which is approximately when intake reaches about 200ml/kg/day. If the child is breast feeding it
should continue.
As catch up begins and the blood volume expands there is a danger of precipitating cardiac failure.The child should be carefully monitored for tachypnoea and tachycardia. Cardiac failure is unlikelyif a gradual transition to catch up formula is followed. If suspected the volume of feeds should bereduced to 100 ml/kg/day for 24 hours, and then gradually increased to 115 ml/kg/day for the next24 hours and 130 ml/kg/day for following 48 hours.
Monitoring growth in the catch up phase.
If weight gain is more than 10 g/kg/day the child is progressing well and the treatment should be
continued. If weight gain is between 5 – 10 g/kg/day it is unlikely that intake targets of nutrients are being met, or that underlying infection has been missed. If weight gain is < 5g/kg/day a fullassessment is called for. Feeding schedules and targets should be reviewed. Investigations forinfection, particularly tuberculosis should be undertaken. The quality of mothering and nursing careshould be assessed.
270
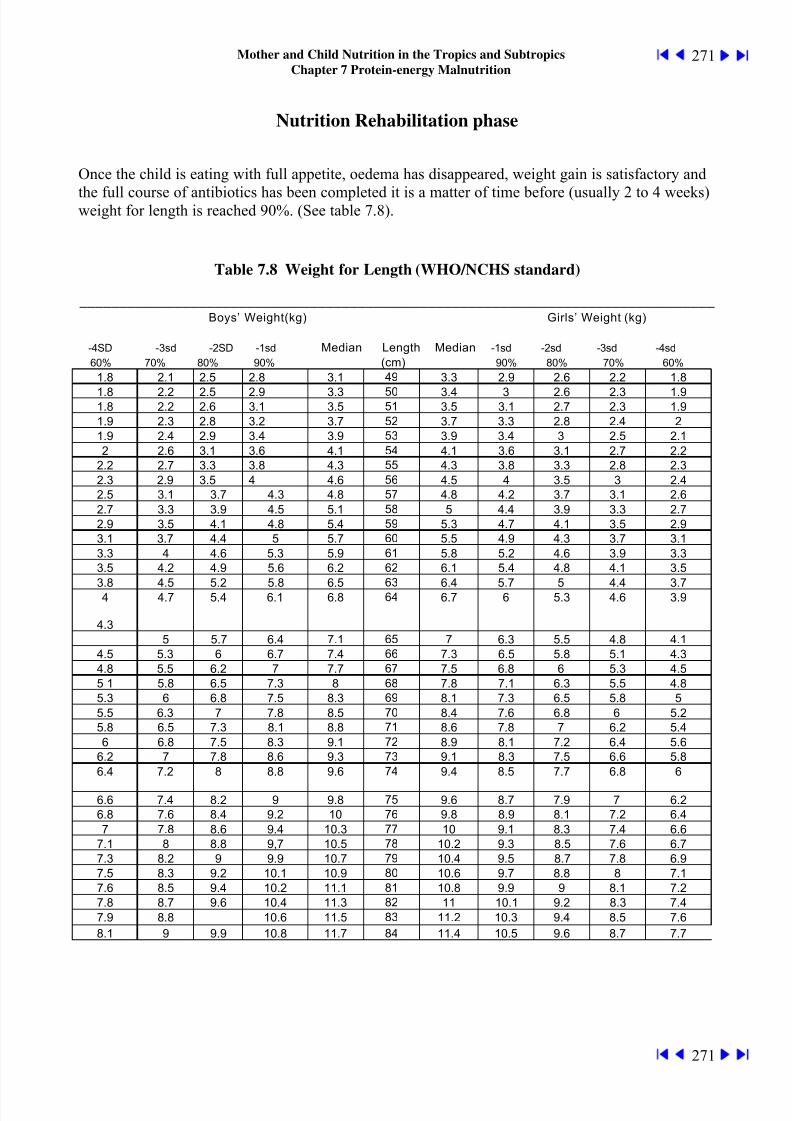
7/23/2019 KEP pada anak berak celana
http://slidepdf.com/reader/full/kep-pada-anak-berak-celana 35/44
Mother and Child Nutrition in the Tropics and Subtropics
Chapter 7 Protein-energy Malnutrition271
Nutrition Rehabilitation phase
Once the child is eating with full appetite, oedema has disappeared, weight gain is satisfactory and
the full course of antibiotics has been completed it is a matter of time before (usually 2 to 4 weeks)weight for length is reached 90%. (See table 7.8).
Table 7.8 Weight for Length (WHO/NCHS standard)
________________________________________________________________________________Boys’ Weight(kg) Girls’ Weight (kg)
-4SD -3sd -2SD -1sd Median Length Median -1sd -2sd -3sd -4sd
60% 70% 80% 90% (cm) 90% 80% 70% 60%
1.8 2.1 2.5 2.8 3.1 49 3.3 2.9 2.6 2.2 1.8
1.8 2.2 2.5 2.9 3.3 50 3.4 3 2.6 2.3 1.91.8 2.2 2.6 3.1 3.5 51 3.5 3.1 2.7 2.3 1.9
1.9 2.3 2.8 3.2 3.7 52 3.7 3.3 2.8 2.4 2
1.9 2.4 2.9 3.4 3.9 53 3.9 3.4 3 2.5 2.1
2 2.6 3.1 3.6 4.1 54 4.1 3.6 3.1 2.7 2.2
2.2 2.7 3.3 3.8 4.3 55 4.3 3.8 3.3 2.8 2.3
2.3 2.9 3.5 4 4.6 56 4.5 4 3.5 3 2.4
2.5 3.1 3.7 4.3 4.8 57 4.8 4.2 3.7 3.1 2.6
2.7 3.3 3.9 4.5 5.1 58 5 4.4 3.9 3.3 2.7
2.9 3.5 4.1 4.8 5.4 59 5.3 4.7 4.1 3.5 2.9
3.1 3.7 4.4 5 5.7 60 5.5 4.9 4.3 3.7 3.1
3.3 4 4.6 5.3 5.9 61 5.8 5.2 4.6 3.9 3.3
3.5 4.2 4.9 5.6 6.2 62 6.1 5.4 4.8 4.1 3.5
3.8 4.5 5.2 5.8 6.5 63 6.4 5.7 5 4.4 3.7
4
4.3
4.7 5.4 6.1 6.8 64 6.7 6 5.3 4.6 3.9
5 5.7 6.4 7.1 65 7 6.3 5.5 4.8 4.1
4.5 5.3 6 6.7 7.4 66 7.3 6.5 5.8 5.1 4.3
4.8 5.5 6.2 7 7.7 67 7.5 6.8 6 5.3 4.5
5 1 5.8 6.5 7.3 8 68 7.8 7.1 6.3 5.5 4.8
5.3 6 6.8 7.5 8.3 69 8.1 7.3 6.5 5.8 5
5.5 6.3 7 7.8 8.5 70 8.4 7.6 6.8 6 5.2
5.8 6.5 7.3 8.1 8.8 71 8.6 7.8 7 6.2 5.4
6 6.8 7.5 8.3 9.1 72 8.9 8.1 7.2 6.4 5.6
6.2 7 7.8 8.6 9.3 73 9.1 8.3 7.5 6.6 5.8
6.4 7.2 8 8.8 9.6 74 9.4 8.5 7.7 6.8 6
6.6 7.4 8.2 9 9.8 75 9.6 8.7 7.9 7 6.2
6.8 7.6 8.4 9.2 10 76 9.8 8.9 8.1 7.2 6.4
7 7.8 8.6 9.4 10.3 77 10 9.1 8.3 7.4 6.6
7.1 8 8.8 9,7 10.5 78 10.2 9.3 8.5 7.6 6.7
7.3 8.2 9 9.9 10.7 79 10.4 9.5 8.7 7.8 6.9
7.5 8.3 9.2 10.1 10.9 80 10.6 9.7 8.8 8 7.1
7.6 8.5 9.4 10.2 11.1 81 10.8 9.9 9 8.1 7.2
7.8 8.7 9.6 10.4 11.3 82 11 10.1 9.2 8.3 7.4
7.9 8.8 10.6 11.5 83 11.2 10.3 9.4 8.5 7.6
8.1 9 9.9 10.8 11.7 84 11.4 10.5 9.6 8.7 7.7
271
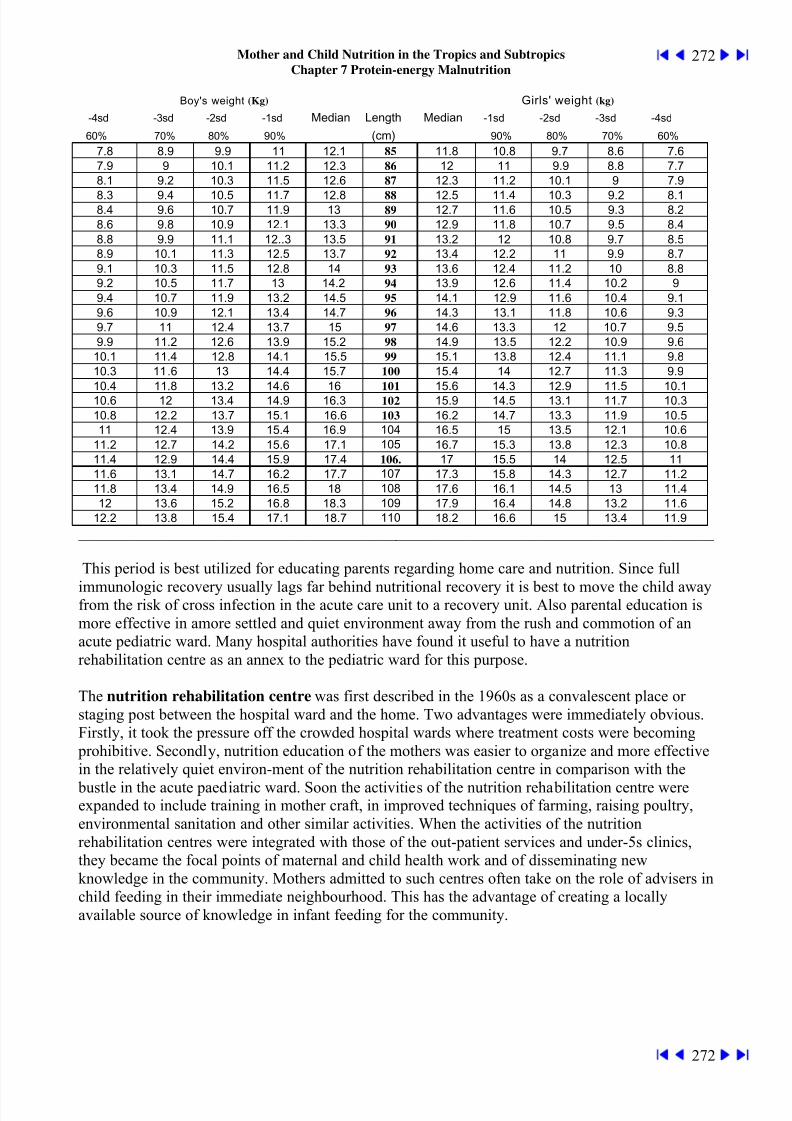
7/23/2019 KEP pada anak berak celana
http://slidepdf.com/reader/full/kep-pada-anak-berak-celana 36/44
Mother and Child Nutrition in the Tropics and Subtropics
Chapter 7 Protein-energy Malnutrition272
Boy's weight (Kg) Girls' weight (kg)
-4sd -3sd -2sd -1sd Median Length Median -1sd -2sd -3sd -4sd
60% 70% 80% 90% (cm) 90% 80% 70% 60%
7.8 8.9 9.9 11 12.1 85 11.8 10.8 9.7 8.6 7.6
7.9 9 10.1 11.2 12.3 86 12 11 9.9 8.8 7.7
8.1 9.2 10.3 11.5 12.6 87 12.3 11.2 10.1 9 7.9
8.3 9.4 10.5 11.7 12.8 88 12.5 11.4 10.3 9.2 8.18.4 9.6 10.7 11.9 13 89 12.7 11.6 10.5 9.3 8.2
8.6 9.8 10.9 12.1 13.3 90 12.9 11.8 10.7 9.5 8.4
8.8 9.9 11.1 12..3 13.5 91 13.2 12 10.8 9.7 8.5
8.9 10.1 11.3 12.5 13.7 92 13.4 12.2 11 9.9 8.7
9.1 10.3 11.5 12.8 14 93 13.6 12.4 11.2 10 8.8
9.2 10.5 11.7 13 14.2 94 13.9 12.6 11.4 10.2 9
9.4 10.7 11.9 13.2 14.5 95 14.1 12.9 11.6 10.4 9.1
9.6 10.9 12.1 13.4 14.7 96 14.3 13.1 11.8 10.6 9.3
9.7 11 12.4 13.7 15 97 14.6 13.3 12 10.7 9.5
9.9 11.2 12.6 13.9 15.2 98 14.9 13.5 12.2 10.9 9.6
10.1 11.4 12.8 14.1 15.5 99 15.1 13.8 12.4 11.1 9.8
10.3 11.6 13 14.4 15.7 100 15.4 14 12.7 11.3 9.9
10.4 11.8 13.2 14.6 16 101 15.6 14.3 12.9 11.5 10.1
10.6 12 13.4 14.9 16.3 102 15.9 14.5 13.1 11.7 10.3
10.8 12.2 13.7 15.1 16.6 103 16.2 14.7 13.3 11.9 10.5
11 12.4 13.9 15.4 16.9 104 16.5 15 13.5 12.1 10.6
11.2 12.7 14.2 15.6 17.1 105 16.7 15.3 13.8 12.3 10.8
11.4 12.9 14.4 15.9 17.4 106. 17 15.5 14 12.5 11
11.6 13.1 14.7 16.2 17.7 107 17.3 15.8 14.3 12.7 11.2
11.8 13.4 14.9 16.5 18 108 17.6 16.1 14.5 13 11.4
12 13.6 15.2 16.8 18.3 109 17.9 16.4 14.8 13.2 11.6
12.2 13.8 15.4 17.1 18.7 110 18.2 16.6 15 13.4 11.9
________________________________________________________________________________________________
This period is best utilized for educating parents regarding home care and nutrition. Since full
immunologic recovery usually lags far behind nutritional recovery it is best to move the child awayfrom the risk of cross infection in the acute care unit to a recovery unit. Also parental education ismore effective in amore settled and quiet environment away from the rush and commotion of anacute pediatric ward. Many hospital authorities have found it useful to have a nutritionrehabilitation centre as an annex to the pediatric ward for this purpose.
The nutrition rehabilitation centre was first described in the 1960s as a convalescent place orstaging post between the hospital ward and the home. Two advantages were immediately obvious.Firstly, it took the pressure off the crowded hospital wards where treatment costs were becoming
prohibitive. Secondly, nutrition education of the mothers was easier to organize and more effectivein the relatively quiet environ-ment of the nutrition rehabilitation centre in comparison with the
bustle in the acute paediatric ward. Soon the activities of the nutrition rehabilitation centre wereexpanded to include training in mother craft, in improved techniques of farming, raising poultry,environmental sanitation and other similar activities. When the activities of the nutritionrehabilitation centres were integrated with those of the out-patient services and under-5s clinics,they became the focal points of maternal and child health work and of disseminating newknowledge in the community. Mothers admitted to such centres often take on the role of advisers inchild feeding in their immediate neighbourhood. This has the advantage of creating a locallyavailable source of knowledge in infant feeding for the community.
272

7/23/2019 KEP pada anak berak celana
http://slidepdf.com/reader/full/kep-pada-anak-berak-celana 37/44
Mother and Child Nutrition in the Tropics and Subtropics
Chapter 7 Protein-energy Malnutrition273
The nutrition rehabilitation centre is basically a school for parents who come together as eitherresidents or day visitors to learn about better ways of feeding their children. They learn by
participation and by observing their children thrive on foods which they have cooked a the centre.Thus, in leading the child back to health the emphasis now shifts from the hospital environment tothe home environment. (See Fig. 7.20)
Figure 7.20 Nutrition Rehabilitation
Unit with Pediatric wards in the distance
Figure 7.21 Mothers learning to
cook a nutritious meal. Figure 7.22 A group discussion with vegetable garden in
background
Health workers now step back and allow the auxiliaries to take over as educators and demonstrators.The emphasis is on locally available foods, prepared and cooked in the home kitchen, and as befitsthe domestic economy. The facilities consist of a residential unit or a ward with a kitchen and a plotof land where the foods used in the daily cooking are grown. The objective is to demonstrate thecooking of multimixes which provide adequate calories and protein in manageable bulk. Whilstwaiting for the child to recover rehabilitation is also to be thought of as cognitive recovery.Engaging the child in stimulating play activities is helpful for mental stimulation. Individual andgroup play help in the overall recovery process.
273

7/23/2019 KEP pada anak berak celana
http://slidepdf.com/reader/full/kep-pada-anak-berak-celana 38/44
Mother and Child Nutrition in the Tropics and Subtropics
Chapter 7 Protein-energy Malnutrition274
The development of the nutrition rehabilitation centres has been a useful step towards integration oftreatment with prevention. After the initial period of acute illness, medical care is actively replaced
by informed lay care as recovery proceeds. Moreover, there is cross-fertilization between medicineand several other related disciplines like community development, agriculture, education and socialsciences. Such a unified team approach gives better results than the individual activities of the same
disciplines based on rigid departmental lines.
A recent evaluation in Uganda, Peru, Haiti and Guatemala has proved that children attending thesecentres do show improved growth and nutrition recuperation in an impressive way.(See Figs 7.23and 7.24).
Weights of children on admission and at the time of discharge from the nutrition rehabilitationcentre
Figure 7.23 (left) Weights on admission
Figure 7.24 (right Weights at the time of discharge
The cost per child per day ranged from US$372 in Haiti to US$876 in Guatemala, and even thoughten to forty times less than that of hospitalization, can still be called excessive. The effect of thenutrition rehabilitation centre on the knowledge of the mother was not always impressive. Thusthere is still a great deal of room for improvement.
Daily diet in the nutrition rehabilitation centre
The catch up formula described in Table 7.7.is the basis of feeding and recovery. At the same timethe child may be offered solids as required. Once the child is eating well the catch up formula feedsmay be tapered off so that by the time of discharge the child is eating foods that the mother haslearned to cook in the centre. A specimen diet is illustrated in Table 7.9. (See table 7.9)
274
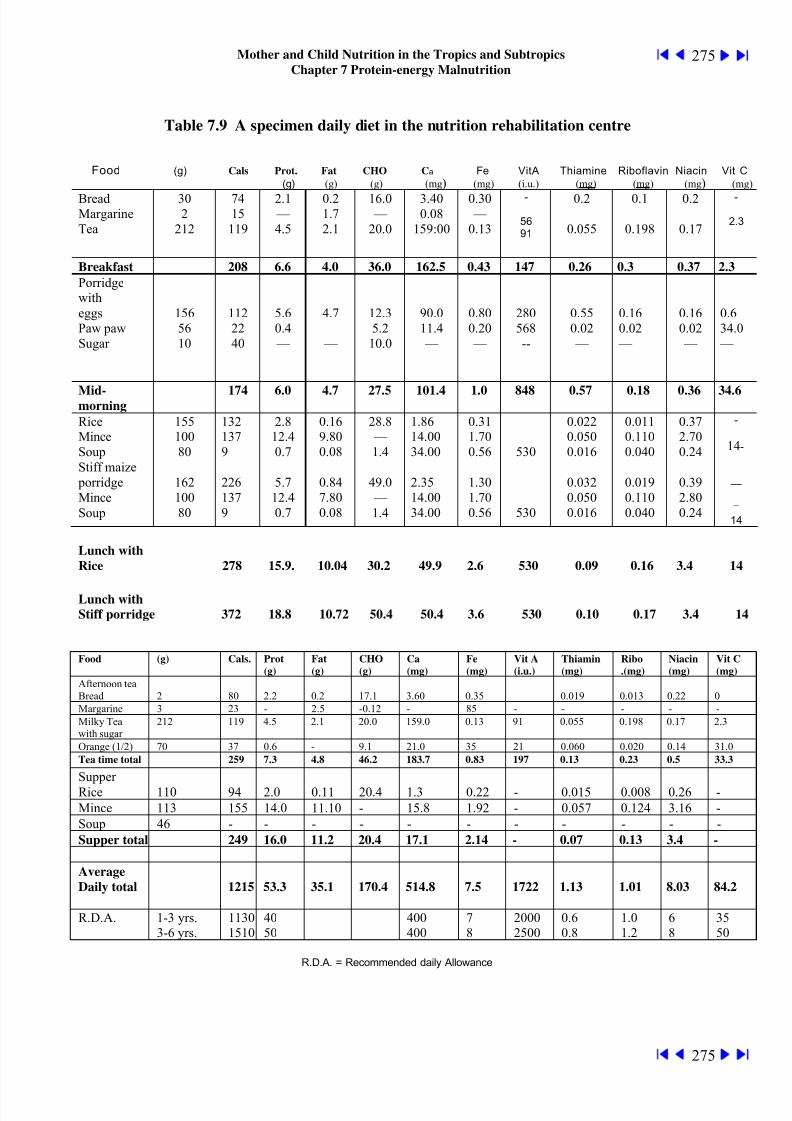
7/23/2019 KEP pada anak berak celana
http://slidepdf.com/reader/full/kep-pada-anak-berak-celana 39/44
Mother and Child Nutrition in the Tropics and Subtropics
Chapter 7 Protein-energy Malnutrition275
Table 7.9 A specimen daily diet in the nutrition rehabilitation centre
Food (g) Cals
Prot.
Fat CHO
Ca Fe VitA Thiamine Riboflavin Niacin Vit C
(g) (g) (g) (mg) (mg) (i.u.) (mg) (mg) (mg) (mg)
BreadMargarineTea
302
212
7415
119
2.1 —4.5
0.21.72.1
16.0 —20.0
3.400.08
159:00
0.30 —0.13
-
5691
0.2
0.055
0.1
0.198
0.2
0.17
-
2.3
Breakfast 208 6.6 4.0 36.0 162.5 0.43 147 0.26 0.3 0.37 2.3
PorridgewitheggsPaw pawSugar
1565610
1122240
5.60.4 —
4.7
—
12.35.2
10.0
90.011.4 —
0.800.20 —
280568--
0.550.02 —
0.160.02
—
0.160.02 —
0.634.0
—
Mid-morning
174 6.0 4.7 27.5 101.4 1.0 848 0.57 0.18 0.36 34.6
RiceMinceSoupStiff maize
porridgeMinceSoup
15510080
16210080
1321379
2261379
2.812.40.7
5.712.40.7
0.169.800.08
0.847.800.08
28.8 —1.4
49.0 —1.4
1.8614.0034.00
2.3514.0034.00
0.311.700.56
1.301.700.56
530
530
0.0220.0500.016
0.0320.0500.016
0.0110.1100.040
0.0190.1100.040
0.372.700.24
0.392.800.24
-
14-
—
—
14
Lunch with
Rice 278 15.9. 10.04 30.2 49.9 2.6 530 0.09 0.16 3.4 14
Lunch with
Stiff porridge 372 18.8 10.72 50.4 50.4 3.6 530 0.10 0.17 3.4 14
Food (g) Cals. Prot
(g)
Fat
(g)
CHO
(g)
Ca
(mg)
Fe
(mg)
Vit A
(i.u.)
Thiamin
(mg)
Ribo
.(mg)
Niacin
(mg)
Vit C
(mg)
Afternoon teaBread 2 80 2.2 0.2 17.1 3.60 0.35 0.019 0.013 0.22 0
Margarine 3 23 - 2.5 -0.12 - 85 - - - - -
Milky Teawith sugar
212 119 4.5 2.1 20.0 159.0 0.13 91 0.055 0.198 0.17 2.3
Orange (1/2) 70 37 0.6 - 9.1 21.0 35 21 0.060 0.020 0.14 31.0
Tea time total 259 7.3 4.8 46.2 183.7 0.83 197 0.13 0.23 0.5 33.3
SupperRice 110 94 2.0 0.11 20.4 1.3 0.22 - 0.015 0.008 0.26 -
Mince 113 155 14.0 11.10 - 15.8 1.92 - 0.057 0.124 3.16 -
Soup 46 - - - - - - - - - - -
Supper total 249 16.0 11.2 20.4 17.1 2.14 - 0.07 0.13 3.4 -
Average
Daily total 1215 53.3 35.1 170.4 514.8 7.5 1722 1.13 1.01 8.03 84.2
R.D.A. 1-3 yrs.3-6 yrs.
11301510
4050
400400
78
20002500
0.60.8
1.01.2
68
3550
R.D.A. = Recommended daily Allowance
275

7/23/2019 KEP pada anak berak celana
http://slidepdf.com/reader/full/kep-pada-anak-berak-celana 40/44
Mother and Child Nutrition in the Tropics and Subtropics
Chapter 7 Protein-energy Malnutrition276
Several shortcomings of the nutrition rehabilitation centre are obvious, even though it is asignificant advance compared to the hospital ward for the treatment of malnutrition. Only a small
proportion of all children suffering from malnutrition in the community are brought to a healthfacility for treatment, and only a proportion of these will be eventually admitted to the nutritionrehabilitation centre. Thus a centre can provide only limited coverage. It is physically impossible to
provide one centre for each village in a country.For these reasons, health workers have experimented with several types of cost-effectiveapproaches.
Outpatient care for severely malnourished children.
As experience has been gained with regard to the care and management of severely malnourishedchildren a number of modifications have been attempted in different countries to suit the localsituation. In Indonesia, health workers treated severely malnourished children as out-patients andreported a lower case fatality rate of 16.6% compared with 50% for hospital based care. In acontrolled trial in Bangladesh researchers compared home based care with day care and in-patientmanagement of severe malnutrition. They found home based care to be most cost effective beingfive times cheaper than in-patient care. As the patho-physiology of severe malnutrition has come to
be better understood its management is getting rationalized and is increasingly undertaken at fivedifferent levels depending upon available resources viz. in hospitals; in nutrition rehabilitationunits; in health centers; in community out-reach clinics; and at home with regular follow-up. It isthe initial intensive phase which requires careful search and treatment of life threateningcomplications like septiceamia, hypoglycaemia, hypothermia and electrolyte imbalance. In this
phase of stabilization it is also necessary to avoid metabolic stress by offering feeds with relativelylow concentration of energy (100kcal/kg/day) and protein (1 to 1.5 g/kg/day). When recovery setsin and appetite returns energy content may be increased to 150-220 kcal/kg/day and protein to 4 to 6
g/kg/day. It is also important to bear in mind that severe malnutrition is a global deficiency in whicha large number of nutrients including vitamins and minerals need to be replenished. These are thenthe principles of treatment which can be followed wherever care is undertaken.
In emergency situations where a large number of children (and adults) have to be cared for withlimited resources researchers have suggested classifying acute malnutrition for treatment purposesas follows:
Acute malnutrition complicated by infection (<80% of median weight for height; or presence of pitting oedema in both legs; or mid-arm circumference <110 mm; with presence of any of thefollowing: anorexia; diarrhoea; hypothermia; clinical signs of respiratory infection; anaemia;
excessive drowsiness); Group 1 Acute uncomplicated malnutrition (<70% median weight forheight; or oedema; or mid-upper arm circumference <110 mm; appetite good; clinically well; alert);Group 2 Moderate uncomplicated malnutrition (70 – 80% median weight for height; no oedema;mid-upper arm circumference 110-125 mm; appetite good; clinically well; alert); Group 3.
According to this classification group 1 needs intensive inpatient stabilization care; Group 2 can betreated in the outpatients with therapeutic care (i.e. catch-up formula with gradual introduction ofsolid food and nutritional rehabilitation); and Group 3 can be helped with just supplementaryfeeding.
276

7/23/2019 KEP pada anak berak celana
http://slidepdf.com/reader/full/kep-pada-anak-berak-celana 41/44
Mother and Child Nutrition in the Tropics and Subtropics
Chapter 7 Protein-energy Malnutrition277
Community Centred approaches
As with all severe illnesses the best approach is prevention. A fresh look at the problem ofchildhood malnutrition and our methods of dealing with it is necessary. Traditionally we tend tothink of malnutrition as any other disease in which the problem is at the family level and the
management is also aimed at the level of the patient and his family. But malnutrition is a problem atthe level of the community, and is the consequence of the prevailing state of cultural, social andtechnical development. A community which is able to feed its children is in a healthier state ofdevelopment compared to one which cannot. One must therefore search for solutions within thecommunity on the principle that "the state of nutrition is determined by what people do and not bywhat they get'. Amongst the community-based programmes are those for increasing productivity atthe village level, preparation of weaning diets from local foods in the form of multimixes, childfeeding programmes supported by community effort, identification of beneficiaries for communityassistance by village health workers using simple techniques, and other similar activities. Many ofthese activities supplement the effects of services like the under-5s clinics described earlier, andtogether prepare the community for programmes of integrated development. Thus, in Hyderabad
(India) the village community was mobilized to create farmers' groups who raised crops oncommunal plots; the women in turn processed these foods into a nourishing multimix, the villagehealth workers identified children in need of food supplementation and all these activities werestrongly supported by a network of community health activities. In Jamkhed (India) the communityincreases its agricultural potential by building earth dams across streams, and young farmers' clubsraise crops for a village feeding programme which is supervised by village health committees andoperated by the village health workers.
These are some of the new approaches. But they are all in experimental stages and operating withindefined boundaries. For them to spread both nationally and internationally a new breed of
professional are needed who are capable of identifying the social, ecological and other root causesof nutritional disorders, and of working with the community to find solutions.
Monitoring the nutrition of the community
The health worker usually operates from the district hospital or health and the community to beserved is defined administratively or by geographical boundaries. The first need is to get to knowone's community well. It is important to obtain an ordnance map of the area and the latest censusdata. Other government departments like agriculture, community development, water supply,education and so on may have useful information about the area and the people. A study of annual
reports of these departments supplemented with reports of any surveys carried out can provideinformation on land availability, agricultural productivity, literacy, rates, employment, localindustry as well as local beliefs and practices. Meetings and discussions with local leaders andofficials may also help to add further details about the community and its problems. The best sourceof information, however, can come through familiarizing oneself with the area and its people duringcommunity rounds.
Is malnutrition a problem in the community? Hospital admission figures and out-patient registers provide a useful clue to its presence in the community. When malnutrition is being commonlydiagnosed in the health institutions it is important that the extent of the problem be measured in thecommunity, always bearing in mind that most health institutions mainly serve the community intheir immediate neighbourhood. Many cases of malnutrition, and especially the mild-moderate
277

7/23/2019 KEP pada anak berak celana
http://slidepdf.com/reader/full/kep-pada-anak-berak-celana 42/44
Mother and Child Nutrition in the Tropics and Subtropics
Chapter 7 Protein-energy Malnutrition278
forms, may not be brought to the notice of the health workers, and hence it is useful to measuretheir prevalence in the community.
All health workers are not in the fortunate position of having the resources to carry out extensivesurveys, but this should not prevent them from measuring the effectiveness of their activities at
regular intervals. Several techniques of rapid rural assessment have been described recently and can be used to advantage by health workers in isolated rural areas with poor facilities and support.
Making a community diagnosis of malnutrition
Depending upon the resources available, weight-for-age, height-for-age, arm circumference andarm circumference-for-height (Quac Stick) may be used as parameters for measuring the growthand the nutritional status of children. Clearly it is not possible to measure all the children in the areaand it may only be possible to measure the children in one or two villages at a time. However, ifthese villages are selected with forethought, a useful picture of the whole district can be put togetherover a couple of years. Many villages have a population of about 1000 persons, and often villagesand hamlets are in clusters. The desirable minimum for statistical purposes is about 50 childrenunder the age of 3 years per village. For truly useful information about the dietary pattern, therecommended number is 300 children under the age of 3 years. Depending upon the size of thevillage or of the residential area (e.g. squatter settlement), the number of households to be visited isindicated in Table 6.4. The information obtained through such surveys can be
Table 7.10 Number of children to be included in a survey of households for assessing
Nutritional Status
_______________________________________________________________________________________
No. of people inthe settlement
No. of children inthe settlement
No. of children formeasuring
No. of houses inthe settlement
Homes to visit
100 20 20 5-7 All houses500 100 100 25-30 All houses1000 200 200 50-70 All houses2000 400 200 50-70 Every 2nd house5000 1000 200 50-70 Every 5th house
_______________________________________________________________________________________
augmented through lay reporting. Various members of the community, such as village healthworkers, school teachers, or school children can gather information using the arm band and/or theQuac Stick, as well as a simple questionnaire on infant feeding. In the case of the latter, as well asin general discussions with community leaders, it is useful to follow four areas of enquiry, viz:
278

7/23/2019 KEP pada anak berak celana
http://slidepdf.com/reader/full/kep-pada-anak-berak-celana 43/44
Mother and Child Nutrition in the Tropics and Subtropics
Chapter 7 Protein-energy Malnutrition279
(1) What do informants say people ought to do? (Assesses level ofknowledge).
(2) What do informants say most people do? (Provides a measure of beliefs and practices).
(3) What do informants say they themselves do? (Gives a measure ofcommon d dietary patterns).
(4) What do informants and others actually do? (This informationis obtained through actual observations and recall type of enquiry).
The traditional birth attendants in the community are usually knowledgeable and can providevaluable information on family life patterns, dietary practices and attitudes, details of pregnanciesas well as birth weights and birth intervals.
When all the information discussed above is assembled, it is possible to construct a nutrition profileof the community. The proportion of infants with low birth weight, percentage low weight for age,
percentage with low arm circumference, percentage with low arm circumference for height, percentage low weight for height, birth intervals, high-risk pregnancies, family stability, customsand taboos, use of fats and oils in the dietaries and similar other information can be obtained aboutlife patterns in the different settlements and communities of the district. Malnutrition is common incommunities who do not receive adequate health and other services. Hence indicators of healthcoverage provide useful contributory information. Availability and acceptance of prenatal care,attendance at the under-5s clinics as judged by the presence of a weight chart at home and theregularity of weighing, coverage by immunization, local facilities for oral rehydration to treatdiarrhoea and acceptance of family planning services serve as measures of the quality of healthcoverage of the community. Malnutrition is also the consequence of the prevailing state of cultural,social and technical development of the community as well as the sharing of resources. Hencesocioeconomic indicators such as availability of safe water in adequate amounts, facilities fordisposal of human waste, literacy rates, employment or availability of land, type of dwellings and soon help to assess the determinants of malnutrition in the community.
Malnutrition is said to be prevalent when community surveys reveal the following:
(1) the number of children with marasmus and those with oedema is
greater than 20 per cent;
(2) the number of children with severe anaemia is greater than 5 percent;
(3) the number of children under-weight exceeds 20 per cent;
(4) the number of children dying is greater than 20 per cent of totalchildren born to mothers in the community.
Alleviation and eradication of hunger requires community action. Hence community awareness andinterest are important. The sharing of all information with the community helps to create rapport
279
7/23/2019 KEP pada anak berak celana
http://slidepdf.com/reader/full/kep-pada-anak-berak-celana 44/44
Mother and Child Nutrition in the Tropics and Subtropics
Chapter 7 Protein-energy Malnutrition280
and exchange of ideas. Several of the community programmes mentioned in the preceding sectionhave active community participation as the primary objective. I n the sharing of information andexchange of ideas one may discover the beginnings of community-based interventions.
In all surveys and activities for monitoring the impact of services it is important to be aware of
certain pitfalls. Those who are in greatest need are usually out of sight. It is the remote village awayfrom the main road where the need is most acute. It is the disadvantaged in the community, such asfor example, the lower castes or the single-parent families, whose voice is rarely heard in thedialogue with the community. Subjects like low wages, often below the statutory minimum wage,the iron grip of the big landlords, high interest rates and consequent indebtedness, andunemployment rarely get discussed in the open and need to be looked for. Interviews with thedisadvantaged in small groups may provide useful information. The effects of the seasons must also
be taken into account. If one has established a regular pattern of community or village rounds, thenvisiting the same place just before and soon after the wet season may provide useful insights.Finally, all surveys are snapshots and not trends. Hence one should be careful about drawing firmconclusions and making generalizations.
The objective of monitoring services and programmes is to bring about improvements in theireffectiveness and efficiency. Technical innovations, policy decisions and administrative changes areall part of the process. A question often asked is, "How can health and nutrition interventions alterdestitution and poverty? Surely political decisions and socioeconomic development are theanswers!' This is true to a large extent, but health workers can contribute a great deal by slanting theservices to seek out and help the neediest. Health services, like other national programmes in mostcountries, are largely monopolized by the elite. To be able to identify those at greatest risk andensure their health and welfare will be one way to alleviate poverty; for to ensure freedom fromillness and incapacity is to ensure availability for employment. To create self-ufficiency throughlocally available foods is to save scarce family resources. Community cohesion will ensurecommunity support for the disadvantaged. To help promote functional literacy is to enable thedisadvantaged to fend for themselves in a hostile world. Health and nutrition interventions hold the
promise of becoming springboards for community upliftment.
FURTHER READING
Alleyne, G. A. O., Hay, R. W., Picou, D. l., Stanfield, J. P. and Whitehead, R. G.Protein-energy Malnutrition. Edward Arnold, London, 1977.World Health Organization. Management of the child with a serious infection or severe
malnutrition.WHO, Geneva 2000