Kalimantan Timur Dalam Angka Tahun 2015
624
-
Upload
muhammad-ilyas -
Category
Documents
-
view
230 -
download
2
Transcript of Kalimantan Timur Dalam Angka Tahun 2015
8/20/2019 Kalimantan Timur Dalam Angka Tahun 2015
http://slidepdf.com/reader/full/kalimantan-timur-dalam-angka-tahun-2015 1/623

8/20/2019 Kalimantan Timur Dalam Angka Tahun 2015
http://slidepdf.com/reader/full/kalimantan-timur-dalam-angka-tahun-2015 2/623
h t t p : / / k a l t i m
. b p s . g o . i d
8/20/2019 Kalimantan Timur Dalam Angka Tahun 2015
http://slidepdf.com/reader/full/kalimantan-timur-dalam-angka-tahun-2015 3/623
8/20/2019 Kalimantan Timur Dalam Angka Tahun 2015
http://slidepdf.com/reader/full/kalimantan-timur-dalam-angka-tahun-2015 4/623
KALIMANTAN TIMURDALAM ANGKA 2015Kalimantan Timur in Figures 2015
ISSN: 0215 – 2266Nomor Publikasi/
: 64.000.1503PublicationNumber Katalog BPS : 1102001.64Ukuran Buku
: 14,8 Cm x 21 CmBook Size Jumlah Halaman
: lxiv + 544
Halaman
Number of Pages Pages
Naskah:
Badan Pusat Statistik (BPS)Provinsi Kalimantan TimurBPS-Statistics of Kalimantan Timur Province
Manuscript
Gambar Kulit : Badan Pusat Statistik (BPS)Provinsi Kalimantan TimurBPS-Statistics of Kalimantan Timur Province
Cover Design
Diterbitkan oleh : Badan Pusat Statistik (BPS)Provinsi Kalimantan TimurBPS-Statistics of Kalimantan Timur Province
Published by
Dilarang mengumumkan, mendistribusikan, mengomunikasikan, dan/ataumenggandakan sebagian atau seluruh isi buku ini untuk tujuan komersil tanpa izintertulis dari Badan Pusat StatistikProhibited to announce, distribute, communicate, and/or copy part or all of this
book for commercial purpose without permission from BPS-Statistics Indonesia
:
.
o . i d
tan Timur
tik (BPS)ntan Tim
s of Kalim
usat Stansi Kali
S-Statist
mkan, m,ebagian
u
8/20/2019 Kalimantan Timur Dalam Angka Tahun 2015
http://slidepdf.com/reader/full/kalimantan-timur-dalam-angka-tahun-2015 5/623
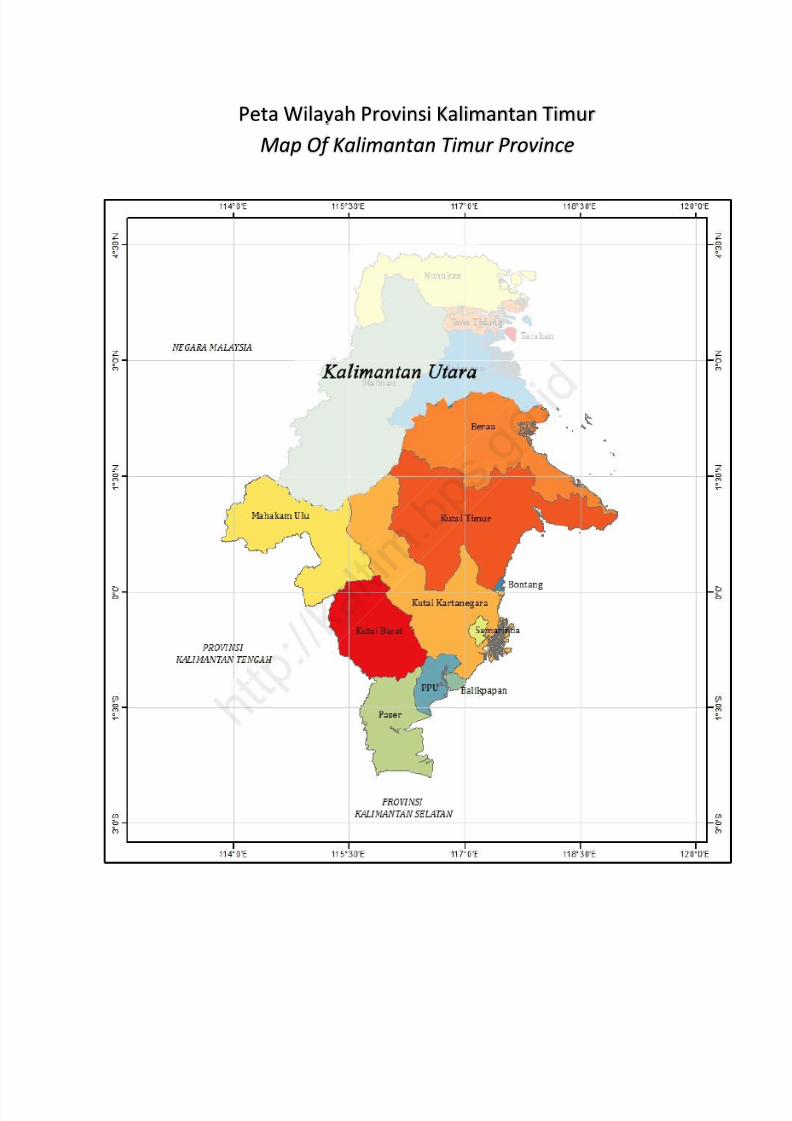
Peta Wilayah Provinsi Kalimantan TimurMap Of Kalimantan Timur Province

8/20/2019 Kalimantan Timur Dalam Angka Tahun 2015
http://slidepdf.com/reader/full/kalimantan-timur-dalam-angka-tahun-2015 6/623
h t t p : / / k a l t i m
. b p s . g o . i d
8/20/2019 Kalimantan Timur Dalam Angka Tahun 2015
http://slidepdf.com/reader/full/kalimantan-timur-dalam-angka-tahun-2015 7/623
KEPALA BADAN PUSAT STATISTIKPROVINSI KALIMANTAN TIMUR
Ir. ADEN GULTOM, MM.

8/20/2019 Kalimantan Timur Dalam Angka Tahun 2015
http://slidepdf.com/reader/full/kalimantan-timur-dalam-angka-tahun-2015 8/623
h t t p : / / k a l t i m
. b p s . g o . i d
8/20/2019 Kalimantan Timur Dalam Angka Tahun 2015
http://slidepdf.com/reader/full/kalimantan-timur-dalam-angka-tahun-2015 9/623
BADAN PUSAT STATISTIK PROVINSI KALIMANTAN TIMUR
KATA PENGANTAR
Publikasi “Kalimantan Timur Dalam Angka 2015 ” ini merupakan serial publikasi yangditerbitkan secara berkala oleh Badan Pusat Statistik (BPS) Provinsi Kalimantan Timur.Publikasi ini dimaksudkan untuk memberikan gambaran yang lengkap dan akurat tentangpembangunan dan sekaligus perkembangan perstatistikan di daerah ini.
Dalam penyusunan buku Kalimantan Timur Dalam Angka ini, data yang dihimpun
selain bersumber dari data primer juga bersumber dari data sekunder, baik dari instansipemerintah maupun swasta. Seperti halnya pada publikasi terdahulu, setiap tahunnyaselalu diupayakan perbaikan angka-angka pada tabel-tabel yang disajikan, demikian pulapada publikasi ini. Selain itu, juga terdapat penambahan dan pengembangan data gunamelengkapi isi dan validitas data sesuai dengan dinamika pembangunan dan pemerintahanyang berkembang.
Meskipun telah diupayakan kelengkapan dan penyempurnaan data yang disajikannamun masih terasa belum dapat memenuhi kebutuhan pemakai data secara menyeluruh.Oleh karena itu kami mengharapkan saran dan kritik yang konstruktif dari berbagai pihak,untuk perbaikan dan penyempurnaan publikasi di masa yang akan datang.
Kepada semua Dinas/Instansi/Lembaga Pemerintah maupun Swasta yang telahmembantu menyediakan data dalam kegiatan penyusunan Buku Kalimantan Timur DalamAngka Tahun 2015 ini, kami sampaikan ucapan terima kasih, semoga kerjasama kita dapatterus ditingkatkan dimasyarakat.
Akhirnya semoga publikasi ini bermanfaat bagi kita semua dalam perencanaan,evaluasi dan melaksanakan pembangunan.
Samarinda, 2 November 2015KEPALA BADAN PUSAT STATISTIKPROVINSI KALIMANTAN TIMUR
KEPALA BADAN
Ir. Aden Gultom, MM
. p
,
under, ,i terdahul
el yang da an an
ami a pe
gkapan dmenuhi ke
an saran durnaan pu
inas/InstaIkan data
ini, kamian dimas
se
8/20/2019 Kalimantan Timur Dalam Angka Tahun 2015
http://slidepdf.com/reader/full/kalimantan-timur-dalam-angka-tahun-2015 10/623
BPS-STATISTICS OF KALIMANTAN TIMUR PROVINCE
P R E F A C E
“Kalimantan Timur in Figures” in 2015 is a series of from previous publication
which is periodically published by BPS-Statistics Kalimantan Timur Province. This
publication intended to provide complete and accurate picture about development and the
activity of statistics in this region.
In the preparation of this book, both primary and secondary data were collected
from public and private institutions. For the completion of its content and of data validity
following the development and governmental dynamism and development of statistical
data and annually figures always renewed.
Although some efforts for the completion already been made, however maybe it
not yet meet the need of data users completly. Therefore, any constructive critism and
suggestion for the improvement of the publication very needed.
Our gratitude goes to all parties and all the offices/institutions/ government
and private institutions that have helped provide data in preparation this book. I hope our
cooperation can keep being endlessly increased.
Finally, we hope this book will be greatly beneficial for the readers in planning,
evaluation and implementation of development.
Samarinda, 2 nd November 2015
HEAD OF BPS-STATISTICS OFKALIMANTAN TIMUR PROVINCE
Ir. Aden Gultom, MM.
.
t
t an o
evelopme
ready bee
. T ere ore
ation very
parties an
elped pro
dlessly inc
ope t is
lementatio
8/20/2019 Kalimantan Timur Dalam Angka Tahun 2015
http://slidepdf.com/reader/full/kalimantan-timur-dalam-angka-tahun-2015 11/623
ixK A L I M A N T A N T I M U R D A L A M A N G K A 2015
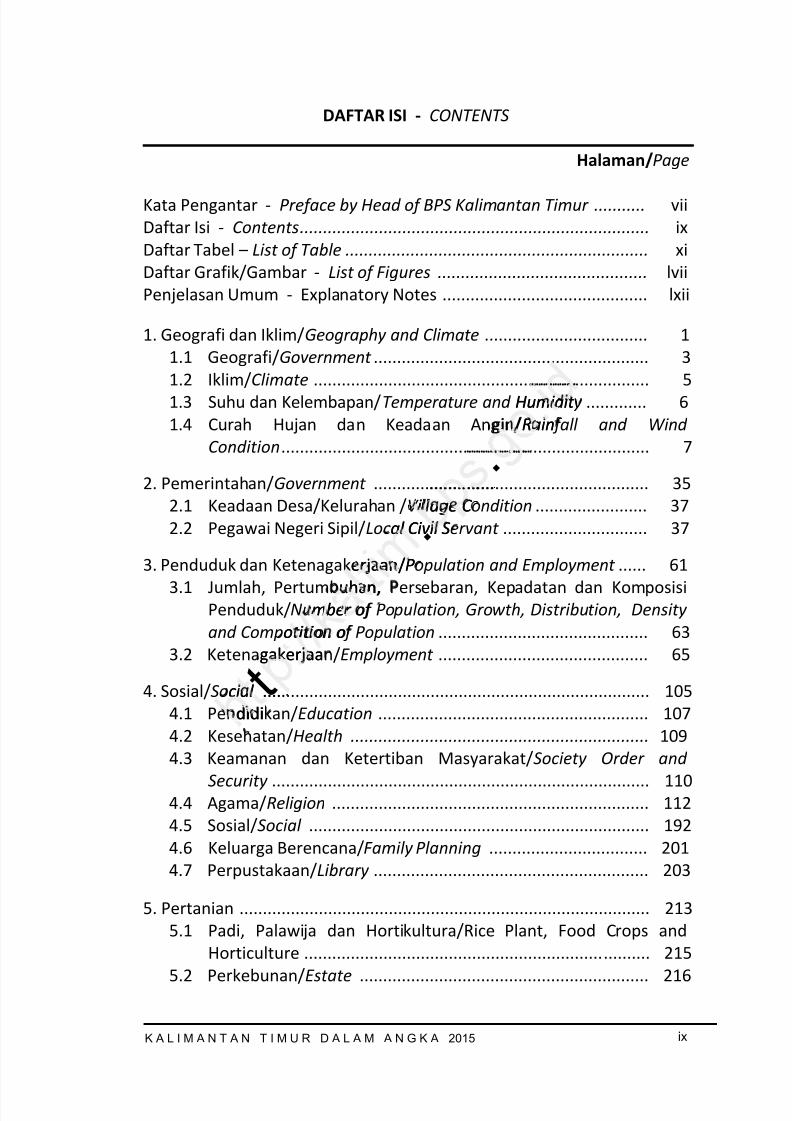
DAFTAR ISI - CONTENTS
Halaman/ Page
Kata Pengantar - Preface by Head of BPS Kalimantan Timur ........... vii Daftar Isi - Contents ........................................................................... ix Daftar Tabel – List of Table ................................................................. xiDaftar Grafik/Gambar - List of Figures ............................................. lviiPenjelasan Umum - Explanatory Notes ............................................ lxii
1. Geografi dan Iklim/ Geography and Climate ................................... 11.1 Geografi/ Government ........................................................... 3
1.2 Iklim/ Climate ........................................................................ 51.3 Suhu dan Kelembapan/ Temperature and Humidity ............. 61.4 Curah Hujan dan Keadaan Angin/ Rainfall and Wind
Condition ............................................................................... 7
2. Pemerintahan/ Government ........................................................... 352.1 Keadaan Desa/Kelurahan / Village Condition ........................ 372.2 Pegawai Negeri Sipil/ Local Civil Servant ............................... 37
3. Penduduk dan Ketenagakerjaan/ Population and Employment ...... 613.1 Jumlah, Pertumbuhan, Persebaran, Kepadatan dan Komposisi
Penduduk/ Number of Population, Growth, Distribution, Densityand Compotition of Population ............................................. 63
3.2 Ketenagakerjaan/ Employment ............................................. 65
4. Sosial/ Social ................................................................................... 1054.1 Pendidikan/ Education .......................................................... 1074.2 Kesehatan/ Health ................................................................ 1094.3 Keamanan dan Ketertiban Masyarakat/ Society Order and
Security ................................................................................. 1104.4 Agama/ Religion .................................................................... 1124.5 Sosial/ Social ......................................................................... 1924.6 Keluarga Berencana/ Family Planning .................................. 2014.7 Perpustakaan/ Library ........................................................... 203
5. Pertanian ........................................................................................ 2135.1 Padi, Palawija dan Hortikultura/Rice Plant, Food Crops and
Horticulture .......................................................................... 2155.2 Perkebunan/ Estate .............................................................. 216
. .
........... . . Humidit gin/ Rain
............... ...
............... . . i age C
al Civil S
erjaan/ Puhan,
mber ofotition o
t gakerjaa
cial ..... didi
8/20/2019 Kalimantan Timur Dalam Angka Tahun 2015
http://slidepdf.com/reader/full/kalimantan-timur-dalam-angka-tahun-2015 12/623
x K A L I M A N T A N T I M U R D A L A M A N G K A 2015
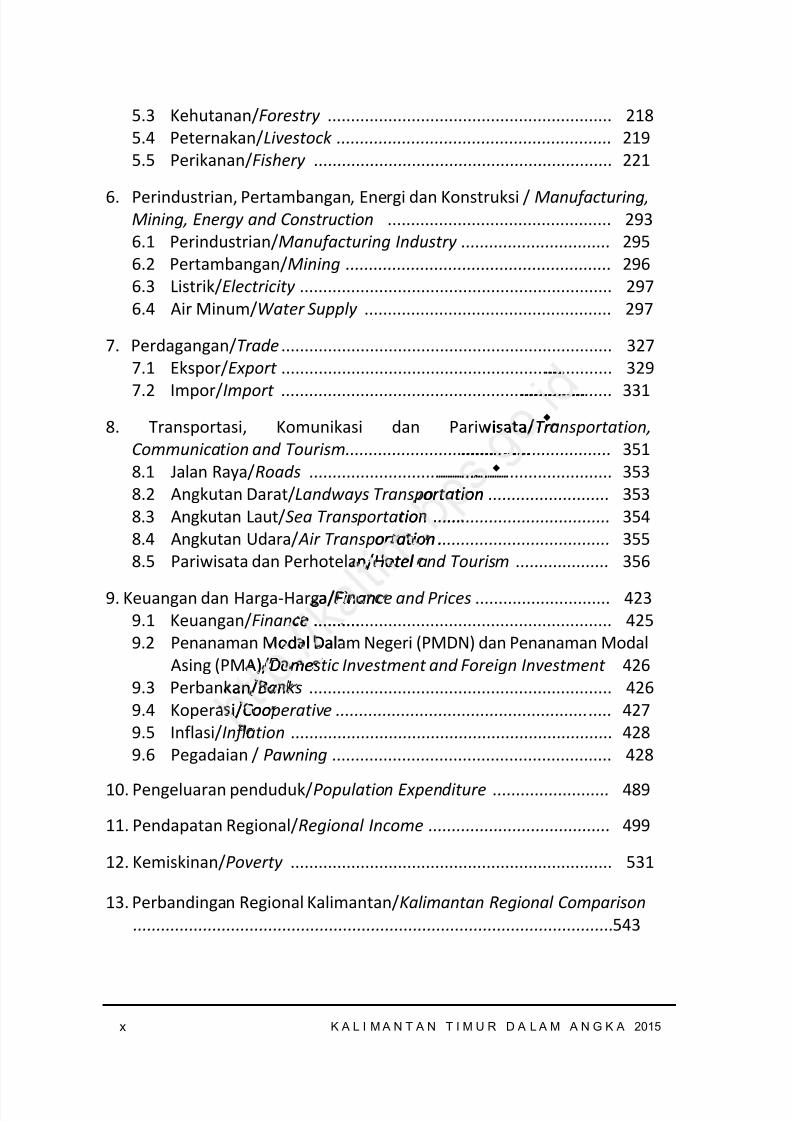
5.3 Kehutanan/ Forestry ............................................................. 2185.4 Peternakan/ Livestock ........................................................... 2195.5 Perikanan/ Fishery ................................................................ 221
6. Perindustrian, Pertambangan, Energi dan Konstruksi / Manufacturing,Mining, Energy and Construction ................................................ 2936.1 Perindustrian/ Manufacturing Industry ................................ 2956.2 Pertambangan/ Mining ......................................................... 2966.3 Listrik/ Electricity ................................................................... 2976.4 Air Minum/ Water Supply ..................................................... 297
7. Perdagangan/ Trade ....................................................................... 3277.1 Ekspor/ Export ....................................................................... 3297.2 Impor/ Import ....................................................................... 331
8. Transportasi, Komunikasi dan Pariwisata/ Transportation,Communication and Tourism......................................................... 3518.1 Jalan Raya/ Roads ................................................................. 3538.2 Angkutan Darat/ Landways Transportation .......................... 3538.3 Angkutan Laut/ Sea Transportation ...................................... 3548.4 Angkutan Udara/ Air Transportation ..................................... 3558.5 Pariwisata dan Perhotelan/ Hotel and Tourism .................... 356
9. Keuangan dan Harga-Harga/ Finance and Prices ............................. 4239.1 Keuangan/ Finance ................................................................ 4259.2 Penanaman Modal Dalam Negeri (PMDN) dan Penanaman Modal
Asing (PMA)/Domestic Investment and Foreign Investment 4269.3 Perbankan/ Banks ................................................................. 4269.4 Koperasi/ Cooperative ........................................................... 4279.5 Inflasi/ Inflation ..................................................................... 4289.6 Pegadaian / Pawning ............................................................ 428
10. Pengeluaran penduduk/ Population Expenditure ......................... 489
11. Pendapatan Regional/ Regional Income ....................................... 499
12. Kemiskinan/ Poverty ..................................................................... 531
13. Perbandingan Regional Kalimantan/ Kalimantan Regional Comparison....................................................................................................... 543
. .
..................... .. .
isata/ Tr................. . .
.................. . ortation
ion ....... ortation .
n/ Hotel
a/ Finane ............
odal Dal)/ Dome
an/n Bani/Coo
8/20/2019 Kalimantan Timur Dalam Angka Tahun 2015
http://slidepdf.com/reader/full/kalimantan-timur-dalam-angka-tahun-2015 13/623
xiK A L I M A N T A N T I M U R D A L A M A N G K A 2015
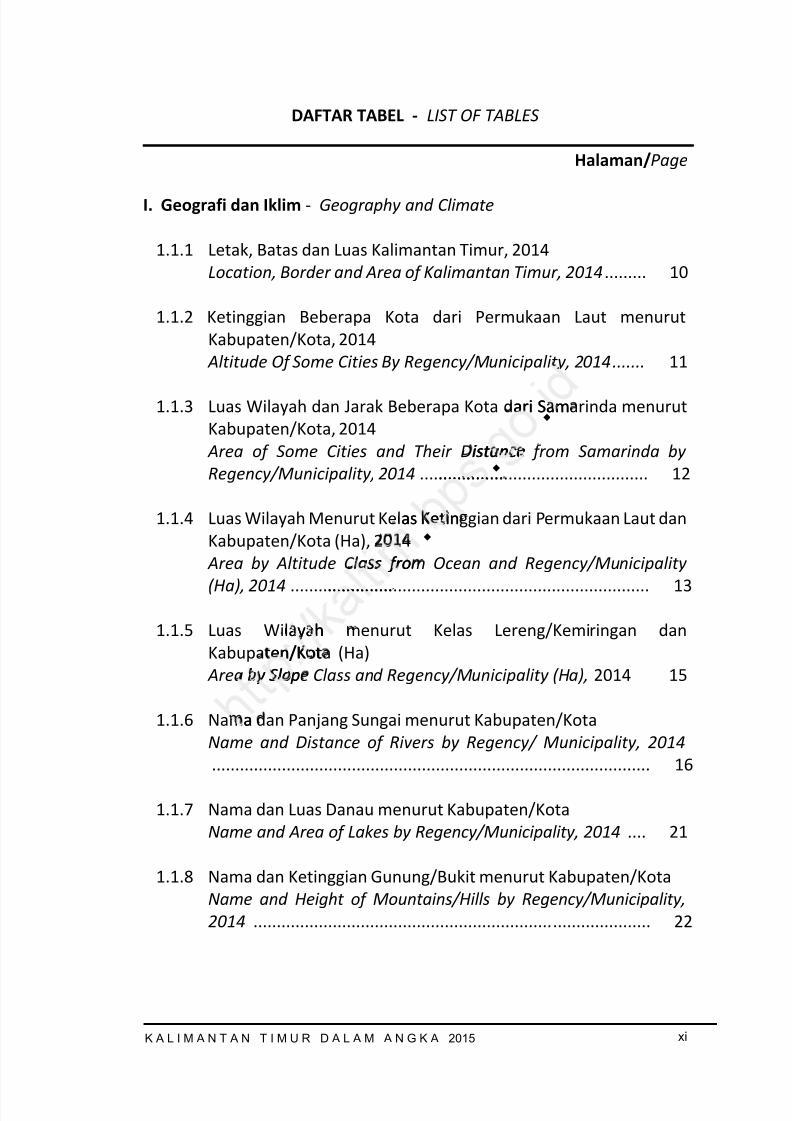
DAFTAR TABEL -LIST OF TABLES
Halaman/ Page
I. Geografi dan Iklim - Geography and Climate
1.1.1 Letak, Batas dan Luas Kalimantan Timur, 2014Location, Border and Area of Kalimantan Timur, 2014 ......... 10
1.1.2 Ketinggian Beberapa Kota dari Permukaan Laut menurutKabupaten/Kota, 2014 Altitude Of Some Cities By Regency/Municipality, 2014 ....... 11
1.1.3 Luas Wilayah dan Jarak Beberapa Kota dari Samarinda menurutKabupaten/Kota, 2014 Area of Some Cities and Their Distance from Samarinda byRegency/Municipality, 2014 ................................................. 12
1.1.4 Luas Wilayah Menurut Kelas Ketinggian dari Permukaan Laut danKabupaten/Kota (Ha), 2014 Area by Altitude Class from Ocean and Regency/Municipality(Ha), 2014 ............................................................................. 13
1.1.5 Luas Wilayah menurut Kelas Lereng/Kemiringan danKabupaten/Kota (Ha) Area by Slope Class and Regency/Municipality (Ha), 2014 15
1.1.6 Nama dan Panjang Sungai menurut Kabupaten/KotaName and Distance of Rivers by Regency/ Municipality, 2014
.............................................................................................. 16
1.1.7 Nama dan Luas Danau menurut Kabupaten/KotaName and Area of Lakes by Regency/Municipality, 2014 .... 21
1.1.8 Nama dan Ketinggian Gunung/Bukit menurut Kabupaten/KotaName and Height of Mountains/Hills by Regency/Municipality,2014 ..................................................................................... 22
. .
.
ari Sam
istance............... .
as Ketin
ass fro................ ..
ayahen/Kot
by Slop
a
8/20/2019 Kalimantan Timur Dalam Angka Tahun 2015
http://slidepdf.com/reader/full/kalimantan-timur-dalam-angka-tahun-2015 14/623
xi i K A L I M A N T A N T I M U R D A L A M A N G K A 2015
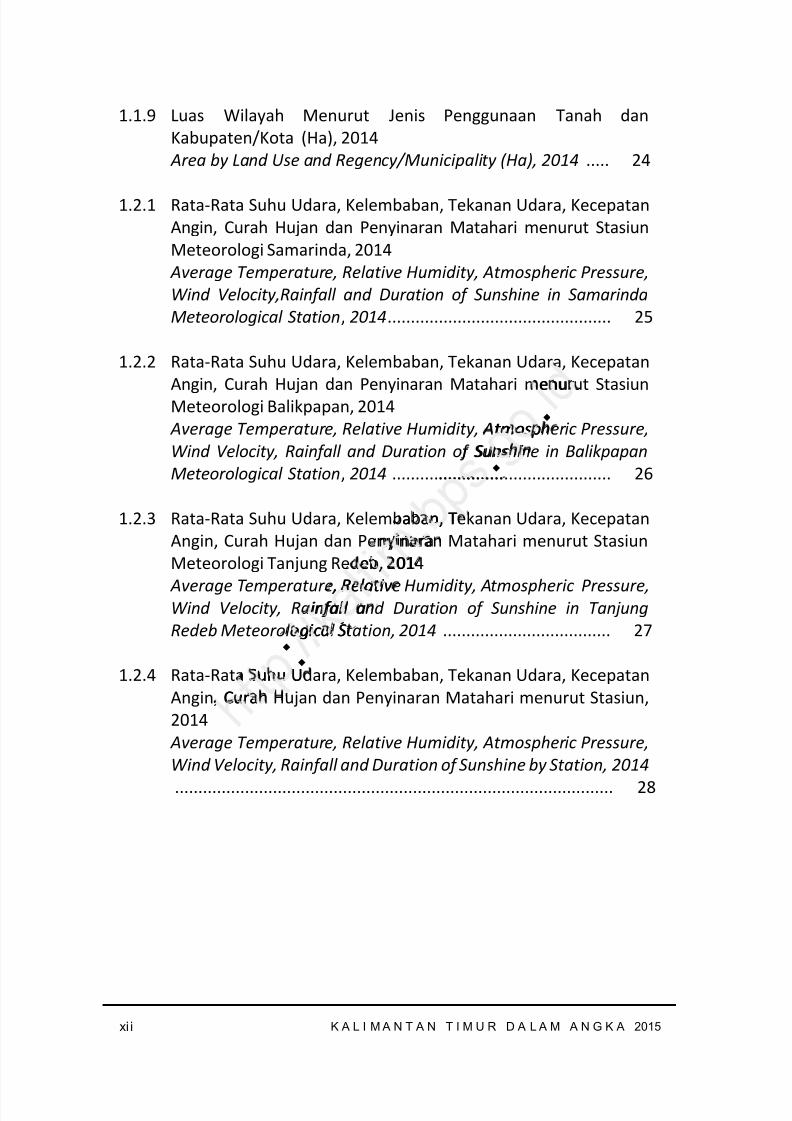
1.1.9 Luas Wilayah Menurut Jenis Penggunaan Tanah danKabupaten/Kota (Ha), 2014 Area by Land Use and Regency/Municipality (Ha), 2014 ..... 24
1.2.1 Rata-Rata Suhu Udara, Kelembaban, Tekanan Udara, KecepatanAngin, Curah Hujan dan Penyinaran Matahari menurut StasiunMeteorologi Samarinda, 2014
Average Temperature, Relative Humidity, Atmospheric Pressure,Wind Velocity,Rainfall and Duration of Sunshine in SamarindaMeteorological Station , 2014 ................................................ 25
1.2.2 Rata-Rata Suhu Udara, Kelembaban, Tekanan Udara, Kecepatan
Angin, Curah Hujan dan Penyinaran Matahari menurut StasiunMeteorologi Balikpapan, 2014
Average Temperature, Relative Humidity, Atmospheric Pressure,Wind Velocity, Rainfall and Duration of Sunshine in BalikpapanMeteorological Station , 2014 ............................................... 26
1.2.3 Rata-Rata Suhu Udara, Kelembaban, Tekanan Udara, KecepatanAngin, Curah Hujan dan Penyinaran Matahari menurut StasiunMeteorologi Tanjung Redeb, 2014
Average Temperature, Relative Humidity, Atmospheric Pressure,Wind Velocity, Rainfall and Duration of Sunshine in TanjungRedeb Meteorological Station, 2014 .................................... 27
1.2.4 Rata-Rata Suhu Udara, Kelembaban, Tekanan Udara, KecepatanAngin, Curah Hujan dan Penyinaran Matahari menurut Stasiun,2014
Average Temperature, Relative Humidity, Atmospheric Pressure,
Wind Velocity, Rainfall and Duration of Sunshine by Station, 2014 .............................................................................................. 28
:
. .
enur
tmospSuns i
............... .
a an, T,nyinara
eb,, 01 , Relativ
infall alogica S
Suhu UCura
8/20/2019 Kalimantan Timur Dalam Angka Tahun 2015
http://slidepdf.com/reader/full/kalimantan-timur-dalam-angka-tahun-2015 15/623
xiiiK A L I M A N T A N T I M U R D A L A M A N G K A 2015
II. Pemerintahan - Government
2.1 Banyaknya Kecamatan, Desa/Kelurahan dan Luas Wilayahmenurut Kabupaten/Kota, 2014Number of Districts, Villages and Area by Regency/ Municipality ,2014 ...................................................................................... 33
2.2 Banyaknya Desa/Kelurahan Definitif menurut Klasifikasi Desadan Kabupaten/Kota, 2014Number of Definitive Villages by Classification andRegency/Municipality, 2014 ................................................. 34
2.3 Banyaknya Desa/Kelurahan Definitif menurut Kelompok JumlahKepala Keluarga, 2014Number of Definitive Villages by Household Group, 2014 ... 35
2.4 Banyaknya LPM menurut Kategori dan Kabupaten/Kota, 2014Number of LPM by Level and Regency/Municipality, 2014 ... 37
2.5 Kelompok Binaan LPM Tahun 2008 s.d 2014 Provinsi KalimantanTimurGuided Group LPM 2008 till 2014 Kalimantan TimurProvince ................................................................................. 38
2.6 Kelompok Binaan PKK Tahun 2008 s.d 2014 Provinsi KalimantanTimurGuided Group PKK till 2014 Kalimantan Timur Province ....... 42
2.7 Jumlah Desa Swasembada Provinsi Kalimantan Timur
Number of Self-Sufficiency Village Kalimantan TimurProvince ................................................................................. 46
2.8 Banyaknya LSM, ORMAS menurut Status/Sifat Organisasi danKabupaten/Kota, 2014Number of ORMAS, LSM and OKP by Organization andRegency/Municipality, 2014 ................................................. 47
i
. ut Ke
ehold Gr
ori danRegency
Ta un 2
LPM................ . ....
ok Binar
ui e Gr
8/20/2019 Kalimantan Timur Dalam Angka Tahun 2015
http://slidepdf.com/reader/full/kalimantan-timur-dalam-angka-tahun-2015 16/623
xiv K A L I M A N T A N T I M U R D A L A M A N G K A 2015
2.9 Jumlah LSM, ORMAS dan OKP Tahun 2008 s,d 2014 MenurutKabupaten/Kota Provinsi Kalimantan TimurThe number of NGOs, NGOs, and OKP Year 2008 to 2014 EastKalimantan Province ............................................................. 49
2.10 Jumlah LSM, ORMAS dan OKP Aktif Tahun 2008 s.d 2014 ProvinsiKalimantan TimurThe number of NGOs, ORMAS, and OKP Active Year 2008 to 2014Kalimantan Timur Province ................................................... 53
2.11.1 Banyaknya Pegawai Negeri Sipil (PNS) dan Tenaga HonorerDaerah, 2014
Number of Local Civil and Temporary Servants, 2014 .......... 54
2.11.2 Banyaknya Pegawai Negeri Sipil (PNS) di Lingkungan PemerintahProvinsi Kalimantan Timur Berdasarkan Golongan dan JenisKelamin, 2014Number of Local Civil Servants of Kalimantan Timur by Degreeand Sex, 2014 ....................................................................... 55
2.11.3 Banyaknya Pegawai Negeri Sipil (PNS) di Lingkungan PemerintahProvinsi Kalimantan Timur Berdasarkan Eselon dan Jenis Kelamin,2014Number of Local Civil Servants of Kalimantan Timur by Echelonand Sex, 2014 ...................................................................... 56
2.11.4 Banyaknya Pegawai Negeri Sipil (PNS) di Lingkungan PemerintahProvinsi Kalimantan Timur Berdasarkan Pendidikan dan JenisKelamin, 2014
Number of Local Civil Servants of Kalimantan Timur by Educationand Sex, 2014 ...................................................................... 57
2.11.5 Banyaknya Pegawai Negeri Sipil (PNS) menurut Kabupaten/Kotadan Golongan, 2014Number of Civil Servants by Regency/Municipality and Degree,2014 ...................................................................................... 58
2.11.6 Banyaknya Pegawai Negeri Sipil di Lingkungan PemerintahDaerah Provinsi Kalimantan Timur Menurut Unit
:
. s .
. 14 ......
ngkungaan Go o
Kalima................ ..
eri Sipilmur Ber
Civi S4 ..........
nya PeKa
8/20/2019 Kalimantan Timur Dalam Angka Tahun 2015
http://slidepdf.com/reader/full/kalimantan-timur-dalam-angka-tahun-2015 17/623
xvK A L I M A N T A N T I M U R D A L A M A N G K A 2015
Organisasi/Nama Dinas/Nama Badan Di Bawah Pejabat Eselon IIdan Jenis Kelamin, 2014Number of Civil Servants in Local Government of KalimantanTimur Province by Organization Unit Under The Echelon II andSex, 2014 ............................................................................... 59
2.12 Jumlah Penerima Dana Pensiun, 2014Number of Retired Fund Receiver , 2014 ............................... 61
2.13.1 Jumlah Pemilih Tetap pada Pemilihan Umum menurutKabupaten Kota, 2009 dan 2014Number of Population for General Election by
Regency/Municipality , 2009 and 2014 ................................. 63
2.13.2 Jumlah Perolehan Suara Anggota DPRD Kaltim menurut Partai,Pemilu 2009 dan 2014Number of Vote Result Election for Assembly Legislative byParties, Election in 2009 and 2014 ...................................... 64
2.13.3 Jumlah Suara Dalam Pemilihan Gubernur menurutKabupaten/Kota, 2014 Number of vote result for Governor Election by Regency/Municipality 2014 ................................................................. 66
2.13.4 Jumlah Anggota Legislatif (DPRD) menurut Jenis Kelamin 2014Number of Representative at The Local House of Representative(DPRD) by Sex Period 2014 ................................................... 67
III. Penduduk dan Ketenagakerjaan – Population and Employment
3.1.1 Penduduk Menurut Kabupaten/Kota tahun 2011-2014 HasilProyeksiPopulation by Regency/Municipality in 2011-2014 pojectionresults .................................................................................. 79
3.1.2 Penyebaran dan Laju Pertumbuhan Penduduk MenurutKabupaten/Kota, 2011-2014 Distribution and Growth Rate ofPopulation by Regency/Municipality, 2011-2014 ............... 80
............. ..
D Ka ti
n for201 ...
am P14
e result014 .......
Anggotaber of R
PRD) y
8/20/2019 Kalimantan Timur Dalam Angka Tahun 2015
http://slidepdf.com/reader/full/kalimantan-timur-dalam-angka-tahun-2015 18/623
xvi K A L I M A N T A N T I M U R D A L A M A N G K A 2015
3.1.3 Luas Wilayah dan Kepadatan Penduduk MenurutKabupaten/Kota tahun 2014
Area and Population Density by Regency/Municipality in2014 ...................................................................................... 81
3.1.4 Jumlah Penduduk Menurut Kabupaten/Kota, Jenis Kelamin, danRasio Jenis Kelamin Provinsi Kalimantan Timur 2014Population by Regency/Municipality, Sex and Sex Ratio ofKalimantan Timur, 2014 ........................................................ 82
3.1.5 Proyeksi Penduduk Laki-laki Berdasarkan Umur ProvinsiKalimantan Timur 2010-2014Males Population Projections by Age Kalimantan TimurProvince ................................................................................. 83
3.1.6 Proyeksi Penduduk Perempuan Berdasarkan Umur ProvinsiKalimantan Timur 2010-2014Female Population Projection by Age Kalimantan TimurProvince ................................................................................. 84
3.1.7 Rasio Ketergantungan Provinsi Kalimantan Timur 2010-2014Dependency Ratio Kalimantan Timur Province 2010-2014 ... 85
3.1.8 Persentase Penduduk Usia 10 Tahun Ke Atas Menurut StatusPerkawinan di Provinsi Kalimantan Timur, 2014Percentage of Population 10 Years of Age and Over by MaritalStatus in Kalimantan Timur Province, 2014 .......................... 86
3.1.9 Proporsi Penduduk Perempuan Usia 10 Tahun Ke Atas yangPernah Kawin Menurut Usia Perkawinan Pertama di ProvinsiKalimantan Timur, 2014Proportion of Married Woman 10 Years Old and Over by Age atFirst Married in Kalimantan Timur Province, 2014 ............... 87
3.2.1 Penduduk Bekerja Menurut Lapangan Usaha Tahun 2014Provinsi Kalimantan Timur
t
.
m
Kalima................ ..
er asa
ion by................ .
an Provio Kalim
Pen unan di Page o
8/20/2019 Kalimantan Timur Dalam Angka Tahun 2015
http://slidepdf.com/reader/full/kalimantan-timur-dalam-angka-tahun-2015 19/623
xviiK A L I M A N T A N T I M U R D A L A M A N G K A 2015
Work Population by Industrial Origin 2014 Kalimantan TimurProvince ................................................................................. 88
3.2.2 Tingkat Partisipasi Angkatan Kerja (TPAK) Penduduk 15 Tahun keAtas Menurut Jenis Kelamin, 2011-2014Labour Force Participation Rates Aged 15 Years and Over by Sex,2011 – 2014 .......................................................................... 89
3.2.3 Penduduk Berumur 15 Tahun ke Atas Menurut Kegiatan Utama,2011 – 2014Population Aged 15 Years and Over by Activity, 2011 – 2014 90
3.2.4 Penduduk Berumur 15 Tahun ke Atas Menurut Kegiatan danJenis Kelamin, 2011-2014Population Aged 15 Years and Over by Activity and Sex, 2011 – 2014 ...................................................................................... 91
3.2.5 Jumlah Penduduk Usia 15 Tahun ke Atas yang Bekerja denganAngkatan Kerja, 2014Number of Population Aged 15 Years and Over by Labour Force,
2014 ...................................................................................... 92
3.2.6 Tingkat Pengangguran Terbuka menurut Kabupaten/KotaUnemployment Rate by Regency/Municipality, 2011-2014 . 93
3.2.7 Angkatan Kerja Dan TPAK menurut Kabupaten/KotaLabour Force and Participation Rates by Regency/ Municipality,2011-2014 ............................................................................ 94
3.2.8 Penduduk Usia 15 Tahun ke Atas Dirinci Menurut Angkatan Kerjadan Bukan Angkatan Kerja serta Jenis Kelamin Tahun 2014Provinsi Kalimantan TimurPopulation Aged 15 Years and Over by Labour Force and NonLabour Force and Sex 2014 Kalimantan Timur Province ....... 95
. .
.enuru t
by Activ................. ...
a un
Aged 1
................. .. ..
anggurament R
ata n Kbour F
-
8/20/2019 Kalimantan Timur Dalam Angka Tahun 2015
http://slidepdf.com/reader/full/kalimantan-timur-dalam-angka-tahun-2015 20/623
xviii K A L I M A N T A N T I M U R D A L A M A N G K A 2015
3.2.9 Penduduk Usia 15 Tahun ke Atas Menurut Jenis Kegiatan Utamadan Pendidikan Tertinggi yang di Tamatkan dan Jenis Kelamin,2014
Population 15 Years Old and Over by Main Employment Status,Educational Attainment and Sex, 2014 ................................ 96
3.2.10 Penduduk 15 Tahun ke Atas yang Bekerja Menurut KelompokUmur, Jenis Kelamin dan Pendidikan Tertinggi yang Ditamatkan,2014Populatin 15 Years Old and Over Who Work by Group of Age, Sexand Educational Attainment, 2014 ...................................... 97
3.2.11 Penduduk 15 Tahun ke Atas yang Bekerja Menurut LapanganUsaha, Pendidikan Tertinggi yang Ditamatkan dan Jenis Kelamin,2014Population by 15 Years Old and Over Who Work by IndustrialOrigin, Educational Attainment and Sex, 2014 ..................... 98
3.2.12 Banyaknya Pencari Kerja dan Permintaan Tenaga Kerja yangTerdaftar menurut Tingkat Pendidikan dan Jenis Kelamin, 2012-
2014Number of Registered Job Seekers and Demand of Worker byEducational Levels and Sex , 2012 – 2014 .............................. 99
3.2.13 Banyaknya Pencari Kerja dan Permintaan Tenaga Kerja yangTerdaftar menurut Tingkat Pendidikan, Jenis Kelamin danKabupaten/Kota, 2014Number of Registered Job Seekers and Demand of Worker byEducational Level, Sex and Regency/Municipality , 2014 ...... 101
3.2.14 Banyaknya Pencari Kerja yang Terdaftar Tingkat Pendidikan,Status dan Jenis Kelamin, 2014Number of Registered Job Seekers by Educational Levels, Statusand Sex, 2014 ........................................................................ 104
3.2.15 Banyaknya Pencari Kerja yang Terdaftar Menurut Status,Golongan Umur, dan Jenis Kelamin, 2014
Number of Registered Job Seekers by Status, Age Group and Sex,2014 ...................................................................................... 106
nurutdan Je
Who WSex, 201
n PermiPendidi
e Jo Ss and Se
Pencarir menu
ten/K
8/20/2019 Kalimantan Timur Dalam Angka Tahun 2015
http://slidepdf.com/reader/full/kalimantan-timur-dalam-angka-tahun-2015 21/623
xixK A L I M A N T A N T I M U R D A L A M A N G K A 2015
3.2.16 Banyaknya Lowongan Kerja yang Belum Dipenuhi MenurutLapangan Usaha Utama dan Jenis Kelamin, 2010 - 2014Number of Job Vacancies by Main Industry and Sex, 2010 – 2014 ...................................................................................... 107
3.2.17 Banyaknya Lowongan Kerja Yang Belum Dipenuhi MenurutLapangan Usaha Utama dan Status, 2012Number of Job Vacancies by Main Industry and Status, 2014 .............................................................................................. 108
3.2.18 Banyaknya Lowongan Kerja yang Belum Dipenuhi Menurut Jenis
Pekerjaan dan Jenis Kelamin, 2009-2012Number of Job Vacancies by Occupation Type and Sex,2009 – 2012 .......................................................................... 109
3.3 Keadaan Tenaga Kerja Indonesia (TKI) Melalui Kalimantan Timurdan Pemutusan Hubungan Kerja (PHK), 2011-2014Indonesian Workers via Kalimantan Timur and Their Dismissal2011-2014 ............................................................................. 110
3.4.1 Banyaknya Peserta Program Jamsostek Menurut WilayahOperasi, Provinsi Kalimantan Timur 2013-2014Number of Jamsostek Participants by Operational Region ofKalimantan Timur 2013-2014 ............................................... 111
3.4.2 Realisasi Pembayaran Jaminan Jamsostek Menurut Jenis danWilayah Operasi, Provinsi Kalimantan Timur 2014Realization of Jamsostek Benefit Payment by Programs and
Operational Region of Kalimantan Timur 2014 .................... 112
IV. Sosial - Social
4.1.1 Banyaknya Sekolah, Murid, Guru TK dan Rasio Murid TerhadapGuru menurut Kabupaten / Kota, 2014/2014Number of Schools, Pupils and Kindergarten Teachers and RatioofPupils to Teachers by Regency/Municipality, 2014/2014 .... 127
i .
ype an............... . .
a (TKI)erja (PH
a imant.................. .
erta Prnsi Ka i
Jamsotan Tim
ea isasiya
8/20/2019 Kalimantan Timur Dalam Angka Tahun 2015
http://slidepdf.com/reader/full/kalimantan-timur-dalam-angka-tahun-2015 22/623
xx K A L I M A N T A N T I M U R D A L A M A N G K A 2015
4.1.2 Banyaknya Sekolah, Murid, Guru dan Rasio Murid Terhadap GuruSD Negeri menurut Kabupaten/Kota, 2014/2014Number of State Primary Schools, Pupils, Teachers an Ratio ofPupils to Teachers by Regency/Municipality, 2014/2014 .... 128
4.1.3 Banyaknya Sekolah, Murid, Guru dan Rasio Murid Terhadap GuruSD Swasta menurut Kabupaten/Kota, 2014/2014Number of Private Primary Schools, Pupils, Teachers and Ratioof Pupils to Teachers by Regency/Municipality, 2014/2014 . 129
4.1.4 Banyaknya Murid SD Negeri dan Swasta yang Lulus Ujian (UAN)Kabupaten/Kota, 2014/2014
Number of Pupils of State and Private Primary School Who PassedTheir Final Exams by Regency/Municipality, 2014/2014 ...... 130
4.1.5 Banyaknya Sekolah, Murid, Guru dan Rasio Murid Terhadap GuruSLTP Negeri menurut Kabupaten/Kota, 2014/2014Number of State Junior High Schools, Pupils , Teachers and Ratioof Pupils toTeachers by Regency/Municipality, 2014/2014 .. 131
4.1.6 Banyaknya Sekolah, Murid, Guru dan Rasio Murid Terhadap GuruSLTP Swasta menurut Kabupaten/Kota, 2014/2014Number of Private Junior High Schools , Pupils, Teachersand Ratio of Pupils to Teachers by Regency/Municipality,2014/2014 ............................................................................. 132
4.1.7 Banyaknya Murid SLTP/MTs/SMPT yang Lulus (UAN) menurutKabupaten/Kota, 2014/2014Number of Pupils of Junior High School Who Passed Their Final
Exam by Regency/Municipality, 2014/2014 ......................... 133
4.1.8 Banyaknya Sekolah, Murid, Guru, dan Rasio Murid TerhadapGuru SMU Negeri menurut Kabupaten/Kota, 2014/2014Number of State Senior High Schools, Pupils, Teachers and Ratioof Pupils to Teachers by Regency/Municipality, 2014/2014 . 134
4.1.9 Banyaknya Sekolah, Murid, Guru, dan Rasio Murid TerhadapGuru SMU Swasta menurut Kabupaten/Kota, 2014/2014Number of Private Senior High Schools, Pupils,Teachers and Ratioof Pupils to Teachers by Regency/Municipality, 2014/2014 . 135
.
. oo l14/ 01
sio Muria, 014/
ols, Pupiy/Munic
d, GuruKabupa
Junior H
: Pupils................. .
nya Mn/
8/20/2019 Kalimantan Timur Dalam Angka Tahun 2015
http://slidepdf.com/reader/full/kalimantan-timur-dalam-angka-tahun-2015 23/623
xxiK A L I M A N T A N T I M U R D A L A M A N G K A 2015
4.1.10 Banyaknya Sekolah, Murid, Guru dan Rasio Murid Terhadap GuruSMK (Negeri + Swasta) menurut Kabupaten/Kota, 2014/2014Number of V0cational Senior High Schools (State+Private), Pupils,Teachers and Ratio Pupils to Teachers by Regency/Municipality,2014/2014 ............................................................................. 136
4.1.11 Banyaknya Sekolah, Murid, Guru dan Rasio Murid Terhadap GuruSMK Negeri menurut Kabupaten/Kota, 2014/2014Number of Vocational Senior High Schools State, Pupils, Teachersand Ratio Pupils to Teachers, by Regency/Municipality,2014/2014 ............................................................................. 137
4.1.12 Banyaknya Sekolah, Murid, Guru dan Rasio Murid Terhadap GuruSMK Swasta menurut Kabupaten/Kota, 2014/2014Number of Vocational Senior High Schools Private, Pupils,Teachers and Ratio Pupils to Teachers, by Regency/Municipality,2014/2014 ............................................................................. 138
4.1.13 Banyaknya Murid SMU/MA yang Lulus (UAN) menurutKabupaten/Kota, 2014/2014Number of Pupils of Senior High Schools Who Passed Their Examsby Regency/Municipality, 2014/2014 ................................... 139
4.1.14 Banyaknya Murid SMK Yang Lulus (UAN) menurutKabupaten/Kota, 2014/2014Number of Pupils of Vocational Senior High School Who PassedTheir Exams by Regency/Municipality, 2014/2014 ............. 141
4.1.15 Banyaknya Sekolah, Murid, Guru Madrasah Ibtidaiyah dan RasioMurid Terhadap Guru menurut Kabupaten / Kota, 2014/2014 Number of Madrasah Ibtidaiyah Schools, Pupils and Teachers andRatio of Pupils to Teachers by Regency/Municipality,2014/2014 ............................................................................. 142
4.1.16 Banyaknya Sekolah, Murid, Guru Madrasah Ibtidaiyah Negeridan Rasio Murid Terhadap Guru menurut Kabupaten / Kota,2014/2014Number of State Madrasah Ibtidaiyah Schools, Pupils and
b
. o Mu ri, 2014/
chools Pchers, b
................. .
U/MA14/2014
o Seniounicipal
ya Mpaten/K
m er oir E
8/20/2019 Kalimantan Timur Dalam Angka Tahun 2015
http://slidepdf.com/reader/full/kalimantan-timur-dalam-angka-tahun-2015 24/623
xxii K A L I M A N T A N T I M U R D A L A M A N G K A 2015
Teachers and Ratio of Pupils to Teachers byRegency/Municipality, 2014/2014 ........................................ 143
4.1.17 Banyaknya Sekolah, Murid, Guru Madrasah Ibtidaiyah Swastadan Rasio Murid Terhadap Guru menurut Kabupaten / Kota,2014/2014Number of Private Madrasah Ibtidaiyah Schools, Pupils andTeachers and Ratio of Pupils to Teachers byRegency/Municipality, 2014/2014 ........................................ 144
4.1.18 Banyaknya Sekolah, Murid, Guru Madrasah Tsanawiyah danRasio Murid Terhadap Guru menurut Kabupaten/Kota,
2014/2014Number of Madrasah Tsanawiyah Schools , Pupils, Teachers andRatio of Pupils to Teachers by Regency/Municipality,2014/2014 ............................................................................. 145
4.1.19 Banyaknya Sekolah, Murid, Guru Madrasah Tsanawiyah Negeridan Rasio Murid Terhadap Guru menurut Kabupaten/Kota,2014/2014Number of State Madrasah Tsanawiyah Schools , Pupils,Teachers and Ratio of Pupils to Teachers byRegency/Municipality, 2014/2014 ........................................ 146
4.1.20 Banyaknya Sekolah, Murid, Guru Madrasah Tsanawiyah Swastadan Rasio Murid Terhadap Guru menurut Kabupaten/Kota,2014/2014Number of Private Madrasah Tsanawiyah Schools, Pupils,Teachers and Ratio of Pupils to Teachers by
Regency/Municipality, 2014/2014 ........................................ 147
4.1.21 Banyaknya Sekolah, Murid, Guru Madrasah Aliyah dan RasioMurid Terhadap Guru menurut Kabupaten/Kota, 2014/2014Number of Madrasah Aliyah Schools, Pupils, Teachers and Ratioof Pupils to Teachers by Regency/Municipality, 2014/2014 . 148
4.1.22 Banyaknya Sekolah, Murid, Guru Madrasah Aliyah Negeridan Rasio Murid Terhadap Guru menurut Kabupaten/Kota,2014/2014
. s .
pils, Teegency/
................. .
MadrasGuru m
rasah Tatio o
ity 01
ekolah,o Murir
014o
8/20/2019 Kalimantan Timur Dalam Angka Tahun 2015
http://slidepdf.com/reader/full/kalimantan-timur-dalam-angka-tahun-2015 25/623
xxiiiK A L I M A N T A N T I M U R D A L A M A N G K A 2015
Number of State Madrasah Aliyah Schools, Pupils, Teachers andRatio of Pupils to Teachers by Regency/Municipality,2014/2014 ............................................................................. 149
4.1.23 Banyaknya Sekolah, Murid, Guru Madrasah Aliyah Swastadan Rasio Murid Terhadap Guru menurut Kabupaten/Kota,2014/2014Number of Private Madrasah Aliyah Schools, Pupils, Teachersand Ratio of Pupils toTeachers by Regency/Municipality,2014/2014 ............................................................................. 150
4.1.24 Banyaknya Perguruan Tinggi/Akademi, Fakultas dan Mahasiswa,
2014/2014Number of University/Academies, Faculties and Students,2014/2014 ............................................................................. 151
4.1.25 Jumlah Lulusan dan Dosen Perguruan Tinggi/Akademi menurutKabupaten/Kota, 2014/2014Number of Succeed and Lecturers by Regency/ Municipality,2014/2014 ............................................................................. 152
4.1.26 Jumlah Dosen Tetap Perguruan Tinggi dan Akademi Swastamenurut Jenjang Pendidikan, 2014Number of Lecturers in Private University and Academy byEducational Attainment, 2014 .............................................. 153
4.2.1 Banyaknya Rumah Sakit dan Kapasitas Tempat Tidur menurutKabupaten/Kota, 2010-2014Number of Hospitals and Bed Capacity by Regency/ Municipality,
2010-2014 ............................................................................. 154
4.2.2 Banyaknya Rumah Sakit Swasta dan Kapasitas TempatTidur menurut Kabupaten/Kota, 2010-2014Number of Hospitals and Bed Capacity by Regency/ Municipality,2010-2014 ............................................................................. 155
4.2.3 Banyaknya Dokter menurut Kabupaten/Kota, 2014Number of Doctors by Regency/Municipality, 2014 ............. 156
i .
es and S................ . .
guruan T
Lecture.................. .
etap Png Pen
Lecturonal Att
anya nyup
8/20/2019 Kalimantan Timur Dalam Angka Tahun 2015
http://slidepdf.com/reader/full/kalimantan-timur-dalam-angka-tahun-2015 26/623
xxiv K A L I M A N T A N T I M U R D A L A M A N G K A 2015
4.2.4 Banyaknya Tenaga Medis, Paramedis dan Non Medis di RumahSakit menurut Kabupaten/Kota, 2014Number of Medical Personnels, Paramedics and Non Paramedicsin Hospitals by Regency/Municipality, 2014 ....................... 157
4.2.5 Banyaknya Bidan, Paramedis dan Non Medis di Rumah Bersalinmenurut Kabupaten/Kota,2014Number of Midwife, Paramedics and Non Paramedics inHospitals by Regency/Municipality, 2014 ........................... 158
4.2.6 Banyaknya Penderita dan Kematian menurut Jenis Penyakit danKabupaten/Kota, 2014
Number of Patients and Death by Kind of Disease andRegency/Municipality, 2014 ................................................. 159
4.2.7 Banyaknya Puskesmas menurut Kabupaten/Kota, 2008-2014Number of Public Health Centres by Regency/ Municipality, 2008-2014 ...................................................................................... 160
4.2.8 Banyaknya Puskesmas, Puskesmas Pembantu dan DokterPuskesmas menurut Kabupaten/Kota, 2014Number of Public Health Centres, Subsidiary Public HealthCentres and Doctors by Regency/Municipality, 2014 ........... 161
4.2.9 Banyaknya Pedagang Besar Farmasi dan Apotik menurutKabupaten/Kota, 2010-2014Number of Pharmaceutical Wholesalers and Pharmaciesby Regency/Municipality, 2010-2014 .................................... 162
4.2.10 Jumlah Ibu Hamil dan Jumlah Persalinan menurutKabupaten/Kota, 2014Number of Pregnant Mother and Baby DeliverybyRegency/Municipality, 2014 ................................................. 163
4.2.11 Banyaknya Balita yang Pernah Mendapat Imunisasi MenurutJenis Imunisasi di Provinsi Kalimantan Timur, 2014Number of Toddler that Ever Received Immunization by Type ofImmunization in Kalimantan Timur, 2014 ............................. 164
. f Di...... .........
en/Kotegency/
................ .
us esupaten/
ealth C rs y Re
edagann/Kota,
er of Phcy/
8/20/2019 Kalimantan Timur Dalam Angka Tahun 2015
http://slidepdf.com/reader/full/kalimantan-timur-dalam-angka-tahun-2015 27/623
xxvK A L I M A N T A N T I M U R D A L A M A N G K A 2015
4.2.12 Banyaknya Sarana Keluarga Berencana (KB) menurutKabupaten/Kota, 2014Number of Family Planning (FP) Facilities byRegency/Municipality, 2014 ................................................. 165
4.2.13 Banyaknya Peserta KB Aktif menurut Pemakaian Jenis AlatKontrasepsi dan Kabupaten/Kota, 2014Number of Active Acceptors by Contraception Method andRegency/Municipality, 2014 ................................................. 166
4.2.14 Banyaknya Peserta Baru menurut Pemakaian Alat Kontrasepsidan Kabupaten/Kota, 2014
Number of New Acceptors by Contraception Method andRegency/Municipality, 2014 ................................................. 167
4.2.15 Banyaknya Donor Darah menurut Golongan Darah dan Kabupaten/Kota, 2014Number of Blood Donaturs by Blood Type and Regency/Municipality, 2014 ................................................................ 168
4.2.16 Banyaknya Distribusi Darah Lengkap menurut Bagian-Bagian danKabupaten/Kota, 2014Number of Blood Distribution by Division and Regency/Municipality, 2014 ................................................................ 169
4.2.17 Sarana dan Kegiatan Palang Merah Indonesia, 2014Indonesian Red Cross Activities and Facilities, 2014 ........... 171
4.3.1 Banyaknya Tindak Kejahatan yang Dilaporkan, Tertunggak dan
Telah Diselesaikan menurut Kabupaten/Kota, 2011-2014Number of Crimes and Offenses Which Reported, Postpone andResolved by Ragency/Municipality, 2011-2014 .................... 173
4.3.2 Banyaknya Tahanan pada Kepolisian Daerah, 2014Number of Prisoners on Regional Police, 2014 ..................... 174
4.3.3 Banyaknya Perkara yang Masuk di Kejaksaan Tinggi, 2014Number of Cases that Received by High Prosecution Office,2014 ...................................................................................... 175
:
. s .
. ption...............
rut Go
s by Bl...................
i Darah, 2014
Bloodty
na dan Konesia
8/20/2019 Kalimantan Timur Dalam Angka Tahun 2015
http://slidepdf.com/reader/full/kalimantan-timur-dalam-angka-tahun-2015 28/623
xxvi K A L I M A N T A N T I M U R D A L A M A N G K A 2015
4.3.4 Banyaknya Tahanan yang Masuk di Kejaksaan Tinggi, 2014Number of Prisoner that Received by Chief Prosecution Office,2014 ...................................................................................... 178
4.3.5 Rekapitulasi Penyelesaian Perkara Tindak Pidana Umum, 2011-2014Summary on The Completion of Public Crimes Cases, 2011 – 2014 .............................................................................................. 177
4.3.6 Perkara Tindak Pidana Umum yang Menonjol /Menarik PerhatianMasyarakat, 2011-2014
Case of Uppermost Public Crimes, 2011-2014 ...................... 178
4.3.7 Hasil Dinas Tindak Pidana Umum (dalam Rupiah), 2011-2014Result From Public Crimes Assignment, 2011-2014 (Rps) ..... 179
4.3.8 Perkara yang Ditangani Unit Tindak Pidana Umum KejaksaanTinggi Kalimantan Timur, 2014Number of Cases Handled by Public Crimes Unit in High PublicProsecution Office in Kalimantan Timur, 2014 ...................... 180
4.3.9 Jumlah Hakim, Panitera dan Juru Sita, 2014Number of Judges, Clerks of Court and Ushers, 2014 ........... 181
4.3.10 Kapasitas Lembaga Permasyarakatan/Rutan, Jumlah Narapidanadan Tahanan Menurut Lapas/Rutan dan Jenis Kelamin Pada AkhirTahun Menurut Jenis Kelamin, 2014Number of Penitentiaries, Prisoners and Detainees at End of Year
by Sex and Regency/Municipality, 2014 ............................... 182
4.3.11 Banyaknya Narapidana dan Tahanan pada Akhir Tahun, MenurutJenis Kejahatan/Pelanggaran dan Jenis Kelamin, 2014Number of Prisoners and Detainees at End of Year by Type ofCrime/Offense and Sex, 2014 ................................................ 183
4.3.12 Data Kasus Illegal Kehutanan, Pertambangan, Perikanan dangPerdagangan Illegal Per Bulan Tahun 2014
s . . i............. ..
piah) ,, 2-
dak Pida
y Pu imantan
itera
:a
es, C er
Lembaananen
8/20/2019 Kalimantan Timur Dalam Angka Tahun 2015
http://slidepdf.com/reader/full/kalimantan-timur-dalam-angka-tahun-2015 29/623
xxviiK A L I M A N T A N T I M U R D A L A M A N G K A 2015
Cases of Illegal Logging, Mining, Fishing and Illegal Trafficking PerMonth in 2014 ....................................................................... 185
4.3.13 Angka Kriminalitas Provinsi Kalimantan Timur (Tanpa Kaltara),2014Number of Criminality Kalimantan Timur Province (WithoutKaltara), 2014 ....................................................................... 186
4.3.14 Angka Kriminalitas Provinsi Kalimantan Timur (Tanpa Kaltara),2008-2014Number of Criminality Kalimantan Timur Province (WithoutKaltara), 2008-2014 .............................................................. 187
4.3.15 Jumlah Kegiatan Demokrasi menurut Kabupaten/Kota, 2014Number of Democratic Activities by Regency/Municipality,2014 ...................................................................................... 188
4.4.1 Banyaknya Pemeluk Agama menurut Golongan Agama danKabupaten/Kota, 2014Number of Population by Religion and Regency/ Municipality,2014 ...................................................................................... 189
4.4.2 Banyaknya Tempat Peribadatan menurut Kabupaten/Kota, 2014Number of Religious Worship Facilities by Regency/ Municipality,2014 ...................................................................................... 190
4.4.3 Banyaknya Penyuluh Agama menurut Kabupaten/Kota, 2014Number of Religious Teachers by Regency/Municipality,2014 ...................................................................................... 191
4.4.4 Banyaknya Pondok Pesantren, Kyai dan Santri menurutKabupaten/Kota, 2014Number of Moslem boarding Schools, Teachers and Pupils byRegency/Municipality, 2014 ................................................. 192
4.4.5 Banyaknya Jemaah Haji menurut Kabupaten/Kota, 2009-2014Number of Moslem Pilgrims by Regency/Municipality, 2009-2014 .............................................................................................. 193
: l
s .
...
upaten/by Reg
.................. .
menur
y Re i............. . ......
mpat PeReligiou
................. .
anyaknye
8/20/2019 Kalimantan Timur Dalam Angka Tahun 2015
http://slidepdf.com/reader/full/kalimantan-timur-dalam-angka-tahun-2015 30/623
xxviii K A L I M A N T A N T I M U R D A L A M A N G K A 2015
4.4.6 Banyaknya Nikah, 2014Number of Marriages, 2014 .................................................. 194
4.4.7 Banyaknya Talak dan Cerai Menurut Kabupaten/Kota, 2014Number of Divorces by Regency/Municipality, 2014 ............ 195
4.4.8 Banyaknya Perkara yang Diputus oleh Pengadilan AgamaKabupaten/Kota Menurut Jenis Perkara, 2014Number of Cases Which Was Decided by Religious Courts by Typeof Cases, 2014 ....................................................................... 196
4.4.9 Banyaknya Perkara di Pengadilaan Agama menurut
Kabupaten/Kota, 2014Number of Cases in Religious Courts by Regency/ Municipality,2014 ...................................................................................... 198
4.4.10 Faktor-Faktor Penyebab Terjadinya Perceraian Se WilayahPengadilan Tinggi Agama Samarinda menurut Kabupaten/Kota,2014Causing Factors of Divorce at High Religious Court of,Kalimantan Timur by Regency/Municipality, 2014 ............... 199
4.5.1 Banyaknya Panti Asuhan, Anak Asuh dan Hasil Rehabilitasimenurut Status, 2007-2014Number of Orphanages, Children in Care and Rehabilitation byStatus, 2007 - 2014 ............................................................... 201
4.5.2 Banyaknya Panti Werdha dan Penghuninya menurut Status,2007-2014
Number of Old People’s Home and Occupant by Status,2007 – 2014 ........................................................................... 202
4.5.3 Banyaknya Kejadian dan Korban Bencana Alam menurutJenisnya, 2014Number of Natural Disasters and Victims by Type of Disasters,2014 ...................................................................................... 203
4.5.4 Banyaknya Komunitas Adat Terpencil menurutKabupaten/Kota (KK), 2010-2014
ncy / M................ .
a Perceda me
t Hig Rency/M
Asu an,, -
rphana07 -- 01
a
8/20/2019 Kalimantan Timur Dalam Angka Tahun 2015
http://slidepdf.com/reader/full/kalimantan-timur-dalam-angka-tahun-2015 31/623
xxixK A L I M A N T A N T I M U R D A L A M A N G K A 2015
Number of Isolated Communities by Regency/Municipality(Household), 2010-2014 ........................................................ 204
4.5.5 Banyaknya Anak Asuh yang Terdaftar, yang Menerima Bantuandan yang Belum Menerima Bantuan menurut Kabupaten/Kota,2014Number of Children in Care Registered by Regency/ Municipality,2014 ...................................................................................... 205
4.5.6 Banyaknya Anak Terlantar (0-21 Tahun) menurutKabupaten/Kota, 2008-2014Number of Waif (0-21 Years Old) by Regency/ Municipality, 2008-
2014 ...................................................................................... 206
4.5.7 Banyaknya Pekerja Sosial Masyarakat (PSM) menurutKabupaten/Kota, 2011 - 2014Number of Public Social Workers by Regency/ Municipality, 2011-2014 ..................................................................................... 207
4.5.8 Banyaknya Karang Taruna menurut Tingkat Perkembangan danKabupaten/Kota, 2014Number of Youth Association by Growth and Regency/Municipality, 2014 ................................................................ 208
4.5.9 Banyaknya Organisasi Sosial menurut Jenis/Klasifikasi danKabupaten/Kota, 2014Number of Social Organization by Classification and Regency/Municipality, 2014 ................................................................ 209
4.6.1 Banyaknya Keluarga Pra Sejahtera, Sejahtera I, Sejahtera II,Sejahtera III dan Sejahtera III Plus menurut Kabupaten/Kota,2014Number of Pre welfare Number, Welfare I, Welfare II, Welfare IIIand Welfare III Plus by Regency/Municipality, 2014 ............. 210
4.6.2 Banyaknya Keluarga Prasejahtera, Sejahtera I, Sejahtera II,Sejahtera III dan Sejahtera III Plus, 2009-2014Number of Pre Welfare, Welfare I, Welfare II, Welfare III andWelfare III Plus, 2009 – 2014 .................................................. 211
. i............. ..
(PSM
s by Reg ................ .
una me14
uth As2014 .....
ya Orpaten/
umberici
8/20/2019 Kalimantan Timur Dalam Angka Tahun 2015
http://slidepdf.com/reader/full/kalimantan-timur-dalam-angka-tahun-2015 32/623
xxx K A L I M A N T A N T I M U R D A L A M A N G K A 2015
4.7.1 Banyaknya Perpustakaan menurut Jenis dan Kabupaten/Kota,2014Number of Libraries by Kind and Regency/Municipality,2014 ...................................................................................... 212
4.7.2 Jumlah Buku yang Tersedia dan Dipinjamkan di PerpustakaanNasional, 2014Number of Book Available and Lent at National Library,2014 ...................................................................................... 213
4.7.3 Banyaknya Anggota, Peminjam dan Pengunjung Perpustakaan di
Perpustakaan Nasional (Orang), 2014Number of Member, Lender and Visitor by Status at NationalLibrary ( Person ), 2014 ........................................................... 214
4.7.4 Jumlah Perpustakaan Tahun 2008 s.d 2014 Provinsi KalimantanTimurNumber of Library 2008-2014 Kalimantan Timur Province ... 215
4.7.5 Jumlah Pengunjung Perpustakaan Tahun 2011 s.d 2014 MenurutKabupaten/Kota Provinsi Kalimantan TimurNumber of Library Visitor 2011-2014 by Regency/MunicipalityKalimantan Timur Province ................................................... 217
4.8 Indeks Pembangunan Manusia (IPM) dan PeringkatKabupaten/Kota, 2010-2014Human Development Index (HDI) and Ranking byRegency/Municipality, 2010-2014 ........................................ 218
4.9 Indikator Perkembangan Infrastruktur Kesehatan, 2008-2014Series of health infrastructure indicators, 2008 – 2014 ........ 219
4.10 Persentase Rumah Tangga menurut Luas Lantai Tempat Tinggaldan Kabupaten/Kota, 2014Percentage of Households By Floor Area Of Dwelling AndRegency/Municipality, 2014 ................................................. 220
.
tatus a............... . .
.d 2014 P
alimant
ustakaa
: nsi Kali
Visitoriur Provi
Pembanaten/Ko D

8/20/2019 Kalimantan Timur Dalam Angka Tahun 2015
http://slidepdf.com/reader/full/kalimantan-timur-dalam-angka-tahun-2015 33/623
xxxiK A L I M A N T A N T I M U R D A L A M A N G K A 2015
4.11 Persentase Wanita Pernah Kawin (15-49) Menurut AktivitasPenggunaan Alat KB dan Kabupaten/Kota, 2014Percentage WEM (15-49) by Using the Tools KB Activity ByRegency/Municipality, 2014 ................................................. 221
4.12 Banyaknya Lembaga, Jenis, Atlet dan sarana/prasarana padaCabang Olahraga Unggulan, Tahun 2014
Number of Institution, Type, Athletes, andFacilities/Infrastructure in Sports, 2014 ................................ 222
4.13 Produksi dan Volume Sampah yang Terangkut per Hari MenurutKabupaten/Kota Tahun 2014
Production and volume of waste transported per day accordingto the Regency/Municipality in 2014 .................................... 223
d pe
h t t p : / / k a l t i m
. b p s . g
................
8/20/2019 Kalimantan Timur Dalam Angka Tahun 2015
http://slidepdf.com/reader/full/kalimantan-timur-dalam-angka-tahun-2015 34/623
xxxii K A L I M A N T A N T I M U R D A L A M A N G K A 2015
V. Pertanian – Agriculture
5.1.1 Luas Panen, Hasil Per Hektar dan Produksi Padi (Sawah+Ladang)Menurut Kabupaten/Kota, 2014Harvested Area, Yield Rate and Production of Paddy(Wetland+Dryland) by Regency/Municipality , 2014 ............. 241
5.1.2 Luas Panen, Hasil Per Hektar dan Produksi Padi Sawah MenurutKabupaten/ Kota, 2014Harvested Area, Yield rate and Production Of Wetland Paddy byRegency/Municipality, 2014 ................................................. 242
5.1.3 Luas Panen Hasil Per Hektar dan Produksi Padi Bukan LahanSawah Menurut Kabupaten/Kota, 2014Harvested Area, Yield rate and Production of Dryland Paddy byRegency/Municipality, 2014 ................................................. 243
5.1.4 Luas Panen dan Produksi Palawija Menurut Kabupaten/Kota,2014Harvested Area and Production of Food Crops byRegency/Municipality, 2014 ................................................. 244
5.1.5 Luas Panen Tanaman Palawija Menurut Jenis Tanaman (Ha),2008-2014Harvested Area of Food Crops by Type (Ha), 2008-2014 ...... 246
5.1.6 Hasil Per Hektar Tanaman Palawija Menurut Jenis Tanaman (Kw),2008-2014Yield Rate of Food Crops by Type (Kw), 2008-2014 ............... 247
5.1.7 Produksi Tanaman Palawija Menurut Jenis Tanaman (Ton), 2008-2014Food Crops Production by Type (Tons), 2008-2014 ............... 248
5.1.8 Produksi Tanaman Sayur-Sayuran menurut Jenisnya (Ton), 2008-2014Vegetables Production by Type (Tons), 2008-2014 ............... 249
5.1.9 Produksi Sayur-Sayuran Menurut Kabupaten/Kota (Ton), 2014
l
s . . di Bu
of Dryl................. .
ja Men
ro ucti14 .........
an Pal
rea of Fo
er Hekta
8/20/2019 Kalimantan Timur Dalam Angka Tahun 2015
http://slidepdf.com/reader/full/kalimantan-timur-dalam-angka-tahun-2015 35/623
xxxiiiK A L I M A N T A N T I M U R D A L A M A N G K A 2015
Vegetables Production by Regency/Municipality (Ton),2014 ...................................................................................... 250
5.1.10 Hasil Per Hektar Tanaman Sayur-Sayuran Menurut Jenisnya(Kw/Ha), 2008-2014Yield Rate of Vegetables by Type (Kw/Ha), 2008 – 2014 ...... 251
5.1.11 Luas Panen Tanaman Sayur-Sayuran menurut Jenisnya (Ha),2008-2014Harvested Area of Vegetables by Type (Ha), 2008- 2014 ..... 252
5.1.12 Produksi Buah-Buahan menurut Jenisnya (Ton), 2008-2014
Fruits Production by Type (Ton), 2008-2014 ......................... 253
5.1.13 Produksi Buah-Buahan menurut Jenisnya dan Kabupaten/Kota(Ton), 2014Fruits Production by Type and Regency/Municipality (Ton),2014 ...................................................................................... 254
5.2.1 Luas Tanaman Perkebunan menurut Jenis Tanaman danKabupaten/Kota (Ha), 2014Planted Area of Estates by Type of Crops andRegency/Municipality (Ha), 2014 .......................................... 255
5.2.2 Produksi Perkebunan menurut Jenis Tanaman danKabupaten/Kota (Ton), 2014Production of Estates by Type of Crops and Regency/Municipality(Tons), 2014 .......................................................................... 257
5.2.3 Luas dan Produksi Tanaman Perkebunan Besar Pemerintahmenurut Jenis Tanaman dan Kabupaten/Kota (Ha), 2014Planted Area and Production of Large States Estates by Type ofCrops and Regency/Municipality (Ha), 2014 ......................... 259
5.2.4 Luas Tanaman Perkebunan Besar Swasta menurut JenisTanaman dan Kabupaten/Kota (Ha), 2014Planted Area of Large Private Estates by Type of Crops andRegency/Municipality (Ha), 2014 .......................................... 260
. i
............ ..
snya a
d Rege................ .
unan), 2014
of Eicipality
i Perpaten/
r oductios) ,
8/20/2019 Kalimantan Timur Dalam Angka Tahun 2015
http://slidepdf.com/reader/full/kalimantan-timur-dalam-angka-tahun-2015 36/623
xxxiv K A L I M A N T A N T I M U R D A L A M A N G K A 2015
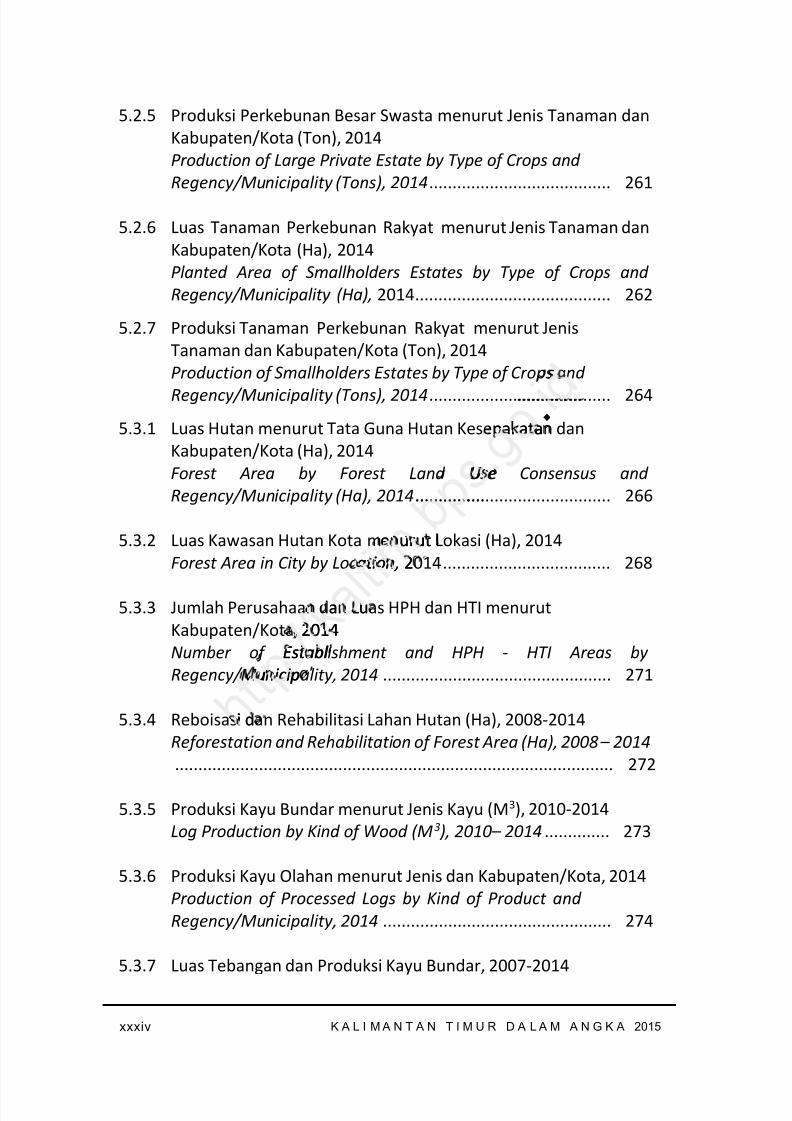
5.2.5 Produksi Perkebunan Besar Swasta menurut Jenis Tanaman danKabupaten/Kota (Ton), 2014Production of Large Private Estate by Type of Crops andRegency/Municipality (Tons), 2014 ....................................... 261
5.2.6 Luas Tanaman Perkebunan Rakyat menurut Jenis Tanaman danKabupaten/Kota (Ha), 2014Planted Area of Smallholders Estates by Type of Crops andRegency/Municipality (Ha), 2014 .......................................... 262
5.2.7 Produksi Tanaman Perkebunan Rakyat menurut JenisTanaman dan Kabupaten/Kota (Ton), 2014Production of Smallholders Estates by Type of Crops andRegency/Municipality (Tons), 2014 ....................................... 264
5.3.1 Luas Hutan menurut Tata Guna Hutan Kesepakatan danKabupaten/Kota (Ha), 2014Forest Area by Forest Land Use Consensus andRegency/Municipality (Ha), 2014 .......................................... 266
5.3.2 Luas Kawasan Hutan Kota menurut Lokasi (Ha), 2014Forest Area in City by Location, 2014 .................................... 268
5.3.3 Jumlah Perusahaan dan Luas HPH dan HTI menurutKabupaten/Kota, 2014Number of Establishment and HPH - HTI Areas byRegency/Municipality, 2014 ................................................. 271
5.3.4 Reboisasi dan Rehabilitasi Lahan Hutan (Ha), 2008-2014Reforestation and Rehabilitation of Forest Area (Ha), 2008 – 2014
.............................................................................................. 272
5.3.5 Produksi Kayu Bundar menurut Jenis Kayu (M 3), 2010-2014Log Production by Kind of Wood (M 3 ), 2010 – 2014 .............. 273
5.3.6 Produksi Kayu Olahan menurut Jenis dan Kabupaten/Kota, 2014Production of Processed Logs by Kind of Product andRegency/Municipality, 2014 ................................................. 274
5.3.7 Luas Tebangan dan Produksi Kayu Bundar, 2007-2014
. s
............... .
pakata
Use................ .
enurutation , , 2
dan Lu, 2014
Establunicipi
i d
8/20/2019 Kalimantan Timur Dalam Angka Tahun 2015
http://slidepdf.com/reader/full/kalimantan-timur-dalam-angka-tahun-2015 37/623
xxxvK A L I M A N T A N T I M U R D A L A M A N G K A 2015
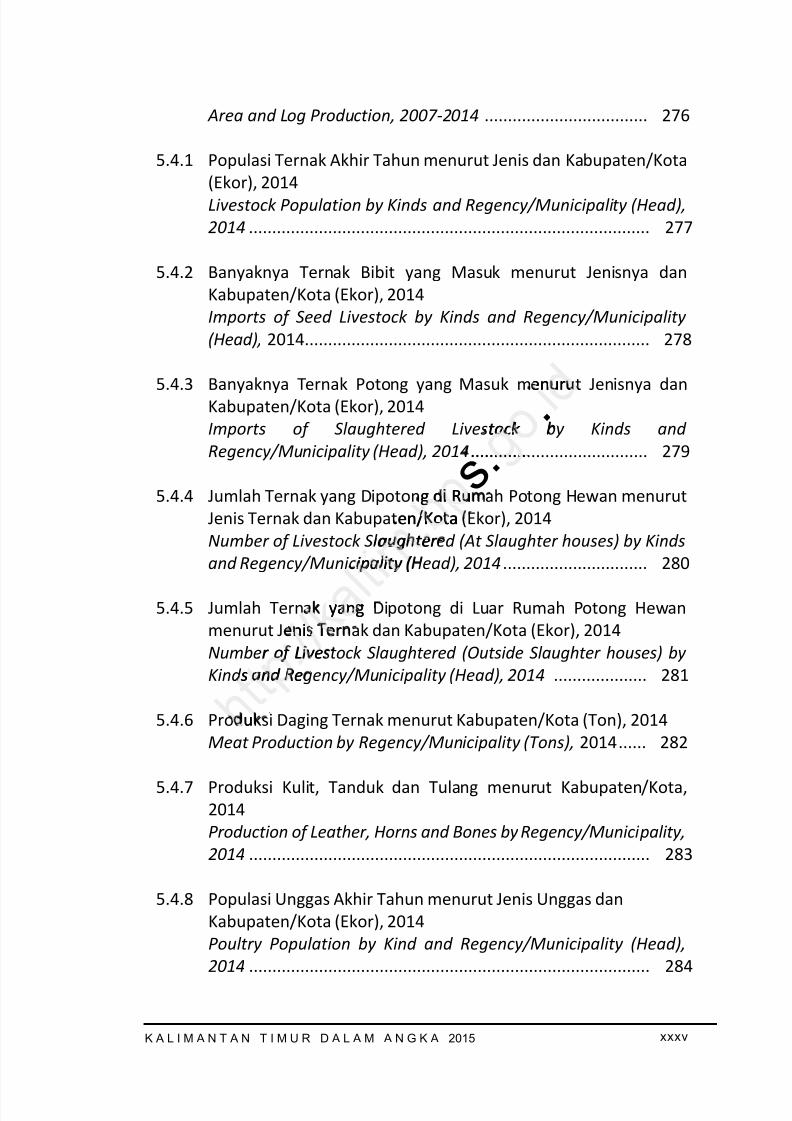
Area and Log Production, 2007-2014 ................................... 276
5.4.1 Populasi Ternak Akhir Tahun menurut Jenis dan Kabupaten/Kota(Ekor), 2014Livestock Population by Kinds and Regency/Municipality (Head),2014 ...................................................................................... 277
5.4.2 Banyaknya Ternak Bibit yang Masuk menurut Jenisnya danKabupaten/Kota (Ekor), 2014Imports of Seed Livestock by Kinds and Regency/Municipality(Head), 2014.......................................................................... 278
5.4.3 Banyaknya Ternak Potong yang Masuk menurut Jenisnya danKabupaten/Kota (Ekor), 2014Imports of Slaughtered Livestock by Kinds andRegency/Municipality (Head), 2014 ...................................... 279
5.4.4 Jumlah Ternak yang Dipotong di Rumah Potong Hewan menurutJenis Ternak dan Kabupaten/Kota (Ekor), 2014Number of Livestock Slaughtered (At Slaughter houses) by Kindsand Regency/Municipality (Head), 2014 ............................... 280
5.4.5 Jumlah Ternak yang Dipotong di Luar Rumah Potong Hewanmenurut Jenis Ternak dan Kabupaten/Kota (Ekor), 2014Number of Livestock Slaughtered (Outside Slaughter houses) byKinds and Regency/Municipality (Head), 2014 .................... 281
5.4.6 Produksi Daging Ternak menurut Kabupaten/Kota (Ton), 2014Meat Production by Regency/Municipality (Tons), 2014 ...... 282
5.4.7 Produksi Kulit, Tanduk dan Tulang menurut Kabupaten/Kota,2014Production of Leather, Horns and Bones by Regency/Municipality,2014 ...................................................................................... 283
5.4.8 Populasi Unggas Akhir Tahun menurut Jenis Unggas danKabupaten/Kota (Ekor), 2014Poultry Population by Kind and Regency/Municipality (Head),2014 ...................................................................................... 284
s . . enur
tock............... .
g di Ruen/Kota
aug teripality (
yangnis Ter
r of Lives and Re
u
8/20/2019 Kalimantan Timur Dalam Angka Tahun 2015
http://slidepdf.com/reader/full/kalimantan-timur-dalam-angka-tahun-2015 38/623
xxxvi K A L I M A N T A N T I M U R D A L A M A N G K A 2015
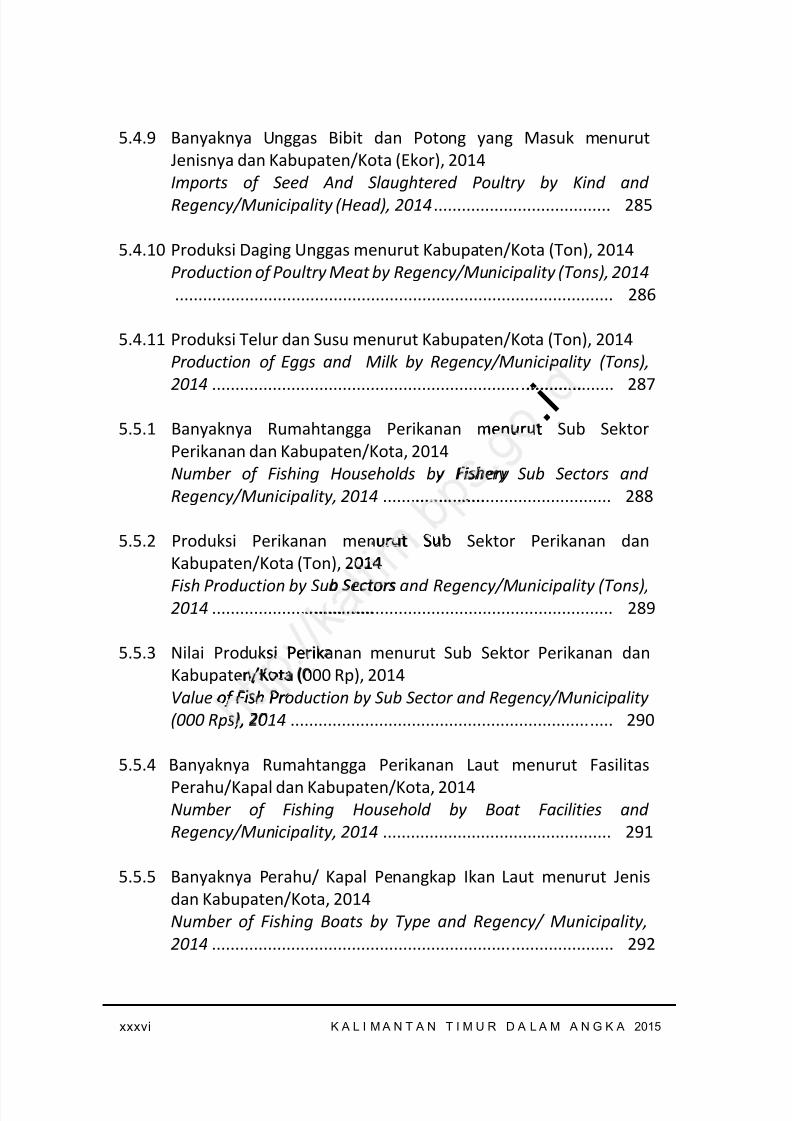
5.4.9 Banyaknya Unggas Bibit dan Potong yang Masuk menurutJenisnya dan Kabupaten/Kota (Ekor), 2014Imports of Seed And Slaughtered Poultry by Kind andRegency/Municipality (Head), 2014 ...................................... 285
5.4.10 Produksi Daging Unggas menurut Kabupaten/Kota (Ton), 2014Production of Poultry Meat by Regency/Municipality (Tons), 2014 .............................................................................................. 286
5.4.11 Produksi Telur dan Susu menurut Kabupaten/Kota (Ton), 2014Production of Eggs and Milk by Regency/Municipality (Tons),
2014 ...................................................................................... 287
5.5.1 Banyaknya Rumahtangga Perikanan menurut Sub SektorPerikanan dan Kabupaten/Kota, 2014Number of Fishing Households by Fishery Sub Sectors andRegency/Municipality, 2014 ................................................. 288
5.5.2 Produksi Perikanan menurut Sub Sektor Perikanan danKabupaten/Kota (Ton), 2014Fish Production by Sub Sectors and Regency/Municipality (Tons),2014 ...................................................................................... 289
5.5.3 Nilai Produksi Perikanan menurut Sub Sektor Perikanan danKabupaten/Kota (000 Rp), 2014Value of Fish Production by Sub Sector and Regency/Municipality(000 Rps), 2014 ..................................................................... 290
5.5.4 Banyaknya Rumahtangga Perikanan Laut menurut FasilitasPerahu/Kapal dan Kabupaten/Kota, 2014Number of Fishing Household by Boat Facilities andRegency/Municipality, 2014 ................................................. 291
5.5.5 Banyaknya Perahu/ Kapal Penangkap Ikan Laut menurut Jenisdan Kabupaten/Kota, 2014Number of Fishing Boats by Type and Regency/ Municipality,2014 ...................................................................................... 292
. i............. ..
enurut
Fishery................ .
urut S014
Sector................ . ...
si Perikn/Kota
of Fish Pr , ,
8/20/2019 Kalimantan Timur Dalam Angka Tahun 2015
http://slidepdf.com/reader/full/kalimantan-timur-dalam-angka-tahun-2015 39/623
xxxviiK A L I M A N T A N T I M U R D A L A M A N G K A 2015
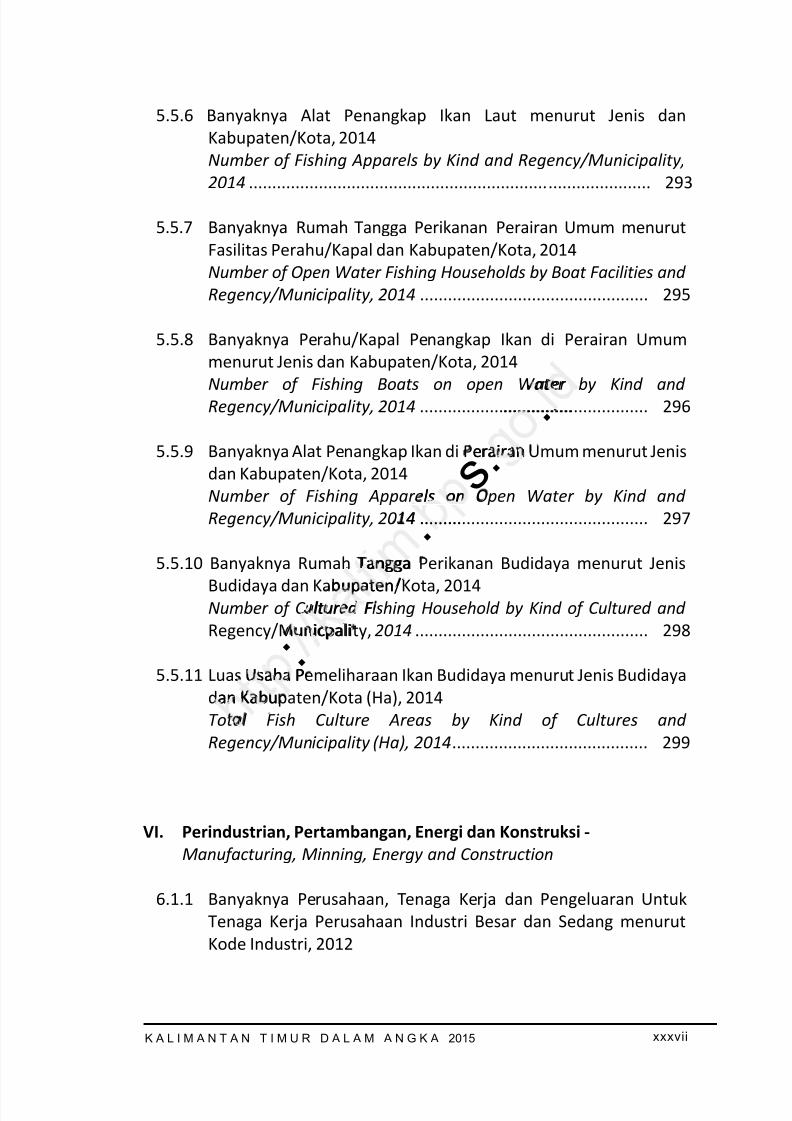
5.5.6 Banyaknya Alat Penangkap Ikan Laut menurut Jenis danKabupaten/Kota, 2014Number of Fishing Apparels by Kind and Regency/Municipality,2014 ...................................................................................... 293
5.5.7 Banyaknya Rumah Tangga Perikanan Perairan Umum menurutFasilitas Perahu/Kapal dan Kabupaten/Kota, 2014Number of Open Water Fishing Households by Boat Facilities andRegency/Municipality, 2014 ................................................. 295
5.5.8 Banyaknya Perahu/Kapal Penangkap Ikan di Perairan Umummenurut Jenis dan Kabupaten/Kota, 2014
Number of Fishing Boats on open Water by Kind andRegency/Municipality, 2014 ................................................. 296
5.5.9 Banyaknya Alat Penangkap Ikan di Perairan Umum menurut Jenisdan Kabupaten/Kota, 2014Number of Fishing Apparels on Open Water by Kind andRegency/Municipality, 2014 ................................................. 297
5.5.10 Banyaknya Rumah Tangga Perikanan Budidaya menurut JenisBudidaya dan Kabupaten/Kota, 2014Number of Cultured Fishing Household by Kind of Cultured andRegency/Municpality, 2014 .................................................. 298
5.5.11 Luas Usaha Pemeliharaan Ikan Budidaya menurut Jenis Budidayadan Kabupaten/Kota (Ha), 2014Total Fish Culture Areas by Kind of Cultures andRegency/Municipality (Ha), 2014 .......................................... 299
VI. Perindustrian, Pertambangan, Energi dan Konstruksi -Manufacturing, Minning, Energy and Construction
6.1.1 Banyaknya Perusahaan, Tenaga Kerja dan Pengeluaran UntukTenaga Kerja Perusahaan Industri Besar dan Sedang menurutKode Industri, 2012
:
. s .
. ater...............
erairan
ls on4 .............
anggaupaten
ltured Funicpali
Usaha Pan Kabu

8/20/2019 Kalimantan Timur Dalam Angka Tahun 2015
http://slidepdf.com/reader/full/kalimantan-timur-dalam-angka-tahun-2015 40/623
xxxviii K A L I M A N T A N T I M U R D A L A M A N G K A 2015
Number of Establishments, Workers Engaged and Labour Costsof Large and Medium Manufacturing Establishments byIndustrial Code, 2012 ............................................................ 311
6.1.2 Biaya Input Perusahaan Industri Besar dan Sedang menurut KodeIndustri (000.000 Rp), 2012Input Cost of Large and Medium Manufacturing EstablishmentsBy Industrial Code (000,000 Rps), 2012 ................................ 312
6.1.3 Nilai Output Perusahaan Industri Besar dan Sedang menurutKode Industri (000.000 Rp), 2012 Value of Gross Output of Large and Medium Manufacturing
Establishment by Industrial Code (000,000 Rps), 2012 ......... 313
6.1.4 Nilai Tambah Perusahaan Industri Besar dan Sedang menurutKode Industri (000.000 Rp), 2012Value Added of Large and Medium ManufacturingEstablishments by Industrial Code (000,000 Rps), 2010 ....... 314
6.1.5 Beberapa Indikator Industri Besar dan Sedang menurut KodeIndustri, 2012Some Indicators of Large and Medium ManufacturingEstablishments by Industrial Code, 2010 .............................. 315
6.2.1 Produksi Batubara, Emas dan Perak, 2007-2014Coal, Gold and Silver Production, 2007- 2014 ....................... 316
6.2.2 Produksi dan Penyaluran Amoniak (Ton), 2009-2014Production And Distribution Of Ammonia (Tons), 2009-
2014 ...................................................................................... 317
6.2.3 Produksi dan Penyaluran Urea (Ton), 2009-2014Production and Distribution of Urea in Bulks (Tons), 2009-2014 ...................................................................................... 318
6.2.4 Produksi Minyak Bumi dan Gas Bumi, 2009-2014Production of Oil and Gas, 2009 – 2014 ............................... 319
6.2.5 Produksi LNG, C3, C4 dan Kondensat (M 3), 2010-2014
i
.
01 .....
an Se
Mediu(000,00
i Besar
Largen ustri
ubara, Eand Silv
da
8/20/2019 Kalimantan Timur Dalam Angka Tahun 2015
http://slidepdf.com/reader/full/kalimantan-timur-dalam-angka-tahun-2015 41/623
xxxixK A L I M A N T A N T I M U R D A L A M A N G K A 2015
Production of LNG. C3. C4 and Kondensat (M³), 2010- 2014 320
6.2.6 Produksi. Ekspor dan Pengapalan LNG, 2014Production. Export and Shipment of LNG, 2014 .................... 321
6.3.1 Banyaknya Tenaga Listrik yang Diproduksi. Terpasang, Terjual,Dipakai Sendiri dan Susut menurut Kabupaten/Kota (MWh), 2014Number of Electricity Produced, Installed, Sold, Owned-Use andDepreciated by Regency/Municipality (MWh), 2014 ............ 322
6.3.2 Banyaknya Tenaga Listrik yang Terjual menurut Jenis Pelanggandan Kabupaten/Kota (MWh), 2014
Number of Electricity Sold by Kind of Customers andRegency/Municipality (MWh), 2014 ..................................... 323
6.3.3 Banyaknya Pelanggan Listrik menurut Jenis Pelanggan danKabupaten/Kota, 2014Number of Customer Electricity by Kind of Customers andRegency/Municipality, 2014 ................................................. 324
6.3.4 Banyaknya Pelanggan Listrik menurut Kelompok Tarif, 2014Number of Customer Electricity by Group Tariff, 2014 ......... 325
6.3.5 Prakiraan Kebutuhan Beban Tenaga Listrik Provinsi KalimantanTimurForecasting Needs of Electric Power Load Kalimantan TimurProvince ................................................................................. 326
6.4.1 Jumlah Perusahaan Air Minum. Kapasitas Produksi Sumber Air
Baku dan Tenaga Kerja, 2010-2012Number of Water Supply Establishments.Production Capacity,Water Sources and Workers Engaged, 2010-2012 ............... 328
6.4.2 Banyaknya Air Minum yang Disalurkan Perusahaan Air Minummenurut Jenis Konsumen (000 M 3), 2010-2012Quantity of Water Supply by Water Supply Establishments byKind of Consumers (000 M 3 ), 2010-2012 .............................. 329
6.4.3 Nilai Air Minum yang Disalurkan Perusahaan Air Minum
. s .
. of...............
nurut J
ricity b4 .............
n Listri
: mer Ele
e utu
castingr ovince ..
8/20/2019 Kalimantan Timur Dalam Angka Tahun 2015
http://slidepdf.com/reader/full/kalimantan-timur-dalam-angka-tahun-2015 42/623
xl K A L I M A N T A N T I M U R D A L A M A N G K A 2015
menurut Jenis Konsumen (000 Rp), 2010-2012Value of Water Supplied by Water Supply Establishments by Kindof Consumer (000 Rps), 2010-2012 ....................................... 330
6.4.4 Pendapatan/Penerimaan Perusahaan Air Minum (000 Rp), 2010-2012Main Income Of Water Supply Establishmens (000 Rps),2010-2012 ............................................................................. 331
6.4.5 Biaya Input Perusahaan Air Minum (000 Rp), 2012-2014Input Cost of Water Supply Establishments (000 Rps), 2012-2014 ...................................................................................... 332
6.4.6 Nilai Tambah Perusahaan Air Minum (000 Rp), 2010-2012Value Added of Water Supply Establishments (000 Rps), 2010 – 2012 ...................................................................................... 333
6.5 Banyaknya Pemohon SIB dan SIPA Kab/Kota, 2012 - 2014Number of DL and LE Permit by Regency/Municipality, 2012 -2014 ...................................................................................... 334
VII. Perdagangan – Trade
7.1.1 Volume dan Nilai Ekspor Dirinci menurut Jenis Komoditi Utama,2012-2014 Volume and Value of Export by Main Comodities, 2012-2014 ...................................................................................... 343
7.1.2 Volume dan Nilai Ekspor Dirinci menurut Negara Tujuan Utama,2012-2014Volume and Value of Export by Main Destination Country,2012-2014 ............................................................................. 344
7.1.3 Volume dan Nilai Ekspor Dirinci menurut Pelabuhan, 2012-2014Volume and Value of Export by Comodities, 2012-2014 ....... 345
7.1.4 Nilai Ekspor menurut Pelabuhan (000 US $), 2010 - 2014
: / k a l t i .
s . .
....
, 20 10-2nts (000
................. .
Kab/Koby Reg
.................. .
e
an Nilai014 an
8/20/2019 Kalimantan Timur Dalam Angka Tahun 2015
http://slidepdf.com/reader/full/kalimantan-timur-dalam-angka-tahun-2015 43/623
xl iK A L I M A N T A N T I M U R D A L A M A N G K A 2015
Value of Exports by Port (000 US $), 2010 – 2014 ................. 346
7.1.5 Nilai Ekspor Migas dan Non Migas (000 Us$), 2007-2014Exports Value of Oil and Non-Oil Products (000 US$), 2007-2014 ...................................................................................... 347
7.2.1 Volume dan Nilai Impor Dirinci menurut Jenis Komoditi, 2012-2014Volume and Value of Export by Comodities, 2012-2014 ....... 348
7.2.2 Volume dan Nilai Impor Dirinci menurut Benua, 2012-2014Volume and Value of Export by Continent, 2012-2014 ......... 349
7.2.3 Nilai Impor menurut Pelabuhan (000 Us$), 2009 - 2014Value of Imports by Port (000 US$), 2009 – 2014 ................. 350
7.2.4 Nilai Impor Migas dan Non Migas (000 Us$), 2009-2014Value of Imports Oil and Non Oil (000 US$), 2009-2014 ....... 351
7.2.5 Neraca Perdagangan Luar Negeri Provinsi Kalimantan Timur,2003-2014Foreign Trade Balance of East Kalimantan Province, 2003-2014 ...................................................................................... 352
7.3.1 Penggunaan Cadangan Beras Pemerintah (CBP) di Perum BulogMenurut Kabupaten/Kota (Ton), 2011-2014Government Use of Rice Reserve in Public Corporate Bulog byRegency/Municipality Year, 2011-2014 ................................ 353
7.3.2 Persediaan, Pengadaan dan Penyaluran Beras Perum Bulog(Ton), 2010-2014Stock, Supply and Distribution of Rice in Public CorporateBULOG (Tons), 2010 – 2014 .................................................. 354
7.3.3 Persediaan, Pengadaan dan Penyaluran Beras Perum Bulog Menurut Wilayah Kerja (Ton), 2014Stocks, Supply and Distribution of Rice in Public Corporate BULOGby Sub Regional Division (Tons), 2014 ................................... 355
, 2009 -09 – 20
s (000Oil (000
uar Ne
alance................ . ...
naan Caurut Ka
overnmen
8/20/2019 Kalimantan Timur Dalam Angka Tahun 2015
http://slidepdf.com/reader/full/kalimantan-timur-dalam-angka-tahun-2015 44/623
xlii K A L I M A N T A N T I M U R D A L A M A N G K A 2015
7.3.4 Penyaluran dan Penjualan Beras Oleh Perum Bulog DivisiRegional menurut Golongan Konsumen (Ton), 2010-2014Rice Sales and Distribution by Public Corporate BULOGRegional Division, According to Consumer Groups (Tons),2010-2014 ............................................................................. 356
VIII. Transportasi Komunikasi dan Pariwisata – Transportation,Communication and Tourism
8.1.1 Banyak dan Panjang Jembatan menurut Tingkat Pemerintahanyang Berwenang, 2014
Number and Length of Bridges by Level of GovernmentResponsibility, 2014 .............................................................. 369
8.1.2 Panjang Jalan Negara menurut Jenis Permukaan Jalan danKabupaten/Kota (Km), 2014Length of State Roads by Type of Surface andRegency/Municipality (Km), 2014 ......................................... 370
8.1.3 Panjang Jalan Negara menurut Kondisi Jalan dan Kabupaten/Kota(Km), 2014Length of State Roads by Road Condition andRegency/Municipality (Km), 2014 ......................................... 371
8.1.4 Panjang Jalan Negara menurut Kelas Jalan dan Kabupaten/Kota(Km), 2014Length of State Roads by Class of Road and Regency/Municipality
(Km), 2014 ............................................................................. 372
8.1.5 Panjang Jalan Provinsi menurut Jenis Permukaan Jalan danKabupaten/Kota (Km), 2014Length of Provincial Roads by Type of Surface andRegency/Municipality (Km), 2014 ......................................... 373
8.1.6 Panjang Jalan Provinsi menurut Kondisi Jalan danKabupaten/Kota (Km), 2014
. s .
. of G...............
Permu
Type14 .............
nurut Ko
: te Ro
pality (
g Jalan

8/20/2019 Kalimantan Timur Dalam Angka Tahun 2015
http://slidepdf.com/reader/full/kalimantan-timur-dalam-angka-tahun-2015 45/623
xliiiK A L I M A N T A N T I M U R D A L A M A N G K A 2015
Length of Provincial Roads by Road Condition andRegency/Municipality (Km), 2014 ......................................... 374
8.1.7 Panjang Jalan Provinsi menurut Kelas Jalan dan Kabupaten/Kota(Km), 2014Length of Provincial Roads by Class of Road andRegency/Municipality (Km), 2014 ......................................... 375
8.1.8 Panjang Jalan Kabupaten/Kota menurut Jenis PermukaanJalan (Km), 2014Length of Regency/Municipality Roads by Type of Surface (Km),2014 ...................................................................................... 376
8.1.9 Panjang Jalan Kabupaten/Kota menurut Kondisi Jalan (Km), 2014Length of Regency/Municipality Roads by Road Condition (Km),2014 ...................................................................................... 377
8.1.10 Panjang Jalan Kabupaten/Kota menurut Kelas Jalan (Km), 2014Length of Regency Roads by Class of Road (Km), 2014 ......... 378
8.2.1 Banyaknya Kendaraan Bermotor menurut Kabupaten/Kota(Unit), 2010-2014Number of Registered Motor Vehicles by Regency/Municipality(Units), 2010 – 2014 .............................................................. 380
8.2.2 Banyaknya Kendaraan Bermotor menurut Jenis Kendaraan(Unit), 2014Number of Motor Vehicles by Type (units), 2014 .................. 381
8.2.3 Banyaknya Kecelakaan Lalu Lintas menurut Kabupaten/Kota,2014Number of Traffic Accidents by Regency/Municipality, 2014 383
8.2.4 Banyaknya Kendaraan Bermotor Wajib Uji menurut JenisKendaraan (Unit), 2009-2014Number of Tested Motor Vehicles by Type (Units), 2009 – 2014 ...................................................................................... 384
:
. s .
....
ondisi Js y Ro
................. .
ta meny Class
aan Be4
egistere
aknyanit), 20
be
8/20/2019 Kalimantan Timur Dalam Angka Tahun 2015
http://slidepdf.com/reader/full/kalimantan-timur-dalam-angka-tahun-2015 46/623
8/20/2019 Kalimantan Timur Dalam Angka Tahun 2015
http://slidepdf.com/reader/full/kalimantan-timur-dalam-angka-tahun-2015 47/623
xlvK A L I M A N T A N T I M U R D A L A M A N G K A 2015
8.5.2 Banyaknya Paket Pos menurut Tujuan dan Kabupaten/Kota, 2014Number of Parcels by Direction and Regency/Municipality,2014 ...................................................................................... 413
8.5.3 Banyaknya Wesel Pos menurut Tujuan dan Kabupaten/Kota,2014Number of Money Orders by Destination andRegency/Municipality, 2014 ................................................. 414
8.5.4 Banyak Telepon Umum menurut Jenisnya Dirinci PerKabupaten/Kota, 2014
Number of Public Phones by Type and Regency/ Municipality,2014 ...................................................................................... 416
8.5.5 Jumlah Sarana Telekomunikasi di Wilayah Kaltim, 20012Number of Telecommunication Facilities in Kalimantan TimurRegion, 2014 ......................................................................... 417
8.5.6 Indikator Telekomunikasi, 2009-2014Telecomunication Indicators, 2009-2014 .............................. 418
8.6.1 Banyaknya Akomodasi, Kamar dan Tempat Tidur yangTersedia menurut Kabupaten/Kota, 2014Number of Accomodations, Rooms and Available Beds Availableby Regency/Municipality, 2014 ............................................. 419
8.6.2 Tingkat Hunian Kamar, Rata-Rata Menginap dan Jumlah Tamupada Hotel Berbintang, 2013 – 2014
Room Accupancy Rate, Average and Number of Guest Staying inStar Hotels, 2011-2012 ......................................................... 420
8.6.3 Tingkat Hunian Kamar, Rata-Rata Menginap dan Jumlah Tamupada Bukan Hotel Berbintang, 2012-2014Room Occupancy Rate, Average and Number of Guests Staying inNon-Star Hotels, 2012 – 2014 ............................................... 421
8.7.1 Banyaknya Wisatawan Mancanegara dan Wisatawan Nusantarayang Datang di Kalimantan Timur, 2007-2014
. genc ......... ......
i ayaFaciliti
.......... .......
asi, 2009 ,dicators
omo asenurut
r of Accoegency/
a
8/20/2019 Kalimantan Timur Dalam Angka Tahun 2015
http://slidepdf.com/reader/full/kalimantan-timur-dalam-angka-tahun-2015 48/623
xlvi K A L I M A N T A N T I M U R D A L A M A N G K A 2015
Number of Foreign and Domestic Tourists Arrives in KalimantanTimur, 2007 – 2014 ................................................................ 424
8.7.2 Destinasi/Obyek Wisata Kalimantan Timur BerdasarkanJenis/Kategori Tahun 2014Destinations/Attractions Kalimantan Timur Based on theType/Category ....................................................................... 425
8.7.3 Pekembangan Kepariwisataan Kalimantan Timur, 2010-2014Development of Tourism in East Kalimantan, 2010-2014 ..... 426
8.7.4 Perkembangan Seni, Budaya dan Olahraga 2008 s.d 2014 Provinsi
Kalimantan TimurDevelopment of art, Culture and Sports in Kalimantan Timur Year2010-2014 ............................................................................. 427
8.7.5 Perkembangan Seni, Budaya dan Olahraga menurutKabupaten/Kota Tahun 2014Development of Art, Culture and Sports by Regency/MunicipalityYear 2014 .............................................................................. 428
8.7.6 Jumlah Penginapan/Hotel dan Kamar menurut Jenis Hotel diProvinsi Kalimantan Timur, 2011-2014Number of Lodging/Hotels and Rooms by Type Hotels inKalimantan Timur Province, 2011-2014 ................................ 429
8.7.7 Banyaknya Pengunjung pada Museum Negeri Mulawarmanmenurut Golongan Pengunjung, Tahun 2014Number of Visitors to Mulawarman Museum by Visitors Group,
Year 2014 .............................................................................. 430
IX. Keuangan dan Harga-Harga – Finance and Prices
9.1.1 Jumlah Proyek dan Dana Pembangunan yang Bersumber dariAPBN dan Bantuan Luar Negeri menurut Lembaga (000 Rp),2012-2014Number of Projects and Development Fund from State Budget byInstitution (000 Rps), 2012 – 2014 ........................................ 440
.
antan.... ............ . .
dan O
d Sports................. .
otel dan Timur,
dging/Himur Pr
nya PeGo
8/20/2019 Kalimantan Timur Dalam Angka Tahun 2015
http://slidepdf.com/reader/full/kalimantan-timur-dalam-angka-tahun-2015 49/623
xlviiK A L I M A N T A N T I M U R D A L A M A N G K A 2015
9.12 Rekapitulasi Daftar Isian Pelaksanaan Anggaran (DIPA) APBN danPHLN menurut Lembaga (000 Rp), 2014Recapitulation of DIPA and Development Fund from State Budgetby Institution (000 Rps), 2014 ............................................... 442
9.1.3 Jumlah Dana Pembangunan yang Bersumber dari APBD Provinsimenurut Lembaga/Dinas (000 Rp), 2012Development Budgetis coming from Province DevelopmentBudget by Institution (000 Rps), 2012 .................................. 444
9.1.4 Realisasi Pendapatan Asli Daerah Provinsi Kalimantan Timur (000
Rp), 2012-2014 Actual Local Original Revenues of Kalimantan Timur (000 Rps),2012 – 2014 .......................................................................... 446
9.1.5 Target dan Realisasi Penerimaan Asli Daerah Provinsi menurutJenis Penerimaan (000 Rp), 2014Target and Actual Provincial Original Revenues by Kind ofRevenues (000 Rps), 2014 ..................................................... 447
9.1.6 Target dan Realisasi Penerimaan Pajak Daerah Provinsi menurutJenisnya (000 Rp), 2014Target and Actual of Provincial Regional Tax Revenues by Kind(000 Rps), 2014 ..................................................................... 448
9.1.7 Target dan Realisasi Penerimaan Retribusi Daerah Provinsimenurut Jenisnya (000 Rp), 2014Target and Actual Provincial Regional Retribution Revenues by
Kind of Retribution (000 Rps), 2014 ...................................... 449
9.1.8 Target dan Realisasi Laba Perusahaan Daerah dan Lain-LainMenurut Jenis Penerimaan (000 Rp), 2014Target And Actual Revenues from Departments, Net Profit ofLocal Government Enterprises and Others by Kind of Revenues(000 Rps), 2014 ..................................................................... 450
9.1.9 Target dan Realisasi Penerimaan Dana Perimbangan dan Instansiyang Lebih Tinggi Menurut Jenis Penerimaannya(000 Rp), 2014
: i
.
antan Ti................ . .
n Asli D014
ncial O14 .........
asi PenRp) , 0
Actuas), , 014
rgetur
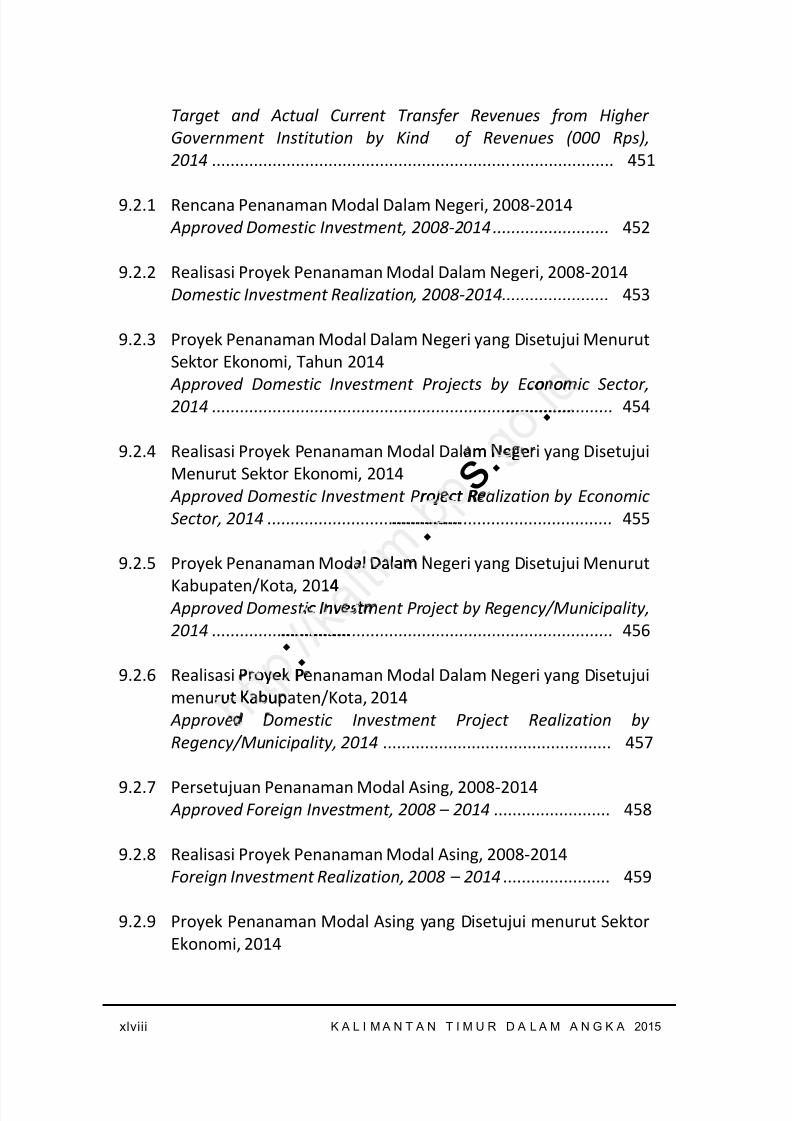
8/20/2019 Kalimantan Timur Dalam Angka Tahun 2015
http://slidepdf.com/reader/full/kalimantan-timur-dalam-angka-tahun-2015 50/623
xlviii K A L I M A N T A N T I M U R D A L A M A N G K A 2015
Target and Actual Current Transfer Revenues from HigherGovernment Institution by Kind of Revenues (000 Rps),2014 ...................................................................................... 451
9.2.1 Rencana Penanaman Modal Dalam Negeri, 2008-2014 Approved Domestic Investment, 2008-2014 ......................... 452
9.2.2 Realisasi Proyek Penanaman Modal Dalam Negeri, 2008-2014Domestic Investment Realization, 2008-2014 ....................... 453
9.2.3 Proyek Penanaman Modal Dalam Negeri yang Disetujui MenurutSektor Ekonomi, Tahun 2014
Approved Domestic Investment Projects by Economic Sector,2014 ...................................................................................... 454
9.2.4 Realisasi Proyek Penanaman Modal Dalam Negeri yang DisetujuiMenurut Sektor Ekonomi, 2014 Approved Domestic Investment Project Realization by EconomicSector, 2014 .......................................................................... 455
9.2.5 Proyek Penanaman Modal Dalam Negeri yang Disetujui MenurutKabupaten/Kota, 2014 Approved Domestic Investment Project by Regency/Municipality,2014 ...................................................................................... 456
9.2.6 Realisasi Proyek Penanaman Modal Dalam Negeri yang Disetujuimenurut Kabupaten/Kota, 2014 Approved Domestic Investment Project Realization byRegency/Municipality, 2014 ................................................. 457
9.2.7 Persetujuan Penanaman Modal Asing, 2008-2014 Approved Foreign Investment, 2008 – 2014 ......................... 458
9.2.8 Realisasi Proyek Penanaman Modal Asing, 2008-2014Foreign Investment Realization, 2008 – 2014 ....................... 459
9.2.9 Proyek Penanaman Modal Asing yang Disetujui menurut SektorEkonomi, 2014
. s .
. ono..............
m Nege
roject R................. .
al Dala4
: c Invest
................ . .
royek Put Kabu

8/20/2019 Kalimantan Timur Dalam Angka Tahun 2015
http://slidepdf.com/reader/full/kalimantan-timur-dalam-angka-tahun-2015 51/623
xlixK A L I M A N T A N T I M U R D A L A M A N G K A 2015
Approved Foreign Investment Project by Economic Sector,2014 ...................................................................................... 460
9.2.10 Realisasi Proyek Penanaman Modal Asing yang Disetujuimenurut Sektor Ekonomi, 2014 Approved Foreign Investment Project Realization by EconomicSector, 2014 .......................................................................... 461
9.2.11 Proyek Penanaman Modal Asing yang Disetujui menurutKabupaten/Kota, 2014 Approved Foreign Investment Project by Regency/ Municipality,2014 ...................................................................................... 462
9.2.12 Realisasi Proyek Penanaman Modal Asing yang Disetujuimenurut Kabupaten/Kota, 2014
Approved Foreign Investment Project Realization byRegency/Municipality, 2014 ................................................. 463
9.2.13 Jumlah Investor PMDN/PMA Tahun 2008-2014 ProvinsiKalimantan TimurNumber of PMDN/PMA Investor Year 2008-2014 KalimantanTimur Province ...................................................................... 464
9.2.14 Jumlah Investasi PMDN/PMA Tahun 2008-2014 ProvinsiKalimantan TimurNumber of PMDN/PMA Investment Year 2008-2014 KalimantanTimur Province ...................................................................... 465
9.3.1 Banyaknya Kantor Bank Umum menurut Status Provinsi
Kalimantan Timur, 2014Number of Bank Offices by Offices Status, Kalimantan TimurProvince, 2014 ....................................................................... 466
9.3.2 Banyaknya Kantor Bank menurut Kabupaten/Kota, 2010-2014Number of Bank Offices by Regency/Municipality, 2010 – 2014 ...................................................................................... 467
9.3.3 Jumlah Bank Umum dan BPR Provinsi Kalimantan Timur
....
Asing
Proje............... .
/PMA
PMA In................. .
vestasitan Tim
ber of Pmur Pro
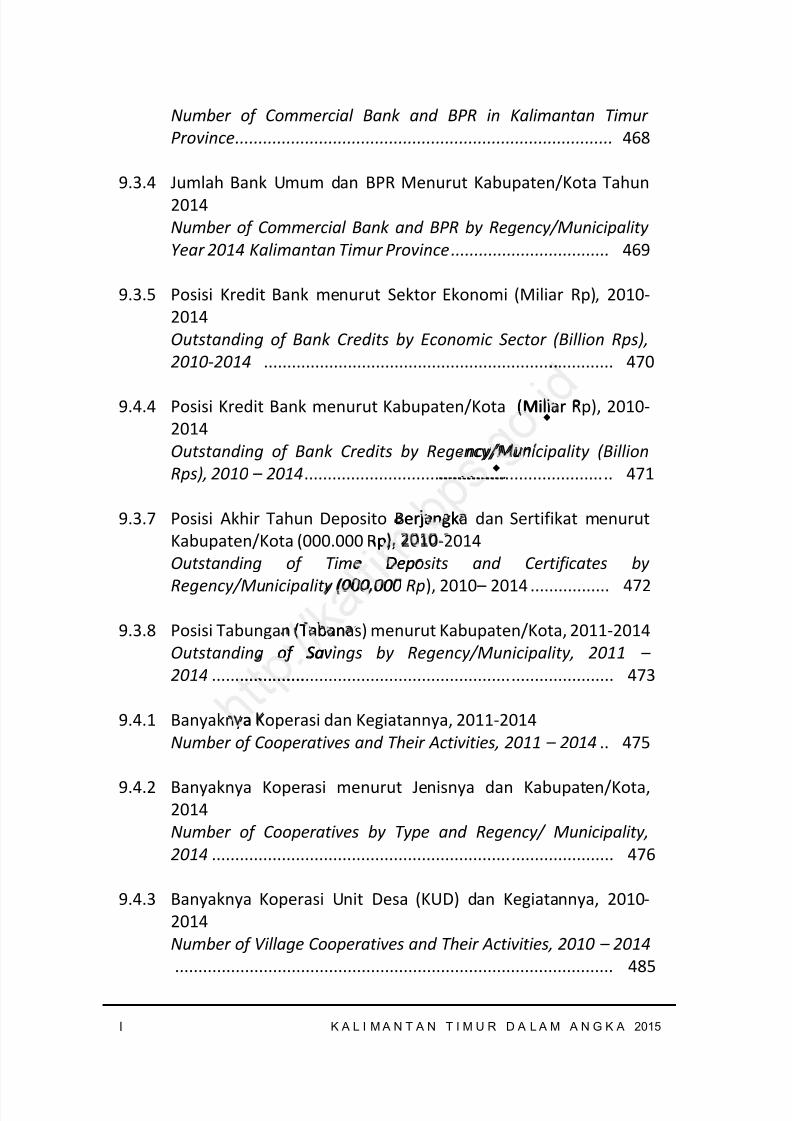
8/20/2019 Kalimantan Timur Dalam Angka Tahun 2015
http://slidepdf.com/reader/full/kalimantan-timur-dalam-angka-tahun-2015 52/623
l K A L I M A N T A N T I M U R D A L A M A N G K A 2015
Number of Commercial Bank and BPR in Kalimantan TimurProvince ................................................................................. 468
9.3.4 Jumlah Bank Umum dan BPR Menurut Kabupaten/Kota Tahun2014Number of Commercial Bank and BPR by Regency/MunicipalityYear 2014 Kalimantan Timur Province .................................. 469
9.3.5 Posisi Kredit Bank menurut Sektor Ekonomi (Miliar Rp), 2010-2014Outstanding of Bank Credits by Economic Sector (Billion Rps),2010-2014 ........................................................................... 470
9.4.4 Posisi Kredit Bank menurut Kabupaten/Kota (Miliar Rp), 2010-2014Outstanding of Bank Credits by Regency/Municipality (BillionRps), 2010 – 2014 .................................................................. 471
9.3.7 Posisi Akhir Tahun Deposito Berjangka dan Sertifikat menurutKabupaten/Kota (000.000 Rp), 2010-2014Outstanding of Time Deposits and Certificates byRegency/Municipality (000,000 Rp ), 2010 – 2014 ................. 472
9.3.8 Posisi Tabungan (Tabanas) menurut Kabupaten/Kota, 2011-2014Outstanding of Savings by Regency/Municipality, 2011 – 2014 ...................................................................................... 473
9.4.1 Banyaknya Koperasi dan Kegiatannya, 2011-2014Number of Cooperatives and Their Activities, 2011 – 2014 .. 475
9.4.2 Banyaknya Koperasi menurut Jenisnya dan Kabupaten/Kota,2014Number of Cooperatives by Type and Regency/ Municipality,2014 ...................................................................................... 476
9.4.3 Banyaknya Koperasi Unit Desa (KUD) dan Kegiatannya, 2010-2014Number of Village Cooperatives and Their Activities, 2010 – 2014 .............................................................................................. 485
. .
....
( Miliar
ncy/Mu............... .
erjangkp ,
e Dep(000 00
(Tabanof Sa
................. ....
a
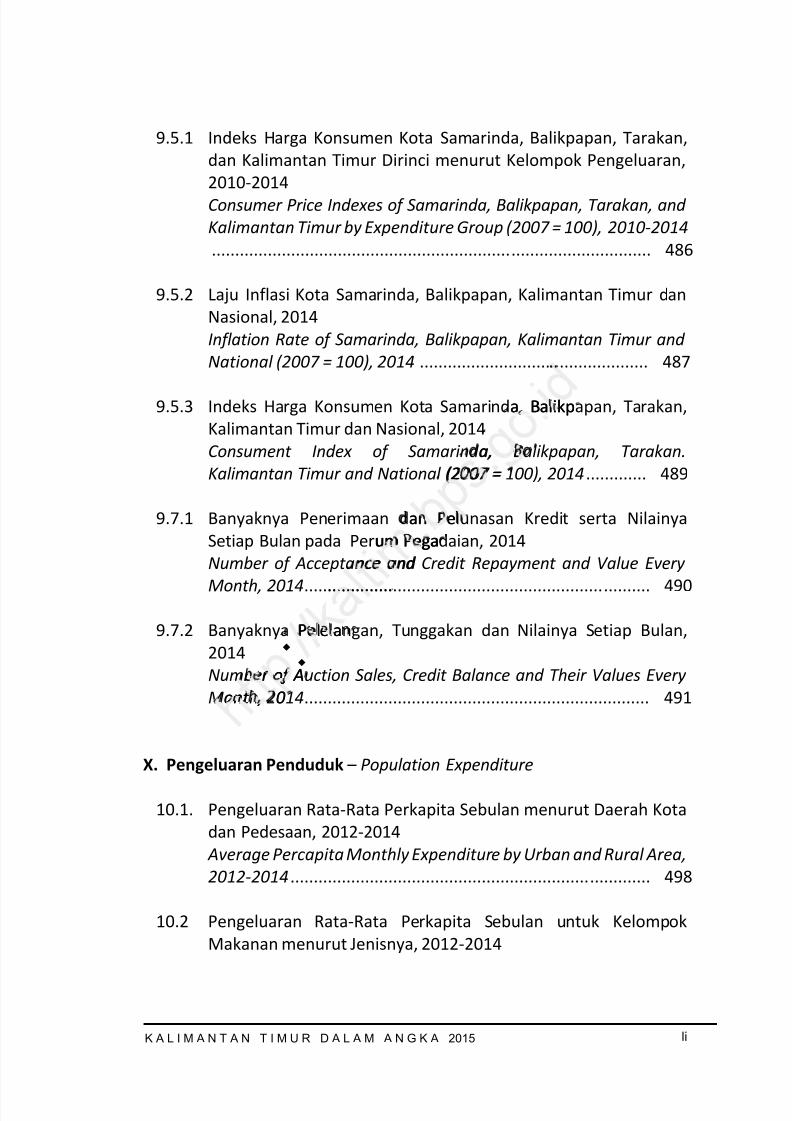
8/20/2019 Kalimantan Timur Dalam Angka Tahun 2015
http://slidepdf.com/reader/full/kalimantan-timur-dalam-angka-tahun-2015 53/623
liK A L I M A N T A N T I M U R D A L A M A N G K A 2015
9.5.1 Indeks Harga Konsumen Kota Samarinda, Balikpapan, Tarakan,dan Kalimantan Timur Dirinci menurut Kelompok Pengeluaran,2010-2014Consumer Price Indexes of Samarinda, Balikpapan, Tarakan, andKalimantan Timur by Expenditure Group (2007 = 100), 2010-2014 .............................................................................................. 486
9.5.2 Laju Inflasi Kota Samarinda, Balikpapan, Kalimantan Timur danNasional, 2014Inflation Rate of Samarinda, Balikpapan, Kalimantan Timur andNational (2007 = 100), 2014 ................................................. 487
9.5.3 Indeks Harga Konsumen Kota Samarinda, Balikpapan, Tarakan,Kalimantan Timur dan Nasional, 2014Consument Index of Samarinda, Balikpapan, Tarakan.Kalimantan Timur and National (2007 = 100), 2014 ............. 489
9.7.1 Banyaknya Penerimaan dan Pelunasan Kredit serta NilainyaSetiap Bulan pada Perum Pegadaian, 2014Number of Acceptance and Credit Repayment and Value EveryMonth, 2014 .......................................................................... 490
9.7.2 Banyaknya Pelelangan, Tunggakan dan Nilainya Setiap Bulan,2014Number of Auction Sales, Credit Balance and Their Values EveryMonth, 2014 .......................................................................... 491
X. Pengeluaran Penduduk – Population Expenditure
10.1. Pengeluaran Rata-Rata Perkapita Sebulan menurut Daerah Kotadan Pedesaan, 2012-2014 Average Percapita Monthly Expenditure by Urban and Rural Area,2012-2014 ............................................................................. 498
10.2 Pengeluaran Rata-Rata Perkapita Sebulan untuk KelompokMakanan menurut Jenisnya, 2012-2014
....
a, Balikp
a, B(2007 =
an Peum Pega
:
nce and................ ..
Pe e a
ber of Aont , 0

8/20/2019 Kalimantan Timur Dalam Angka Tahun 2015
http://slidepdf.com/reader/full/kalimantan-timur-dalam-angka-tahun-2015 54/623
li i K A L I M A N T A N T I M U R D A L A M A N G K A 2015
Average Percapita Montly Expenditure of Food by Food Group,2012-2014 ............................................................................. 499
10.3 Pengeluaran Rata-Rata Perkapita Sebulan untuk KelompokBukan Makanan,menurut Jenisnya, 2012-2014
Average Percapita Monthly Expenditure of Non-Food by Kinds,2012-2014 ............................................................................. 500
10.4 Pengeluaran Rata-Rata Sebulan untuk Golongan Makanan danBukan Makanan menurut Golongan Pengeluaran PerkapitaSebulan (Rp), 2014
Average Percapita Monthly Expenditure of Food and Non-Food by
Expenditure Class (Rps), 2014 ............................................... 501
10.5 Pengeluaran Rata-Rata Perkapita Sebulan ,menurutKabupaten/Kota (Rp), 2012-2014
Average Percapita Monthly Expenditure by Regency/Municipality(Rps), 2012-2014 ................................................................... 502
XI. Pendapatan Regional – Regional Income
11.1.1 Produk Domestik Regional Bruto Atas Dasar Harga Berlakumenurut Lapangan Usaha (000.000 Rp), 2010-2014Gross Regional Domestic Product at Current Prices by IndustrialOrigin (000,000 Rps), 2010-2014 .......................................... 509
11.1.2 Produk Domestik Regional Bruto Atas Dasar Harga Konstan 2000menurut Lapangan Usaha (000.000 Rp), 2010-2014Gross Regional Domestic Product at Constant 2000 Prices byIndustrial Origin (000,000 Rps), 2010-2014 .......................... 511
11.1.3 Laju Pertumbuhan Produk Domestik Regional Bruto Atas DasarHarga Konstan 2000 menurut Lapangan Usaha (%), 2011-2014Growth Rate of Gross Regional Domestic Product at Constant2000 Prices by Industrial Origin (%), 2011-2014 ................... 513
l t i m .
. i
............. ..
Se u an
re by Re................ .
Regiona
estik Rapanga
eg iona00,
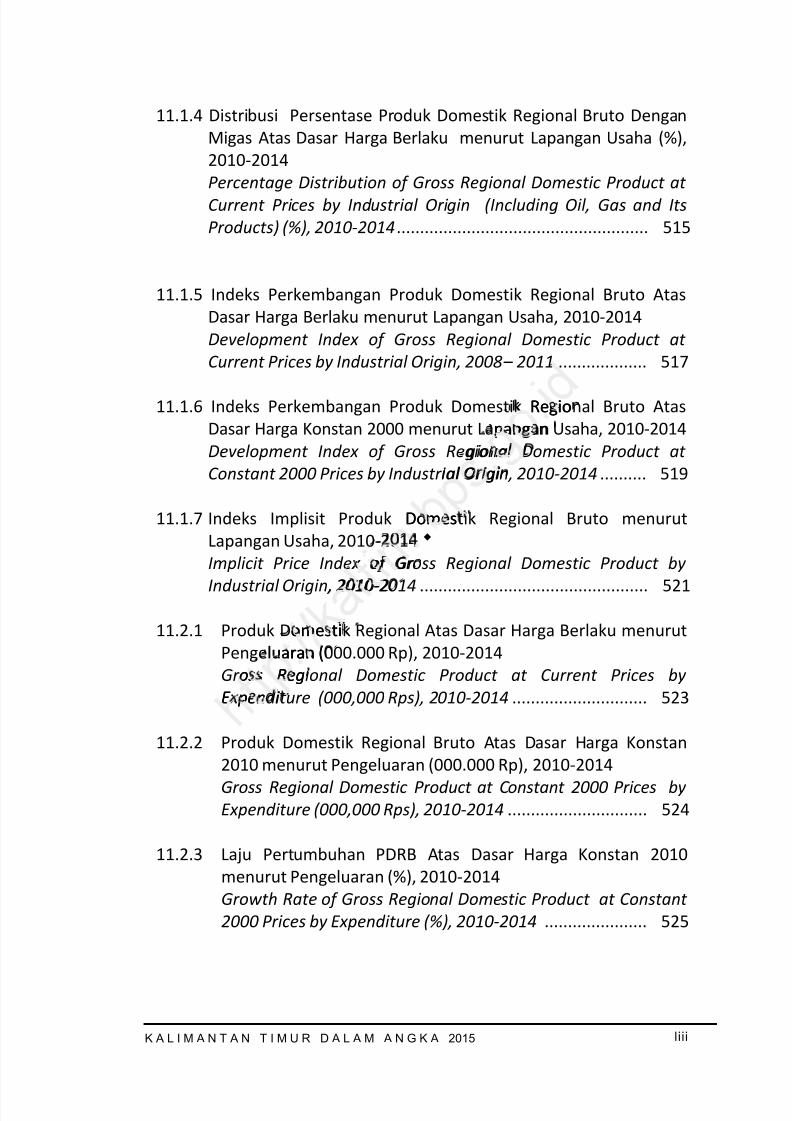
8/20/2019 Kalimantan Timur Dalam Angka Tahun 2015
http://slidepdf.com/reader/full/kalimantan-timur-dalam-angka-tahun-2015 55/623
liiiK A L I M A N T A N T I M U R D A L A M A N G K A 2015
11.1.4 Distribusi Persentase Produk Domestik Regional Bruto DenganMigas Atas Dasar Harga Berlaku menurut Lapangan Usaha (%),2010-2014Percentage Distribution of Gross Regional Domestic Product atCurrent Prices by Industrial Origin (Including Oil, Gas and ItsProducts) (%), 2010-2014 ...................................................... 515
11.1.5 Indeks Perkembangan Produk Domestik Regional Bruto AtasDasar Harga Berlaku menurut Lapangan Usaha, 2010-2014Development Index of Gross Regional Domestic Product atCurrent Prices by Industrial Origin, 2008 – 2011 ................... 517
11.1.6 Indeks Perkembangan Produk Domestik Regional Bruto AtasDasar Harga Konstan 2000 menurut Lapangan Usaha, 2010-2014Development Index of Gross Regional Domestic Product atConstant 2000 Prices by Industrial Origin, 2010-2014 .......... 519
11.1.7 Indeks Implisit Produk Domestik Regional Bruto menurutLapangan Usaha, 2010-2014Implicit Price Index of Gross Regional Domestic Product byIndustrial Origin, 2010-2014 ................................................. 521
11.2.1 Produk Domestik Regional Atas Dasar Harga Berlaku menurutPengeluaran (000.000 Rp), 2010-2014Gross Regional Domestic Product at Current Prices byExpenditure (000,000 Rps), 2010-2014 ............................. 523
11.2.2 Produk Domestik Regional Bruto Atas Dasar Harga Konstan
2010 menurut Pengeluaran (000.000 Rp), 2010-2014Gross Regional Domestic Product at Constant 2000 Prices byExpenditure (000,000 Rps), 2010-2014 .............................. 524
11.2.3 Laju Pertumbuhan PDRB Atas Dasar Harga Konstan 2010menurut Pengeluaran (%), 2010-2014Growth Rate of Gross Regional Domestic Product at Constant2000 Prices by Expenditure (%), 2010-2014 ...................... 525
.
Regiopangan
gionaal Origi
Domes-
x of Gr , 2010-2 -
omestiluaran (
oss RegExpen i
8/20/2019 Kalimantan Timur Dalam Angka Tahun 2015
http://slidepdf.com/reader/full/kalimantan-timur-dalam-angka-tahun-2015 56/623
liv K A L I M A N T A N T I M U R D A L A M A N G K A 2015
11.2.4 Distribusi Persentase PDRB Atas Dasar Harga Berlaku menurutPengeluaran (%), 2010-2014Percentage Distribution of Gross Regional Domestic Product atCurrent Prices by Expenditure (%), 2010-2014 ...................... 526
11.2.5 Indeks Implisit PDRB menurut Pengeluaran (Harga BerlakuTerhadap Harga Konstan 2010), 2010-2014Implicit Price Index of Gross Regional Domestic Product byExpenditure (Current Prices by Constant Price), 2010-2014 . 527
11.3.1 Produk Domestik Regional Bruto Tanpa Migas Atas Dasar HargaBerlaku menurut Kabupaten/Kota (000.000 Rp), 2010-2014
Gross Regional Domestic Product Non Oil at Current Prices byRegency/Municipality (000,000 Rps), 2010-2014 ................. 528
11.3.2 Produk Domestik Regional Bruto Atas Dasar Harga Konstan 2010menurut Kabupaten/Kota (000.000 Rp), 2010-2014Gross Regional Domestic Product at Constant 2000 Prices byRegency/Municipality (000,000 Rps), 2010-2014 ................. 529
11.3.3 Laju Pertumbuhan Produk Domestik Regional Bruto Atas DasarHarga Konstan 2010 menurut Kabupaten/Kota (%), 2010-2014Growth Rate of Gross Regional Domestic Product atConstant2000 Prices by Regency/Municipality (%), 2010-2014 ...................................................................................... 530
11.3.4 Distribusi Persentase Produk Domestik Regional Bruto DenganMigas atas Dasar Harga Berlaku menurut Kabupaten/Kota (%),2011-2014
Percentage Distribution of Gross Regional Domestic Product atCurrent Prices by Regency/Municipality (Including Oil, Gas and ItProducts) (%), 2011-2014 ...................................................... 531
11.3.5 Distribusi Persentase Produk Domestik Regional Bruto NonMigas Atas Dasar Harga Berlaku menurut Kabupaten/Kota (%),2011-2014Percentage Distribution of Gross Regional Domestic Product atCurrent Prices by Regency/Municipality (Without Oil, Gas and ItsProducts) (%), 2011-2014 ...................................................... 53
.
.rren4 .........
asar Harp) , 2010
t at CoRps), 2
k Domenurut
Gross
:Prices................. .
usi Persas
8/20/2019 Kalimantan Timur Dalam Angka Tahun 2015
http://slidepdf.com/reader/full/kalimantan-timur-dalam-angka-tahun-2015 57/623
lvK A L I M A N T A N T I M U R D A L A M A N G K A 2015
11.3.6 Produk Domestik Regional Bruto (PDRB) Perkapita Atas DasarHarga Berlaku menurut Kabupaten/Kota (Rp), 2010-2014Gross Regional Domestic Product Percapita at Current Prices byRegency/Municipality (Rps), 2010-2014 ............................... 533
11.3.7 Produk Domestik Regional Bruto (PDRB) Perkapita Atas DasarHarga Konstan 2010 menurut Kabupaten/Kota (Rp), 2010-2014Gross Regional Domestic Product Percapita at Constant 2000Prices byRegency/Municipality (Rps), 2010-2014 ................. 534
XII. Kemiskinan – Poverty
12.1.1 Perkiraan Persentase Pembagian Total Pendapatan Perkapitadan Gini Rasio, 2012-2014Estimated Percentage of Income Distribution and Gini Ratio , 2012– 2014 ................................................................................... 540
12.1.2 Perkiraan Persentase Pembagian Total Pendapatan Perkapitadan Gini Ratio menurut Kabupaten/Kota, 2012-2014Estimated Percentage of Income Distribution and Gini Ratio byRegency/Municipality, 2012-2014 ........................................ 541
12.2.1 Jumlah dan Persentase Penduduk Miskin Serta Garis Kemiskinanmenurut Kabupaten/Kota, 2014Number and Percentage of Poor Population, Households andPoverty Line by Regency/Municipality, 2014 ........................ 543
12.2.2 Garis Kemiskinan, Jumlah dan Persentase Penduduk Miskinmenurut Daerah Perkotaan/Pedesaan, 2005-2014Poverty Line, Growth and Percentage of Population belowPoverty Line by Urban/Rural, 2005 – 2014 ........................... 544
XII. Perbandingan Regional Kalimantan – Kalimantan Region Comparison13.1 Proyeksi Penduduk Regional Kalimantan (dalam ribuan jiwa)
Tahun 2012, 2013, 2014Population of Kalimantan Region 2012, 2013, 2014 ............ 540
. i d ta Pen
Distribu................ .
Pem arut Kab
ntage oficipality
dan Perurut Kab
umberert
8/20/2019 Kalimantan Timur Dalam Angka Tahun 2015
http://slidepdf.com/reader/full/kalimantan-timur-dalam-angka-tahun-2015 58/623
lvi K A L I M A N T A N T I M U R D A L A M A N G K A 2015
13.2 Laju Pertumbuhan Produk Domestik Regional Bruto RegionalKalimanatan Menurut Harga Konstan (Persen), 2010-2014Growth Rate of Regional Domestic Product of Kalimantan Regionat Constan 2000 Price (%), 2010-2014 .................................. 541
13.3 Indeks Harga Konsumen Regional Kalimantan, 2009-2014Consumer Price Index of Kalimantan Region, 2009-2014 .... 542
13.4 Jumlah dan Persentase Penduduk Miskin Regional Kalimantan,2012-2014Number and Percentage of Poor Population by Kalimantan
Region, 2012-2014 ................................................................ 543
13.5 Indeks Pembangunan Manusia (IPM) Menurut Provinsi diIndonesia, 2010-2014Human Development Indeks (HDI) by Province in Indonesia, 2010-2014 ...................................................................................... 544
. i
............. ..
enurut
h t t p : / / k a l t i m
. Province
................ . .
8/20/2019 Kalimantan Timur Dalam Angka Tahun 2015
http://slidepdf.com/reader/full/kalimantan-timur-dalam-angka-tahun-2015 59/623
lviiK A L I M A N T A N T I M U R D A L A M A N G K A 2015
DAFTAR GAMBAR - LIST OF FIGURES
Halaman/ PageGambar 1.1 Peta Provinsi Kalimantan Timur
Map of Kalimantan Timur .................................... 8
Gambar 1.2 Persentase Luas Daratan Menurut Kabupaten/KotaPercentage of Land Area by Regency/ Municipality 9
Gambar 1.3 Luas Wilayah Menurut Jenis Penggunaan Tanah danKabupaten/Kota (Ha), 2014Area by Land Use and Regency/Municipality (Ha), 2014
................................................................................ 9
Gambar 2.1 Banyaknya Pegawai Negeri Sipil (PNS), 2014Number of Local Civil Servants, 2014 ..................... 32
Gambar 2.2 Banyaknya Kecamatan dan Desa/Kelurahan MenurutKabupaten/Kota, 2014Number of Sub Districts, Villages and Area byRegency/Municipality, 2014 .................................. 32
Gambar 3.1 Jumlah Penduduk menurut Kabupaten/Kota, 2014Population by Sex and Regency/Municipality, 2014 78
Gambar 3.2 Indikator Ketenagakerjaan Provinsi Kalimantan TimurLabour Indicators of Kalimantan Timur, 2014 ........ 78
Gambar 4.1 Jumlah Dokter menurut Kabupaten/Kota, 2014
Number of Doctors by Regency/Municipality, 2014 125
Gambar 4.2 Presentase Akseptor Aktif Mneurut Pemakaian JenisAlat Kontrasepsi, 2014Presentase of Active by Contraceptive Method,2014 ........................................................................ 125
Gambar 4.3 Persentase Pemeluk Agama menurut Golongan Agama,2014Percentage of Population by Religion, 2014 ........... 126
s . . i
........... ...
pil (P NS ants, 20
tan dan, 2014
Su Diunicipal
ah Pend
h : pu atio
IndiL
8/20/2019 Kalimantan Timur Dalam Angka Tahun 2015
http://slidepdf.com/reader/full/kalimantan-timur-dalam-angka-tahun-2015 60/623

8/20/2019 Kalimantan Timur Dalam Angka Tahun 2015
http://slidepdf.com/reader/full/kalimantan-timur-dalam-angka-tahun-2015 61/623
lixK A L I M A N T A N T I M U R D A L A M A N G K A 2015
Number of Electricity Produced and Sold byRegency/Municipality, 2009-2014 .......................... 310
Gambar 6.4 Produksi dan Penyaluran Amoniak/Urea, 2014Production and Distribution of Ammonia/Urea,2014 ........................................................................ 310
Gambar 7.1 Nilai Ekspor Impor Migas dan Non Migas (000 US$),2008-2014Export and Import Value of Oil and Non-Oil Product (000US$), 2008 – 2014 ................................................... 342
Gambar 7.2 Persentase Penyaluran dan Penjualan Beras Oleh PerumBulog Divisi Regional menurut Golongan Konsumen(Ton), 2014Percentage Rice Sales and Distribution by PublicCorporate BULOG Regional Division, According toConsumer Groups (Tons), 2014 ............................... 342
Gambar 8.1 Banyaknya Kendaraan Bermotor menurutKabupaten/Kota (Unit), 2011-2014Number of Registered Motor Vehicles byRegency/Municipality (Units), 2011 – 2014 ............ 367
Gambar 8.2 Lalu Lintas Penerbangan, 2009-2014Flight Traffic, 2009-2014 ......................................... 367
Gambar 8.3 Banyaknya Wisatawan Mancanegara dan WisatawanNusantara yang Datang di Kalimantan Timur, 2007-2014
Number of Foreign and Domestic Tourists In KalimantanTimur, 2007 – 2014 ................................................. 368
Gambar 9.1 Posisi Kredit Bank menurut Sektor Ekonomi(Miliar Rp), 2014Outstanding Bank Credits by Economic Sector(Billion Rps), 2014 ................................................... 439
Gambar 9.2 Posisi Kredit Bank (Miliar Rp), 2009-2014
t t
an BeGolon
an Digional
ons), 0
Ken a/Kota (U
ofncy/Mu
Lalu LiFlig
8/20/2019 Kalimantan Timur Dalam Angka Tahun 2015
http://slidepdf.com/reader/full/kalimantan-timur-dalam-angka-tahun-2015 62/623
lx K A L I M A N T A N T I M U R D A L A M A N G K A 2015
Outstanding Bank Credits by Regency/ Municipality(Billion Rps), 2009 – 2014 ........................................ 439
Gambar 10.1 Pengeluaran Rata-Rata Perkapita Sebulan menurutKabupaten/Kota (Rp), 2014 Average Percapita Monthly Expenditure byRegency/Municipality, 2014 ................................... 497
Gambar 10.2 Pengeluaran Rata-Rata Perkapita Sebulan menurutKabupaten/Kota (Rp), 2014 Average Percapita Monthly Expenditure byRegency/Municipality, 2014 ................................... 497
Gambar 11.1 Distribusi Persentase Produk Domestik Regional BrutoAtas Dasar Harga Berlaku menurut Lapangan Usaha (%),2014Percentage Distribution of Gross Regional DomesticProduct at Current Prices by Industrial Origin (IncludingOil, Gas and Its Products) (%), 2014 ........................ 507
Gambar 11.2 Laju Pertumbuhan Produk Domestik Regional Bruto AtasDasar Harga Konstan 2000 menurut Lapangan Usaha(%), 2011-2014Growth Rate of Gross Regional Domestic Product atConstant 2000 Prices by Industrial Origin (%), 2011-2014 ................................................................................ 507
Gambar 11.3 PDRB Perkapita Atas Dasar Harga Berlaku menurutKabupaten/Kota (000.000Rp), 2014
Gross Regional Domestic Product Percapita at CurrentPrices by Regency/Municipality (000,000Rps),2014 ........................................................................ 508
Gambar 11.4 Distribusi Persentase Produk Domestik Regional BrutoNon Migas Atas Dasar Harga Berlaku menurutKabupaten/Kota (%), 2014Percentage Distribution of Gross Regional DomesticProduct at Current Prices by Regency/Municipality(Without Oil, Gas and Its Products) (%), 2014 ........ 508
t
.
....
tik RegiLapang
Grossby Indu
cts) (%),
an ProdKonsta
--2014 Rate
stant 20................ ....
8/20/2019 Kalimantan Timur Dalam Angka Tahun 2015
http://slidepdf.com/reader/full/kalimantan-timur-dalam-angka-tahun-2015 63/623
lx iK A L I M A N T A N T I M U R D A L A M A N G K A 2015
Gambar 12.1 Jumlah Penduduk Miskin menurut Kabupaten/ Kota(000), 2014Number of Poor People by Regency/Municipality (000),2014 ........................................................................ 539
Gambar 12.2 Garis Kemiskinan dan Jumlah Penduduk Miskin, 2005-2014Poverty Line and Number of Poor People, 2005 – 2014 ........................................................................ 539
h t t p : / / k a l t i m
. b p s . g o . i d
8/20/2019 Kalimantan Timur Dalam Angka Tahun 2015
http://slidepdf.com/reader/full/kalimantan-timur-dalam-angka-tahun-2015 64/623
lxii K A L I M A N T A N T I M U R D A L A M A N G K A 2015
PENJELASAN UMUM / EXPLANATORY NOTES
Tanda-tanda, satuan-satuan dan lain-lainnya yang digunakan dalampublikasi ini, adalah sebagai berikut/ Symbols, measurement units andother acronyms which are used in this publication are as follows :
1. TANDA-TANDA/ SYMBOLS
Data belum tersedia/ Data not yet available ................. : … Data tidak tersedia/ Data not available ......................... : -Data dapat diabaikan/ Data negligible ......................... : oTanda desimal/ Decimal point ...................................... : ,
Angka sementara/ Preliminary figures .......................... : *)Angka sangat sementara/ Very preliminary figures ...... : **)Angka diperbaiki/ Revised figures ................................. : r)Angka perkiraan/ Estimated figures .............................. : e)Rupiah/ Rupiahs ............................................................ : Rp.Dollar Amerika/ US Dollars ............................................ : $Meter/ meter ................................................................ : mMeter persegi/ meter per square .................................. : m 2 Kilometer/ kilometer ..................................................... : kmKilometer persegi/ kilometer per square ...................... : km2 Hektar/ hectare ............................................................. : ha
2. S A T U A N/ UNITS
Bal/Bales ...................................................................... : 1.250m 3 = 180 kgBarrel/ Barrel ................................................................. : 158,99 liter
: 1/6,2898 m3
Bata (untuk garam)/ Briquette (for salt) ....................... : 500 gramBatang (untuk sabun)/ Piece (a bar of soap) .................. : 400 gramBotol/ Bottle .................................................................. : 700 ccKilometer (km)/ kilometer (km) .................................... : 1.000 meter (m)Kwintal (kw)/ quintal (ql) .............................................. : 100 kgLiter (untuk beras)/ Litre (for rice) ................................ : 0,80 kgLong ton/ Long ton ........................................................ : 1.016,50 kgLusin/Dozen .................................................................. : 12Metercubic feet (mcf)/ Metercubic feet (mcf) ............. : 1/35,3 m3
. .
. d . : **)
..... : r). :............ :
................. . ................ .
................. ................... .
................ . .. er squar
t p :................ . ....
2. S
............... . . .........

8/20/2019 Kalimantan Timur Dalam Angka Tahun 2015
http://slidepdf.com/reader/full/kalimantan-timur-dalam-angka-tahun-2015 65/623
lxiiiK A L I M A N T A N T I M U R D A L A M A N G K A 2015
Metric ton (m:ton)/ Metric ton (m:ton) .......................... : 0,98421 longton
: 1.000 kgOnce (oz)/ Ounce (oz) ...................................................... : 28,31 gramPound (lb)/ Pound (lb) ...................................................... : 0,454 kgT o n/ Ton ......................................................................... : 1.000 kgSak (untuk semen)/ Sack (for cement) ............................. : 40 kg atau 50kgSatuan lain: buah, bungkus, butir ,helai/lembar, kaleng, batang, pulsa,
Ton, Kilometer (ton-km), jam, menit, persen (%)Other units: unit, pack, number, pieces, tin, pulsa, ton, kilometres, ton-
km, hour, minute and percent (%)
3. KLASIFIKASI INDUSTRI PENGOLAHAN/CLASIFICATION OFMANUFACTURING INDUSTRY
31. Industri makanan, minuman dan tembakau/ Manufacture of food,beverage and tobacco.
32. Industri teksil, pakaian jadi dan kulit/ Manufacture of textile, wearing
apparrel and leather.33. Industri kayu dan barang-barang dari kayu, termasuk perabotan
rumah tangga/ Manufacture of wood and wood products, including furniture.
34. Industri kertas dan barang-barang dari kertas, percetakan danpenerbitan/ Manufacture of paper and paper products, printing and publishing.
35. Industri kimia dan barang-barang dari kimia, minyak bumi, batu bara,karet dan plastik/ Manufacture of chemicals and chemical, oil, coal,rubber and plastic products.
36. Industri barang galian bukan logam, kecuali minyak bumi dan batubara/ Manufacture of non metalic mineral products, except productsof oil and coal.
37. Industri logam dasar/ Manufacture of basic metal .38. Industri barang dari logam, mesin dan peralatannya/ Manufacture of
fabricated metal products, machinery and equipment.39. Industri pengolahan lainnya/ Other manufacturing industries.
. .
. i d N/ CLASI
DUSTR
dan te
di dan k
. baran
anufa
ertasitan/ Ming.
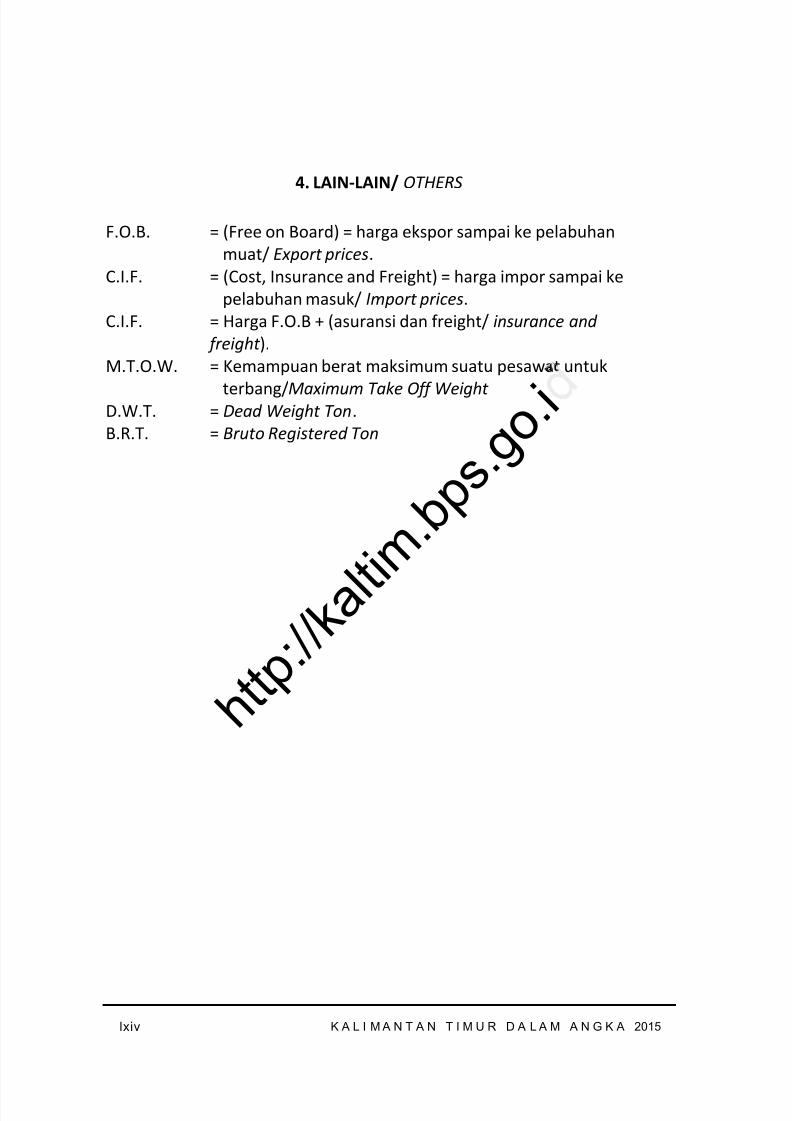
8/20/2019 Kalimantan Timur Dalam Angka Tahun 2015
http://slidepdf.com/reader/full/kalimantan-timur-dalam-angka-tahun-2015 66/623
lxiv K A L I M A N T A N T I M U R D A L A M A N G K A 2015
4. LAIN-LAIN/ OTHERS
F.O.B. = (Free on Board) = harga ekspor sampai ke pelabuhanmuat/ Export prices .
C.I.F. = (Cost, Insurance and Freight) = harga impor sampai kepelabuhan masuk/ Import prices .
C.I.F. = Harga F.O.B + (asuransi dan freight/ insurance and freight ).
M.T.O.W. = Kemampuan berat maksimum suatu pesawat untukterbang/ Maximum Take Off Weight
D.W.T. = Dead Weight Ton .B.R.T. =Bruto Registered Ton
h t t p : / / k a l t i m
. b p s . g o . i
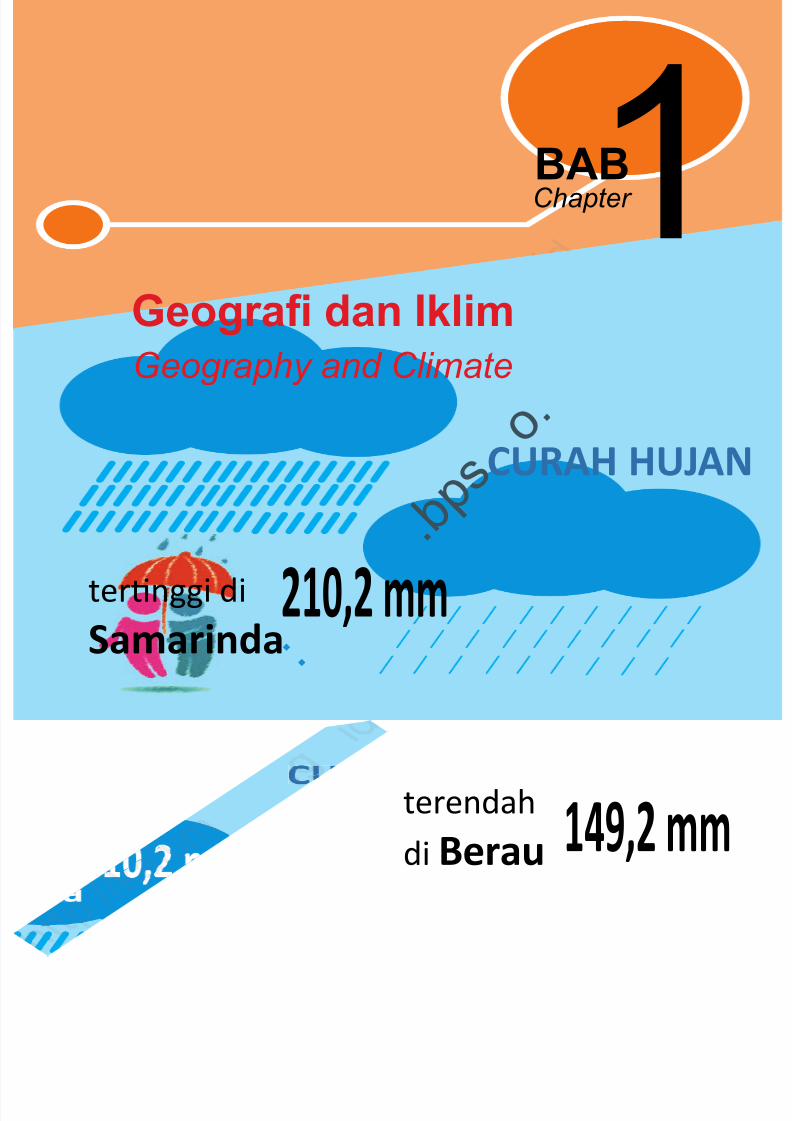
8/20/2019 Kalimantan Timur Dalam Angka Tahun 2015
http://slidepdf.com/reader/full/kalimantan-timur-dalam-angka-tahun-2015 67/623
1Geogra dan Iklim
BABChapter
Geography and Climate
CURAH HUJAN
ter nggi diSamarinda
210,2 mm
terendahdi Berau 149,2 mm
. b p s
o .
:

8/20/2019 Kalimantan Timur Dalam Angka Tahun 2015
http://slidepdf.com/reader/full/kalimantan-timur-dalam-angka-tahun-2015 68/623
h t t p : / / k a l t i m
. b p s . g o . i d
8/20/2019 Kalimantan Timur Dalam Angka Tahun 2015
http://slidepdf.com/reader/full/kalimantan-timur-dalam-angka-tahun-2015 69/623
K a l i m a n t a n T i m u r D a l a m A n g k a 2 0 1 5
3
Geografi dan Iklim /
Geography and Climate
1.1. G E O G R A F I
Daerah Kalimantan Timur yangterdiri dari luas wilayah daratan127.267,52 km 2 dan luas pengelolaanlaut 25.656 km 2, terletak antara113 o44' dan 119 o00' Bujur Timur, danantara 2 o33 'Lintang Utara dan 2 o25'Lintang Selatan. Dengan adanyaperkembangan dan pemekaranwilayah, Kalimantan Timur yangmerupakan provinsi terluas ketigasetelah Papua dan KalimantanTengah, dibagi menjadi 7 (tujuh)kabupaten, 3 (tiga) Kota, 103kecamatan dan 1.032desa/kelurahan.
Tujuh kabupaten tersebut adalah
Paser dengan ibukota Tanah Grogot,Kutai Barat dengan ibukotaSendawar, Kutai Kartanegara denganibukota Tenggarong, Kutai Timurdengan ibukota Sangatta, Beraudengan ibukota Tanjung Redeb,Penajam Paser Utara dengan ibukotaPenajam, dan Mahakam Ulu denganibukota Long Bagun (pemekaran dariKabupaten Kutai Barat). Sedangkantiga Kota adalah Balikpapan,Samarinda, dan Bontang.
1.1. GEOGRAPHY
The areas of Kalimantan Timurwhich comprise 127.267,52 km 2 ofland areas and 25.656 km 2 nauticalareas, is located between 113 o44’and 119 o00’ East Longitude andbetween 2 o33 ’ North Latitude and2o25’ South Latitude. With thedevelopment and expansion of thearea, Kalimantan Timur which is thearea third largest after Papua andKalimantan Tengah province isdivided into 7 (Seven) regencies, 3(three) Municipalities, 103 districtsand 1.032 villages.
Seven regencies were Paser the
capital of the Tanah Grogot ; KutaiBarat with capital of Sendawar, KutaiKartanegara with capital ofTenggarong, Kutai Timur with capitalof Sangatta, Berau with capital ofTanjung Redeb, Penajam Paser Utarawith capital of Penajam andMahakam Ulu with capital of LongBagun (expansion from regency of
Kutai Barat). While the Threemunicipalities are Balikpapan,Samarinda, and Bontang.
rgest
. b alah
rogot,ibukogara er
, KutaiSangat
a Ta nr Utar
Tenginto 7
e) Muni i d 1.0 32
8/20/2019 Kalimantan Timur Dalam Angka Tahun 2015
http://slidepdf.com/reader/full/kalimantan-timur-dalam-angka-tahun-2015 70/623
K a l i m a n t a n T i m u r D a l a m A n g k a 2 0 1 5
4
Geografi dan Iklim /
Geography and Climate
Kalimantan Timur merupakansalah satu pintu gerbang utama diwilayah Indonesia bagian Timur.Daerah yang juga dikenal sebagaigudang kayu dan hasil pertambanganini mempunyai ratusan sungai yangtersebar pada hampir semuakabupaten/kota dan merupakansarana angkutan utama di sampingangkutan darat, dengan sungai yangterpanjang Sungai Mahakam.
Provinsi Kalimantan Timurterletak di paling timur PulauKalimantan. Tepatnya provinsi iniberbatasan langsung denganKalimantan Utara di sebelah Utara,Laut Sulawesi dan Selat Makasar disebelah Timur, Kalimantan Selatan disebelah Selatan, dan KalimantanBarat, Kalimantan Tengah sertaMalaysia di sebelah Barat.
Daratan Kalimantan Timur tidakterlepas dari perbukitan yangterdapat hampir di seluruhkabupaten. Jumlah danau di provinsiini juga cukup banyak yaitu sekitar 18buah. Sebagian besar danau-danau
tersebut berada di Kabupaten KutaiKartanegara dengan danau yangpaling luas yaitu Danau Semayangdan Melintang yang masing-masingmempunyai luas area 13.000 ha dan11.000 ha.
Kalimantan Timur is one of maingates in East Indonesia. The region,which is known as timber storehouseand mining, has hundreds of riversspread to almost all ofRegency/Municipality and used asmain transportation beside landtransportation, and the largest riveris Mahakam River.
Province Kalimantan Timur islocated in the most East ofKalimantan Island. This provincesborder in the North with KalimantanUtara, Sulawesi Ocean and straitsMakasar in the East, KalimantanSelatan in the South, and withKalimantan Barat, KalimantanTengah and Malaysia in the West.
Kalimantan Timur also has groupof hills in almost all of regencies.There are 18 lakes in KalimantanTimur, most of located in KutaiKartanegara. And Kalimantan Timur
have two largest lakes are LakeSemayang and Lake Melintang eachof which has a 13,000 hectare area,and 11,000 hectare.
manthe m
Is an .t e Nor
, Sulawkasar i
a
ta
imur t iukitandi
anaa
e atanKa imTe
8/20/2019 Kalimantan Timur Dalam Angka Tahun 2015
http://slidepdf.com/reader/full/kalimantan-timur-dalam-angka-tahun-2015 71/623
K a l i m a n t a n T i m u r D a l a m A n g k a 2 0 1 5
5
Geografi dan Iklim /
Geography and Climate
1.2. I K L I M
Seperti iklim wilayah Indonesiapada umumnya, Kalimantan Timurberiklim tropis dan mempunyai duamusim yaitu musim kemarau danmusim penghujan. Musim kemaraubiasanya terjadi pada bulan Meisampai dengan bulan Oktober,sedang musim penghujan terjadi
pada bulan Nopember sampaidengan bulan April. Keadaan ini terusberlangsung setiap tahun yangdiselingi dengan musim peralihanpada bulan-bulan tertentu. Selain itu,karena letaknya di daerahkhatulistiwa maka iklim di KalimantanTimur juga dipengaruhi oleh anginMuson, yaitu angin Muson Barat
Nopember-April dan angin MusonTimur Mei-Oktober.
Namun dalam tahun-tahunterakhir ini, keadaan musim di Kali-mantan Timur kadang tidak menentu.Pada bulan-bulan yang seharusnyaturun hujan dalam kenyataannya
tidak ada hujan sama sekali, atausebaliknya pada bulan-bulan yangseharusnya kemarau justru terjadihujan dengan waktu yang jauh lebihpanjang.
1.2. CLIMATE
As the climate of Indonesia ingeneral, Kalimantan Timur has atropical climate and two rainyseasons the dry season and rainyseason. The dry season usually occursin May to October, while the rainyseason occurs in November to April.This situation was to take place each
year are interspersed withtransitional season in certain months.In addition, because of its location onthe equator the climate inKalimantan Timur is also influencedby the monsoon, the west monsoon,November-April and East monsoon from May to October.
However in recent years, theseason condition in Kalimantan Timuris sometimes uncertain. In themonths that it should re rain in realitythere is no rain at all, on theconversely in the months that shouldbe dry it rains in a much longer time.
.
intseason i
k
n
arat
Muson
tah aan m
a anglan
n, beca ,equator
imantanby heNove fr
8/20/2019 Kalimantan Timur Dalam Angka Tahun 2015
http://slidepdf.com/reader/full/kalimantan-timur-dalam-angka-tahun-2015 72/623
K a l i m a n t a n T i m u r D a l a m A n g k a 2 0 1 5
6
Geografi dan Iklim /
Geography and Climate
1.3 SUHU DAN KELEMBABAN
Suhu udara suatu tempatditentukan oleh tinggi dan rendahnyadaerah tersebut dari permukaan lautdan jaraknya dari pantai. Secaraumum, Kalimantan Timur beriklimpanas dengan suhu pada tahun 2014berkisar antara 20,0 oC di Berau padabulan Maret sampai 36,2 oC di Beraupada bulan September dan Oktober.
Rata-rata suhu terendah adalah21,7 oC dan tertinggi 35,0 oC terjadi diBerau. Selain sebagai daerah tropisdengan hutan yang luas, di tahun2014 rata-rata kelembaban udaraKalimantan Timur antara 81-86
persen. Kelembaban udara terendahdiamati oleh stasiun meteorologiSamarinda terjadi pada beberapabulan dengan kelembaban 76 persen.Sedangkan tertinggi terjadi di Beraupada bulan Januari, Mei danDesember dengan kelembaban 88persen.
Informasi lebih lanjut dapatdilihat pada tabel 1.2.7 mengenaisuhu rata-rata minimum danmaksimum, kelembaban udara,kecepatan angin, curah hujan, sinarmatahari di stasiun pengamatmeteorologi pada tahun 2014.
1.3 TEMPERATURE AND
HUMIDITY
The temperature in someplaceis determined by its high and lowabove sea level and its distance fromthe beach. In general, KalimantanTimur has hot climates withtemperatures ranged from 20,0 oC to36,2 oC. The lowest and highest
temperatur in Berau .
The lowest temperature averagewas 21,7 oC and the highest was 35.00C occurred in Berau. Besides as thetropic area with a large forest, in theyear 2014 Kalimantan Timur averageair humidity between 81 – 86 percent.The lowest air humidity was observedby meteorology station of Samarindahappened on few month withhumidity 76 percent. While thehighest was observed in Berau on January, May, and December withhumidity 88 percent.
Further information of averagetemperature of minimum andmaximum, air humidity, windvelocity, rainfall, sunshine at theobserver meteorology stations in2014 can seen at Table 1.2.7.
ahrologieberap
76 per erjadi di
uari,an kel
u .
owest t , o an
ccurredropic arear
air
8/20/2019 Kalimantan Timur Dalam Angka Tahun 2015
http://slidepdf.com/reader/full/kalimantan-timur-dalam-angka-tahun-2015 73/623
K a l i m a n t a n T i m u r D a l a m A n g k a 2 0 1 5
7
Geografi dan Iklim /
Geography and Climate
1.4. CURAH HUJAN DAN
KEADAAN ANGIN
Curah hujan di daerahKalimantan Timur sangat beragammenurut bulan dan letak stasiunpengamat. Catatan curah hujanbulanan sepanjang tahun 2014menurut stasiun disajikan pada Tabel1.2.1 sampai 1.2.6, sedang catatanrata-rata curah hujan menurutmasing-masing stasiun pengamatselama tahun 2014 disajikan padaTabel 1.2.4. Rata-rata curah hujantertinggi tercatat pada StasiunMeteorologi Samarinda sebesar210,2 mm dan terendah selamatahun 2014 tercatat pada StasiunMeteorologi Berau yaitu 149,2 mm.
Pada beberapa stasiunpengamat memantau kondisi angin diKalimantan Timur pada 2014.Pengamatan menunjukkan bahwakecepatan angin antara 3 sampai 6knot. Kecepatan angin tertinggiadalah 6 knot terjadi di Balikpapan,sementara yang terendah adalah 3knot di Samarinda dan Balikpapan.Informasi lebih lanjut tentang kondisiangin di beberapa stasiun pengamatdapat dilihat pada Tabel 1.2.1 sampai1.2.6.
1.4. RAINFALL AND WIND
CONDITION
The rainfall in Kalimantan Timurvaried by month and observer stationlocation. The rainfall in 2014 byobserver station is shown in Table1.2.1 until 1.2.6. The rainfall averageby each of observer station in 2014 isshown in Table 1.2.7. Average of thehighest recorded on Meteorologystation of Samarinda 210,2 mm andlowest rainfall in 2014 recorded onMeteorology station of Samarinda149,2 mm.
At several monitored observerstations the wind condition inKalimantan Timur in 2013.Observation indicated that windvelocity between 3 to 6 knot. Highestwind velocity is 6 knot happened inBalikpapan, while the lowest was 3knot in Samarinda and Balikpapan.Further information of the windcondition in several observers is
shown in Table 1.2.1 until 1.2.6.
t i m . b p
s .
.
stasindisi an
padaunju
n antaratan
r
arin a in
logy stmm.
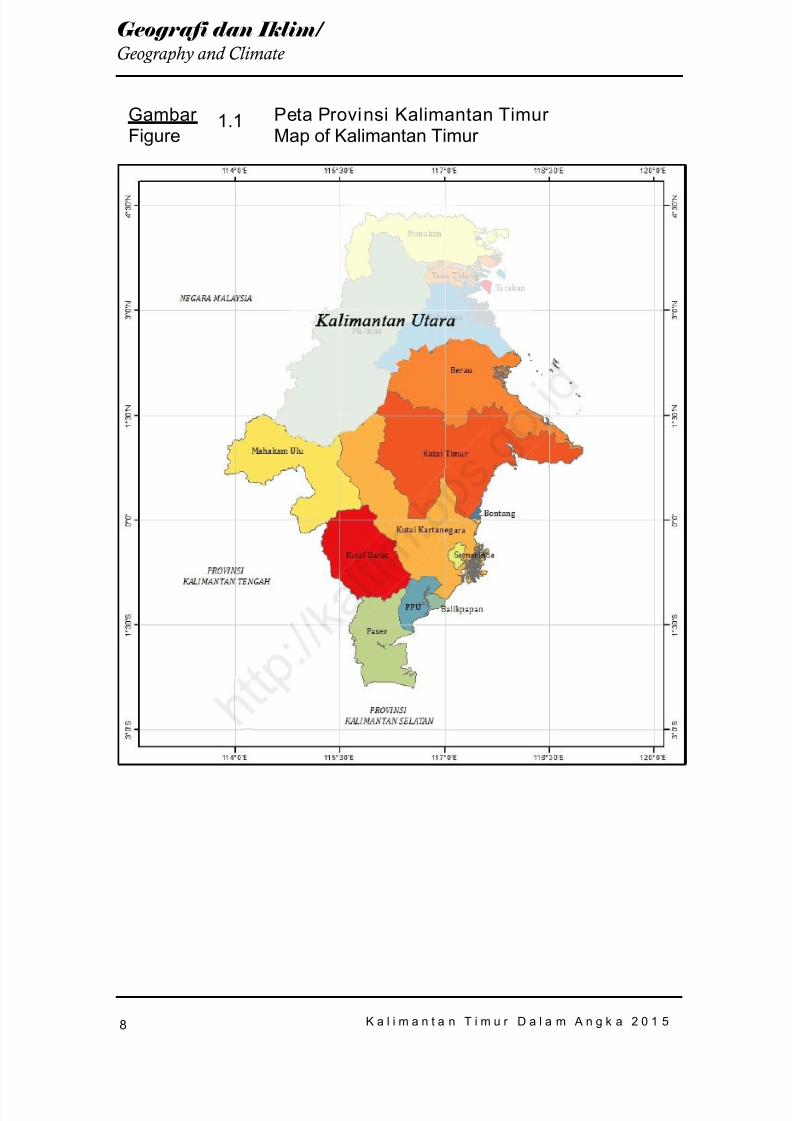
8/20/2019 Kalimantan Timur Dalam Angka Tahun 2015
http://slidepdf.com/reader/full/kalimantan-timur-dalam-angka-tahun-2015 74/623
K a l i m a n t a n T i m u r D a l a m A n g k a 2 0 1 5
8
Geografi dan Iklim /
Geography and Climate
Gambar Figure
1.1 Peta Provinsi Kalimantan Timur Map of Kalimantan Timur
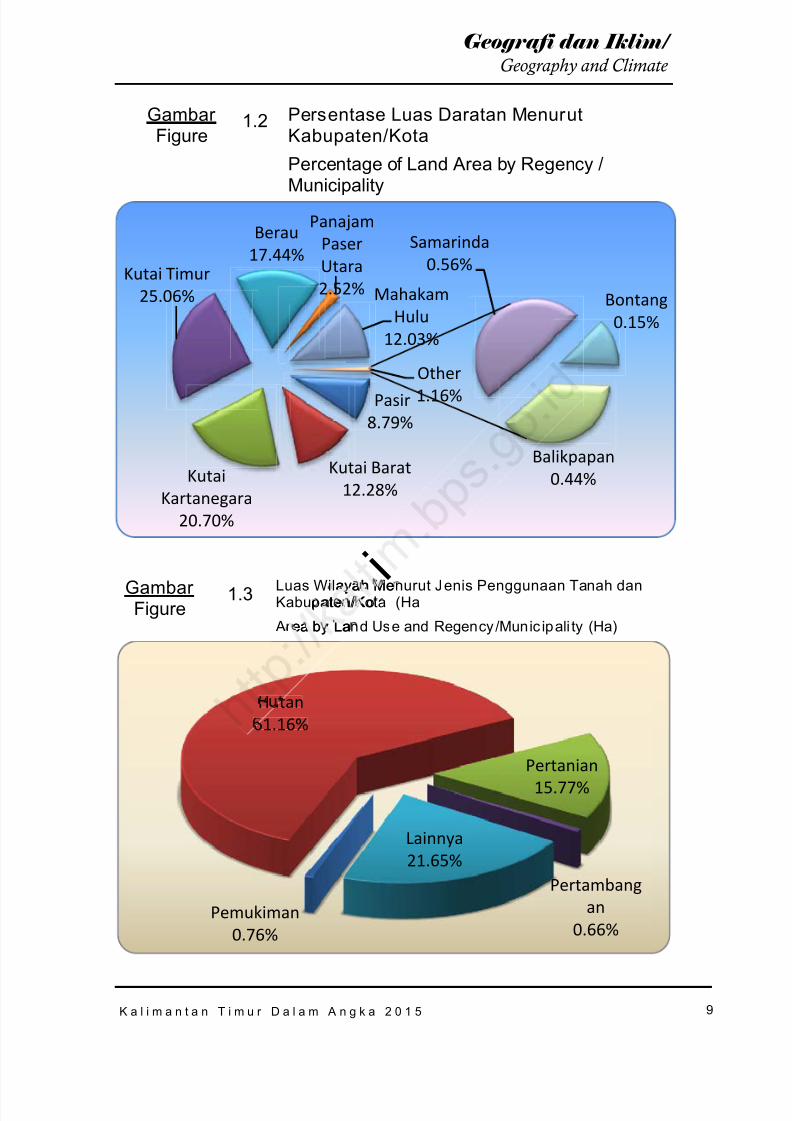
8/20/2019 Kalimantan Timur Dalam Angka Tahun 2015
http://slidepdf.com/reader/full/kalimantan-timur-dalam-angka-tahun-2015 75/623
K a l i m a n t a n T i m u r D a l a m A n g k a 2 0 1 5
9
Geografi dan Iklim /
Geography and Climate
Gambar Figure
1.2 Persentase Luas Daratan MenurutKabupaten/KotaPercentage of Land Area by Regency /
Municipality
Gambar Figure
1.3 Luas Wilayah Menurut Jenis Penggunaan Tanah danKabupaten/Kota (Ha
Area by Land Use and Regency /Munic ipali ty (Ha)
Pasir8.79%
Kutai Barat12.28%
KutaiKartanegara
20.70%
Kutai Timur25.06%
Berau17.44%
PanajamPaserUtara2.52% Mahakam
Hulu12.03%
Balikpapan0.44%
Samarinda0.56%
Bontang0.15%
Other1.16%
Pemukiman0.76%
Hutan61.16%
Pertanian15.77%
Pertambangan
0.66%
Lainnya21.65%
iaya h Meaten/Ko
ea by La
H
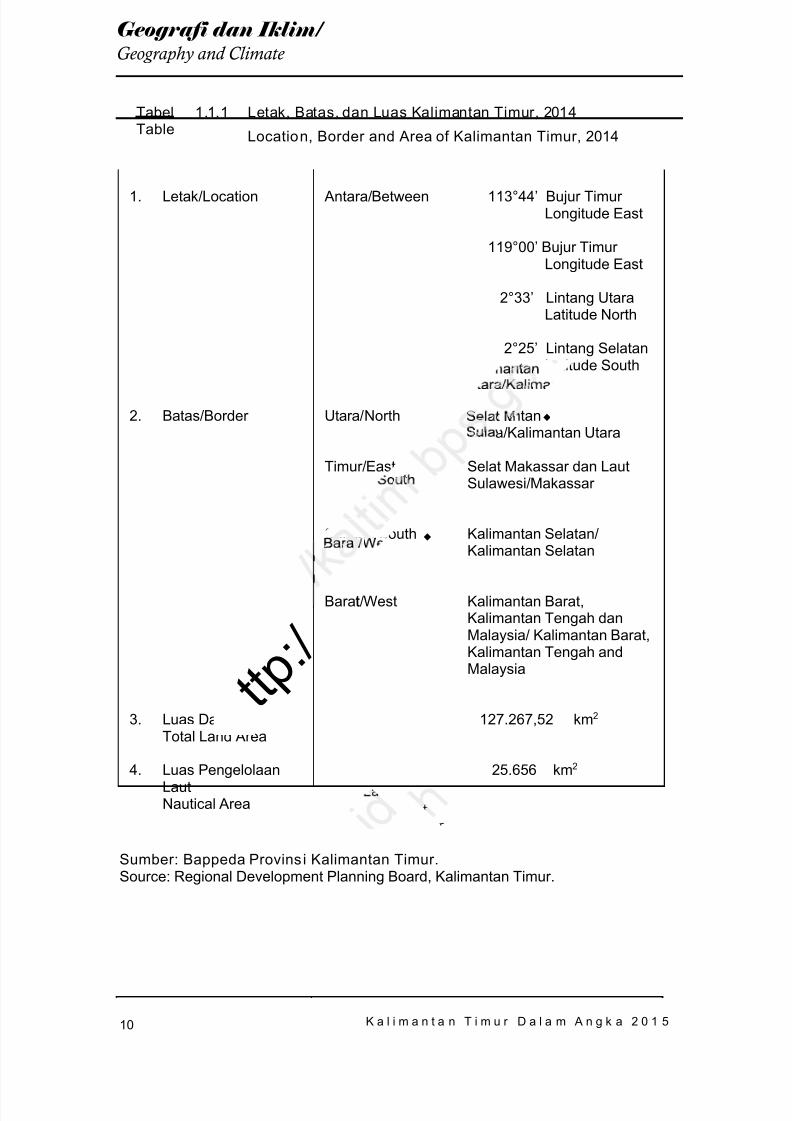
8/20/2019 Kalimantan Timur Dalam Angka Tahun 2015
http://slidepdf.com/reader/full/kalimantan-timur-dalam-angka-tahun-2015 76/623
K a l i m a n t a n T i m u r D a l a m A n g k a 2 0 1 5
10
Geografi dan Iklim /
Geography and Climate
TabelTable
1.1.1 Letak, Batas, dan Luas Kalimantan Timur, 2014
Location, Border and Area of Kalimantan Timur, 2014
1. Letak/ Location
2. Batas/ Border
3. Luas DaratTotal Land Area
4. Luas PengelolaanLautNautical Area
Antara/ Between
Utara/ North
Timur/East
Selatan/ South
Barat/ West
113°44’ Bujur Timur Longitude East
119°00’ Bujur Timur Longitude East
2°33’ Lintang UtaraLatitude North
2°25’ Lintang SelatanLatitude South
KalimantanUtara/ Kalimantan Utara
Selat Makassar dan LautSulawesi/ Makassar
Kalimantan Selatan/Kalimantan Selatan
Kalimantan Barat,Kalimantan Tengah danMalaysia/ Kalimantan Barat,Kalimantan Tengah andMalaysia
127.267,52 km 2
25.656 km 2
Sumber: Bappeda Provins i Kalimantan Timur.Source: Regional Development Planning Board, Kalimantan Timur.
.
.t
t t p : /
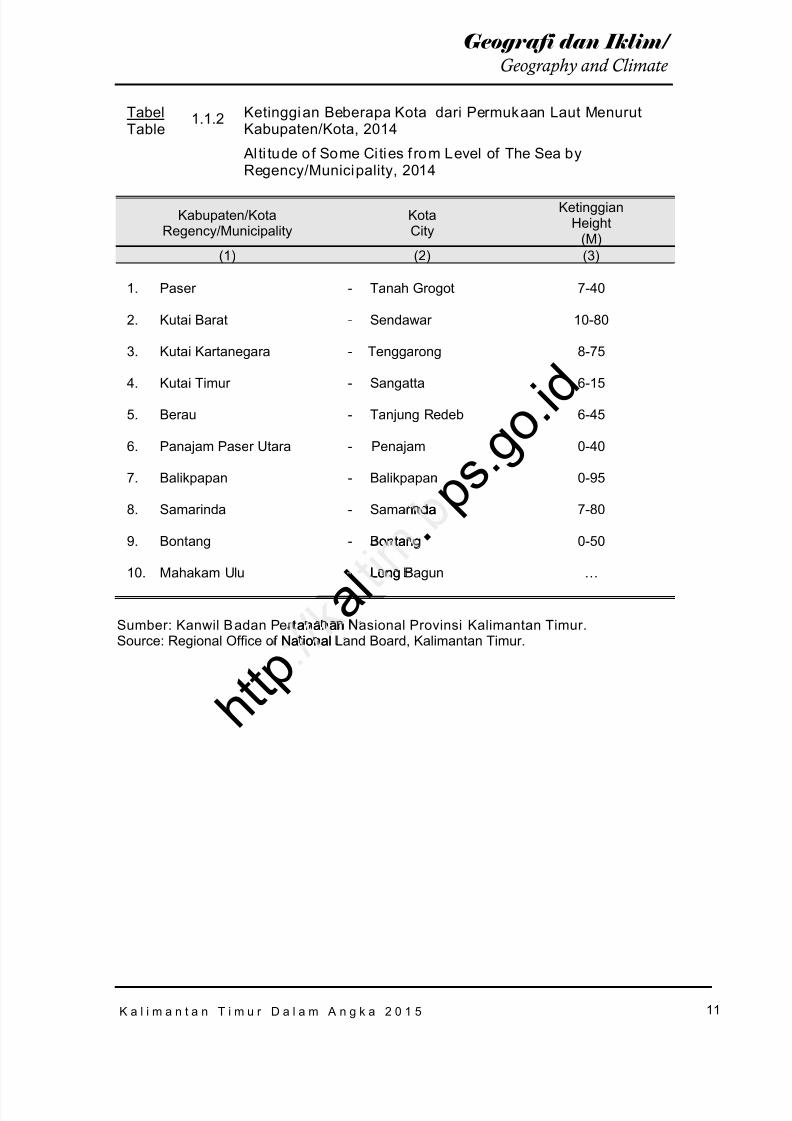
8/20/2019 Kalimantan Timur Dalam Angka Tahun 2015
http://slidepdf.com/reader/full/kalimantan-timur-dalam-angka-tahun-2015 77/623
K a l i m a n t a n T i m u r D a l a m A n g k a 2 0 1 5
11
Geografi dan Iklim /
Geography and Climate
TabelTable
1.1.2 Ketinggian Beberapa Kota dari Permukaan Laut MenurutKabupaten/Kota, 2014
Al ti tude of Some Cities f rom Level of The Sea byRegency/Municipality, 2014
Kabupaten/Kota
Regency/MunicipalityKotaCity
KetinggianHeight
(M)(1) (2) (3)
1. Paser
2. Kutai Barat
3. Kutai Kartanegara
4. Kutai Timur
5. Berau
6. Panajam Paser Utara
7. Balikpapan
8. Samarinda
9. Bontang
10. Mahakam Ulu
- Tanah Grogot
- Sendawar
- Tenggarong
- Sangatta
- Tanjung Redeb
- Penajam
- Balikpapan
- Samarinda
- Bontang
- Long Bagun
7-40
10-80
8-75
6-15
6-45
0-40
0-95
7-80
0-50
…
Sumber: Kanwil Badan Pertanahan Nasional Provinsi Kalimantan Timur.Source: Regional Office of National Land Board, Kalimantan Timur.
a l . p
s . g o . i d
inda
ontangt
Long
anahan
h t t p National
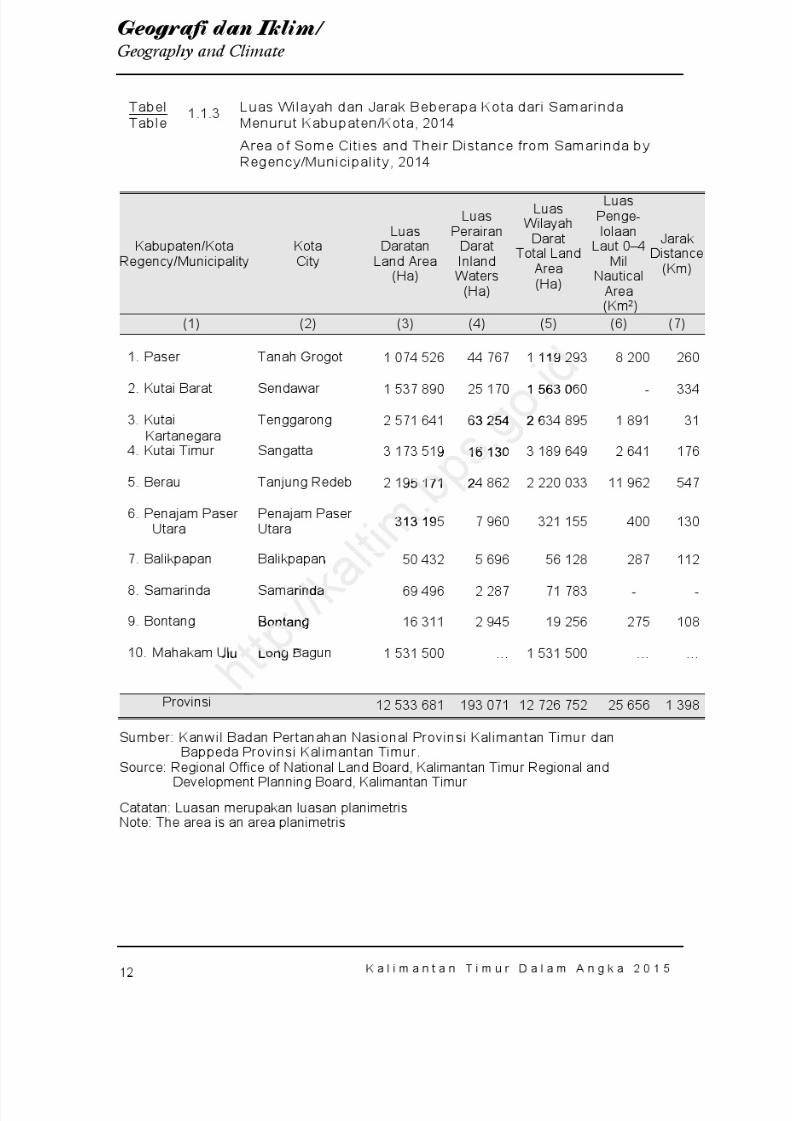
8/20/2019 Kalimantan Timur Dalam Angka Tahun 2015
http://slidepdf.com/reader/full/kalimantan-timur-dalam-angka-tahun-2015 78/623
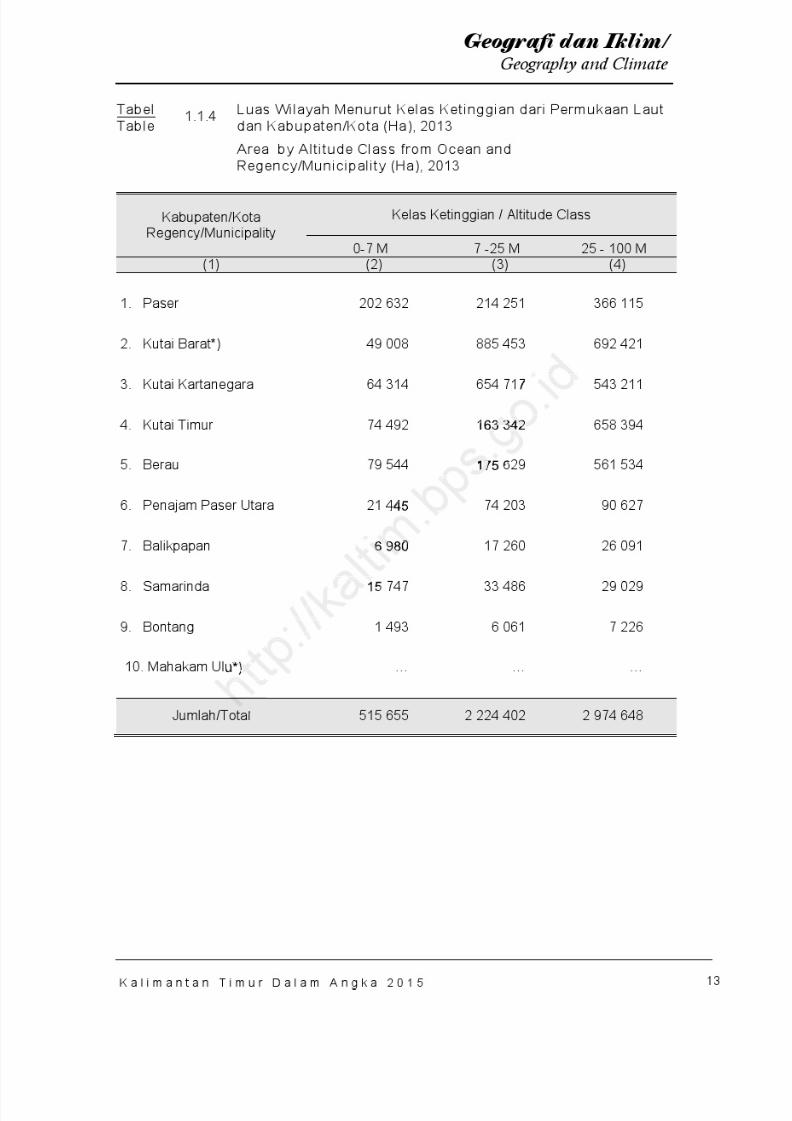
8/20/2019 Kalimantan Timur Dalam Angka Tahun 2015
http://slidepdf.com/reader/full/kalimantan-timur-dalam-angka-tahun-2015 79/623
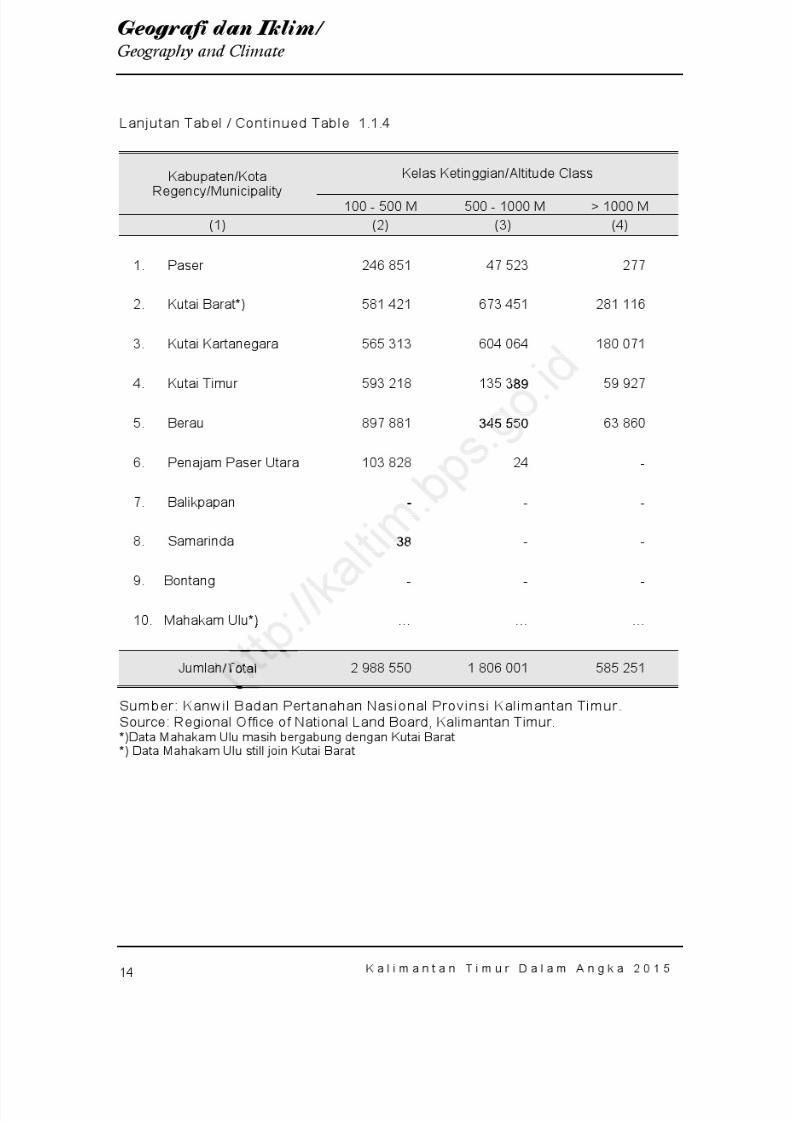
8/20/2019 Kalimantan Timur Dalam Angka Tahun 2015
http://slidepdf.com/reader/full/kalimantan-timur-dalam-angka-tahun-2015 80/623
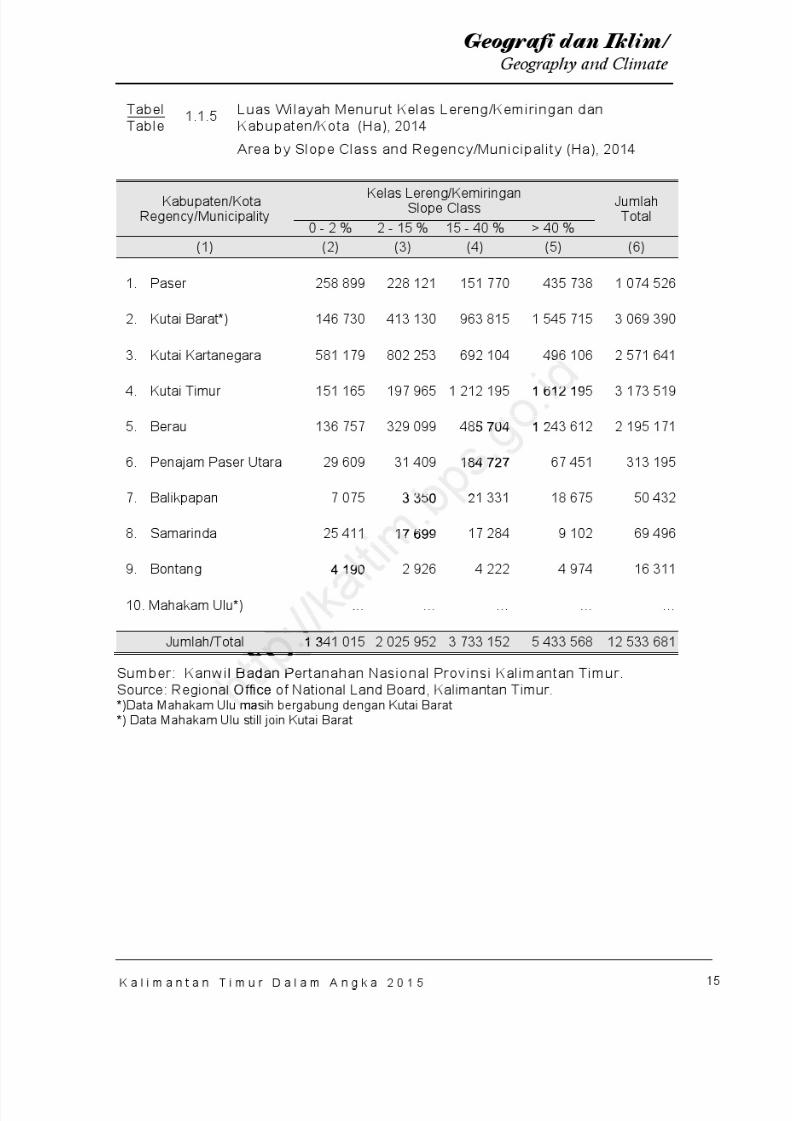
8/20/2019 Kalimantan Timur Dalam Angka Tahun 2015
http://slidepdf.com/reader/full/kalimantan-timur-dalam-angka-tahun-2015 81/623
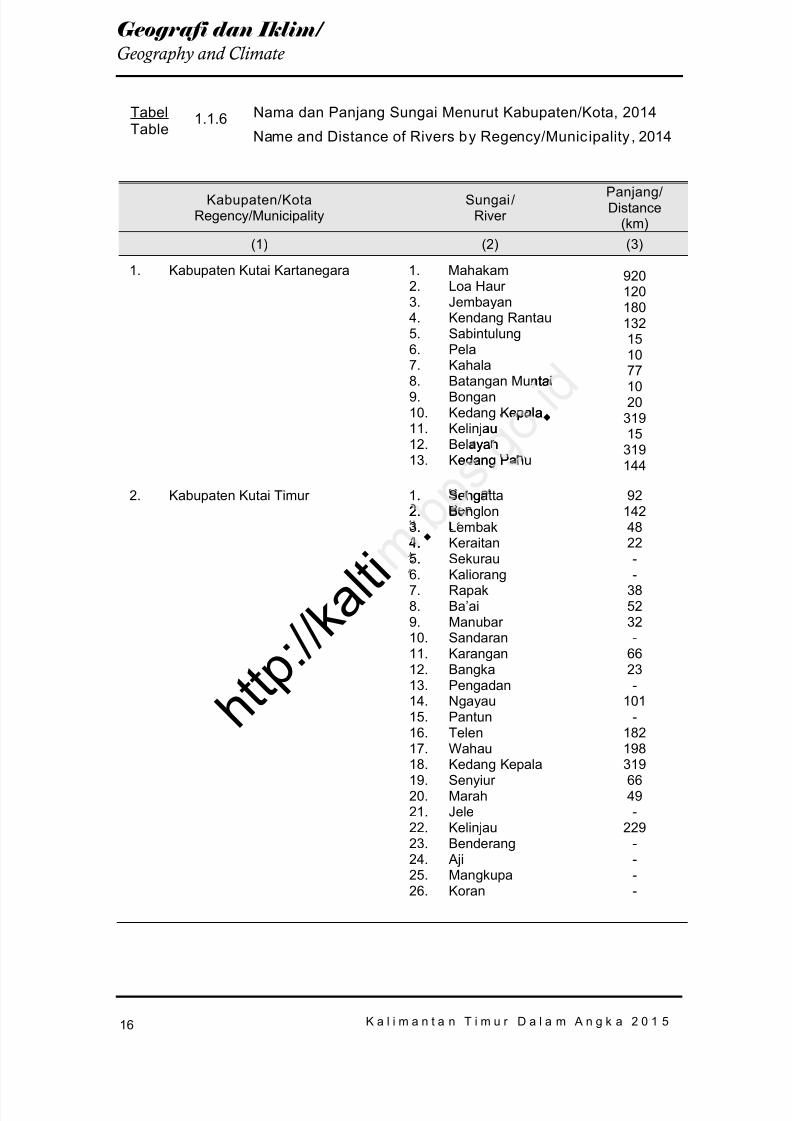
8/20/2019 Kalimantan Timur Dalam Angka Tahun 2015
http://slidepdf.com/reader/full/kalimantan-timur-dalam-angka-tahun-2015 82/623
K a l i m a n t a n T i m u r D a l a m A n g k a 2 0 1 5
16
Geografi dan Iklim /
Geography and Climate
TabelTable
1.1.6 Nama dan Panjang Sungai Menurut Kabupaten/Kota, 2014
Name and Distance of Rivers by Regency/Municipality , 2014
Kabupaten/KotaRegency/Municipality
Sungai /River
Panjang/Distance
(km)(1) (2) (3)
1. Kabupaten Kutai Kartanegara 1. Mahakam2. Loa Haur 3. Jembayan4. Kendang Rantau5. Sabintulung6. Pela7. Kahala
8. Batangan Muntai9. Bongan10. Kedang Kepala11. Kelinjau12. Belayan13. Kedang Pahu
9201201801321510771020
31915
319144
2. Kabupaten Kutai Timur 1. Sengatta2. Benglon3. Lembak4. Keraitan5. Sekurau
6. Kaliorang7. Rapak8. Ba’ai9. Manubar 10. Sandaran11. Karangan12. Bangka13. Pengadan14. Ngayau15. Pantun16. Telen17. Wahau
18. Kedang Kepala19. Senyiur 20. Marah21. Jele22. Kelinjau23. Benderang24. Aji25. Mangkupa26. Koran
921424822-
-385232-
6623-
101-
182198
3196649-
229----
h t t p : / / k a l t i
.
.tai
epa au
yanedang Pa
. eng2. e
.4..
.
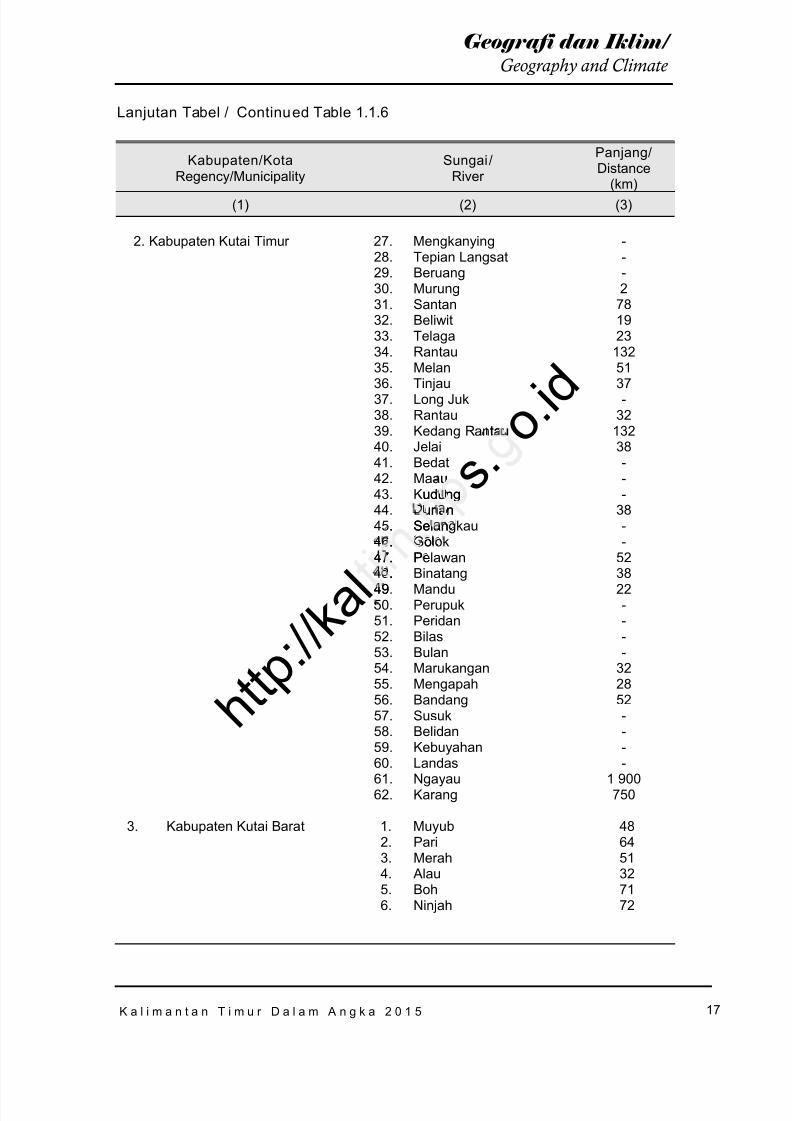
8/20/2019 Kalimantan Timur Dalam Angka Tahun 2015
http://slidepdf.com/reader/full/kalimantan-timur-dalam-angka-tahun-2015 83/623
K a l i m a n t a n T i m u r D a l a m A n g k a 2 0 1 5
17
Geografi dan Iklim /
Geography and Climate
Lanjutan Tabel / Continued Table 1.1.6
Kabupaten/KotaRegency/Municipality
Sungai /River
Panjang/Distance
(km)(1) (2) (3)
2. Kabupaten Kutai Timur 27. Mengkanying28. Tepian Langsat29. Beruang30. Murung31. Santan32. Beliwit33. Telaga34. Rantau35. Melan
36. Tinjau37. Long Juk38. Rantau39. Kedang Rantau40. Jelai41. Bedat42. Maau43. Kudung44. Durian45. Selangkau46. Golok47. Pelawan
48. Binatang49. Mandu50. Perupuk51. Peridan52. Bilas53. Bulan54. Marukangan55. Mengapah56. Bandang57. Susuk58. Belidan59. Kebuyahan
60. Landas61. Ngayau62. Karang
---2
781923
13251
37-
3213238---
38--
52
3822----
322852---
-1 900750
3. Kabupaten Kutai Barat 1. Muyub2. Pari3. Merah4. Alau5. Boh6. Ninjah
486451327172
h t t p : / / k a l
s . o . i d
tau
uudungur an
. S elan
.. o47.. P
..49
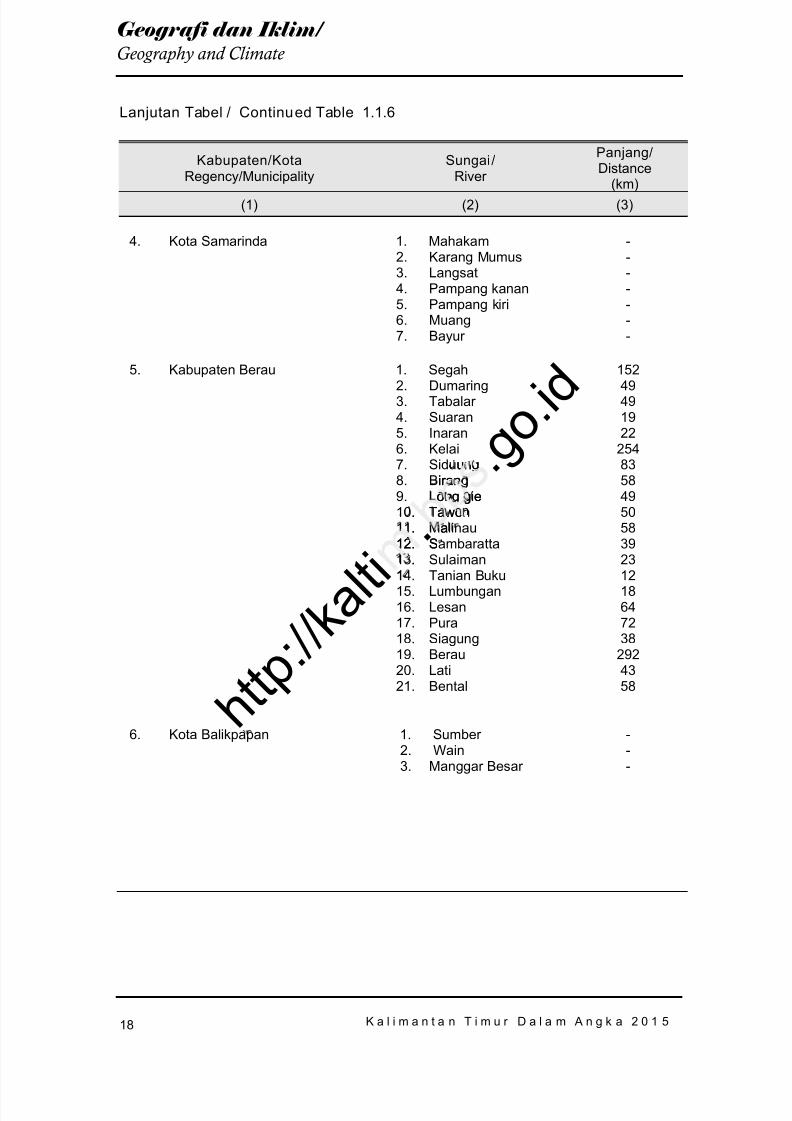
8/20/2019 Kalimantan Timur Dalam Angka Tahun 2015
http://slidepdf.com/reader/full/kalimantan-timur-dalam-angka-tahun-2015 84/623
K a l i m a n t a n T i m u r D a l a m A n g k a 2 0 1 5
18
Geografi dan Iklim /
Geography and Climate
Lanjutan Tabel / Continued Table 1.1.6
Kabupaten/KotaRegency/Municipality
Sungai /River
Panjang/Distance
(km)(1) (2) (3)
4. Kota Samarinda 1. Mahakam2. Karang Mumus3. Langsat4. Pampang kanan5. Pampang kiri6. Muang7. Bayur
-------
5. Kabupaten Berau 1. Segah2. Dumaring3. Tabalar 4. Suaran5. Inaran6. Kelai7. Siduung8. Birang9. Long gie10. Tawon11. Malinau12. Sambaratta13. Sulaiman
14. Tanian Buku15. Lumbungan16. Lesan17. Pura18. Siagung19. Berau20. Lati21. Bental
15249491922
25483584950583923
1218647238
2924358
6. Kota Balikpapan 1. Sumber 2. Wain
3. Manggar Besar
--
-
h t t p : / / k a l t i
. . g o . i d
ungirangong g e
. awo
. a12. S
.
1
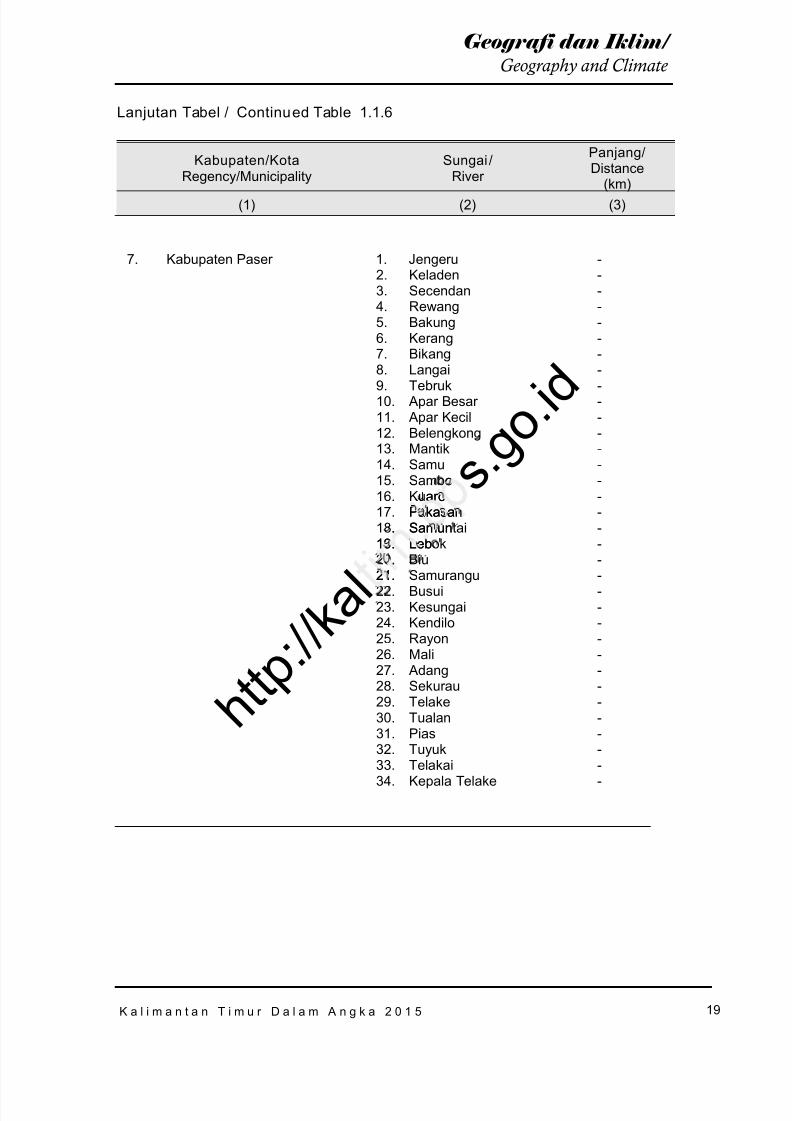
8/20/2019 Kalimantan Timur Dalam Angka Tahun 2015
http://slidepdf.com/reader/full/kalimantan-timur-dalam-angka-tahun-2015 85/623
K a l i m a n t a n T i m u r D a l a m A n g k a 2 0 1 5
19
Geografi dan Iklim /
Geography and Climate
Lanjutan Tabel / Continued Table 1.1.6
Kabupaten/KotaRegency/Municipality
Sungai /River
Panjang/Distance
(km)(1) (2) (3)
7. Kabupaten Paser 1. Jengeru2. Keladen3. Secendan4. Rewang5. Bakung6. Kerang7. Bikang8. Langai9. Tebruk10. Apar Besar 11. Apar Kecil12. Belengkong13. Mantik14. Samu15. Sambo16. Kuaro17. Pakasan18. Samuntai19. Lebok20. Biu
21. Samurangu22. Busui23. Kesungai24. Kendilo25. Rayon26. Mali27. Adang28. Sekurau29. Telake30. Tualan31. Pias32. Tuyuk
33. Telakai34. Kepala Telake
--------------------
------------
--
h t t p : / / k a l
s . g o . i do
aroPakasan
. Samun19. Leb
..
21.
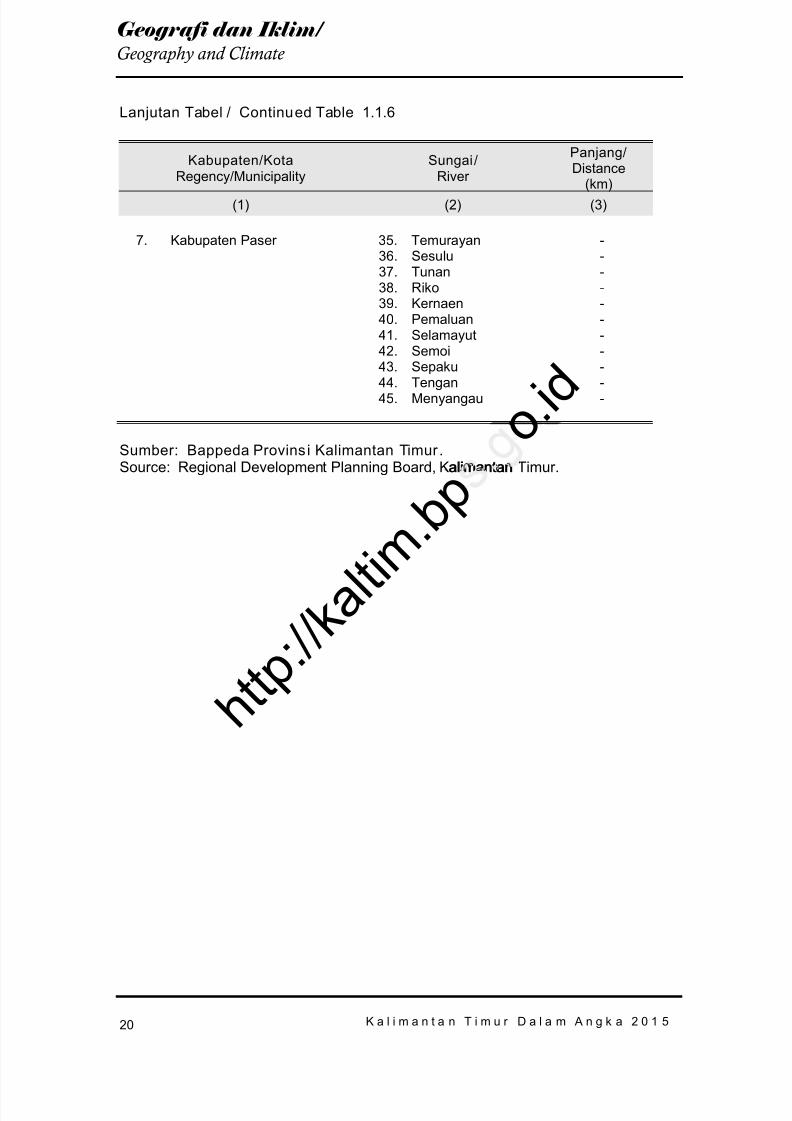
8/20/2019 Kalimantan Timur Dalam Angka Tahun 2015
http://slidepdf.com/reader/full/kalimantan-timur-dalam-angka-tahun-2015 86/623
K a l i m a n t a n T i m u r D a l a m A n g k a 2 0 1 5
20
Geografi dan Iklim /
Geography and Climate
Lanjutan Tabel / Continued Table 1.1.6
Kabupaten/KotaRegency/Municipality
Sungai /River
Panjang/Distance
(km)(1) (2) (3)
7. Kabupaten Paser 35. Temurayan36. Sesulu37. Tunan38. Riko39. Kernaen40. Pemaluan41. Selamayut42. Semoi43. Sepaku
44. Tengan45. Menyangau
---------
--
Sumber: Bappeda Provins i Kalimantan Timur .Source: Regional Development Planning Board, Kalimantan Timur.
h t t p : / / k a l t i m
. b p o . i d
alimantan
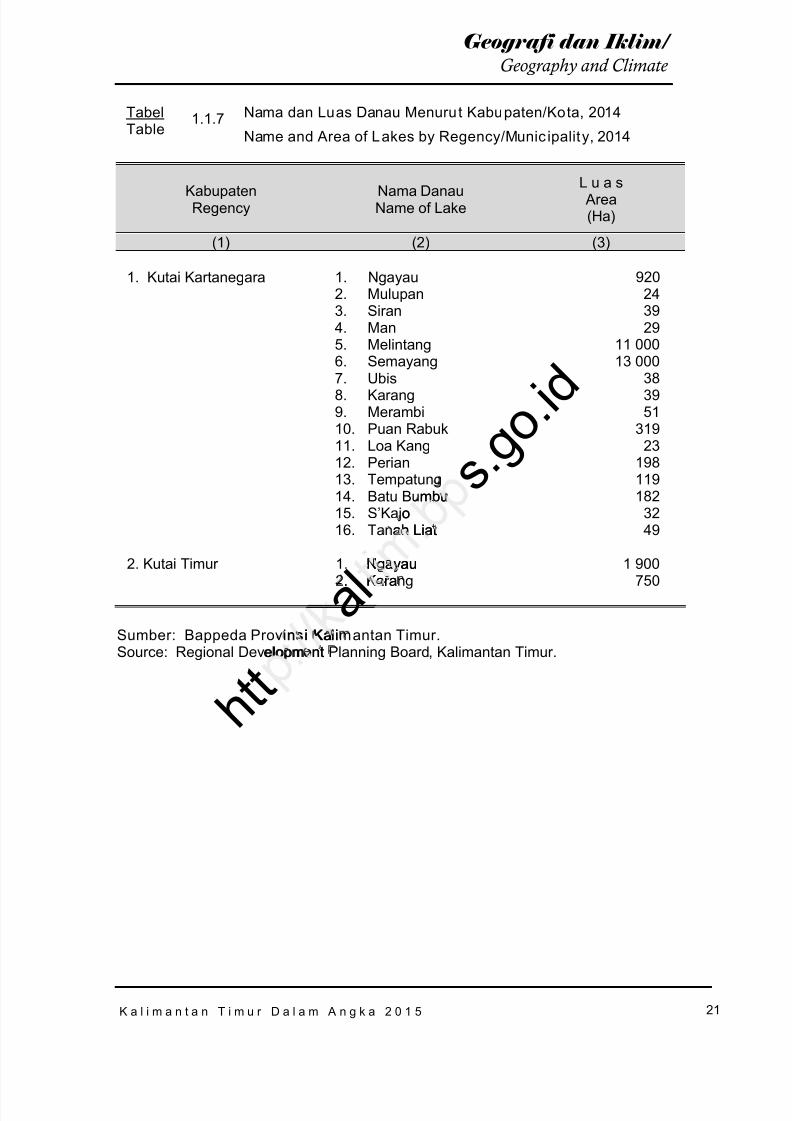
8/20/2019 Kalimantan Timur Dalam Angka Tahun 2015
http://slidepdf.com/reader/full/kalimantan-timur-dalam-angka-tahun-2015 87/623
K a l i m a n t a n T i m u r D a l a m A n g k a 2 0 1 5
21
Geografi dan Iklim /
Geography and Climate
TabelTable
1.1.7 Nama dan Luas Danau Menurut Kabupaten/Kota, 2014
Name and Area of Lakes by Regency/Munic ipality, 2014
KabupatenRegency
Nama DanauName of Lake
L u a s Area(Ha)
(1) (2) (3)
1. Kutai Kartanegara 1. Ngayau2. Mulupan3. Siran4. Man5. Melintang6. Semayang
7. Ubis8. Karang9. Merambi10. Puan Rabuk11. Loa Kang12. Perian13. Tempatung14. Batu Bumbu15. S’Kajo16. Tanah Liat
920243929
11 00013 000
383951
31923
198119182
3249
2. Kutai Timur 1. Ngayau2. Karang
1 900750
Sumber: Bappeda Provins i Kalimantan Timur.Source: Regional Development Planning Board, Kalimantan Timur.
a l
s . g o . i d mbuo
ah Liat
Ngayau. Kara
nsi Kali
h t t elopm ent
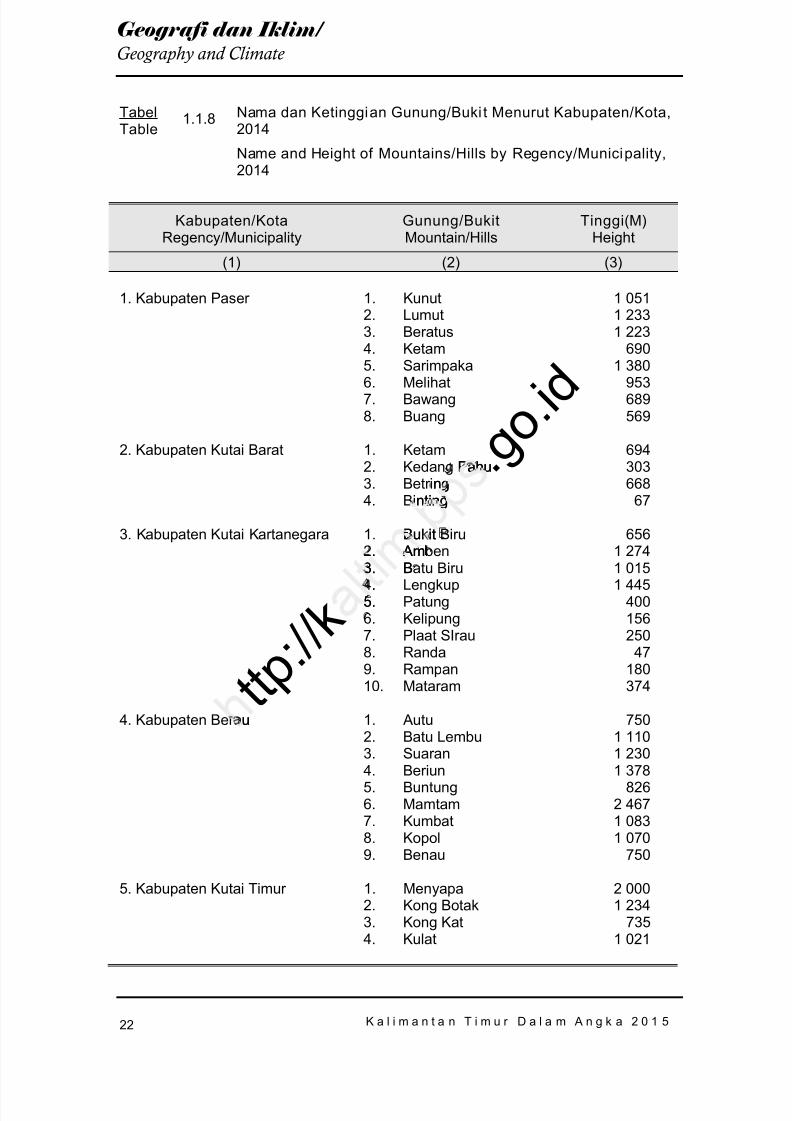
8/20/2019 Kalimantan Timur Dalam Angka Tahun 2015
http://slidepdf.com/reader/full/kalimantan-timur-dalam-angka-tahun-2015 88/623
K a l i m a n t a n T i m u r D a l a m A n g k a 2 0 1 5
22
Geografi dan Iklim /
Geography and Climate
TabelTable
1.1.8 Nama dan Ketinggian Gunung/Buki t Menurut Kabupaten/Kota,2014
Name and Height of Mountains/Hills by Regency/Municipality ,2014
Kabupaten/KotaRegency/Municipality
Gunung/BukitMountain/Hills
Tinggi (M)Height
(1) (2) (3)
1. Kabupaten Paser 1. Kunut2. Lumut3. Beratus4. Ketam5. Sarimpaka
6. Melihat7. Bawang8. Buang
1 0511 2331 223
6901 380
953689569
2. Kabupaten Kutai Barat 1. Ketam2. Kedang Pahu3. Betring4. Binting
694303668
67
3. Kabupaten Kutai Kartanegara 1. Bukit Biru2. Amben
3. Batu Biru4. Lengkup5. Patung6. Kelipung7. Plaat SIrau8. Randa9. Rampan10. Mataram
6561 274
1 0151 445400156250
47180374
4. Kabupaten Berau 1. Autu2. Batu Lembu3. Suaran4. Beriun5. Buntung6. Mamtam7. Kumbat8. Kopol9. Benau
7501 1101 2301 378
8262 4671 0831 070
750
5. Kabupaten Kutai Timur 1. Menyapa2. Kong Botak3. Kong Kat4. Kulat
2 0001 234
7351 021
t t p : / / k
. g o . i d Pahu
ngnting
Bukit. Am
3. B.5.
u
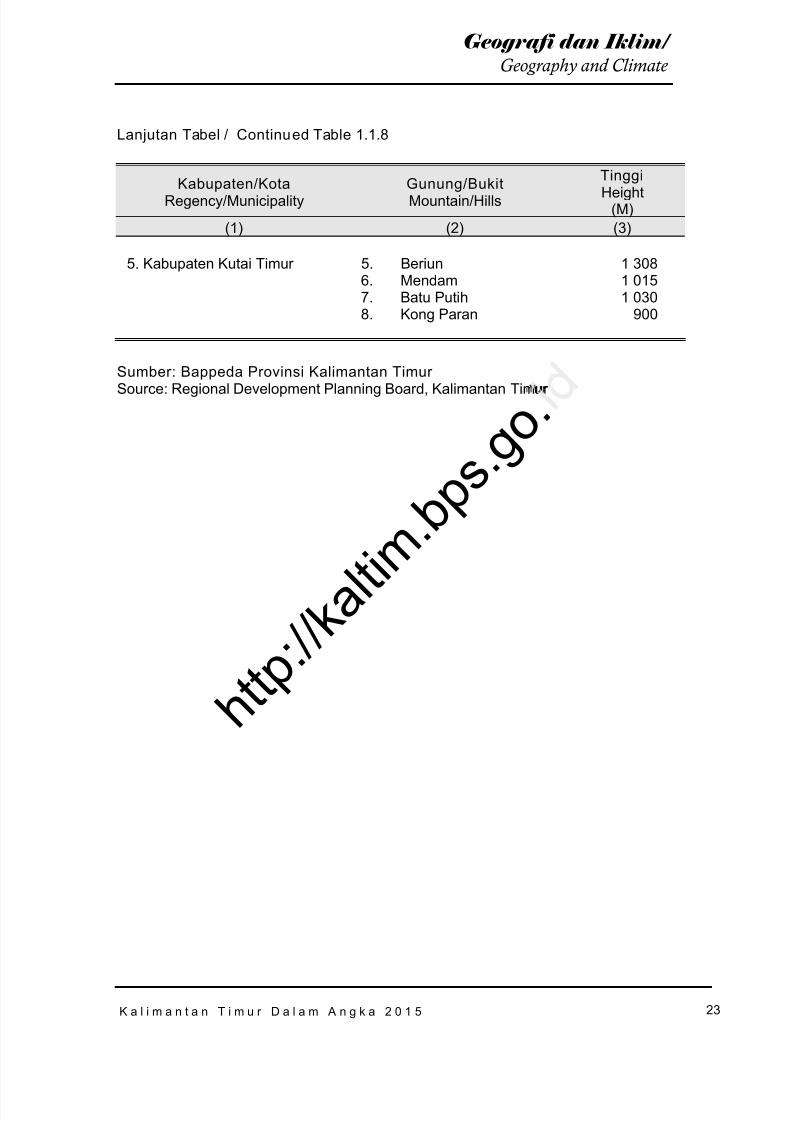
8/20/2019 Kalimantan Timur Dalam Angka Tahun 2015
http://slidepdf.com/reader/full/kalimantan-timur-dalam-angka-tahun-2015 89/623
K a l i m a n t a n T i m u r D a l a m A n g k a 2 0 1 5
23
Geografi dan Iklim /
Geography and Climate
Lanjutan Tabel / Continued Table 1.1.8
Kabupaten/KotaRegency/Municipality
Gunung/BukitMountain/Hills
TinggiHeight
(M)(1) (2) (3)
5. Kabupaten Kutai Timur 5. Beriun6. Mendam7. Batu Putih8. Kong Paran
1 3081 0151 030
900
Sumber: Bappeda Provinsi Kalimantan TimurSource: Regional Development Planning Board, Kalimantan Timur
h t t p : / / k a l t i m
. b p s . g o .
ur

8/20/2019 Kalimantan Timur Dalam Angka Tahun 2015
http://slidepdf.com/reader/full/kalimantan-timur-dalam-angka-tahun-2015 90/623
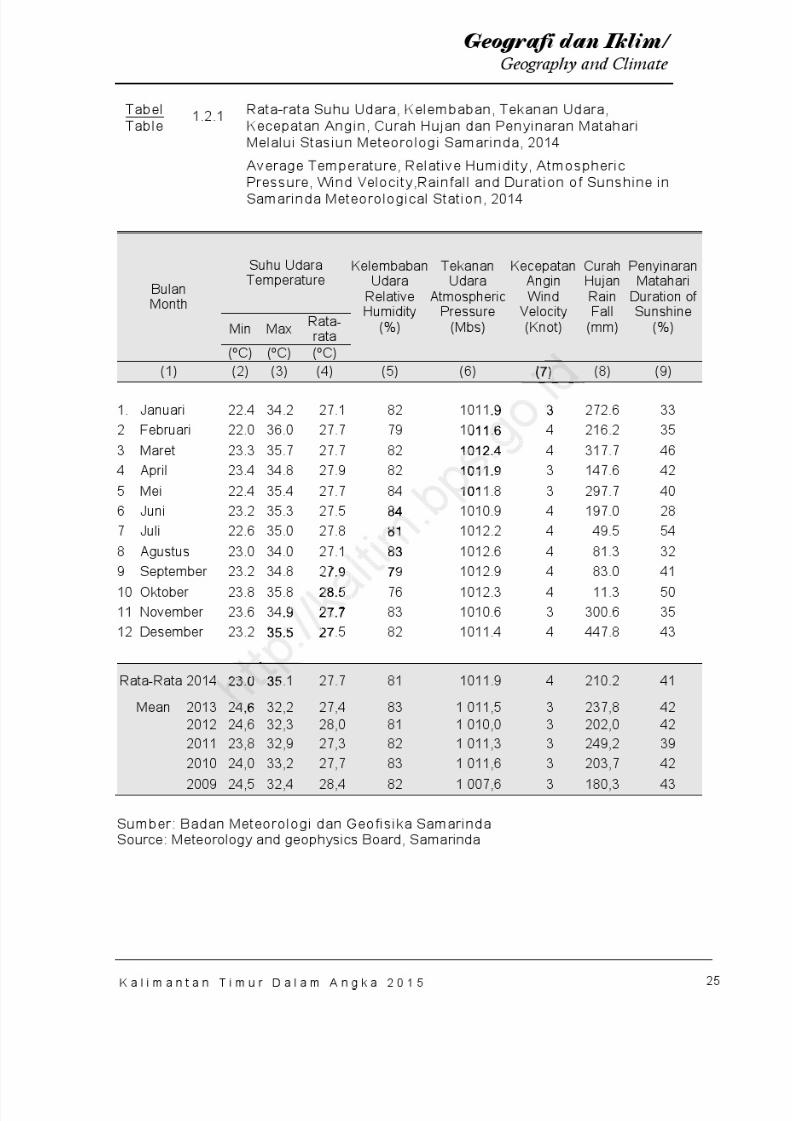
8/20/2019 Kalimantan Timur Dalam Angka Tahun 2015
http://slidepdf.com/reader/full/kalimantan-timur-dalam-angka-tahun-2015 91/623
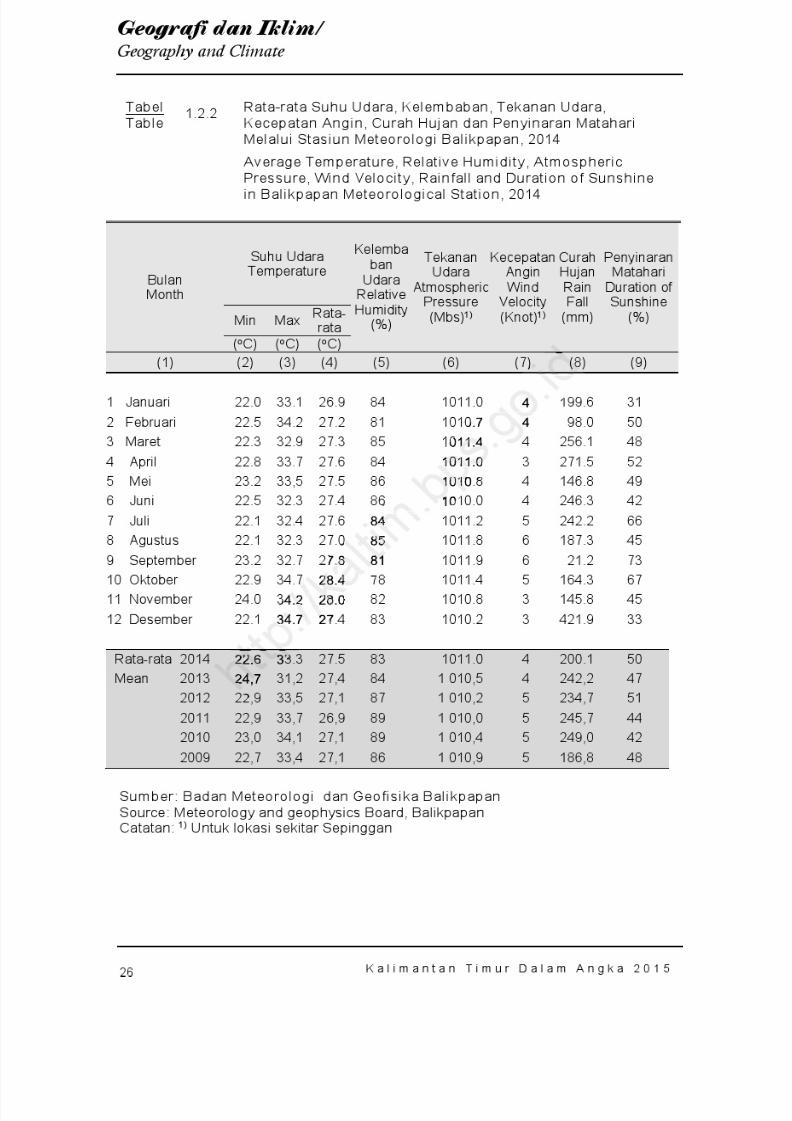
8/20/2019 Kalimantan Timur Dalam Angka Tahun 2015
http://slidepdf.com/reader/full/kalimantan-timur-dalam-angka-tahun-2015 92/623
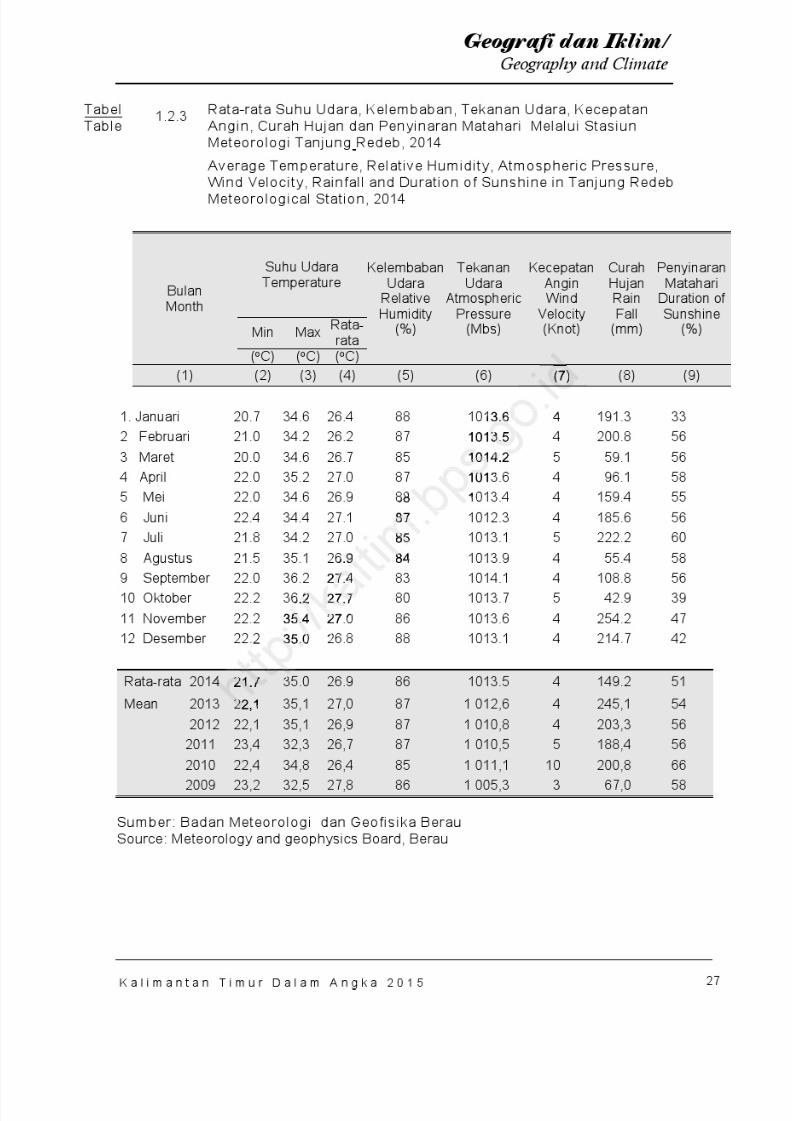
8/20/2019 Kalimantan Timur Dalam Angka Tahun 2015
http://slidepdf.com/reader/full/kalimantan-timur-dalam-angka-tahun-2015 93/623
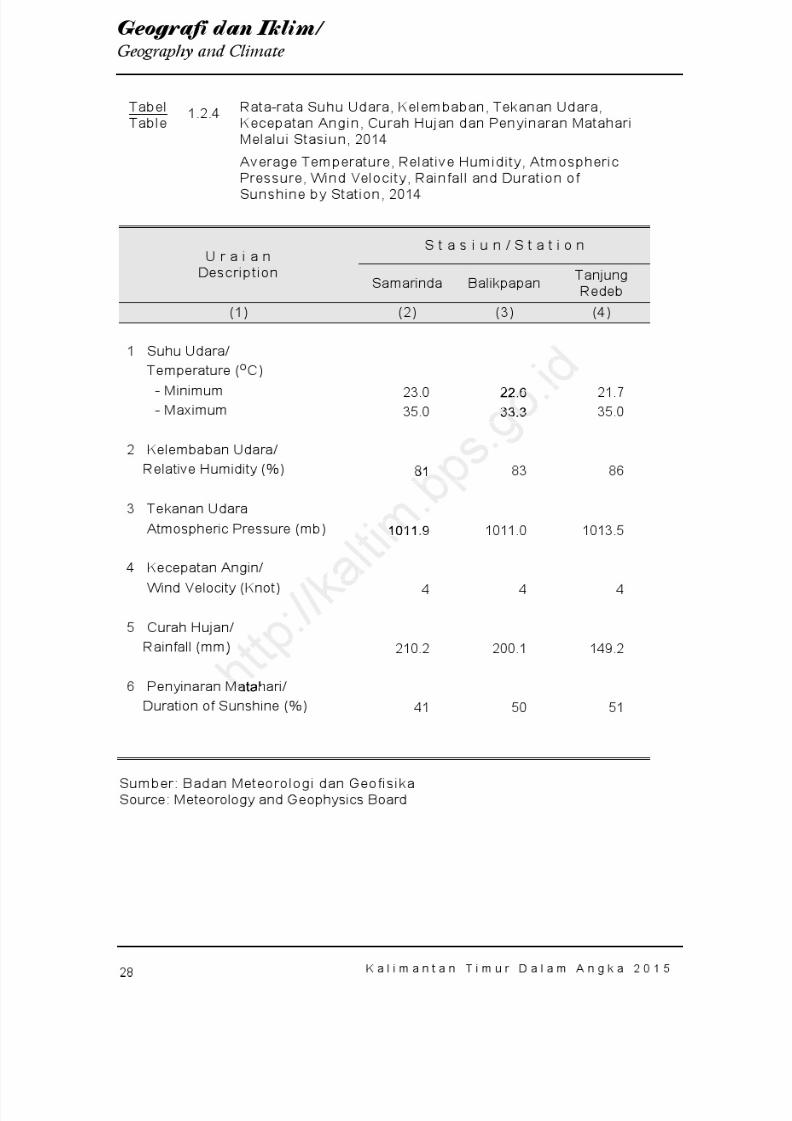
8/20/2019 Kalimantan Timur Dalam Angka Tahun 2015
http://slidepdf.com/reader/full/kalimantan-timur-dalam-angka-tahun-2015 94/623

8/20/2019 Kalimantan Timur Dalam Angka Tahun 2015
http://slidepdf.com/reader/full/kalimantan-timur-dalam-angka-tahun-2015 95/623
2Pemerintahan
BABChapter
Government
Jumlah PNSdi Pemerintahan
Provinsi Kalimantan Timur
Perempuan
40%Laki-laki
60%
s .
h t t p : / / k

8/20/2019 Kalimantan Timur Dalam Angka Tahun 2015
http://slidepdf.com/reader/full/kalimantan-timur-dalam-angka-tahun-2015 96/623
h t t p : / / k a l t i m
. b p s . g o . i d
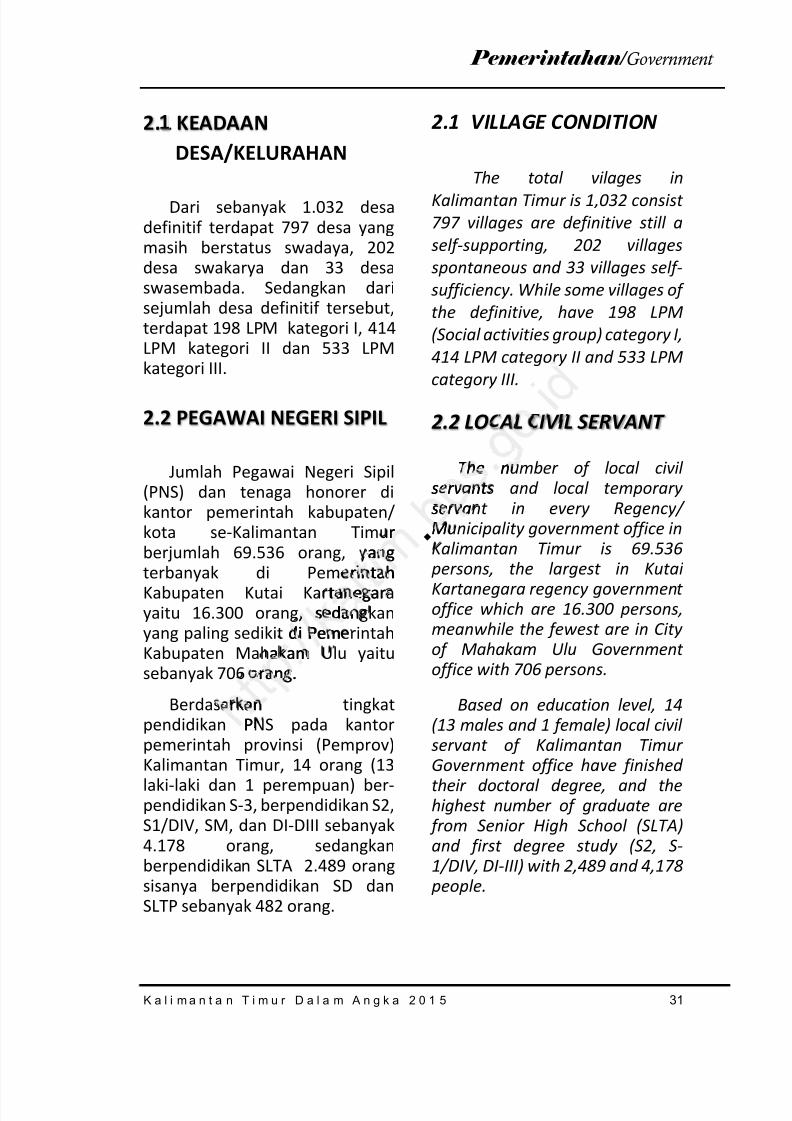
8/20/2019 Kalimantan Timur Dalam Angka Tahun 2015
http://slidepdf.com/reader/full/kalimantan-timur-dalam-angka-tahun-2015 97/623
31K a l i m a n t a n T i m u r D a l a m A n g k a 2 0 1 5
Pemerintahan / Government
2.1 KEADAANDESA/KELURAHAN
Dari sebanyak 1.032 desadefinitif terdapat 797 desa yangmasih berstatus swadaya, 202desa swakarya dan 33 desaswasembada. Sedangkan darisejumlah desa definitif tersebut,terdapat 198 LPM kategori I, 414LPM kategori II dan 533 LPMkategori III.
2.2 PEGAWAI NEGERI SIPIL
Jumlah Pegawai Negeri Sipil(PNS) dan tenaga honorer dikantor pemerintah kabupaten/kota se-Kalimantan Timurberjumlah 69.536 orang, yang
terbanyak di PemerintahKabupaten Kutai Kartanegarayaitu 16.300 orang, sedangkanyang paling sedikit di PemerintahKabupaten Mahakam Ulu yaitusebanyak 706 orang.
Berdasarkan tingkatpendidikan PNS pada kantorpemerintah provinsi (Pemprov)
Kalimantan Timur, 14 orang (13laki-laki dan 1 perempuan) ber-pendidikan S-3, berpendidikan S2,S1/DIV, SM, dan DI-DIII sebanyak4.178 orang, sedangkanberpendidikan SLTA 2.489 orangsisanya berpendidikan SD danSLTP sebanyak 482 orang.
2.1 VILLAGE CONDITION
The total vilages inKalimantan Timur is 1,032 consist797 villages are definitive still aself-supporting, 202 villagesspontaneous and 33 villages self-sufficiency. While some villages ofthe definitive, have 198 LPM(Social activities group) category I,414 LPM category II and 533 LPM
category III.
2.2 LOCAL CIVIL SERVANT
The number of local civilservants and local temporaryservant in every Regency/Municipality government office inKalimantan Timur is 69.536
persons, the largest in KutaiKartanegara regency governmentoffice which are 16.300 persons,meanwhile the fewest are in Cityof Mahakam Ulu Governmentoffice with 706 persons.
Based on education level, 14(13 males and 1 female) local civilservant of Kalimantan Timur
Government office have finishedtheir doctoral degree, and thehighest number of graduate are from Senior High School (SLTA)and first degree study (S2, S-1/DIV, DI-III) with 2,489 and 4,178 people.
. r
ang
rintahtanegar, sedan
di Pema am
orang.
ar anP
AL IV
The nservantservaM
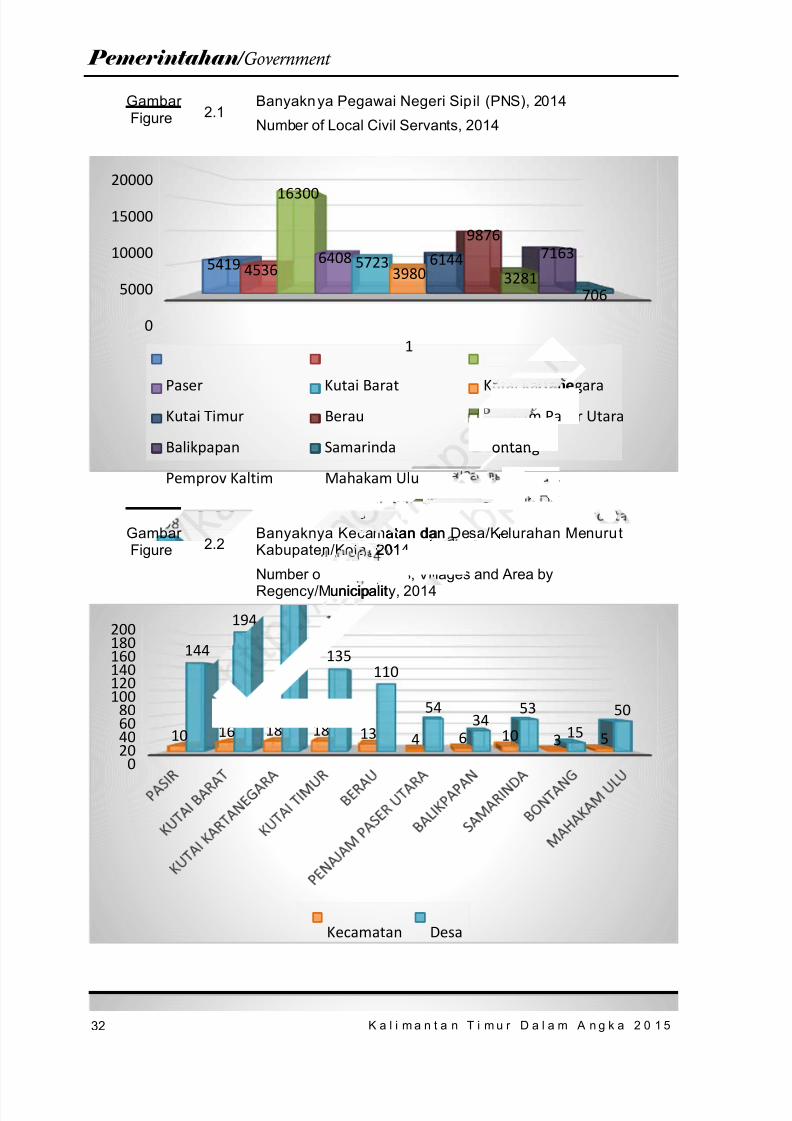
8/20/2019 Kalimantan Timur Dalam Angka Tahun 2015
http://slidepdf.com/reader/full/kalimantan-timur-dalam-angka-tahun-2015 98/623
32
Pemerintahan / Government
K a l i m a n t a n T i m u r D a l a m A n g k a 2 0 1 5
Gambar Figure 2.1
Banyakn ya Pegawai Negeri Sipil (PNS), 2014
Number of Local Civil Servants, 2014
Gambar Figure 2.2
Banyaknya Kecamatan dan Desa/Kelurahan MenurutKabupaten/Kota, 2014
Number of Sub Districts, Villages and Area byRegency/Municipality, 2014
0
5000
10000
15000
20000
1
5419 4536
16300
6408 57233980
6144
9876
3281
7163
706
Paser Kutai Barat Kutai Kartanegara
Kutai Timur Berau Penajam Paser Utara
Balikpapan Samarinda Bontang
Pemprov Kaltim Mahakam Ulu
0
20406080
100120140160180200
10 16 18 18 13 4 6 10 3 5
144
194 198
135110
5434
53
1550
Kecamatan Desa
atan dan, 201
b Districtunicipalit
rtane
najam Pa
ontan
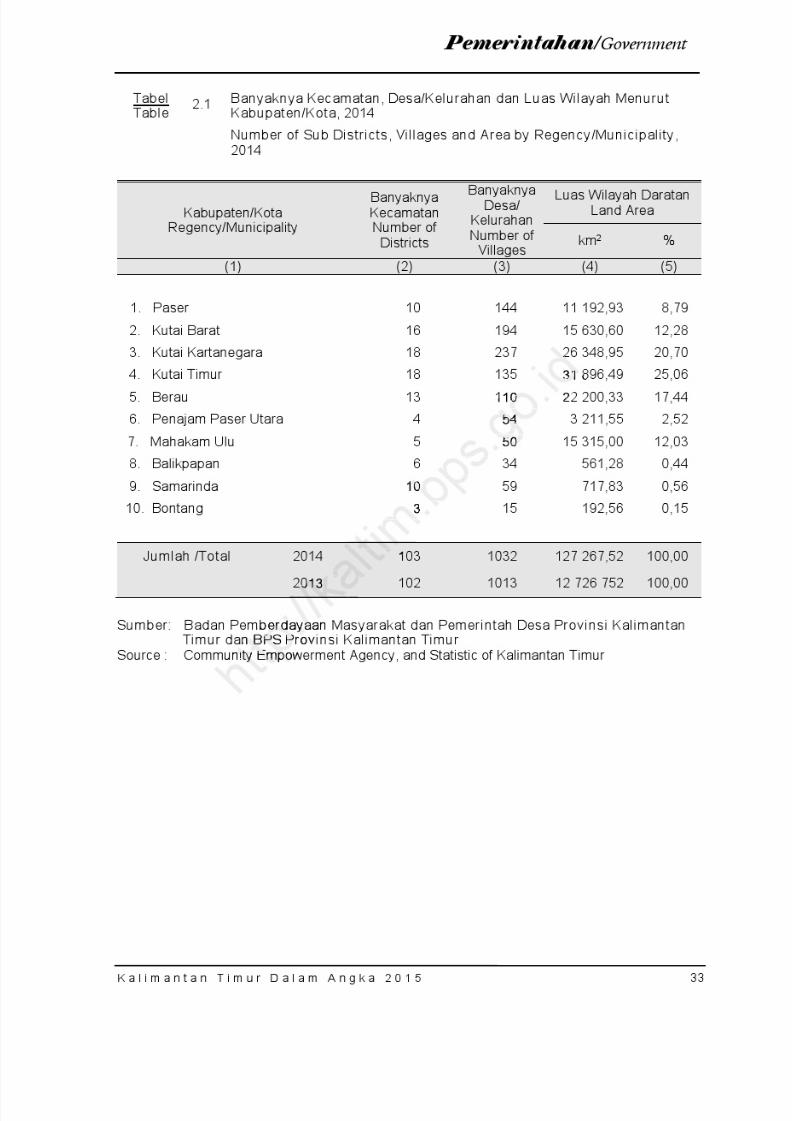
8/20/2019 Kalimantan Timur Dalam Angka Tahun 2015
http://slidepdf.com/reader/full/kalimantan-timur-dalam-angka-tahun-2015 99/623
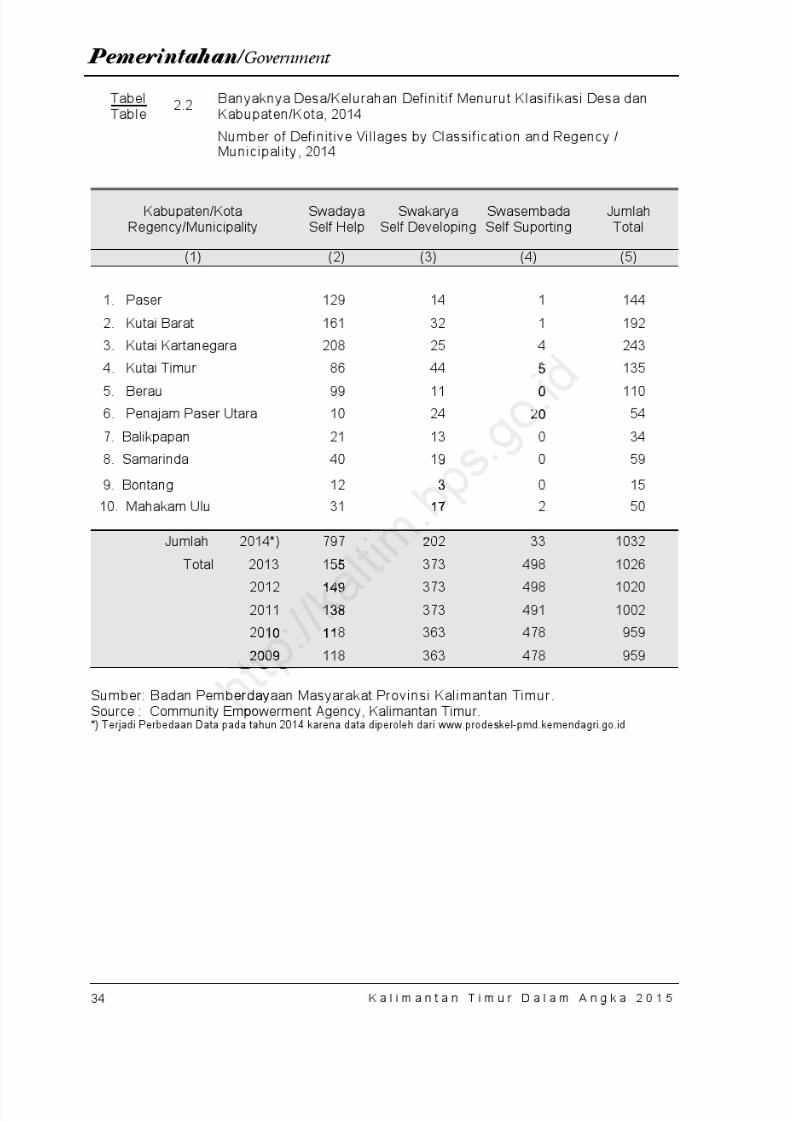
8/20/2019 Kalimantan Timur Dalam Angka Tahun 2015
http://slidepdf.com/reader/full/kalimantan-timur-dalam-angka-tahun-2015 100/623
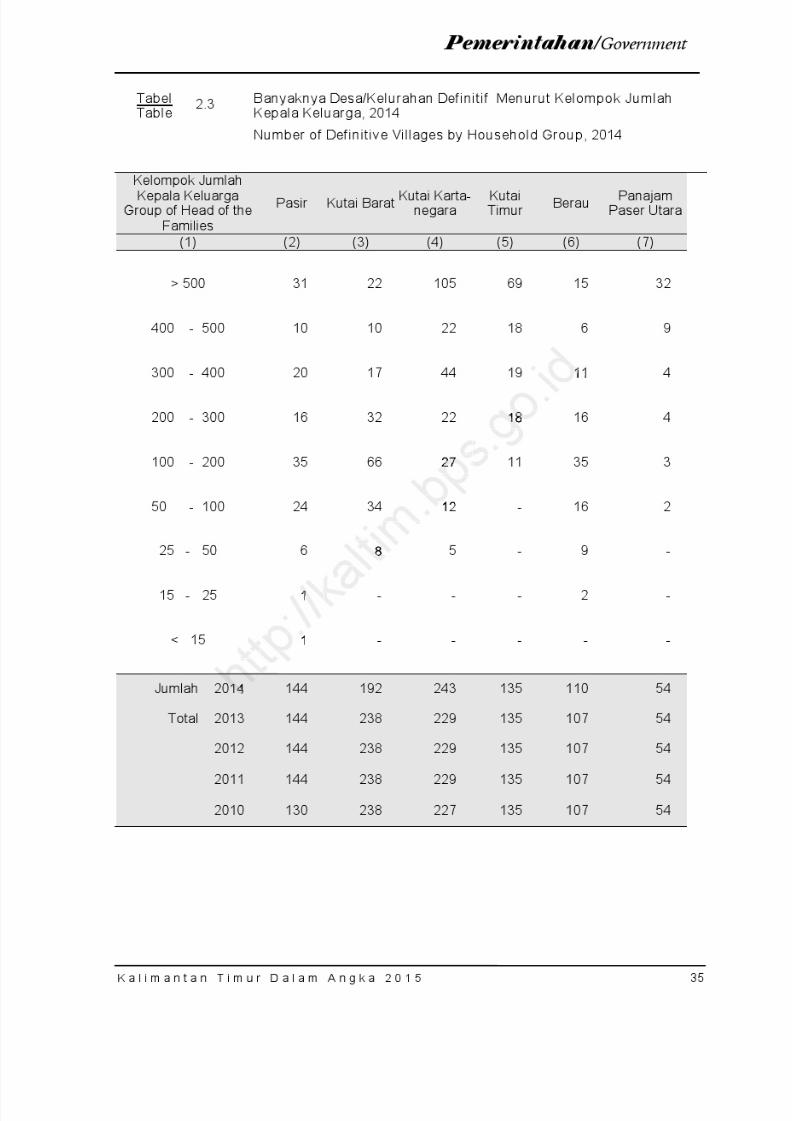
8/20/2019 Kalimantan Timur Dalam Angka Tahun 2015
http://slidepdf.com/reader/full/kalimantan-timur-dalam-angka-tahun-2015 101/623
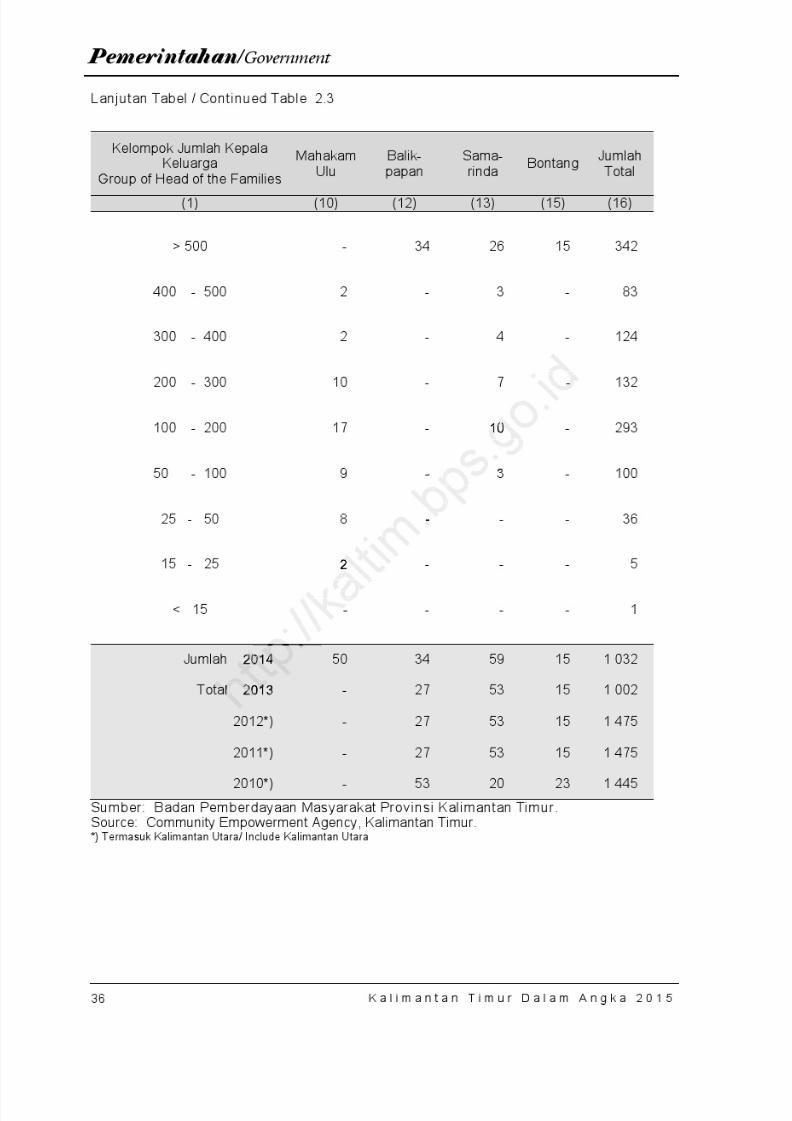
8/20/2019 Kalimantan Timur Dalam Angka Tahun 2015
http://slidepdf.com/reader/full/kalimantan-timur-dalam-angka-tahun-2015 102/623
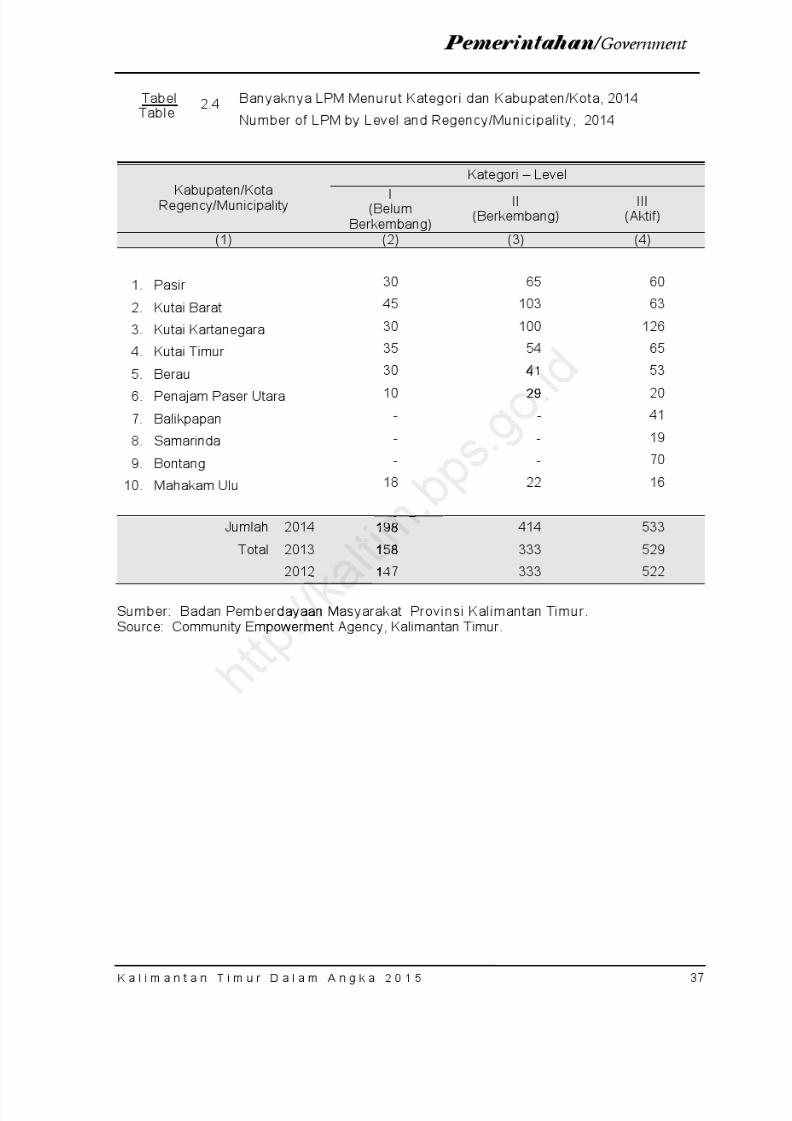
8/20/2019 Kalimantan Timur Dalam Angka Tahun 2015
http://slidepdf.com/reader/full/kalimantan-timur-dalam-angka-tahun-2015 103/623
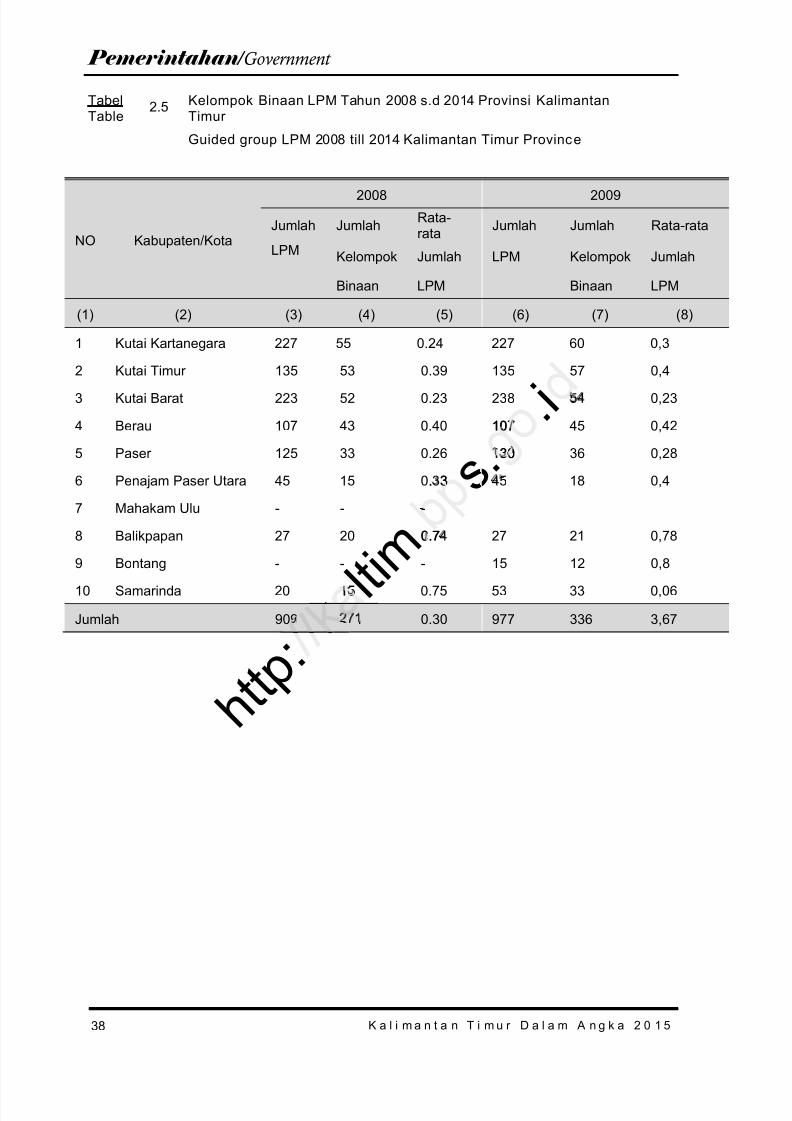
8/20/2019 Kalimantan Timur Dalam Angka Tahun 2015
http://slidepdf.com/reader/full/kalimantan-timur-dalam-angka-tahun-2015 104/623
38
Pemerintahan / Government
K a l i m a n t a n T i m u r D a l a m A n g k a 2 0 1 5
TabelTable
2.5 Kelompok Binaan LPM Tahun 2008 s.d 2014 Provinsi KalimantanTimur
Guided group LPM 2008 till 2014 Kalimantan Timur Province
NO Kabupaten/Kota
2008 2009
Jumlah Jumlah Rata-rata Jumlah Jumlah Rata-rata
LPM Kelompok Jumlah LPM Kelompok Jumlah
Binaan LPM Binaan LPM
(1) (2) (3) (4) (5) (6) (7) (8)
1 Kutai Kartanegara 227 55 0.24 227 60 0,3
2 Kutai Timur 135 53 0.39 135 57 0,4
3 Kutai Barat 223 52 0.23 238 54 0,23
4 Berau 107 43 0.40 107 45 0,42
5 Paser 125 33 0.26 130 36 0,28
6 Penajam Paser Utara 45 15 0.33 45 18 0,4
7 Mahakam Ulu - - -
8 Balikpapan 27 20 0.74 27 21 0,78
9 Bontang - - - 15 12 0,8
10 Samarinda 20 15 0.75 53 33 0,06
Jumlah 909 271 0.30 977 336 3,67 l t i m
s . . i107
130
. 3
0.7
15
h t t p :

8/20/2019 Kalimantan Timur Dalam Angka Tahun 2015
http://slidepdf.com/reader/full/kalimantan-timur-dalam-angka-tahun-2015 105/623
39K a l i m a n t a n T i m u r D a l a m A n g k a 2 0 1 5
Pemerintahan / Government
Lanjutan Tabel / Continued Table 2.5
NO Kabupaten/Kota
2010 2011
JumlahLPM
Jumlah
KelompokBinaan
Rata-rata
JumlahLPM
Jumlah
LPM
Jumlah
KelompokBinaan
Rata-rata
JumlahLPM
(1) (2) (3) (4) (5) (6) (7) (8)
1 Kutai Kartanegara 229 63 0,28 229 65 0,28
2 Kutai Timur 135 59 0,44 135 61 0,45
3 Kutai Barat 238 62 0,26 238 64 0,27
4 Berau 107 48 0,45 107 52 0,49
5 Paser 137 38 0,28 144 41 0,286 Penajam Paser Utara 54 21 0,39 54 23 0,43
7 Mahakam Ulu
8 Balikpapan 27 23 0,85 27 26 0,96
9 Bontang 15 14 0,93 15 16 1,07
10 Samarinda 53 36 0,68 53 37 0,70
Jumlah 995 364 0.37 1002 385 0.38
. g o . d4
,85
,
,
h t t p : / / k a l
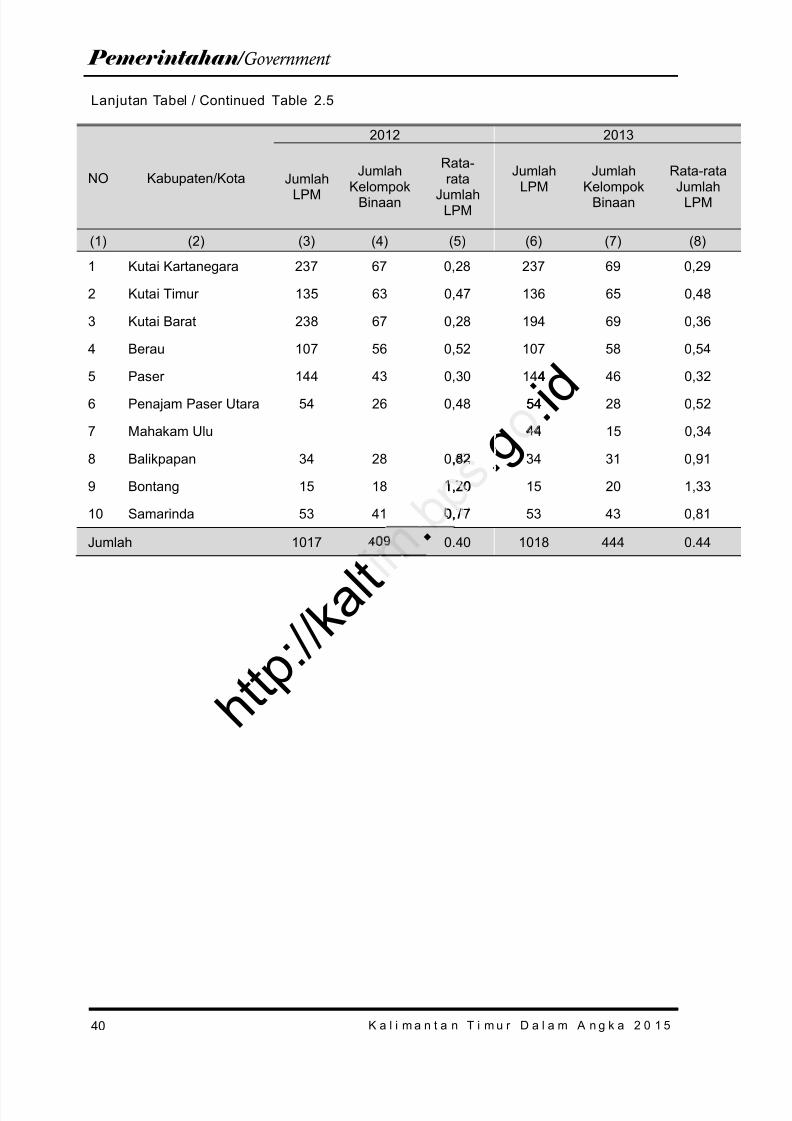
8/20/2019 Kalimantan Timur Dalam Angka Tahun 2015
http://slidepdf.com/reader/full/kalimantan-timur-dalam-angka-tahun-2015 106/623
40
Pemerintahan / Government
K a l i m a n t a n T i m u r D a l a m A n g k a 2 0 1 5
Lanjutan Tabel / Continued Table 2.5
NO Kabupaten/Kota
2012 2013
JumlahLPM
Jumlah
KelompokBinaan
Rata-rata
JumlahLPM
Jumlah
LPM
Jumlah
KelompokBinaan
Rata-rata
JumlahLPM
(1) (2) (3) (4) (5) (6) (7) (8)
1 Kutai Kartanegara 237 67 0,28 237 69 0,29
2 Kutai Timur 135 63 0,47 136 65 0,48
3 Kutai Barat 238 67 0,28 194 69 0,36
4 Berau 107 56 0,52 107 58 0,54
5 Paser 144 43 0,30 144 46 0,32
6 Penajam Paser Utara 54 26 0,48 54 28 0,52
7 Mahakam Ulu 44 15 0,34
8 Balikpapan 34 28 0,82 34 31 0,91
9 Bontang 15 18 1,20 15 20 1,33
10 Samarinda 53 41 0,77 53 43 0,81
Jumlah 1017 409 0.40 1018 444 0.44
. g . i d
4
54
,
1,20
0,7 .
h t t p : / / k a l t
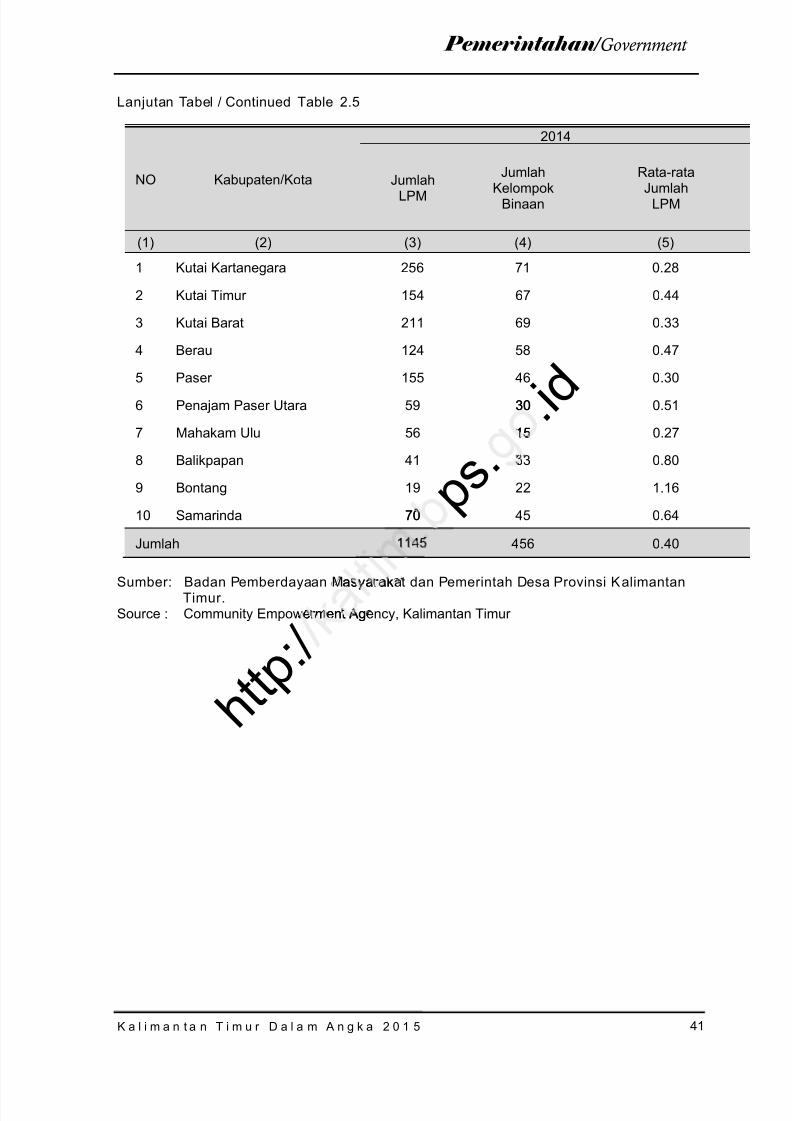
8/20/2019 Kalimantan Timur Dalam Angka Tahun 2015
http://slidepdf.com/reader/full/kalimantan-timur-dalam-angka-tahun-2015 107/623
41K a l i m a n t a n T i m u r D a l a m A n g k a 2 0 1 5
Pemerintahan / Government
Lanjutan Tabel / Continued Table 2.5
NO Kabupaten/Kota
2014
JumlahLPM
Jumlah
KelompokBinaan
Rata-rata
JumlahLPM
(1) (2) (3) (4) (5)
1 Kutai Kartanegara 256 71 0.28
2 Kutai Timur 154 67 0.44
3 Kutai Barat 211 69 0.33
4 Berau 124 58 0.47
5 Paser 155 46 0.306 Penajam Paser Utara 59 30 0.51
7 Mahakam Ulu 56 15 0.27
8 Balikpapan 41 33 0.80
9 Bontang 19 22 1.16
10 Samarinda 70 45 0.64
Jumlah 1145 456 0.40
Sumber: Badan Pemberdayaan Masyarakat dan Pemerintah Desa Provinsi KalimantanTimur.
Source : Community Empowerment Agency, Kalimantan Timur
p s .
. i d30
15
70
h t t p : /
asyara k
erment Ag
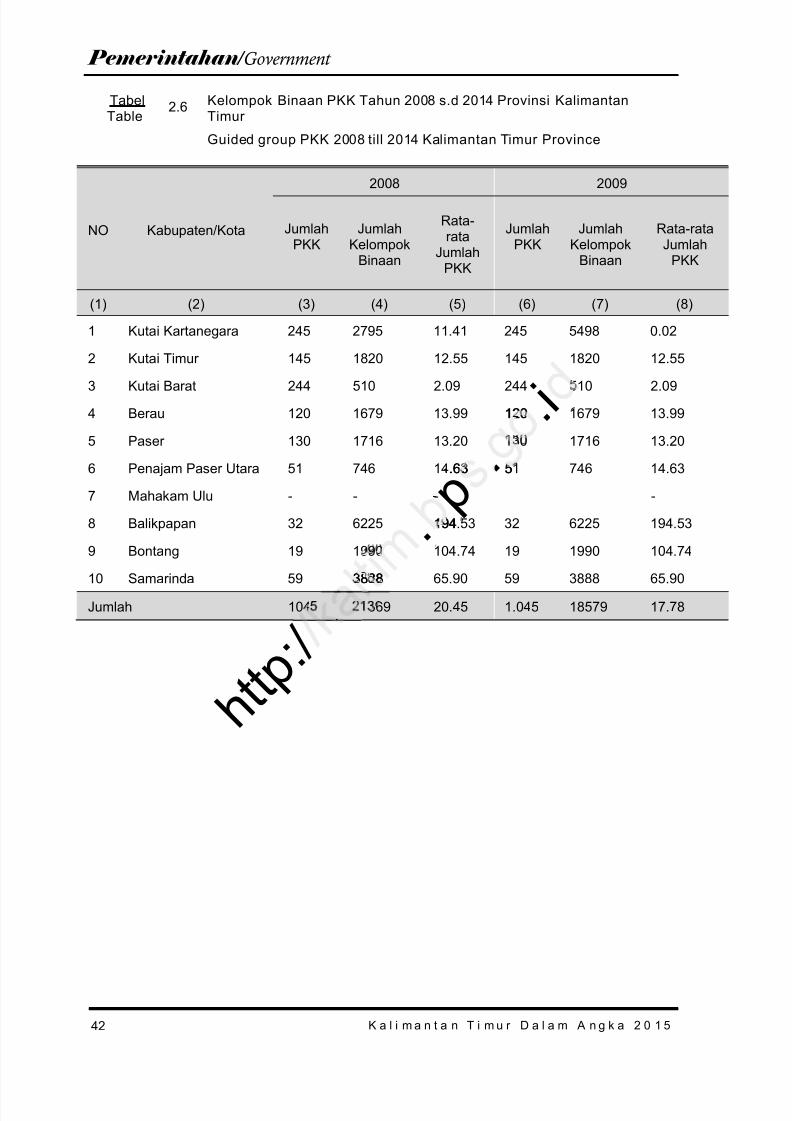
8/20/2019 Kalimantan Timur Dalam Angka Tahun 2015
http://slidepdf.com/reader/full/kalimantan-timur-dalam-angka-tahun-2015 108/623
42
Pemerintahan / Government
K a l i m a n t a n T i m u r D a l a m A n g k a 2 0 1 5
TabelTable
2.6 Kelompok Binaan PKK Tahun 2008 s.d 2014 Provinsi KalimantanTimur
Guided group PKK 2008 till 2014 Kalimantan Timur Province
NO Kabupaten/Kota
2008 2009
JumlahPKK
JumlahKelompok
Binaan
Rata-rata
JumlahPKK
JumlahPKK
JumlahKelompok
Binaan
Rata-rataJumlah
PKK
(1) (2) (3) (4) (5) (6) (7) (8)
1 Kutai Kartanegara 245 2795 11.41 245 5498 0.02
2 Kutai Timur 145 1820 12.55 145 1820 12.55
3 Kutai Barat 244 510 2.09 244 510 2.09
4 Berau 120 1679 13.99 120 1679 13.99
5 Paser 130 1716 13.20 130 1716 13.20
6 Penajam Paser Utara 51 746 14.63 51 746 14.63
7 Mahakam Ulu - - - -
8 Balikpapan 32 6225 194.53 32 6225 194.53
9 Bontang 19 1990 104.74 19 1990 104.74
10 Samarinda 59 3888 65.90 59 3888 65.90
Jumlah 1045 21369 20.45 1.045 18579 17.78
. p .
. i120
.63 5
194
3888
h t t p : /
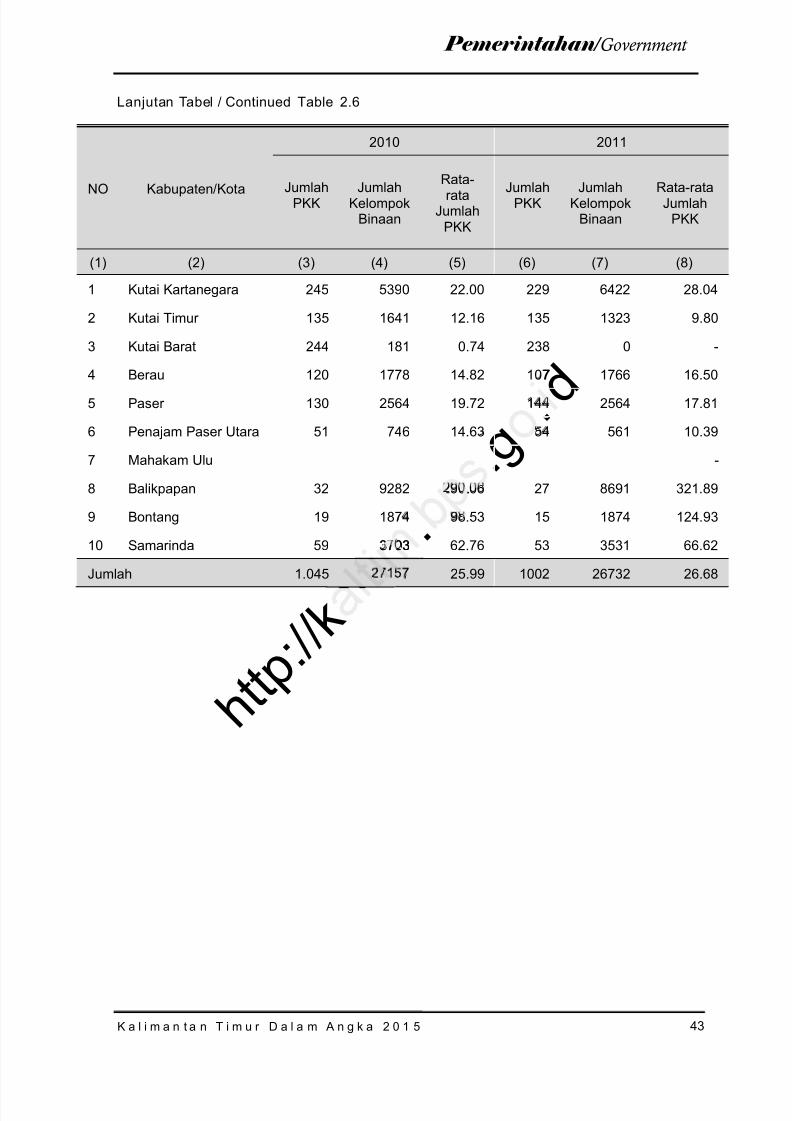
8/20/2019 Kalimantan Timur Dalam Angka Tahun 2015
http://slidepdf.com/reader/full/kalimantan-timur-dalam-angka-tahun-2015 109/623
43K a l i m a n t a n T i m u r D a l a m A n g k a 2 0 1 5
Pemerintahan / Government
Lanjutan Tabel / Continued Table 2.6
NO Kabupaten/Kota
2010 2011
JumlahPKK JumlahKelompokBinaan
Rata-rata
JumlahPKK
JumlahPKK JumlahKelompokBinaan
Rata-rataJumlahPKK
(1) (2) (3) (4) (5) (6) (7) (8)
1 Kutai Kartanegara 245 5390 22.00 229 6422 28.04
2 Kutai Timur 135 1641 12.16 135 1323 9.80
3 Kutai Barat 244 181 0.74 238 0 -
4 Berau 120 1778 14.82 107 1766 16.50
5 Paser 130 2564 19.72 144 2564 17.81
6 Penajam Paser Utara 51 746 14.63 54 561 10.39
7 Mahakam Ulu -
8 Balikpapan 32 9282 290.06 27 8691 321.89
9 Bontang 19 1874 98.53 15 1874 124.93
10 Samarinda 59 3703 62.76 53 3531 66.62
Jumlah 1.045 27157 25.99 1002 26732 26.68
. . g
. d7
..
3703
h t t p : / / k
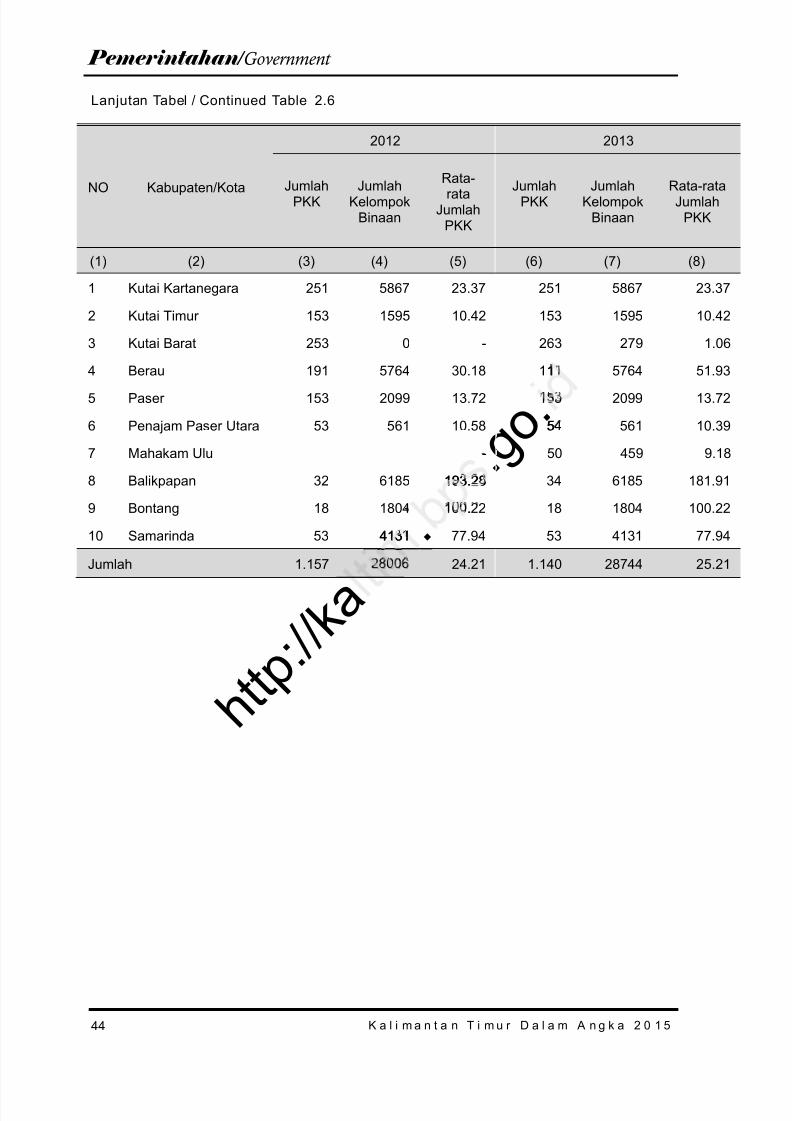
8/20/2019 Kalimantan Timur Dalam Angka Tahun 2015
http://slidepdf.com/reader/full/kalimantan-timur-dalam-angka-tahun-2015 110/623
44
Pemerintahan / Government
K a l i m a n t a n T i m u r D a l a m A n g k a 2 0 1 5
Lanjutan Tabel / Continued Table 2.6
NO Kabupaten/Kota
2012 2013
JumlahPKK JumlahKelompokBinaan
Rata-rata
JumlahPKK
JumlahPKK JumlahKelompokBinaan
Rata-rataJumlahPKK
(1) (2) (3) (4) (5) (6) (7) (8)
1 Kutai Kartanegara 251 5867 23.37 251 5867 23.37
2 Kutai Timur 153 1595 10.42 153 1595 10.42
3 Kutai Barat 253 0 - 263 279 1.06
4 Berau 191 5764 30.18 111 5764 51.93
5 Paser 153 2099 13.72 153 2099 13.72
6 Penajam Paser Utara 53 561 10.58 54 561 10.39
7 Mahakam Ulu - 50 459 9.18
8 Balikpapan 32 6185 193.28 34 6185 181.91
9 Bontang 18 1804 100.22 18 1804 100.22
10 Samarinda 53 4131 77.94 53 4131 77.94
Jumlah 1.157 28006 24.21 1.140 28744 25.21
. . g o .
1
5
193.28
.
4131
h t t p : / / k a
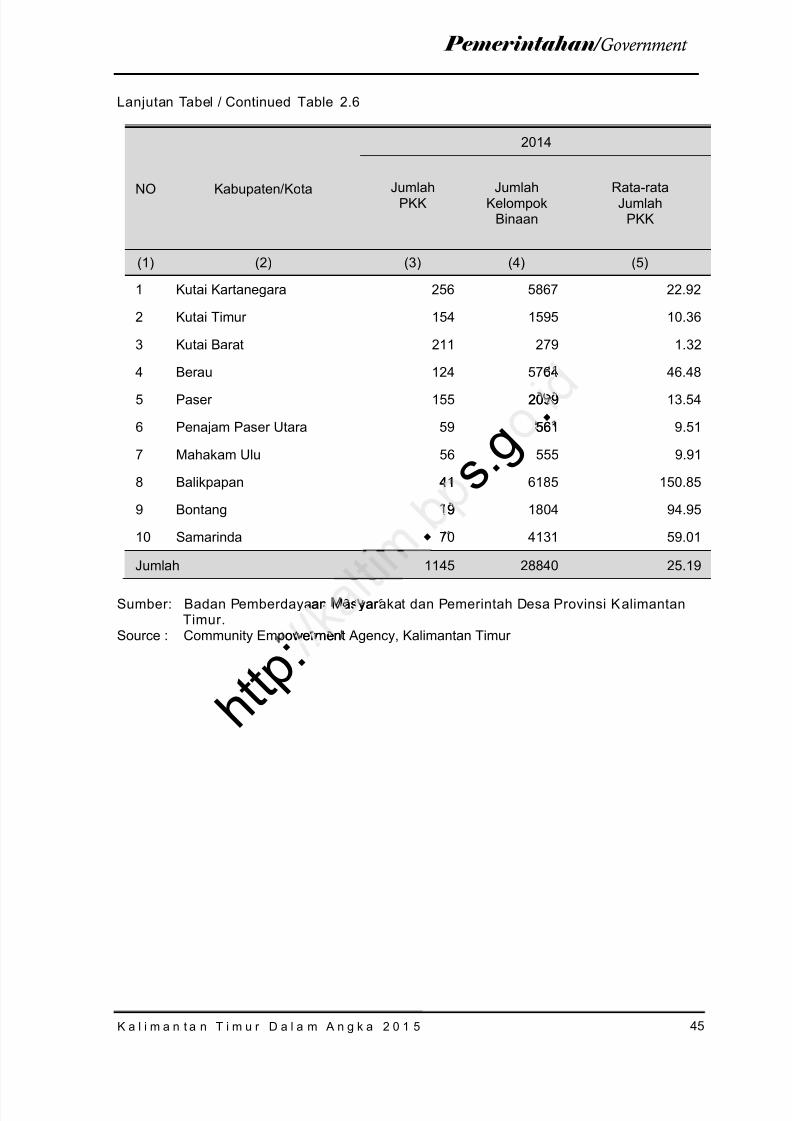
8/20/2019 Kalimantan Timur Dalam Angka Tahun 2015
http://slidepdf.com/reader/full/kalimantan-timur-dalam-angka-tahun-2015 111/623
45K a l i m a n t a n T i m u r D a l a m A n g k a 2 0 1 5
Pemerintahan / Government
Lanjutan Tabel / Continued Table 2.6
NO Kabupaten/Kota
2014
JumlahPKK JumlahKelompokBinaan
Rata-rataJumlahPKK
(1) (2) (3) (4) (5)
1 Kutai Kartanegara 256 5867 22.92
2 Kutai Timur 154 1595 10.36
3 Kutai Barat 211 279 1.32
4 Berau 124 5764 46.48
5 Paser 155 2099 13.54
6 Penajam Paser Utara 59 561 9.51
7 Mahakam Ulu 56 555 9.91
8 Balikpapan 41 6185 150.85
9 Bontang 19 1804 94.95
10 Samarinda 70 4131 59.01
Jumlah 1145 28840 25.19
Sumber: Badan Pemberdayaan Masyarakat dan Pemerintah Desa Provinsi KalimantanTimur.
Source : Community Empowerment Agency, Kalimantan Timur
. s . g
.4
2099
56
41
19
h t t p : an asyar
owermen
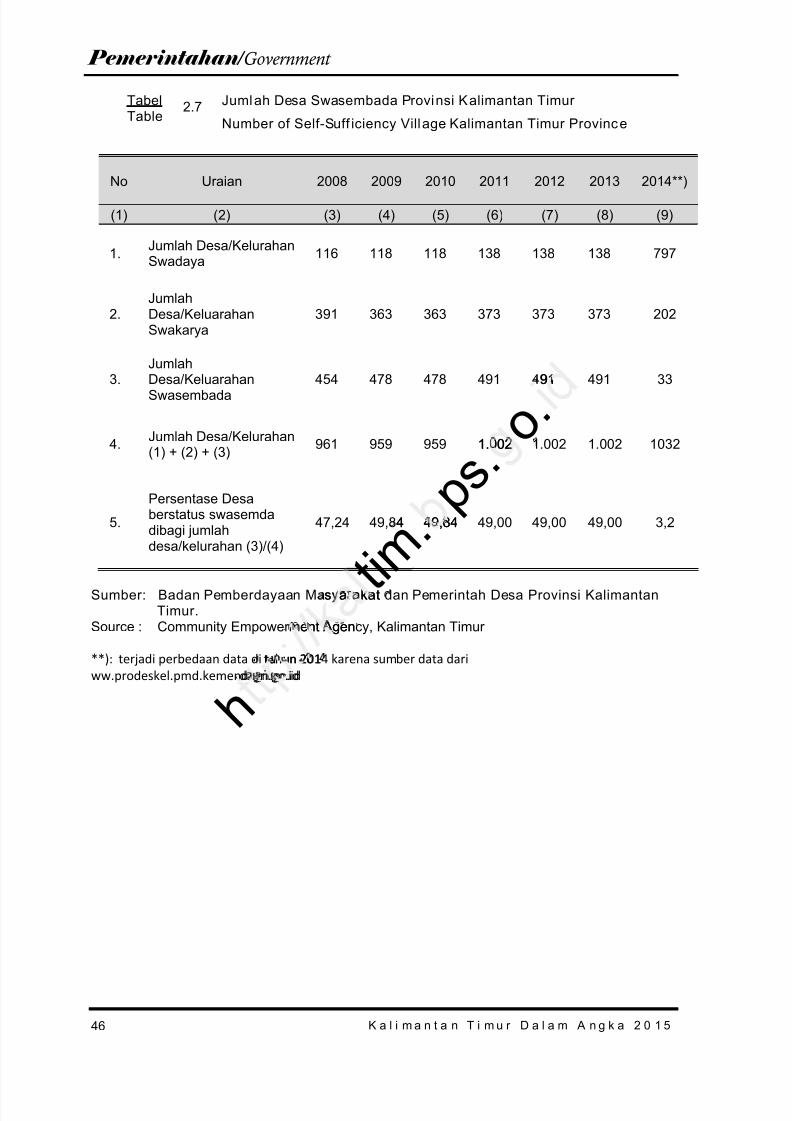
8/20/2019 Kalimantan Timur Dalam Angka Tahun 2015
http://slidepdf.com/reader/full/kalimantan-timur-dalam-angka-tahun-2015 112/623
46
Pemerintahan / Government
K a l i m a n t a n T i m u r D a l a m A n g k a 2 0 1 5
TabelTable
2.7 Jumlah Desa Swasembada Provinsi Kalimantan Timur
Number of Self-Suff iciency Village Kalimantan Timur Province
No Uraian 2008 2009 2010 2011 2012 2013 2014**)
(1) (2) (3) (4) (5) (6) (7) (8) (9)
1. Jumlah Desa/KelurahanSwadaya 116 118 118 138 138 138 797
2.JumlahDesa/KeluarahanSwakarya
391 363 363 373 373 373 202
3.
Jumlah
Desa/KeluarahanSwasembada 454 478 478 491 491 491 33
4. Jumlah Desa/Kelurahan(1) + (2) + (3) 961 959 959 1.002 1.002 1.002 1032
5.
Persentase Desaberstatus swasemdadibagi jumlahdesa/kelurahan (3)/(4)
47,24 49,84 49,84 49,00 49,00 49,00 3,2
Sumber: Badan Pemberdayaan Masyarakat dan Pemerintah Desa Provinsi KalimantanTimur.
Source : Community Empowerment Agency, Kalimantan Timur
**): terjadi perbedaan data di tahun 2014 karena sumber data dariww.prodeskel.pmd.kemendagri.go.id
t i m . p
s . o .
91
1.002
4 49,84
h
syarakat
en t Agen
tahun 201dagri.go.id.i
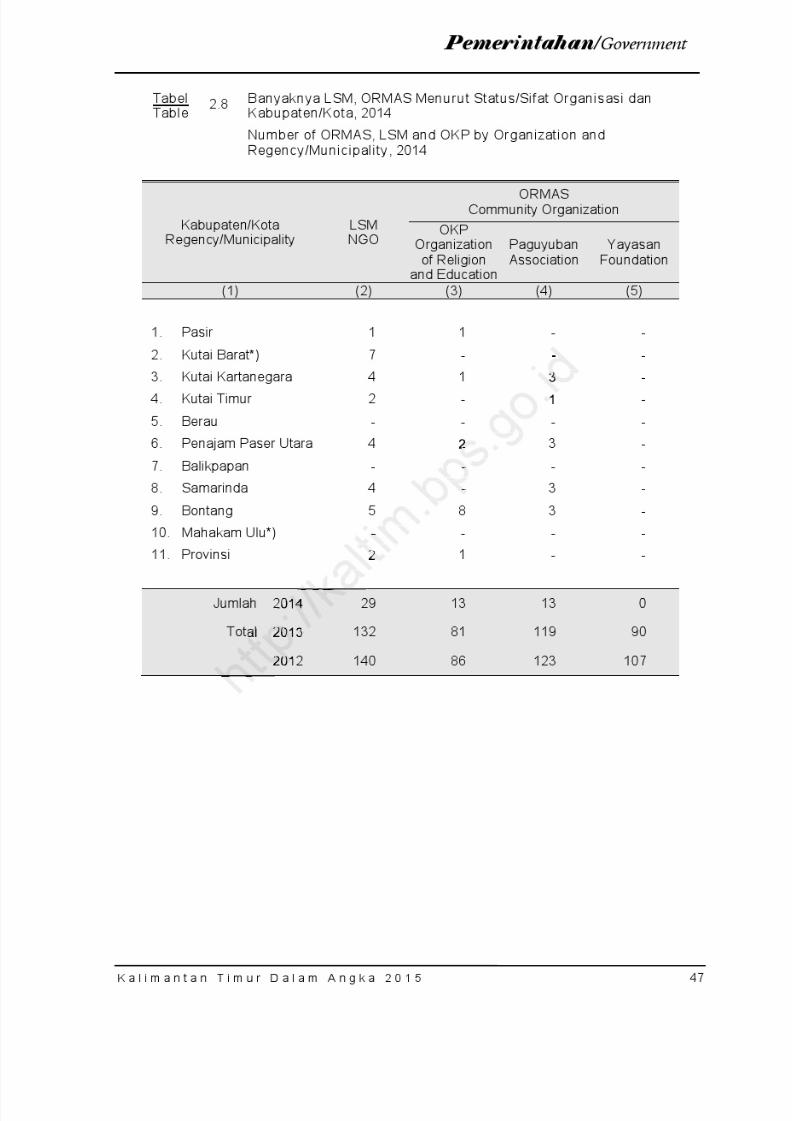
8/20/2019 Kalimantan Timur Dalam Angka Tahun 2015
http://slidepdf.com/reader/full/kalimantan-timur-dalam-angka-tahun-2015 113/623

8/20/2019 Kalimantan Timur Dalam Angka Tahun 2015
http://slidepdf.com/reader/full/kalimantan-timur-dalam-angka-tahun-2015 114/623
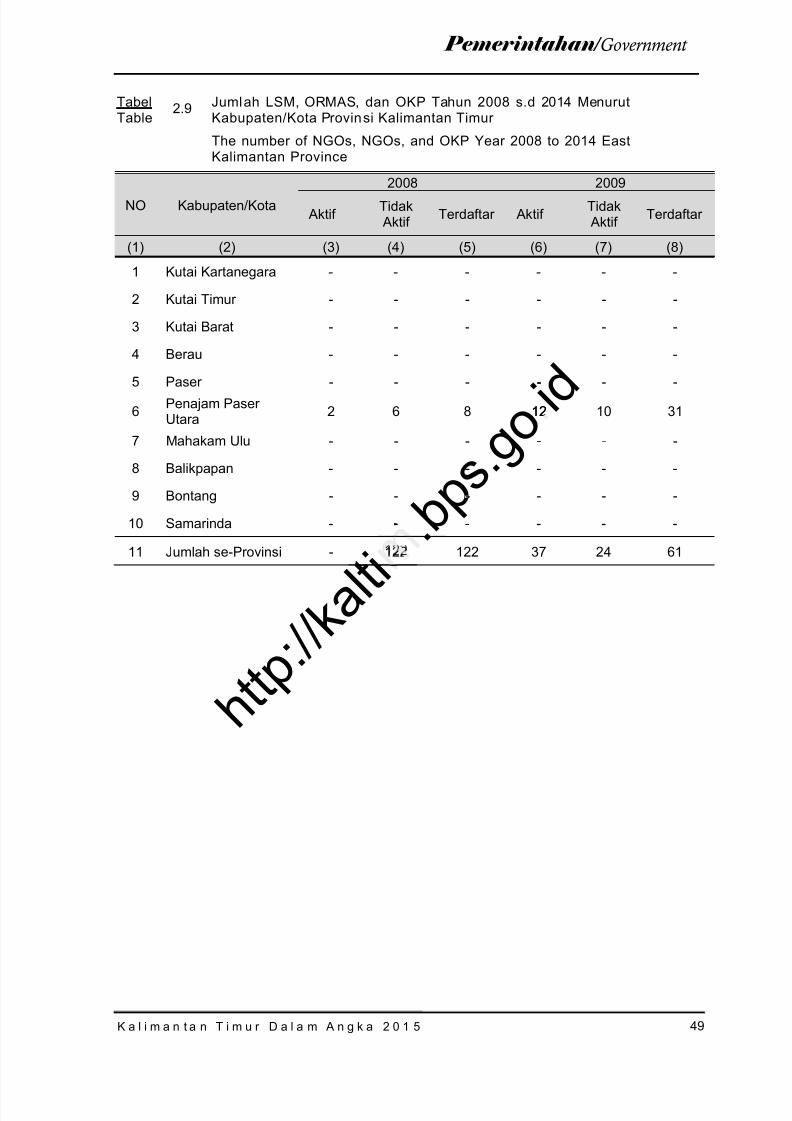
8/20/2019 Kalimantan Timur Dalam Angka Tahun 2015
http://slidepdf.com/reader/full/kalimantan-timur-dalam-angka-tahun-2015 115/623
49K a l i m a n t a n T i m u r D a l a m A n g k a 2 0 1 5
Pemerintahan / Government
TabelTable
2.9 Jumlah LSM, ORMAS, dan OKP Tahun 2008 s.d 2014 MenurutKabupaten/Kota Provinsi Kalimantan Timur
The number of NGOs, NGOs, and OKP Year 2008 to 2014 EastKalimantan Province
NO Kabupaten/Kota
2008 2009
Aktif Tidak Aktif Terdaftar Aktif Tidak
Aktif Terdaftar
(1) (2) (3) (4) (5) (6) (7) (8)
1 Kutai Kartanegara - - - - - -
2 Kutai Timur - - - - - -
3 Kutai Barat - - - - - -
4 Berau - - - - - -
5 Paser - - - - - -6 Penajam Paser
Utara 2 6 8 12 10 31
7 Mahakam Ulu - - - - - -
8 Balikpapan - - - - - -
9 Bontang - - - - - -
10 Samarinda - - - - - -
11 Jumlah se-Provinsi - 122 122 37 24 61
h t t p : / / k a l t i
. b p s . g o i d
-12
-
-
--
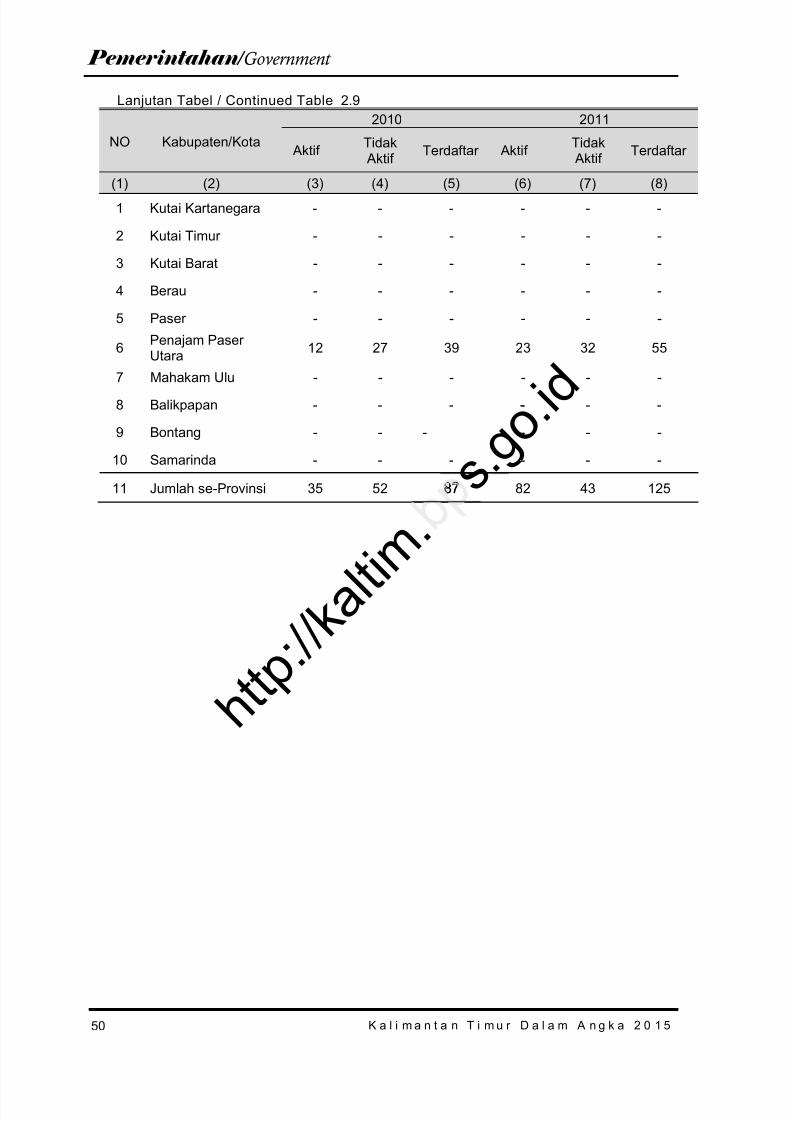
8/20/2019 Kalimantan Timur Dalam Angka Tahun 2015
http://slidepdf.com/reader/full/kalimantan-timur-dalam-angka-tahun-2015 116/623
50
Pemerintahan / Government
K a l i m a n t a n T i m u r D a l a m A n g k a 2 0 1 5
Lanjutan Tabel / Continued Table 2.9
NO Kabupaten/Kota
2010 2011
Aktif Tidak Aktif Terdaftar Aktif Tidak
Aktif Terdaftar
(1) (2) (3) (4) (5) (6) (7) (8)
1 Kutai Kartanegara - - - - - -
2 Kutai Timur - - - - - -
3 Kutai Barat - - - - - -
4 Berau - - - - - -
5 Paser - - - - - -
6 Penajam PaserUtara 12 27 39 23 32 55
7 Mahakam Ulu - - - - - -8 Balikpapan - - - - - -
9 Bontang - - - - - -
10 Samarinda - - - - - -
11 Jumlah se-Provinsi 35 52 87 82 43 125 s . g o . i d87
h t t p : / / k a l t i m
.
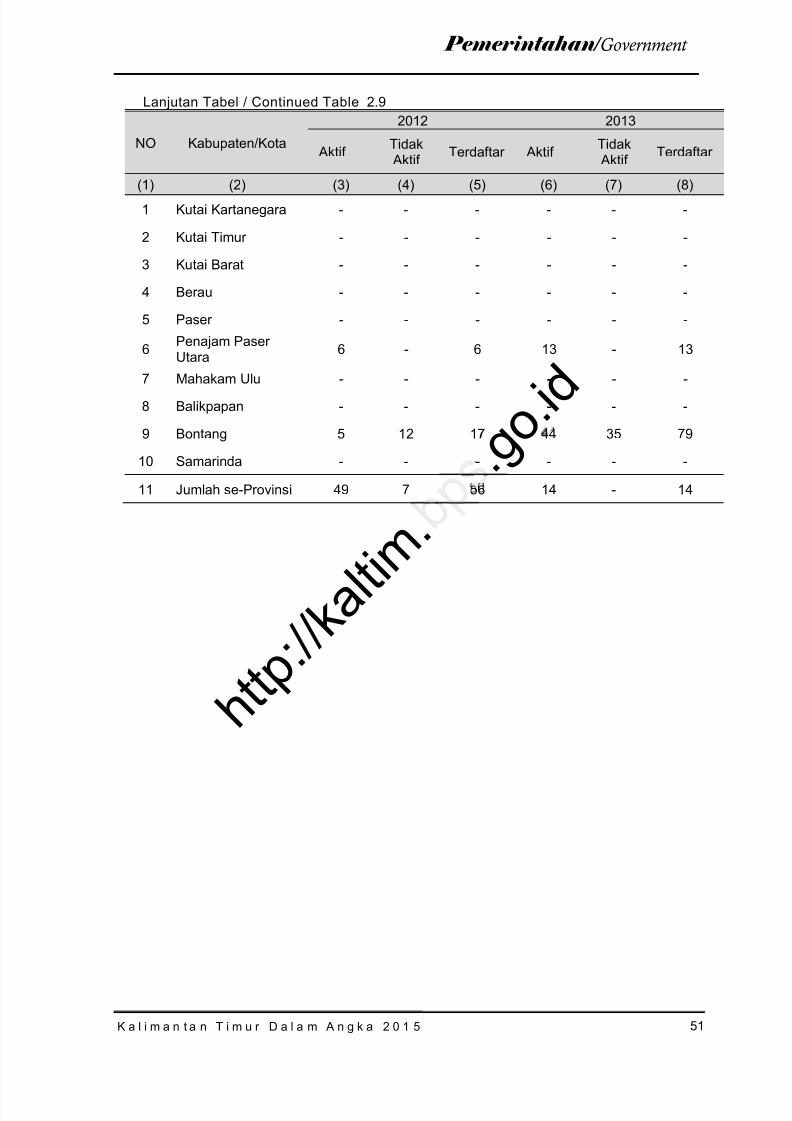
8/20/2019 Kalimantan Timur Dalam Angka Tahun 2015
http://slidepdf.com/reader/full/kalimantan-timur-dalam-angka-tahun-2015 117/623
51K a l i m a n t a n T i m u r D a l a m A n g k a 2 0 1 5
Pemerintahan / Government
Lanjutan Tabel / Continued Table 2.9
NO Kabupaten/Kota
2012 2013
Aktif Tidak Aktif Terdaftar Aktif Tidak
Aktif Terdaftar
(1) (2) (3) (4) (5) (6) (7) (8)1 Kutai Kartanegara - - - - - -
2 Kutai Timur - - - - - -
3 Kutai Barat - - - - - -
4 Berau - - - - - -
5 Paser - - - - - -
6 Penajam PaserUtara 6 - 6 13 - 13
7 Mahakam Ulu - - - - - -8 Balikpapan - - - - - -
9 Bontang 5 12 17 44 35 79
10 Samarinda - - - - - -
11 Jumlah se-Provinsi 49 7 56 14 - 14
. g o . i d--
-
h t t p : / / k a l t i m
.
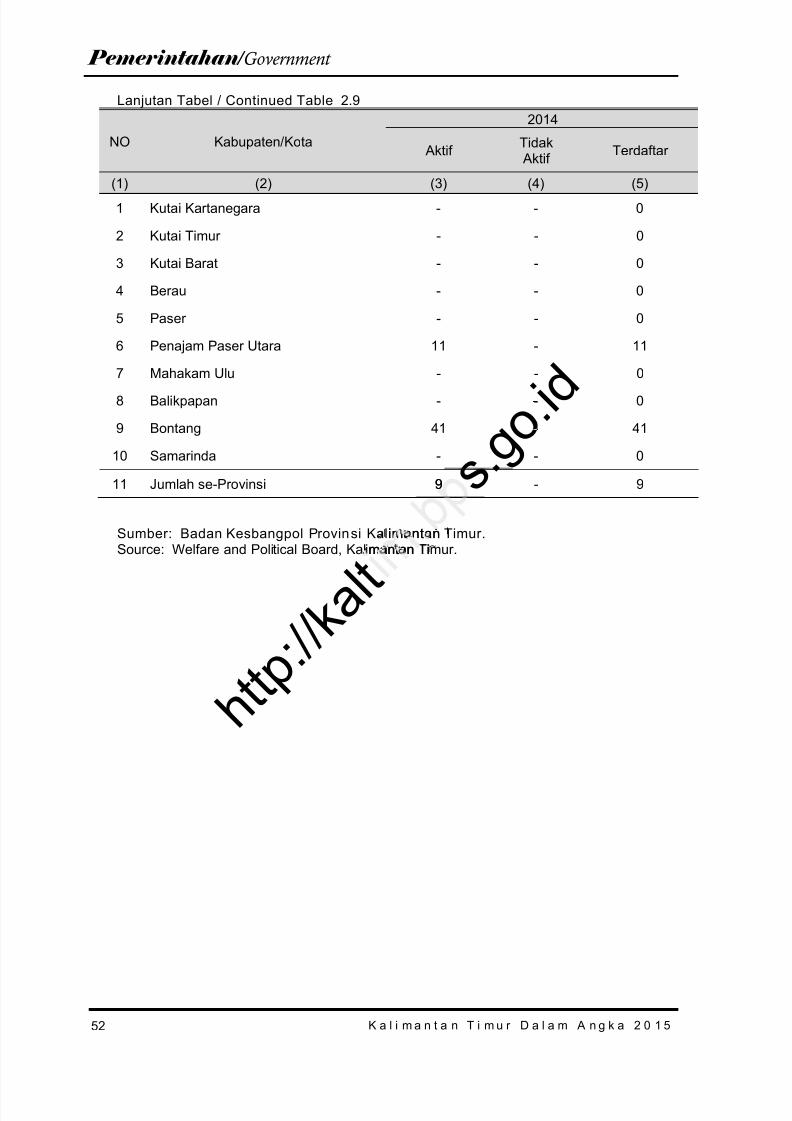
8/20/2019 Kalimantan Timur Dalam Angka Tahun 2015
http://slidepdf.com/reader/full/kalimantan-timur-dalam-angka-tahun-2015 118/623
52
Pemerintahan / Government
K a l i m a n t a n T i m u r D a l a m A n g k a 2 0 1 5
Lanjutan Tabel / Continued Table 2.9
NO Kabupaten/Kota
2014
Aktif Tidak Aktif Terdaftar
(1) (2) (3) (4) (5)
1 Kutai Kartanegara - - 0
2 Kutai Timur - - 0
3 Kutai Barat - - 0
4 Berau - - 0
5 Paser - - 0
6 Penajam Paser Utara 11 - 11
7 Mahakam Ulu - - 0
8 Balikpapan - - 0
9 Bontang 41 - 41
10 Samarinda - - 0
11 Jumlah se-Provinsi 9 - 9
Sumber: Badan Kesbangpol Provinsi Kalimantan Timur.Source: Welfare and Political Board, Kalimantan Timur .
s . g o . i d9
imantan
h t t p : / / k a l t
man tan Ti
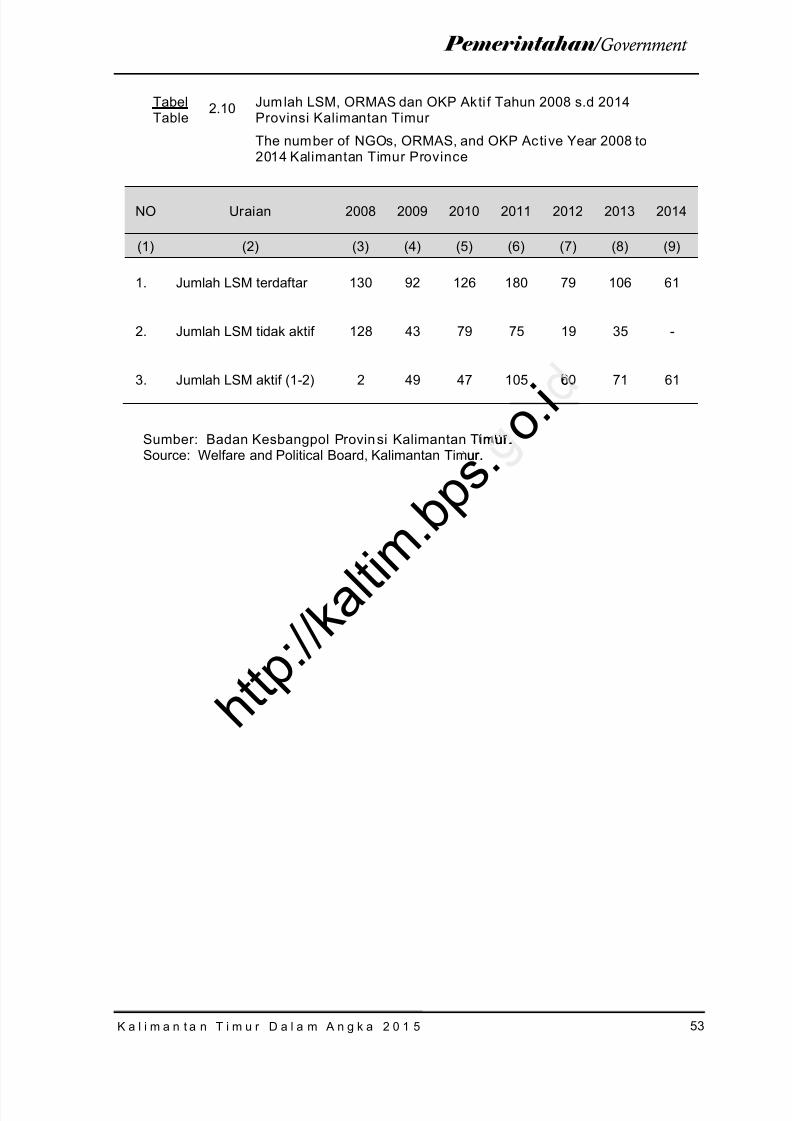
8/20/2019 Kalimantan Timur Dalam Angka Tahun 2015
http://slidepdf.com/reader/full/kalimantan-timur-dalam-angka-tahun-2015 119/623
53K a l i m a n t a n T i m u r D a l a m A n g k a 2 0 1 5
Pemerintahan / Government
TabelTable
2.10 Jumlah LSM, ORMAS dan OKP Aktif Tahun 2008 s.d 2014Provinsi Kalimantan Timur
The number of NGOs, ORMAS, and OKP Active Year 2008 to2014 Kalimantan Timur Province
NO Uraian 2008 2009 2010 2011 2012 2013 2014
(1) (2) (3) (4) (5) (6) (7) (8) (9)
1. Jumlah LSM terdaftar 130 92 126 180 79 106 61
2. Jumlah LSM tidak aktif 128 43 79 75 19 35 -
3. Jumlah LSM aktif (1-2) 2 49 47 105 60 71 61
Sumber: Badan Kesbangpol Provin si Kalimantan Timur.Source: Welfare and Political Board, Kalimantan Timur .
h t t p : / / k a l t i m
. b p s .
o . i6 mur. .
ur .
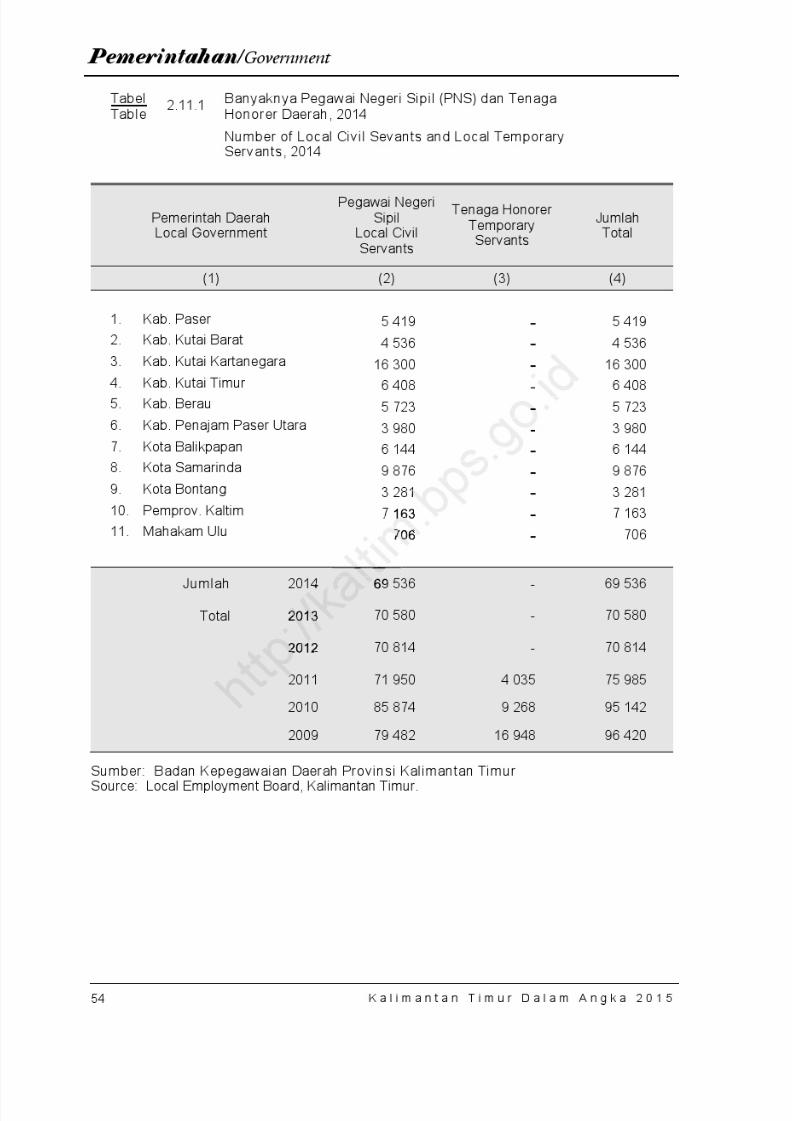
8/20/2019 Kalimantan Timur Dalam Angka Tahun 2015
http://slidepdf.com/reader/full/kalimantan-timur-dalam-angka-tahun-2015 120/623
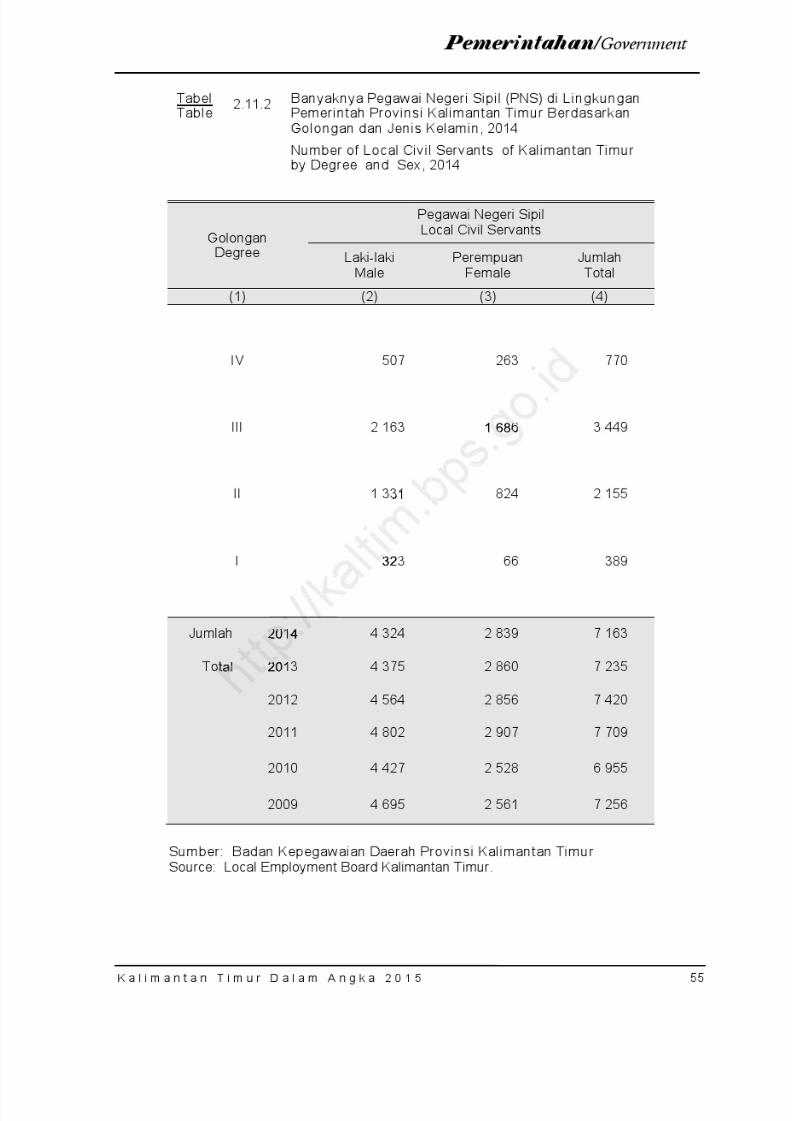
8/20/2019 Kalimantan Timur Dalam Angka Tahun 2015
http://slidepdf.com/reader/full/kalimantan-timur-dalam-angka-tahun-2015 121/623
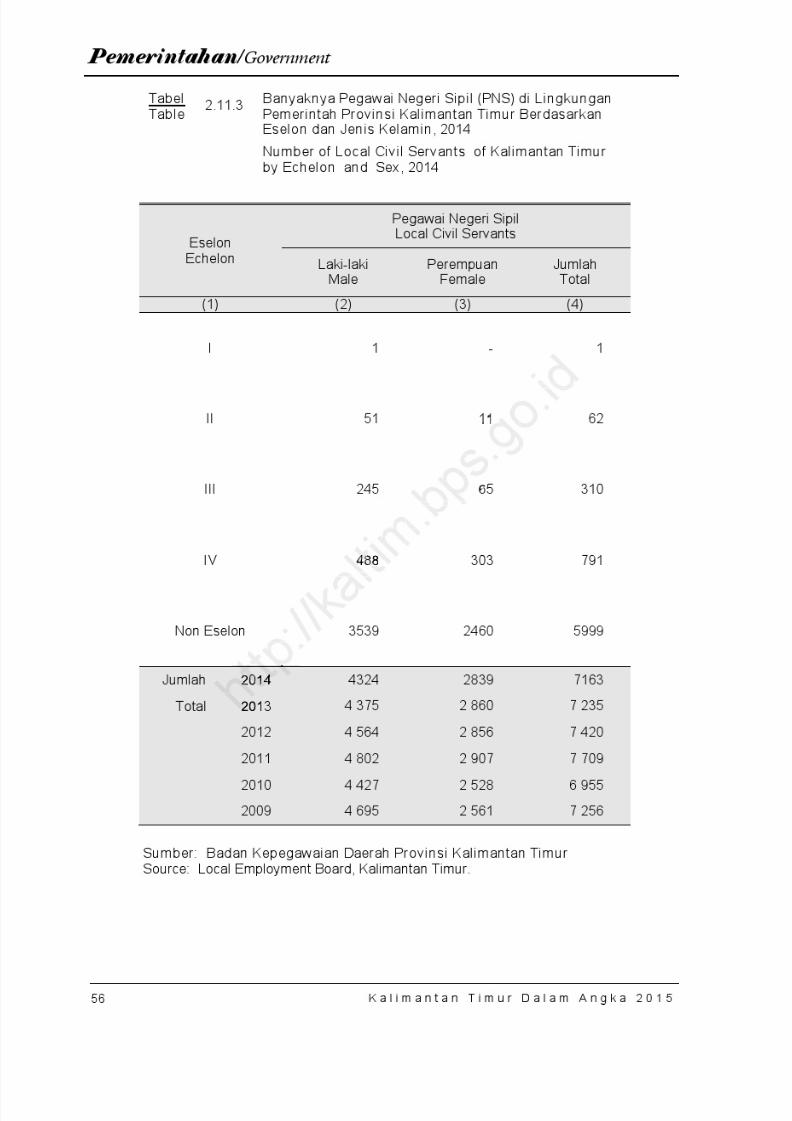
8/20/2019 Kalimantan Timur Dalam Angka Tahun 2015
http://slidepdf.com/reader/full/kalimantan-timur-dalam-angka-tahun-2015 122/623

8/20/2019 Kalimantan Timur Dalam Angka Tahun 2015
http://slidepdf.com/reader/full/kalimantan-timur-dalam-angka-tahun-2015 123/623
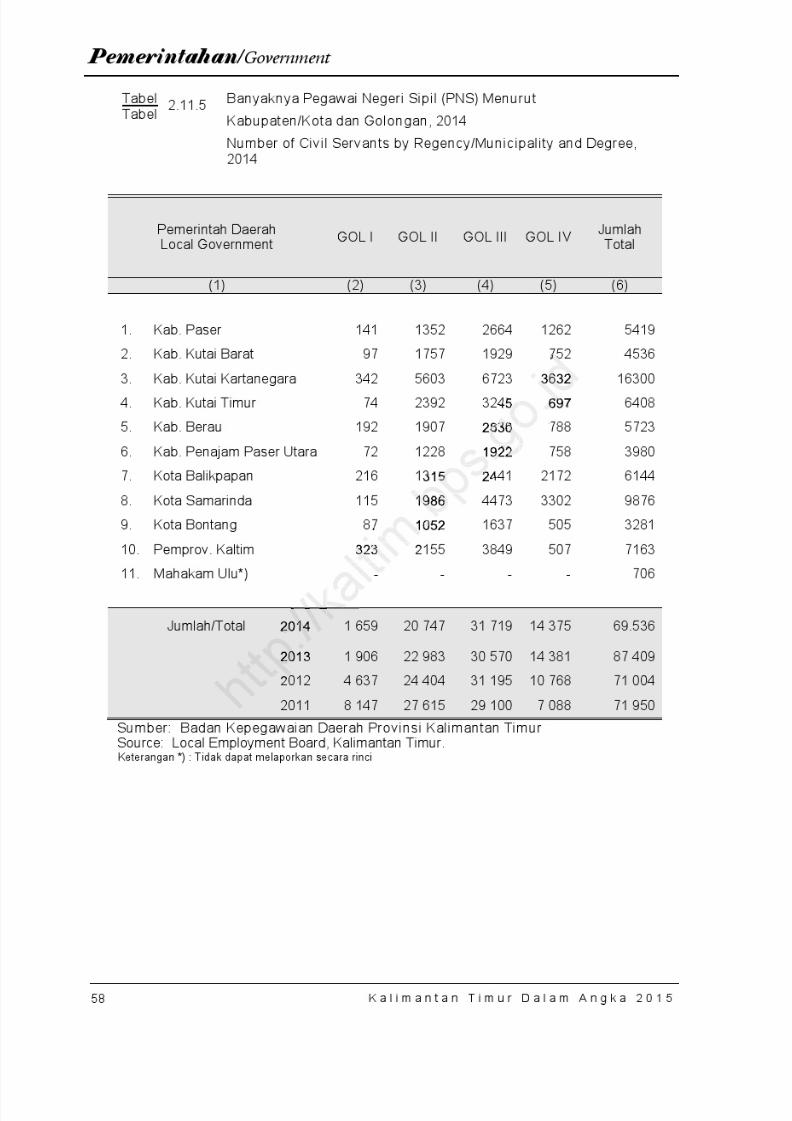
8/20/2019 Kalimantan Timur Dalam Angka Tahun 2015
http://slidepdf.com/reader/full/kalimantan-timur-dalam-angka-tahun-2015 124/623
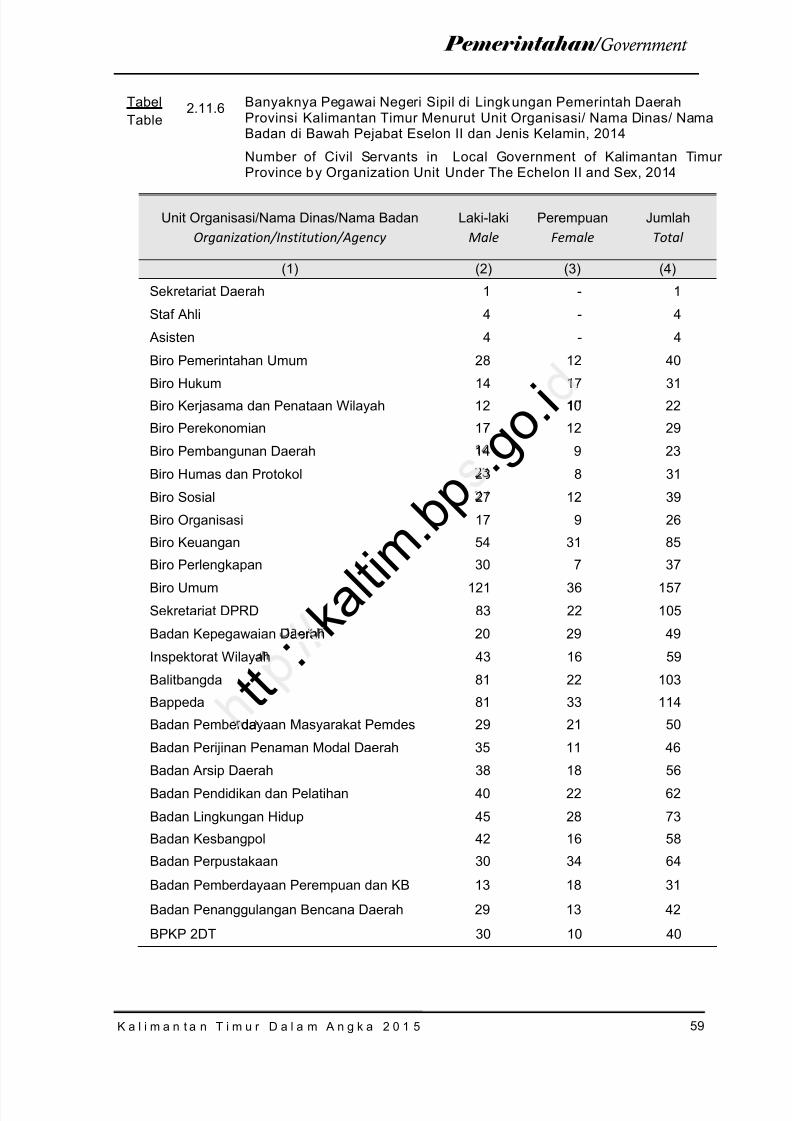
8/20/2019 Kalimantan Timur Dalam Angka Tahun 2015
http://slidepdf.com/reader/full/kalimantan-timur-dalam-angka-tahun-2015 125/623
59K a l i m a n t a n T i m u r D a l a m A n g k a 2 0 1 5
Pemerintahan / Government
TabelTable
2.11.6 Banyaknya Pegawai Negeri Sipil di Lingkungan Pemerintah DaerahProvinsi Kalimantan Timur Menurut Unit Organisasi/ Nama Dinas/ NamaBadan di Bawah Pejabat Eselon II dan Jenis Kelamin, 2014
Number of Civil Servants in Local Government of Kalimantan TimurProvince by Organization Unit Under The Echelon II and Sex, 2014
Unit Organisasi/Nama Dinas/Nama BadanOrganization/Institution/Agency
Laki-lakiMale
PerempuanFemale
JumlahTotal
(1) (2) (3) (4)
Sekretariat Daerah 1 - 1
Staf Ahli 4 - 4
Asisten 4 - 4
Biro Pemerintahan Umum 28 12 40
Biro Hukum 14 17 31Biro Kerjasama dan Penataan Wilayah 12 10 22
Biro Perekonomian 17 12 29
Biro Pembangunan Daerah 14 9 23
Biro Humas dan Protokol 23 8 31
Biro Sosial 27 12 39
Biro Organisasi 17 9 26
Biro Keuangan 54 31 85
Biro Perlengkapan 30 7 37
Biro Umum 121 36 157
Sekretariat DPRD 83 22 105
Badan Kepegawaian Daerah 20 29 49
Inspektorat Wilayah 43 16 59
Balitbangda 81 22 103
Bappeda 81 33 114
Badan Pemberdayaan Masyarakat Pemdes 29 21 50
Badan Perijinan Penaman Modal Daerah 35 11 46
Badan Arsip Daerah 38 18 56Badan Pendidikan dan Pelatihan 40 22 62
Badan Lingkungan Hidup 45 28 73
Badan Kesbangpol 42 16 58
Badan Perpustakaan 30 34 64
Badan Pemberdayaan Perempuan dan KB 13 18 31
Badan Penanggulangan Bencana Daerah 29 13 42
BPKP 2DT 30 10 40
t t : k a l t i m
. b p . g o . i1
aera
da

8/20/2019 Kalimantan Timur Dalam Angka Tahun 2015
http://slidepdf.com/reader/full/kalimantan-timur-dalam-angka-tahun-2015 126/623
60
Pemerintahan / Government
K a l i m a n t a n T i m u r D a l a m A n g k a 2 0 1 5
Lanjutan Tabel / Continued Table 2.11.6
Unit Organisasi/Nama Dinas/Nama BadanOrganization/Institution/Agency
Laki-lakiMale
PerempuanFemale
JumlahTotal
(1) (2) (3) (4)
Badan Ketahanan Pangan dan Penyuluhan 40 21 61
Dinas Kehutanan 429 66 495
Dinas Kelautan dan Perikanan 98 58 156
Dinas Kesehatan 141 88 229
Dinas Pendapata Daerah 218 101 319
Dinas Perhubungan 84 21 105
Dinas Pertanian Tanaman Pangan 178 63 241Dinas Sosial 150 80 230
Dinas Pendidikan 133 103 226Distambang 66 16 82
Disperindagkop dan UMKM 115 47 162
Dinas PU 412 108 520
Dinas Perkebunan 68 47 115
Dinas Peternakan 62 54 116Dinas Kebudayaan dan Pariwisata 77 37 114Disnakertrans 99 55 154Dinas Pemuda dan Olah Raga 72 28 100
Diskominfo 30 13 43RSUD Wahab Syahranie Samarinda 330 505 835
RSUD Dr. Kanudjoso Djatiwibowo BPP 233 323 556
RSUD Tarakan 189 273 462
RSKD Atma Husada 71 71 142
Sekretariat Korpri 17 12 29Satuan Polisi Pamong Praja 73 4 77Sekretariat KPID 9 2 11Kantor Penghubung 21 8 29
Jumlah /Total 2014 4 420 2 680 7 100
2013 4 375 2 860 7235
2012 4 420 2 680 7 152
2011 4 802 2 907 7 709
Sumber: Badan Kepegawaian Daerah Provinsi Kalimantan TimurSource: Local Employment Board, Kalimantan Timur.
t t p : a l t i m
p s .
. d16
10
27799
o BPP
Praja
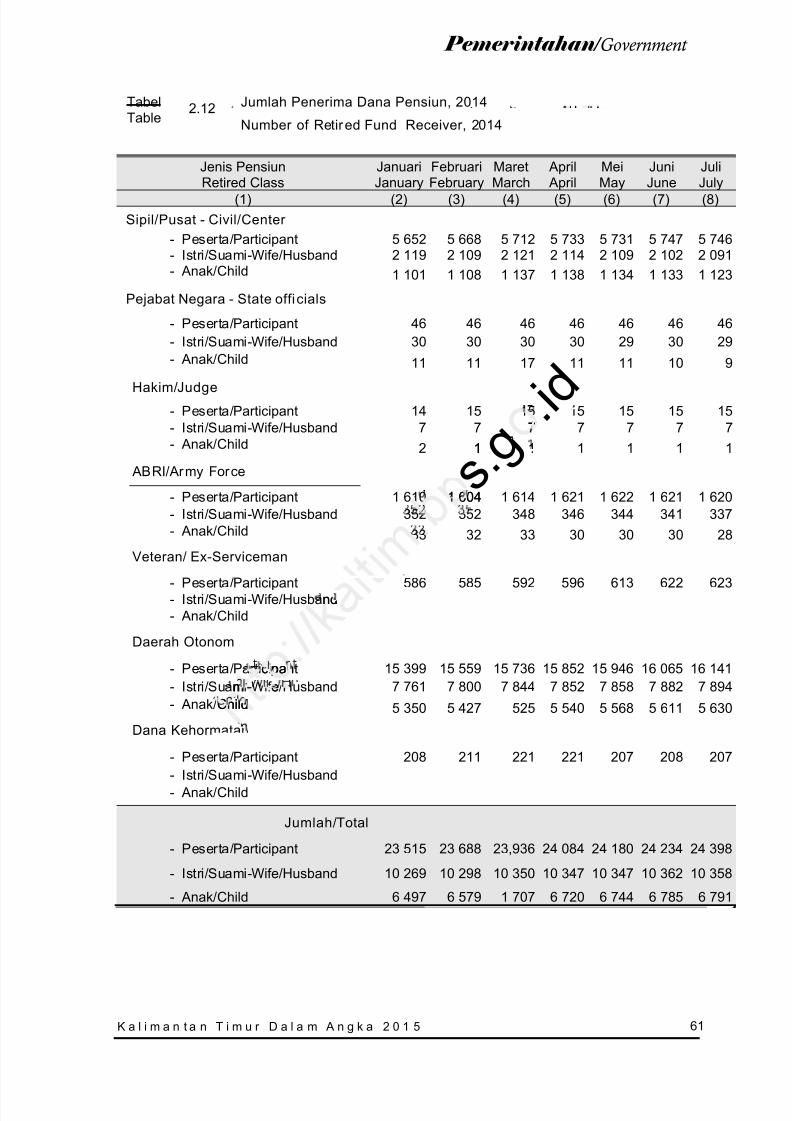
8/20/2019 Kalimantan Timur Dalam Angka Tahun 2015
http://slidepdf.com/reader/full/kalimantan-timur-dalam-angka-tahun-2015 127/623
61K a l i m a n t a n T i m u r D a l a m A n g k a 2 0 1 5
Pemerintahan / Government
TabelTable
2.12 Jumlah Penerima Dana Pensiun, 2014
Number of Retir ed Fund Receiver, 2014
Jenis PensiunRetired Class
JanuariJanuary
FebruariFebruary
MaretMarch
April April
MeiMay
JuniJune
JuliJuly
(1) (2) (3) (4) (5) (6) (7) (8)Sipil/Pusat - Civil/Center
- Peserta/ Participant 5 652 5 668 5 712 5 733 5 731 5 747 5 746- Istri/Suami- Wife/Husband 2 119 2 109 2 121 2 114 2 109 2 102 2 091- Anak/ Child 1 101 1 108 1 137 1 138 1 134 1 133 1 123
Pejabat Negara - State officials
- Peserta/ Participant 46 46 46 46 46 46 46- Istri/Suami- Wife/Husband 30 30 30 30 29 30 29- Anak/ Child 11 11 17 11 11 10 9
Hakim/Judge- Peserta/ Participant 14 15 15 15 15 15 15- Istri/Suami- Wife/Husband 7 7 7 7 7 7 7- Anak/ Child 2 1 1 1 1 1 1
ABRI/ Army Force
- Peserta/ Participant 1 610 1 604 1 614 1 621 1 622 1 621 1 620- Istri/Suami- Wife/Husband 352 352 348 346 344 341 337- Anak/ Child 33 32 33 30 30 30 28
Veteran/ Ex-Serviceman
- Peserta/ Participant 586 585 592 596 613 622 623- Istri/Suami- Wife/Husband- Anak/ Child
Daerah Otonom
- Peserta/ Participant 15 399 15 559 15 736 15 852 15 946 16 065 16 141- Istri/Suami- Wife/Husband 7 761 7 800 7 844 7 852 7 858 7 882 7 894- Anak/ Child 5 350 5 427 525 5 540 5 568 5 611 5 630
Dana Kehormatan
- Peserta/ Participant 208 211 221 221 207 208 207- Istri/Suami- Wife/Husband- Anak/ Child
Jumlah/ Total
- Peserta/ Participant 23 515 23 688 23,936 24 084 24 180 24 234 24 398
- Istri/Suami- Wife/Husband 10 269 10 298 10 350 10 347 10 347 10 362 10 358
- Anak/ Child 6 497 6 579 1 707 6 720 6 744 6 785 6 791
s . g . i d7
1
1 604
nd
r c panm - e
Child
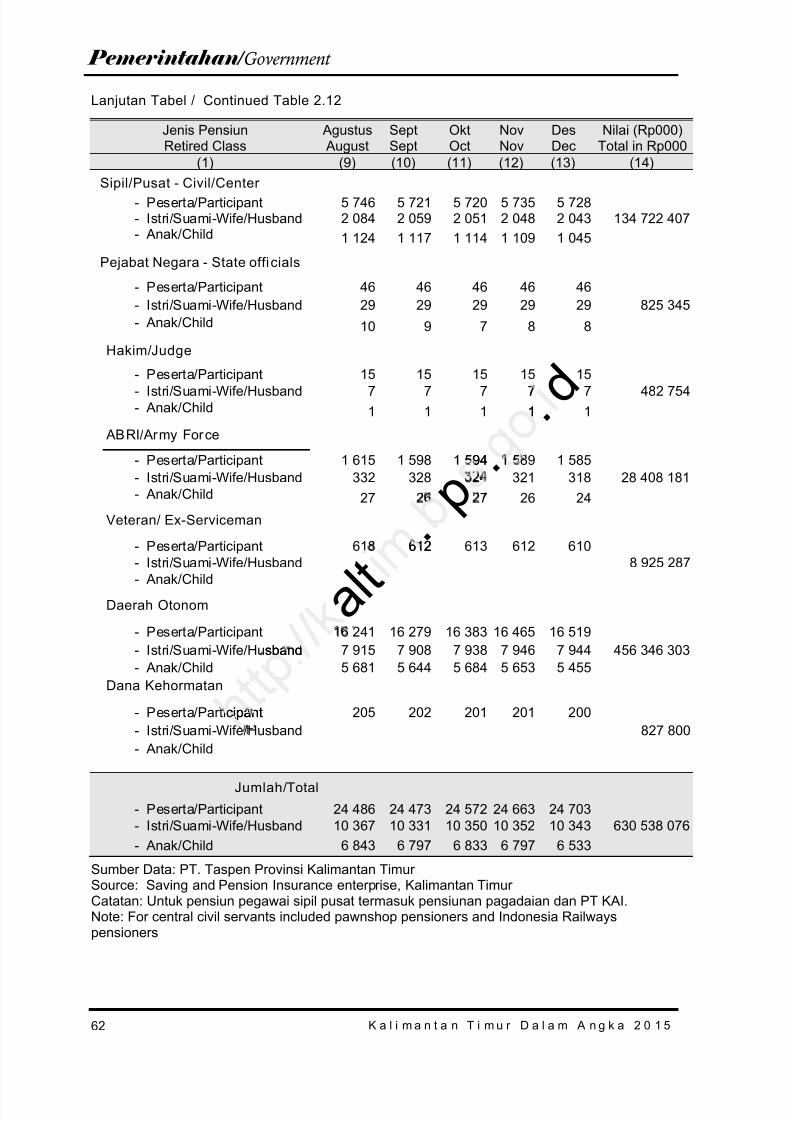
8/20/2019 Kalimantan Timur Dalam Angka Tahun 2015
http://slidepdf.com/reader/full/kalimantan-timur-dalam-angka-tahun-2015 128/623
62
Pemerintahan / Government
K a l i m a n t a n T i m u r D a l a m A n g k a 2 0 1 5
Lanjutan Tabel / Continued Table 2.12
Jenis PensiunRetired Class
Agustus August
SeptSept
OktOct
NovNov
DesDec
Nilai (Rp000)Total in Rp000
(1) (9) (10) (11) (12) (13) (14)Sipil/Pusat - Civil/Center
- Peserta/ Participant 5 746 5 721 5 720 5 735 5 728- Istri/Suami- Wife/Husband 2 084 2 059 2 051 2 048 2 043 134 722 407- Anak/ Child 1 124 1 117 1 114 1 109 1 045
Pejabat Negara - State officials
- Peserta/ Participant 46 46 46 46 46- Istri/Suami- Wife/Husband 29 29 29 29 29 825 345- Anak/ Child 10 9 7 8 8
Hakim/ Judge
- Peserta/ Participant 15 15 15 15 15- Istri/Suami- Wife/Husband 7 7 7 7 7 482 754- Anak/ Child 1 1 1 1 1
ABRI/ Army Force
- Peserta/ Participant 1 615 1 598 1 594 1 589 1 585- Istri/Suami- Wife/Husband 332 328 324 321 318 28 408 181- Anak/ Child 27 26 27 26 24
Veteran/ Ex-Serviceman
- Peserta/ Participant 618 612 613 612 610- Istri/Suami- Wife/Husband 8 925 287- Anak/ Child
Daerah Otonom
- Peserta/ Participant 16 241 16 279 16 383 16 465 16 519- Istri/Suami- Wife/Husband 7 915 7 908 7 938 7 946 7 944 456 346 303- Anak/ Child 5 681 5 644 5 684 5 653 5 455
Dana Kehormatan
- Peserta/ Participant 205 202 201 201 200- Istri/Suami- Wife/Husband 827 800- Anak/ Child
Jumlah/ Total- Peserta/ Participant 24 486 24 473 24 572 24 663 24 703- Istri/Suami- Wife/Husband 10 367 10 331 10 350 10 352 10 343 630 538 076- Anak/ Child 6 843 6 797 6 833 6 797 6 533
Sumber Data: PT. Taspen Provinsi Kalimantan Timur Source: Saving and Pension Insurance enterprise, Kalimantan TimurCatatan: Untuk pensiun pegawai sipil pusat termasuk pensiunan pagadaian dan PT KAI.Note: For central civil servants included pawnshop pensioners and Indonesia Railwayspensioners
a l t . p
. . d7
1
594 1 5
612
sband
cipantc
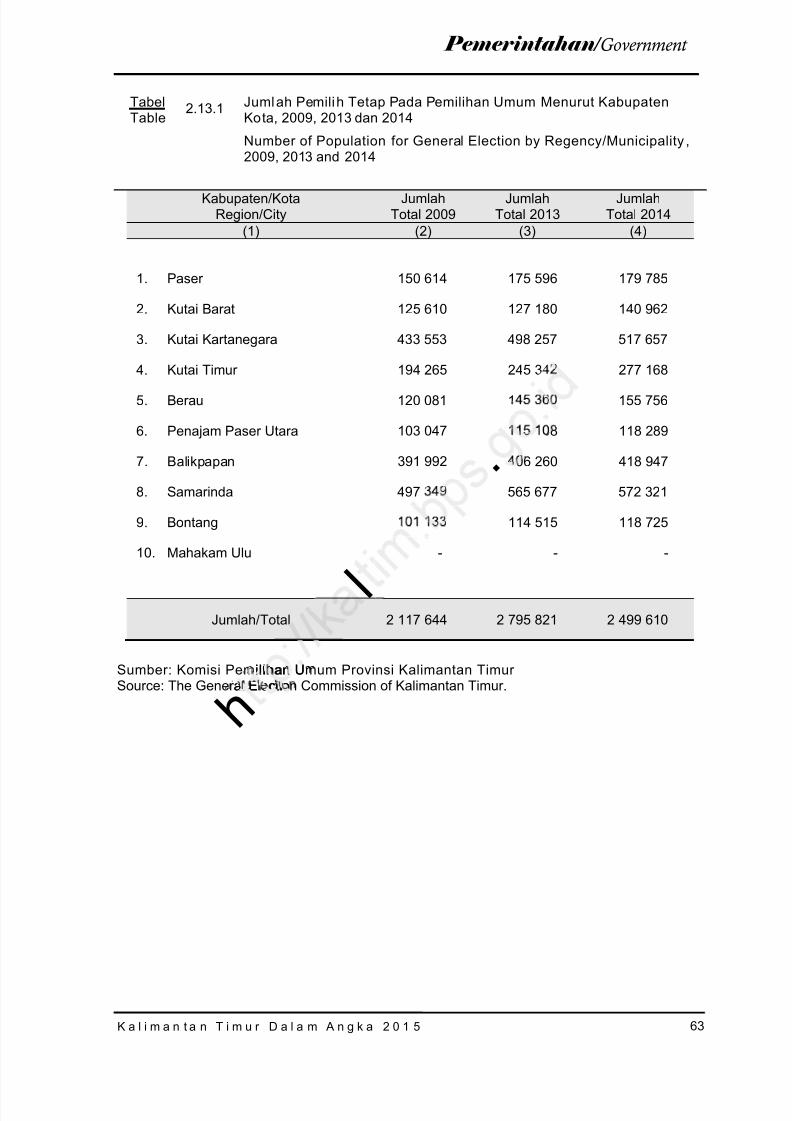
8/20/2019 Kalimantan Timur Dalam Angka Tahun 2015
http://slidepdf.com/reader/full/kalimantan-timur-dalam-angka-tahun-2015 129/623
63K a l i m a n t a n T i m u r D a l a m A n g k a 2 0 1 5
Pemerintahan / Government
TabelTable
2.13.1 Jumlah Pemilih Tetap Pada Pemilihan Umum Menurut KabupatenKota, 2009, 2013 dan 2014
Number of Population for General Election by Regency/Municipality ,2009, 2013 and 2014
Kabupaten/KotaRegion/City
JumlahTotal 2009
JumlahTotal 2013
JumlahTotal 2014
(1) (2) (3) (4)
1. Paser 150 614 175 596 179 785
2. Kutai Barat 125 610 127 180 140 962
3. Kutai Kartanegara 433 553 498 257 517 657
4. Kutai Timur 194 265 245 342 277 168
5. Berau 120 081 145 360 155 756
6. Penajam Paser Utara 103 047 115 108 118 289
7. Balikpapan 391 992 406 260 418 947
8. Samarinda 497 349 565 677 572 321
9. Bontang 101 133 114 515 118 725
10. Mahakam Ulu - - -
Jumlah/ Total 2 117 644 2 795 821 2 499 610
Sumber: Komisi Pemilihan Umum Provinsi Kalimantan Timur Source: The General Election Commission of Kalimantan Timur.
.
lilihan U
h al Electio
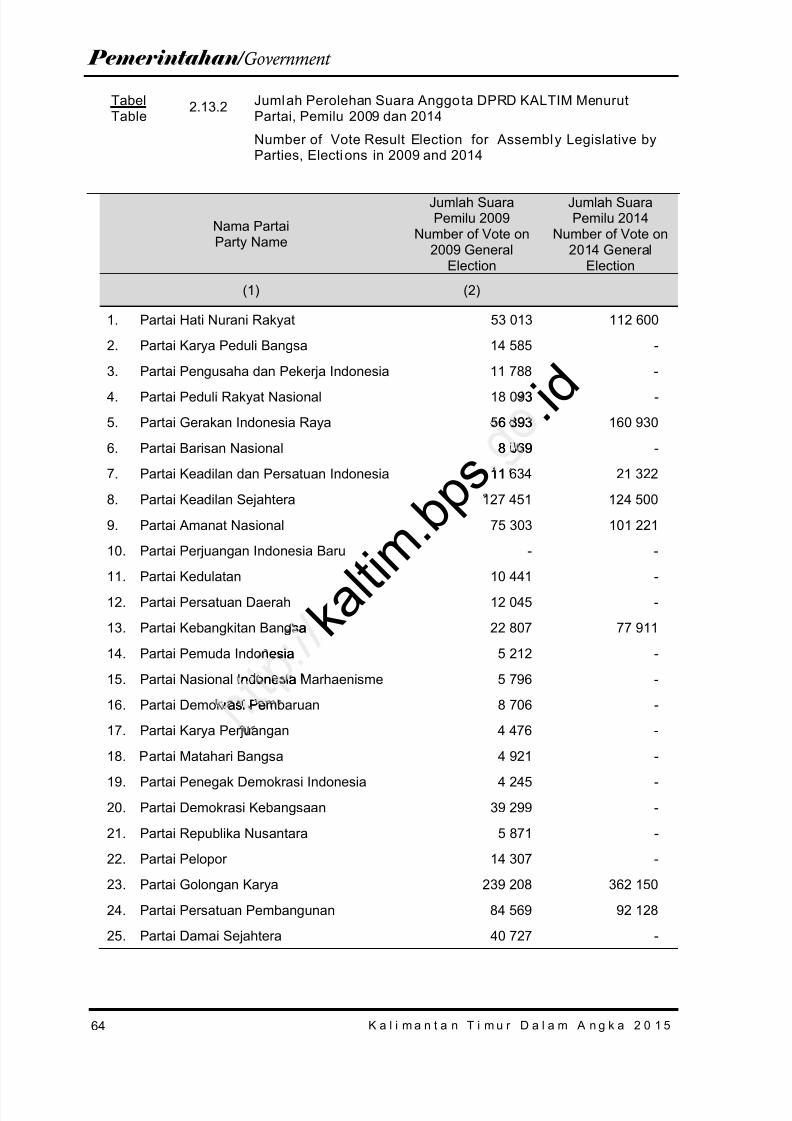
8/20/2019 Kalimantan Timur Dalam Angka Tahun 2015
http://slidepdf.com/reader/full/kalimantan-timur-dalam-angka-tahun-2015 130/623
64
Pemerintahan / Government
K a l i m a n t a n T i m u r D a l a m A n g k a 2 0 1 5
TabelTable
2.13.2 Jumlah Perolehan Suara Anggota DPRD KALTIM MenurutPartai, Pemilu 2009 dan 2014
Number of Vote Result Election for Assembly Legislative byParties, Electi ons in 2009 and 2014
Nama PartaiParty Name
Jumlah SuaraPemilu 2009
Number of Vote on2009 General
Election
Jumlah SuaraPemilu 2014
Number of Vote on2014 General
Election
(1) (2)
1. Partai Hati Nurani Rakyat 53 013 112 600
2. Partai Karya Peduli Bangsa 14 585 -
3. Partai Pengusaha dan Pekerja Indonesia 11 788 -
4. Partai Peduli Rakyat Nasional 18 093 -
5. Partai Gerakan Indonesia Raya 56 893 160 930
6. Partai Barisan Nasional 8 069 -
7. Partai Keadilan dan Persatuan Indonesia 11 634 21 322
8. Partai Keadilan Sejahtera 127 451 124 500
9. Partai Amanat Nasional 75 303 101 221
10. Partai Perjuangan Indonesia Baru - -
11. Partai Kedulatan 10 441 -12. Partai Persatuan Daerah 12 045 -
13. Partai Kebangkitan Bangsa 22 807 77 911
14. Partai Pemuda Indonesia 5 212 -
15. Partai Nasional Indonesia Marhaenisme 5 796 -
16. Partai Demokrasi Pembaruan 8 706 -
17. Partai Karya Perjuangan 4 476 -
18. Partai Matahari Bangsa 4 921 -
19. Partai Penegak Demokrasi Indonesia 4 245 -
20. Partai Demokrasi Kebangsaan 39 299 -
21. Partai Republika Nusantara 5 871 -
22. Partai Pelopor 14 307 -
23. Partai Golongan Karya 239 208 362 150
24. Partai Persatuan Pembangunan 84 569 92 128
25. Partai Damai Sejahtera 40 727 -
k a l t i m . b p
s . i d3
6 893
8 069
11
sa
esia
ndonesia
rasi Pe
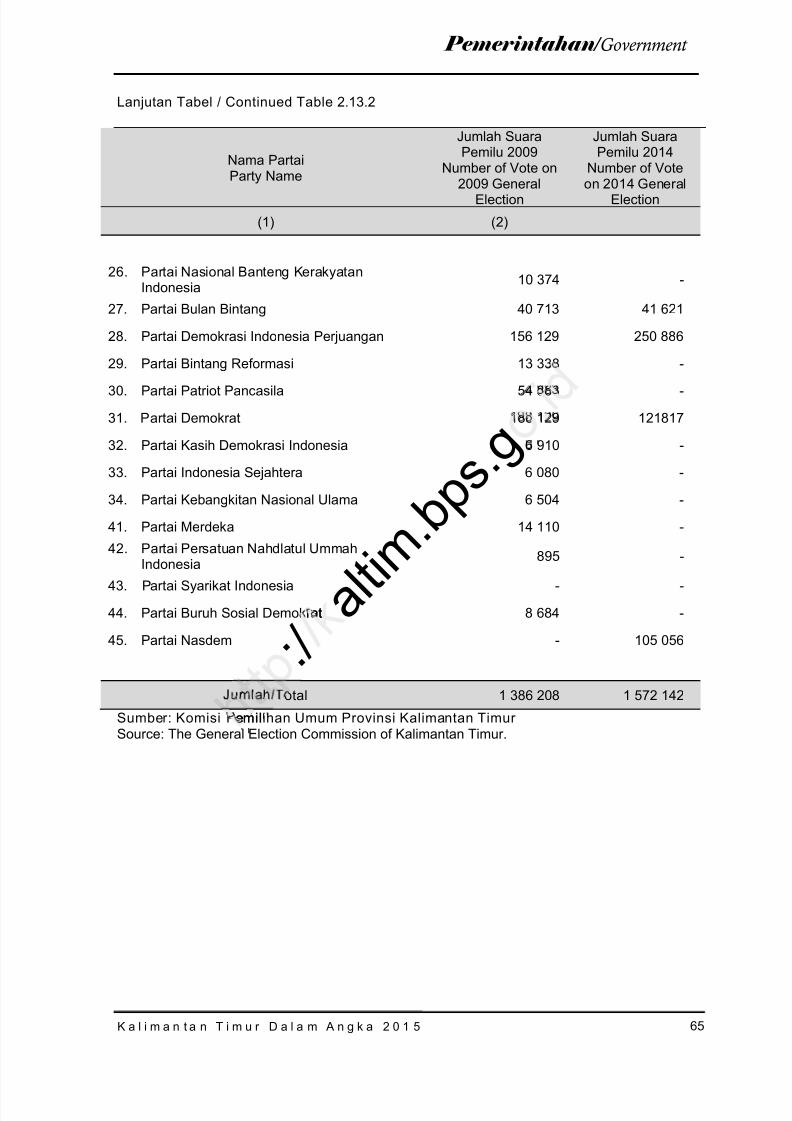
8/20/2019 Kalimantan Timur Dalam Angka Tahun 2015
http://slidepdf.com/reader/full/kalimantan-timur-dalam-angka-tahun-2015 131/623
65K a l i m a n t a n T i m u r D a l a m A n g k a 2 0 1 5
Pemerintahan / Government
Lanjutan Tabel / Continued Table 2.13.2
Nama PartaiParty Name
Jumlah SuaraPemilu 2009
Number of Vote on2009 General
Election
Jumlah SuaraPemilu 2014
Number of Voteon 2014 General
Election
(1) (2)
26. Partai Nasional Banteng KerakyatanIndonesia 10 374 -
27. Partai Bulan Bintang 40 713 41 621
28. Partai Demokrasi Indonesia Perjuangan 156 129 250 886
29. Partai Bintang Reformasi 13 338 -
30. Partai Patriot Pancasila 54 883 -
31. Partai Demokrat 188 129 121817
32. Partai Kasih Demokrasi Indonesia 6 910 -
33. Partai Indonesia Sejahtera 6 080 -
34. Partai Kebangkitan Nasional Ulama 6 504 -
41. Partai Merdeka 14 110 -42. Partai Persatuan Nahdlatul Ummah
Indonesia 895 -
43. Partai Syarikat Indonesia - -
44. Partai Buruh Sosial Demokrat 8 684 -
45. Partai Nasdem - 105 056
Jumlah/ Total 1 386 208 1 572 142
Sumber: Komisi Pemilihan Umum Provinsi Kalimantan Timur Source: The General Election Commission of Kalimantan Timur.
: / a l t i m
. b p s . g
rat
emil
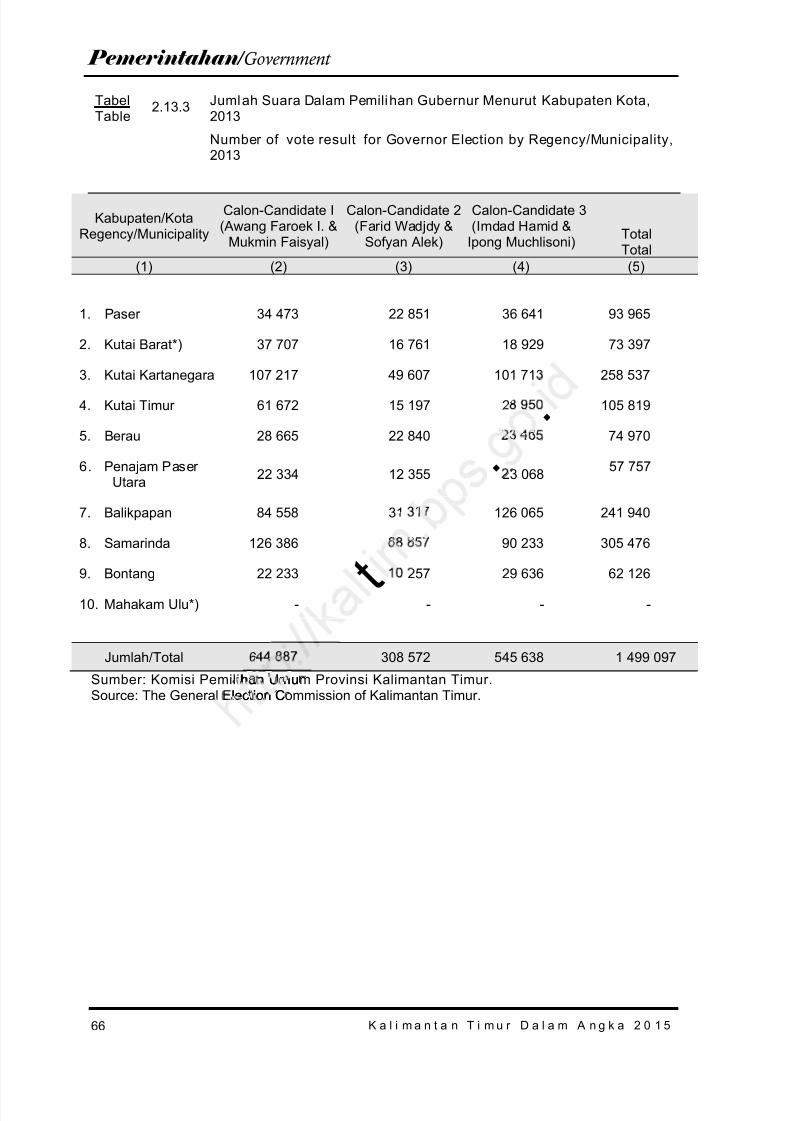
8/20/2019 Kalimantan Timur Dalam Angka Tahun 2015
http://slidepdf.com/reader/full/kalimantan-timur-dalam-angka-tahun-2015 132/623
66
Pemerintahan / Government
K a l i m a n t a n T i m u r D a l a m A n g k a 2 0 1 5
TabelTable
2.13.3 Jumlah Suara Dalam Pemilihan Gubernur Menurut Kabupaten Kota,2013
Number of vote result for Governor Election by Regency/Municipality,2013
Kabupaten/KotaRegency/Municipality
Calon- Candidate I(Awang Faroek I. &
Mukmin Faisyal)
Calon- Candidate 2(Farid Wadjdy &
Sofyan Alek)
Calon- Candidate 3(Imdad Hamid &
Ipong Muchlisoni) TotalTotal
(1) (2) (3) (4) (5)
1. Paser 34 473 22 851 36 641 93 965
2. Kutai Barat*) 37 707 16 761 18 929 73 397
3. Kutai Kartanegara 107 217 49 607 101 713 258 537
4. Kutai Timur 61 672 15 197 28 950 105 819
5. Berau 28 665 22 840 23 465 74 970
6. Penajam PaserUtara 22 334 12 355 23 068 57 757
7. Balikpapan 84 558 31 317 126 065 241 940
8. Samarinda 126 386 88 857 90 233 305 476
9. Bontang 22 233 10 257 29 636 62 126
10. Mahakam Ulu*) - - - -
Jumlah/ Total 644 887 308 572 545 638 1 499 097
Sumber: Komisi Pemilihan Umum Provinsi Kalimantan Timur.Source: The General Election Commission of Kalimantan Timur.
. .
t
han Umulection C

8/20/2019 Kalimantan Timur Dalam Angka Tahun 2015
http://slidepdf.com/reader/full/kalimantan-timur-dalam-angka-tahun-2015 133/623
67K a l i m a n t a n T i m u r D a l a m A n g k a 2 0 1 5
Pemerintahan / Government
TabelTable
2.13.4 Jumlah Anggota Legislatif (DPRD) Menurut Jenis Kelamin,2014
Number of Representative at The Local House ofRepresentative (DPRD) Region/City by Sex, 2014
Kabupaten/KotaRegency/Municipality
Laki-lakiMale
PerempuanFemale
JumlahTotal
PersentaseKeterwakilanPerempuan
FemaleRepresentationin Parliament
(%)(1) (2) (3) (4) (5)
1. Paser 25 5 30 17
2. Kutai Barat 24 1 25 4
3. Kutai Kartanegara 42 3 45 7
4. Kutai Timur 36 4 40 10
5. Berau 27 3 30 10
6. Penajam Paser Utara 19 1 20 5
7. Balikpapan 37 8 45 18
8. Samarinda 42 3 45 7
9. Bontang 23 2 25 8
10. Mahakam Ulu 16 4 20 20
11. DPRD Tk.I Kaltim 50 5 55 9
Jumlah/ Total 341 39 380 10
Sumber: Komisi Pemilihan Umum Provinsi Kalimantan Timur Source:The General Election Commission of Kalimantan Timur.
a l t . b p
. g o . i4
3
42

8/20/2019 Kalimantan Timur Dalam Angka Tahun 2015
http://slidepdf.com/reader/full/kalimantan-timur-dalam-angka-tahun-2015 134/623
h t t p : / / k a l t i m
. b p s . g o . i d
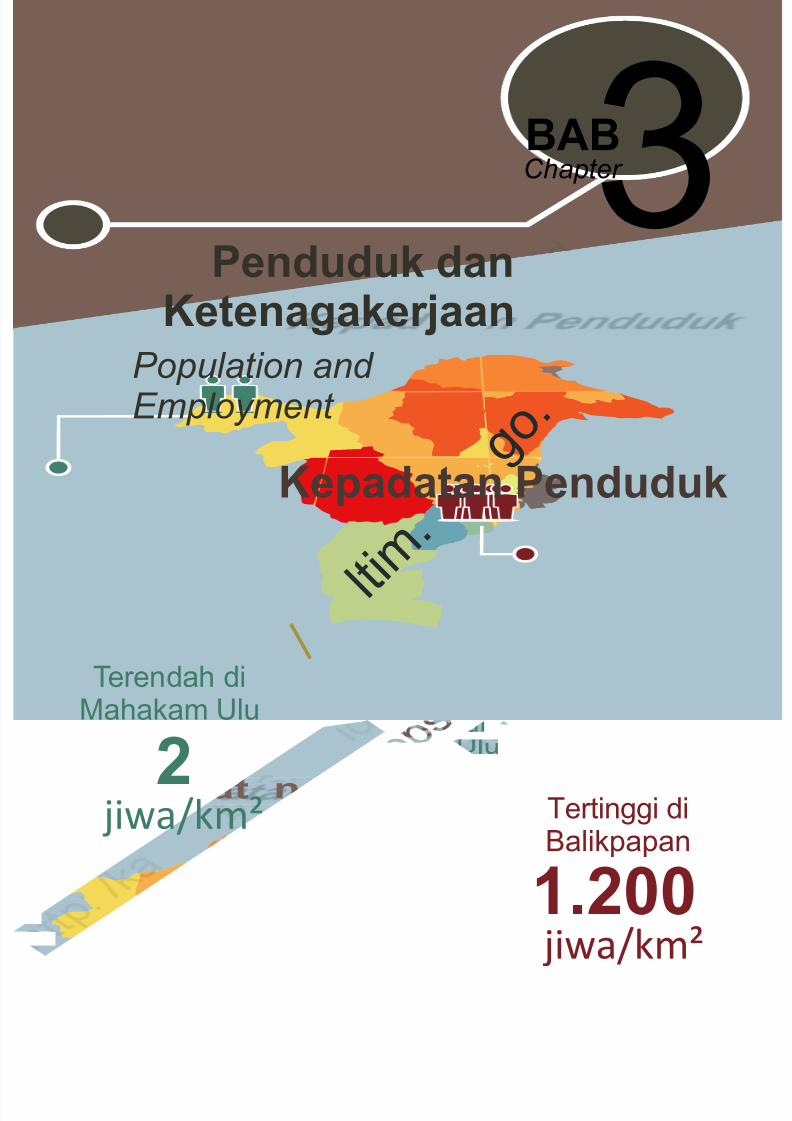
8/20/2019 Kalimantan Timur Dalam Angka Tahun 2015
http://slidepdf.com/reader/full/kalimantan-timur-dalam-angka-tahun-2015 135/623
3Penduduk dan
Ketenagakerjaan
BABChapter
Population and Employment
Kepadatan Penduduk
Terendah diMahakam Ulu
2 jiwa/km² Tertinggi diBalikpapan
1.200 jiwa/km²
l t i m .
g o .
/
a

8/20/2019 Kalimantan Timur Dalam Angka Tahun 2015
http://slidepdf.com/reader/full/kalimantan-timur-dalam-angka-tahun-2015 136/623
h t t p : / / k a l t i m
. b p s . g o . i d

8/20/2019 Kalimantan Timur Dalam Angka Tahun 2015
http://slidepdf.com/reader/full/kalimantan-timur-dalam-angka-tahun-2015 137/623
K a l i m a n t a n T i m u r D a l a m A n g k a 2 0 1 5 71
Penduduk dan Ketenagakerjaan / Population and Employment
3.1 JUMLAH, PERTUM-
BUHAN, PERSEBARAN,
KEPADATAN DANKOMPOSISI PENDUDUK
Penduduk Kalimantan Timurdari tahun ke tahun mengalamikenaikan yang cukup berarti. Halini dapat dilihat dari jumlahPenduduk 2012, 2013 sampaidengan 2014. Jumlah pendudukpada tahun 2012 sebesar3.199.696 jiwa, meningkatmenjadi 3.275.844 jiwa padatahun 2013 dan meningkat lagimenjadi 3.351.432 di tahun 2014.Berarti dalam periode tersebut
penduduk Kalimantan Timur telahbertambah hampir 100 ribu jiwasetiap tahunnya.
Pada periode 2013-2014pertumbuhan penduduk diKalimantan Timur sebesar 2,31persen. Kabupaten/Kota yangmengalami pertumbuhantertinggi adalah Kabupaten KutaiTimur sebesar 4,34 persen,sedangkan kabupaten/ kotalainnya pertumbuhannya berkisar0,61 –2,96 persen.
3.1. NUMBER OF
POPULATION GROWTH,
DISTRIBUTION, DENSITY AND COMPOSOTION OF
POPULATION
Population of KalimantanTimur each year tended toincrease significantly. It can beseen from the total Population in2012, 2013 and 2014. The numberof population increased from3,199,696 people in 2012 to3,275,844 people in 2013 andincreased again to 3,351,432 in2014. It means that population ofKalimantan Timur has increasednearly 100 thousands people
every year.
During 2013-2014 the population growth in KalimantanTimur 2.31 percent. The highestgrowth was in Kutai TimurRegency (4.34 percent), the otherregency/municipality have population growth between 0.61 – 2.96 percent.
ot nd 014
ation i , 96 pe ,
/ k
. .ut
r telahribu jiw
rio en peTimu
ncrease201 .Kal
8/20/2019 Kalimantan Timur Dalam Angka Tahun 2015
http://slidepdf.com/reader/full/kalimantan-timur-dalam-angka-tahun-2015 138/623
8/20/2019 Kalimantan Timur Dalam Angka Tahun 2015
http://slidepdf.com/reader/full/kalimantan-timur-dalam-angka-tahun-2015 139/623
K a l i m a n t a n T i m u r D a l a m A n g k a 2 0 1 5 73
Penduduk dan Ketenagakerjaan / Population and Employment
kepadatan penduduk di KotaBalikpapan sebanyak 1.199,83 jiwa/km², Kota Samarinda1.146,84 jiwa/km², dan KotaBontang 978,57 jiwa/km².Sedangkan kepadatan pendudukKalimantan Timur adalah 26,14 jiwa/km².
3.2. KETENAGAKERJAAN
Tenaga kerja adalah modaldalam pembangunan ekonomi.Jumlah dan komposisi tenagakerja akan mengalami perubahanseiring dengan pertumbuhanpenduduk. Tenaga Kerja yangaktif secara ekonomi disebut
angkatan kerja. Tingkat PartisipasiAngkatan (TPAK) adalah ukuranyang menggambarkan jumlahpenduduk digolongkan sebagaiangkatan kerja untuk setiap 100pekerja.
Selama kurun waktu 2013-2014, angkatan kerja diKalimantan Timur meningkatsebanyak 40.366 orang dari1.497.572 orang menjadi1.537.938 orang.
kilometer, and Bontang 978.57 people per square kilometer.Thus , the population density ofKalimantan Timur is 26,14 people
per square kilometre.
3.2 EMPLOYMENT
Manpower is one capital inthe economic development. Totalnumber and the composition ofmanpower will change parallelwith demography growth.Manpower who economicallyactive is called labour force.
Labour Force Participation Rates(LFPRs) is a measurement thatillustrates number of populationclassified as labour force for every100 workers.
During the period of 2013-2014, the labour force in
Kalimantan Timur has increased40,366 people. In 2013, thelabour force was 1,497,572 andits increased to 1,537,938 in 2014.
power
h t
gut
tisipasih ukur
an jung an
untu
ionomic
ber anmanpowwitM
8/20/2019 Kalimantan Timur Dalam Angka Tahun 2015
http://slidepdf.com/reader/full/kalimantan-timur-dalam-angka-tahun-2015 140/623
K a l i m a n t a n T i m u r D a l a m A n g k a 2 0 1 5
74
Penduduk dan Ketenagakerjaan / Population and Employment
TPAK Kalimantan Timurpada tahun 2014 sebesar 63,48persen, sedikit mengalamipenurunan sebesar 0,05 persendibandingkan dengan kondisitahun 2013.
Menurut jenis kelaminterlihat bahwa TPAK laki-lakiselalu lebih tinggi dibanding TPAKperempuan. Tahun 2013 TPAK
laki-laki sebesar 84,53 persen dan2014 turun menjadi 83,36 persen.
LFPRs Kalimantan Timur in2014 was 63.48 percent or 0.05
percent lower compared to LFPRsin 2013.
By sex , LFPRs of male alwaysmore than LFPRs female. In 2013,LFPRs of male was 84.53 percentin 2014 has decreased to 83.36
percent
h t t p : / / k a l t i m
. b p s . g o . i d
8/20/2019 Kalimantan Timur Dalam Angka Tahun 2015
http://slidepdf.com/reader/full/kalimantan-timur-dalam-angka-tahun-2015 141/623
K a l i m a n t a n T i m u r D a l a m A n g k a 2 0 1 5 75
Penduduk dan Ketenagakerjaan / Population and Employment
PENJELASAN TEKNIS
1. Rata-rata Pertumbuhan Penduduk adalah angka yangmenunjukkan tingkat pertam-bahan penduduk per tahundalam jangka waktu tertentu.Angka ini dinyatakan sebagaipersentase dari pendudukdasar.
2. Kepadatan Penduduk adalah
banyaknya penduduk per kmpersegi.3. Rasio Jenis Kelamin adalah
perbandingan antarabanyaknya penduduk laki-lakidengan banyaknya pendudukperempuan pada suatudaerah dan waktu tertentu.Biasanya dinyatakan denganbanyaknya penduduk laki-lakiuntuk 100 pendudukperempuan.
4. Penduduk Usia Kerja adalahpenduduk yang berumur 15tahun ke atas.
5. Angkatan Kerja adalahpenduduk usia kerja (15 tahun
ke atas) yang bekerja, ataupunya pekerjaan namunsementara tidak bekerja danpengangguran.
6. Bekerja adalah melakukanpekerjaan dengan maksudmemperoleh atau membantumemperoleh pendapatanatau keuntungan dan lamanya
bekerja paling
TECHNICAL NOTES
1. Average growth of population is the annual population growth rate overa certain period andexpressed as percentage ofthe base population.
2. Population density is the
number of persons persquare kilometre.
3. Sex ratio is the ratio of thenumber males to the numberof females in a given areasand time year; usuallyexpressed as the number ofmales for every 100 females.
4. Working age population isthe population aged 15 yearsand over.
5. Labour force are people aged15 years old and over who, in
the previous week, wereworking, temporarily absent from work but having jobs,and were looking for work.
6. The concept of workingmeans activity intended toearn income by doing work orhelping to do work at leastone hour continuosly during
the reference week
oilometr
. b u.
nganaki-laki
pendud
ia Kerj yang
e atas.n
ratio isumberr
o emand
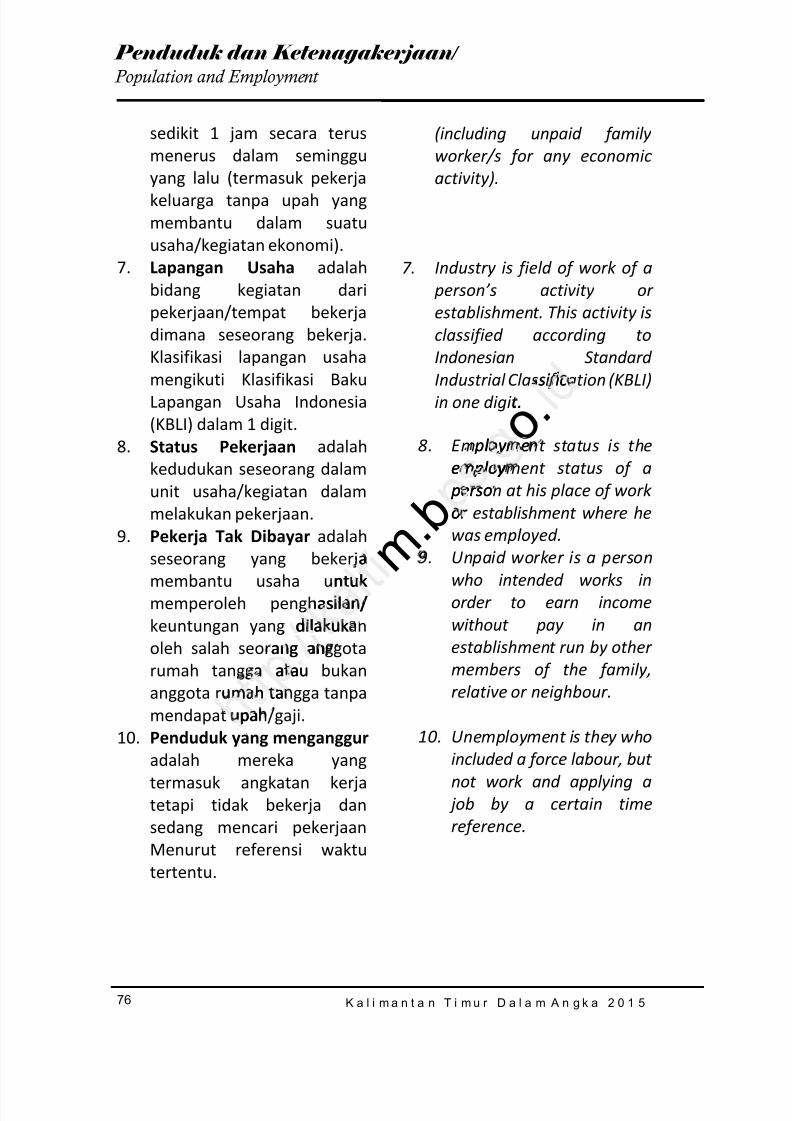
8/20/2019 Kalimantan Timur Dalam Angka Tahun 2015
http://slidepdf.com/reader/full/kalimantan-timur-dalam-angka-tahun-2015 142/623
K a l i m a n t a n T i m u r D a l a m A n g k a 2 0 1 5
76
Penduduk dan Ketenagakerjaan / Population and Employment
sedikit 1 jam secara terusmenerus dalam semingguyang lalu (termasuk pekerjakeluarga tanpa upah yangmembantu dalam suatuusaha/kegiatan ekonomi).
7. Lapangan Usaha adalahbidang kegiatan daripekerjaan/tempat bekerjadimana seseorang bekerja.Klasifikasi lapangan usaha
mengikuti Klasifikasi BakuLapangan Usaha Indonesia(KBLI) dalam 1 digit.
8. Status Pekerjaan adalahkedudukan seseorang dalamunit usaha/kegiatan dalammelakukan pekerjaan.
9. Pekerja Tak Dibayar adalahseseorang yang bekerjamembantu usaha untukmemperoleh penghasilan/keuntungan yang dilakukanoleh salah seorang anggotarumah tangga atau bukananggota rumah tangga tanpamendapat upah/gaji.
10. Penduduk yang menganggur
adalah mereka yangtermasuk angkatan kerjatetapi tidak bekerja dansedang mencari pekerjaanMenurut referensi waktutertentu.
(including unpaid familyworker/s for any economicactivity).
7. Industry is field of work of a person’s activity orestablishment. This activity isclassified according toIndonesian Standard
Industrial Classification (KBLI)in one digit.
8. Employment status is theemployment status of a person at his place of workor establishment where hewas employed.
9. Unpaid worker is a personwho intended works inorder to earn incomewithout pay in anestablishment run by othermembers of the family,relative or neighbour.
10. Unemployment is they whoincluded a force labour, butnot work and applying a job by a certain timereference.
m . b
o .
antuk
asilan/dilakuk
ang anga atau
mah taupa
sific.
ploymeemploy persoor
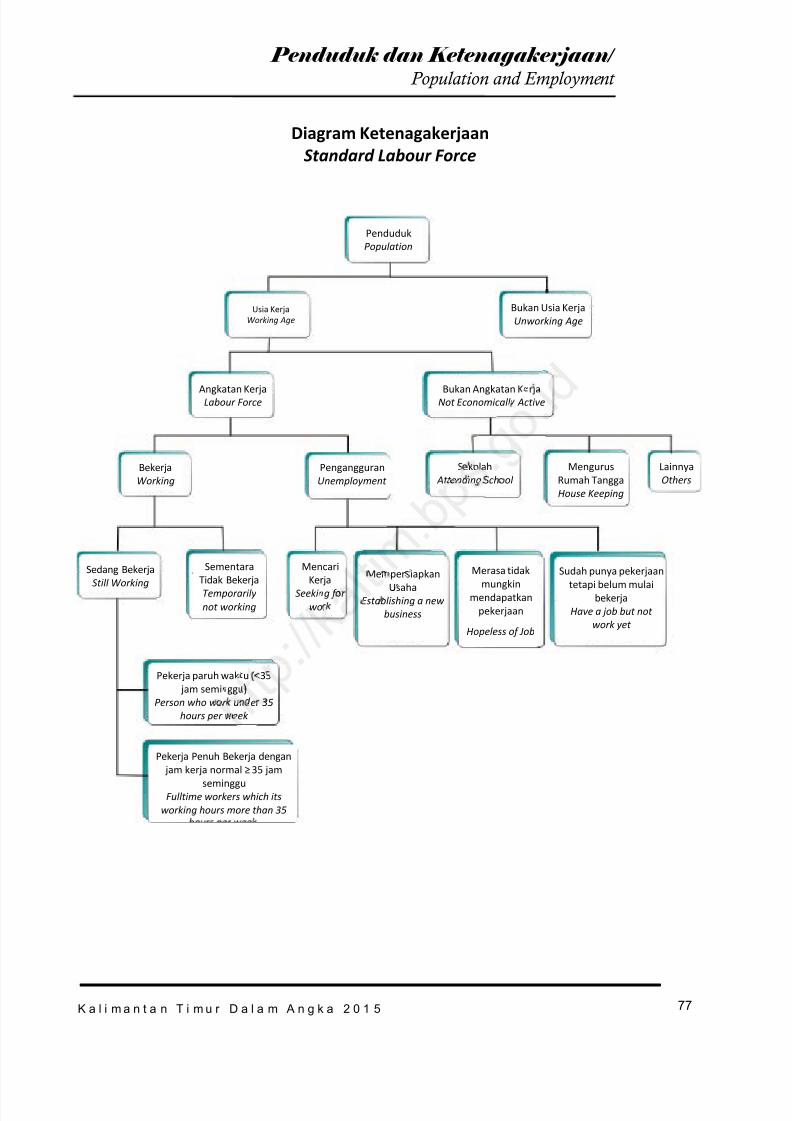
8/20/2019 Kalimantan Timur Dalam Angka Tahun 2015
http://slidepdf.com/reader/full/kalimantan-timur-dalam-angka-tahun-2015 143/623
K a l i m a n t a n T i m u r D a l a m A n g k a 2 0 1 5 77
Penduduk dan Ketenagakerjaan / Population and Employment
Diagram KetenagakerjaanStandard Labour Force
Sedang BekerjaStill Working
BekerjaWorking
PendudukPopulation
Usia KerjaWorking Age
Bukan Usia KerjaUnworking Age
Angkatan KerjaLabour Force
Bukan Angkatan KerjaNot Economically Active
PengangguranUnemployment
Sekolah Attending School
MengurusRumah TanggaHouse Keeping
LainnyaOthers
SementaraTidak BekerjaTemporarilynot working
MencariKerja
Seeking forwork
MempersiapkanUsaha
Establishing a newbusiness
Merasa tidakmungkin
mendapatkanpekerjaan
Hopeless of Job
Sudah punya pekerjaantetapi belum mulaibekerja
Have a job but notwork yet
Pekerja paruh waktu (<35 jam seminggu)
Person who work under 35hours per week
Pekerja Penuh Bekerja dengan jam kerja normal ≥ 35 jam
semingguFulltime workers which its
working hours more than 35
rja Active
Sekolah Attending Sch
g for
wor
MemperU
Esta
u (<35ggu)
or un er 35eek
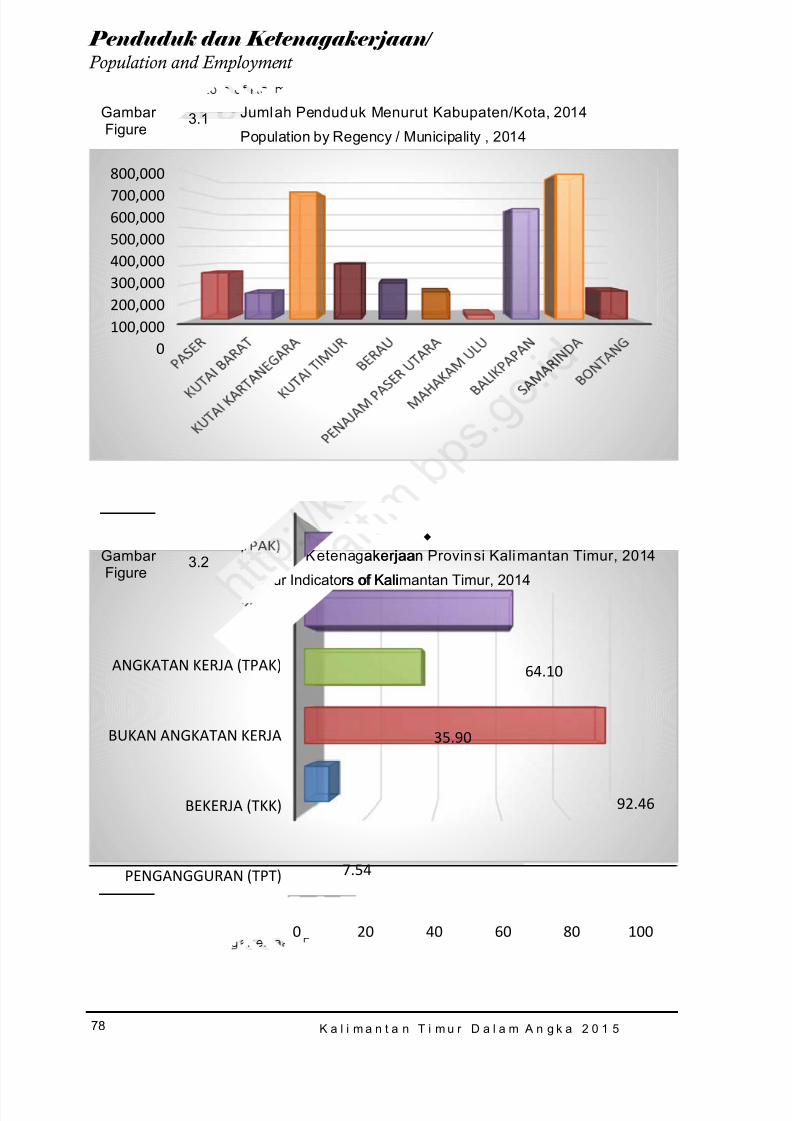
8/20/2019 Kalimantan Timur Dalam Angka Tahun 2015
http://slidepdf.com/reader/full/kalimantan-timur-dalam-angka-tahun-2015 144/623
K a l i m a n t a n T i m u r D a l a m A n g k a 2 0 1 5
78
Penduduk dan Ketenagakerjaan / Population and Employment
Gambar Figure
3.1 Jumlah Penduduk Menurut Kabupaten/Kota, 2014
Population by Regency / Municipality , 2014
Gambar
Figure3.2 Indikator Ketenagakerjaan Provinsi Kalimantan Timur, 2014
Labour Indicators of Kalimantan Timur, 2014
0100,000200,000300,000400,000500,000600,000700,000
800,000
0 20 40 60 80 100
PENGANGGURAN (TPT)
BEKERJA (TKK)
BUKAN ANGKATAN KERJA
ANGKATAN KERJA (TPAK)
7.54
92.46
35.90
64.10
.akerjaan
rs of Kali

8/20/2019 Kalimantan Timur Dalam Angka Tahun 2015
http://slidepdf.com/reader/full/kalimantan-timur-dalam-angka-tahun-2015 145/623
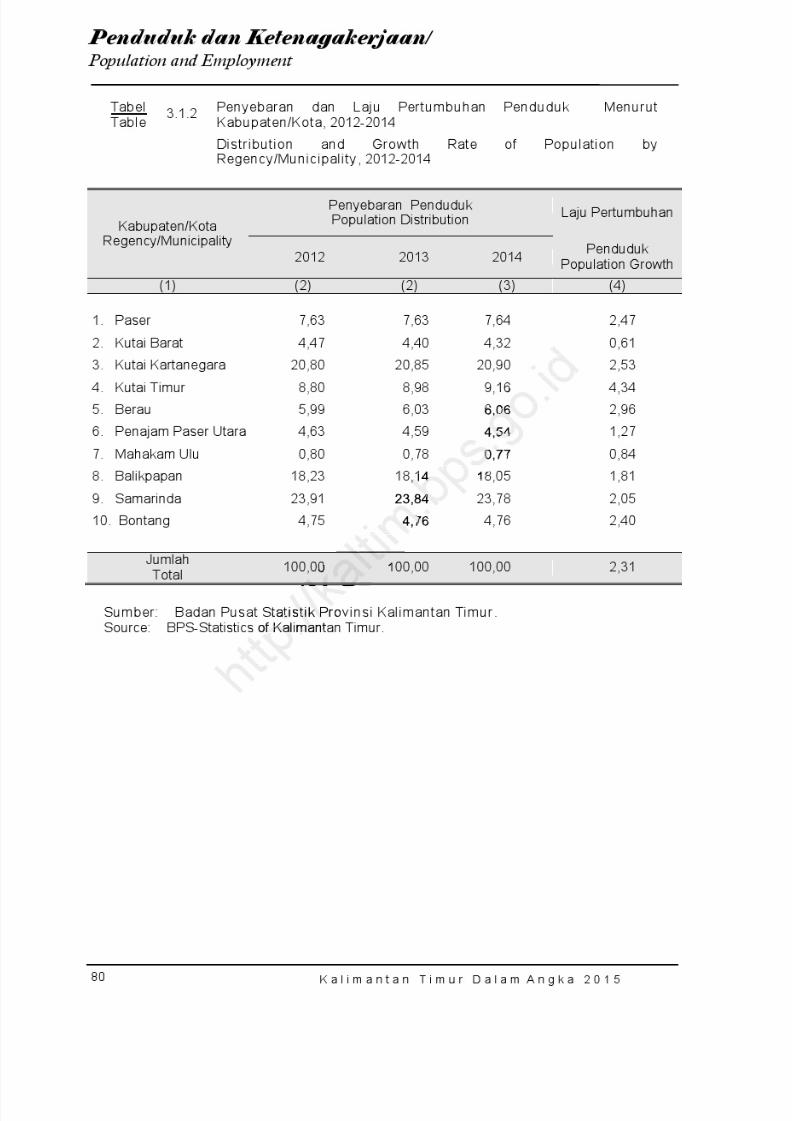
8/20/2019 Kalimantan Timur Dalam Angka Tahun 2015
http://slidepdf.com/reader/full/kalimantan-timur-dalam-angka-tahun-2015 146/623
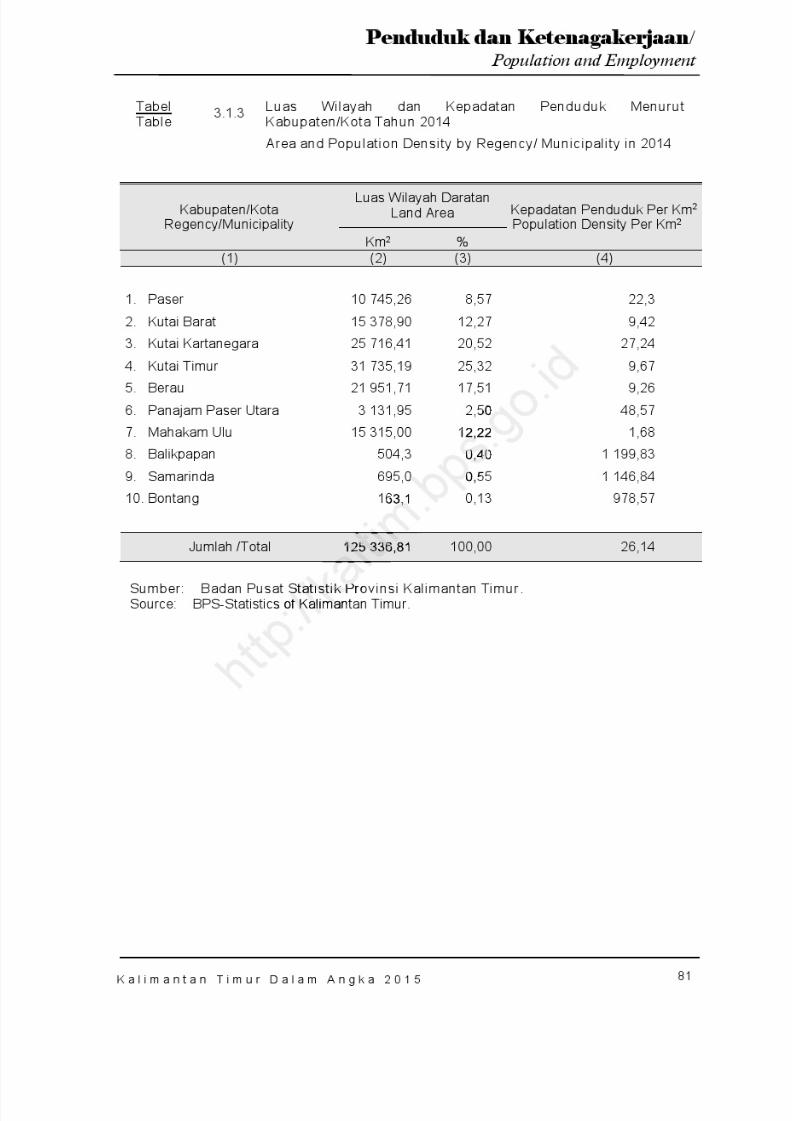
8/20/2019 Kalimantan Timur Dalam Angka Tahun 2015
http://slidepdf.com/reader/full/kalimantan-timur-dalam-angka-tahun-2015 147/623
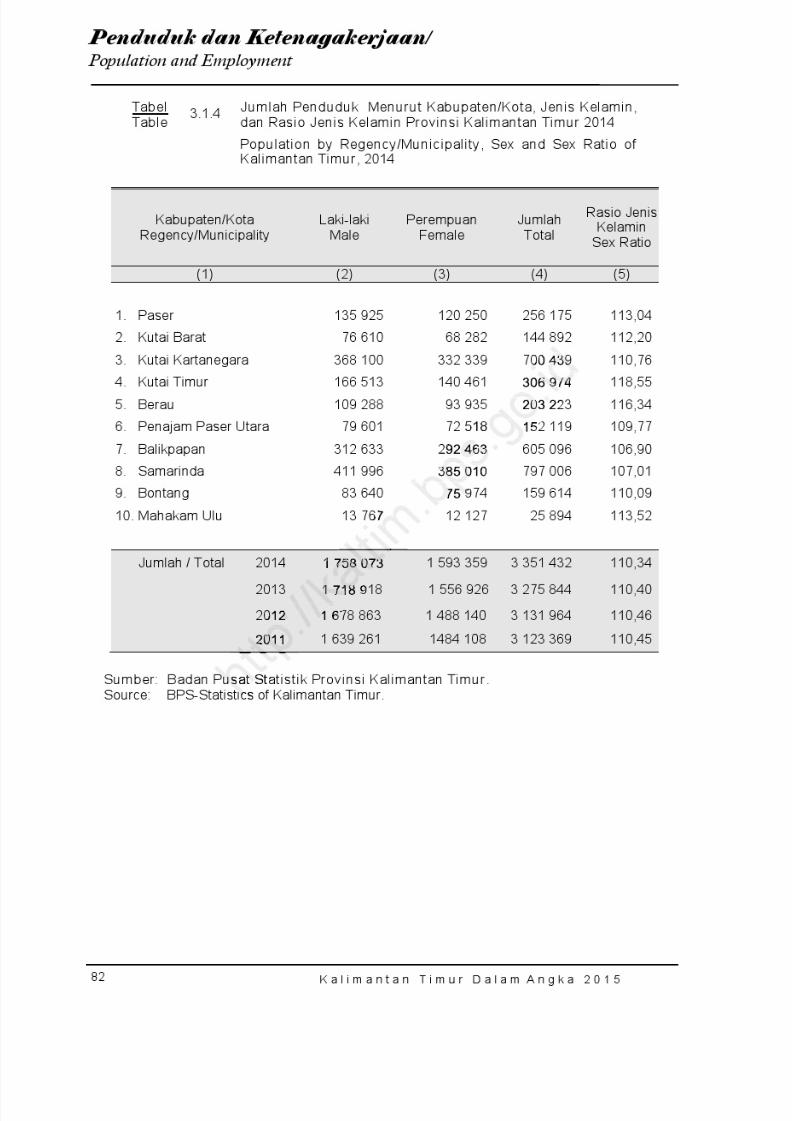
8/20/2019 Kalimantan Timur Dalam Angka Tahun 2015
http://slidepdf.com/reader/full/kalimantan-timur-dalam-angka-tahun-2015 148/623
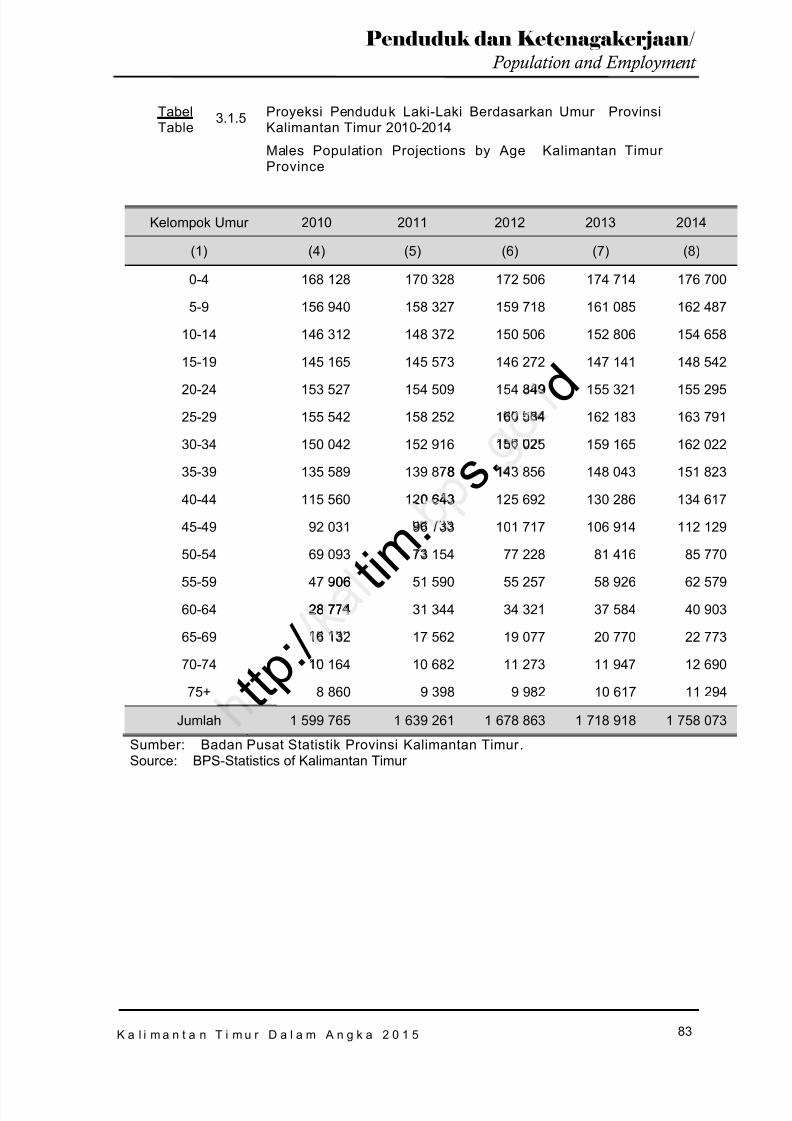
8/20/2019 Kalimantan Timur Dalam Angka Tahun 2015
http://slidepdf.com/reader/full/kalimantan-timur-dalam-angka-tahun-2015 149/623
K a l i m a n t a n T i m u r D a l a m A n g k a 2 0 1 5
83
Penduduk dan Ketenagakerjaan / Population and Employment
TabelTable
3.1.5 Proyeksi Penduduk Laki-Laki Berdasarkan Umur ProvinsiKalimantan Timur 2010-2014
Males Population Projections by Age Kalimantan Timur Province
Kelompok Umur 2010 2011 2012 2013 2014
(1) (4) (5) (6) (7) (8)
0-4 168 128 170 328 172 506 174 714 176 700
5-9 156 940 158 327 159 718 161 085 162 487
10-14 146 312 148 372 150 506 152 806 154 658
15-19 145 165 145 573 146 272 147 141 148 542
20-24 153 527 154 509 154 849 155 321 155 295
25-29 155 542 158 252 160 584 162 183 163 791
30-34 150 042 152 916 156 025 159 165 162 022
35-39 135 589 139 878 143 856 148 043 151 823
40-44 115 560 120 643 125 692 130 286 134 617
45-49 92 031 96 733 101 717 106 914 112 129
50-54 69 093 73 154 77 228 81 416 85 770
55-59 47 906 51 590 55 257 58 926 62 579
60-64 28 774 31 344 34 321 37 584 40 903
65-69 16 132 17 562 19 077 20 770 22 773
70-74 10 164 10 682 11 273 11 947 12 690
75+ 8 860 9 398 9 982 10 617 11 294
Jumlah 1 599 765 1 639 261 1 678 863 1 718 918 1 758 073
Sumber: Badan Pusat Statistik Provinsi Kalimantan Timur .
Source : BPS-Statistics of Kalimantan Timur
t t p : /
t i m .
s . d49
8 1
0 643
06
28 774
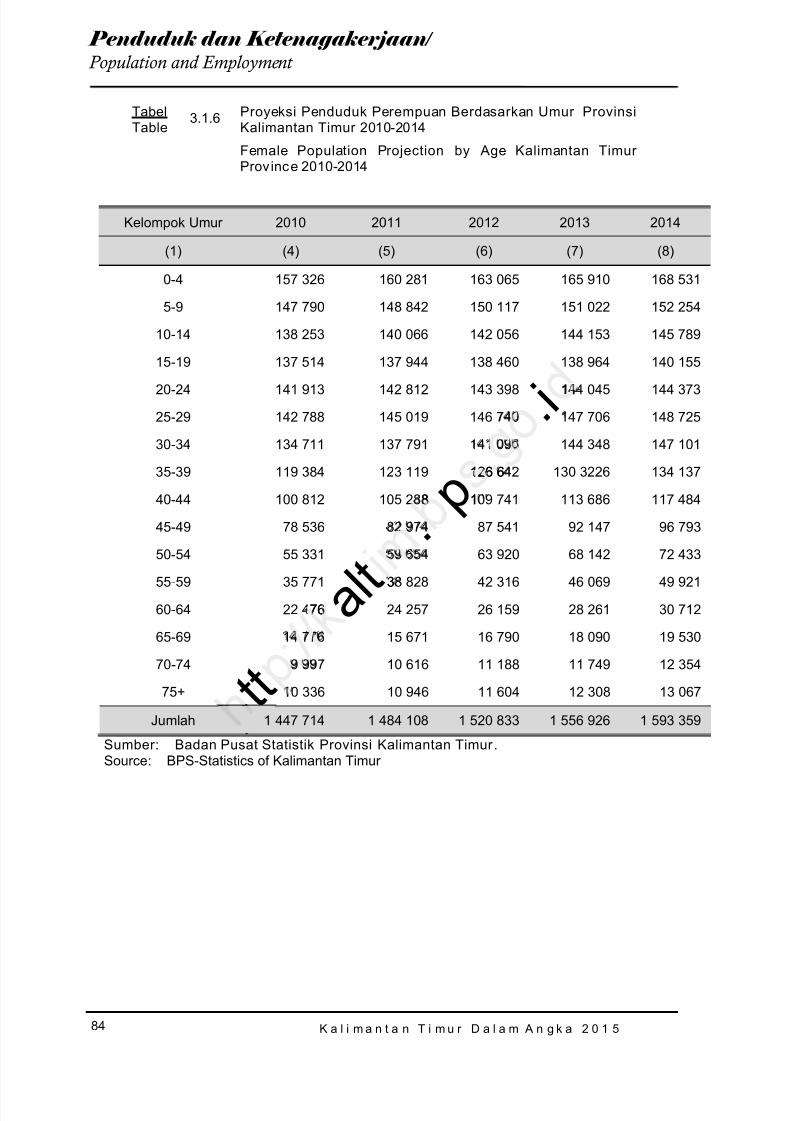
8/20/2019 Kalimantan Timur Dalam Angka Tahun 2015
http://slidepdf.com/reader/full/kalimantan-timur-dalam-angka-tahun-2015 150/623
K a l i m a n t a n T i m u r D a l a m A n g k a 2 0 1 5
84
Penduduk dan Ketenagakerjaan / Population and Employment
TabelTable
3.1.6 Proyeksi Penduduk Perempuan Berdasarkan Umur ProvinsiKalimantan Timur 2010-2014
Female Population Projection by Age Kalimantan Timur Province 2010-2014
Kelompok Umur 2010 2011 2012 2013 2014
(1) (4) (5) (6) (7) (8)
0-4 157 326 160 281 163 065 165 910 168 531
5-9 147 790 148 842 150 117 151 022 152 254
10-14 138 253 140 066 142 056 144 153 145 789
15-19 137 514 137 944 138 460 138 964 140 155
20-24 141 913 142 812 143 398 144 045 144 373
25-29 142 788 145 019 146 740 147 706 148 725
30-34 134 711 137 791 141 096 144 348 147 101
35-39 119 384 123 119 126 642 130 3226 134 137
40-44 100 812 105 288 109 741 113 686 117 484
45-49 78 536 82 974 87 541 92 147 96 793
50-54 55 331 59 654 63 920 68 142 72 433
55-59 35 771 38 828 42 316 46 069 49 921
60-64 22 476 24 257 26 159 28 261 30 712
65-69 14 776 15 671 16 790 18 090 19 530
70-74 9 997 10 616 11 188 11 749 12 354
75+ 10 336 10 946 11 604 12 308 13 067
Jumlah 1 447 714 1 484 108 1 520 833 1 556 926 1 593 359
Sumber: Badan Pusat Statistik Provinsi Kalimantan Timur .
Source : BPS-Statistics of Kalimantan Timur
t t a l t
. p
. i14
126 6
8 1
3
76
1
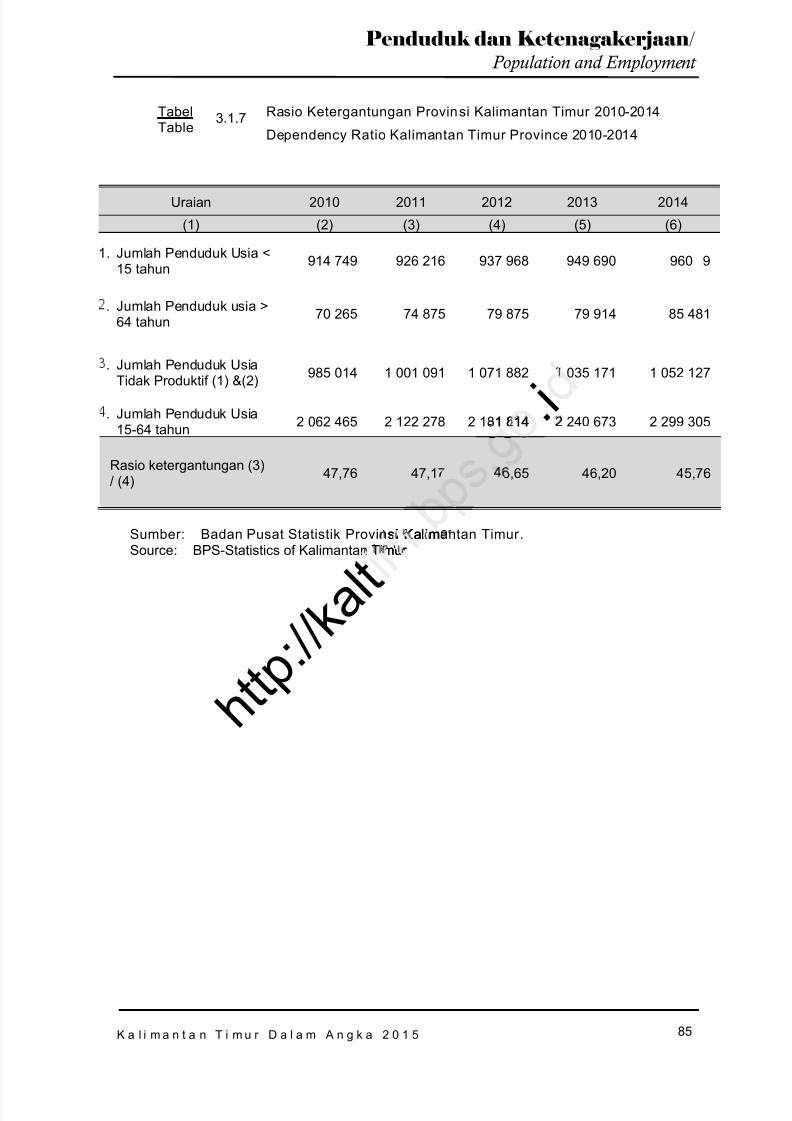
8/20/2019 Kalimantan Timur Dalam Angka Tahun 2015
http://slidepdf.com/reader/full/kalimantan-timur-dalam-angka-tahun-2015 151/623
K a l i m a n t a n T i m u r D a l a m A n g k a 2 0 1 5
85
Penduduk dan Ketenagakerjaan / Population and Employment
TabelTable
3.1.7 Rasio Ketergantungan Provinsi Kalimantan Timur 2010-2014
Dependency Ratio Kalimantan Timur Province 2010-2014
Uraian 2010 2011 2012 2013 2014
(1) (2) (3) (4) (5) (6)
1. Jumlah Penduduk Usia <15 tahun 914 749 926 216 937 968 949 690 960 9
. Jumlah Penduduk usia >64 tahun 70 265 74 875 79 875 79 914 85 481
. Jumlah Penduduk Usia
Tidak Produktif (1) &(2)985 014 1 001 091 1 071 882 1 035 171 1 052 127
. Jumlah Penduduk Usia15-64 tahun 2 062 465 2 122 278 2 181 814 2 240 673 2 299 305
Rasio ketergantungan (3)/ (4) 47,76 47,17 46,65 46,20 45,76
Sumber: Badan Pusat Statistik Provinsi Kalimantan Timur .Source : BPS-Statistics of Kalimantan Timur
. i
1 81 4
h t t p : / / k a l t
si Kalimmur
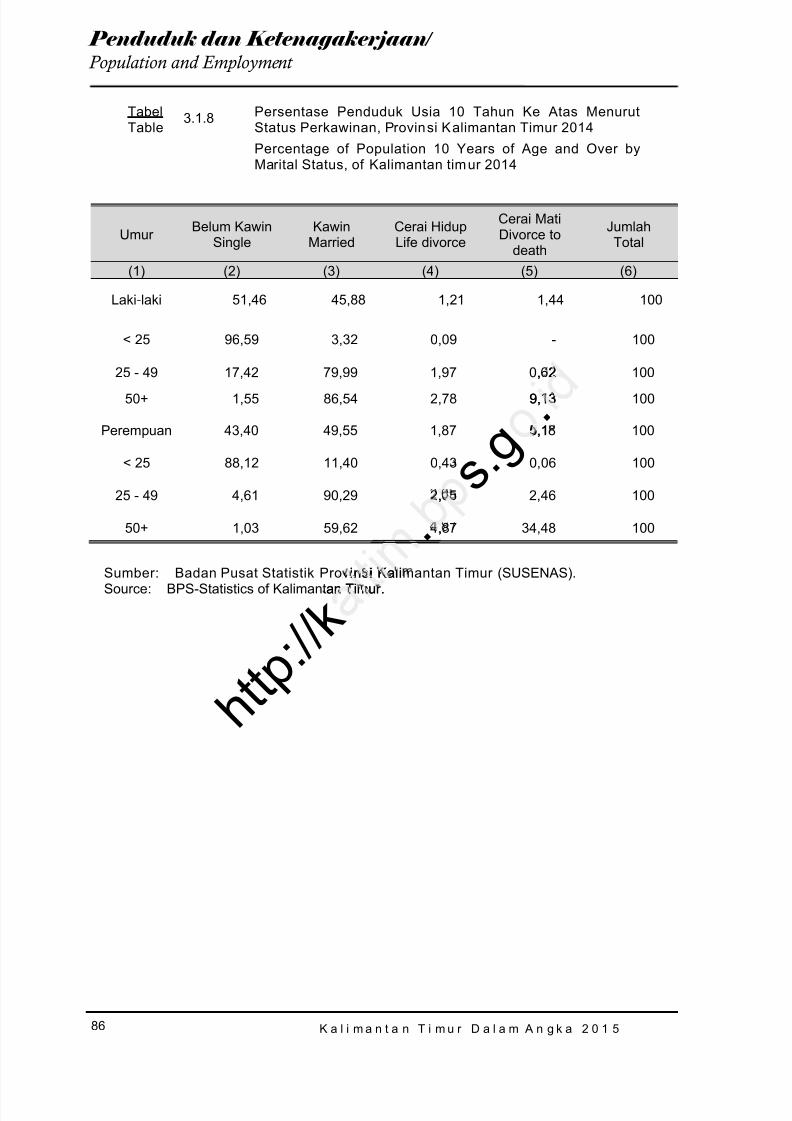
8/20/2019 Kalimantan Timur Dalam Angka Tahun 2015
http://slidepdf.com/reader/full/kalimantan-timur-dalam-angka-tahun-2015 152/623
K a l i m a n t a n T i m u r D a l a m A n g k a 2 0 1 5
86
Penduduk dan Ketenagakerjaan / Population and Employment
TabelTable
3.1.8 Persentase Penduduk Usia 10 Tahun Ke Atas MenurutStatus Perkawinan, Provinsi Kalimantan Timur 2014Percentage of Population 10 Years of Age and Over byMarital Status, of Kalimantan timur 2014
Umur Belum KawinSingle
KawinMarried
Cerai HidupLife divorce
Cerai MatiDivorce to
death
JumlahTotal
(1) (2) (3) (4) (5) (6)
Laki-laki 51,46 45,88 1,21 1,44 100
< 25 96,59 3,32 0,09 - 100
25 - 49 17,42 79,99 1,97 0,62 100
50+ 1,55 86,54 2,78 9,13 100
Perempuan 43,40 49,55 1,87 5,18 100
< 25 88,12 11,40 0,43 0,06 100
25 - 49 4,61 90,29 2,65 2,46 100
50+ 1,03 59,62 4,87 34,48 100
Sumber: Badan Pusat Statistik Provinsi Kalimantan Timur (SUSENAS).Source : BPS-Statistics of Kalimantan Timur .
h t t p : / / k
. s . g
., 2
9,13
5,1
,
,
insi Kalian Timur .
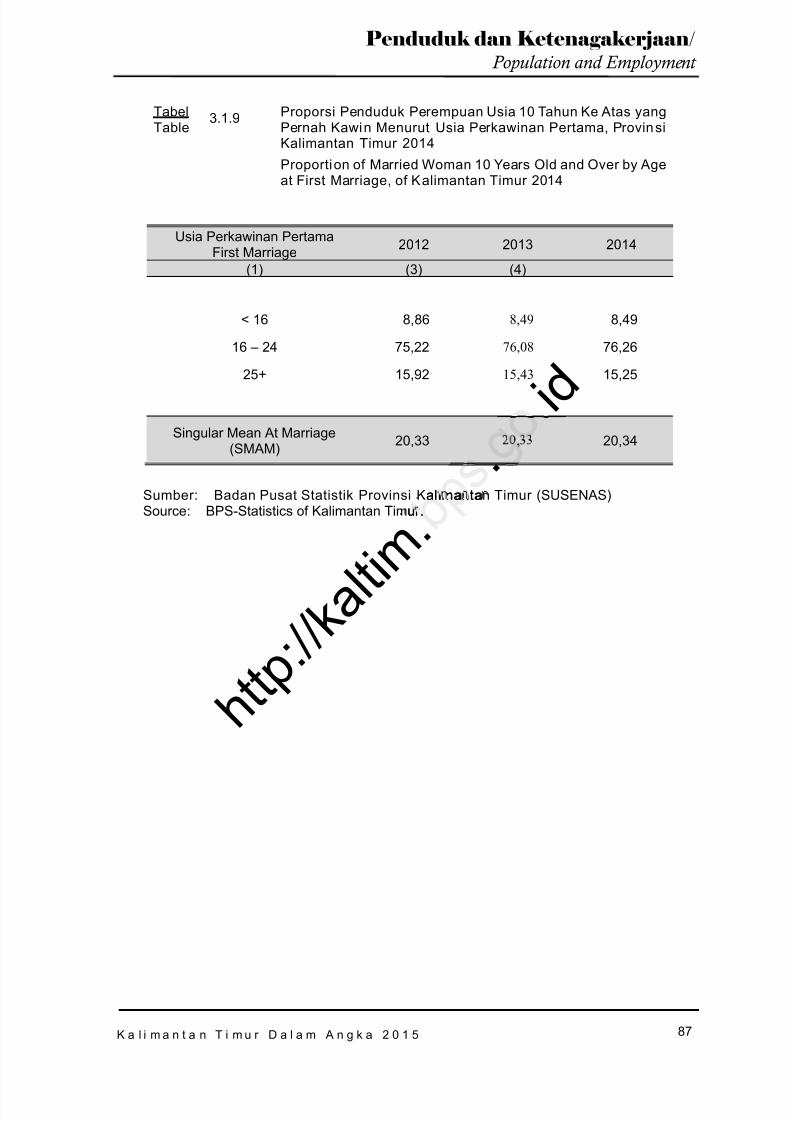
8/20/2019 Kalimantan Timur Dalam Angka Tahun 2015
http://slidepdf.com/reader/full/kalimantan-timur-dalam-angka-tahun-2015 153/623
K a l i m a n t a n T i m u r D a l a m A n g k a 2 0 1 5
87
Penduduk dan Ketenagakerjaan / Population and Employment
TabelTable
3.1.9 Proporsi Penduduk Perempuan Usia 10 Tahun Ke Atas yangPernah Kawin Menurut Usia Perkawinan Pertama, Provin siKalimantan Timur 2014Proportion of Married Woman 10 Years Old and Over by Ageat First Marriage, of Kalimantan Timur 2014
Usia Perkawinan PertamaFirst Marriage 2012 2013 2014
(1) (3) (4)
< 16 8,86 8,49 8,49
16 – 24 75,22 76,08 76,26
25+ 15,92 15,43 15,25
Singular Mean At Marriage(SMAM) 20,33 20,33 20,34
Sumber: Badan Pusat Statistik Provinsi Kalimantan Timur (SUSENAS)Source : BPS-Statistics of Kalimantan Timur .
h t t p : / / k a l t i m
. .
i d,
al imantaur ..
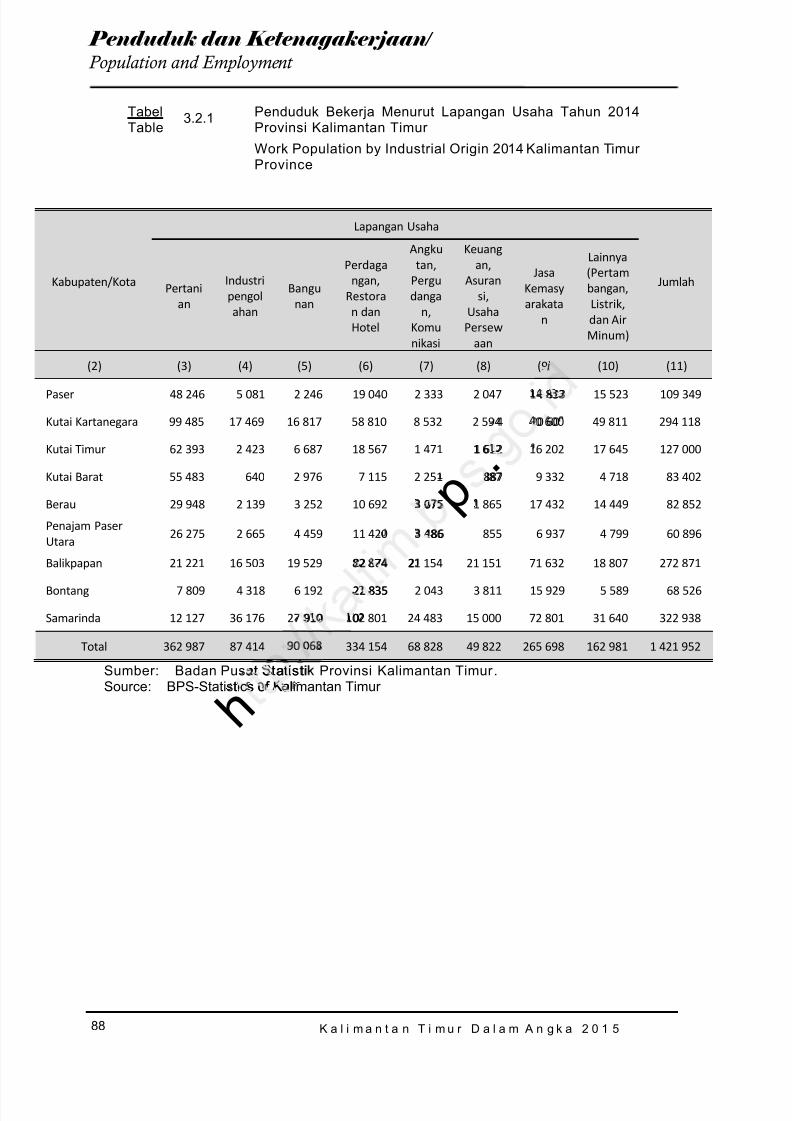
8/20/2019 Kalimantan Timur Dalam Angka Tahun 2015
http://slidepdf.com/reader/full/kalimantan-timur-dalam-angka-tahun-2015 154/623
K a l i m a n t a n T i m u r D a l a m A n g k a 2 0 1 5
88
Penduduk dan Ketenagakerjaan / Population and Employment
TabelTable
3.2.1 Penduduk Bekerja Menurut Lapangan Usaha Tahun 2014Provinsi Kalimantan Timur Work Population by Industrial Origin 2014 Kalimantan TimurProvince
Kabupaten/Kota
Lapangan Usaha
JumlahPertanian
Industripengolahan
Bangunan
Perdagangan,
Restoran danHotel
Angkutan,
Pergudanga
n,Komunikasi
Keuangan,
Asuransi,
UsahaPersew
aan
JasaKemasyarakata
n
Lainnya(Pertambangan,Listrik,dan AirMinum)
(2) (3) (4) (5) (6) (7) (8) (9) (10) (11)
Paser 48 246 5 081 2 246 19 040 2 333 2 047 14 833 15 523 109 349
Kutai Kartanegara 99 485 17 469 16 817 58 810 8 532 2 594 40 600 49 811 294 118
Kutai Timur 62 393 2 423 6 687 18 567 1 471 1 612 16 202 17 645 127 000
Kutai Barat 55 483 640 2 976 7 115 2 251 887 9 332 4 718 83 402
Berau 29 948 2 139 3 252 10 692 3 075 1 865 17 432 14 449 82 852
Penajam PaserUtara
26 275 2 665 4 459 11 420 3 486 855 6 937 4 799 60 896
Balikpapan 21 221 16 503 19 529 82 874 21 154 21 151 71 632 18 807 272 871
Bontang 7 809 4 318 6 192 22 835 2 043 3 811 15 929 5 589 68 526
Samarinda 12 127 36 176 27 910 102 801 24 483 15 000 72 801 31 640 322 938
Total 362 987 87 414 90 068 334 154 68 828 49 822 265 698 162 981 1 421 952
Sumber: Badan Pusat Statistik Provinsi Kalimantan Timur .Source : BPS-Statistics of Kalimantan Timur
p .
4 833
4 40 60
1 612
8878
075
486
82 874 2
22 835
910 0
at Stat is tii
htics of Kalc
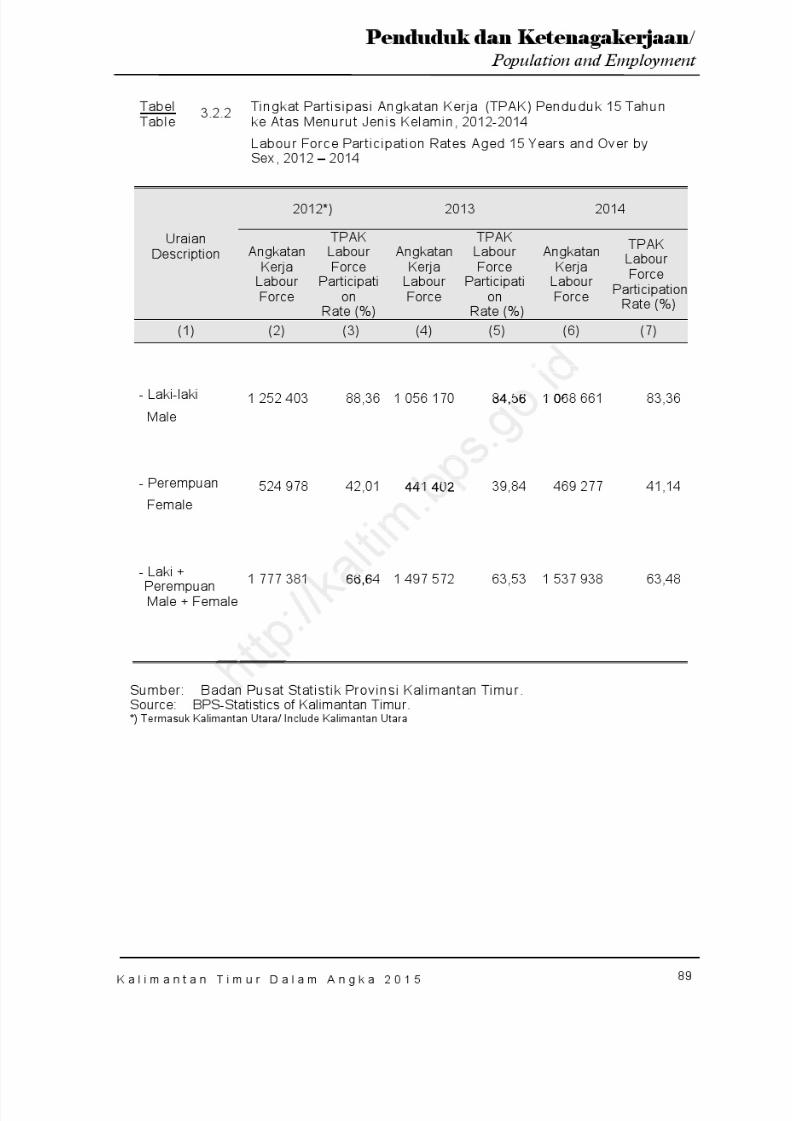
8/20/2019 Kalimantan Timur Dalam Angka Tahun 2015
http://slidepdf.com/reader/full/kalimantan-timur-dalam-angka-tahun-2015 155/623
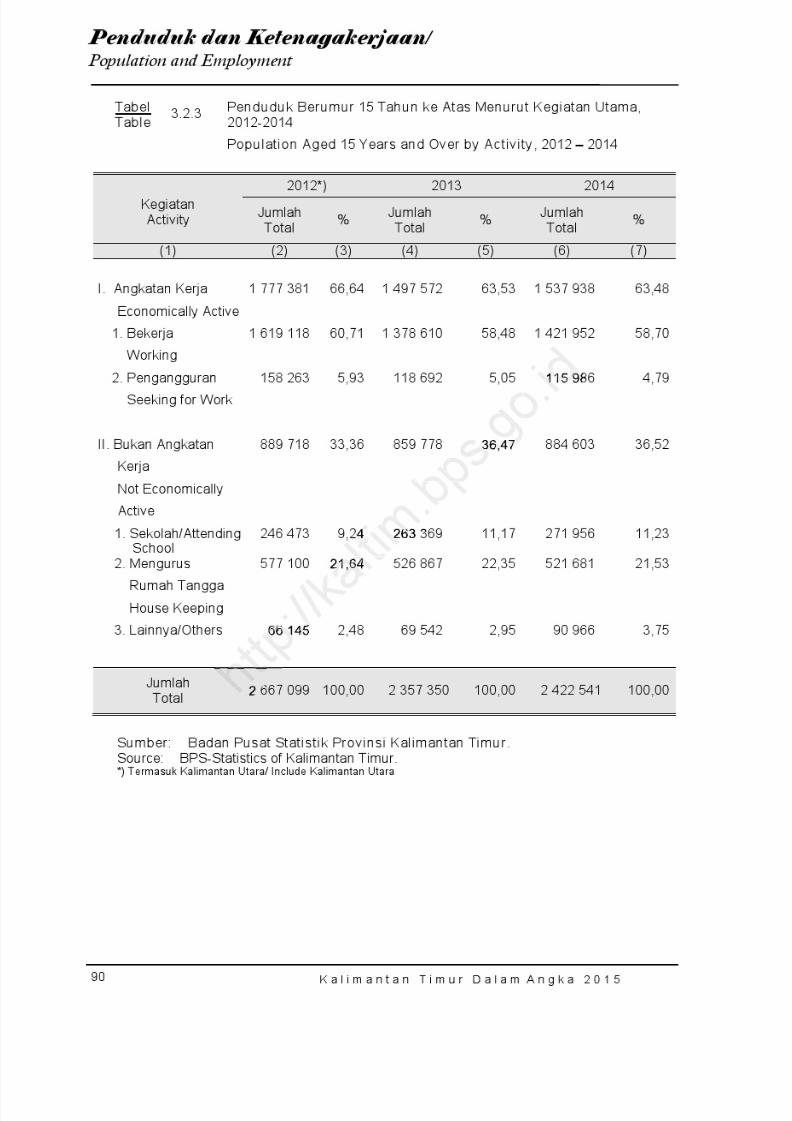
8/20/2019 Kalimantan Timur Dalam Angka Tahun 2015
http://slidepdf.com/reader/full/kalimantan-timur-dalam-angka-tahun-2015 156/623
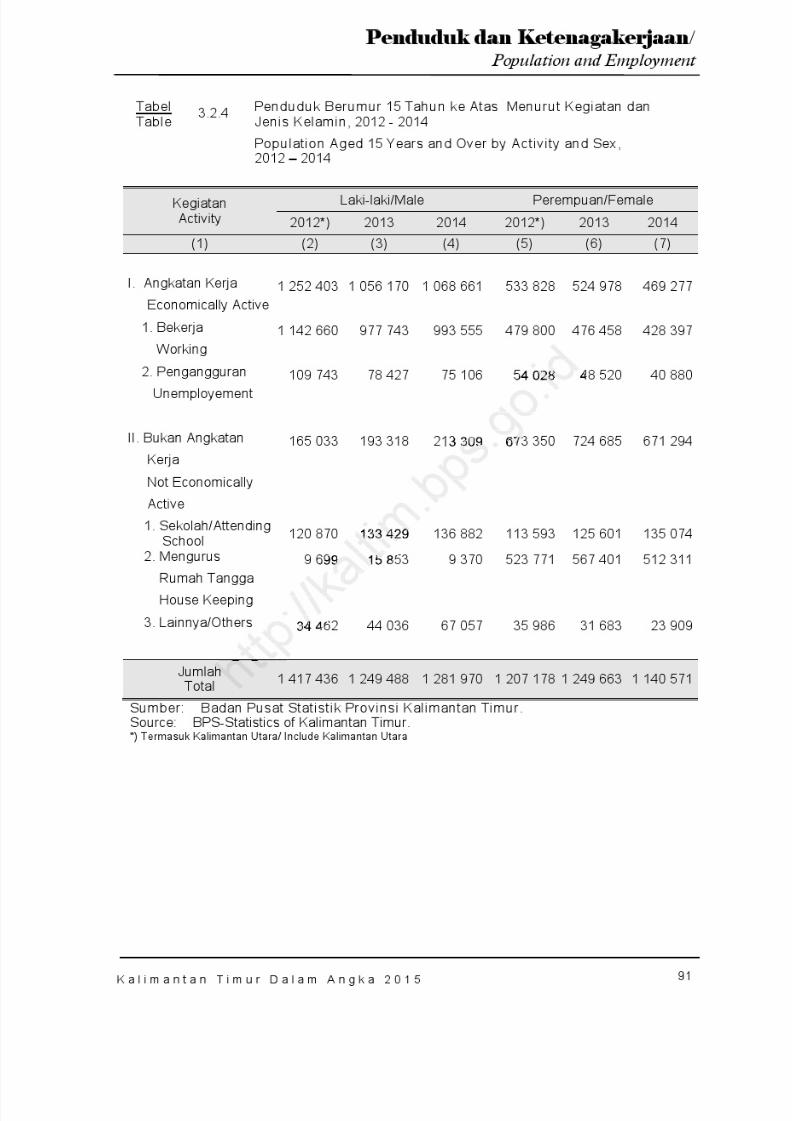
8/20/2019 Kalimantan Timur Dalam Angka Tahun 2015
http://slidepdf.com/reader/full/kalimantan-timur-dalam-angka-tahun-2015 157/623
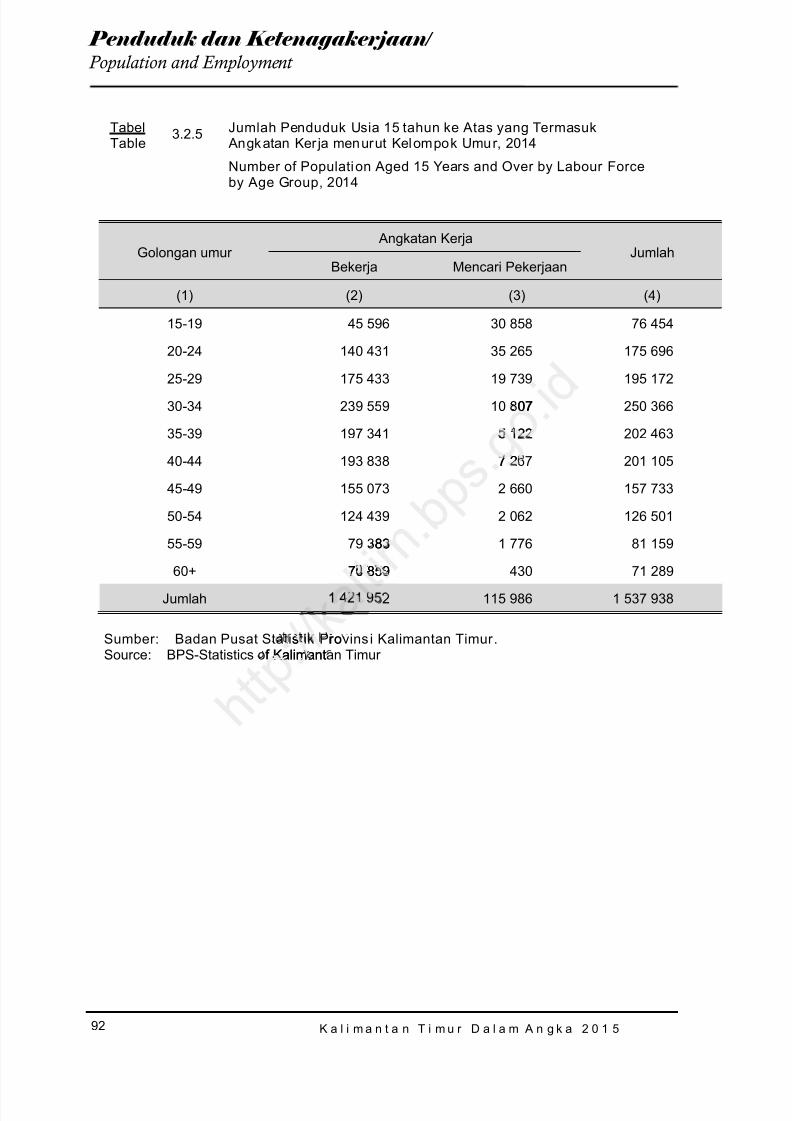
8/20/2019 Kalimantan Timur Dalam Angka Tahun 2015
http://slidepdf.com/reader/full/kalimantan-timur-dalam-angka-tahun-2015 158/623
K a l i m a n t a n T i m u r D a l a m A n g k a 2 0 1 5
92
Penduduk dan Ketenagakerjaan / Population and Employment
TabelTable
3.2.5 Jumlah Penduduk Usia 15 tahun ke Atas yang Termasuk Angkatan Ker ja menurut Kelompok Umur, 2014
Number of Population Aged 15 Years and Over by Labour Forceby Age Group, 2014
Golongan umur Angkatan Kerja
JumlahBekerja Mencari Pekerjaan
(1) (2) (3) (4)
15-19 45 596 30 858 76 454
20-24 140 431 35 265 175 696
25-29 175 433 19 739 195 17230-34 239 559 10 807 250 366
35-39 197 341 5 122 202 463
40-44 193 838 7 267 201 105
45-49 155 073 2 660 157 733
50-54 124 439 2 062 126 501
55-59 79 383 1 776 81 159
60+ 70 859 430 71 289Jumlah 1 421 952 115 986 1 537 938
Sumber: Badan Pusat Statistik Provins i Kalimantan Timur .Source : BPS-Statistics of Kalimantan Timur
07
5 122
7 2
83
70 859
s rof Kalimant
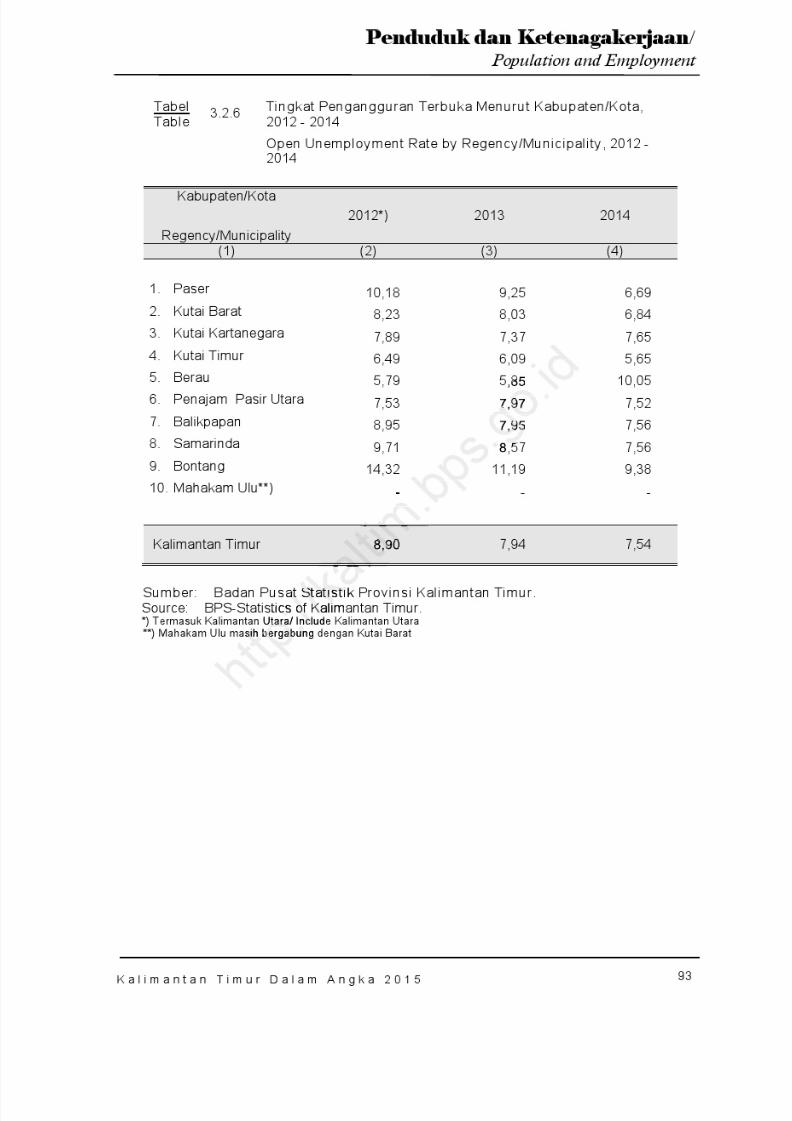
8/20/2019 Kalimantan Timur Dalam Angka Tahun 2015
http://slidepdf.com/reader/full/kalimantan-timur-dalam-angka-tahun-2015 159/623
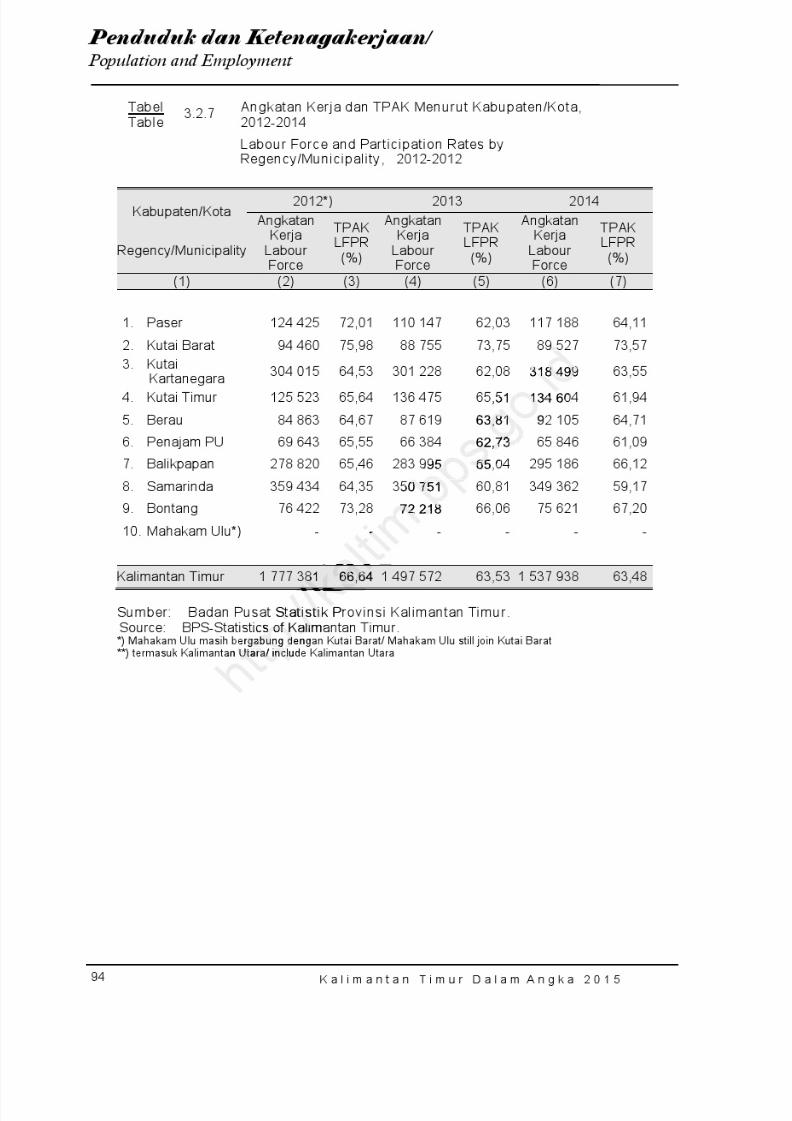
8/20/2019 Kalimantan Timur Dalam Angka Tahun 2015
http://slidepdf.com/reader/full/kalimantan-timur-dalam-angka-tahun-2015 160/623
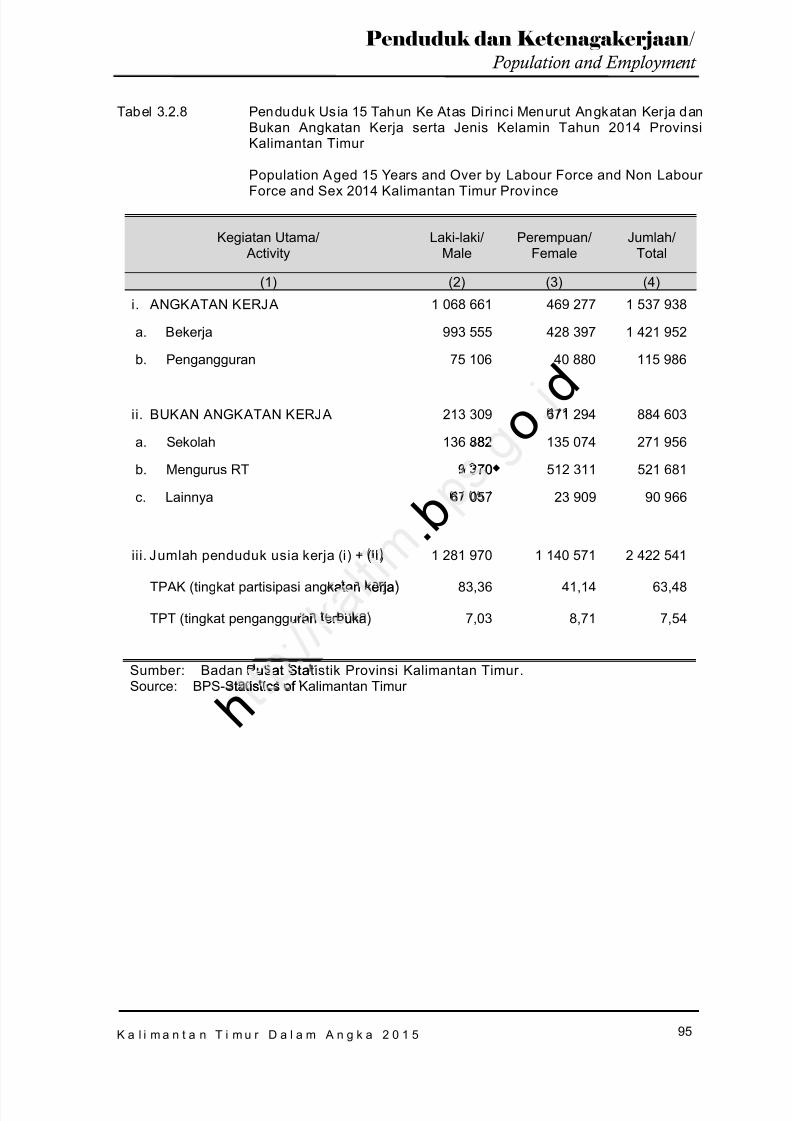
8/20/2019 Kalimantan Timur Dalam Angka Tahun 2015
http://slidepdf.com/reader/full/kalimantan-timur-dalam-angka-tahun-2015 161/623
K a l i m a n t a n T i m u r D a l a m A n g k a 2 0 1 5
95
Penduduk dan Ketenagakerjaan / Population and Employment
Tabel 3.2.8 Penduduk Usia 15 Tahun Ke Atas Dirinci Menurut Angkatan Kerja danBukan Angkatan Kerja serta Jenis Kelamin Tahun 2014 ProvinsiKalimantan Timur
Population Aged 15 Years and Over by Labour Force and Non Labour
Force and Sex 2014 Kalimantan Timur Province
Kegiatan Utama/ Activity
Laki-laki/Male
Perempuan/Female
Jumlah/Total
(1) (2) (3) (4)
i. ANGKATAN KERJA 1 068 661 469 277 1 537 938
a. Bekerja 993 555 428 397 1 421 952
b. Pengangguran 75 106 40 880 115 986
ii. BUKAN ANGKATAN KERJA 213 309 671 294 884 603
a. Sekolah 136 882 135 074 271 956
b. Mengurus RT 9 370 512 311 521 681
c. Lainnya 67 057 23 909 90 966
iii. Jumlah penduduk usia kerja (i) + (ii) 1 281 970 1 140 571 2 422 541
TPAK (tingkat partisipasi angkatan kerja) 83,36 41,14 63,48
TPT (tingkat pengangguran terbuka) 7,03 8,71 7,54
Sumber: Badan Pusat Statistik Provinsi Kalimantan Timur .Source : BPS-Statistics of Kalimantan Timur
h
. b . o
d 82
9 370
a an er a
an er u
usat Statatistics of
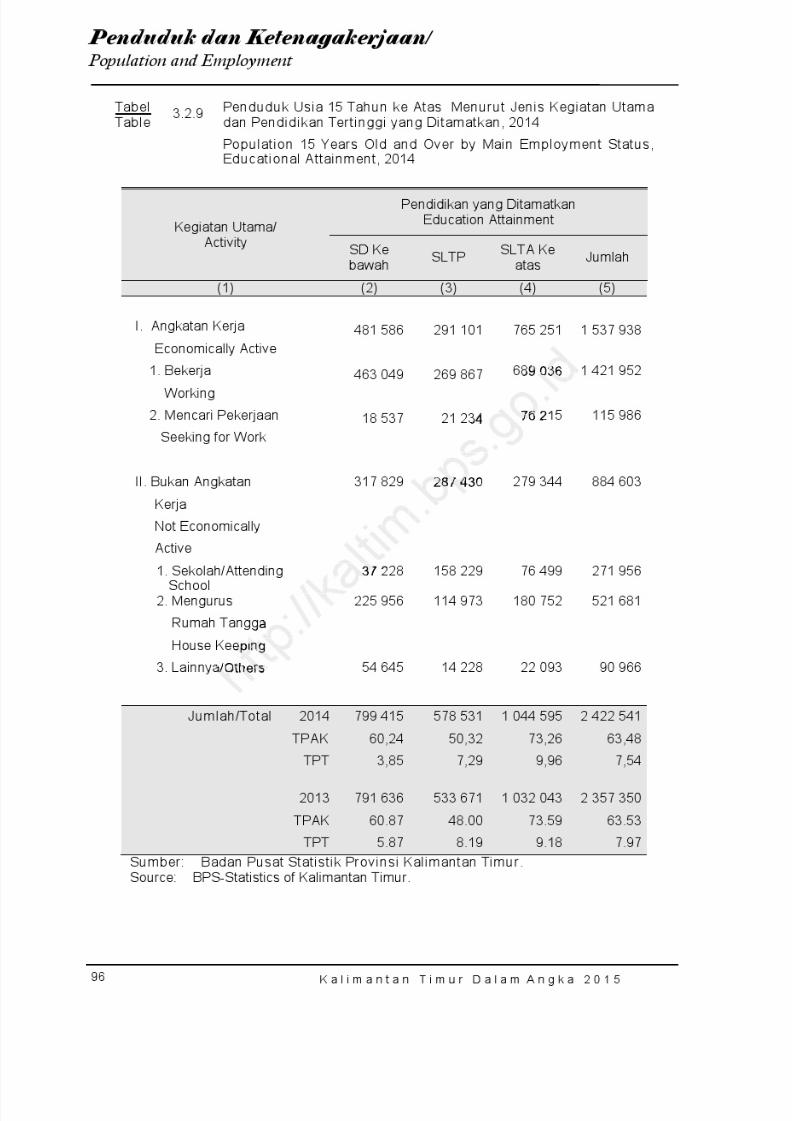
8/20/2019 Kalimantan Timur Dalam Angka Tahun 2015
http://slidepdf.com/reader/full/kalimantan-timur-dalam-angka-tahun-2015 162/623
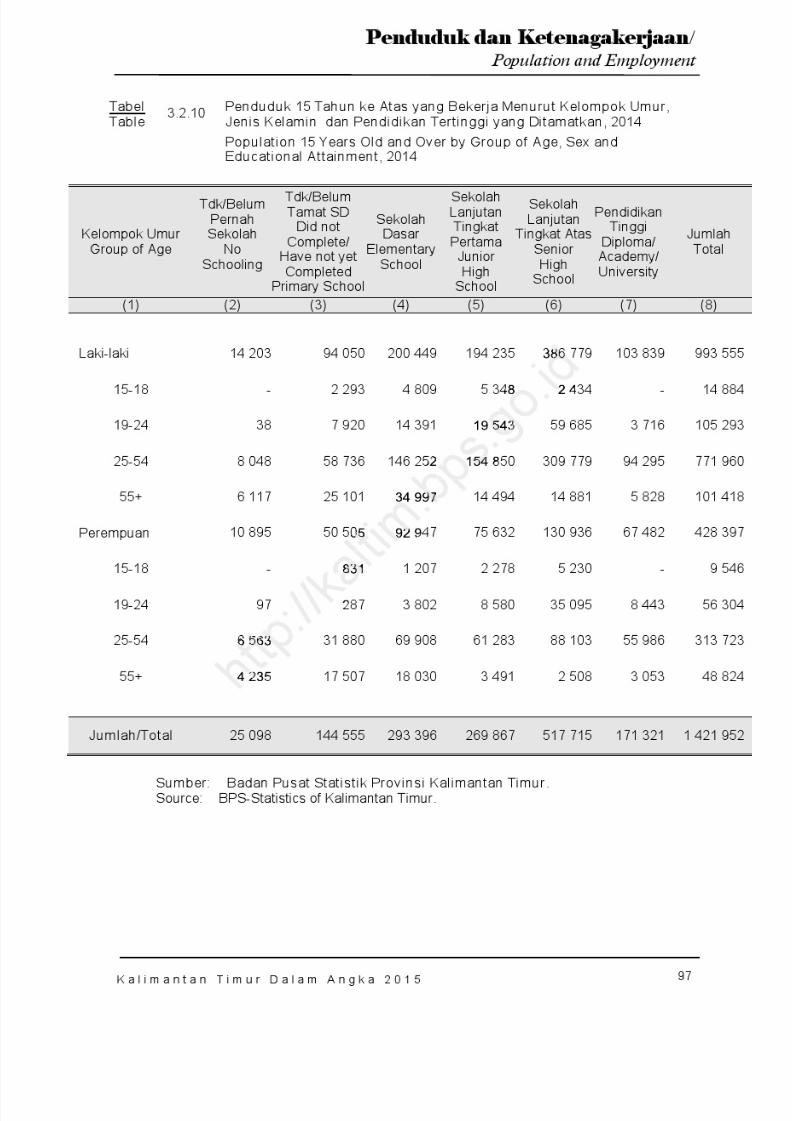
8/20/2019 Kalimantan Timur Dalam Angka Tahun 2015
http://slidepdf.com/reader/full/kalimantan-timur-dalam-angka-tahun-2015 163/623
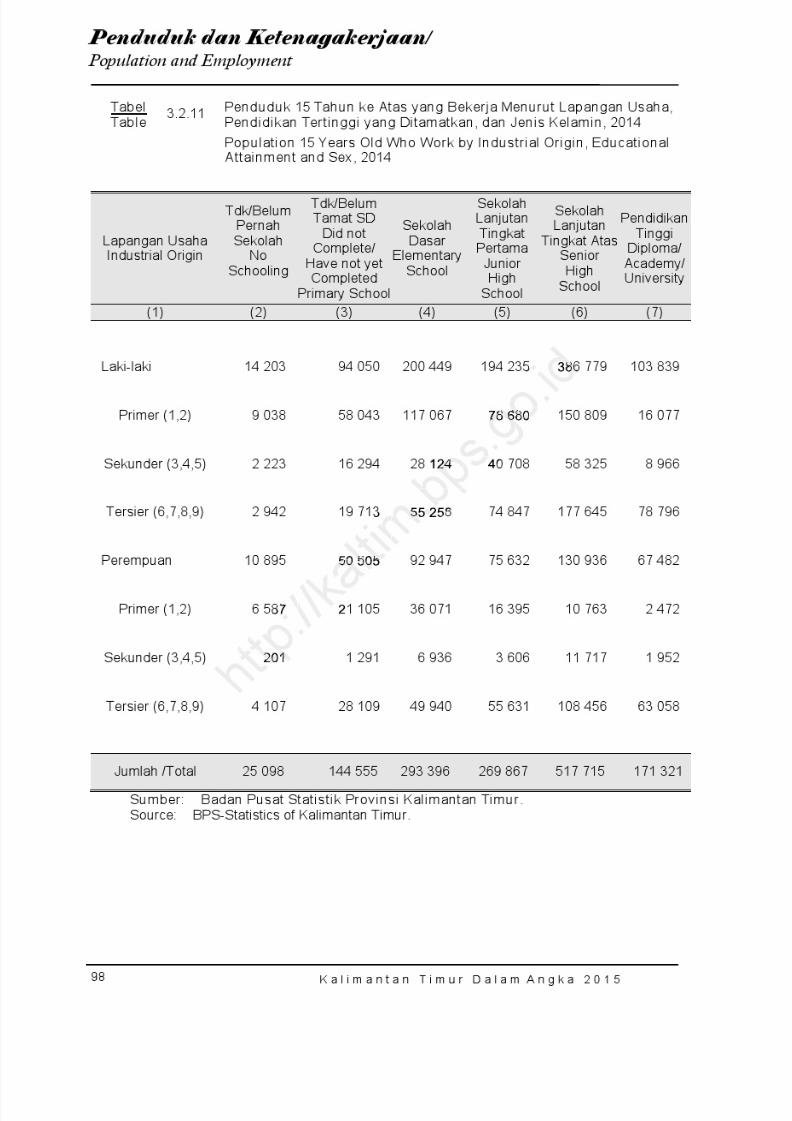
8/20/2019 Kalimantan Timur Dalam Angka Tahun 2015
http://slidepdf.com/reader/full/kalimantan-timur-dalam-angka-tahun-2015 164/623
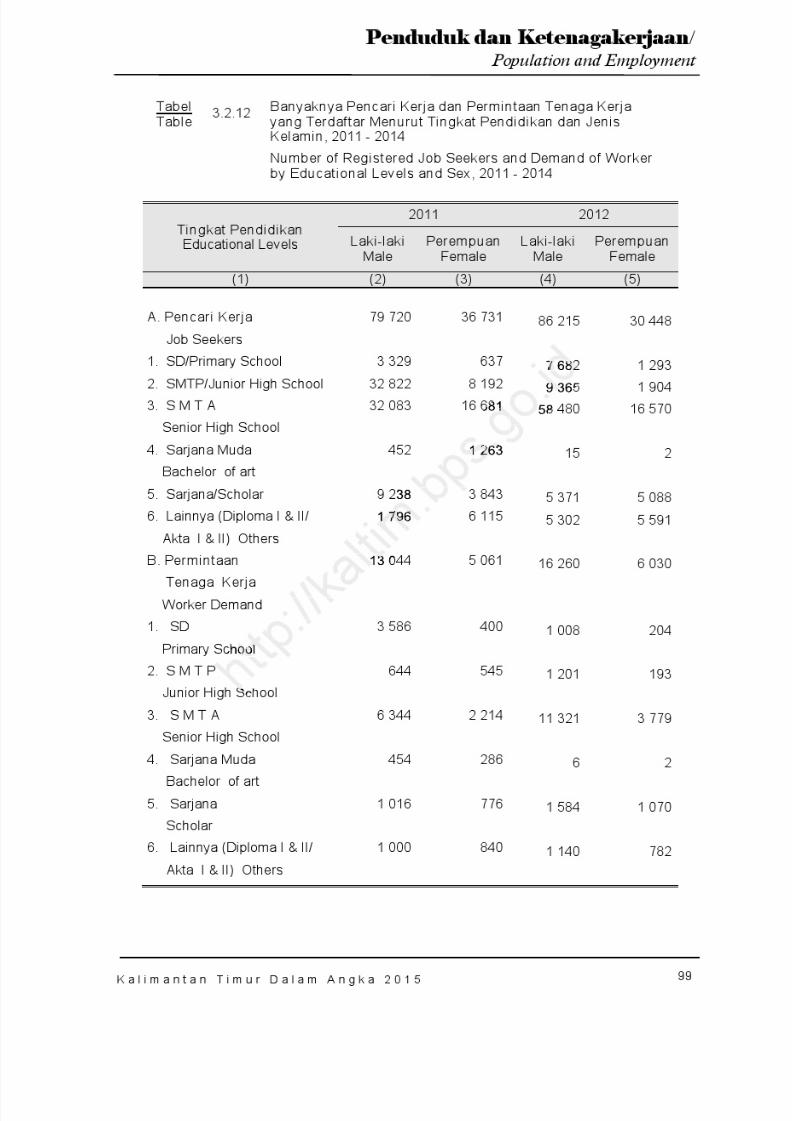
8/20/2019 Kalimantan Timur Dalam Angka Tahun 2015
http://slidepdf.com/reader/full/kalimantan-timur-dalam-angka-tahun-2015 165/623
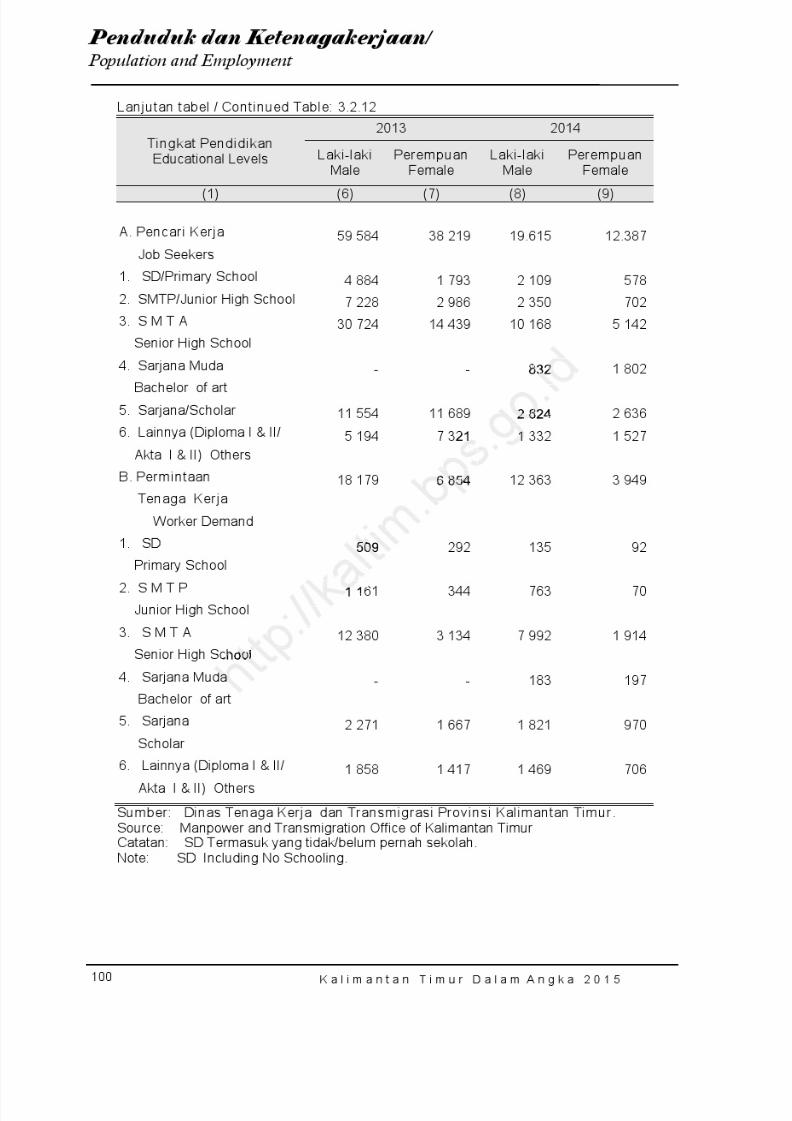
8/20/2019 Kalimantan Timur Dalam Angka Tahun 2015
http://slidepdf.com/reader/full/kalimantan-timur-dalam-angka-tahun-2015 166/623
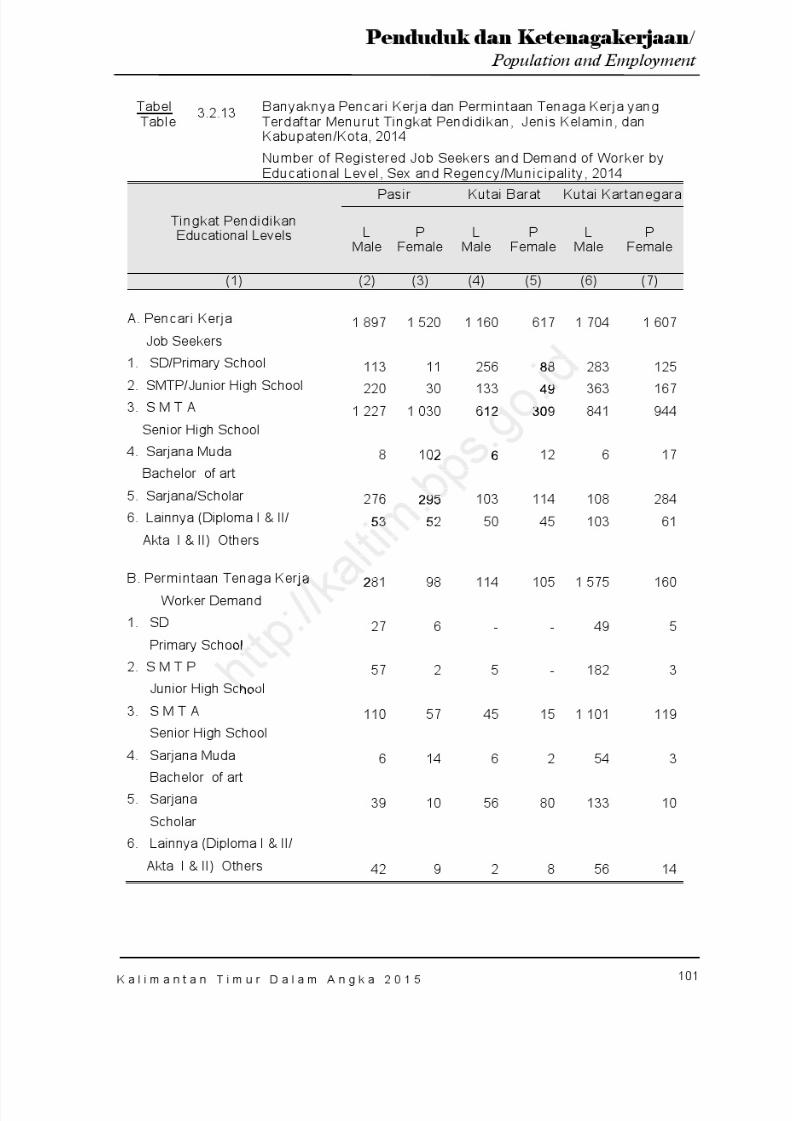
8/20/2019 Kalimantan Timur Dalam Angka Tahun 2015
http://slidepdf.com/reader/full/kalimantan-timur-dalam-angka-tahun-2015 167/623
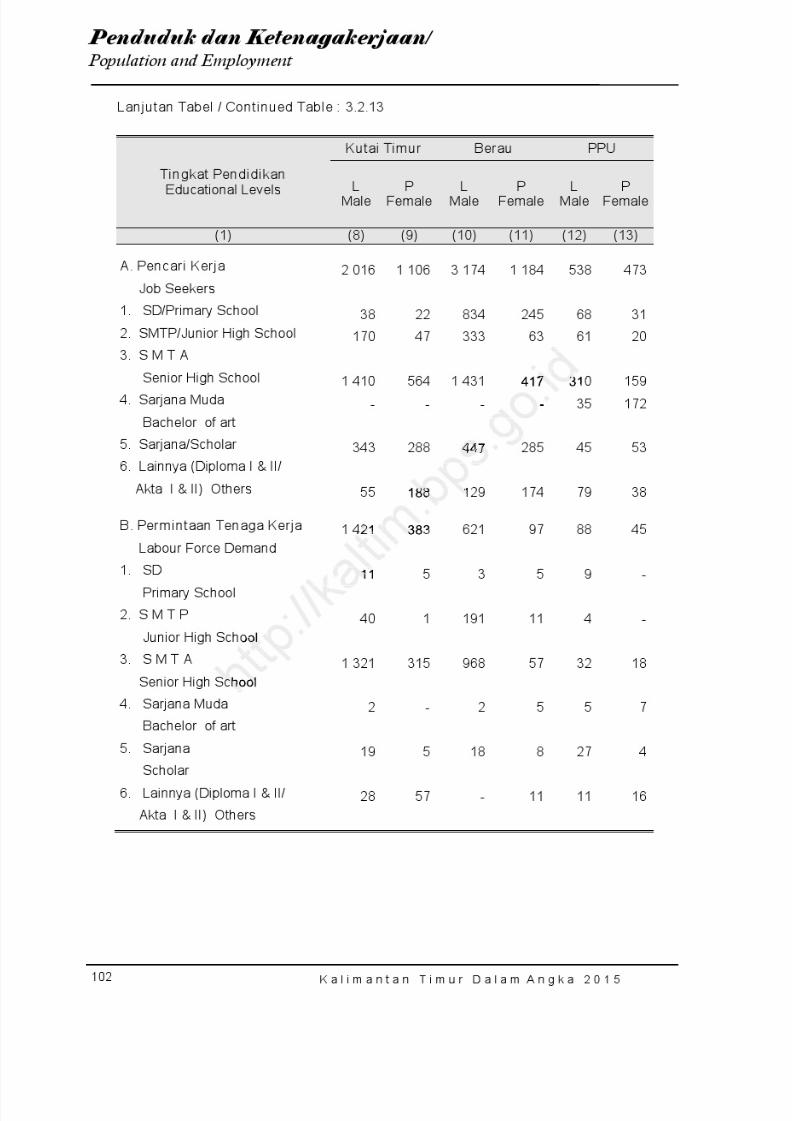
8/20/2019 Kalimantan Timur Dalam Angka Tahun 2015
http://slidepdf.com/reader/full/kalimantan-timur-dalam-angka-tahun-2015 168/623
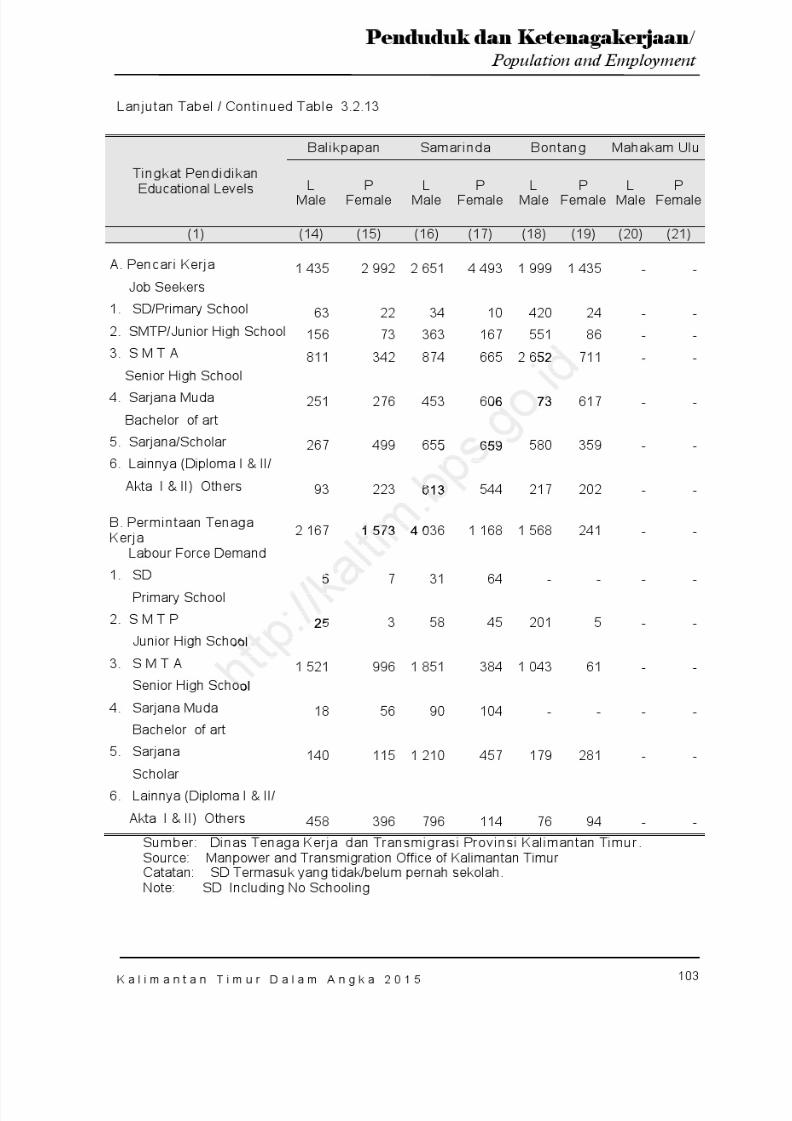
8/20/2019 Kalimantan Timur Dalam Angka Tahun 2015
http://slidepdf.com/reader/full/kalimantan-timur-dalam-angka-tahun-2015 169/623
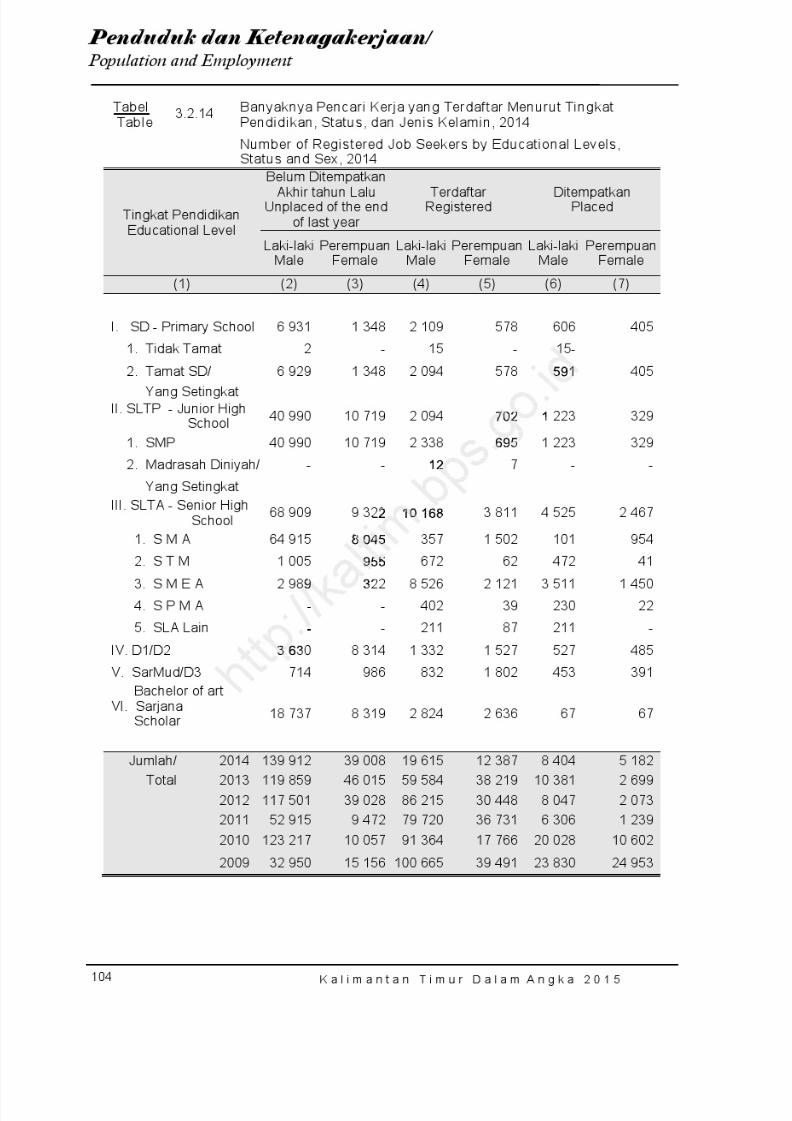
8/20/2019 Kalimantan Timur Dalam Angka Tahun 2015
http://slidepdf.com/reader/full/kalimantan-timur-dalam-angka-tahun-2015 170/623
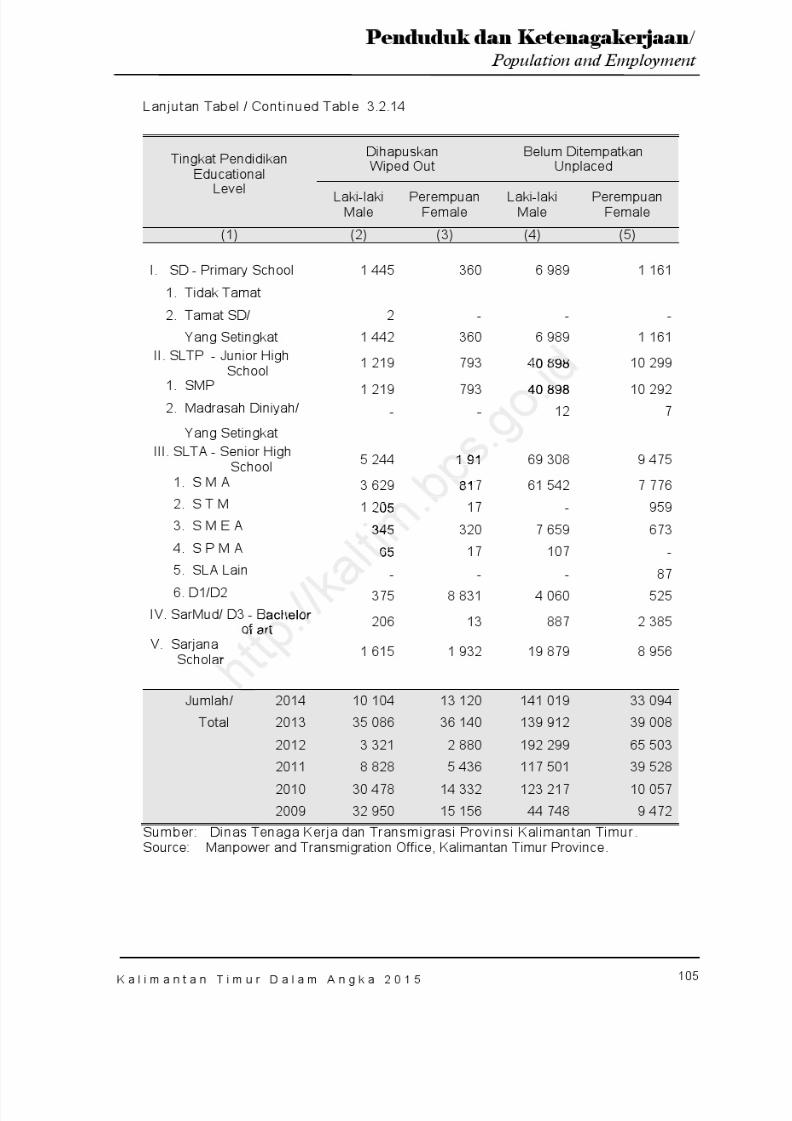
8/20/2019 Kalimantan Timur Dalam Angka Tahun 2015
http://slidepdf.com/reader/full/kalimantan-timur-dalam-angka-tahun-2015 171/623

8/20/2019 Kalimantan Timur Dalam Angka Tahun 2015
http://slidepdf.com/reader/full/kalimantan-timur-dalam-angka-tahun-2015 172/623

8/20/2019 Kalimantan Timur Dalam Angka Tahun 2015
http://slidepdf.com/reader/full/kalimantan-timur-dalam-angka-tahun-2015 173/623
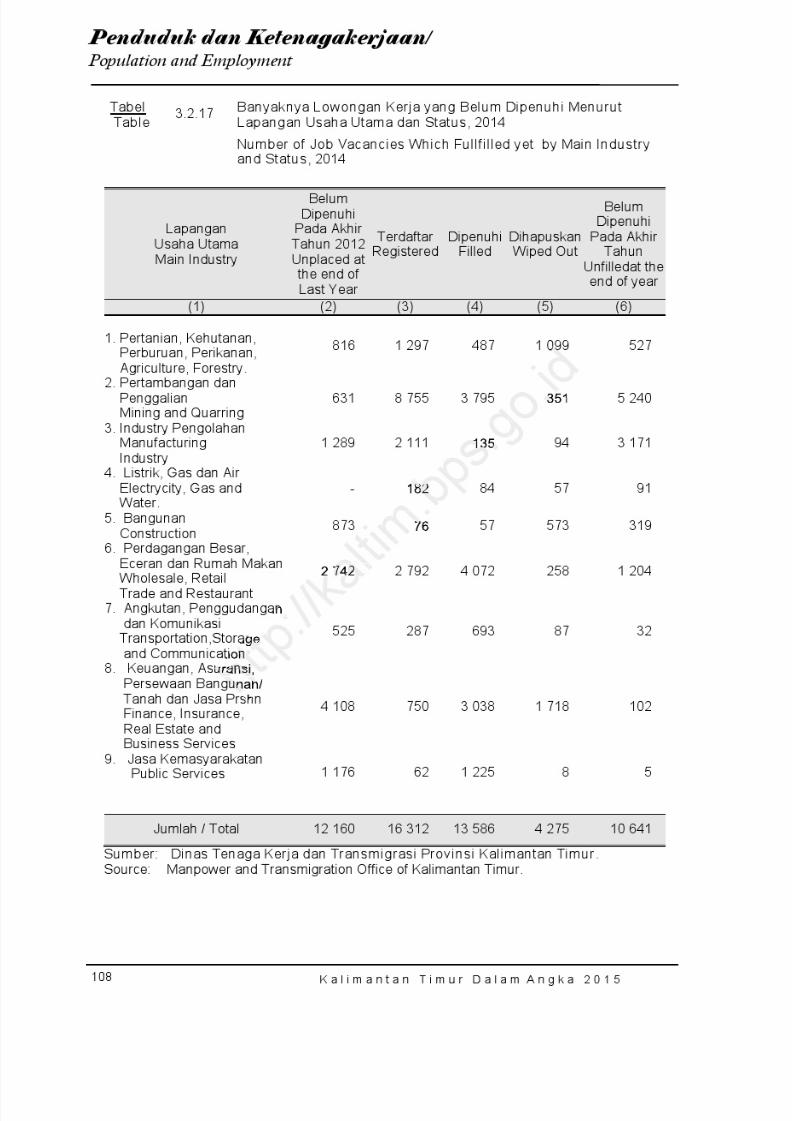
8/20/2019 Kalimantan Timur Dalam Angka Tahun 2015
http://slidepdf.com/reader/full/kalimantan-timur-dalam-angka-tahun-2015 174/623
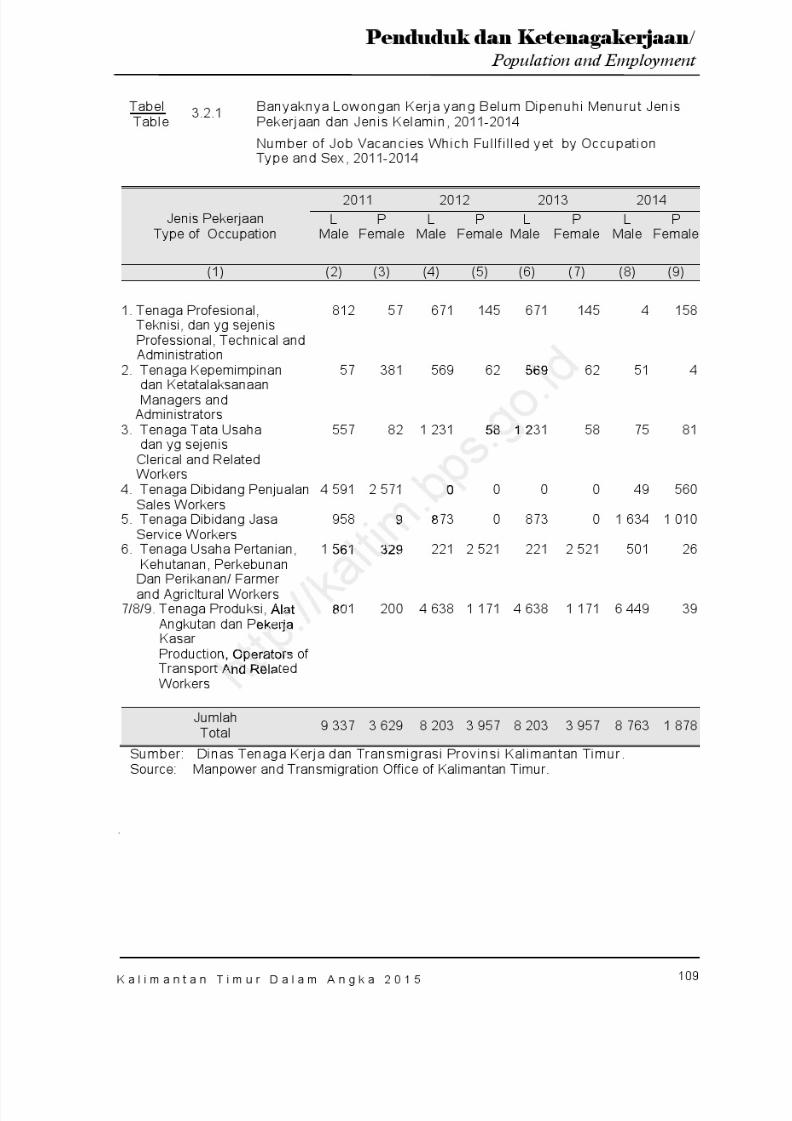
8/20/2019 Kalimantan Timur Dalam Angka Tahun 2015
http://slidepdf.com/reader/full/kalimantan-timur-dalam-angka-tahun-2015 175/623
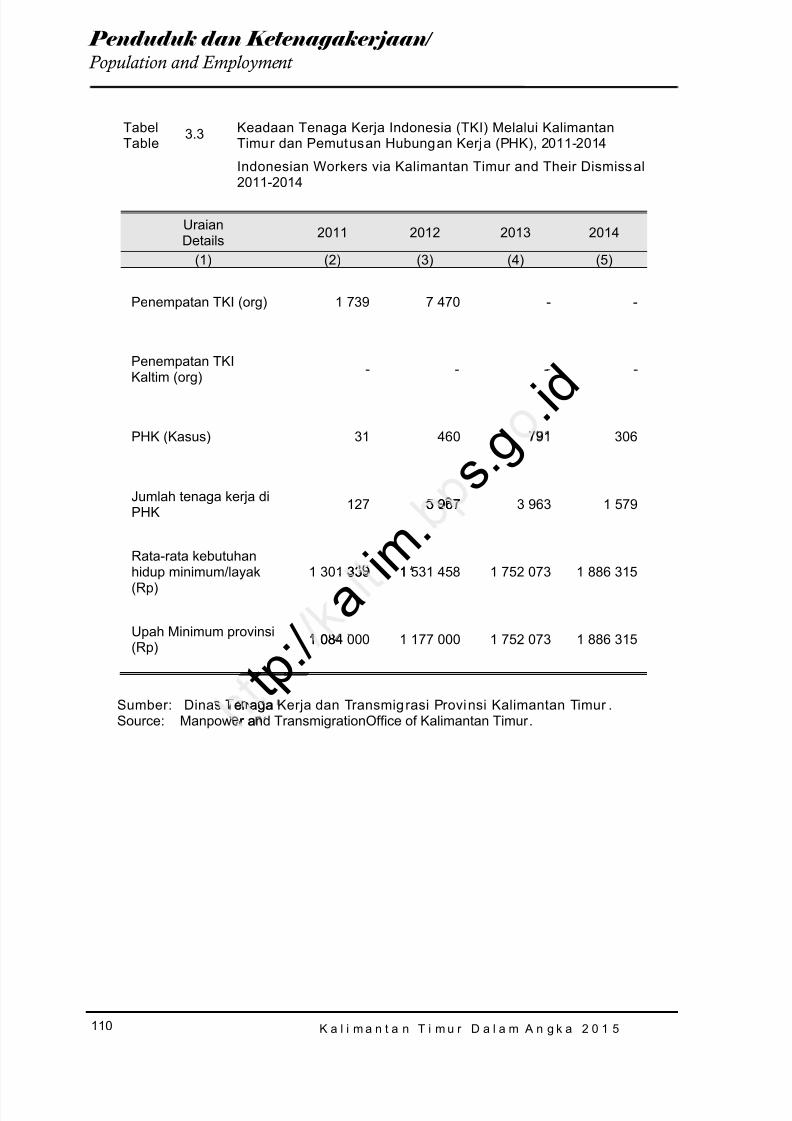
8/20/2019 Kalimantan Timur Dalam Angka Tahun 2015
http://slidepdf.com/reader/full/kalimantan-timur-dalam-angka-tahun-2015 176/623
K a l i m a n t a n T i m u r D a l a m A n g k a 2 0 1 5
110
Penduduk dan Ketenagakerjaan / Population and Employment
TabelTable
3.3 Keadaan Tenaga Kerja Indonesia (TKI) Melalui KalimantanTimur dan Pemutusan Hubungan Kerja (PHK), 2011-2014
Indonesian Workers via Kalimantan Timur and Their Dismissal2011-2014
UraianDetails 2011 2012 2013 2014
(1) (2) (3) (4) (5)
Penempatan TKI (org) 1 739 7 470 - -
Penempatan TKI
Kaltim (org)- - - -
PHK (Kasus) 31 460 791 306
Jumlah tenaga kerja diPHK 127 5 967 3 963 1 579
Rata-rata kebutuhan
hidup minimum/layak(Rp) 1 301 339 1 531 458 1 752 073 1 886 315
Upah Minimum provinsi(Rp) 1 084 000 1 177 000 1 752 073 1 886 315
Sumber: Dinas Tenaga Kerja dan Transmigrasi Provinsi Kalimantan Timur .Source : Manpower and TransmigrationOffice of Kalimantan Timur .
t p : /
a i m .
s . g . i d
5 967
339 1
1 08
Tenagar a
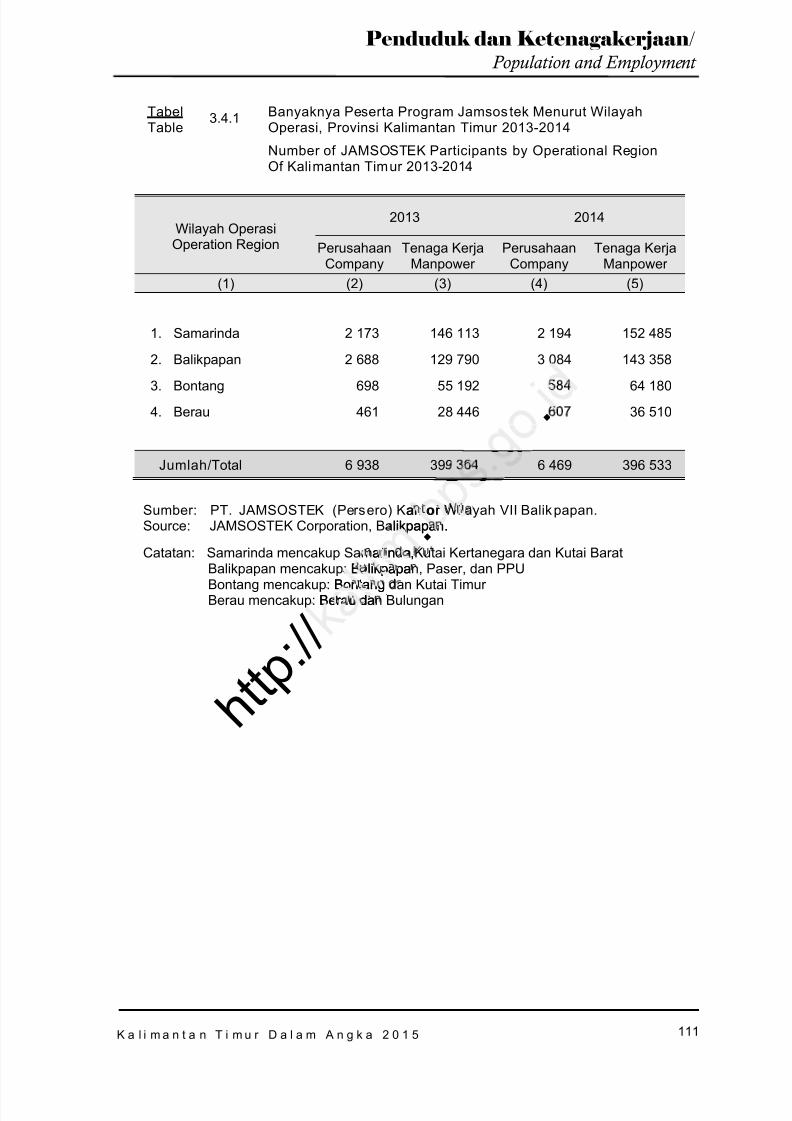
8/20/2019 Kalimantan Timur Dalam Angka Tahun 2015
http://slidepdf.com/reader/full/kalimantan-timur-dalam-angka-tahun-2015 177/623
K a l i m a n t a n T i m u r D a l a m A n g k a 2 0 1 5
111
Penduduk dan Ketenagakerjaan / Population and Employment
TabelTable
3.4.1 Banyaknya Peserta Program Jamsos tek Menurut WilayahOperasi, Provinsi Kalimantan Timur 2013-2014
Number of JAMSOSTEK Participants by Operational RegionOf Kalimantan Timur 2013-2014
Wilayah OperasiOperation Region
2013 2014
PerusahaanCompany
Tenaga KerjaManpower
PerusahaanCompany
Tenaga KerjaManpower
(1) (2) (3) (4) (5)
1. Samarinda 2 173 146 113 2 194 152 485
2. Balikpapan 2 688 129 790 3 084 143 358
3. Bontang 698 55 192 584 64 1804. Berau 461 28 446 607 36 510
Jumlah/ Total 6 938 399 364 6 469 396 533
Sumber: PT. JAMSOSTEK (Persero) Kantor Wilayah VII Balikpapan.Source : JAMSOSTEK Corporation, Balikpapan .
Catatan: Samarinda mencakup Samarinda,Kutai Kertanegara dan Kutai Barat
Balikpapan mencakup: Balikpapan, Paser, dan PPUBontang mencakup: Bontang dan Kutai TimurBerau mencakup: Berau dan Bulungan
.
h t t p : / /
. an orlikpapan .
ar n a,
BalikpapaBontangBerau da
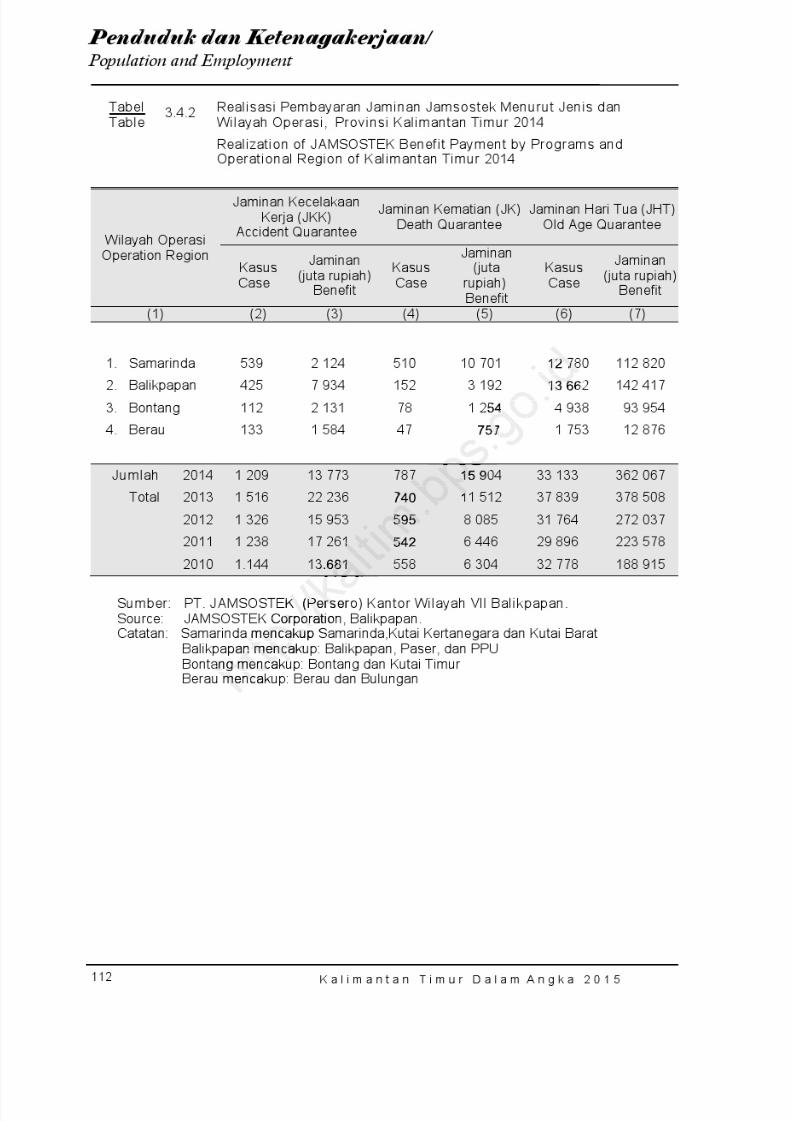
8/20/2019 Kalimantan Timur Dalam Angka Tahun 2015
http://slidepdf.com/reader/full/kalimantan-timur-dalam-angka-tahun-2015 178/623
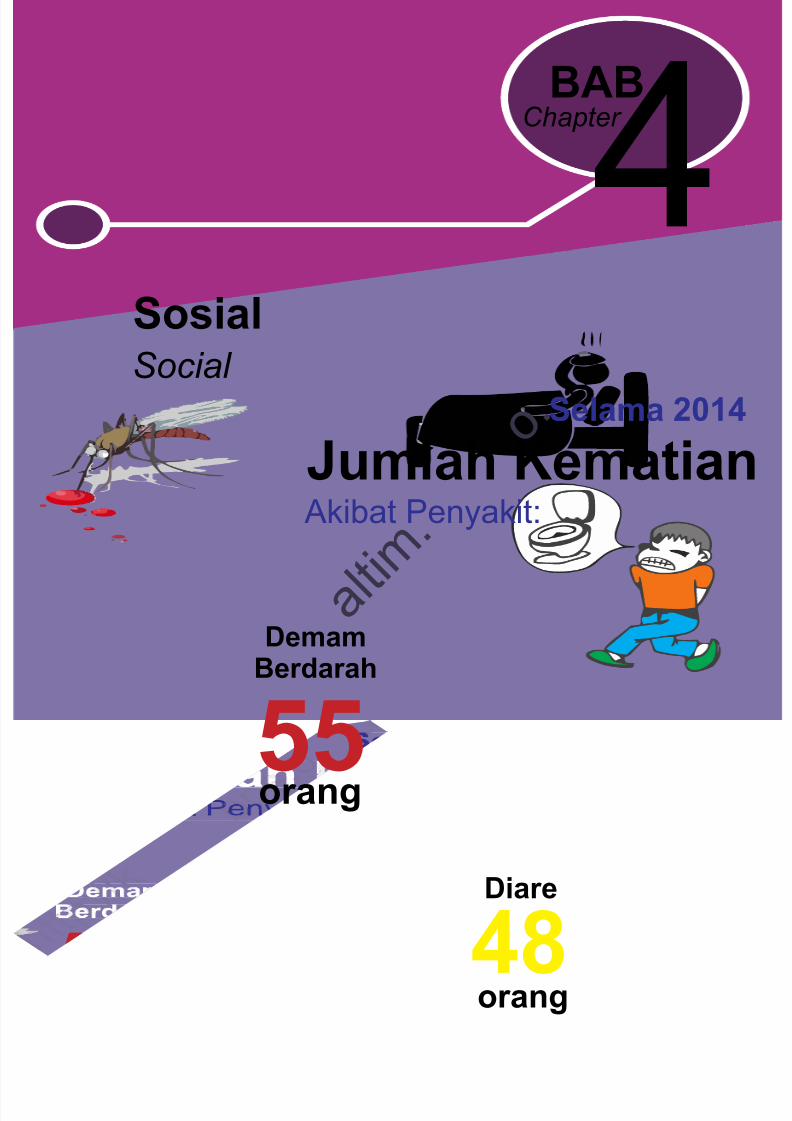
8/20/2019 Kalimantan Timur Dalam Angka Tahun 2015
http://slidepdf.com/reader/full/kalimantan-timur-dalam-angka-tahun-2015 179/623
4Sosial
BABChapter
Social Selama 2014
Jumlah Kematian
Diare
Akibat Penyakit:
48orang
DemamBerdarah
55orang
o .
a l t i m .

8/20/2019 Kalimantan Timur Dalam Angka Tahun 2015
http://slidepdf.com/reader/full/kalimantan-timur-dalam-angka-tahun-2015 180/623
h t t p : / / k a l t i m
. b p s . g o . i d
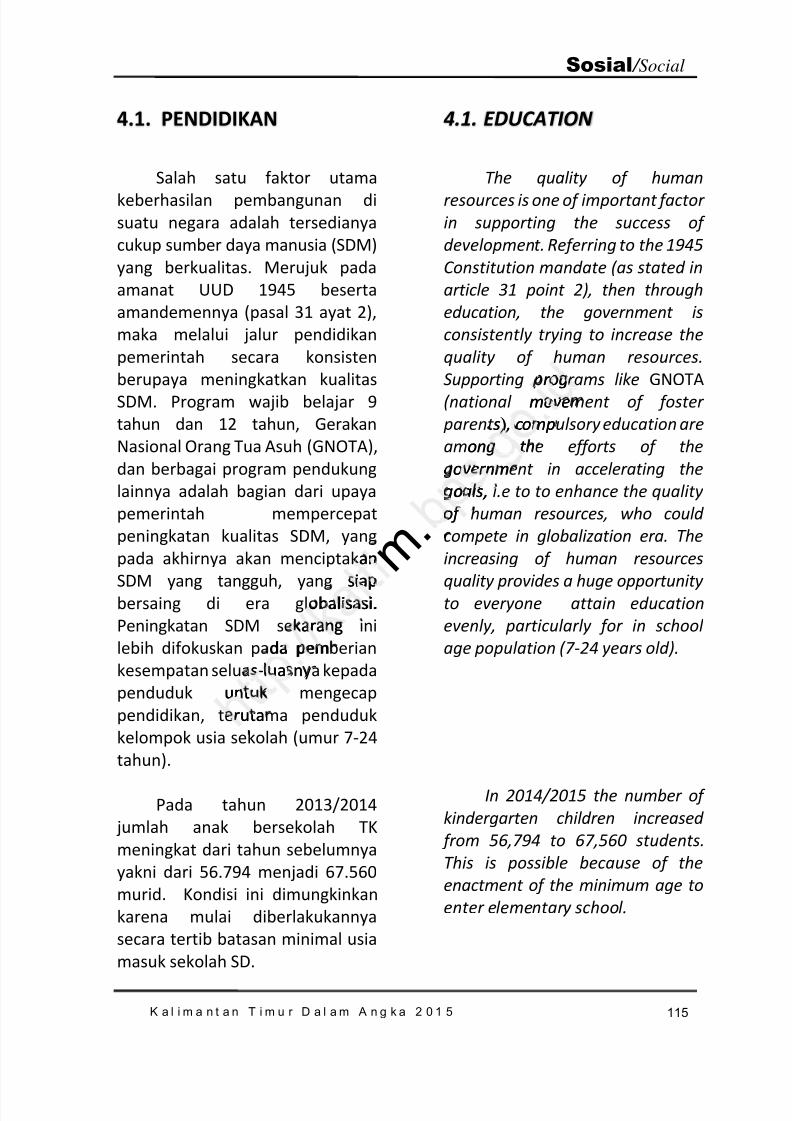
8/20/2019 Kalimantan Timur Dalam Angka Tahun 2015
http://slidepdf.com/reader/full/kalimantan-timur-dalam-angka-tahun-2015 181/623
K a l i m a n t a n T i m u r D a l a m A n g k a 2 0 1 5 115
Sosial / Social
4.1. PENDIDIKAN
Salah satu faktor utamakeberhasilan pembangunan disuatu negara adalah tersedianyacukup sumber daya manusia (SDM)yang berkualitas. Merujuk padaamanat UUD 1945 besertaamandemennya (pasal 31 ayat 2),maka melalui jalur pendidikanpemerintah secara konsisten
berupaya meningkatkan kualitasSDM. Program wajib belajar 9tahun dan 12 tahun, GerakanNasional Orang Tua Asuh (GNOTA),dan berbagai program pendukunglainnya adalah bagian dari upayapemerintah mempercepatpeningkatan kualitas SDM, yangpada akhirnya akan menciptakanSDM yang tangguh, yang siapbersaing di era globalisasi.Peningkatan SDM sekarang inilebih difokuskan pada pemberiankesempatan seluas-luasnya kepadapenduduk untuk mengecappendidikan, terutama pendudukkelompok usia sekolah (umur 7-24
tahun).
Pada tahun 2013/2014 jumlah anak bersekolah TKmeningkat dari tahun sebelumnyayakni dari 56.794 menjadi 67.560murid. Kondisi ini dimungkinkankarena mulai diberlakukannyasecara tertib batasan minimal usia
masuk sekolah SD.
4.1. EDUCATION
The quality of humanresources is one of important factorin supporting the success ofdevelopment. Referring to the 1945Constitution mandate (as stated inarticle 31 point 2), then througheducation, the government isconsistently trying to increase thequality of human resources.
Supporting programs like GNOTA (national movement of foster parents ) , compulsory education areamong the efforts of thegovernment in accelerating thegoals, i.e to to enhance the qualityof human resources, who couldcompete in globalization era. Theincreasing of human resourcesquality provides a huge opportunityto everyone attain educationevenly, particularly for in schoolage population (7-24 years old).
In 2014/2015 the number ofkindergarten children increased from 56,794 to 67,560 students.This is possible because of theenactment of the minimum age toenter elementary school.
rogmove
m .
ansiap
balisasi.arang
da pems- uasn
unturuta
s) , compong t
overnmgoa s,of
8/20/2019 Kalimantan Timur Dalam Angka Tahun 2015
http://slidepdf.com/reader/full/kalimantan-timur-dalam-angka-tahun-2015 182/623
Sosial / Social
K a l i m a n t a n T i m u r D a l a m A n g k a 2 0 1 5116
Pada periode yang sama jumlahanak bersekolah di SD Negerimengalami peningkatan yaitu dari360.317 murid menjadi 363.096murid. Sama hal nya dengan SDswasta mengalami peningkatandari 43.546 murid menjadi 46.808murid. Sedangkan untuk jumlahguru TK dan SD masing-masing4.799 orang, SD negeri 22.036orang dan SD swasta 2.934 orang.Sehingga ratio jumlah murid
terhadap guru untuk TK 14 , SDnegeri 16 dan SD swasta 16 orang.
Untuk sekolah lanjutan baiklanjutan pertama (SLTP) maupunMenengah (SLTA) mengalamifluktuasi jumlah muridnya. Tahun2014/2015 jumlah murid padatingkat SLTP negeri 119.882 murid,swasta 28.229 murid. Sedangkanuntuk SMU negeri dan swasta48.484 dan 8.681 murid. Dariangka tersebut terlihat bahwapada tingkat SLTP dan SMU sekolahberstatus negeri lebih diminati.
In same periode the number of public elementary school childrenhas increased from 387,843 to360,317 students. As for the privateelementary school studentsincreased from 43,269 to 43,546students. As for the number ofteachers in kindergartens andelementary schools public and private respectively 4,699 peopleand 14,872 person and private7,387 people. So that the ratio of
students to teachers forkindergarten is 15, 22 for SD and 14 for private elementary school.
The number of student inboth junior high school (junior) andsecondary school (high school) fluctuated. In 2013/2014 thenumber of students in public juniorschool were 111,816 students, andthe private junior school were26,881 students. While public and private high school were 47,150and 9,472 students. Of these figures shows that the level of junior and senior high schools
public more desirable.
.
tis
t i
s .
da
uri ,,ang a
an swmurid.
ter i an
15, 2e eleme
Thboth jse
8/20/2019 Kalimantan Timur Dalam Angka Tahun 2015
http://slidepdf.com/reader/full/kalimantan-timur-dalam-angka-tahun-2015 183/623
K a l i m a n t a n T i m u r D a l a m A n g k a 2 0 1 5 117
Sosial / Social
4.2. KESEHATAN
Pembangunan sektor
Kesehatan meliputi seluruh siklusatau tahapan kehidupan manusia.Bila pembangunan kesehatanberhasil dengan baik, maka secaralangsung atau tidak langsung akanmeningkatkan kesejahteraan.Kebijakan pembangunan sektorKesehatan adalah bagian yangsangat penting dalammeningkatkan sumber dayamanusia, program kesehatan telahdimulai atau bahkan prioritasutama pada generasi berikutnyaterutama calon bayi (ibu hamil) dananak-anak berusia di bawah limatahun (balita).
Pada tahun 2012 KalimantanTimur sudah terpisah denganKalimantan Utara. Di KalimantanTimur tahun 2014 terdapat 180unit puskesmas dan 661 unit Pustutersebar di seluruh wilayahoperasional kabupaten/kotatermasuk wilayah pedalamanKalimantan Timur. Peningkatan jumlah Puskesmas/Pustu sejalandengan jumlah dokter. Pada tahun2014 jumlah dokter di Puskesmassebanyak 607 orang.
4.2. HEALTH
Development of Health sectorcovers the entire cycle or stages ofhuman life. When the healthdevelopment is working well, thenit is directly or indirectly willincrease welfare. Policydevelopment sector of Health is avery important part in increasingthe human resources, the health
programs have been initiated oreven main priority on the nextgeneration particularly candidates for babies (pregnant women) andchildren aged under five years old(toddlers).
Kalimantan Timur in 2012 hasseparated with Kalimantan Utara.In Kalimantan Timur there are 180units and 661 units of sub healthcenters scattered throughout theoperational area of the district /city, including the interior ofKalimantan Timur. Increasing thenumber of health centers / sub in
line with the number of doctors. In2014 the number of doctors in thehealth center as much as 607 people.
ave
m . b
ntandengana imant
erdapat n 661 u
seluruhka
n priorition par
abies (hildrentoddl

8/20/2019 Kalimantan Timur Dalam Angka Tahun 2015
http://slidepdf.com/reader/full/kalimantan-timur-dalam-angka-tahun-2015 184/623
Sosial / Social
K a l i m a n t a n T i m u r D a l a m A n g k a 2 0 1 5118
Jumlah rumah sakit padatahun 2014 sebanyak 42 unitdengan jumlah tempat tidur 4.538tempat tidur.
Peningkatan jumlah pelayanankesehatan masih diperlukan untukmemenuhi kebutuhan kesehatanmasyarakat sekaligus secara tidaklangsung dapat mengurangi biayakesehatan untuk masyarakat luas.Jumlah dokter, tenaga medis,paramedis, non teknis medismengalami penurunan. Untukdokter umum pada tahun 2013berjumlah 1.007 orang dan tahun2014 menurun menjadi 908 orang.Demikian pula untuk dokterspesialis.
4.3 KEAMANAN DANKETERTIBAN MASYARAKAT
Pembangunan yangdiharapkan dapat membawapenduduk ke arah yang lebih majumasih sering dibarengi denganangka-angka kriminalitas terutamadari segi kuantitasnya. Akibatnyakeamanan dan ketertibanmasyarakat menjadi terganggu.
Demikian seterusnya,sehingga ada anggapanmeningkatnya angka kriminalitasmerupakan salah satu ekses darikemajuan yang telah dicapai olehsuatu daerah, terutama kemajuanyang belum dapat dinikmati olehpenduduk secara merata danmenimbulkan kesenjangan sosial.
The number of hospitals in2013 was 42 units by the number ofbeds was 4.538 beds.
The increasing number ofhealth care is still needed to meetof the health needs of peoples atonce can undirectly reducehealthcare costs for society atlarge. The number of doctors,medical personnel, paramedics,nontechnical medical decreased.
For doctors public in 2013 totaled1,007 people, and in 2014 to 908 people. Similarly to specialist physicians.
4.3. SOCIETY ORDER AND
SECURITY
Development is expected tobring the population to a moreadvanced are often coupled withcrime figures, especially in terms ofquantity. As a result, public orderand safety to be compromised.
So forth, so it was thought theincrease in crime is one of theexcesses of the progress achievedby the region, particularly the progress that can not be equallyenjoyed by residents and causingsocial inequality.
s .
ngawa
h majui deng
tas terunya. . k
nt
lic ine, and i
Simi arans.
4.3.
8/20/2019 Kalimantan Timur Dalam Angka Tahun 2015
http://slidepdf.com/reader/full/kalimantan-timur-dalam-angka-tahun-2015 185/623
K a l i m a n t a n T i m u r D a l a m A n g k a 2 0 1 5 119
Sosial / Social
Angka kriminalitas khususnyatindak kejahatan di daerah inidalam tiga tahun terakhircenderung berfluktuasi. Ini terlihatdari jumlah peristiwa kejahatanyang dilaporkan pada POLDAKaltim. Tercatat jumlah kejahatanyang dilaporkan dari 9.950 kasus(2012) meningkat menjadi 10.173kasus (2013) kemudian menurunkembali menjadi 9.918 kasus(2014).
Penyelesaian kasus olehPOLDA Kaltim terhadap peristiwakejahatan dan pelanggaran yangdilaporkan mengalamipeningkatan. Pada tahun 2013kasus yang dapat diselesaikanmencapai 6.686 kasus, sedangkanpada tahun 2014 yang dapatdiselesaikan menjadi 6.722 kasus.
Selama tahun 2014 jumlahnarapidana pada lembagapemasyarakatan yang ada diKementrian Hukum dan Hamwilayah Kalimantan Timurcenderung menurun. Berartibahwa tindak kejahatan
dimasyarakat semakin sedikit.
Crime, especially crimes in thisarea in the last three years is likelyto fluctuating. This is evident fromthe number of crime events werereported in Kalimantan TimurRegional Police. The number ofcrimes reported from 9,950 cases(2012) increased to 10,173 cases(2013), and decreased to 9,918cases (2014).
While the settlement of thecase by the Kalimantan TimurRegional Police on events andviolations reported crime hasincreased. In 2013 cases resolvedachieve 6,686 cases of the casesreported, and in 2013 that can becompleted 6,722 cases.
During the period of 2014 thenumber of inmates in correctionalinstitutions at the Ministry of Justice and Human Rights is likelyto decrease. This means that crimein the community is getting a bit..
s.
jumlalem
ang aum d
limantaen
he sthe K
a Po iations
ncreaseachiere
8/20/2019 Kalimantan Timur Dalam Angka Tahun 2015
http://slidepdf.com/reader/full/kalimantan-timur-dalam-angka-tahun-2015 186/623
Sosial / Social
K a l i m a n t a n T i m u r D a l a m A n g k a 2 0 1 5120
4.4. A G A M A
Kehidupan beragama diNegara Indonesia diatur sesuaipasal 29 UUD 1945 dan Pancasilasila pertama, yang berke-Tuhan-anserta menjamin kebebasanpenduduk memeluk suatu agamadan menjalankan ibadahkeagamaan sesuai dengan agamadan kepercayaan masing-masing.
Kehidupan beragama senantiasadibina dengan tujuan untukmenciptakan kehidupanmasyarakat yang serasi, seimbang,dan selaras yang diharapkan dapatmengatasi berbagai masalah sosialbudaya sebagai dampak dariglobalisasi dunia dewasa ini, yangmungkin dapat merusak mentalbangsa dan menghambatkemajuan, di samping untukmembina kerukunan hidup antarumat beragama.
Tahun 2014 PendudukKalimantan Timur sebagian besar(84,25 %) beragama Islam, 8,45persen Kristen Protestan, 3,88persen Kristen Katolik, 0,98 persenBudha, 2,33 persen Hindu, 0,06persen Konghuchu, serta 0,05persen lainnya.
4.4 RELIGION
Religious life in the State ofIndonesia is set in accordance with Article 29 UUD 1945 and the first principle of Pancasila, Belief in themilling and ensuring freedom of the population professed a religion andto worship according to religionand religious beliefs of each.Religious life always fostered with
the aim of creating a harmonioussociety, balance, and harmonywhich is expected to address avariety of cultural and social problems as a result of today'sworld of globalization, which maydamage the nation's mental andimpede progress, in addition to
foster harmony between religious people.
Residents of Kalimantan Timurin 2014 the majority (84,25 %) areMuslims, the rest 8.45 percents areProtestant, 3.88 percents are
Catholics, 0.98 percents areBuddhists, 2.33 percents are Hindu,0.06 percents are Confucianism,and 0.05 percents another.
tingance ,
: t i m
at
ntukp antar
4 Pse a
aexpecte
of culems a
or odamaimp
8/20/2019 Kalimantan Timur Dalam Angka Tahun 2015
http://slidepdf.com/reader/full/kalimantan-timur-dalam-angka-tahun-2015 187/623
K a l i m a n t a n T i m u r D a l a m A n g k a 2 0 1 5 121
Sosial / Social
Selain mendirikan saranaibadah, pemerintah juga turutmengelola berbagai kegiatanibadah keagamaan, terutama yangberhubungan langsung dengannegara lain, misalnya ibadah haji.Jumlah penduduk KalimantanTimur yang menunaikan ibadahhaji, yang pemberangkatannyadikelola oleh pemerintah melaluiDepartemen Agama, pada tahun2014 sebanyak 1.939 orang.
Jumlah ini menurun dibandingkandengan tahun sebelumnya yaitu2.423 orang.
Jumlah sarana ibadah didaerah ini dari tahun ke tahunsenantiasa mengalamipeningkatan seiring denganmeningkatnya jumlah pemelukagama sebagai akibat adanyapertumbuhan penduduk. Padatahun 2014 jumlah rumah ibadahsebanyak 7.820. Sarana ibadahtersebut terdiri atas Masjid,Langgar dan Musholla sebanyak6.398 buah, Gereja Protestan 1.046buah, Gereja Katholik 295 buah,
Pura 50 buah, Vihara 27 buah dankelenteng 4 buah.
Apart from establishing places of worship, the governmentalso helped to manage activities ofreligious services, particularlythose dealing directly with othercountries, such as the Hajj. The population of Kalimantan Timurwho perform the pilgrimage, thedeparture is managed by thegovernment through the Ministryof Religious Affairs, in the year2014 were 1,939 people. This
number increased when comparedwith the previous year whichrecorded to 2,423 people.
Number of worship facilities inthis area increased from year toyear along with increasing numberof adherent of a religion asinfluence of population growth. In2013 The worship facilities numberincreased was 7,820 units. Theworship facilities are Mosque,mushola as much as 5,398 units,Protestant Church is 1,046 units,Catholic Church is 295 units, Pura is50 units, Vihara is 27 units, andtemple 4 units.
m .
ukdanya
. Pama i a
ranai atas
Mus oeja
easee previ
e to 2,
Nuhise
8/20/2019 Kalimantan Timur Dalam Angka Tahun 2015
http://slidepdf.com/reader/full/kalimantan-timur-dalam-angka-tahun-2015 188/623
Sosial / Social
K a l i m a n t a n T i m u r D a l a m A n g k a 2 0 1 5122
PENJELASAN TEKNIS
1. Klinik Keluarga Berencana(KKB) adalah suatu tempatdimana dapat diperolehpelayanan medis KB dengancara-cara kontrasepsi. Tempatini dapat berupa Rumah Sakit,Puskesmas, Balai KesehatanIbu dan Anak (BKIA), TeamMedis Keliling (TMK) dantempat-tempat lainnya yangditentukan.
2. Mendengarkan radio ataumenonton televisi. Sese-orang dikatakan mendengar-kan radio atau menontontelevisi jika selama seminggusebelumnya dia melakukankegiatan-kegiatan tersebutdan perhatiannya tertujuuntuk mendengarkan radioatau menonton televisi.
3. Membaca surat kabar ataumajalah. Seseorang dikata-kan membaca surat
kabar/majalah apabila selamaseminggu sebelumnyasetidak-tidaknya telahmembaca suatu artikel didalam surat kabar/majalahtersebut dan biasanyamengetahuimaksud/mengerti isi artikelyang dibacanya.
TECHNICAL NOTES
1. Family Planning Clinic is a
place where to get medicalcare of family planning bycontraceptive methods. This place is like as hospital, LocalGovernment Clinic, MedicalClinic of Mother and Child, Around Medical Team andanother places.
2. Listen to radio or watch TV. A person is said to listen to radioor watch TV if these activities isdone for a week before andinterested for listening to radioor watching TV.
3. Read a newspaper ormagazine. A person is said toread a newspaper/magazine if
he/she had read an article innewspaper/magazine for aweek before and usually knowsthe meaning/understandabout the article that read.
t i m . b
. i d
ut
rtujura dio
visi.
urat kaor
n to raerson is
or watdoi
8/20/2019 Kalimantan Timur Dalam Angka Tahun 2015
http://slidepdf.com/reader/full/kalimantan-timur-dalam-angka-tahun-2015 189/623
K a l i m a n t a n T i m u r D a l a m A n g k a 2 0 1 5 123
Sosial / Social
4. Menonton film/bioskop. Seseorang dikatakan menon-ton film/bioskop apabilaselama seminggu sebelumnyamenonton secara langsungrangkaian cerita gambar hidupyang diputar untuk umum danbukan bersifat film iklan, baikmembayar maupun tidak yangbiasa dilakukan di dalamgedung atau tempat terbuka.
5. Melakukan olah raga. Adalah
apabila seseorang selamaseminggu sebelumnyamelakukan kegiatan olah ragadengan tujuan meningkatkankesegaran jasmani dan ataumeningkatkan prestasi, dapatberupa latihan ataupertandingan-pertandingan.
6. Menonton pertunjukkankesenian. Seseorang dikata-kan menonton pertunjukkankesenian apabila selama 3bulan sebelumnya menontonpertunjukkan yang bersifatseni, antara lain: tari-tarian,musik, drama/sandiwara danwayang.
7. Anggota organisasi sosial. Seseorang dikatakan menjadianggota organisasi sosialapabila pada saat pencacahandia secara resmi tercatatsebagai anggota pada salahsatu atau beberapa organisasi
sosial.
4. Watching film/cinema. A person is said to watch the film/cinema if he/she watcheda picture story for publicdirectly and not commercialbreak for a week before, either pay or un-pay and it can bedone in a building or opened place.
5. Sports are if a person had donesport activity for a week beforeby purpose to increase healthand or increase achievement,like as training or competition.
6. Watching art show. A person issaid to watch an art show if itis done for 3 months, namelydance, music, drama andleather puppet.
7. Social Organization Member. A person is said to becomesocial organization member ifwhen the census he/she isnoted as member at oneof/many social organizations.
re i ft activity
m . b p
kani ata- tunju kk
a selanya m
an yanara lai
y purpoand orlike
8/20/2019 Kalimantan Timur Dalam Angka Tahun 2015
http://slidepdf.com/reader/full/kalimantan-timur-dalam-angka-tahun-2015 190/623
Sosial / Social
K a l i m a n t a n T i m u r D a l a m A n g k a 2 0 1 5124
Organisasi sosial adalahorganisasi-organisasi yangmelaksanakan pelayanandalam bidang kesejahteraansosial dan telah mempunyaistruktur yang tetap (susunanpengurus, seperti: ketua,sekretaris, bendahara, dsb),baik yang berbadan hukummaupun tidak, yang dikelolaoleh pemerintah maupunpihak swasta.
8. Dapat membaca dan menulis.Seseorang yang dapatmembaca dan menulissurat/kalimat sederhanadengan suatu huruf, baikhuruf latin dan atau lainnya.
Social organization is theorganization that give servicesin a social welfare and have astructure (management, suchas: leader, secretary,accountant, etc) eithercorporated body oruncorporated body, managedby government or private.
8. Read and Write. A person canread and write a letter/simplesentence by an alphabet,either Latin alphabet oranother.
h t t p : / / k a l t i m
. b .
d Writeand wri
entenceeitherano
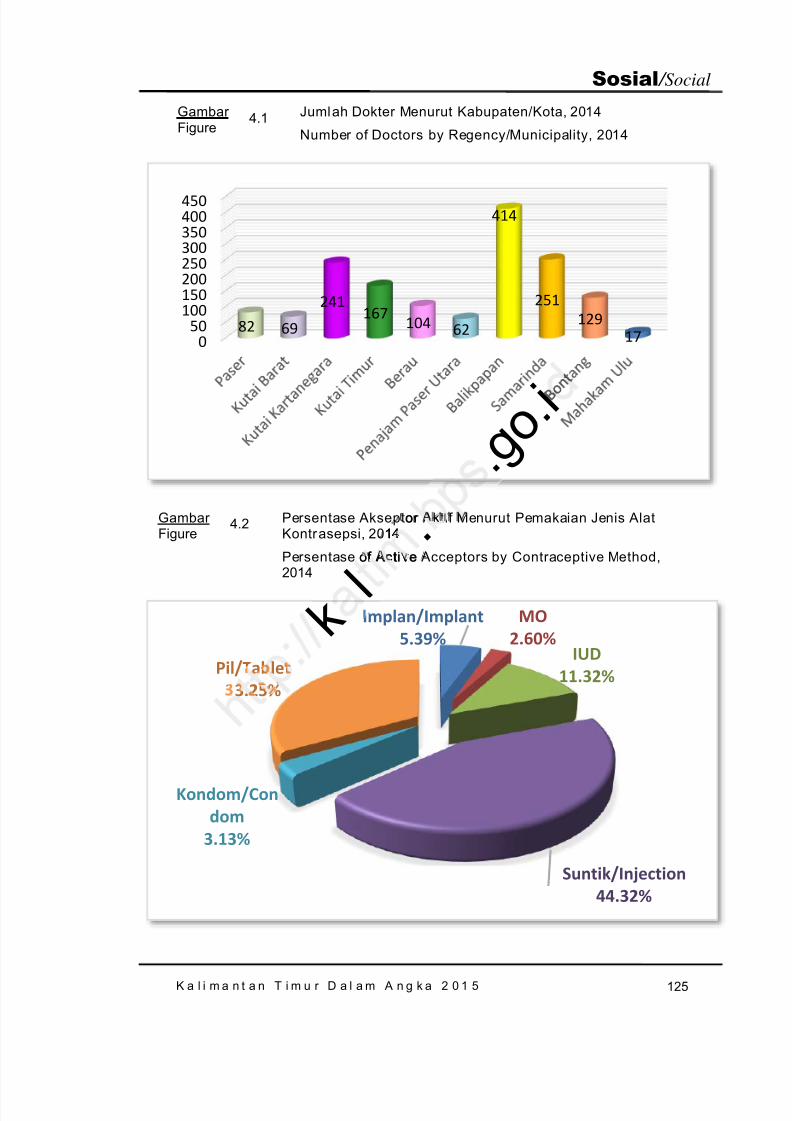
8/20/2019 Kalimantan Timur Dalam Angka Tahun 2015
http://slidepdf.com/reader/full/kalimantan-timur-dalam-angka-tahun-2015 191/623
K a l i m a n t a n T i m u r D a l a m A n g k a 2 0 1 5 125
Sosial / Social
Gambar Figure
4.1 Jumlah Dokter Menurut Kabupaten/Kota, 2014
Number of Doctors by Regency/Municipality, 2014
Gambar Figure
4.2 Persentase Akseptor Aktif Menurut Pemakaian Jenis AlatKontrasepsi, 2014
Persentase of Acti ve Acceptors by Contraceptive Method,
2014
050
100150200250300350400450
82 69
241167
104 62
414
251129
17
Implan/Implant5.39%
MO2.60%
IUD11.32%
Suntik/Injection44.32%
Kondom/Condom
3.13%
Pil/Tablet33.25%
. g o . i
l .or
14
of Acti ve
kablet
3.25%
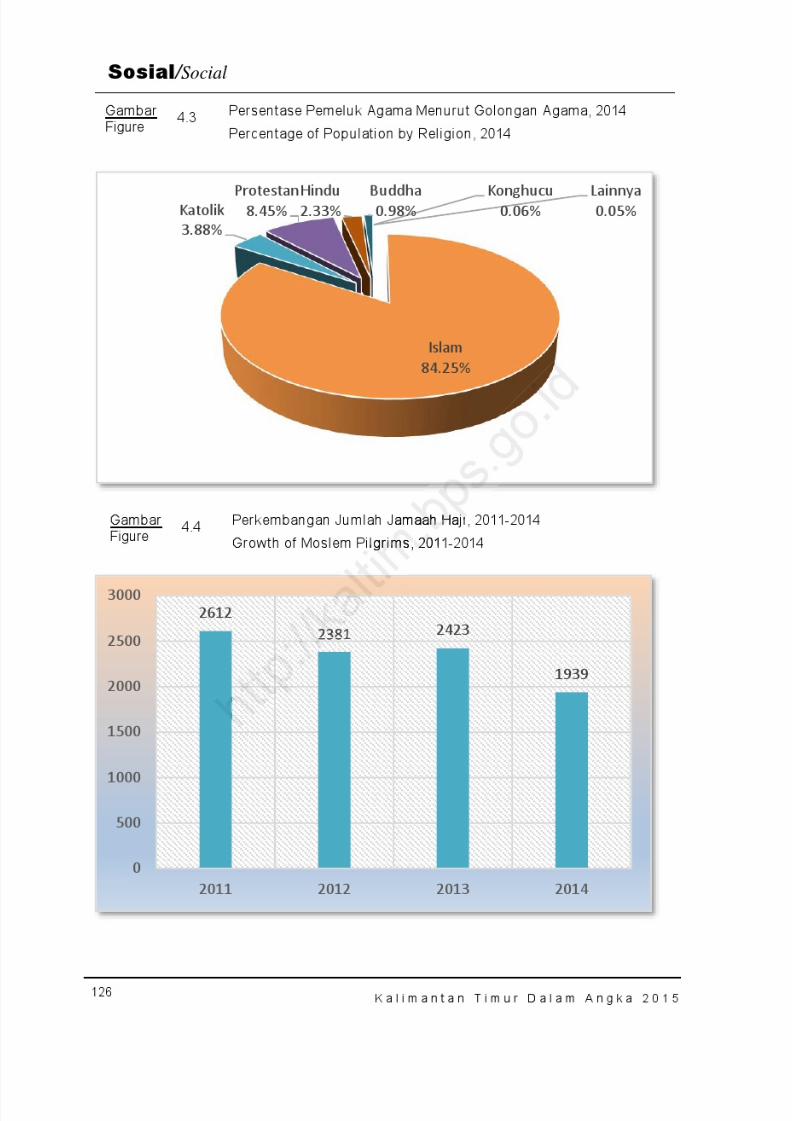
8/20/2019 Kalimantan Timur Dalam Angka Tahun 2015
http://slidepdf.com/reader/full/kalimantan-timur-dalam-angka-tahun-2015 192/623
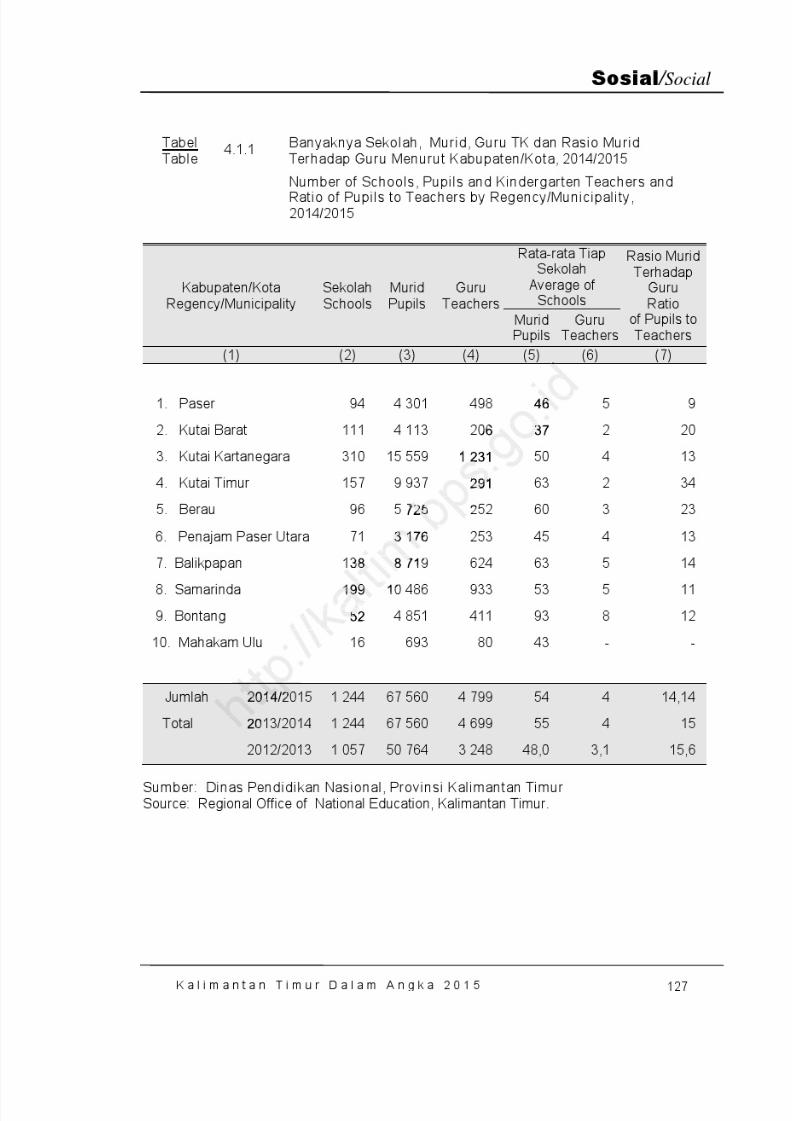
8/20/2019 Kalimantan Timur Dalam Angka Tahun 2015
http://slidepdf.com/reader/full/kalimantan-timur-dalam-angka-tahun-2015 193/623

8/20/2019 Kalimantan Timur Dalam Angka Tahun 2015
http://slidepdf.com/reader/full/kalimantan-timur-dalam-angka-tahun-2015 194/623
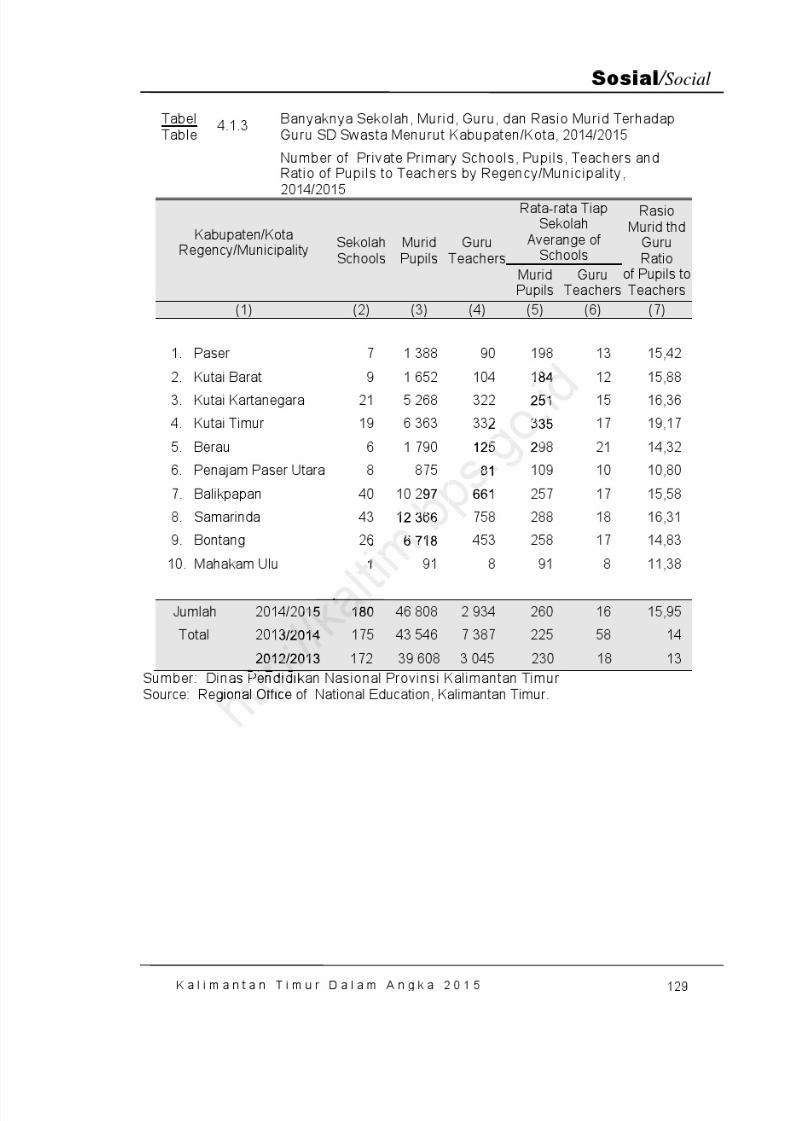
8/20/2019 Kalimantan Timur Dalam Angka Tahun 2015
http://slidepdf.com/reader/full/kalimantan-timur-dalam-angka-tahun-2015 195/623
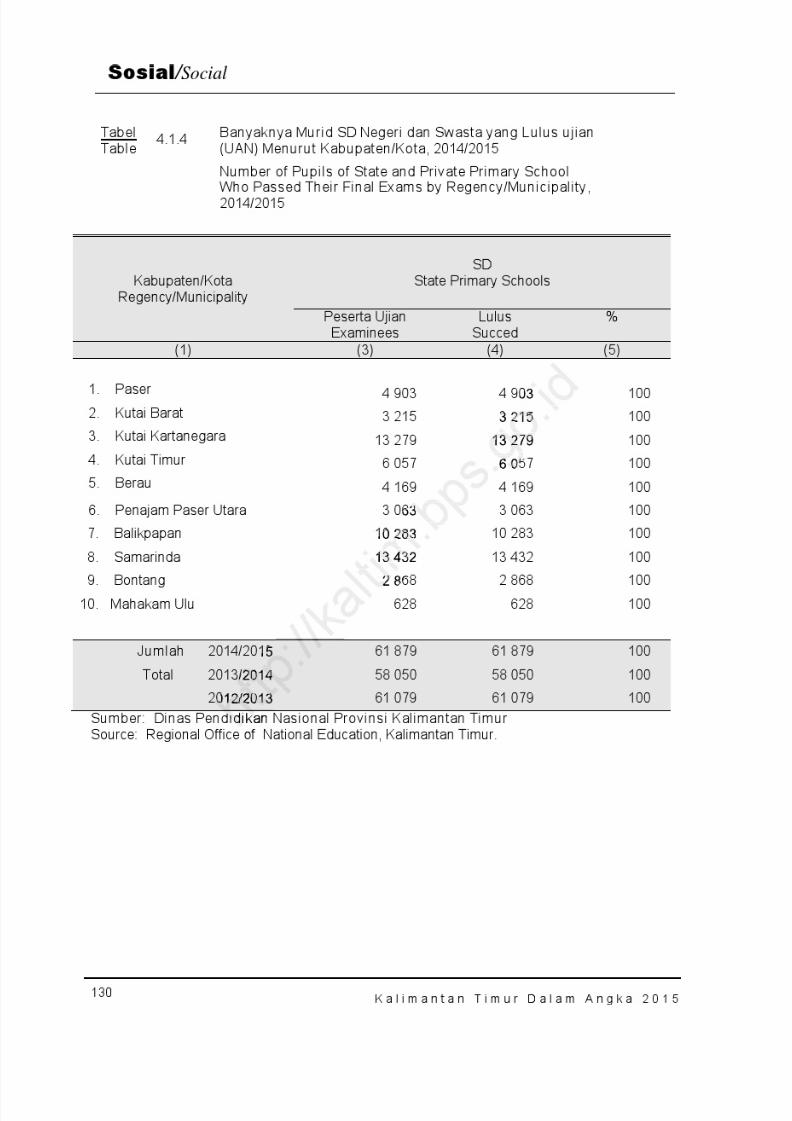
8/20/2019 Kalimantan Timur Dalam Angka Tahun 2015
http://slidepdf.com/reader/full/kalimantan-timur-dalam-angka-tahun-2015 196/623

8/20/2019 Kalimantan Timur Dalam Angka Tahun 2015
http://slidepdf.com/reader/full/kalimantan-timur-dalam-angka-tahun-2015 197/623
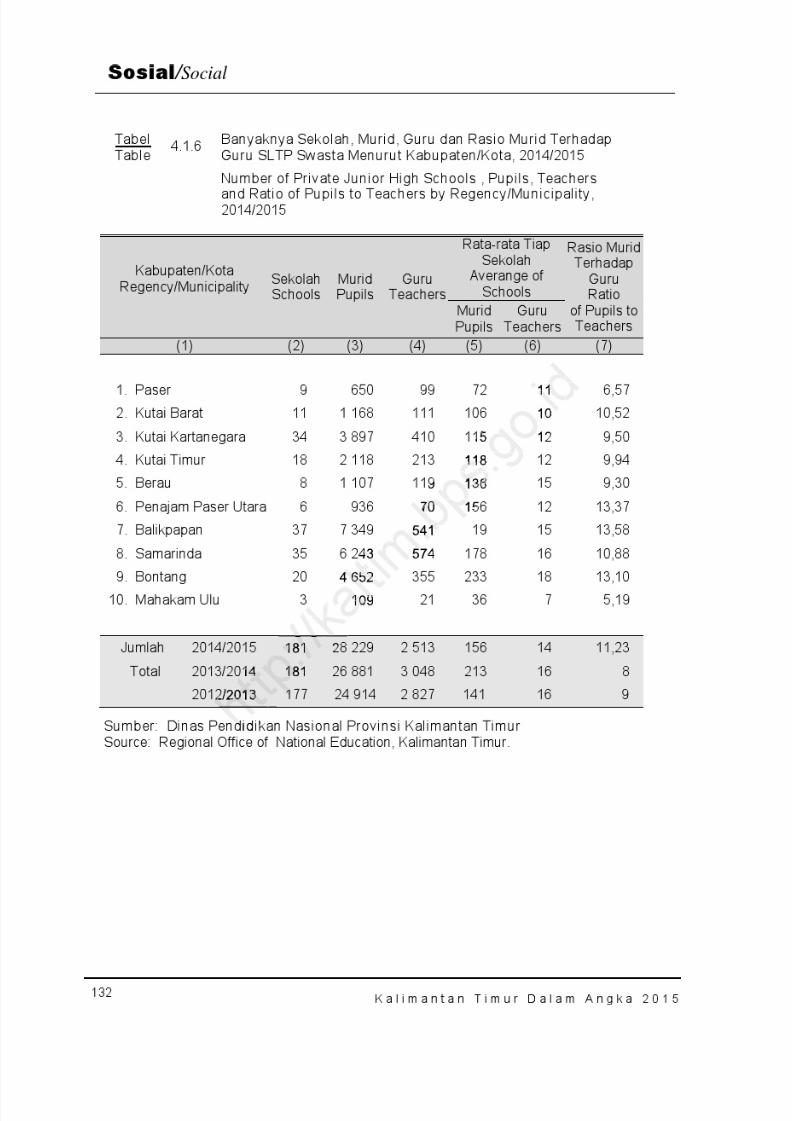
8/20/2019 Kalimantan Timur Dalam Angka Tahun 2015
http://slidepdf.com/reader/full/kalimantan-timur-dalam-angka-tahun-2015 198/623
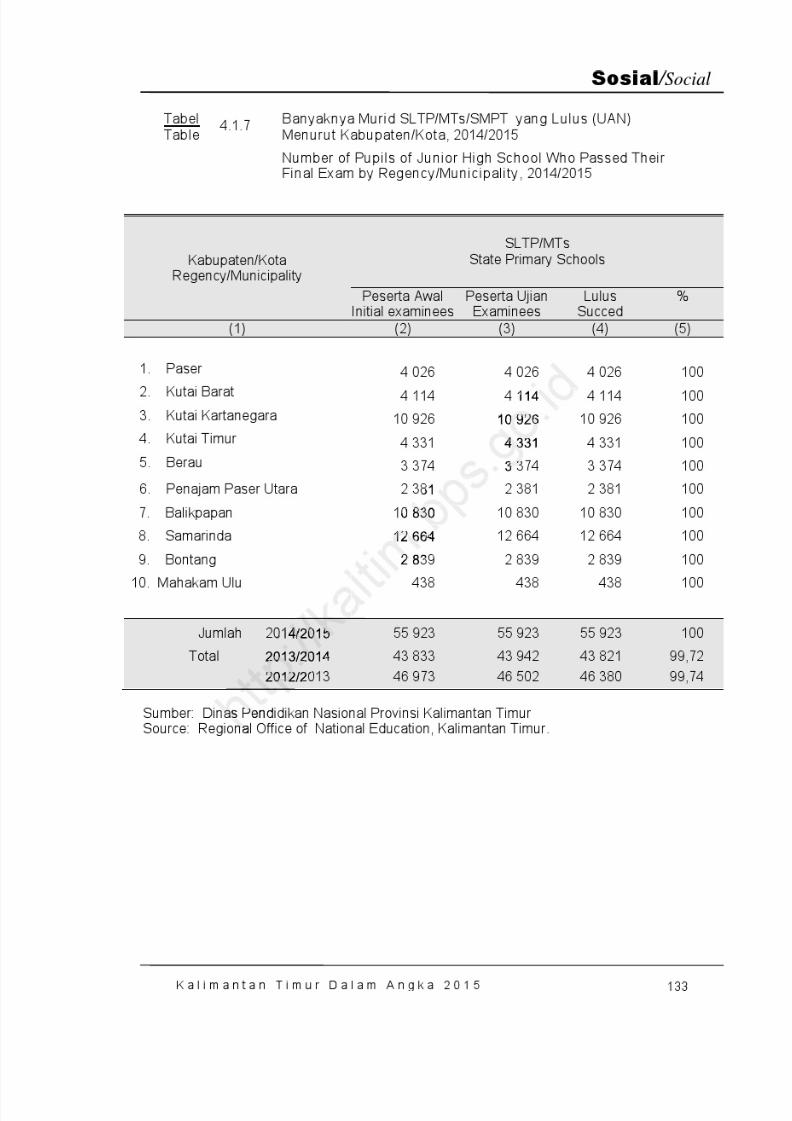
8/20/2019 Kalimantan Timur Dalam Angka Tahun 2015
http://slidepdf.com/reader/full/kalimantan-timur-dalam-angka-tahun-2015 199/623

8/20/2019 Kalimantan Timur Dalam Angka Tahun 2015
http://slidepdf.com/reader/full/kalimantan-timur-dalam-angka-tahun-2015 200/623

8/20/2019 Kalimantan Timur Dalam Angka Tahun 2015
http://slidepdf.com/reader/full/kalimantan-timur-dalam-angka-tahun-2015 201/623
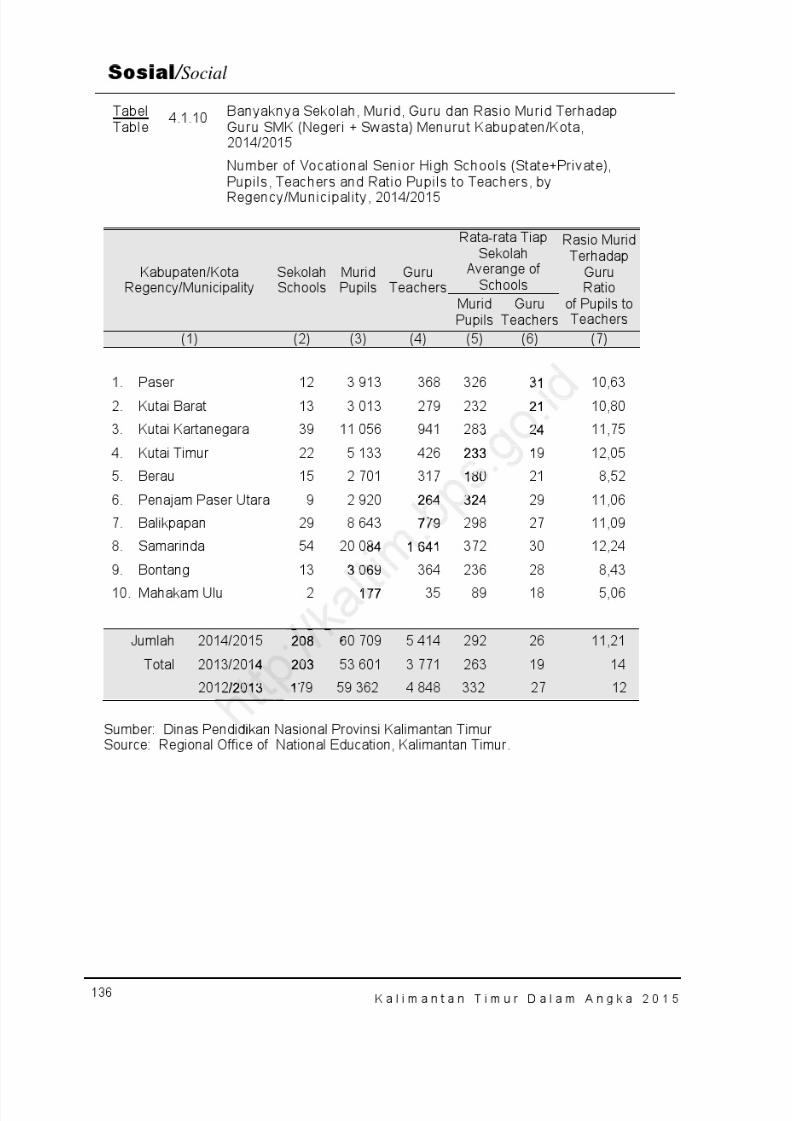
8/20/2019 Kalimantan Timur Dalam Angka Tahun 2015
http://slidepdf.com/reader/full/kalimantan-timur-dalam-angka-tahun-2015 202/623

8/20/2019 Kalimantan Timur Dalam Angka Tahun 2015
http://slidepdf.com/reader/full/kalimantan-timur-dalam-angka-tahun-2015 203/623
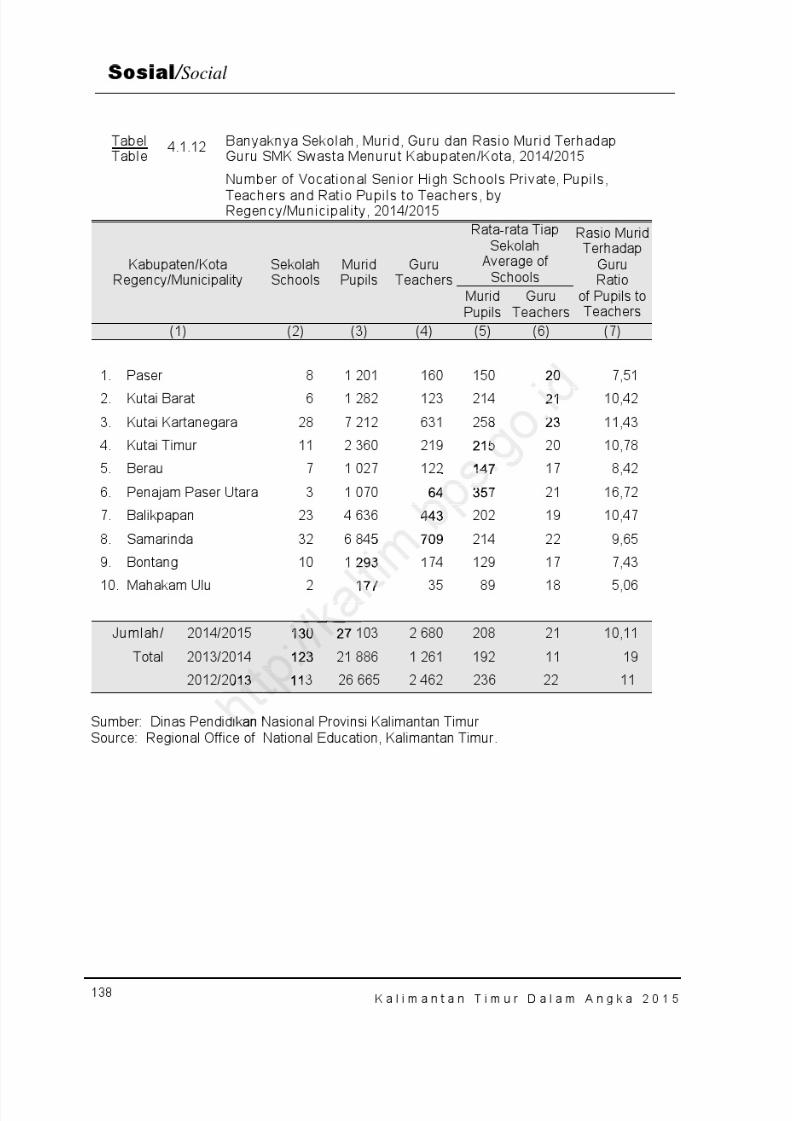
8/20/2019 Kalimantan Timur Dalam Angka Tahun 2015
http://slidepdf.com/reader/full/kalimantan-timur-dalam-angka-tahun-2015 204/623
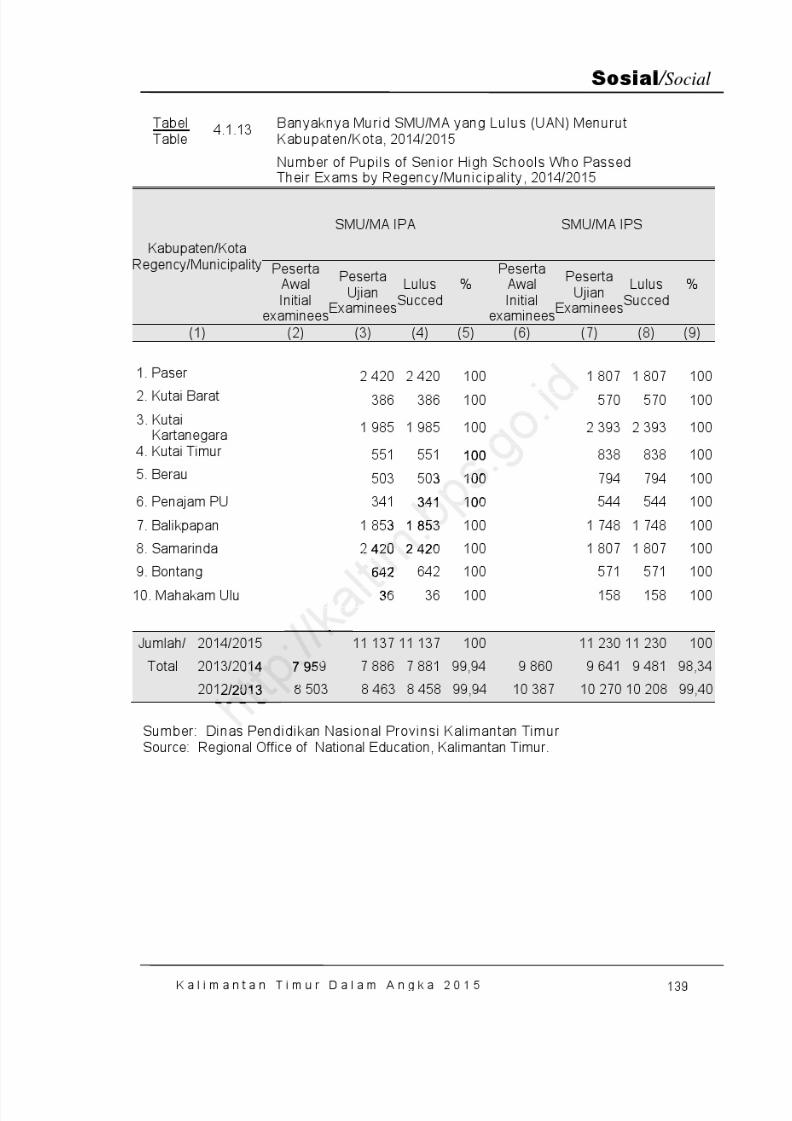
8/20/2019 Kalimantan Timur Dalam Angka Tahun 2015
http://slidepdf.com/reader/full/kalimantan-timur-dalam-angka-tahun-2015 205/623
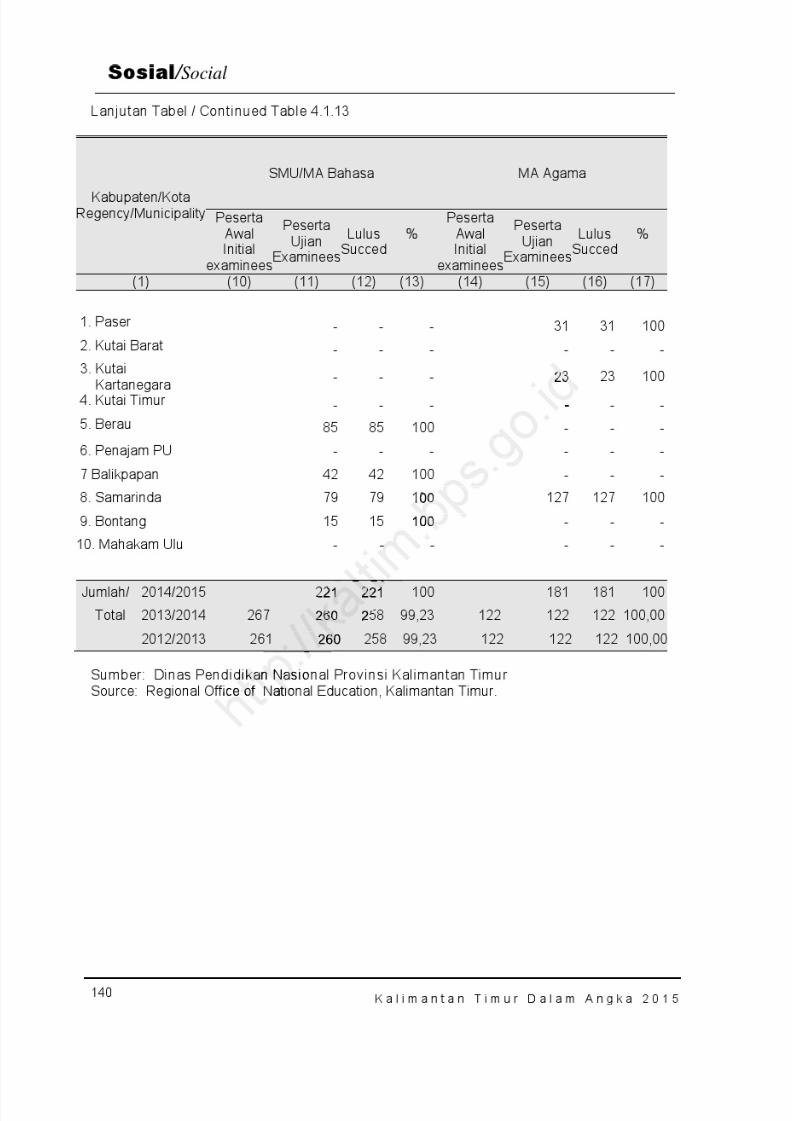
8/20/2019 Kalimantan Timur Dalam Angka Tahun 2015
http://slidepdf.com/reader/full/kalimantan-timur-dalam-angka-tahun-2015 206/623
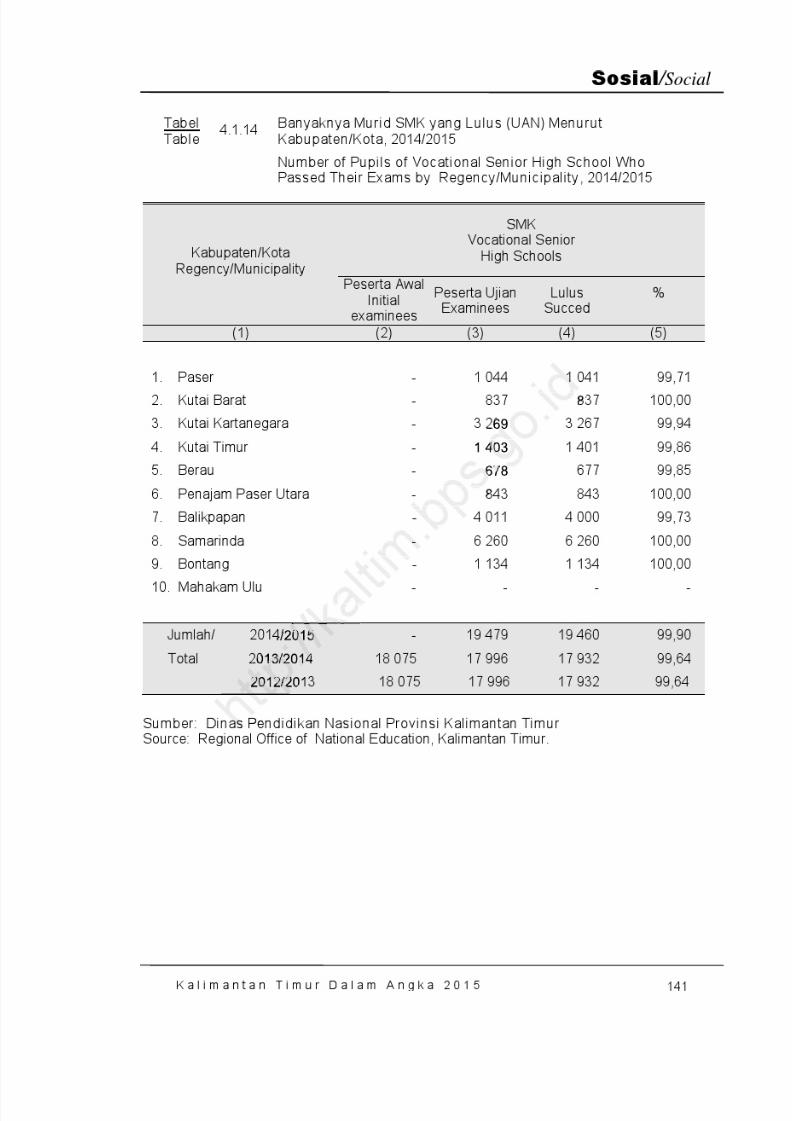
8/20/2019 Kalimantan Timur Dalam Angka Tahun 2015
http://slidepdf.com/reader/full/kalimantan-timur-dalam-angka-tahun-2015 207/623
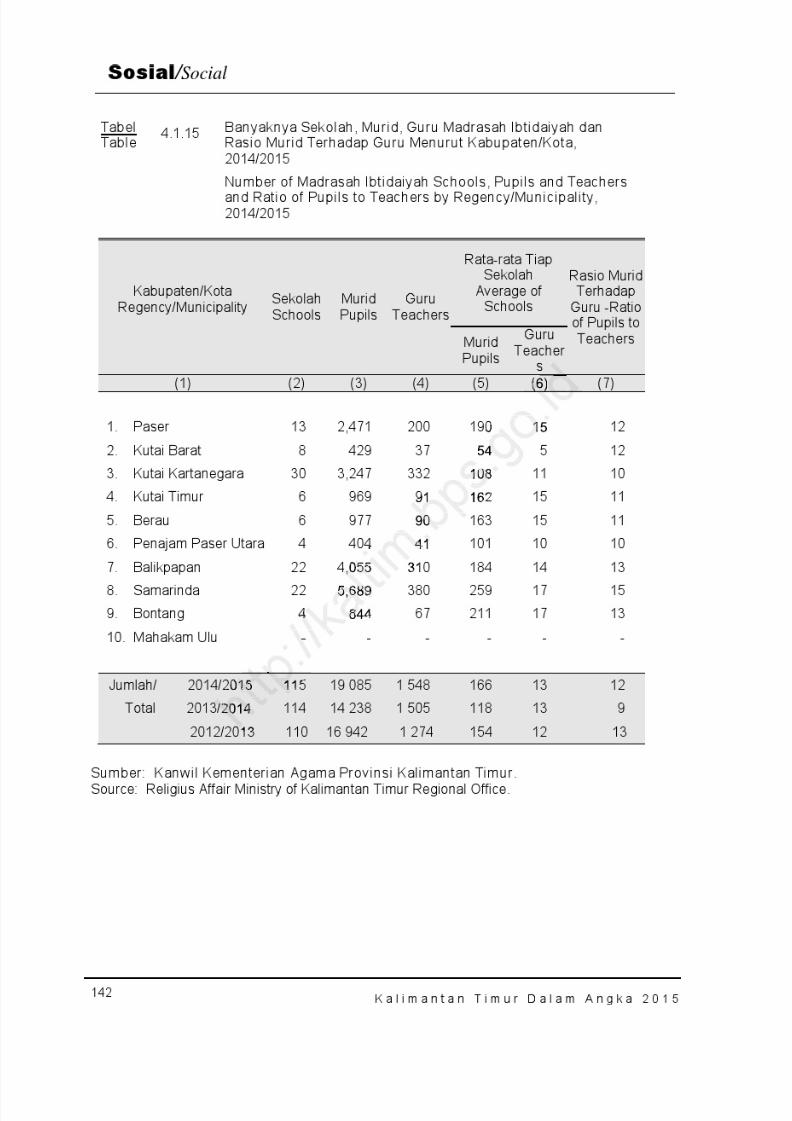
8/20/2019 Kalimantan Timur Dalam Angka Tahun 2015
http://slidepdf.com/reader/full/kalimantan-timur-dalam-angka-tahun-2015 208/623
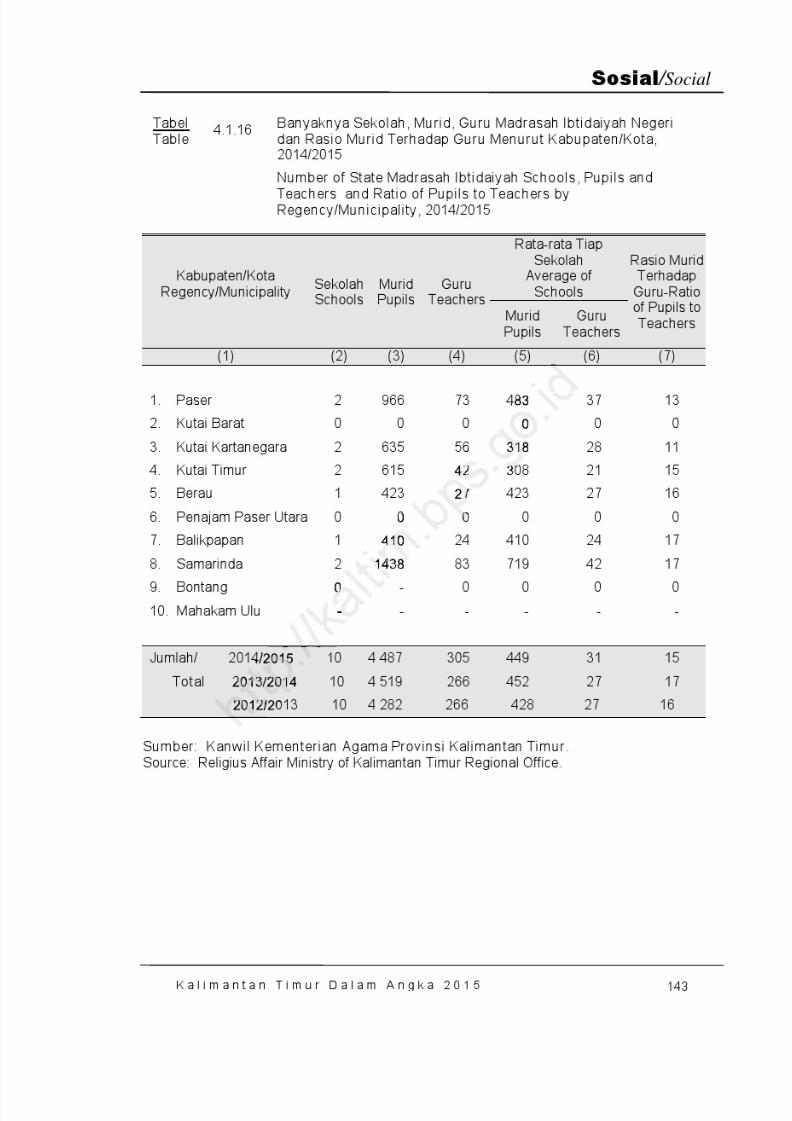
8/20/2019 Kalimantan Timur Dalam Angka Tahun 2015
http://slidepdf.com/reader/full/kalimantan-timur-dalam-angka-tahun-2015 209/623
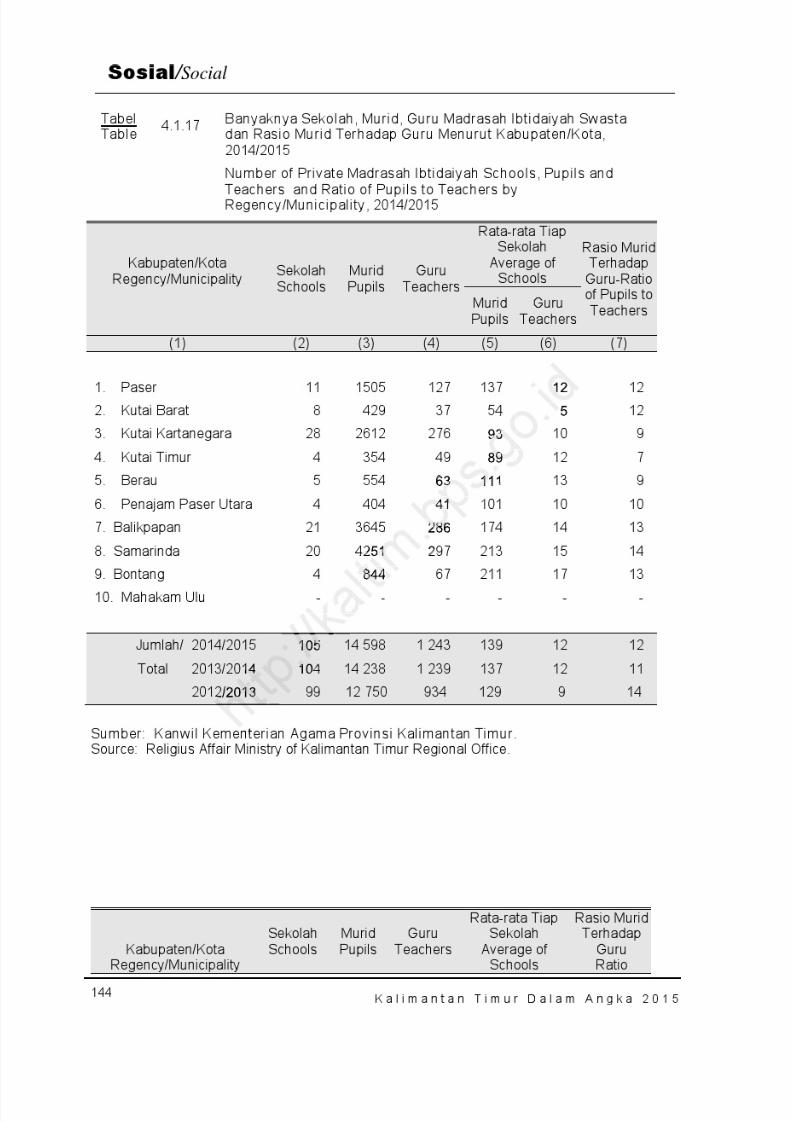
8/20/2019 Kalimantan Timur Dalam Angka Tahun 2015
http://slidepdf.com/reader/full/kalimantan-timur-dalam-angka-tahun-2015 210/623
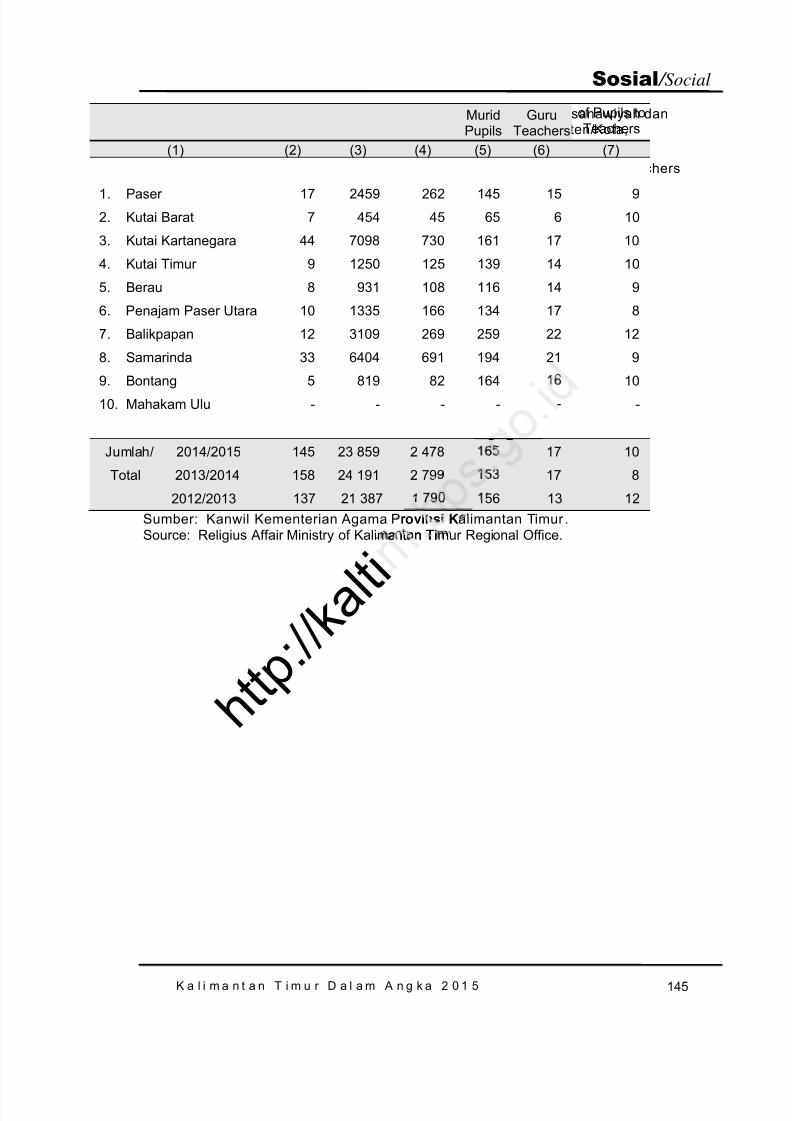
8/20/2019 Kalimantan Timur Dalam Angka Tahun 2015
http://slidepdf.com/reader/full/kalimantan-timur-dalam-angka-tahun-2015 211/623
K a l i m a n t a n T i m u r D a l a m A n g k a 2 0 1 5 145
Sosial / Social
Sumber: Kanwil Kementerian Agama Provinsi Kalimantan Timur .Source: Religius Affair Ministry of Kalimantan Timur Regional Office.
TabelTable
4.1.18 Banyaknya Sekolah, Murid, Guru Madrasah Tsanawiyah danRasio Murid Terhadap Guru Menurut Kabupaten/Kota,2014/2015
Number of Madrasah Tsanawiyah Schools , Pupils, Teachersan Ratio of Pupils to Teachers by Regency/Municipality,2014/2015
MuridPupils
GuruTeachers
of Pupils toTeachers
(1) (2) (3) (4) (5) (6) (7)
1. Paser 17 2459 262 145 15 92. Kutai Barat 7 454 45 65 6 10
3. Kutai Kartanegara 44 7098 730 161 17 10
4. Kutai Timur 9 1250 125 139 14 10
5. Berau 8 931 108 116 14 9
6. Penajam Paser Utara 10 1335 166 134 17 8
7. Balikpapan 12 3109 269 259 22 12
8. Samarinda 33 6404 691 194 21 9
9. Bontang 5 819 82 164 16 1010. Mahakam Ulu - - - - - -
Jumlah/ 2014/2015 145 23 859 2 478 165 17 10
Total 2013/2014 158 24 191 2 799 153 17 8
2012/2013 137 21 387 1 790 156 13 12
h t t p : / / k a l t i
rov insi Kantan Ti
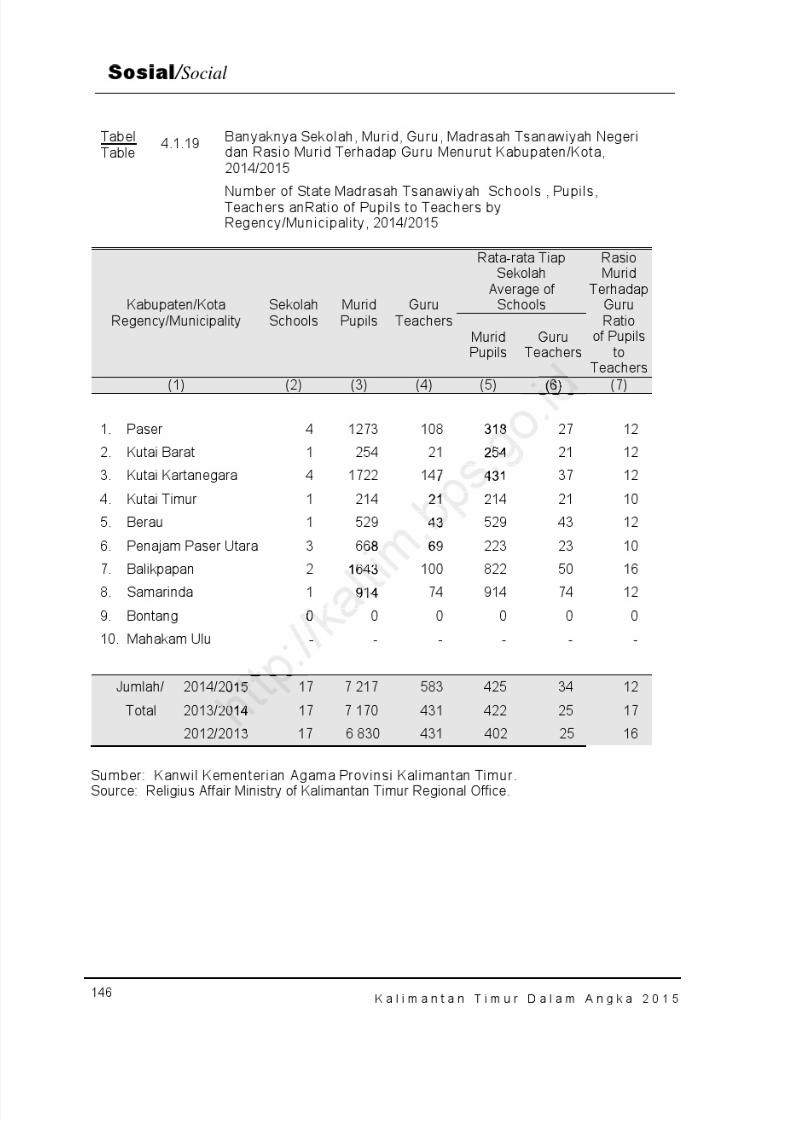
8/20/2019 Kalimantan Timur Dalam Angka Tahun 2015
http://slidepdf.com/reader/full/kalimantan-timur-dalam-angka-tahun-2015 212/623
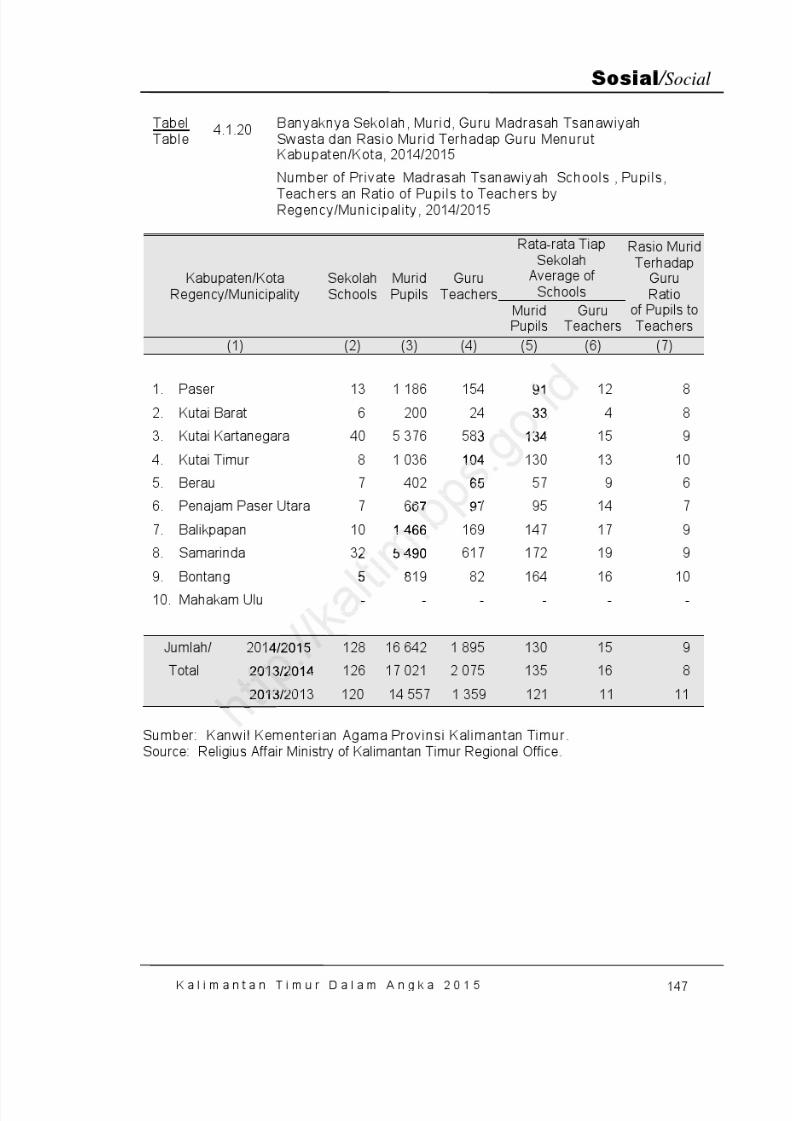
8/20/2019 Kalimantan Timur Dalam Angka Tahun 2015
http://slidepdf.com/reader/full/kalimantan-timur-dalam-angka-tahun-2015 213/623
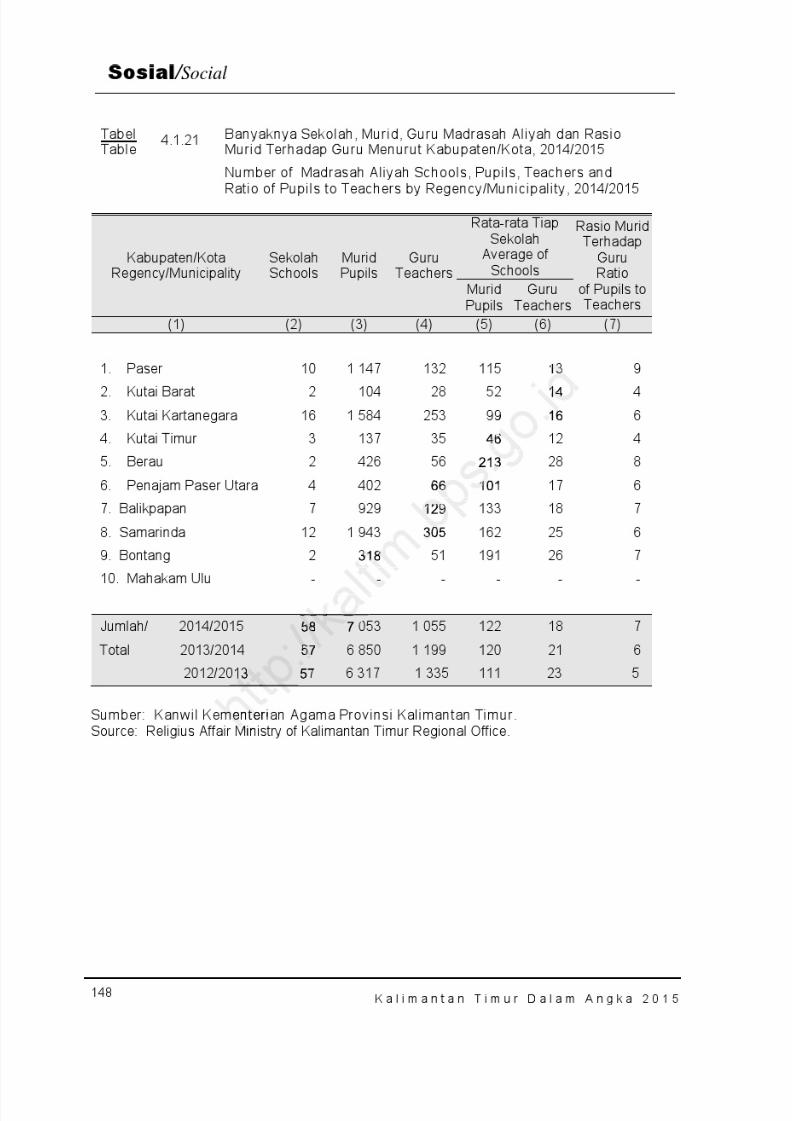
8/20/2019 Kalimantan Timur Dalam Angka Tahun 2015
http://slidepdf.com/reader/full/kalimantan-timur-dalam-angka-tahun-2015 214/623
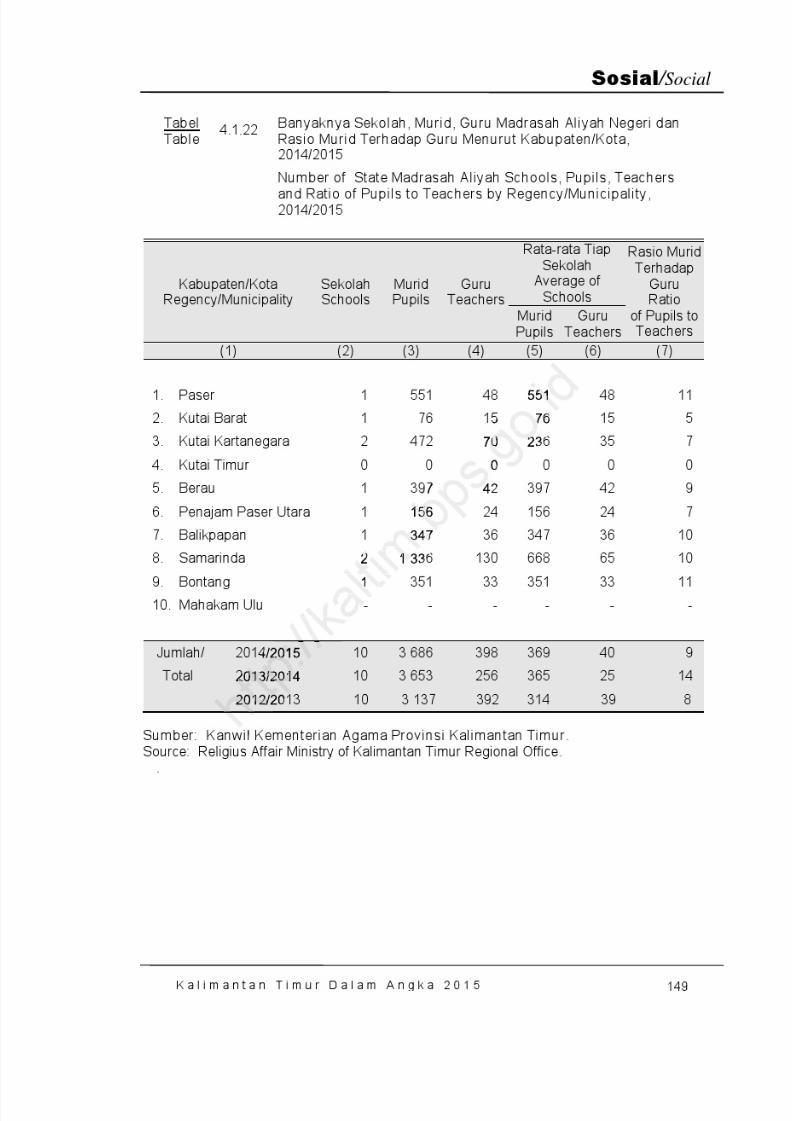
8/20/2019 Kalimantan Timur Dalam Angka Tahun 2015
http://slidepdf.com/reader/full/kalimantan-timur-dalam-angka-tahun-2015 215/623
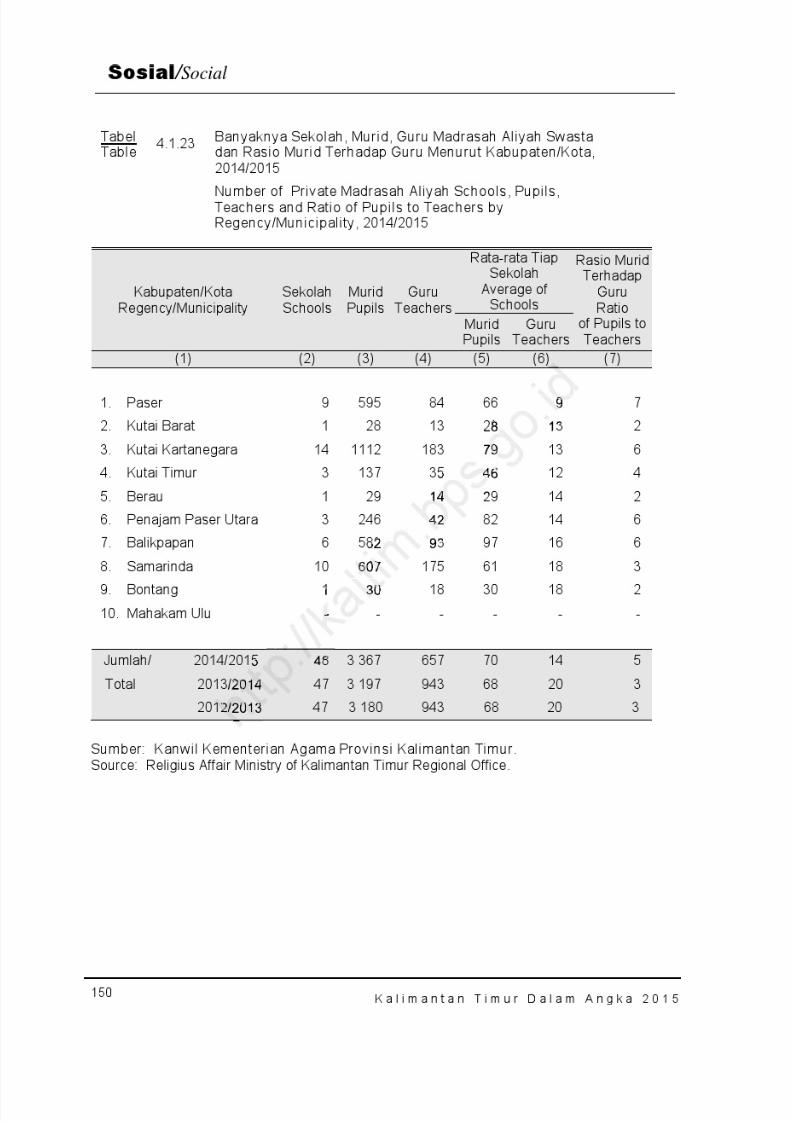
8/20/2019 Kalimantan Timur Dalam Angka Tahun 2015
http://slidepdf.com/reader/full/kalimantan-timur-dalam-angka-tahun-2015 216/623
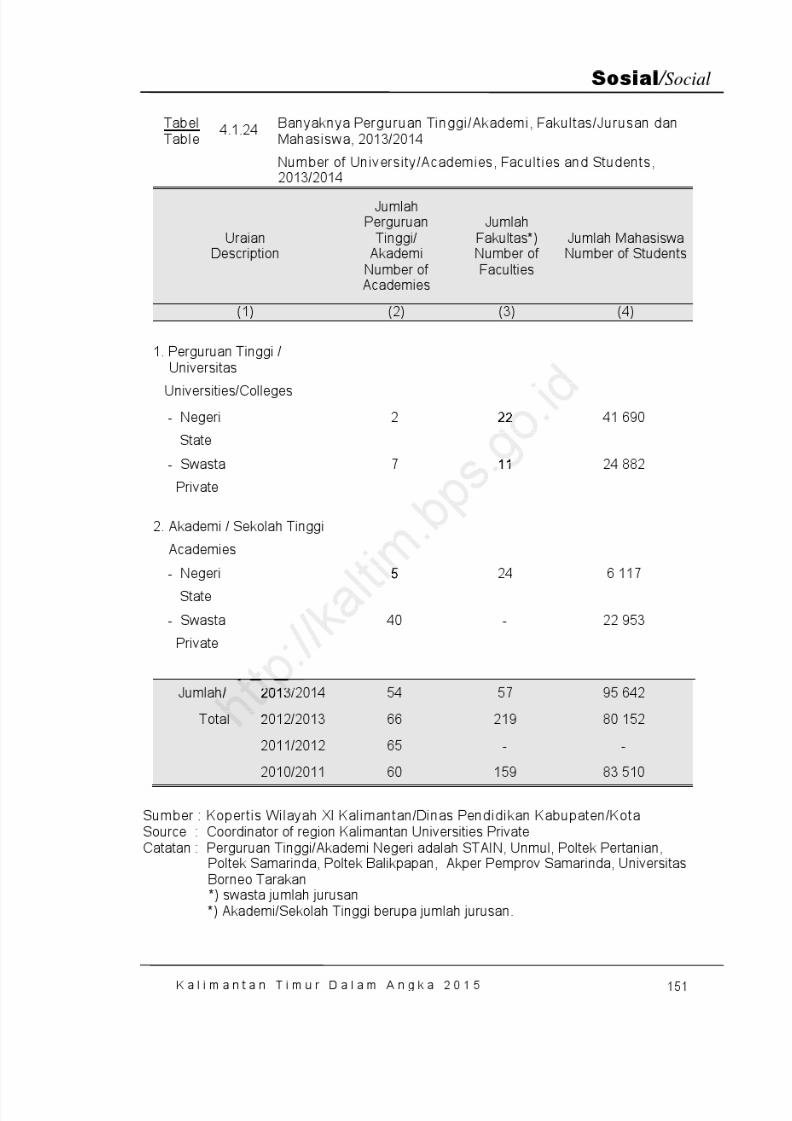
8/20/2019 Kalimantan Timur Dalam Angka Tahun 2015
http://slidepdf.com/reader/full/kalimantan-timur-dalam-angka-tahun-2015 217/623
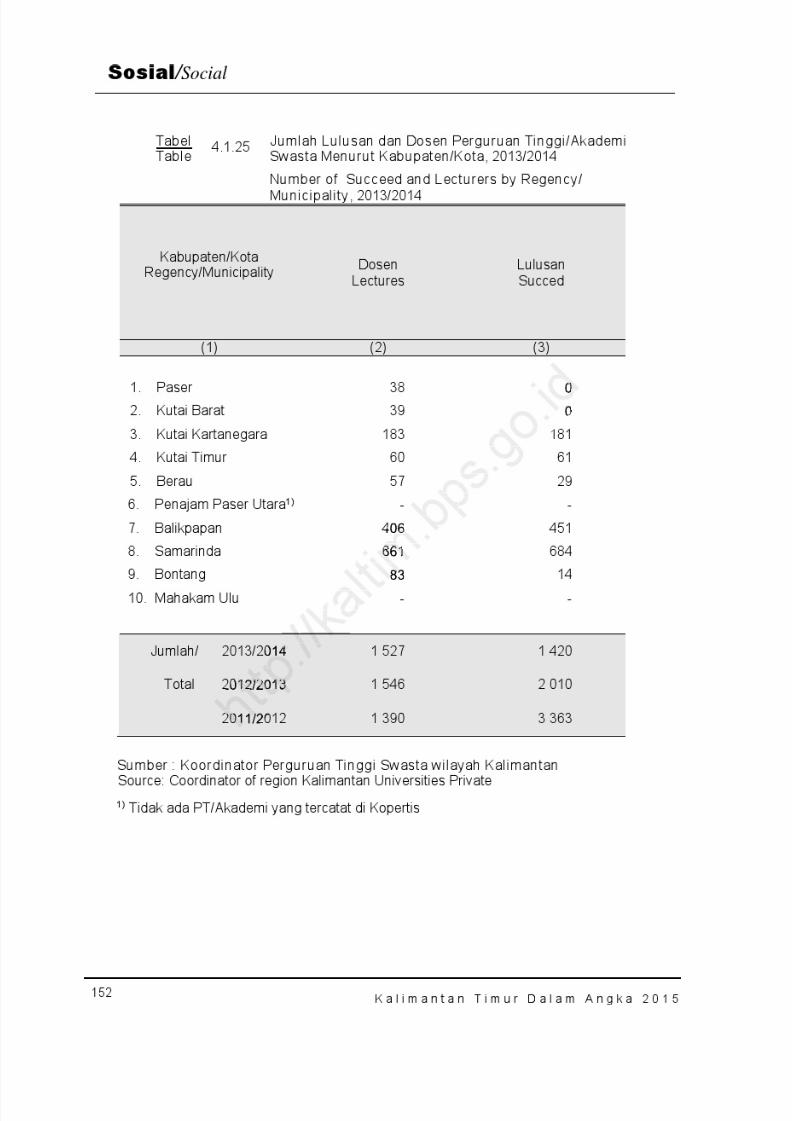
8/20/2019 Kalimantan Timur Dalam Angka Tahun 2015
http://slidepdf.com/reader/full/kalimantan-timur-dalam-angka-tahun-2015 218/623
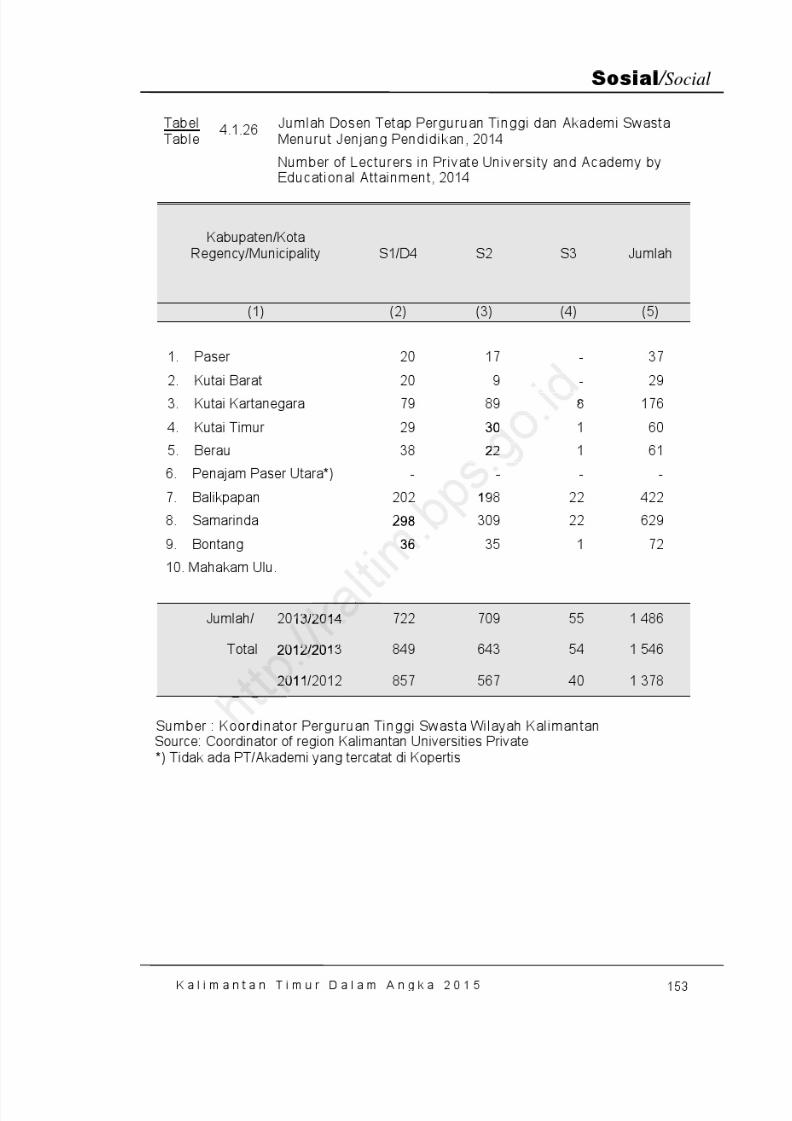
8/20/2019 Kalimantan Timur Dalam Angka Tahun 2015
http://slidepdf.com/reader/full/kalimantan-timur-dalam-angka-tahun-2015 219/623
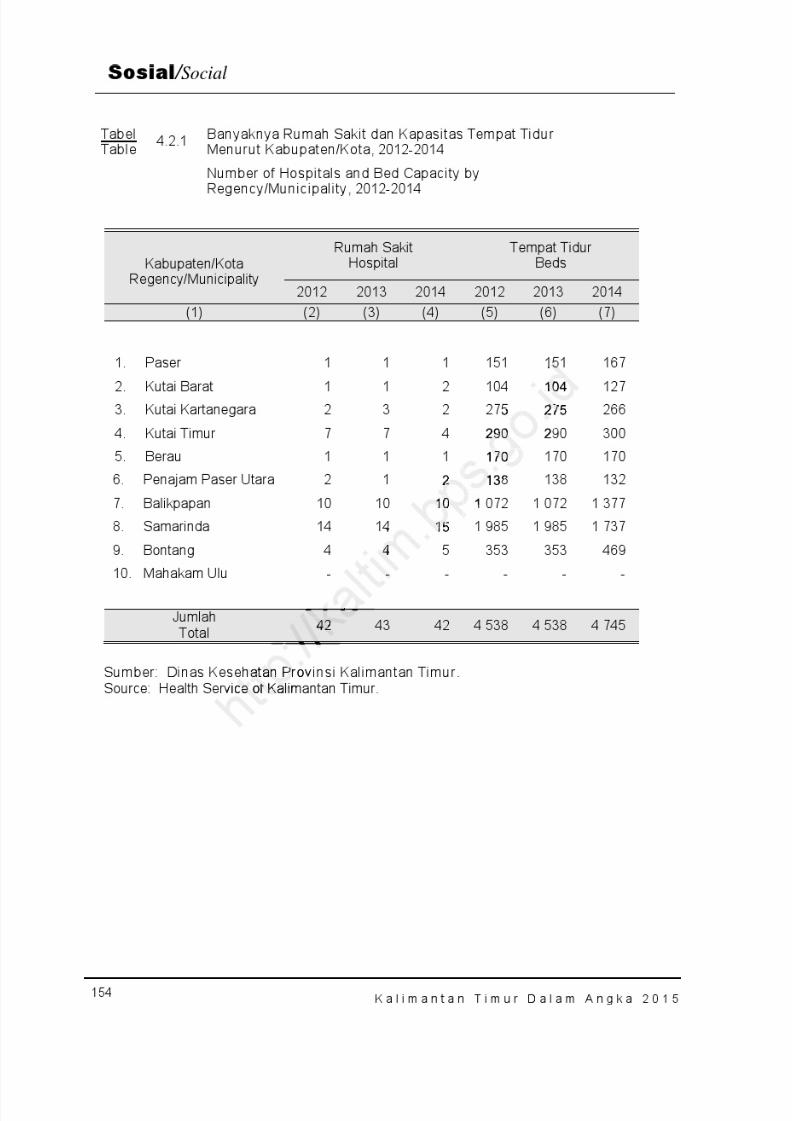
8/20/2019 Kalimantan Timur Dalam Angka Tahun 2015
http://slidepdf.com/reader/full/kalimantan-timur-dalam-angka-tahun-2015 220/623

8/20/2019 Kalimantan Timur Dalam Angka Tahun 2015
http://slidepdf.com/reader/full/kalimantan-timur-dalam-angka-tahun-2015 221/623
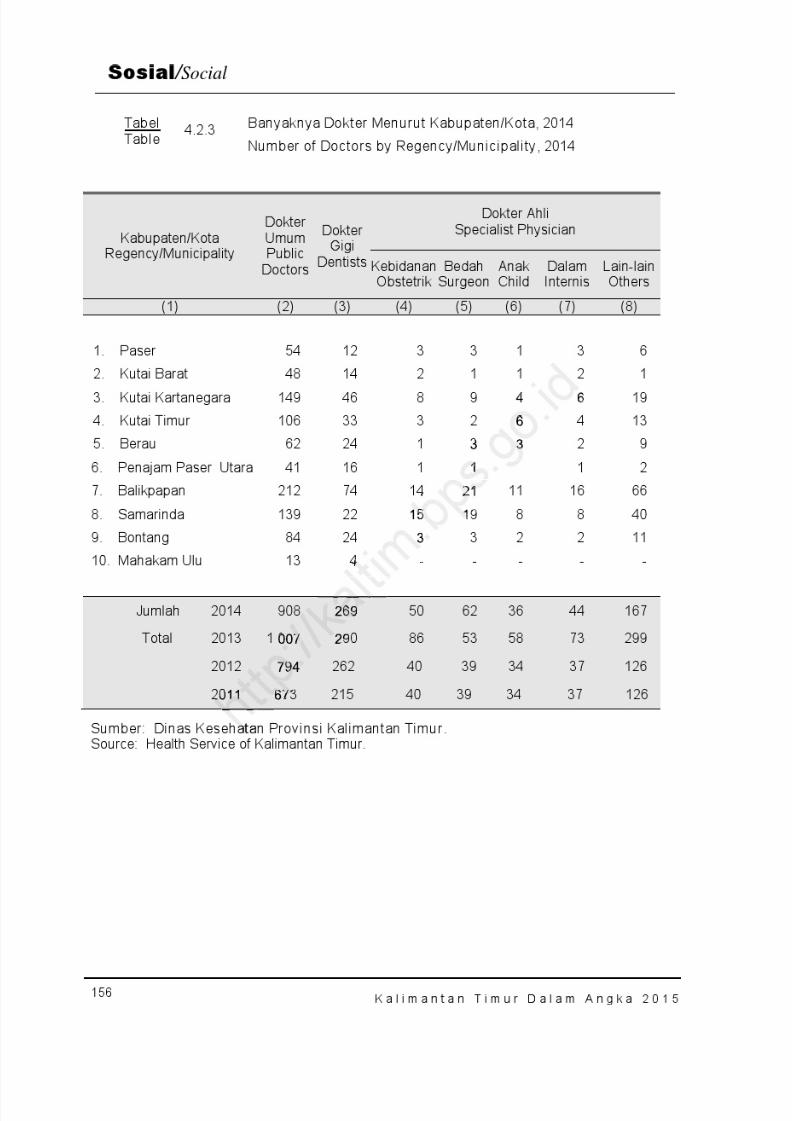
8/20/2019 Kalimantan Timur Dalam Angka Tahun 2015
http://slidepdf.com/reader/full/kalimantan-timur-dalam-angka-tahun-2015 222/623
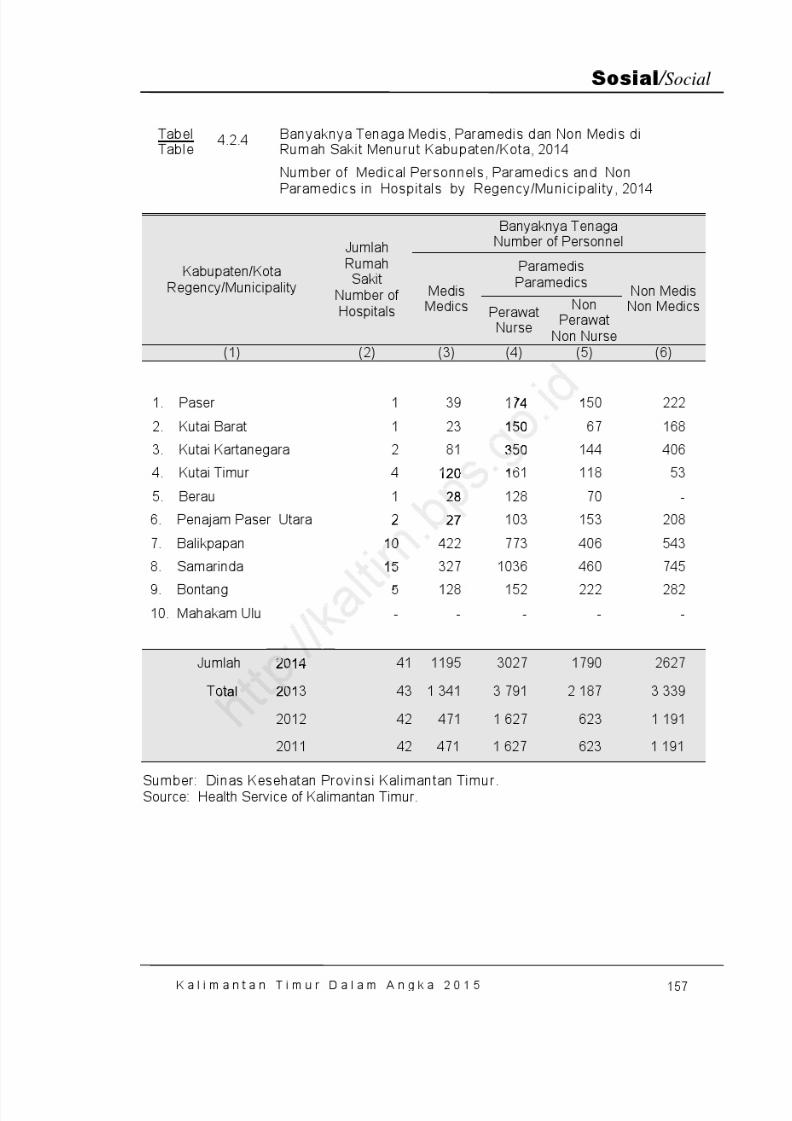
8/20/2019 Kalimantan Timur Dalam Angka Tahun 2015
http://slidepdf.com/reader/full/kalimantan-timur-dalam-angka-tahun-2015 223/623
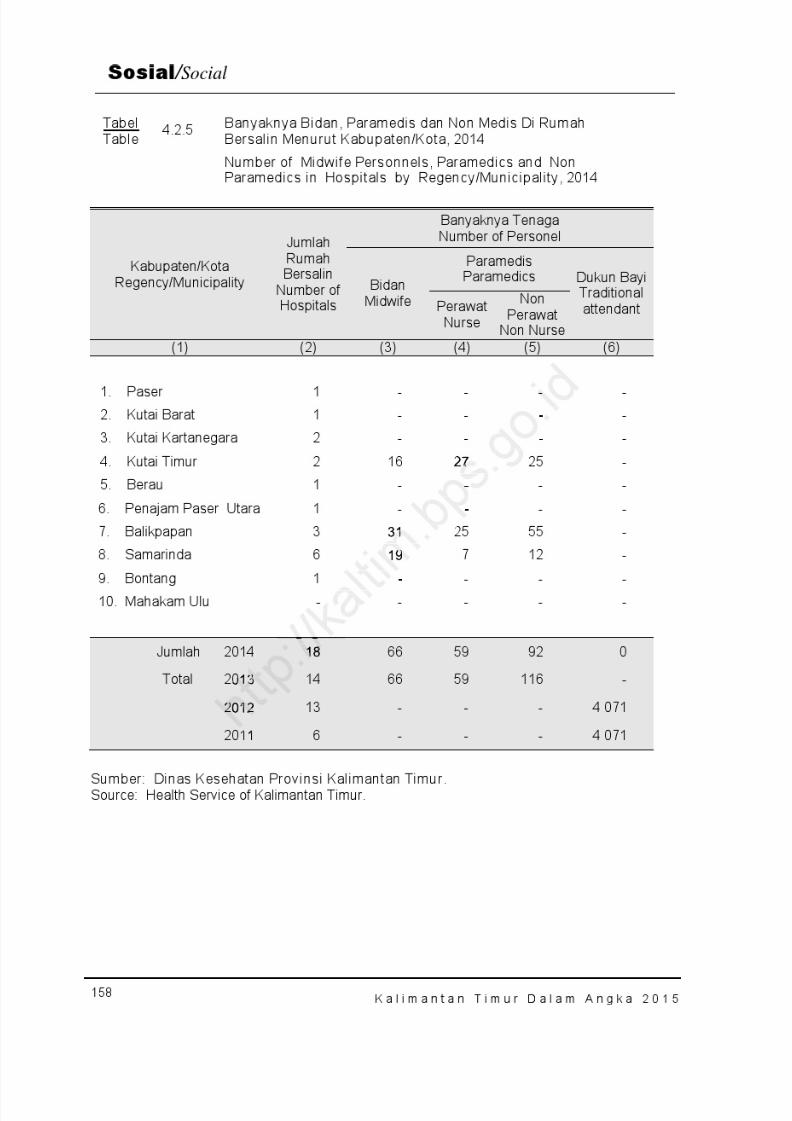
8/20/2019 Kalimantan Timur Dalam Angka Tahun 2015
http://slidepdf.com/reader/full/kalimantan-timur-dalam-angka-tahun-2015 224/623
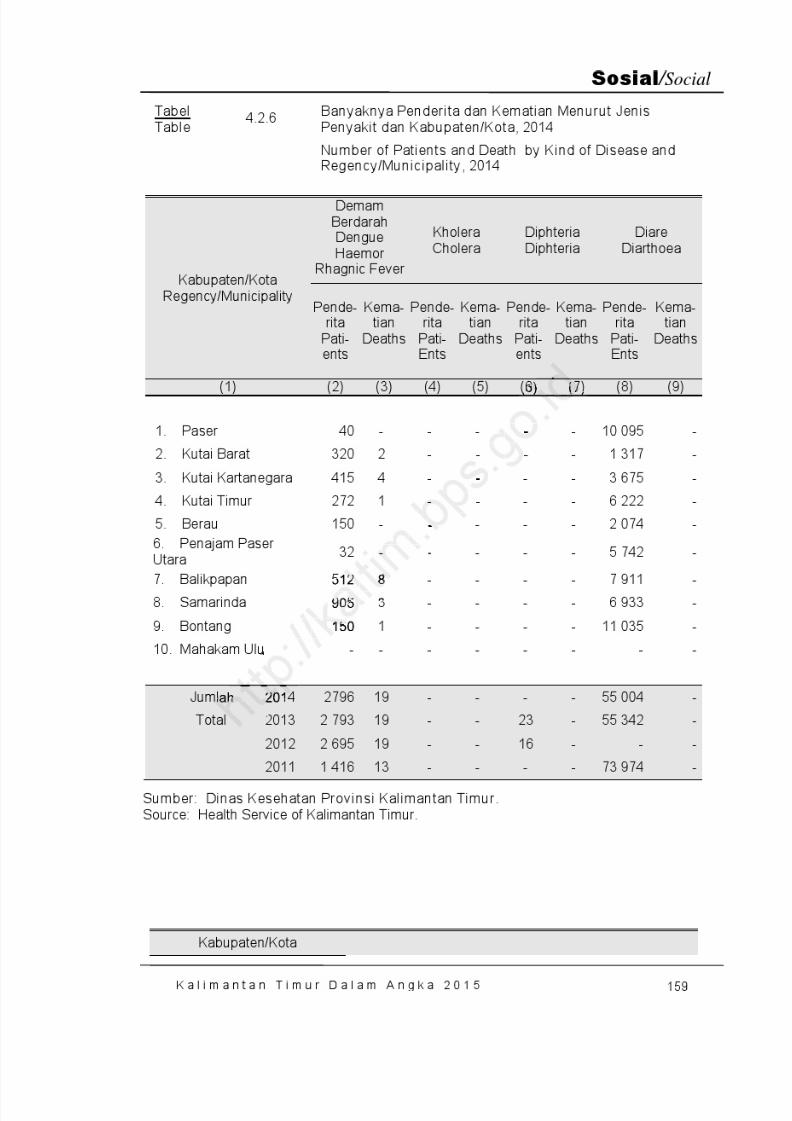
8/20/2019 Kalimantan Timur Dalam Angka Tahun 2015
http://slidepdf.com/reader/full/kalimantan-timur-dalam-angka-tahun-2015 225/623
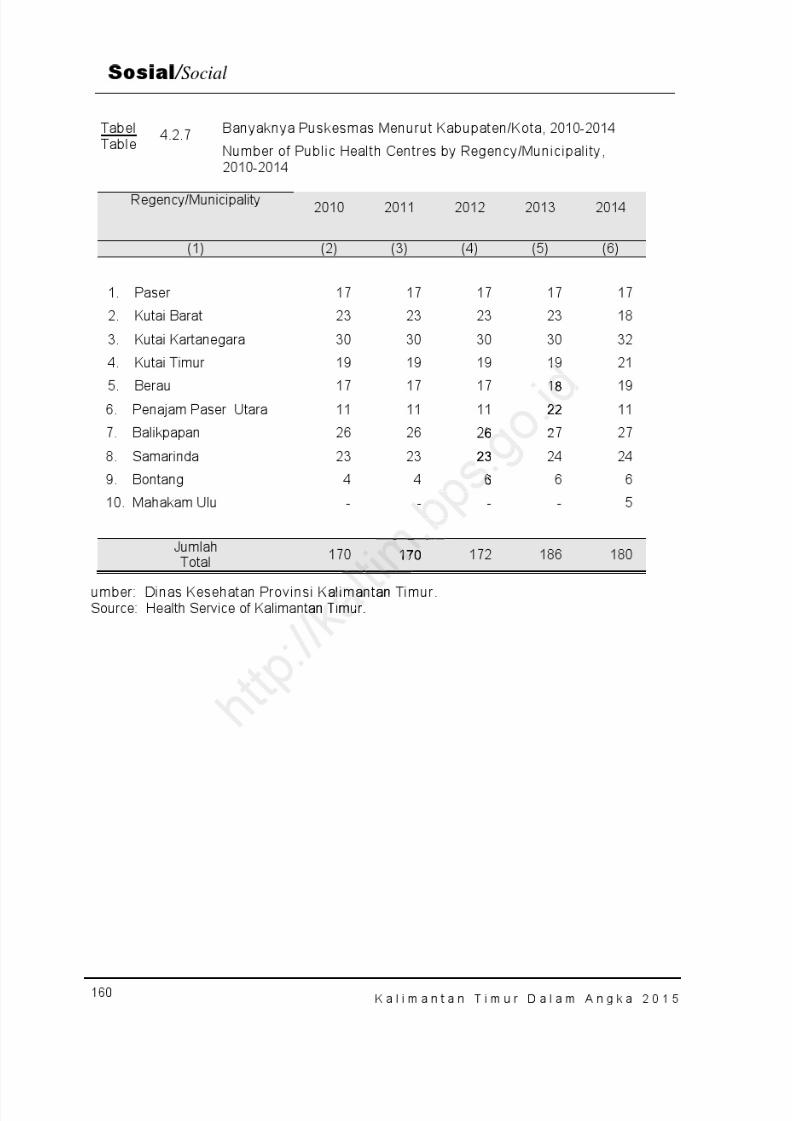
8/20/2019 Kalimantan Timur Dalam Angka Tahun 2015
http://slidepdf.com/reader/full/kalimantan-timur-dalam-angka-tahun-2015 226/623
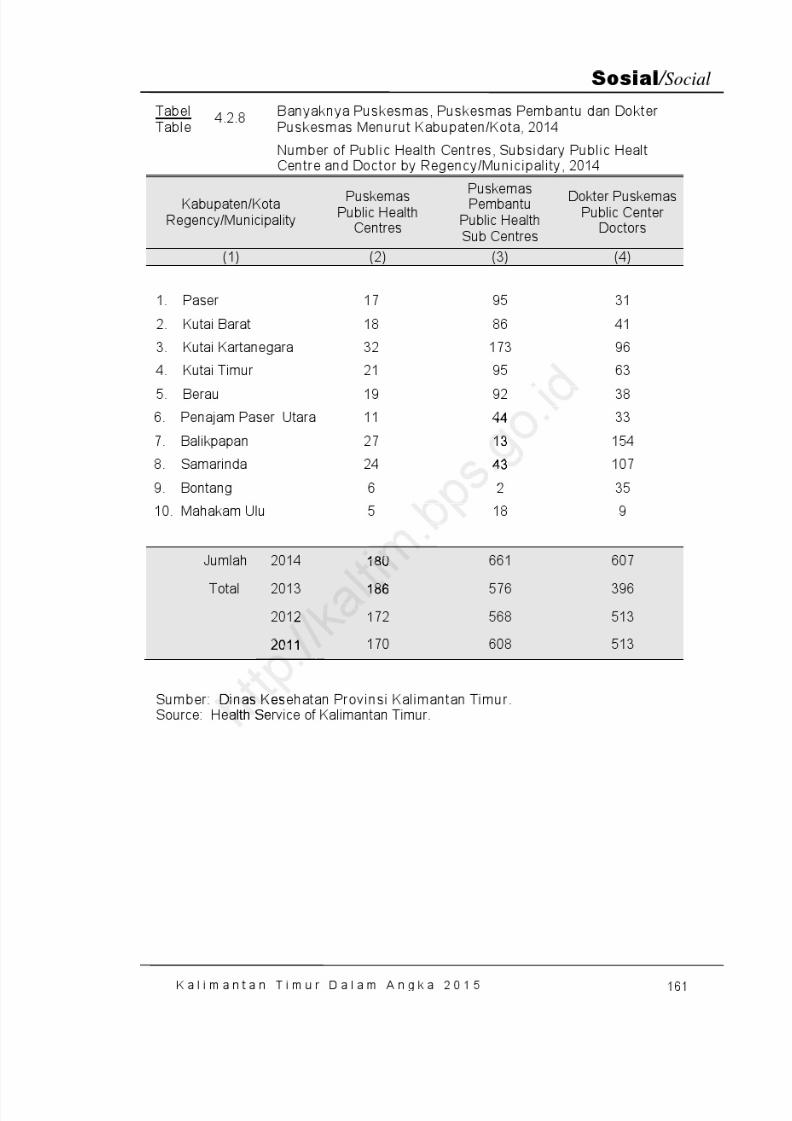
8/20/2019 Kalimantan Timur Dalam Angka Tahun 2015
http://slidepdf.com/reader/full/kalimantan-timur-dalam-angka-tahun-2015 227/623
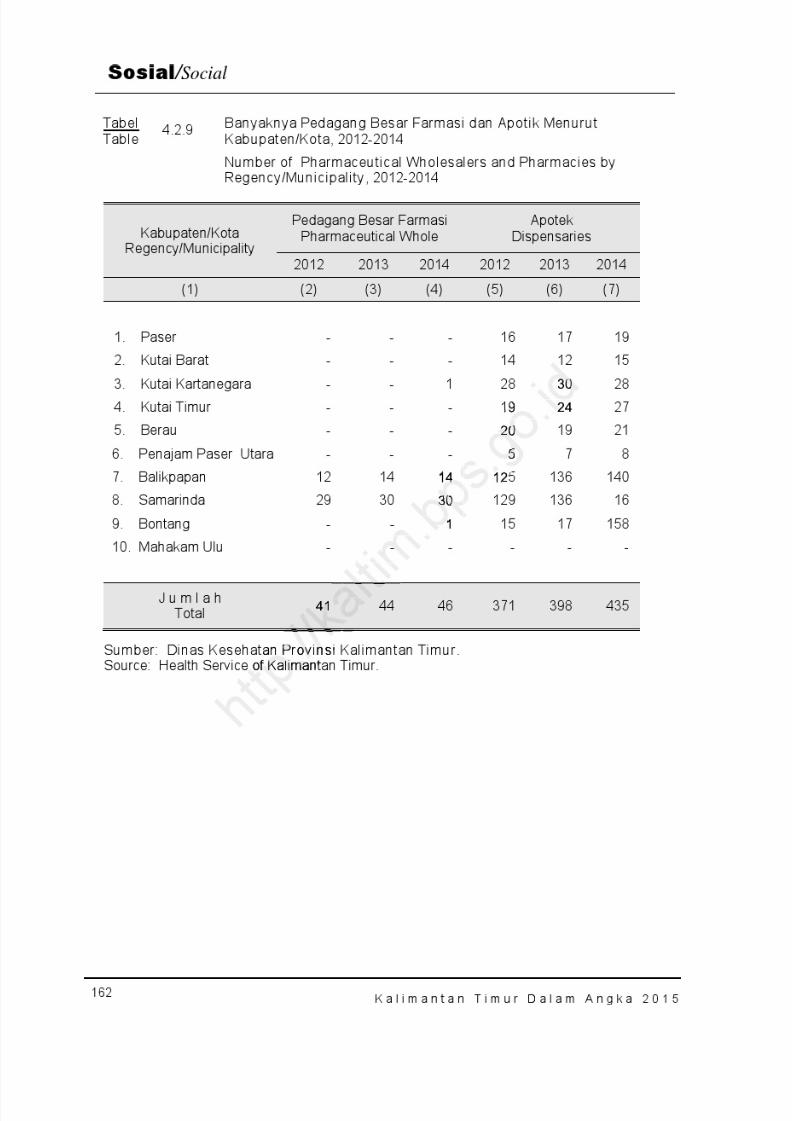
8/20/2019 Kalimantan Timur Dalam Angka Tahun 2015
http://slidepdf.com/reader/full/kalimantan-timur-dalam-angka-tahun-2015 228/623
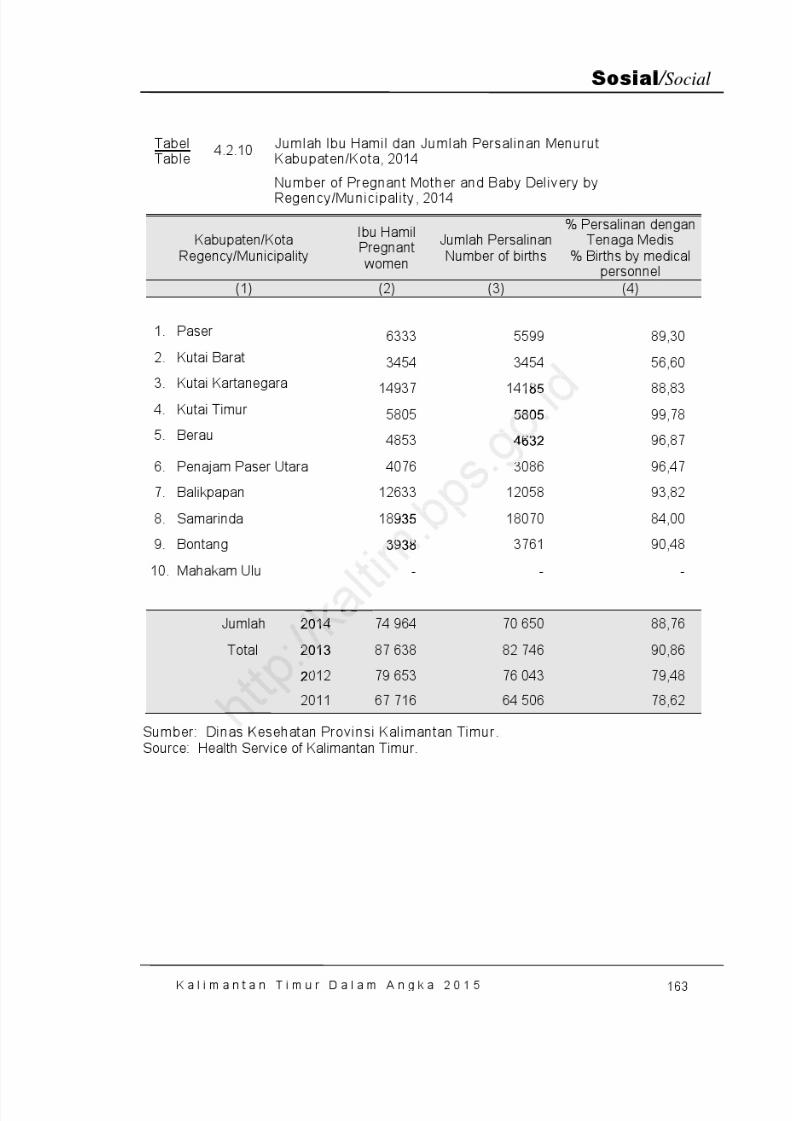
8/20/2019 Kalimantan Timur Dalam Angka Tahun 2015
http://slidepdf.com/reader/full/kalimantan-timur-dalam-angka-tahun-2015 229/623
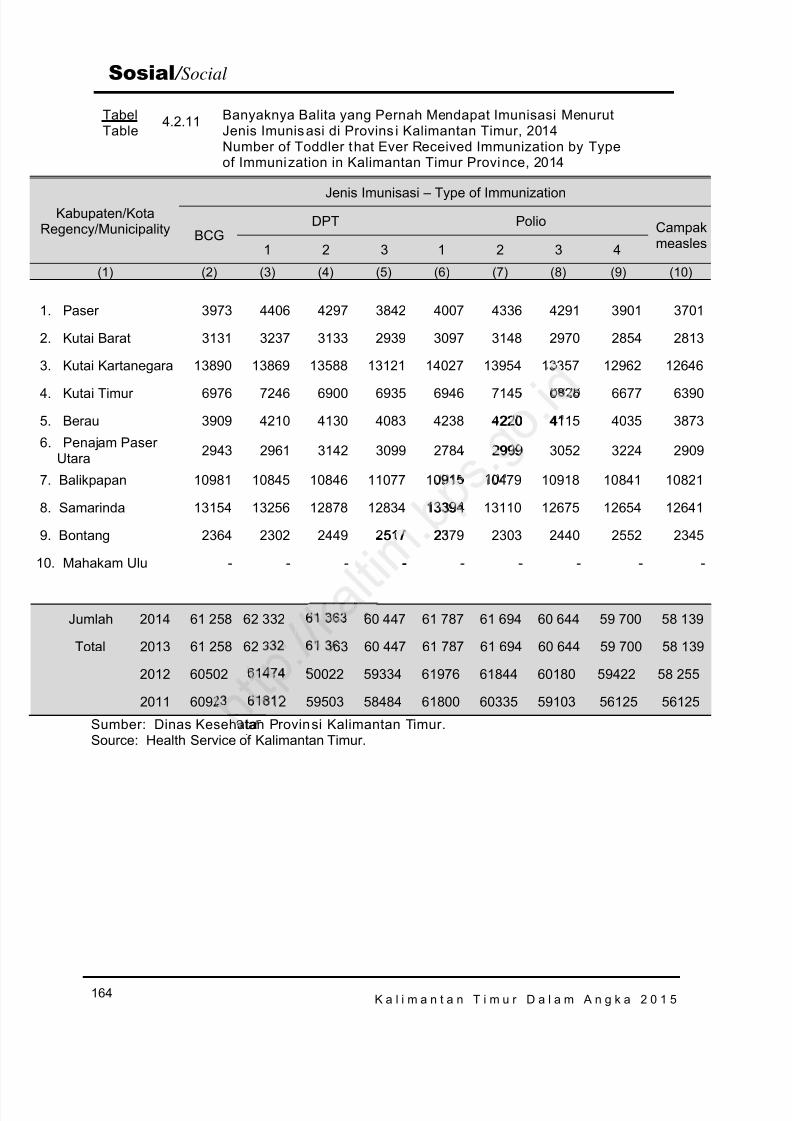
8/20/2019 Kalimantan Timur Dalam Angka Tahun 2015
http://slidepdf.com/reader/full/kalimantan-timur-dalam-angka-tahun-2015 230/623
K a l i m a n t a n T i m u r D a l a m A n g k a 2 0 1 5164
Sosial / Social
Sumber: Dinas Kesehatan Provinsi Kalimantan Timur.Source: Health Service of Kalimantan Timur.
TabelTable
4.2.11 Banyaknya Balita yang Pernah Mendapat Imunisasi MenurutJenis Imunisasi di Provins i Kalimantan Timur, 2014Number of Toddler that Ever Received Immunization by Typeof Immunization in Kalimantan Timur Province, 2014
Kabupaten/KotaRegency/Municipality
Jenis Imunisasi – Type of Immunization
BCGDPT Polio Campak
measles1 2 3 1 2 3 4
(1) (2) (3) (4) (5) (6) (7) (8) (9) (10)
1. Paser 3973 4406 4297 3842 4007 4336 4291 3901 3701
2. Kutai Barat 3131 3237 3133 2939 3097 3148 2970 2854 2813
3. Kutai Kartanegara 13890 13869 13588 13121 14027 13954 13357 12962 12646
4. Kutai Timur 6976 7246 6900 6935 6946 7145 6826 6677 6390
5. Berau 3909 4210 4130 4083 4238 4220 4115 4035 38736. Penajam Paser
Utara 2943 2961 3142 3099 2784 2999 3052 3224 2909
7. Balikpapan 10981 10845 10846 11077 10915 10479 10918 10841 10821
8. Samarinda 13154 13256 12878 12834 13394 13110 12675 12654 12641
9. Bontang 2364 2302 2449 2517 2379 2303 2440 2552 2345
10. Mahakam Ulu - - - - - - - - -
Jumlah 2014 61 258 62 332 61 363 60 447 61 787 61 694 60 644 59 700 58 139
Total 2013 61 258 62 332 61 363 60 447 61 787 61 694 60 644 59 700 58 139
2012 60502 61474 50022 59334 61976 61844 60180 59422 58 255
2011 60923 61812 59503 58484 61800 60335 59103 56125 56125
220 4
2999
13394
517 2
-
ta
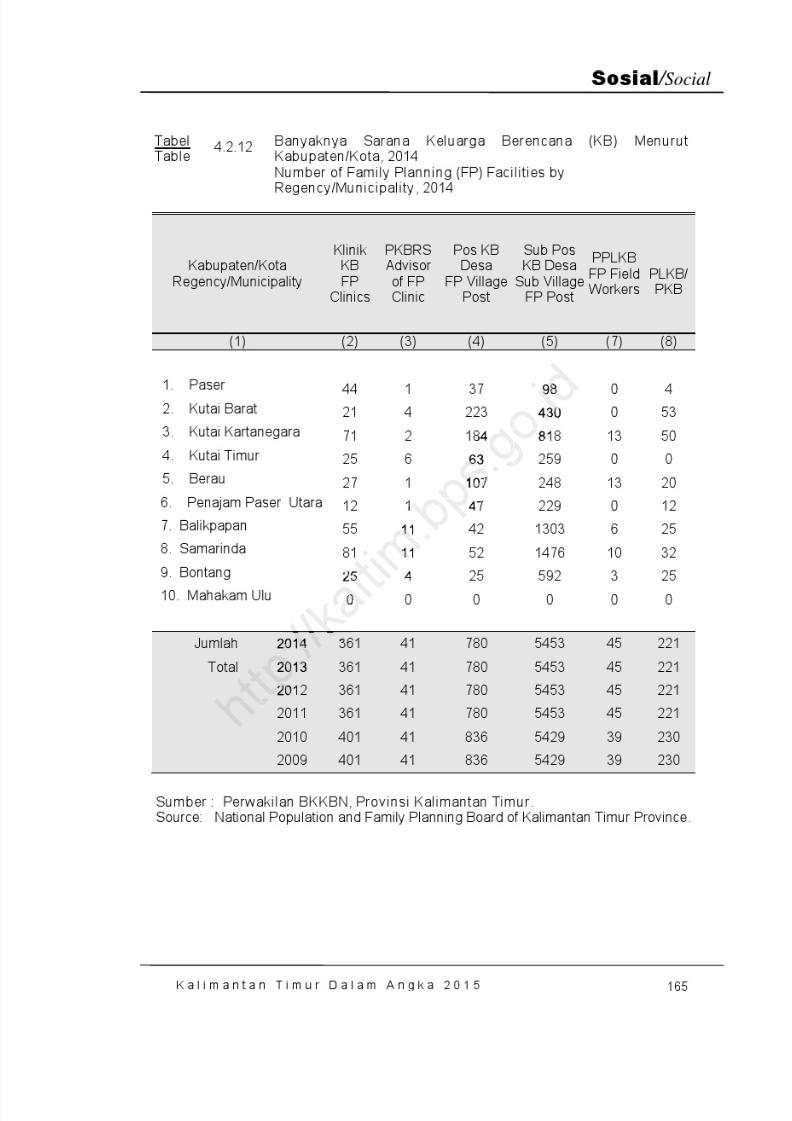
8/20/2019 Kalimantan Timur Dalam Angka Tahun 2015
http://slidepdf.com/reader/full/kalimantan-timur-dalam-angka-tahun-2015 231/623
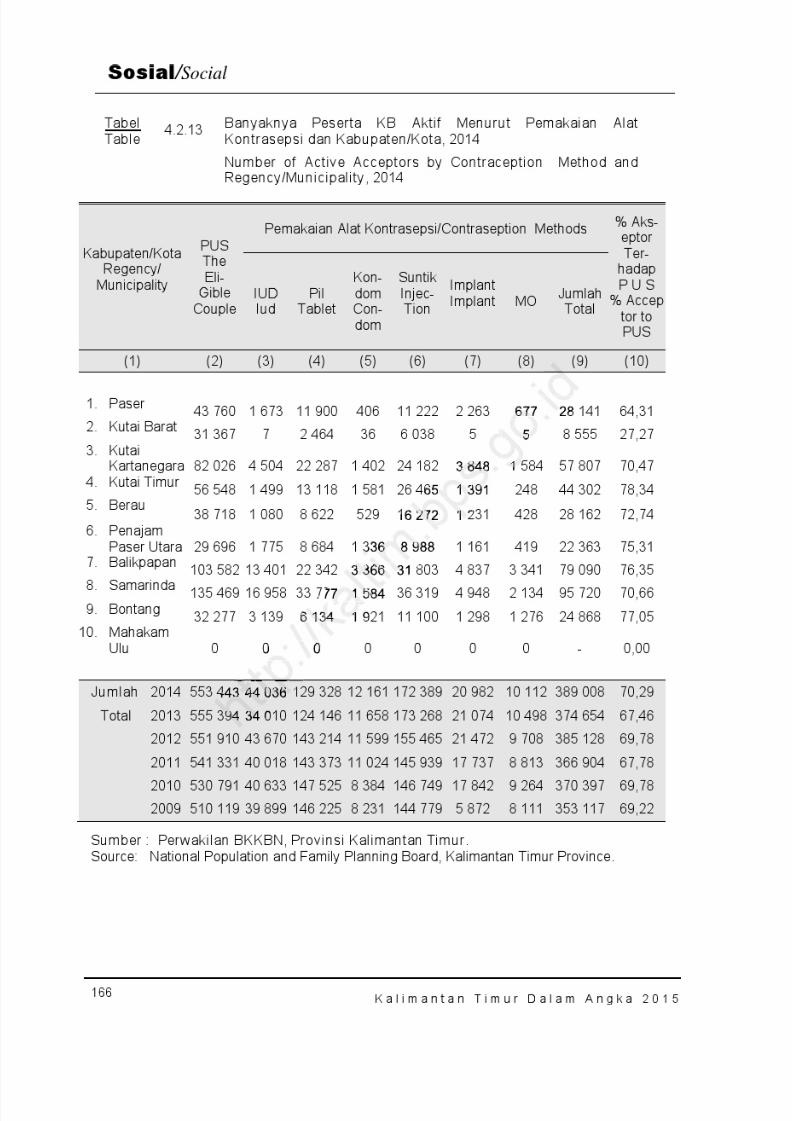
8/20/2019 Kalimantan Timur Dalam Angka Tahun 2015
http://slidepdf.com/reader/full/kalimantan-timur-dalam-angka-tahun-2015 232/623
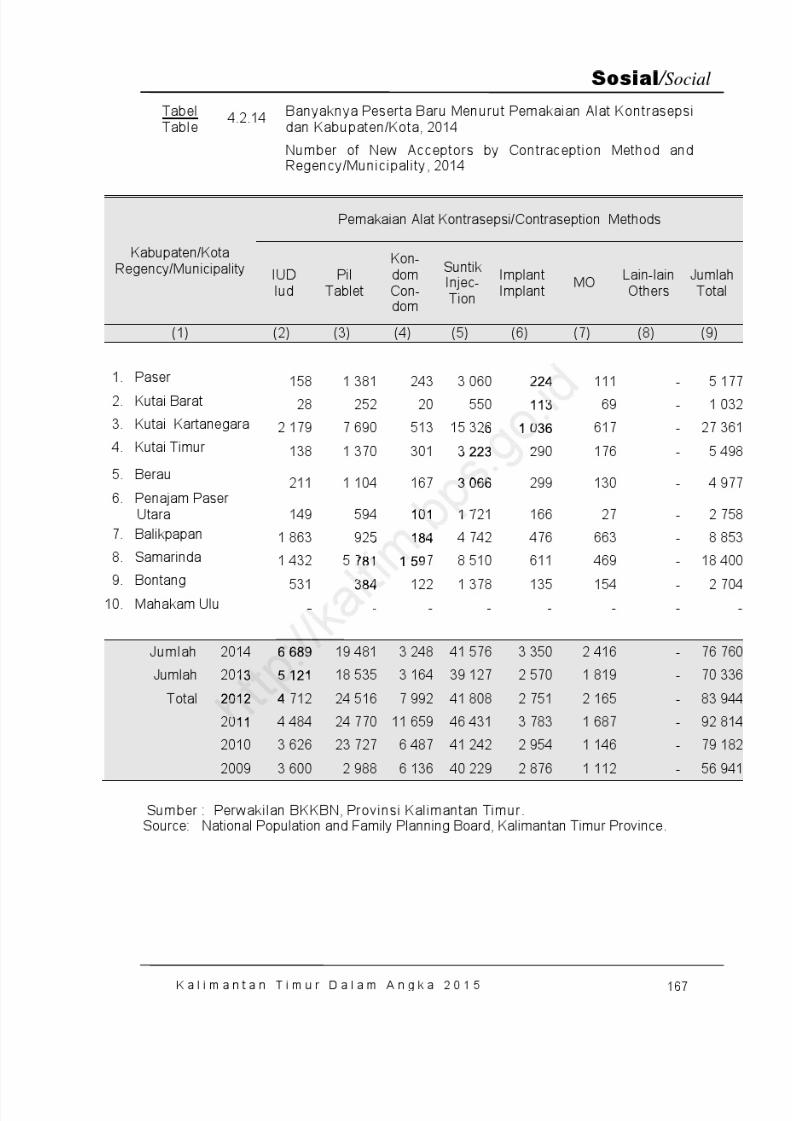
8/20/2019 Kalimantan Timur Dalam Angka Tahun 2015
http://slidepdf.com/reader/full/kalimantan-timur-dalam-angka-tahun-2015 233/623
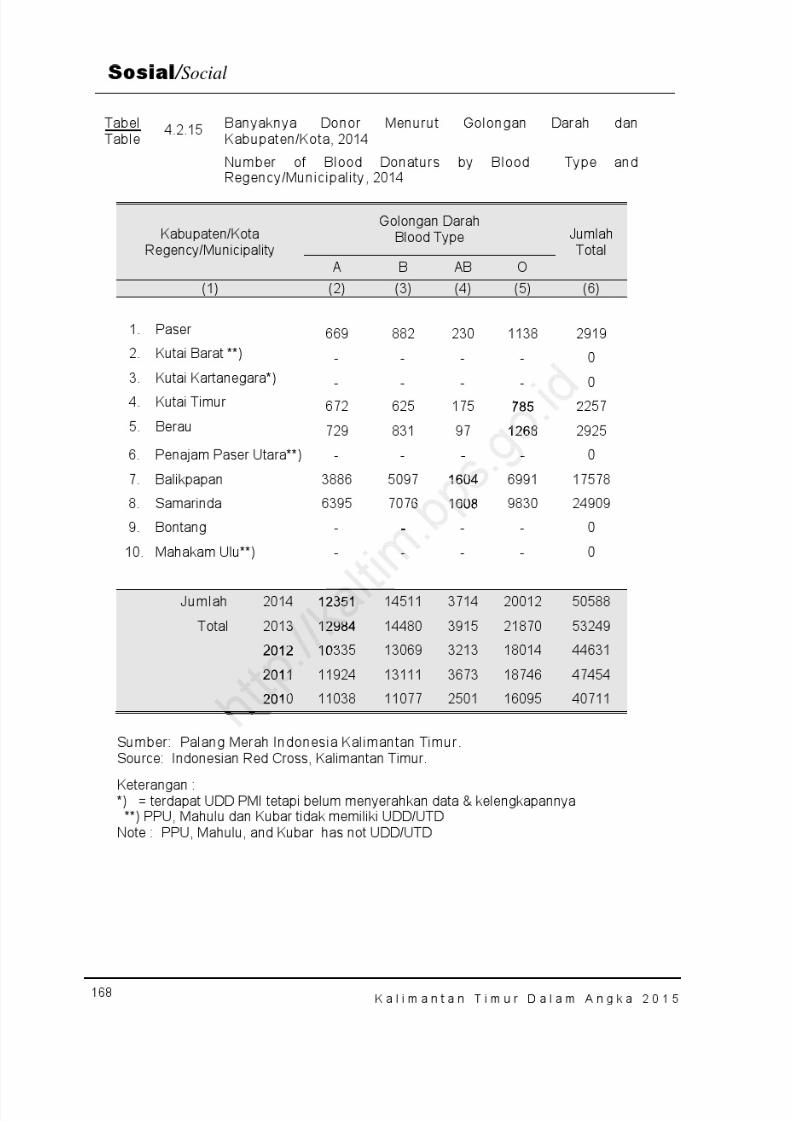
8/20/2019 Kalimantan Timur Dalam Angka Tahun 2015
http://slidepdf.com/reader/full/kalimantan-timur-dalam-angka-tahun-2015 234/623
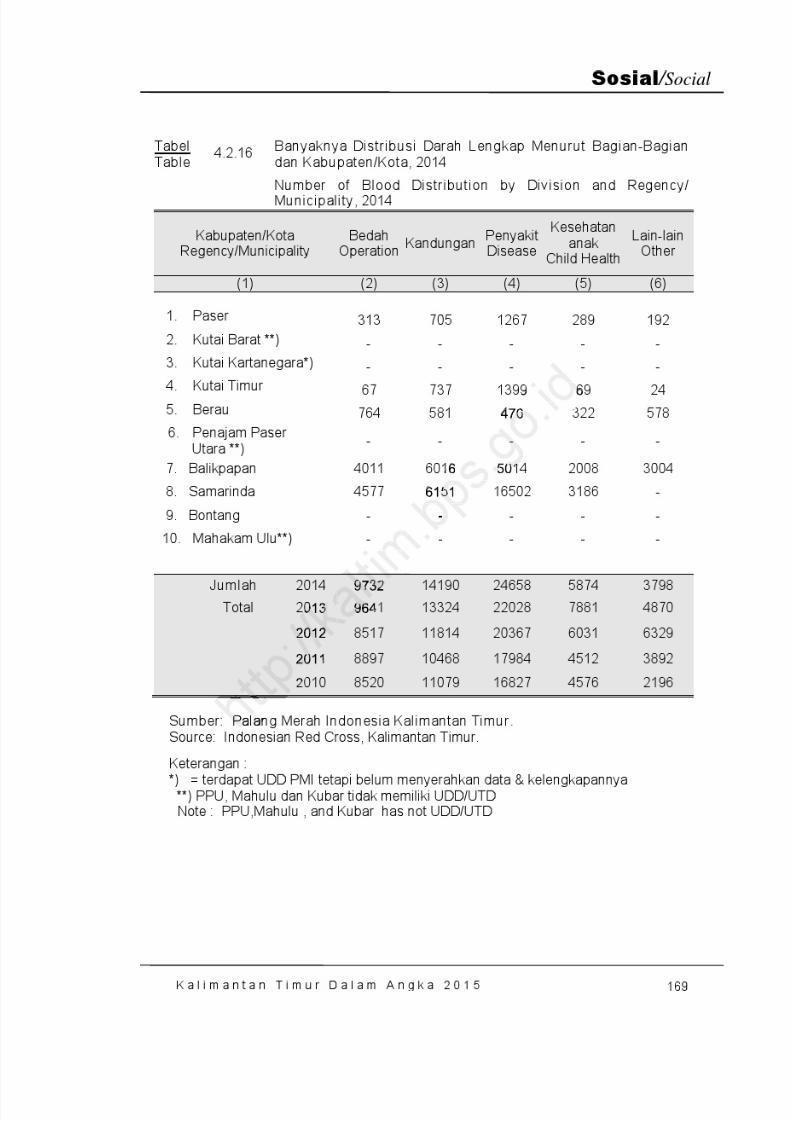
8/20/2019 Kalimantan Timur Dalam Angka Tahun 2015
http://slidepdf.com/reader/full/kalimantan-timur-dalam-angka-tahun-2015 235/623
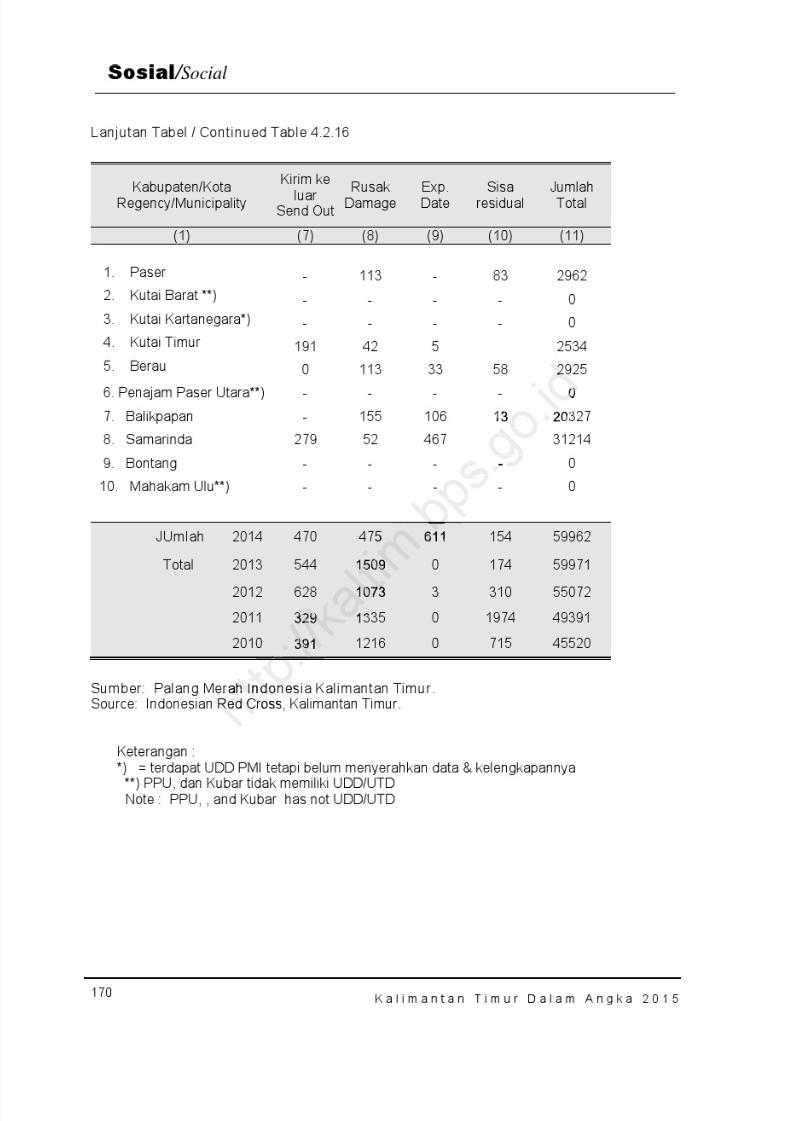
8/20/2019 Kalimantan Timur Dalam Angka Tahun 2015
http://slidepdf.com/reader/full/kalimantan-timur-dalam-angka-tahun-2015 236/623
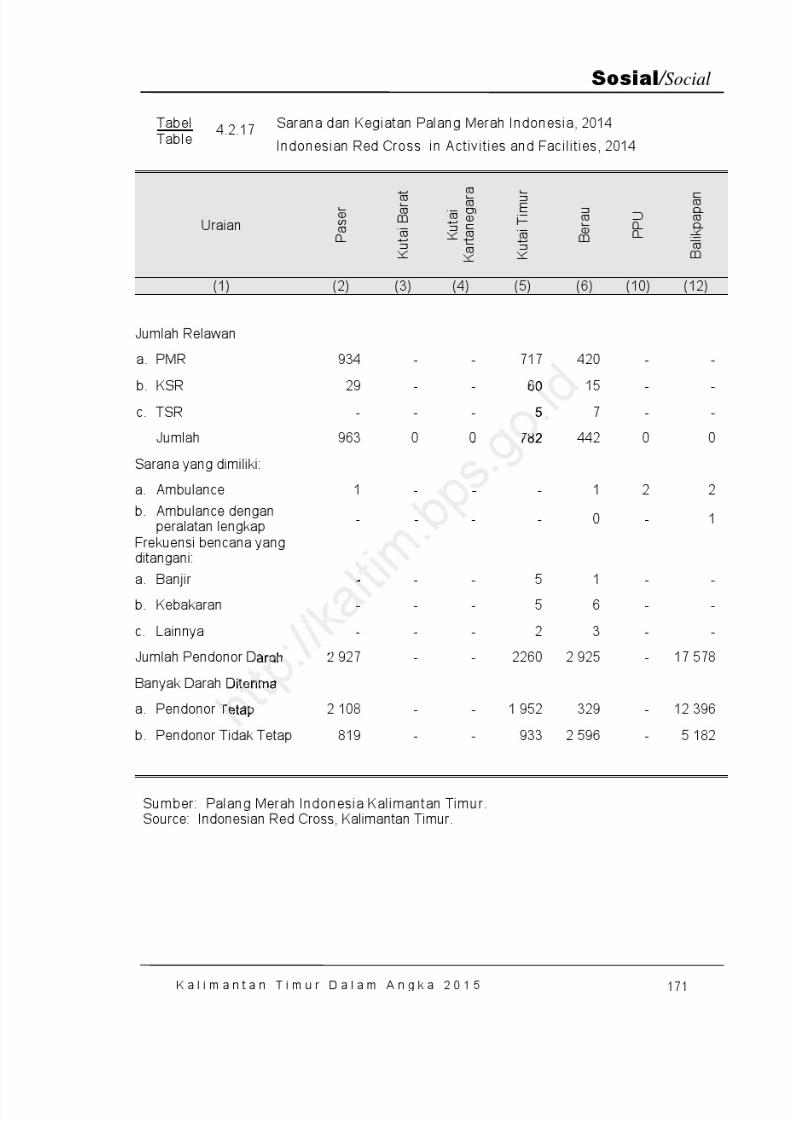
8/20/2019 Kalimantan Timur Dalam Angka Tahun 2015
http://slidepdf.com/reader/full/kalimantan-timur-dalam-angka-tahun-2015 237/623
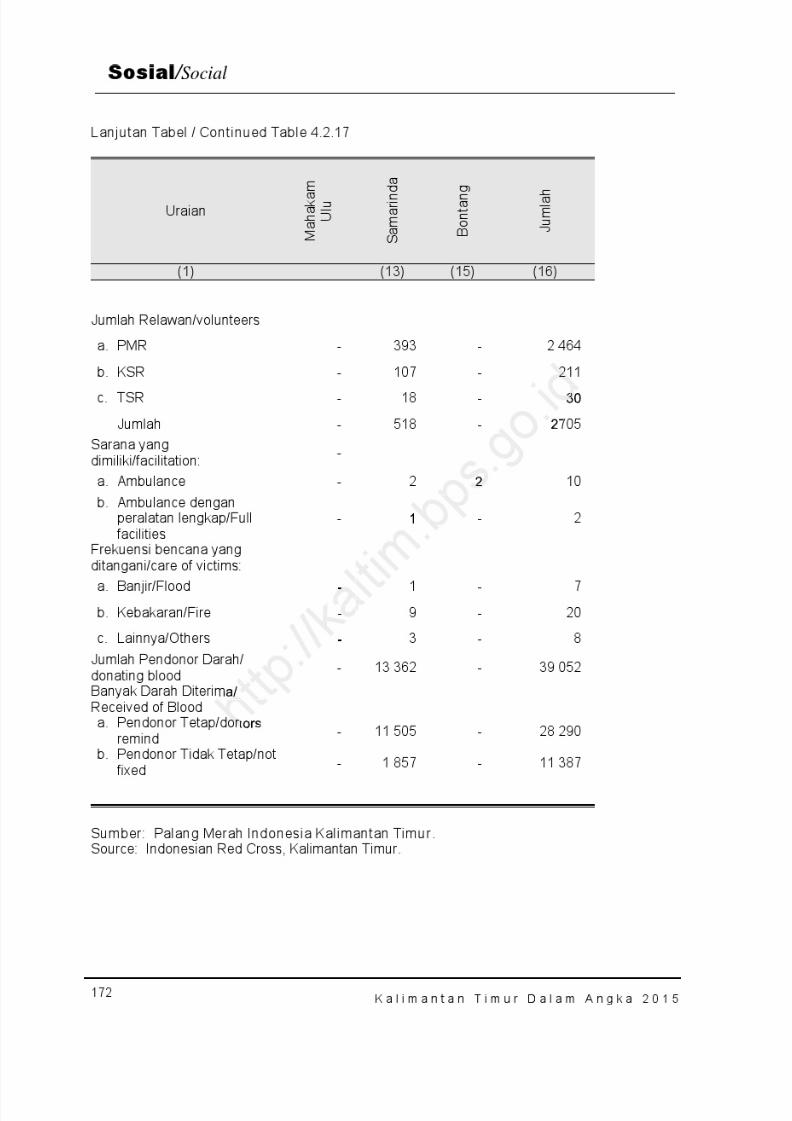
8/20/2019 Kalimantan Timur Dalam Angka Tahun 2015
http://slidepdf.com/reader/full/kalimantan-timur-dalam-angka-tahun-2015 238/623
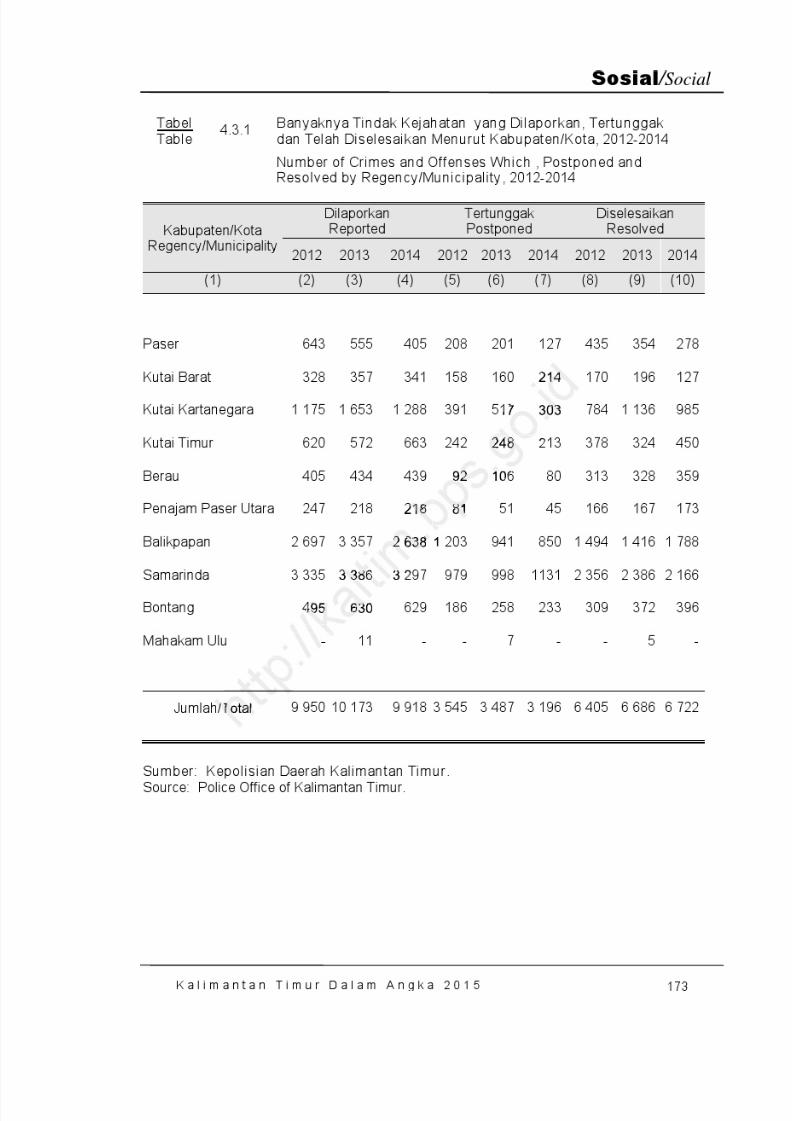
8/20/2019 Kalimantan Timur Dalam Angka Tahun 2015
http://slidepdf.com/reader/full/kalimantan-timur-dalam-angka-tahun-2015 239/623
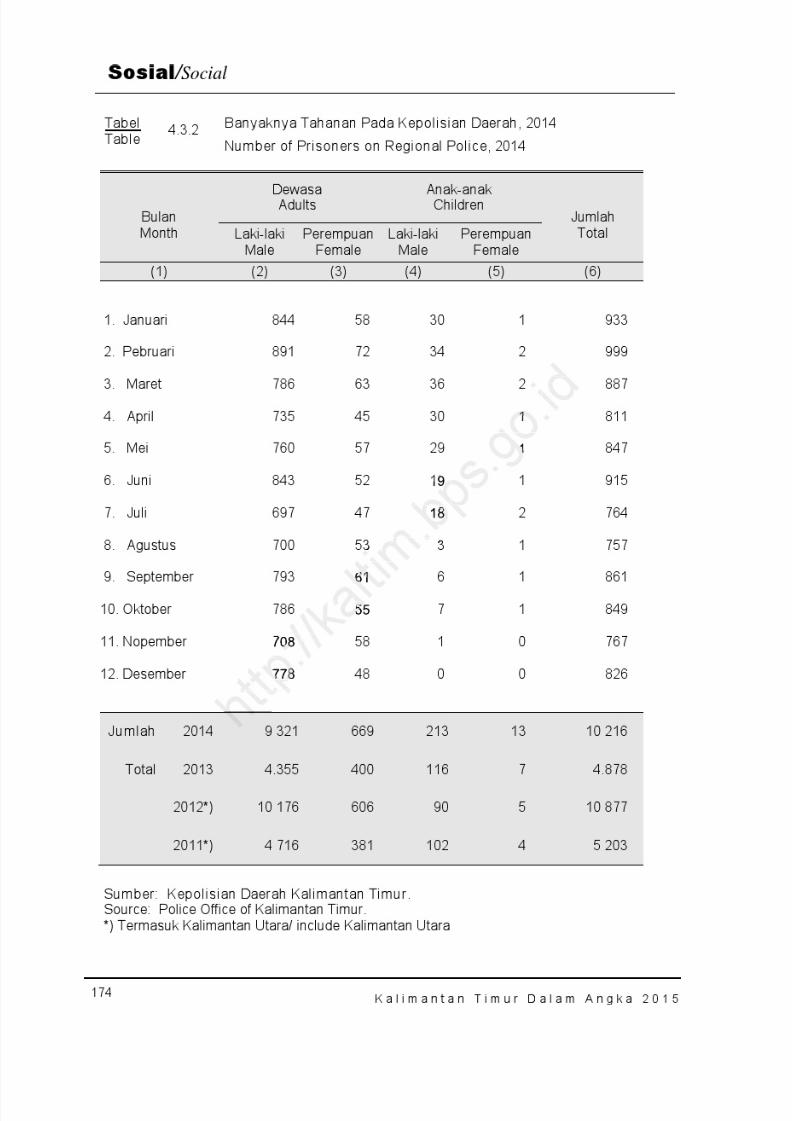
8/20/2019 Kalimantan Timur Dalam Angka Tahun 2015
http://slidepdf.com/reader/full/kalimantan-timur-dalam-angka-tahun-2015 240/623
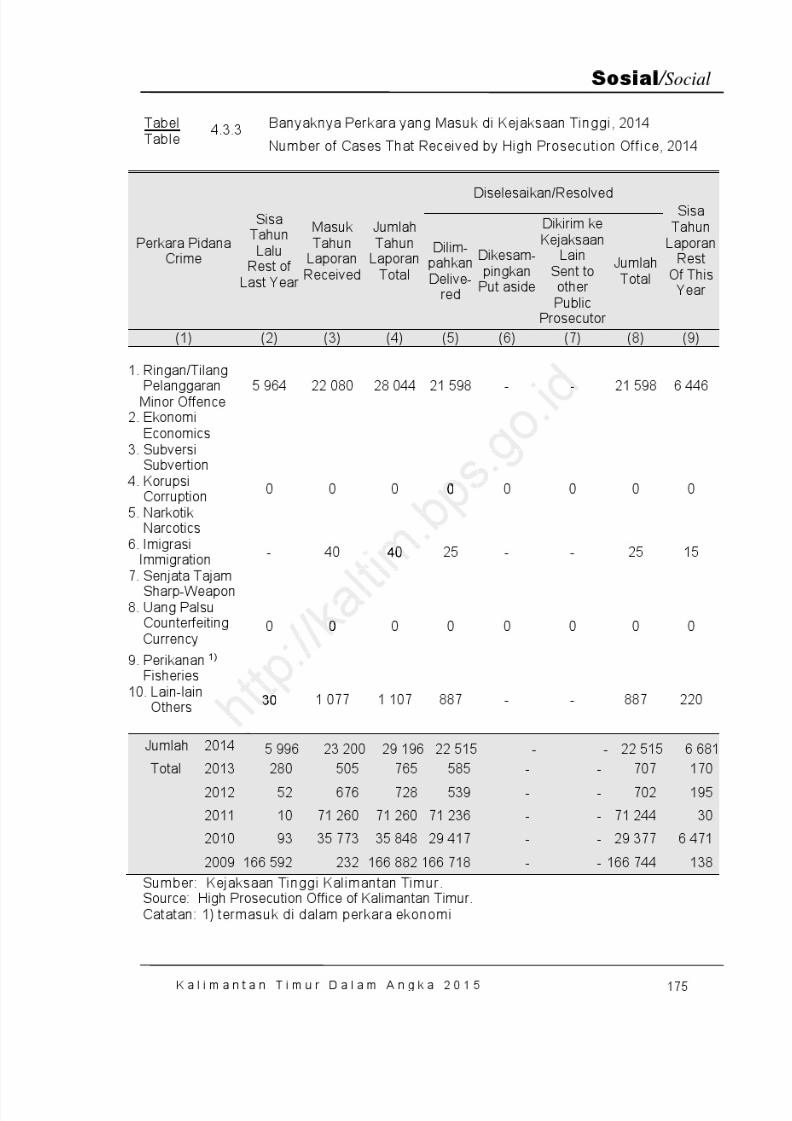
8/20/2019 Kalimantan Timur Dalam Angka Tahun 2015
http://slidepdf.com/reader/full/kalimantan-timur-dalam-angka-tahun-2015 241/623
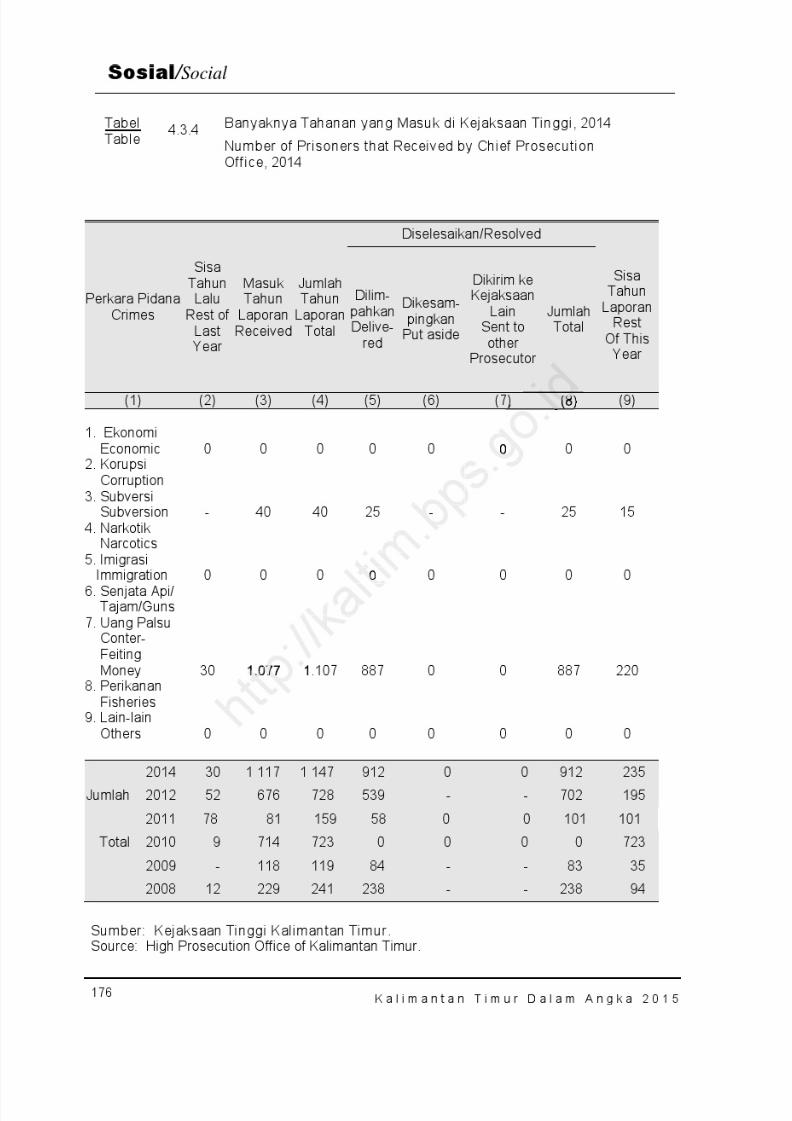
8/20/2019 Kalimantan Timur Dalam Angka Tahun 2015
http://slidepdf.com/reader/full/kalimantan-timur-dalam-angka-tahun-2015 242/623
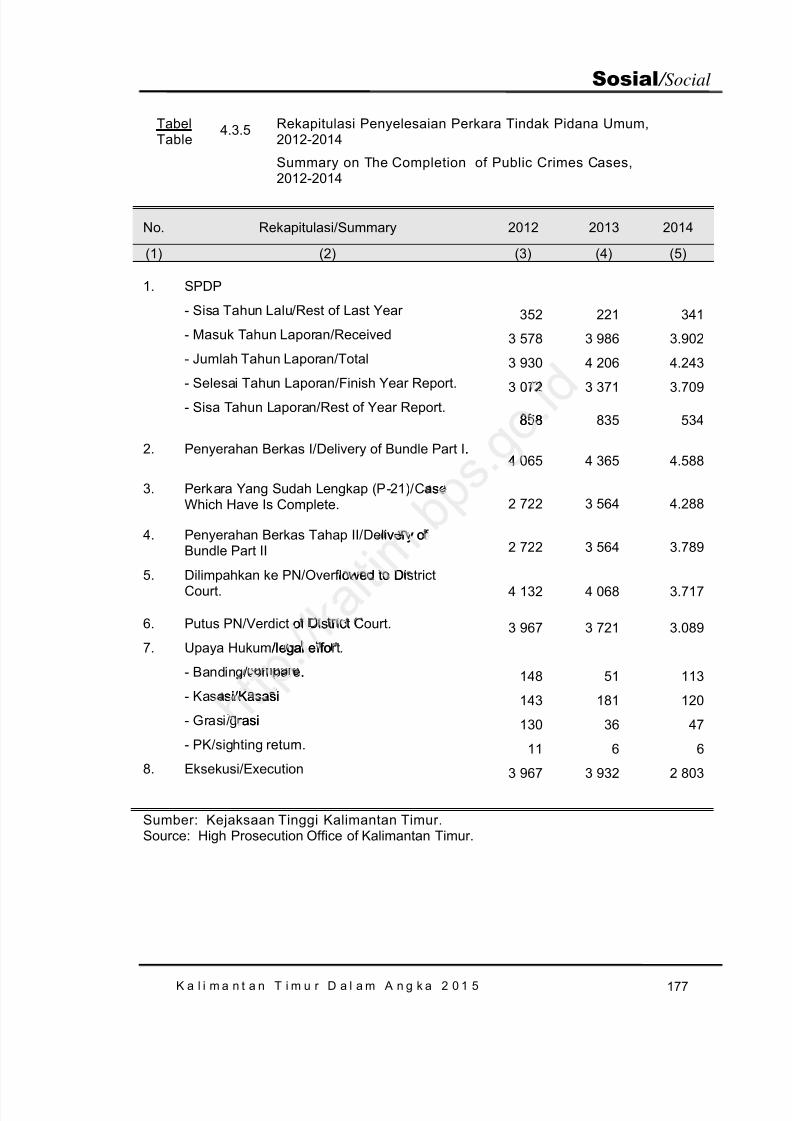
8/20/2019 Kalimantan Timur Dalam Angka Tahun 2015
http://slidepdf.com/reader/full/kalimantan-timur-dalam-angka-tahun-2015 243/623
K a l i m a n t a n T i m u r D a l a m A n g k a 2 0 1 5 177
Sosial / Social
No. Rekapitulasi/ Summary 2012 2013 2014
(1) (2) (3) (4) (5)
1. SPDP
- Sisa Tahun Lalu/ Rest of Last Year 352 221 341- Masuk Tahun Laporan/ Received 3 578 3 986 3.902- Jumlah Tahun Laporan/ Total 3 930 4 206 4.243
- Selesai Tahun Laporan/ Finish Year Report. 3 072 3 371 3.709- Sisa Tahun Laporan/ Rest of Year Report.
858 835 534
2. Penyerahan Berkas I/ Delivery of Bundle Part I.4 065 4 365 4.588
3. Perkara Yang Sudah Lengkap (P-21)/ CaseWhich Have Is Complete. 2 722 3 564 4.288
4. Penyerahan Berkas Tahap II/ Delivery ofBundle Part II 2 722 3 564 3.789
5. Dilimpahkan ke PN/ Overflowed to DistrictCourt. 4 132 4 068 3.717
6. Putus PN/ Verdict of District Court. 3 967 3 721 3.0897. Upaya Hukum/ legal effort.
- Banding/ compare. 148 51 113- Kasasi/ Kasasi 143 181 120- Grasi/ grasi 130 36 47- PK/sighting return. 11 6 6
8. Eksekusi/Execution 3 967 3 932 2 803
Sumber: Kejaksaan Tinggi Kalimantan Timur.Source: High Prosecution Office of Kalimantan Timur.
TabelTable
4.3.5 Rekapitulasi Penyelesaian Perkara Tindak Pidana Umum,2012-2014
Summary on The Completion of Public Crimes Cases,2012-2014
858
. 4
se
very o
owed to D
o s r cs
/legal effo
.
si/Kasasi
rasi
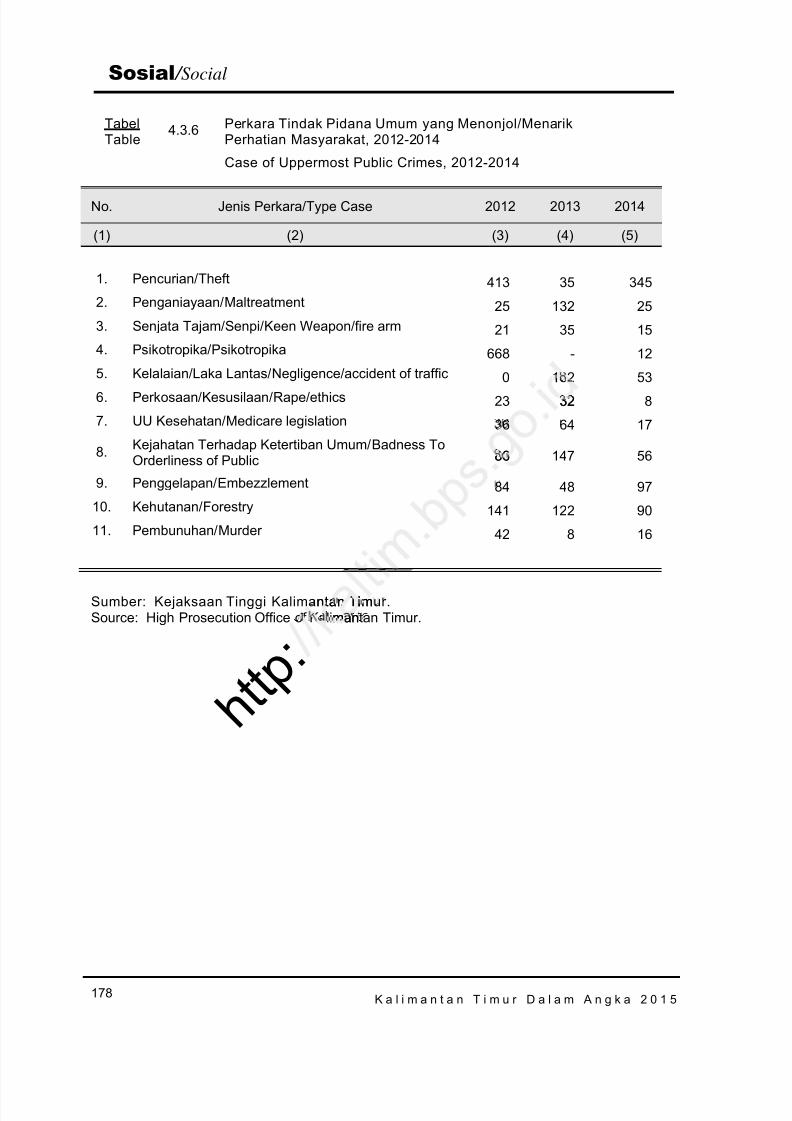
8/20/2019 Kalimantan Timur Dalam Angka Tahun 2015
http://slidepdf.com/reader/full/kalimantan-timur-dalam-angka-tahun-2015 244/623
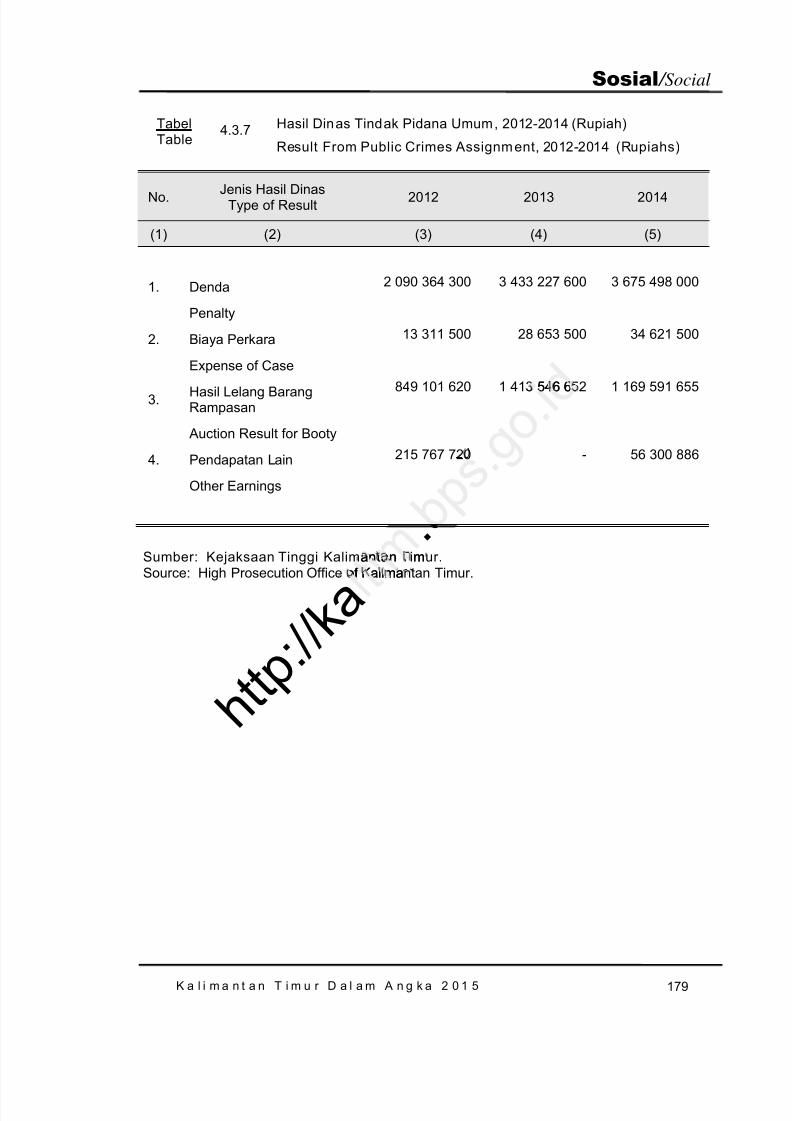
8/20/2019 Kalimantan Timur Dalam Angka Tahun 2015
http://slidepdf.com/reader/full/kalimantan-timur-dalam-angka-tahun-2015 245/623
K a l i m a n t a n T i m u r D a l a m A n g k a 2 0 1 5 179
Sosial / Social
No. Jenis Hasil DinasType of Result 2012 2013 2014
(1) (2) (3) (4) (5)
1. Denda 2 090 364 300 3 433 227 600 3 675 498 000
Penalty
2. Biaya Perkara 13 311 500 28 653 500 34 621 500
Expense of Case
3. Hasil Lelang BarangRampasan
849 101 620 1 413 546 652 1 169 591 655
Auction Result for Booty
4. Pendapatan Lain 215 767 720 - 56 300 886
Other Earnings
Sumber: Kejaksaan Tinggi Kalimantan Timur.
Source: High Prosecution Office of Kalimantan Timur.
TabelTable
4.3.7 Hasil Dinas Tindak Pidana Umum, 2012-2014 (Rupiah)
Result From Public Crimes Assignment, 2012-2014 (Rupiahs)
546 6
. an an m
h t t p : / / k a
of Kalima
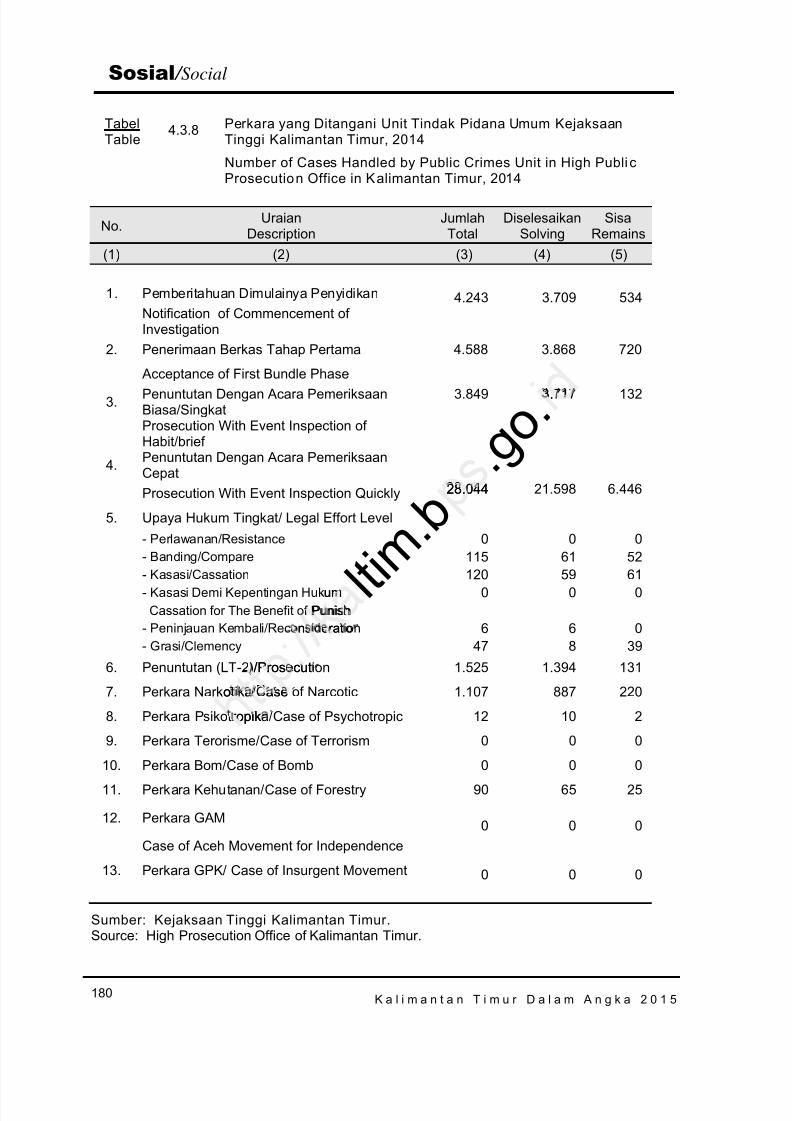
8/20/2019 Kalimantan Timur Dalam Angka Tahun 2015
http://slidepdf.com/reader/full/kalimantan-timur-dalam-angka-tahun-2015 246/623
K a l i m a n t a n T i m u r D a l a m A n g k a 2 0 1 5180
Sosial / Social
No. UraianDescription
JumlahTotal
DiselesaikanSolving
SisaRemains
(1) (2) (3) (4) (5)
1. Pemberitahuan Dimulainya Penyidikan 4.243 3.709 534Notification of Commencement ofInvestigation
2. Penerimaan Berkas Tahap Pertama 4.588 3.868 720
Acceptance of First Bundle Phase
3. Penuntutan Dengan Acara PemeriksaanBiasa/Singkat
3.849 3.717 132
Prosecution With Event Inspection ofHabit/brief
4. Penuntutan Dengan Acara PemeriksaanCepatProsecution With Event Inspection Quickly 28.044 21.598 6.446
5. Upaya Hukum Tingkat/ Legal Effort Level- Perlawanan/ Resistance 0 0 0- Banding/ Compare 115 61 52
- Kasasi/ Cassation 120 59 61- Kasasi Demi Kepentingan Hukum 0 0 0
Cassation for The Benefit of Punish- Peninjauan Kembali/ Reconsideration 6 6 0- Grasi/ Clemency 47 8 39
6. Penuntutan (LT-2)/ Prosecution 1.525 1.394 131
7. Perkara Narkotika/ Case of Narcotic 1.107 887 220
8. Perkara Psikotropika/ Case of Psychotropic 12 10 2
9. Perkara Terorisme/ Case of Terrorism 0 0 0
10. Perkara Bom/ Case of Bomb 0 0 011. Perkara Kehutanan/ Case of Forestry 90 65 25
12. Perkara GAM 0 0 0Case of Aceh Movement for Independence
13. Perkara GPK/ Case of Insurgent Movement 0 0 0
Sumber: Kejaksaan Tinggi Kalimantan Timur.Source: High Prosecution Office of Kalimantan Timur.
TabelTable
4.3.8 Perkara yang Ditangani Unit Tindak Pidana Umum KejaksaanTinggi Kalimantan Timur, 2014
Number of Cases Handled by Public Crimes Unit in High Publi cProsecution Office in Kalimantan Timur, 2014
l t i m . b
. g o ..
28.044.
um Punish
ons erat o
/Prosecutr
o a ase
ropik
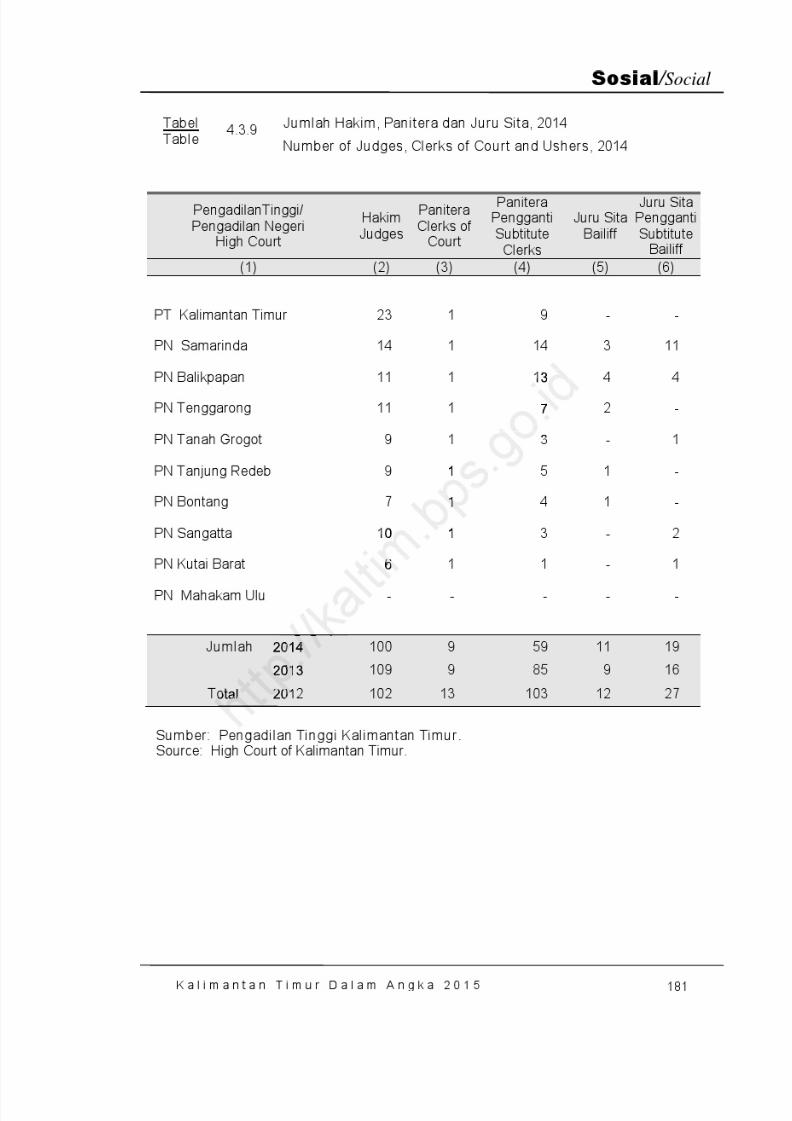
8/20/2019 Kalimantan Timur Dalam Angka Tahun 2015
http://slidepdf.com/reader/full/kalimantan-timur-dalam-angka-tahun-2015 247/623
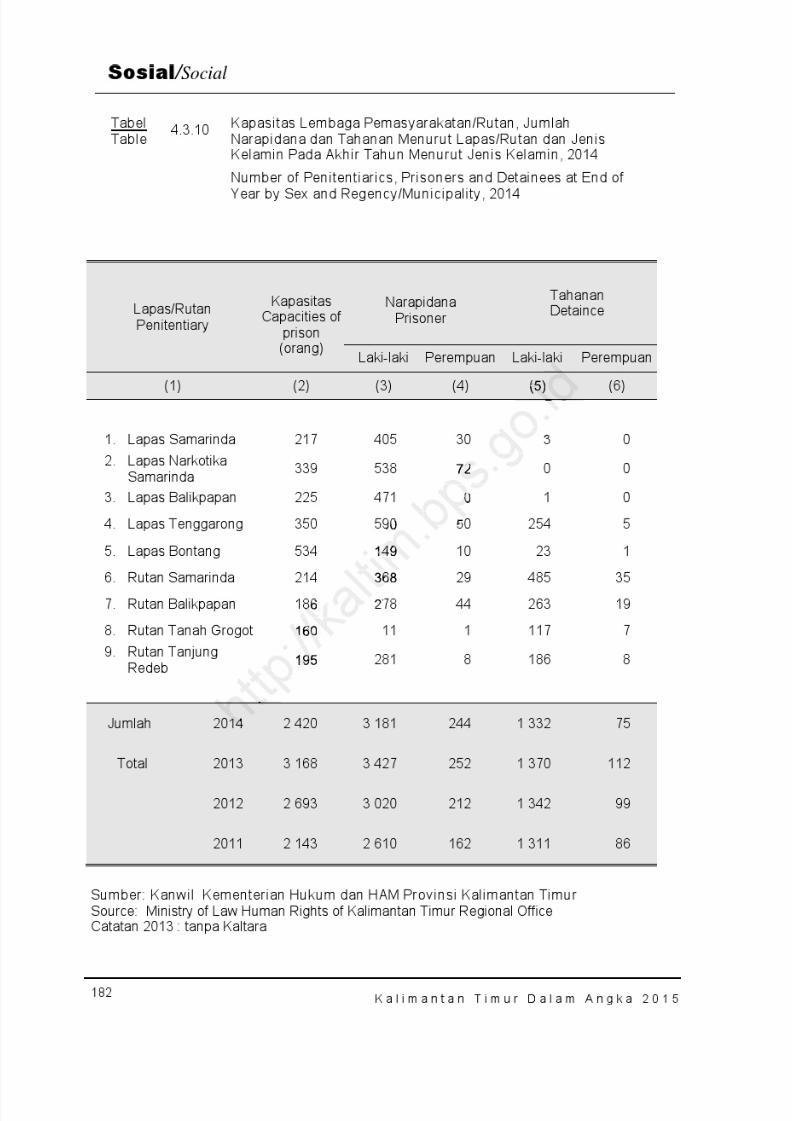
8/20/2019 Kalimantan Timur Dalam Angka Tahun 2015
http://slidepdf.com/reader/full/kalimantan-timur-dalam-angka-tahun-2015 248/623
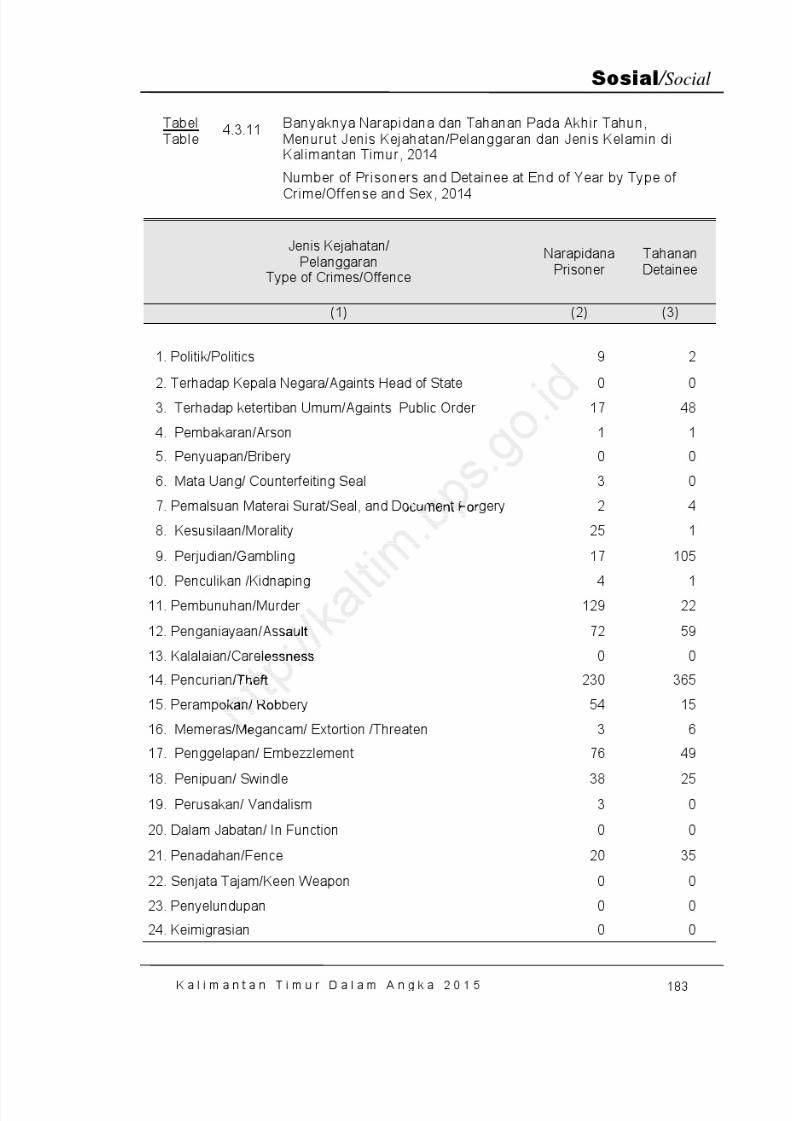
8/20/2019 Kalimantan Timur Dalam Angka Tahun 2015
http://slidepdf.com/reader/full/kalimantan-timur-dalam-angka-tahun-2015 249/623
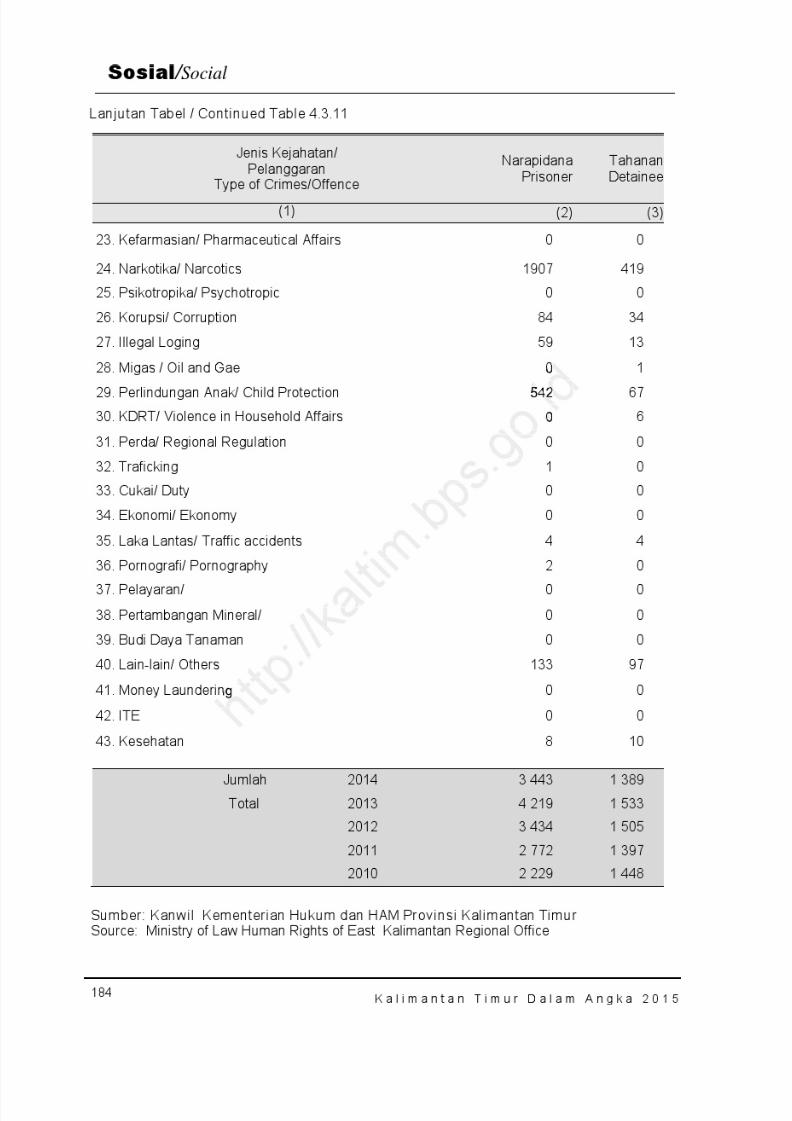
8/20/2019 Kalimantan Timur Dalam Angka Tahun 2015
http://slidepdf.com/reader/full/kalimantan-timur-dalam-angka-tahun-2015 250/623
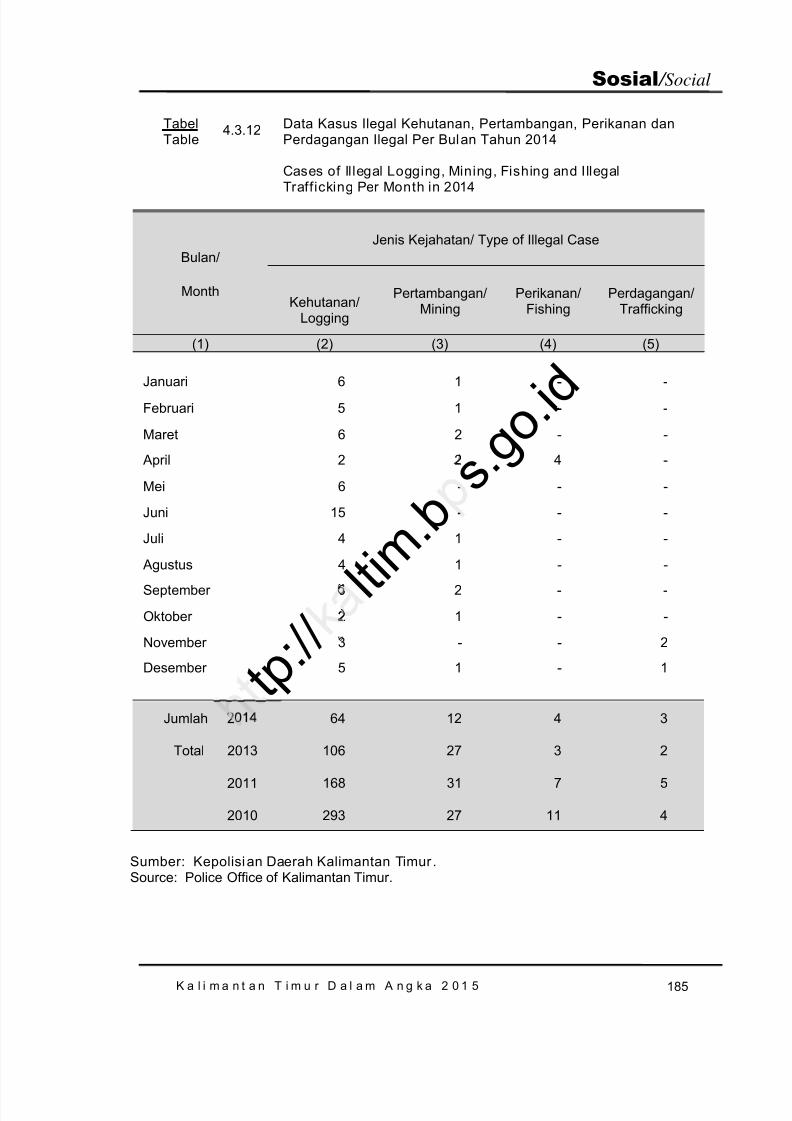
8/20/2019 Kalimantan Timur Dalam Angka Tahun 2015
http://slidepdf.com/reader/full/kalimantan-timur-dalam-angka-tahun-2015 251/623
K a l i m a n t a n T i m u r D a l a m A n g k a 2 0 1 5 185
Sosial / Social
Bulan/
Month
Jenis Kejahatan/ Type of Illegal Case
Kehutanan/Logging
Pertambangan/Mining
Perikanan/Fishing
Perdagangan/Trafficking
(1) (2) (3) (4) (5)
Januari 6 1 - -Februari 5 1 - -
Maret 6 2 - -
April 2 2 4 -
Mei 6 - - -
Juni 15 - - -
Juli 4 1 - -
Agustus 4 1 - -
September 6 2 - -
Oktober 2 1 - -
November 3 - - 2
Desember 5 1 - 1
Jumlah 2014 64 12 4 3
Total 2013 106 27 3 2
2011 168 31 7 5
2010 293 27 11 4
Sumber: Kepolisi an Daerah Kalimantan Timur .Source: Police Office of Kalimantan Timur.
TabelTable
4.3.12 Data Kasus Ilegal Kehutanan, Pertambangan, Perikanan danPerdagangan Ilegal Per Bulan Tahun 2014
Cases of Illegal Logging, Mining, Fishing and Illegal
Trafficking Per Month in 2014
t p : / /
l t i m . b
s . g o . i d--
-
-
2
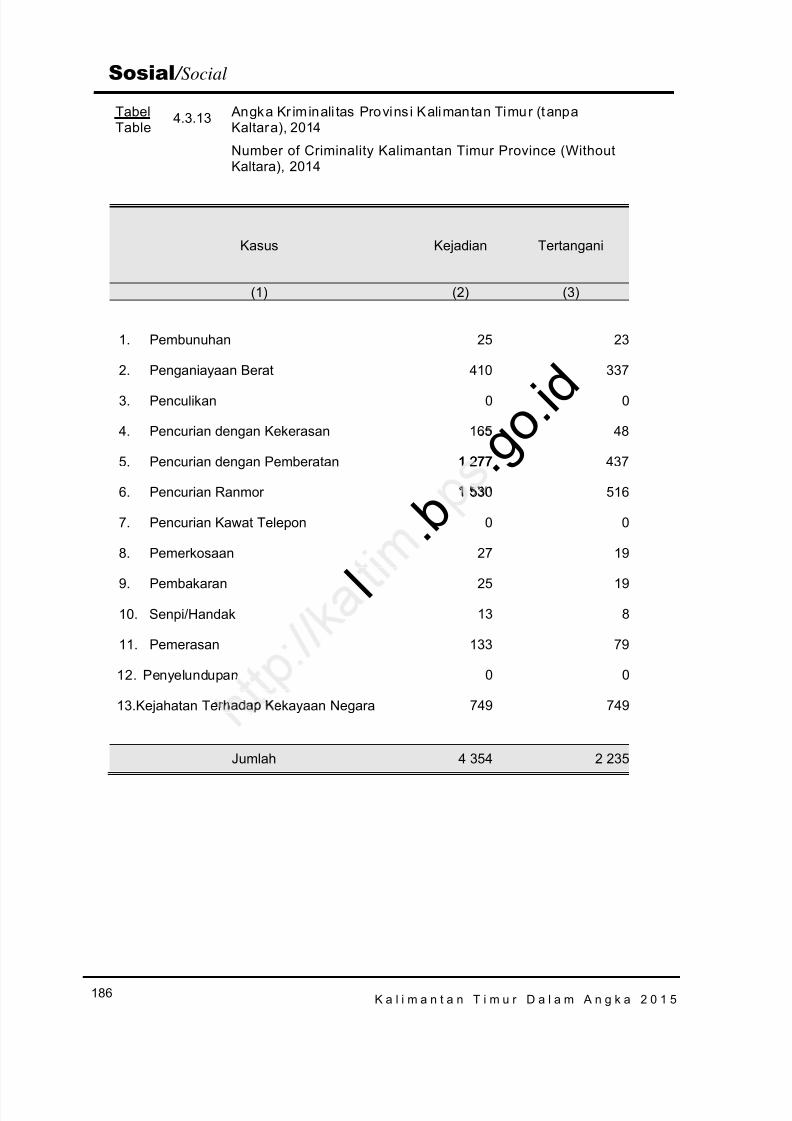
8/20/2019 Kalimantan Timur Dalam Angka Tahun 2015
http://slidepdf.com/reader/full/kalimantan-timur-dalam-angka-tahun-2015 252/623
K a l i m a n t a n T i m u r D a l a m A n g k a 2 0 1 5186
Sosial / Social
TabelTable
4.3.13 Angka Kr iminali tas Provins i Kalimantan Timur (t anpaKaltara), 2014
Number of Criminality Kalimantan Timur Province (WithoutKaltara), 2014
Kasus Kejadian Tertangani
(1) (2) (3)
1. Pembunuhan 25 23
2. Penganiayaan Berat 410 337
3. Penculikan 0 0
4. Pencurian dengan Kekerasan 165 48
5. Pencurian dengan Pemberatan 1 277 437
6. Pencurian Ranmor 1 530 516
7. Pencurian Kawat Telepon 0 0
8. Pemerkosaan 27 19
9. Pembakaran 25 19
10. Senpi/Handak 13 8
11. Pemerasan 133 79
12. Penyelundupan 0 0
13.Kejahatan Terhadap Kekayaan Negara 749 749
Jumlah 4 354 2 235
. b . g o . i d
1 277
l
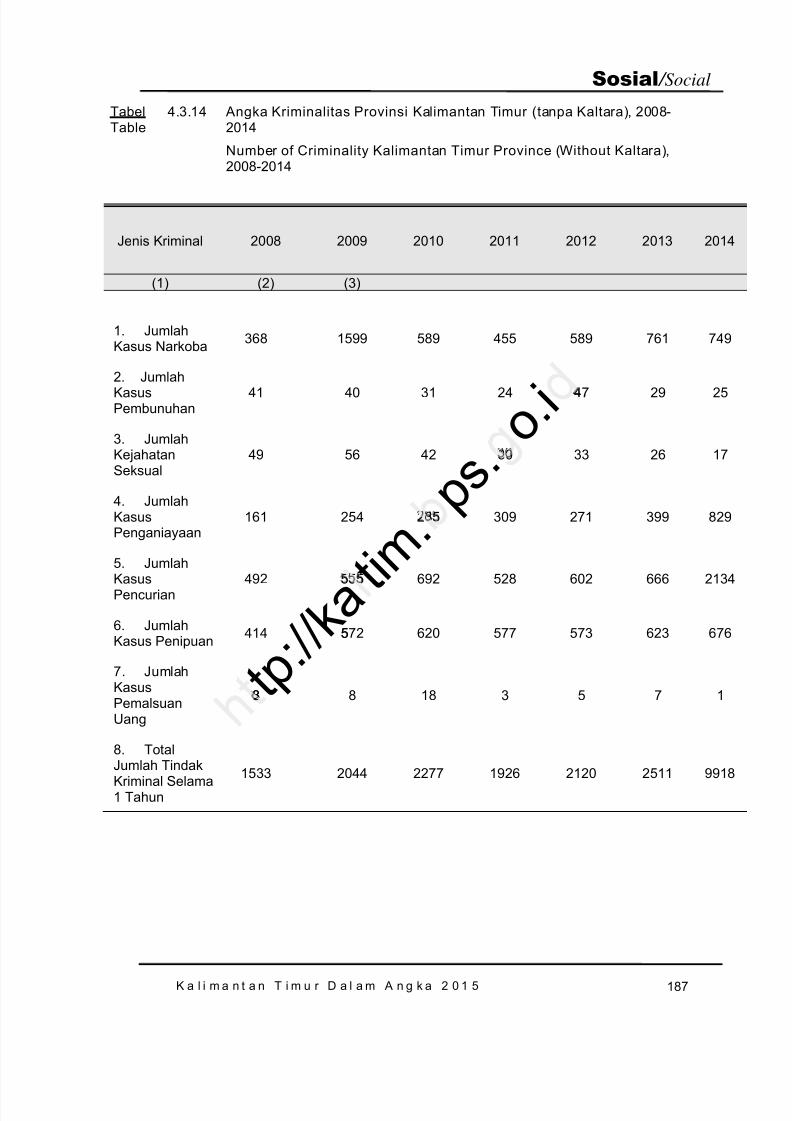
8/20/2019 Kalimantan Timur Dalam Angka Tahun 2015
http://slidepdf.com/reader/full/kalimantan-timur-dalam-angka-tahun-2015 253/623
K a l i m a n t a n T i m u r D a l a m A n g k a 2 0 1 5 187
Sosial / Social
TabelTable
4.3.14 Angka Kriminalitas Provinsi Kalimantan Timur (tanpa Kaltara), 2008-2014
Number of Criminality Kalimantan Timur Province (Without Kaltara),2008-2014
Jenis Kriminal 2008 2009 2010 2011 2012 2013 2014
(1) (2) (3)
1. JumlahKasus Narkoba 368 1599 589 455 589 761 749
2. JumlahKasusPembunuhan
41 40 31 24 47 29 25
3. JumlahKejahatanSeksual
49 56 42 30 33 26 17
4. JumlahKasusPenganiayaan
161 254 285 309 271 399 829
5. JumlahKasusPencurian
492 555 692 528 602 666 2134
6. JumlahKasus Penipuan 414 572 620 577 573 623 676
7. JumlahKasusPemalsuanUang
8 8 18 3 5 7 1
8. Total
Jumlah TindakKriminal Selama1 Tahun
1533 2044 2277 1926 2120 2511 9918
t p : / / k a t i m
. p s .
o . i
5
8
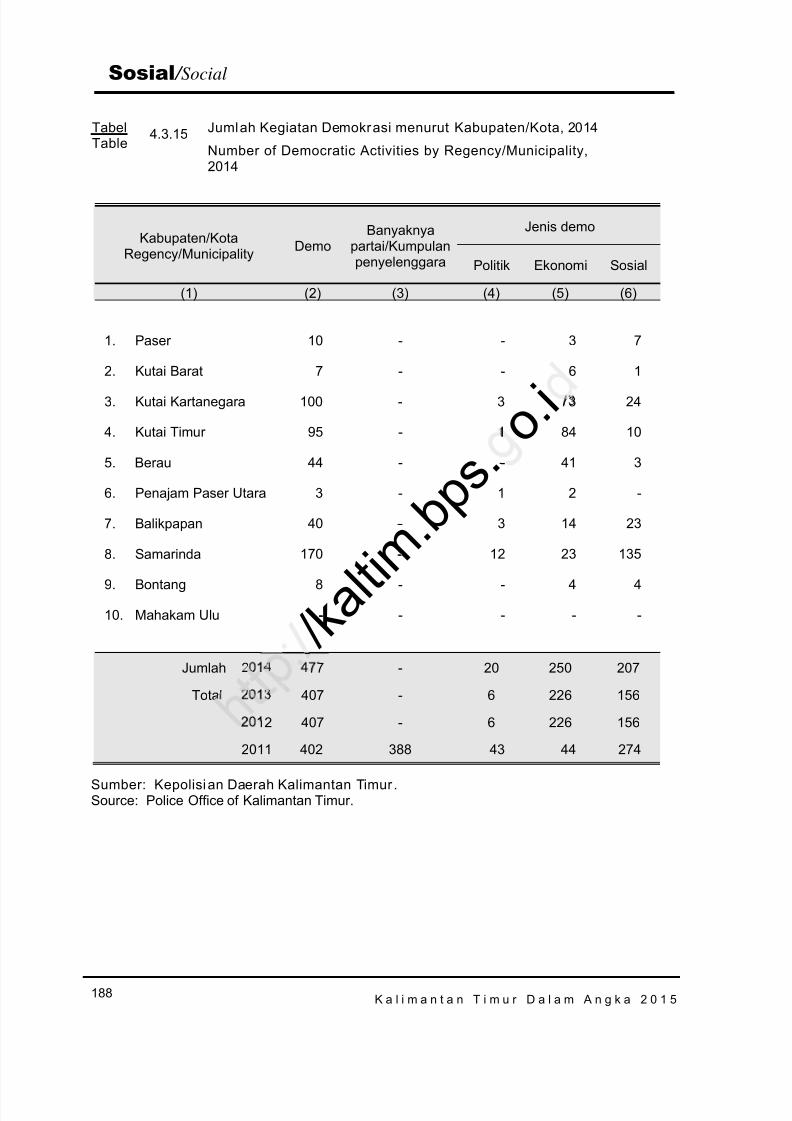
8/20/2019 Kalimantan Timur Dalam Angka Tahun 2015
http://slidepdf.com/reader/full/kalimantan-timur-dalam-angka-tahun-2015 254/623
K a l i m a n t a n T i m u r D a l a m A n g k a 2 0 1 5188
Sosial / Social
TabelTable
4.3.15 Jumlah Kegiatan Demokrasi menurut Kabupaten/Kota, 2014
Number of Democratic Activities by Regency/Municipality,2014
Kabupaten/KotaRegency/Municipality Demo
Banyaknyapartai/Kumpulanpenyelenggara
Jenis demo
Politik Ekonomi Sosial
(1) (2) (3) (4) (5) (6)
1. Paser 10 - - 3 7
2. Kutai Barat 7 - - 6 1
3. Kutai Kartanegara 100 - 3 73 24
4. Kutai Timur 95 - 1 84 10
5. Berau 44 - - 41 3
6. Penajam Paser Utara 3 - 1 2 -
7. Balikpapan 40 - 3 14 23
8. Samarinda 170 - 12 23 135
9. Bontang 8 - - 4 4
10. Mahakam Ulu - - - - -
Jumlah 2014 477 - 20 250 207
Total 2013 407 - 6 226 156
2012 407 - 6 226 156
2011 402 388 43 44 274
Sumber: Kepolisi an Daerah Kalimantan Timur .Source: Police Office of Kalimantan Timur.
/ k a l t i m . b p
s . o . i
1
-
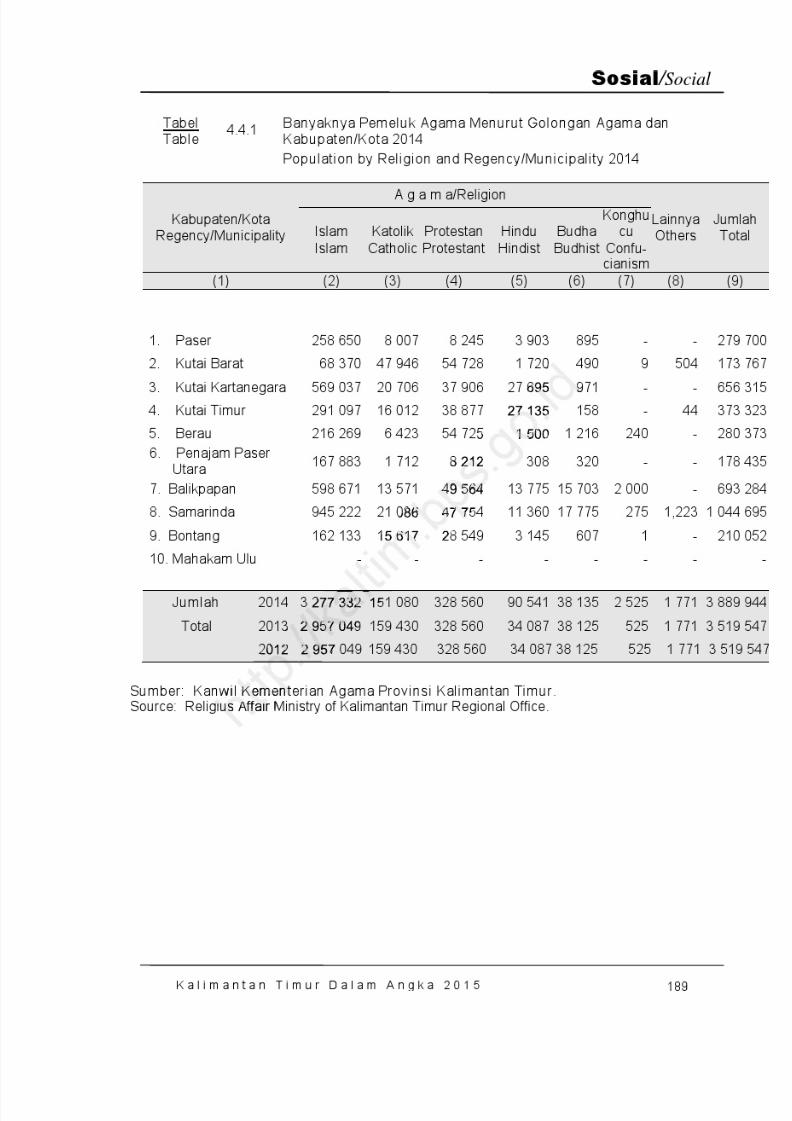
8/20/2019 Kalimantan Timur Dalam Angka Tahun 2015
http://slidepdf.com/reader/full/kalimantan-timur-dalam-angka-tahun-2015 255/623
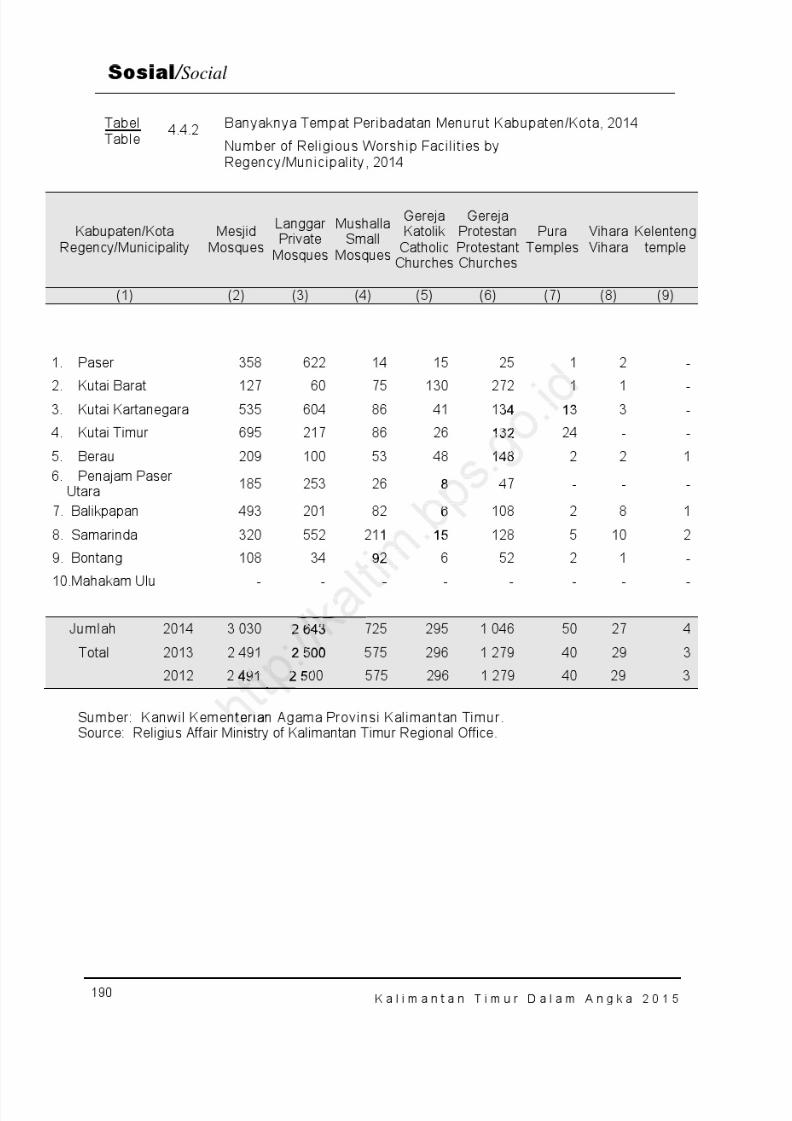
8/20/2019 Kalimantan Timur Dalam Angka Tahun 2015
http://slidepdf.com/reader/full/kalimantan-timur-dalam-angka-tahun-2015 256/623
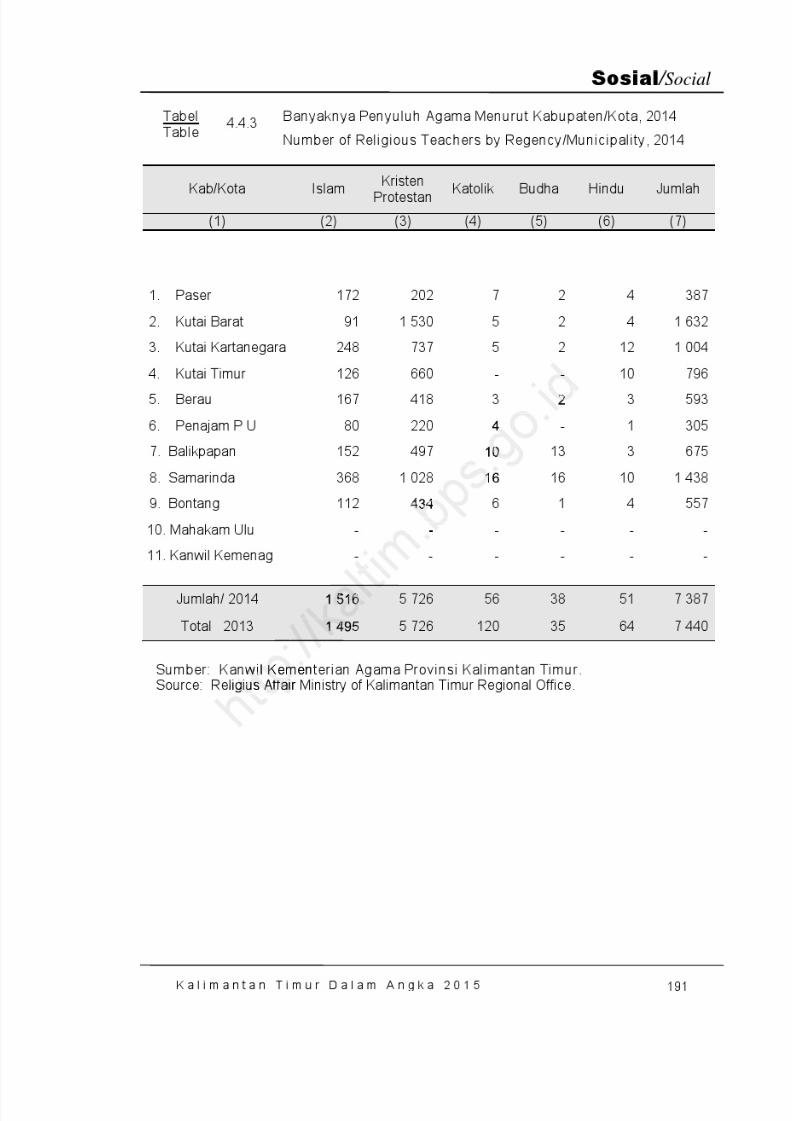
8/20/2019 Kalimantan Timur Dalam Angka Tahun 2015
http://slidepdf.com/reader/full/kalimantan-timur-dalam-angka-tahun-2015 257/623
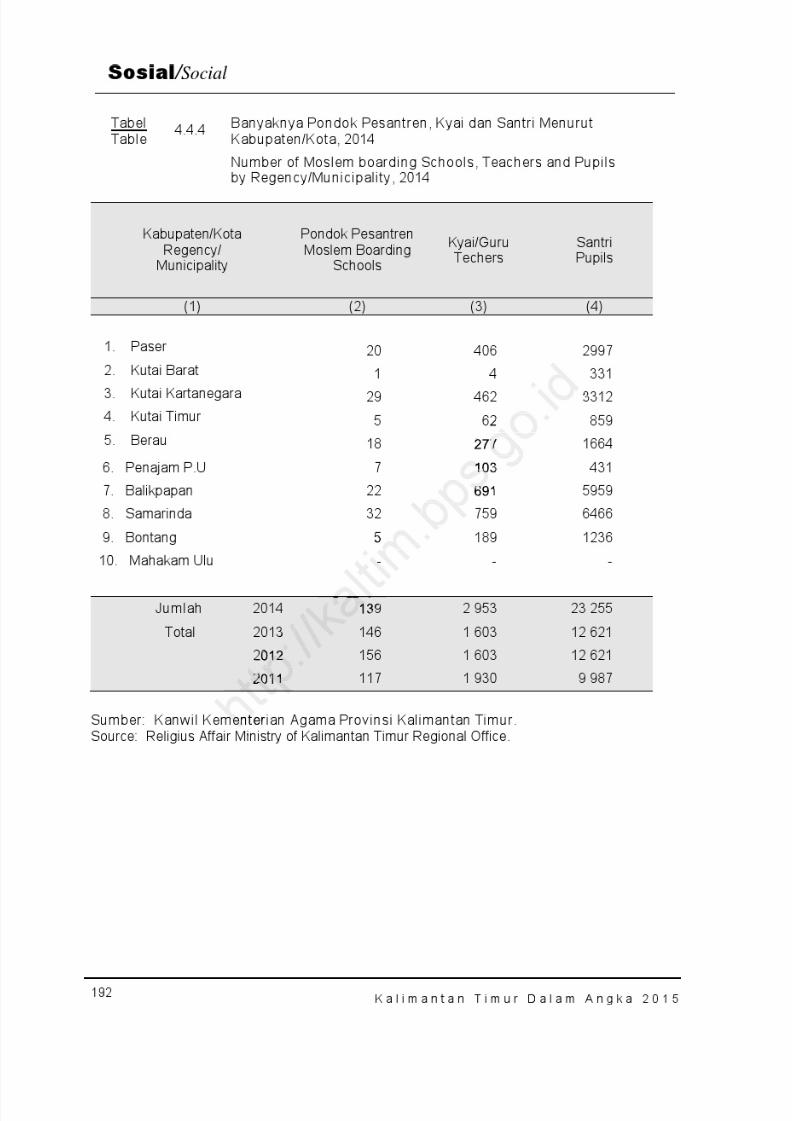
8/20/2019 Kalimantan Timur Dalam Angka Tahun 2015
http://slidepdf.com/reader/full/kalimantan-timur-dalam-angka-tahun-2015 258/623
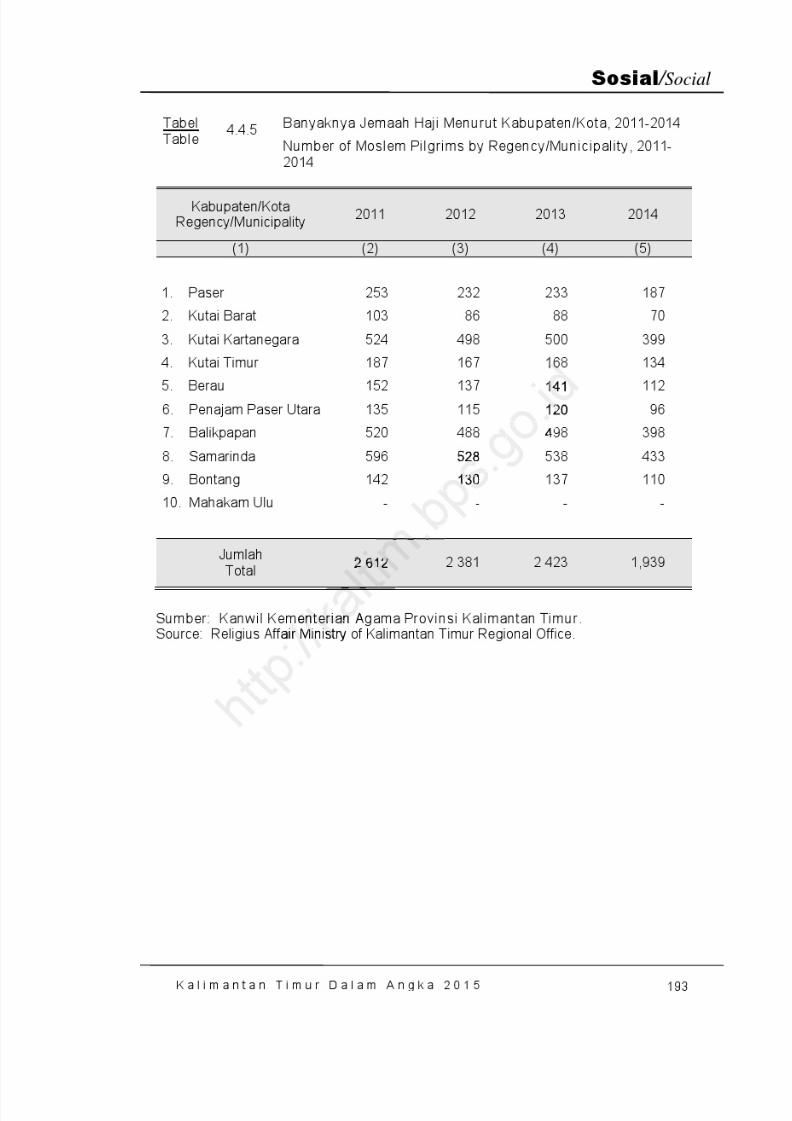
8/20/2019 Kalimantan Timur Dalam Angka Tahun 2015
http://slidepdf.com/reader/full/kalimantan-timur-dalam-angka-tahun-2015 259/623
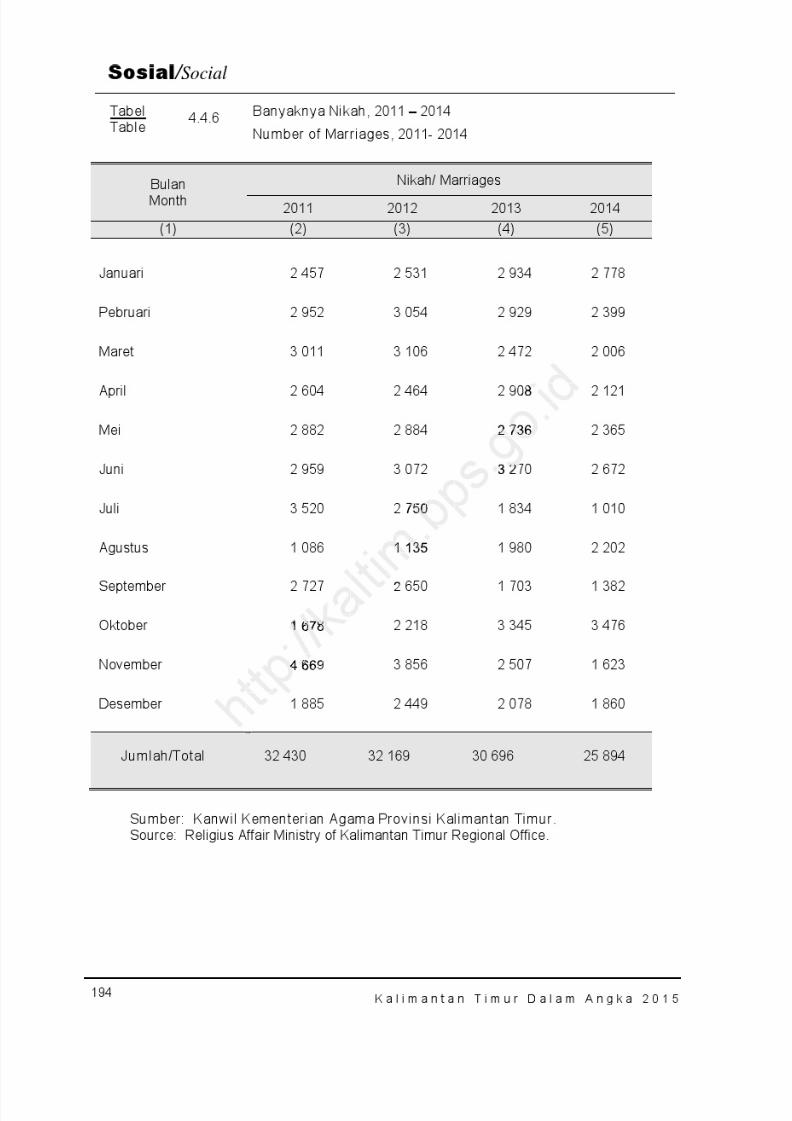
8/20/2019 Kalimantan Timur Dalam Angka Tahun 2015
http://slidepdf.com/reader/full/kalimantan-timur-dalam-angka-tahun-2015 260/623
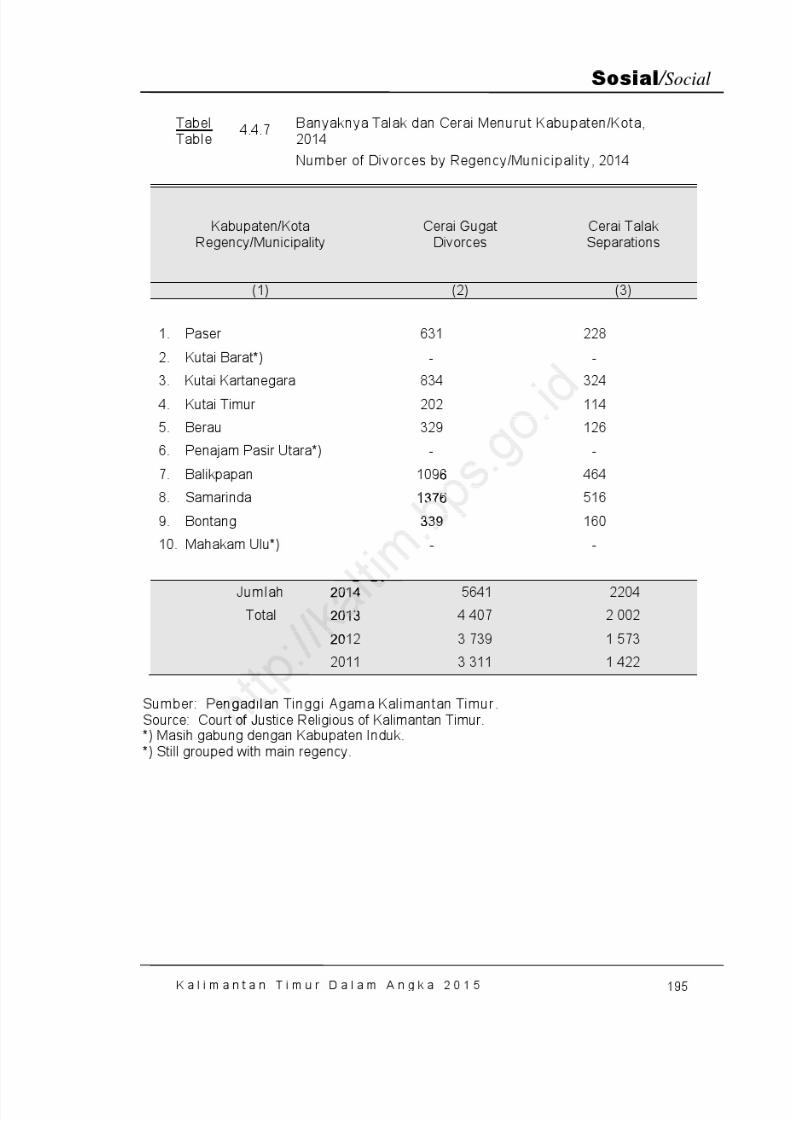
8/20/2019 Kalimantan Timur Dalam Angka Tahun 2015
http://slidepdf.com/reader/full/kalimantan-timur-dalam-angka-tahun-2015 261/623
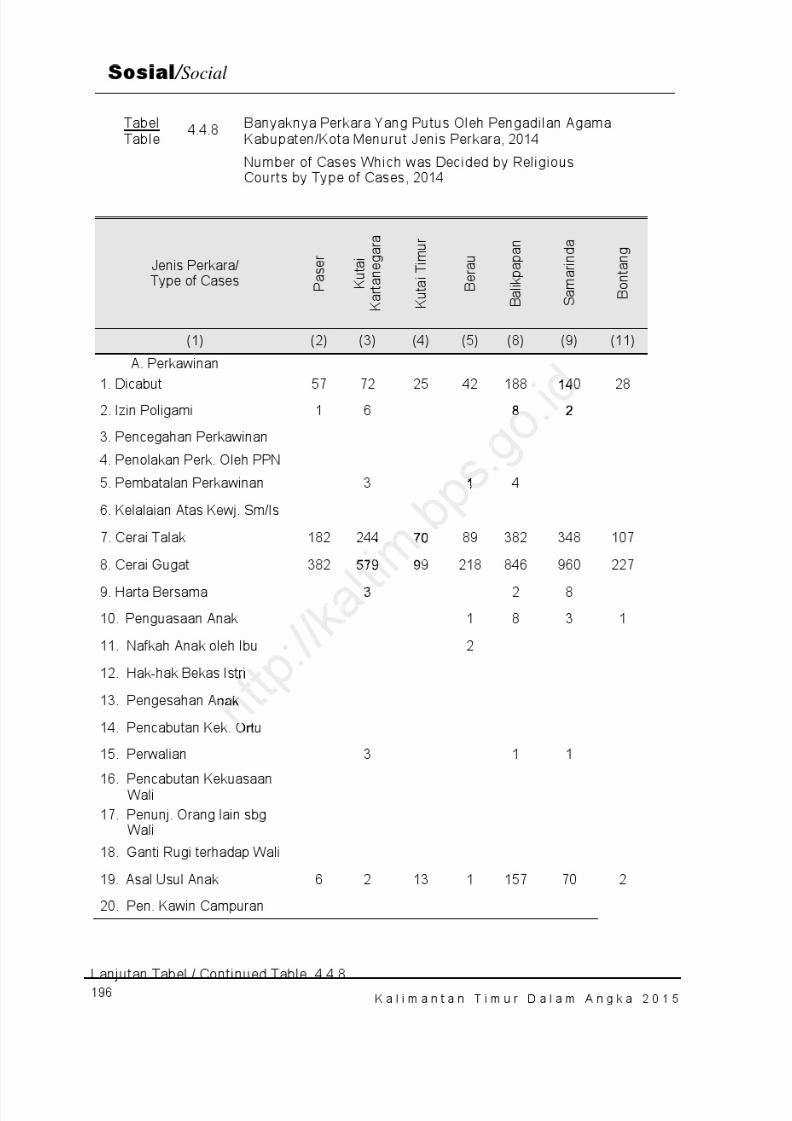
8/20/2019 Kalimantan Timur Dalam Angka Tahun 2015
http://slidepdf.com/reader/full/kalimantan-timur-dalam-angka-tahun-2015 262/623
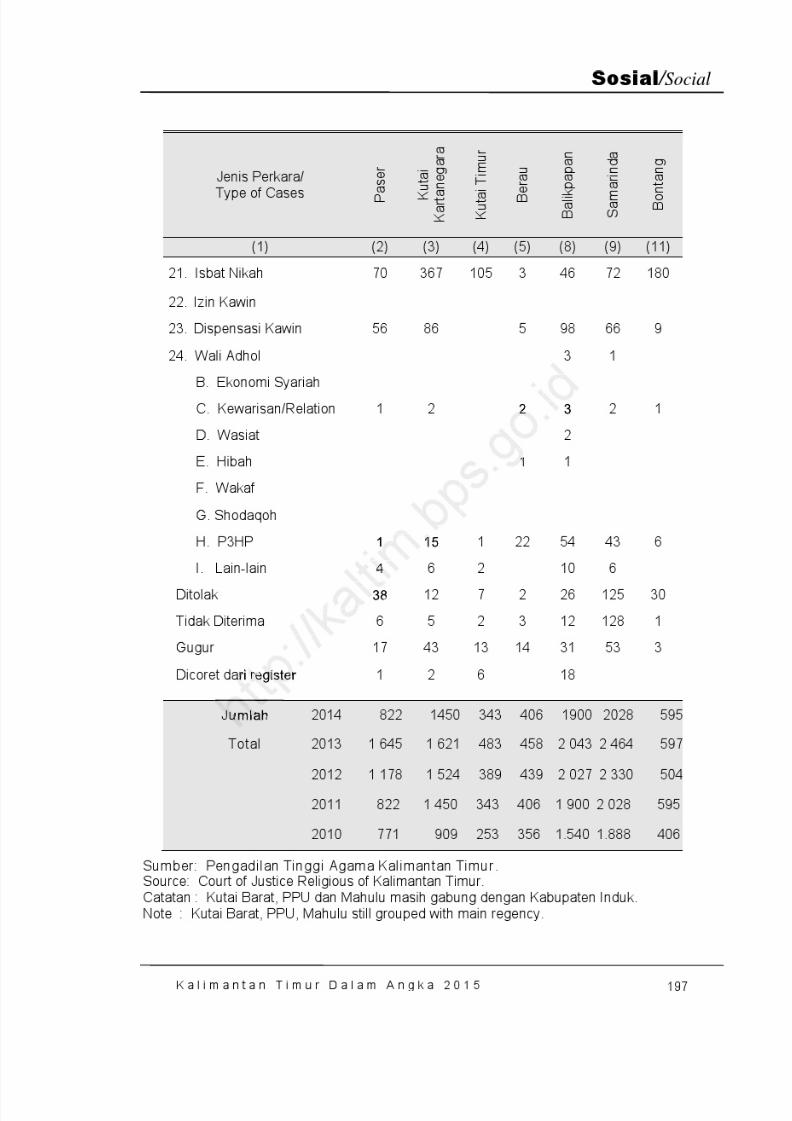
8/20/2019 Kalimantan Timur Dalam Angka Tahun 2015
http://slidepdf.com/reader/full/kalimantan-timur-dalam-angka-tahun-2015 263/623
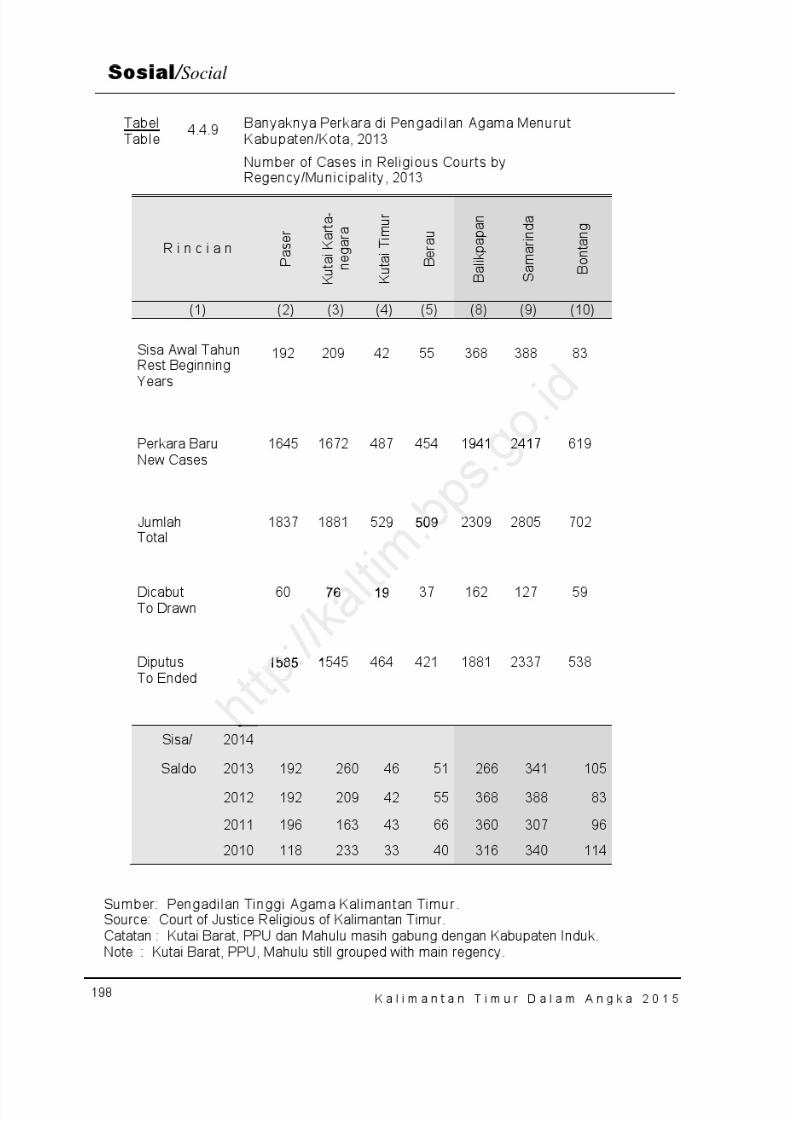
8/20/2019 Kalimantan Timur Dalam Angka Tahun 2015
http://slidepdf.com/reader/full/kalimantan-timur-dalam-angka-tahun-2015 264/623
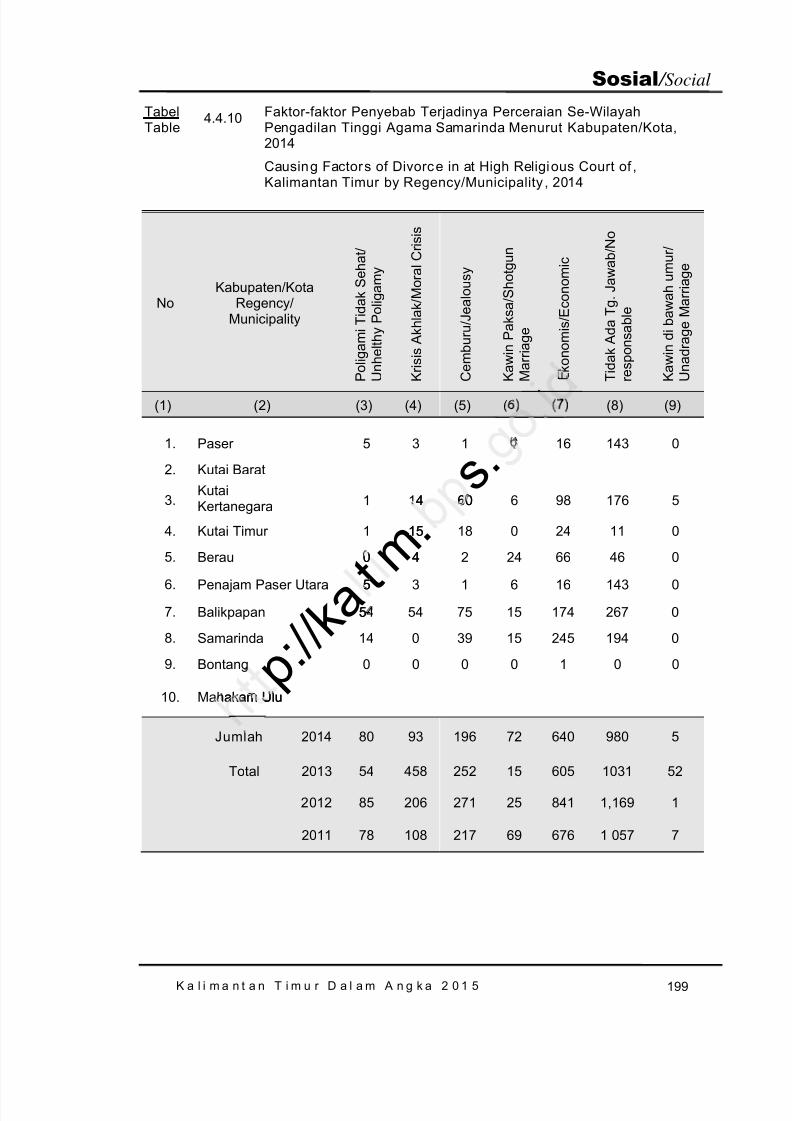
8/20/2019 Kalimantan Timur Dalam Angka Tahun 2015
http://slidepdf.com/reader/full/kalimantan-timur-dalam-angka-tahun-2015 265/623
K a l i m a n t a n T i m u r D a l a m A n g k a 2 0 1 5 199
Sosial / Social
TabelTable
4.4.10 Faktor-faktor Penyebab Terjadinya Perceraian Se-WilayahPengadilan Tinggi Agama Samarinda Menurut Kabupaten/Kota,2014
Causing Factors of Divorce in at High Religious Court of ,Kalimantan Timur by Regency/Municipality , 2014
NoKabupaten/Kota
Regency/Municipality
P o
l i g a m
i T i d a
k S e
h a
t /
U n
h e
l t h y
P o
l i g a m y
K r i s i s
A k h l a k / M o r a
l C r i s i s
C e m
b u r u
/ J e a
l o u s y
K a w
i n P a
k s a / S h o
t g u n
M a r r i a g e
E k o n o m
i s / E c o n o m
i c
T i d a
k A d a
T g .
J a w a
b / N o
r e s p o n s a
b l e
K a w
i n d i b a w a
h u m u r /
U n a
d r a g e
M a r r i a g e
(1) (2) (3) (4) (5) (6) (7) (8) (9)
1. Paser 5 3 1 6 16 143 0
2. Kutai Barat
3.KutaiKertanegara 1 14 60 6 98 176 5
4. Kutai Timur 1 15 18 0 24 11 0
5. Berau 0 4 2 24 66 46 0
6. Penajam Paser Utara 5 3 1 6 16 143 0
7. Balikpapan 54 54 75 15 174 267 0
8. Samarinda 14 0 39 15 245 194 0
9. Bontang 0 0 0 0 1 0 0
10. Mahakam Ulu
Jumlah 2014 80 93 196 72 640 980 5
Total 2013 54 458 252 15 605 1031 52
2012 85 206 271 25 841 1,169 1
2011 78 108 217 69 676 1 057 7
p : / / k a t m
. s .
4 60
15
0 4
5
5
akam Ulu
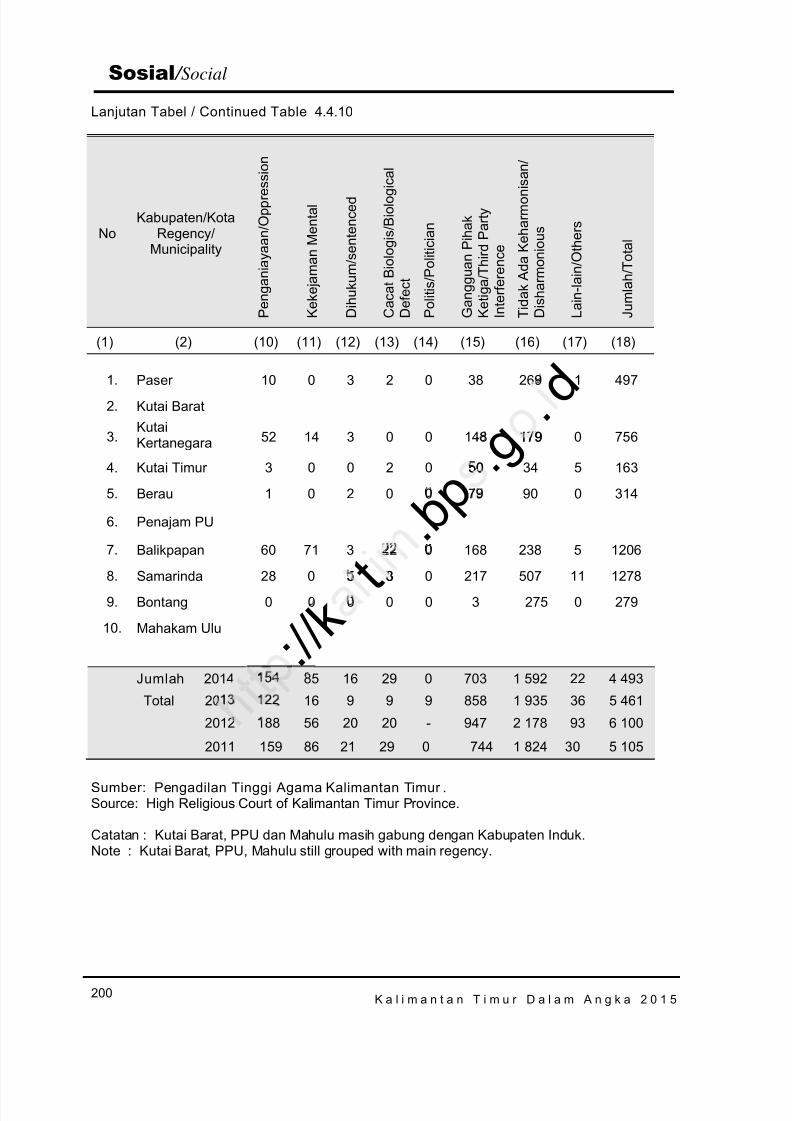
8/20/2019 Kalimantan Timur Dalam Angka Tahun 2015
http://slidepdf.com/reader/full/kalimantan-timur-dalam-angka-tahun-2015 266/623
K a l i m a n t a n T i m u r D a l a m A n g k a 2 0 1 5200
Sosial / Social
Lanjutan Tabel / Continued Table 4.4.10
NoKabupaten/Kota
Regency/Municipality
P e n g a n
i a y a a n
/ O p p r e s s i o n
K e
k e j a m a n
M e n
t a l
D i h u
k u m
/ s e n
t e n c e
d
C a c a
t B i o l o g
i s / B i o l o g i c a l
D e
f e c t
P o
l i t i s / P o
l i t i c i a n
G a n g g u a n
P i h a
k
K e
t i g a
/ T h i r d P a r t y
I n t e r f e r e n c e
T i d a
k A d a
K e
h a r m o n
i s a n
/
D i s h a r m o n
i o u s
L a
i n - l a
i n / O t h e r s
J u m
l a h / T o
t a l
(1) (2) (10) (11) (12) (13) (14) (15) (16) (17) (18)
1. Paser 10 0 3 2 0 38 269 1 4972. Kutai Barat
3.KutaiKertanegara 52 14 3 0 0 148 179 0 756
4. Kutai Timur 3 0 0 2 0 50 34 5 163
5. Berau 1 0 2 0 0 79 90 0 314
6. Penajam PU
7. Balikpapan 60 71 3 22 0 168 238 5 1206
8. Samarinda 28 0 5 3 0 217 507 11 12789. Bontang 0 0 0 0 0 3 275 0 279
10. Mahakam Ulu
Jumlah 2014 154 85 16 29 0 703 1 592 22 4 493
Total 2013 122 16 9 9 9 858 1 935 36 5 461
2012 188 56 20 20 - 947 2 178 93 6 100
2011 159 86 21 29 0 744 1 824 30 5 105
Sumber: Pengadilan Tinggi Agama Kalimantan Timur .Source: High Religious Court of Kalimantan Timur Province.
Catatan : Kutai Barat, PPU dan Mahulu masih gabung dengan Kabupaten Induk.Note : Kutai Barat, PPU, Mahulu still grouped with main regency.
: / / k t . b p
. g . d
179
50
5 3
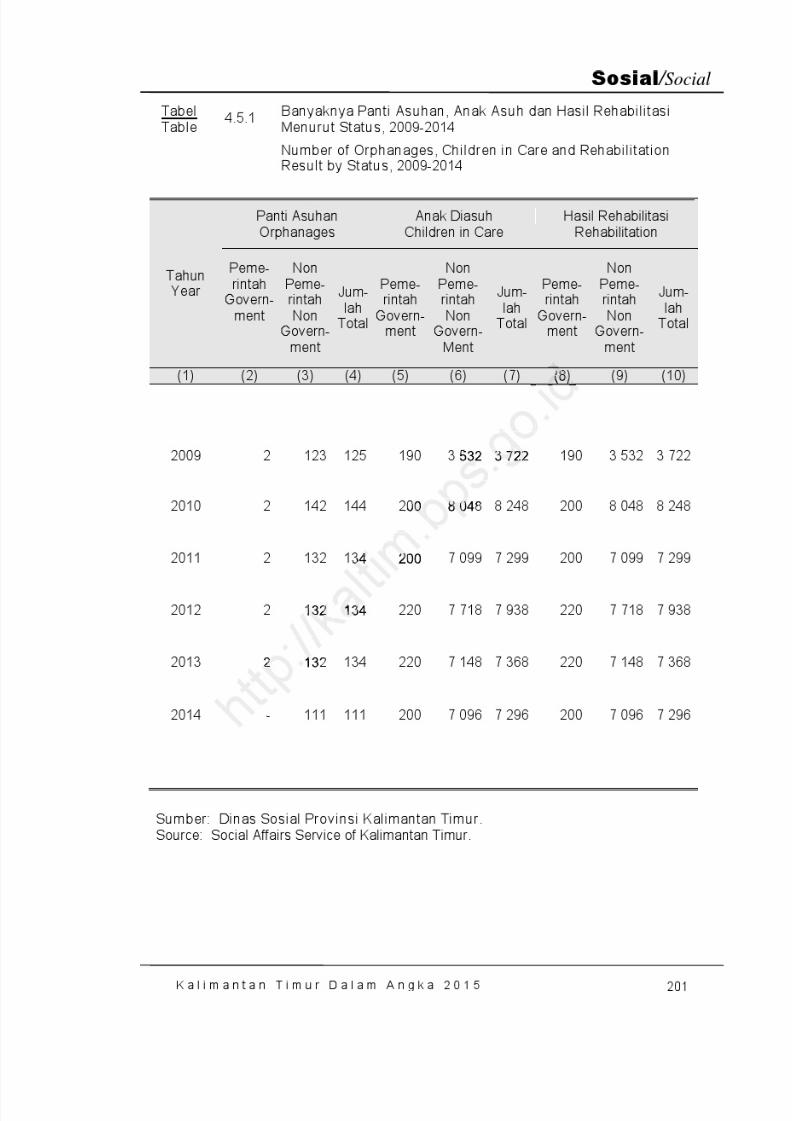
8/20/2019 Kalimantan Timur Dalam Angka Tahun 2015
http://slidepdf.com/reader/full/kalimantan-timur-dalam-angka-tahun-2015 267/623
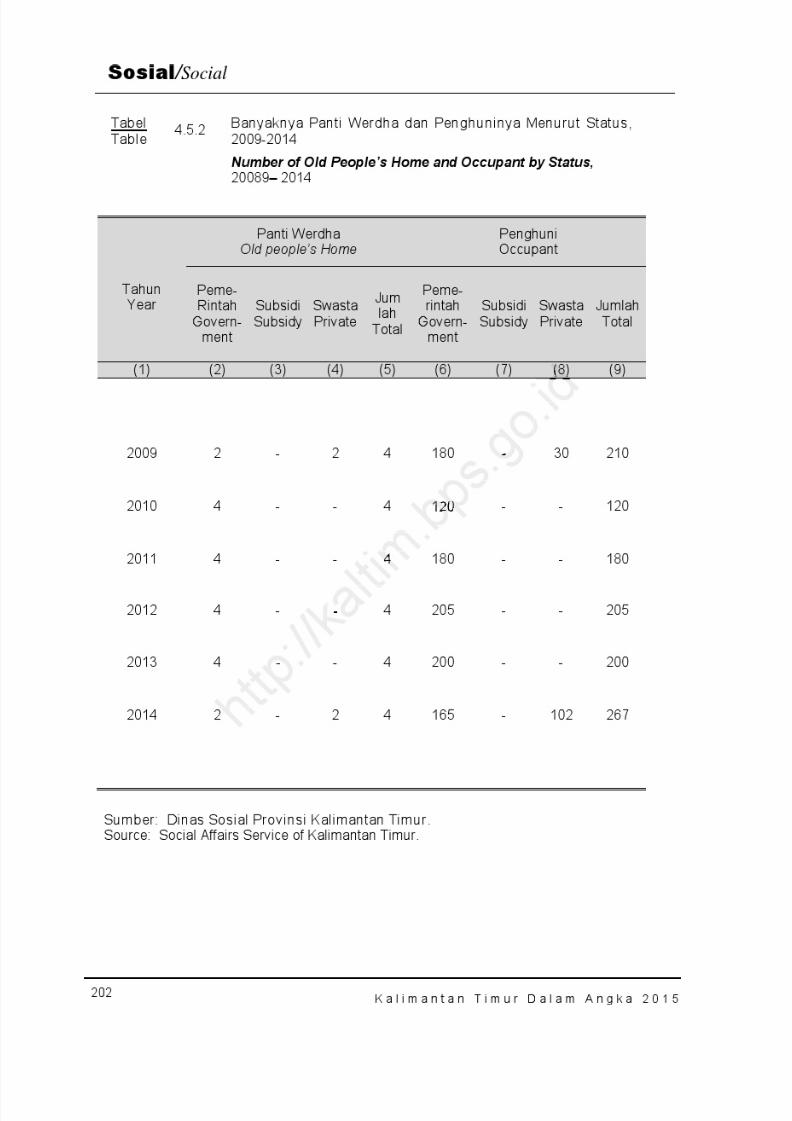
8/20/2019 Kalimantan Timur Dalam Angka Tahun 2015
http://slidepdf.com/reader/full/kalimantan-timur-dalam-angka-tahun-2015 268/623

8/20/2019 Kalimantan Timur Dalam Angka Tahun 2015
http://slidepdf.com/reader/full/kalimantan-timur-dalam-angka-tahun-2015 269/623
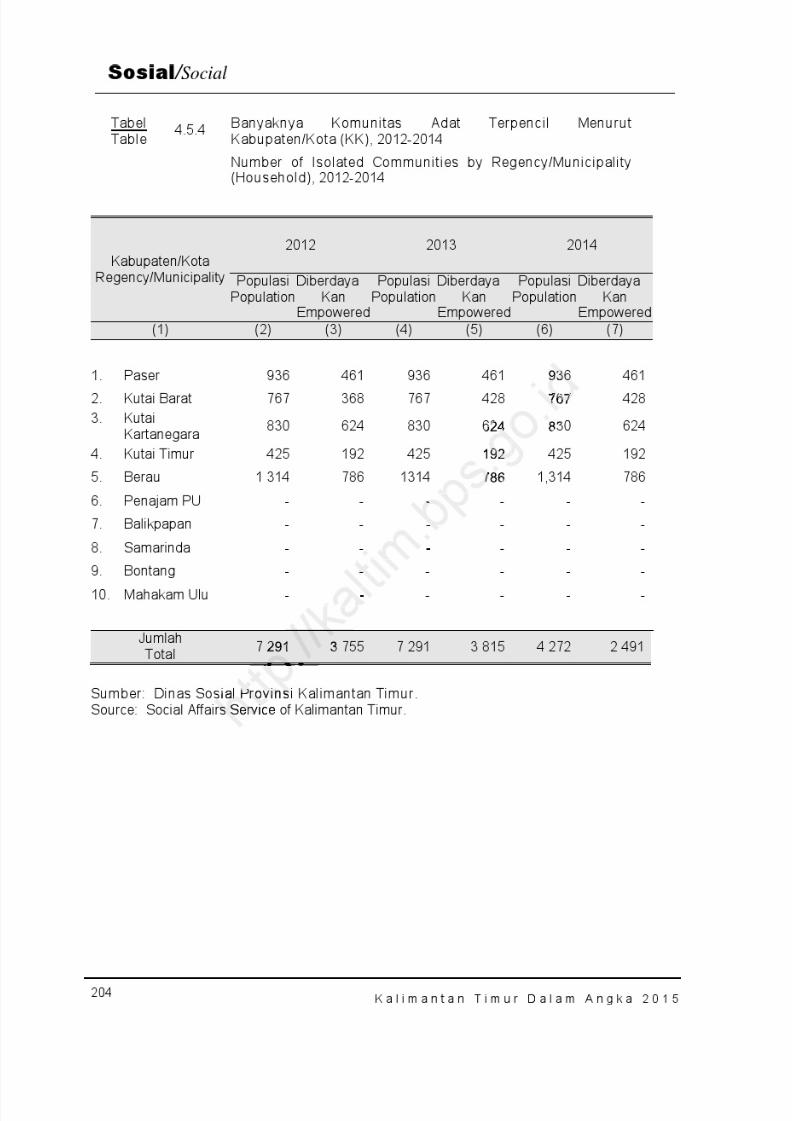
8/20/2019 Kalimantan Timur Dalam Angka Tahun 2015
http://slidepdf.com/reader/full/kalimantan-timur-dalam-angka-tahun-2015 270/623
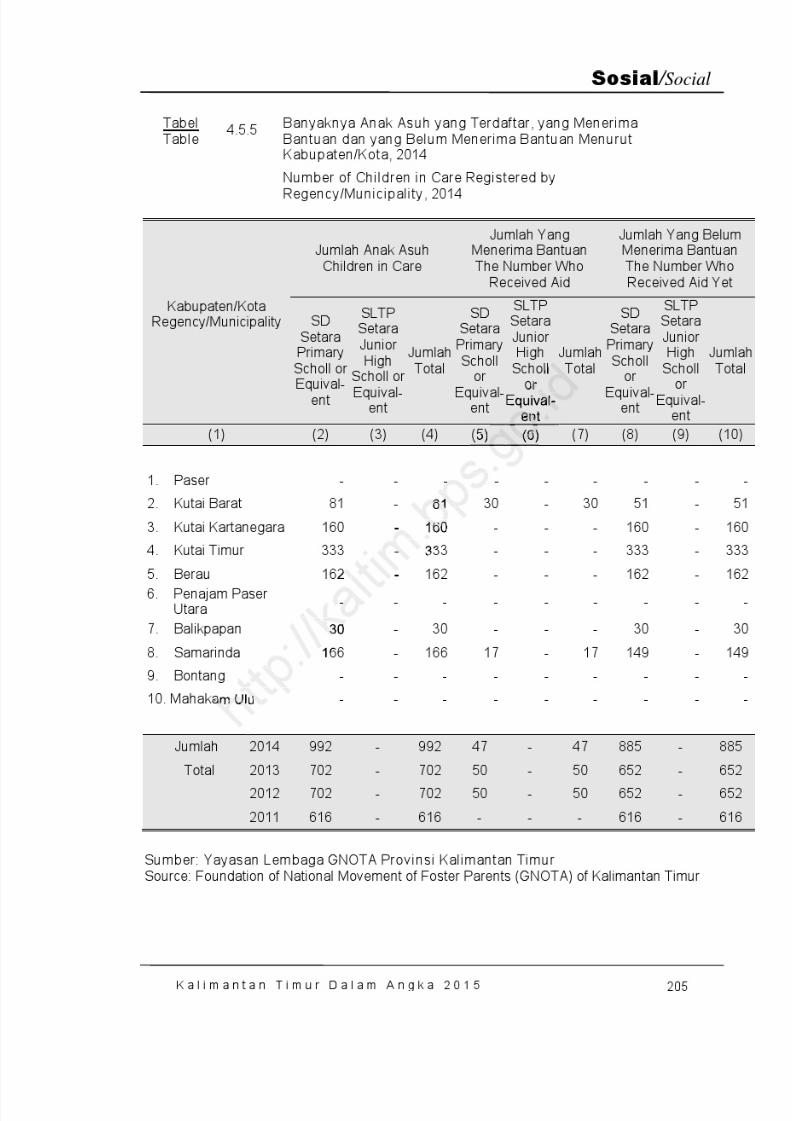
8/20/2019 Kalimantan Timur Dalam Angka Tahun 2015
http://slidepdf.com/reader/full/kalimantan-timur-dalam-angka-tahun-2015 271/623
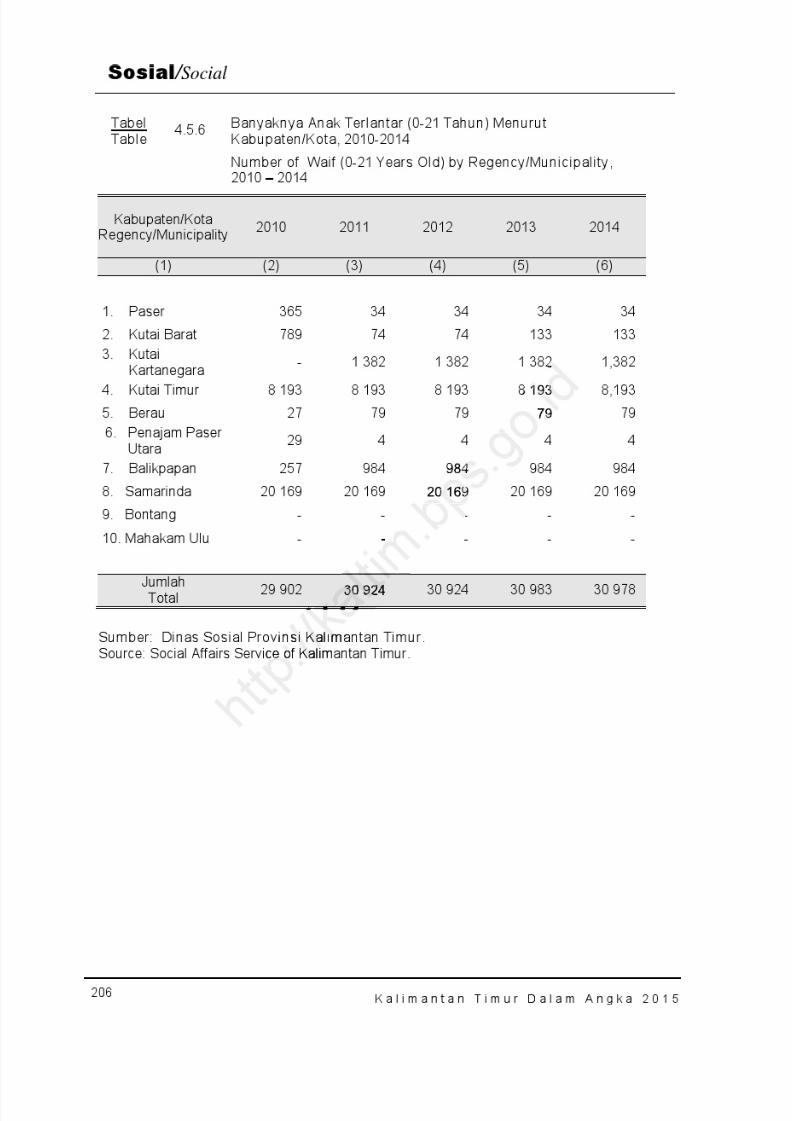
8/20/2019 Kalimantan Timur Dalam Angka Tahun 2015
http://slidepdf.com/reader/full/kalimantan-timur-dalam-angka-tahun-2015 272/623
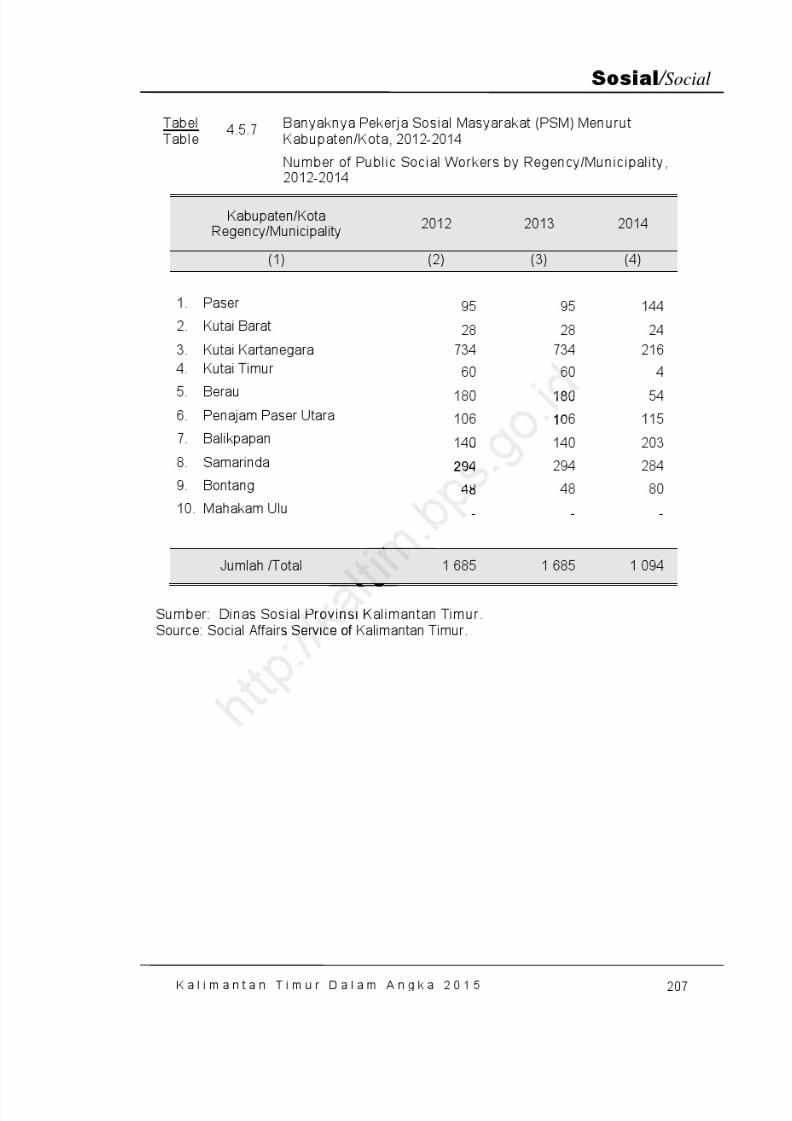
8/20/2019 Kalimantan Timur Dalam Angka Tahun 2015
http://slidepdf.com/reader/full/kalimantan-timur-dalam-angka-tahun-2015 273/623
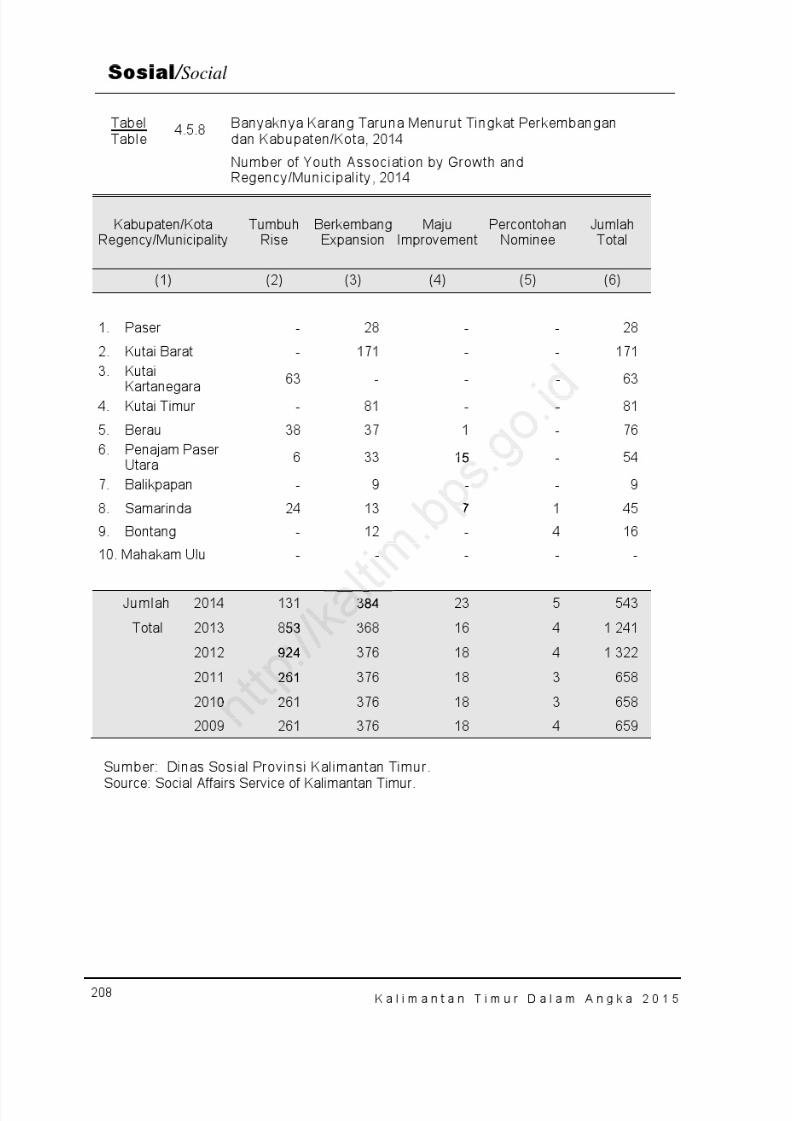
8/20/2019 Kalimantan Timur Dalam Angka Tahun 2015
http://slidepdf.com/reader/full/kalimantan-timur-dalam-angka-tahun-2015 274/623
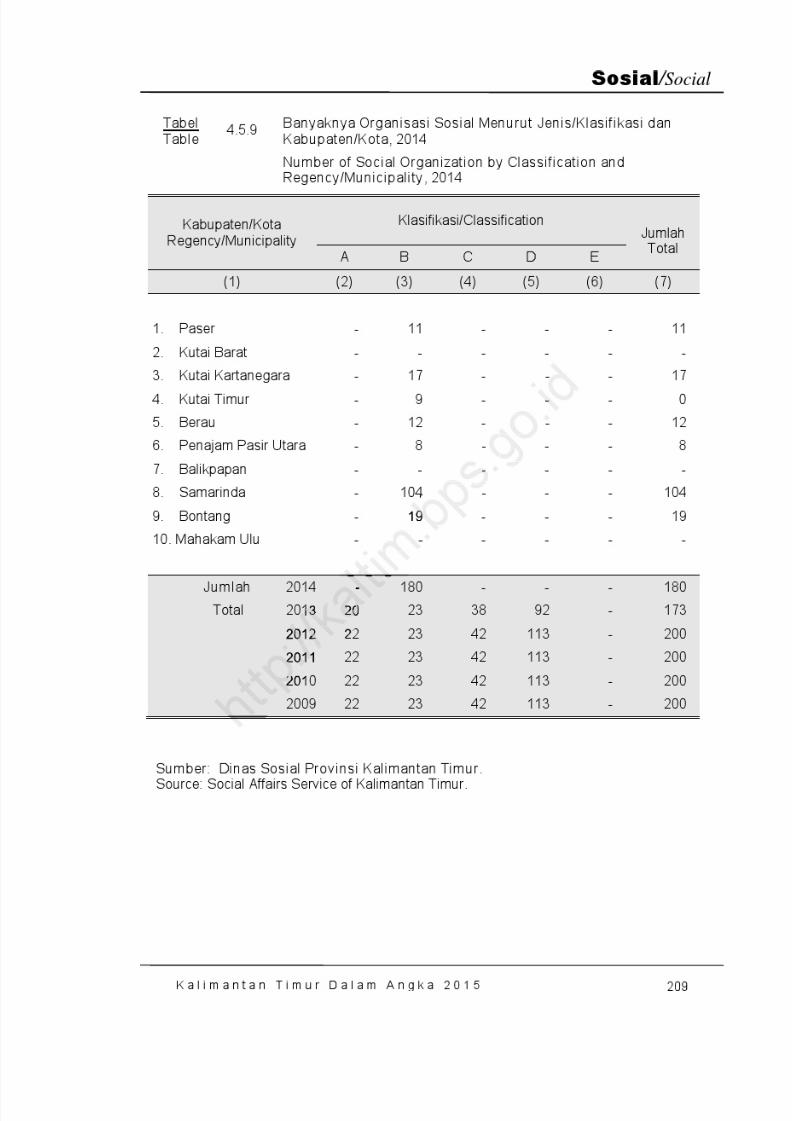
8/20/2019 Kalimantan Timur Dalam Angka Tahun 2015
http://slidepdf.com/reader/full/kalimantan-timur-dalam-angka-tahun-2015 275/623

8/20/2019 Kalimantan Timur Dalam Angka Tahun 2015
http://slidepdf.com/reader/full/kalimantan-timur-dalam-angka-tahun-2015 276/623
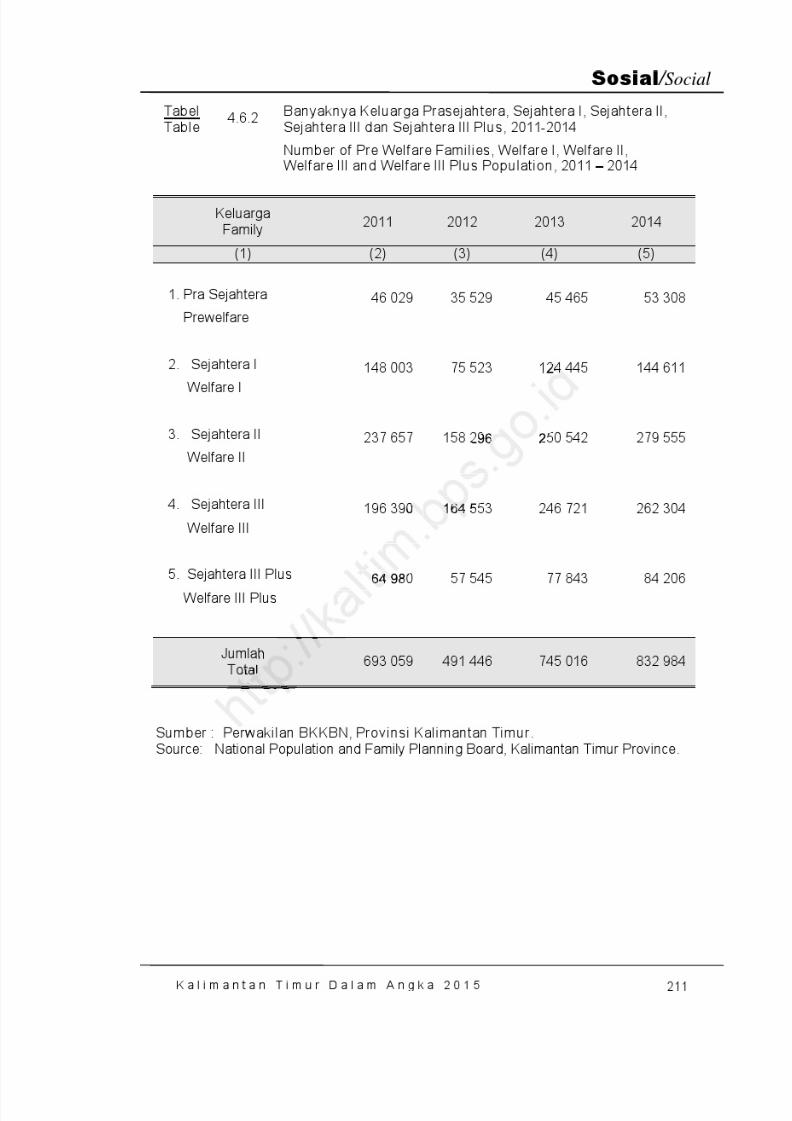
8/20/2019 Kalimantan Timur Dalam Angka Tahun 2015
http://slidepdf.com/reader/full/kalimantan-timur-dalam-angka-tahun-2015 277/623
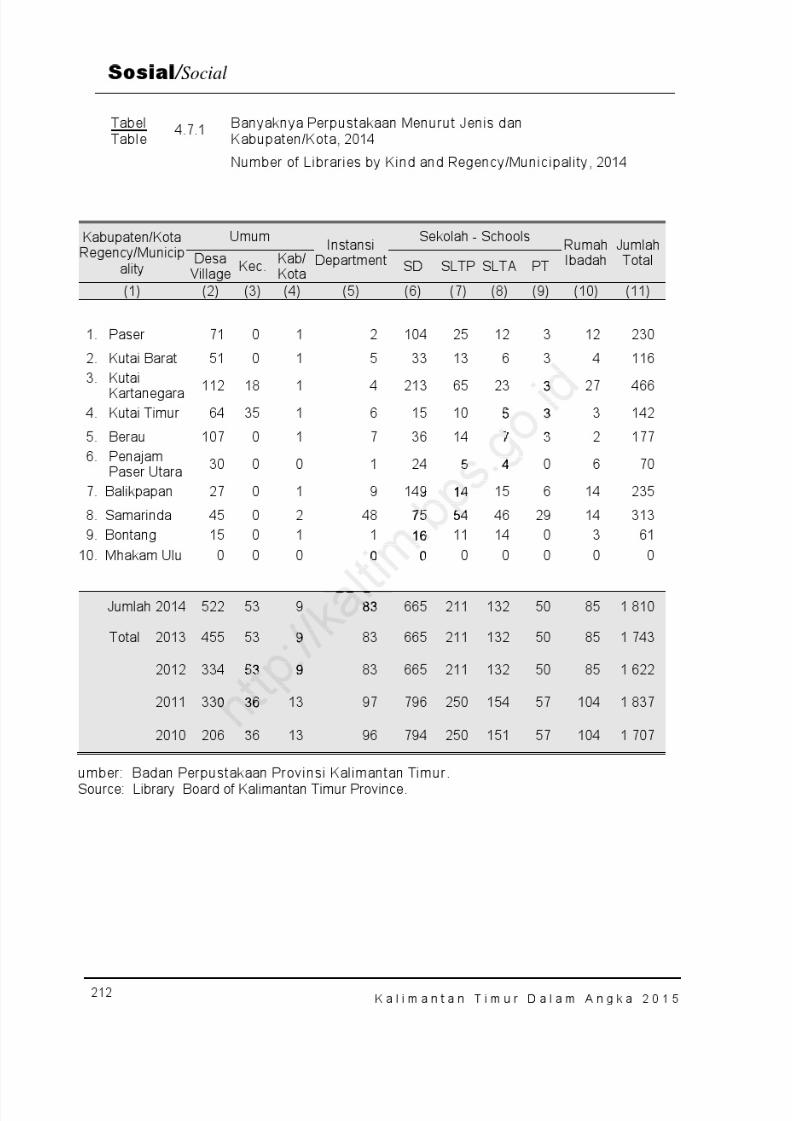
8/20/2019 Kalimantan Timur Dalam Angka Tahun 2015
http://slidepdf.com/reader/full/kalimantan-timur-dalam-angka-tahun-2015 278/623
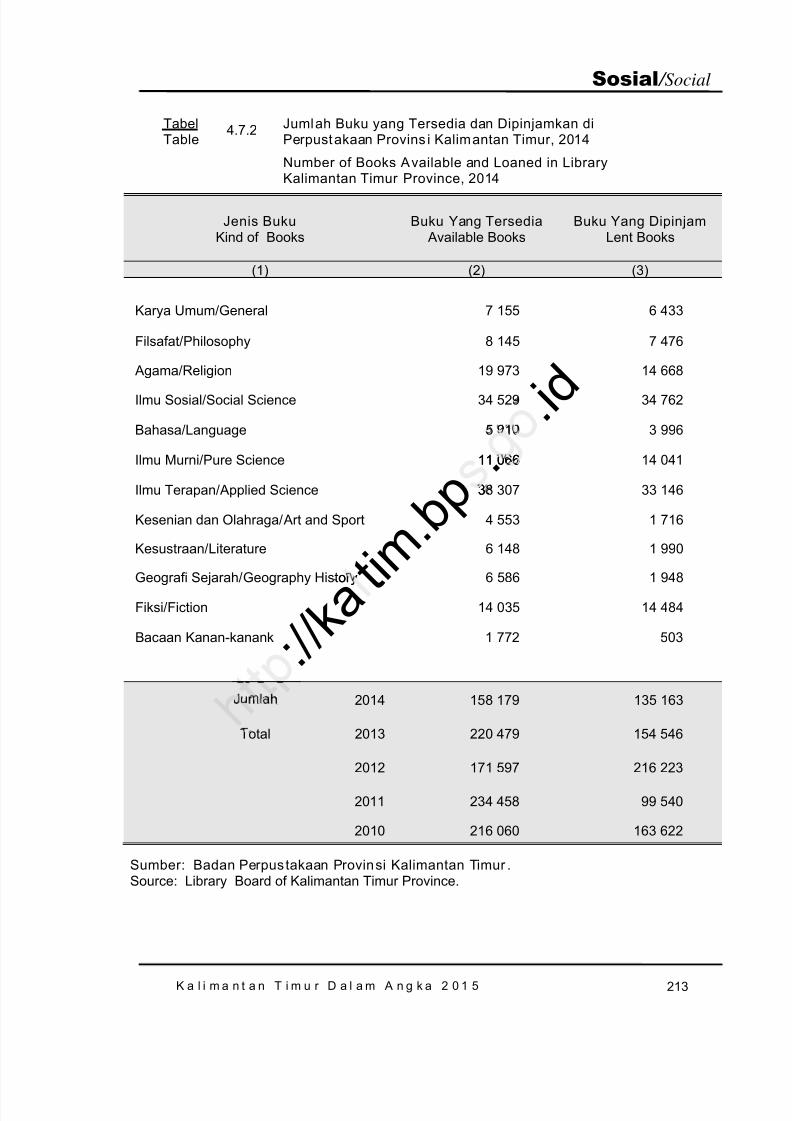
8/20/2019 Kalimantan Timur Dalam Angka Tahun 2015
http://slidepdf.com/reader/full/kalimantan-timur-dalam-angka-tahun-2015 279/623
K a l i m a n t a n T i m u r D a l a m A n g k a 2 0 1 5 213
Sosial / Social
Jenis BukuKind of Books
Buku Yang Tersedia Available Books
Buku Yang DipinjamLent Books
(1) (2) (3)
Karya Umum/ General 7 155 6 433
Filsafat/ Philosophy 8 145 7 476
Agama/ Religion 19 973 14 668
Ilmu Sosial/ Social Science 34 529 34 762
Bahasa/ Language 5 910 3 996
Ilmu Murni/Pure Science 11 066 14 041
Ilmu Terapan/ Applied Science 38 307 33 146
Kesenian dan Olahraga/ Art and Sport 4 553 1 716
Kesustraan/ Literature 6 148 1 990
Geografi Sejarah/ Geography History 6 586 1 948
Fiksi/Fiction 14 035 14 484
Bacaan Kanan-kanank 1 772 503
Jumlah 2014 158 179 135 163
Total 2013 220 479 154 546
2012 171 597 216 223
2011 234 458 99 540
2010 216 060 163 622
Sumber: Badan Perpus takaan Provinsi Kalimantan Timur .Source: Library Board of Kalimantan Timur Province.
TabelTable
4.7.2 Jumlah Buku yang Tersedia dan Dipinjamkan diPerpust akaan Provins i Kalimantan Timur, 2014
Number of Books Available and Loaned in LibraryKalimantan Timur Province, 2014
: / / k a t i m . b p
. . i d
11 066
3
ory
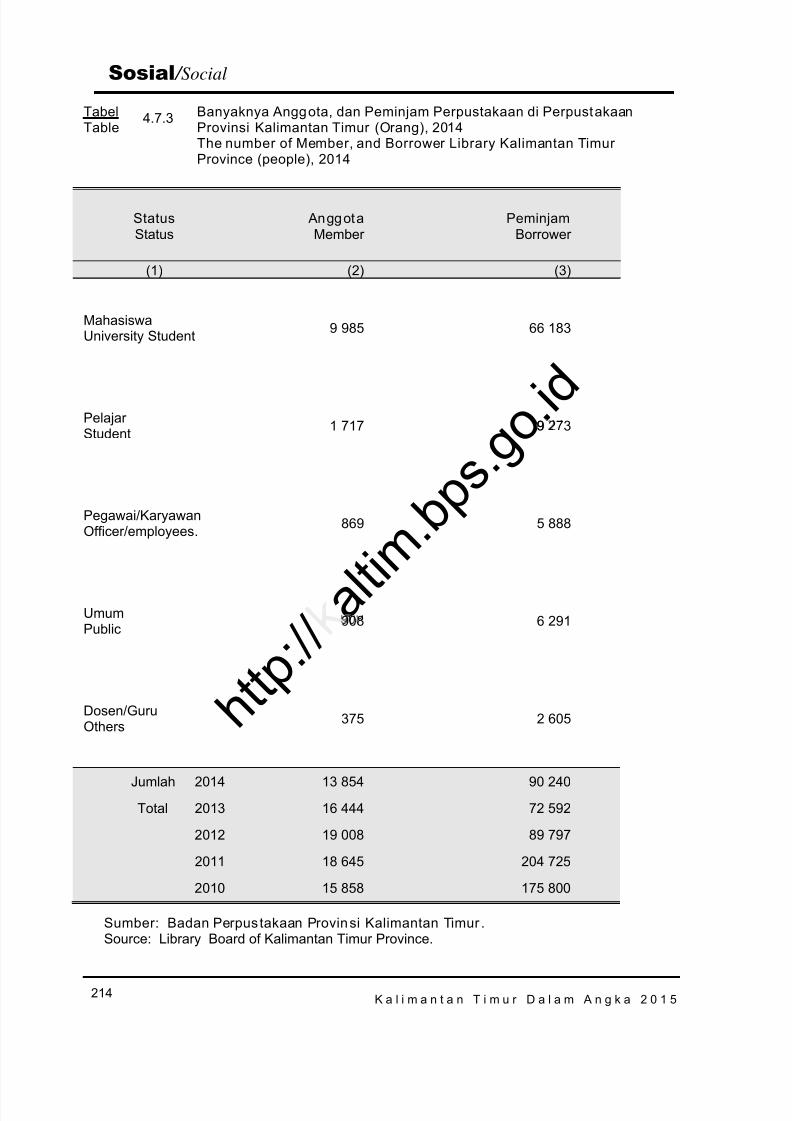
8/20/2019 Kalimantan Timur Dalam Angka Tahun 2015
http://slidepdf.com/reader/full/kalimantan-timur-dalam-angka-tahun-2015 280/623
K a l i m a n t a n T i m u r D a l a m A n g k a 2 0 1 5214
Sosial / Social
TabelTable
4.7.3 Banyaknya Anggota, dan Peminjam Perpustakaan di PerpustakaanProvinsi Kalimantan Timur (Orang), 2014The number of Member, and Borrower Library Kalimantan TimurProvince (people), 2014
StatusStatus
AnggotaMember
PeminjamBorrower
(1) (2) (3)
MahasiswaUniversity Student 9 985 66 183
PelajarStudent 1 717 9 273
Pegawai/KaryawanOfficer/employees . 869 5 888
UmumPublic 908 6 291
Dosen/GuruOthers 375 2 605
Jumlah 2014 13 854 90 240
Total 2013 16 444 72 592
2012 19 008 89 797
2011 18 645 204 725
2010 15 858 175 800
Sumber: Badan Perpus takaan Provin si Kalimantan Timur .Source: Library Board of Kalimantan Timur Province.
h t t p : / /
a l t i m . b p
s . g o . i d9
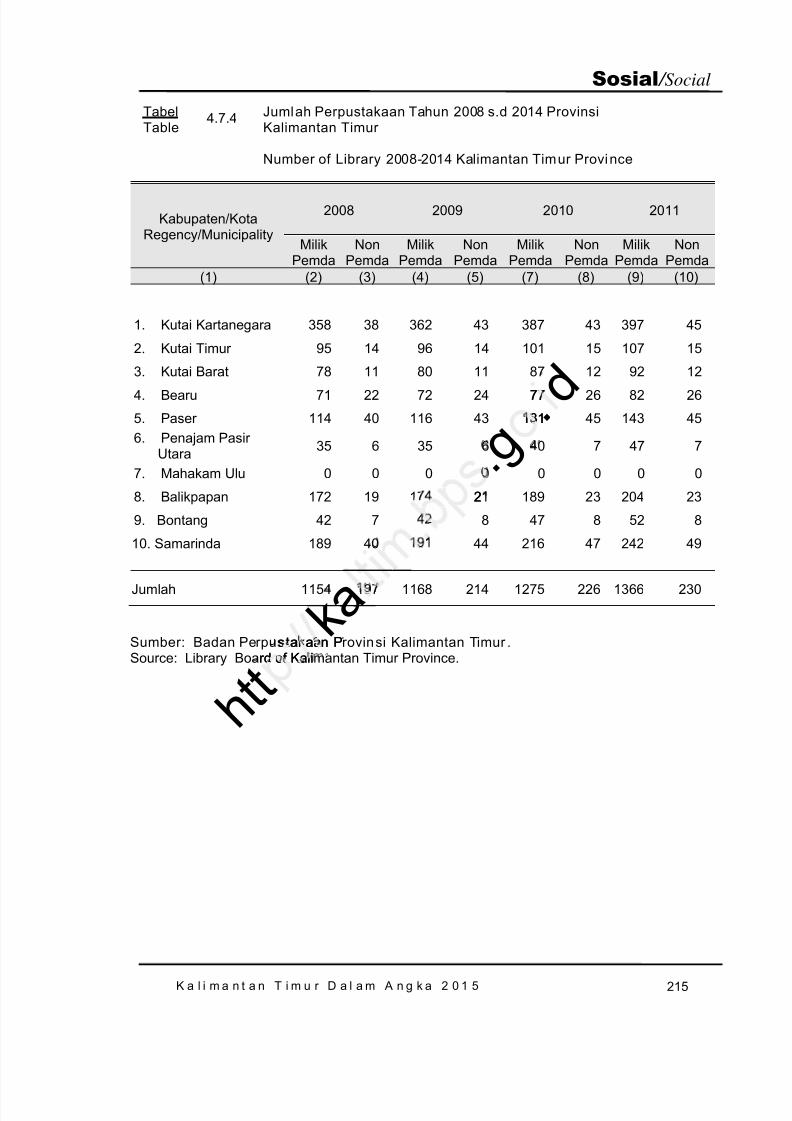
8/20/2019 Kalimantan Timur Dalam Angka Tahun 2015
http://slidepdf.com/reader/full/kalimantan-timur-dalam-angka-tahun-2015 281/623
K a l i m a n t a n T i m u r D a l a m A n g k a 2 0 1 5 215
Sosial / Social
TabelTable
4.7.4 Jumlah Perpustakaan Tahun 2008 s.d 2014 ProvinsiKalimantan Timur
Number of Library 2008-2014 Kalimantan Timur Province
Kabupaten/KotaRegency/Municipality
2008 2009 2010 2011
MilikPemda
NonPemda
MilikPemda
NonPemda
MilikPemda
NonPemda
MilikPemda
NonPemda
(1) (2) (3) (4) (5) (7) (8) (9) (10)
1. Kutai Kartanegara 358 38 362 43 387 43 397 45
2. Kutai Timur 95 14 96 14 101 15 107 15
3. Kutai Barat 78 11 80 11 87 12 92 12
4. Bearu 71 22 72 24 77 26 82 26
5. Paser 114 40 116 43 131 45 143 456. Penajam Pasir
Utara 35 6 35 6 40 7 47 7
7. Mahakam Ulu 0 0 0 0 0 0 0 0
8. Balikpapan 172 19 174 21 189 23 204 23
9. Bontang 42 7 42 8 47 8 52 8
10. Samarinda 189 40 191 44 216 47 242 49
Jumlah 1154 197 1168 214 1275 226 1366 230
Sumber: Badan Perpus takaan Provinsi Kalimantan Timur .Source: Library Board of Kalimantan Timur Province.
k a
. g . d77
131
2
h t t stakaan P
rd of Kali
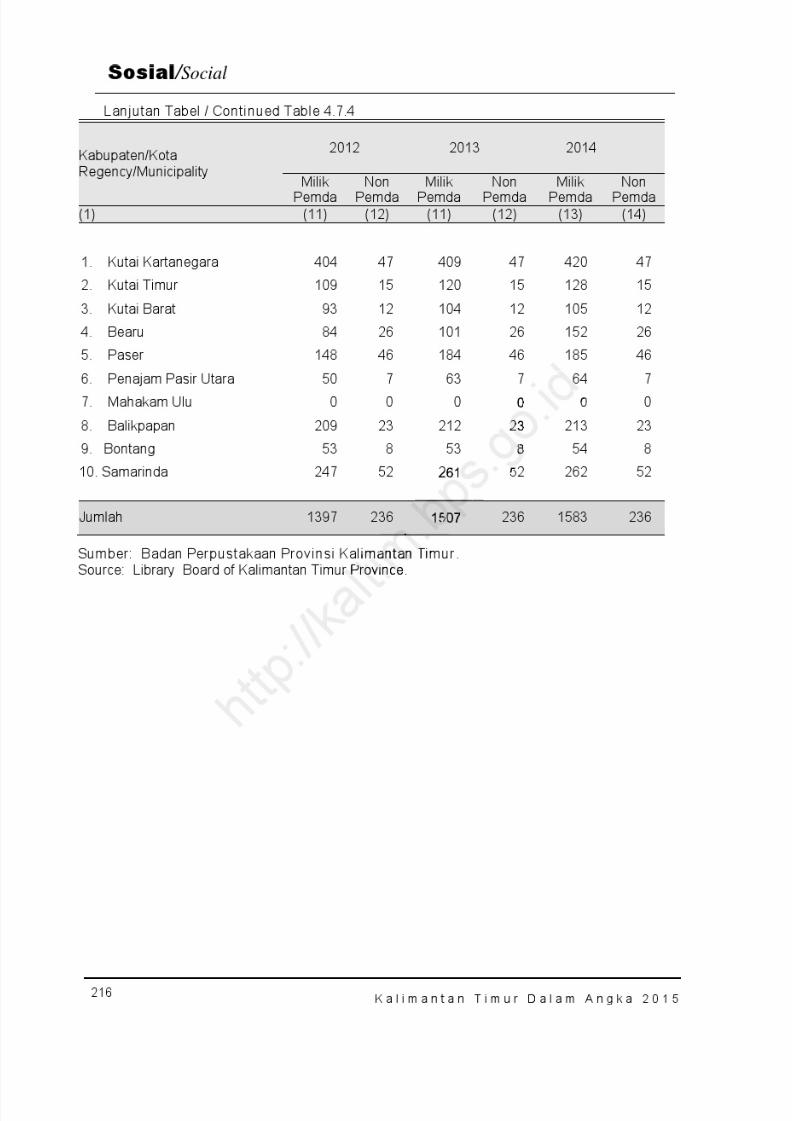
8/20/2019 Kalimantan Timur Dalam Angka Tahun 2015
http://slidepdf.com/reader/full/kalimantan-timur-dalam-angka-tahun-2015 282/623
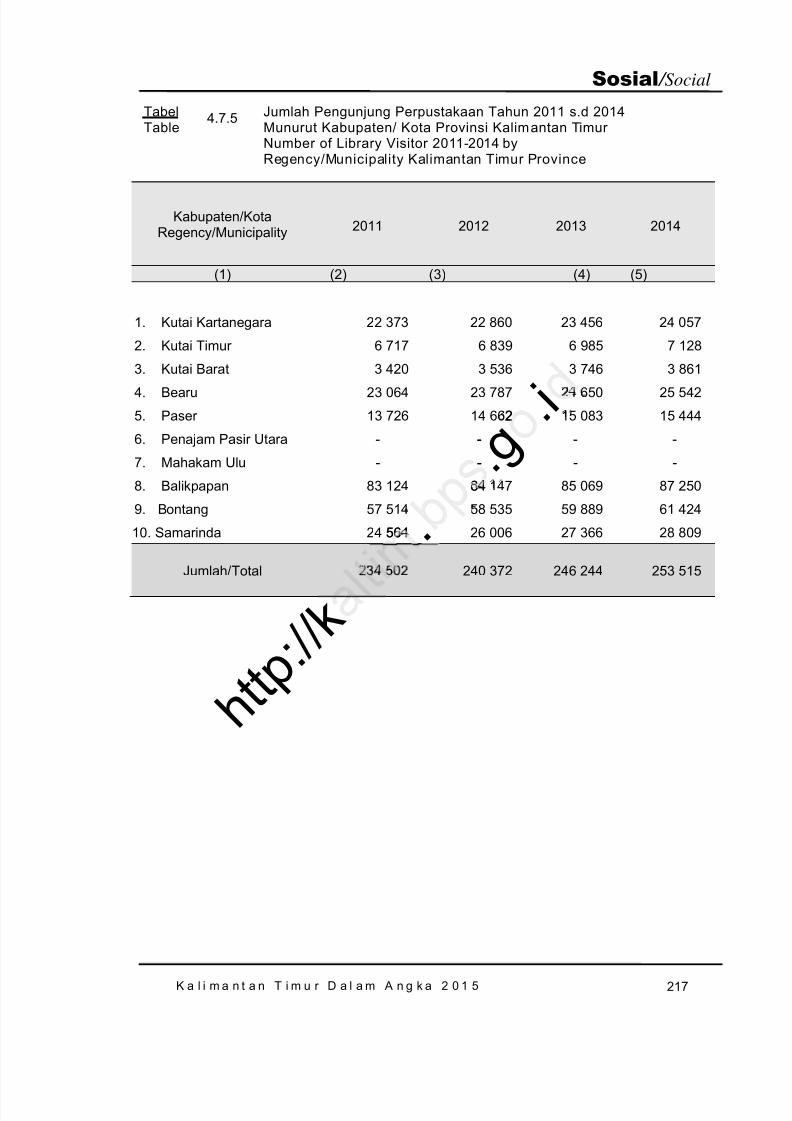
8/20/2019 Kalimantan Timur Dalam Angka Tahun 2015
http://slidepdf.com/reader/full/kalimantan-timur-dalam-angka-tahun-2015 283/623
K a l i m a n t a n T i m u r D a l a m A n g k a 2 0 1 5 217
Sosial / Social
TabelTable
4.7.5 Jumlah Pengunjung Perpustakaan Tahun 2011 s.d 2014Munurut Kabupaten/ Kota Provinsi Kalimantan Timur Number of Library Visitor 2011-2014 byRegency/Municipality Kalimantan Timur Province
Kabupaten/KotaRegency/Municipality 2011 2012 2013 2014
(1) (2) (3) (4) (5)
1. Kutai Kartanegara 22 373 22 860 23 456 24 057
2. Kutai Timur 6 717 6 839 6 985 7 128
3. Kutai Barat 3 420 3 536 3 746 3 861
4. Bearu 23 064 23 787 24 650 25 542
5. Paser 13 726 14 662 15 083 15 444
6. Penajam Pasir Utara - - - -
7. Mahakam Ulu - - - -
8. Balikpapan 83 124 84 147 85 069 87 250
9. Bontang 57 514 58 535 59 889 61 424
10. Samarinda 24 564 26 006 27 366 28 809
Jumlah/ Total 234 502 240 372 246 244 253 515
. g . i
2
-
-
84
564 .
h t t p : / / k
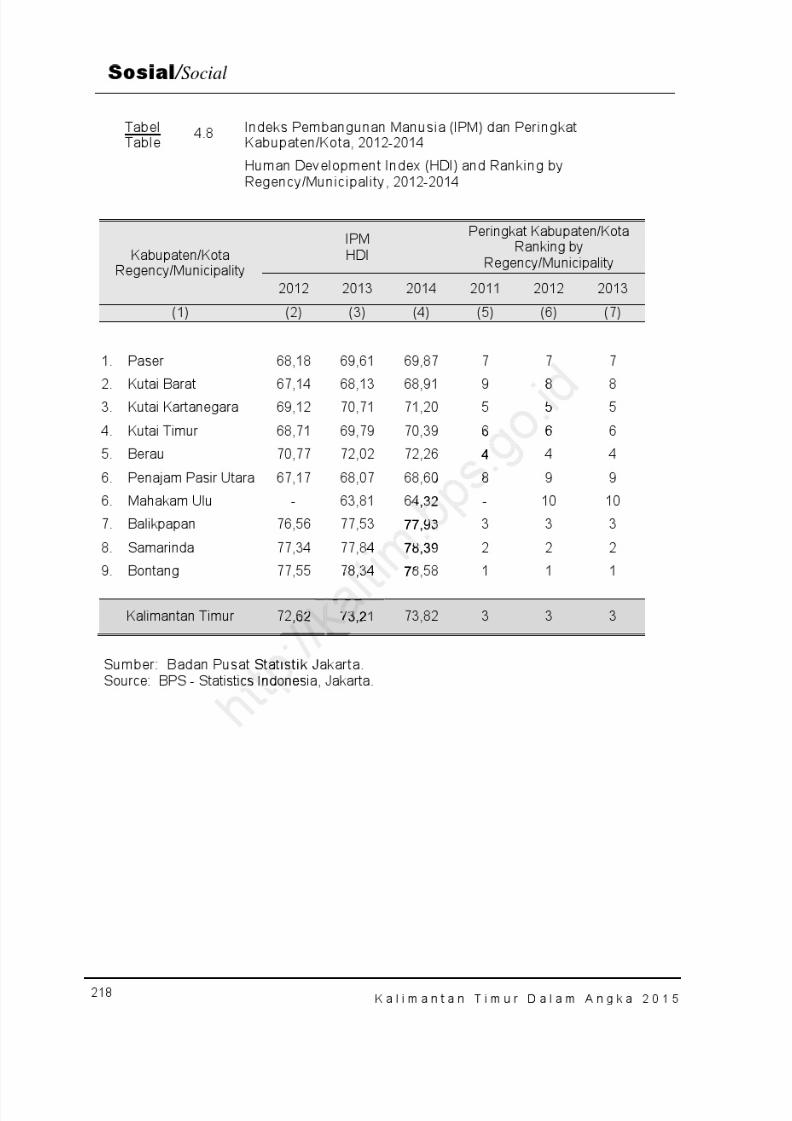
8/20/2019 Kalimantan Timur Dalam Angka Tahun 2015
http://slidepdf.com/reader/full/kalimantan-timur-dalam-angka-tahun-2015 284/623
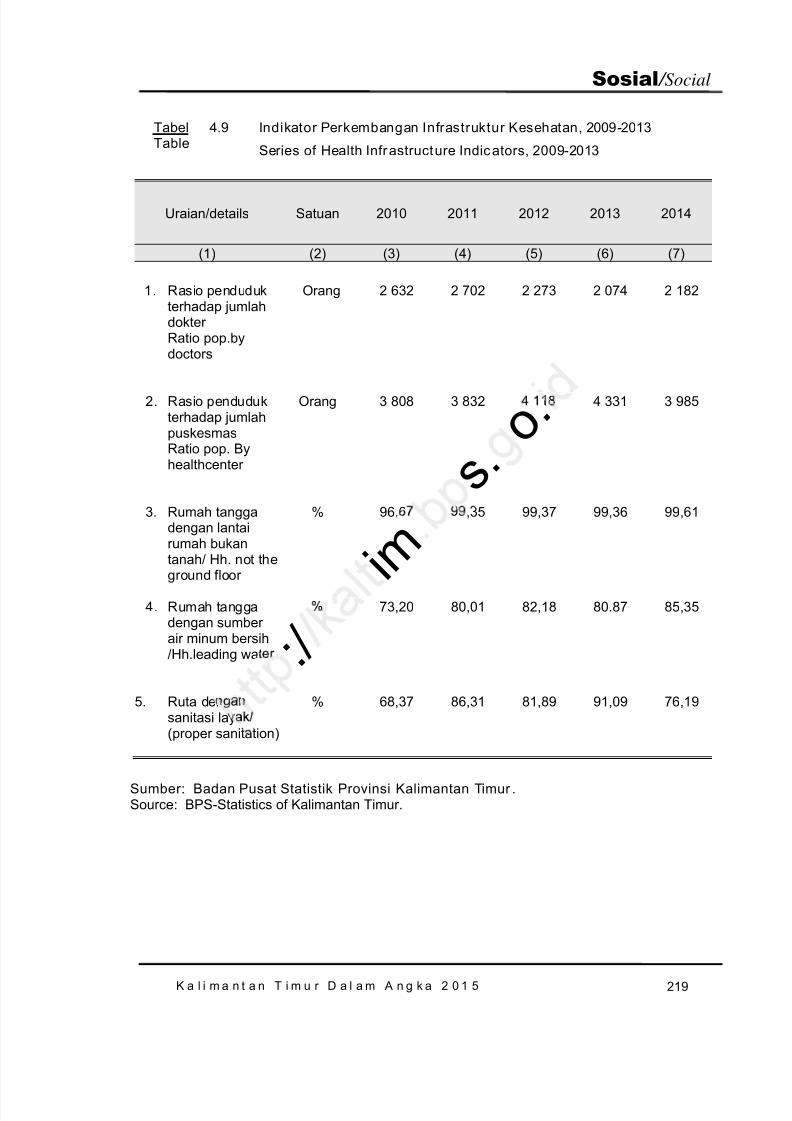
8/20/2019 Kalimantan Timur Dalam Angka Tahun 2015
http://slidepdf.com/reader/full/kalimantan-timur-dalam-angka-tahun-2015 285/623
K a l i m a n t a n T i m u r D a l a m A n g k a 2 0 1 5 219
Sosial / Social
TabelTable
4.9 Indikator Perkembangan Infrastruktur Kesehatan, 2009-2013
Series of Health Infr astructure Indicators, 2009-2013
Uraian/ details Satuan 2010 2011 2012 2013 2014
(1) (2) (3) (4) (5) (6) (7)
1. Rasio pendudukterhadap jumlahdokter Ratio pop.bydoctors
Orang 2 632 2 702 2 273 2 074 2 182
2. Rasio pendudukterhadap jumlahpuskesmasRatio pop. Byhealthcenter
Orang 3 808 3 832 4 118 4 331 3 985
3. Rumah tanggadengan lantairumah bukantanah/ Hh. not the
ground floor
% 96,67 99,35 99,37 99,36 99,61
4. Rumah tanggadengan sumberair minum bersih/Hh.leading water
% 73,20 80,01 82,18 80.87 85,35
5. Ruta dengansanitasi layak/(proper sanitation )
% 68,37 86,31 81,89 91,09 76,19
Sumber: Badan Pusat Statistik Provinsi Kalimantan Timur .Source : BPS-Statistics of Kalimantan Timur.
s . o .
i m : /
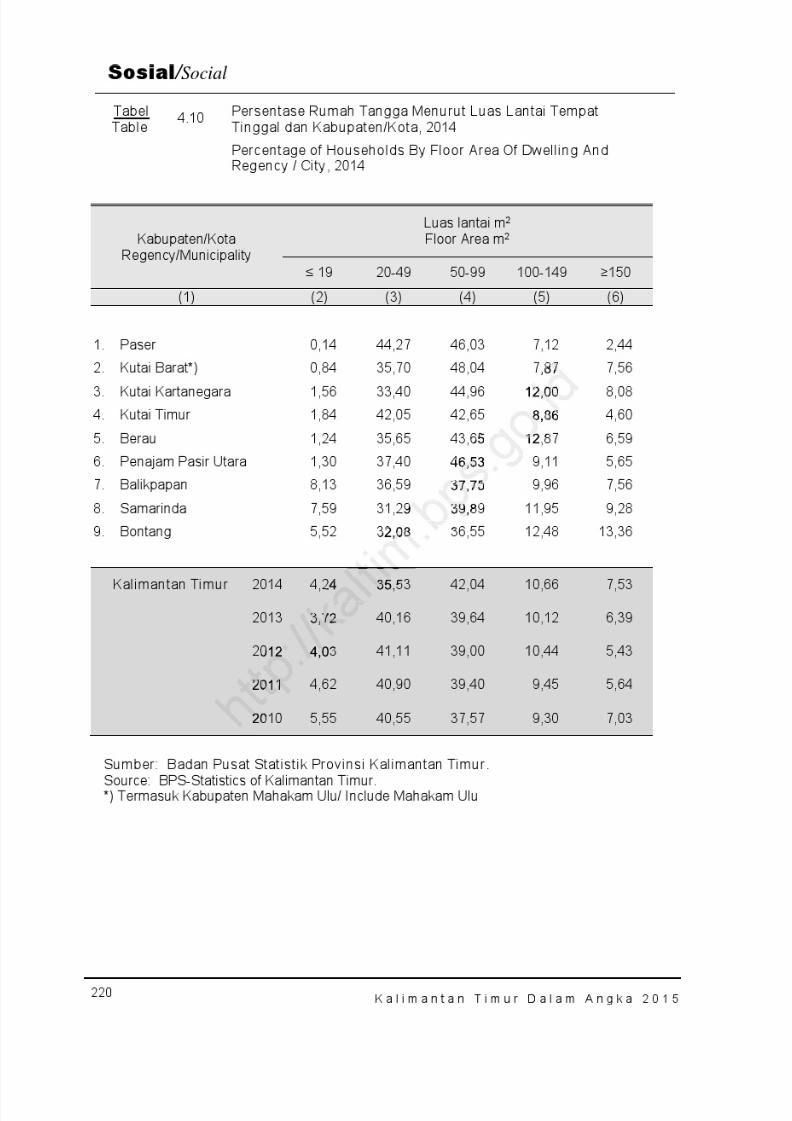
8/20/2019 Kalimantan Timur Dalam Angka Tahun 2015
http://slidepdf.com/reader/full/kalimantan-timur-dalam-angka-tahun-2015 286/623
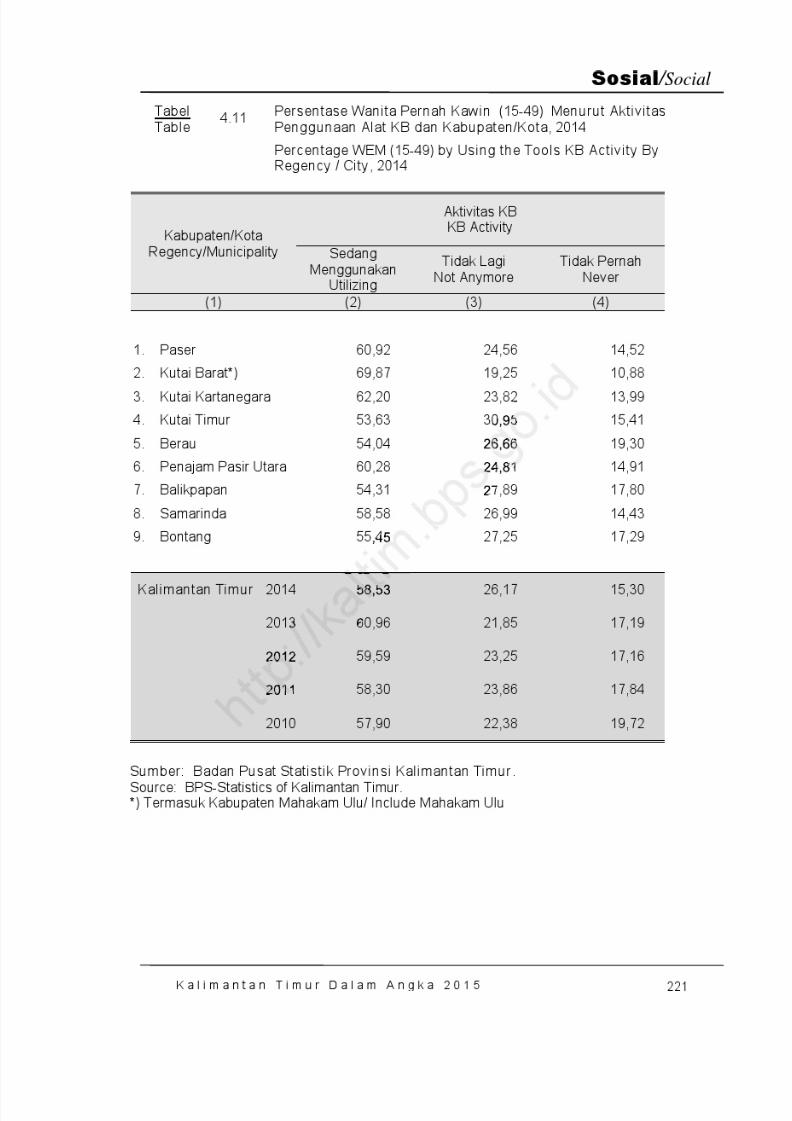
8/20/2019 Kalimantan Timur Dalam Angka Tahun 2015
http://slidepdf.com/reader/full/kalimantan-timur-dalam-angka-tahun-2015 287/623
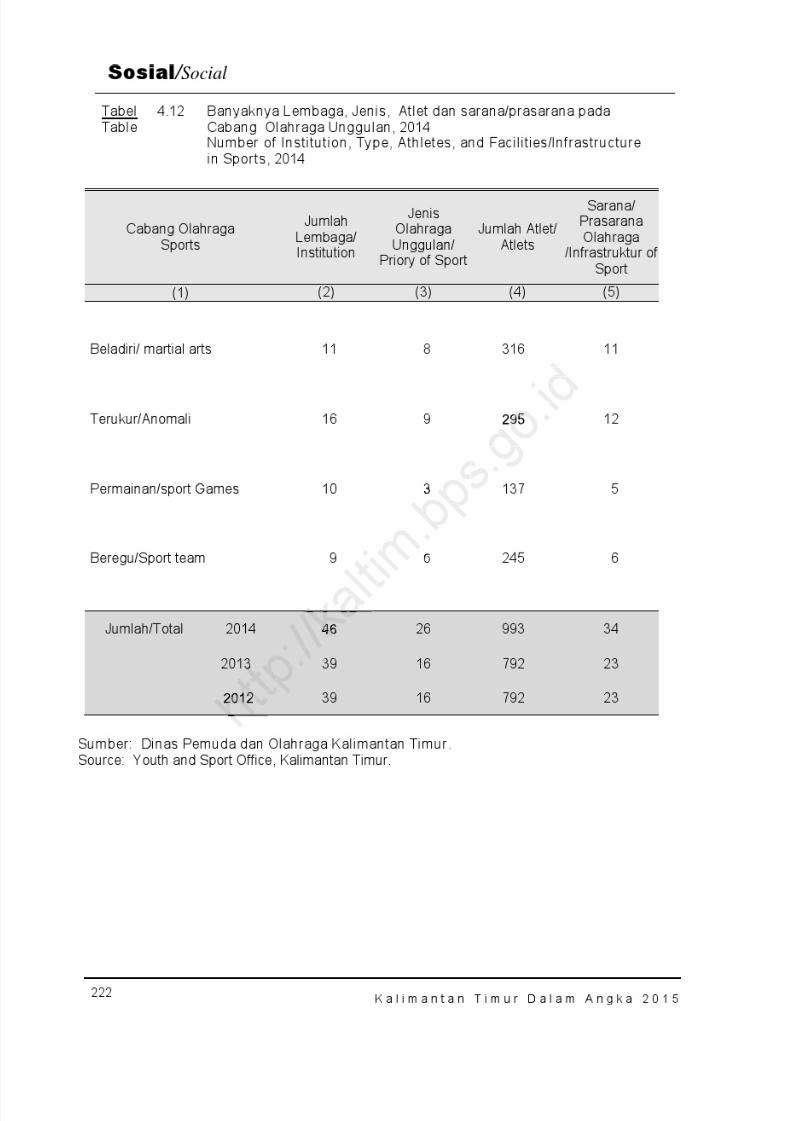
8/20/2019 Kalimantan Timur Dalam Angka Tahun 2015
http://slidepdf.com/reader/full/kalimantan-timur-dalam-angka-tahun-2015 288/623

8/20/2019 Kalimantan Timur Dalam Angka Tahun 2015
http://slidepdf.com/reader/full/kalimantan-timur-dalam-angka-tahun-2015 289/623

8/20/2019 Kalimantan Timur Dalam Angka Tahun 2015
http://slidepdf.com/reader/full/kalimantan-timur-dalam-angka-tahun-2015 290/623
h t t p : / / k a l t i m
. b p s . g o . i d
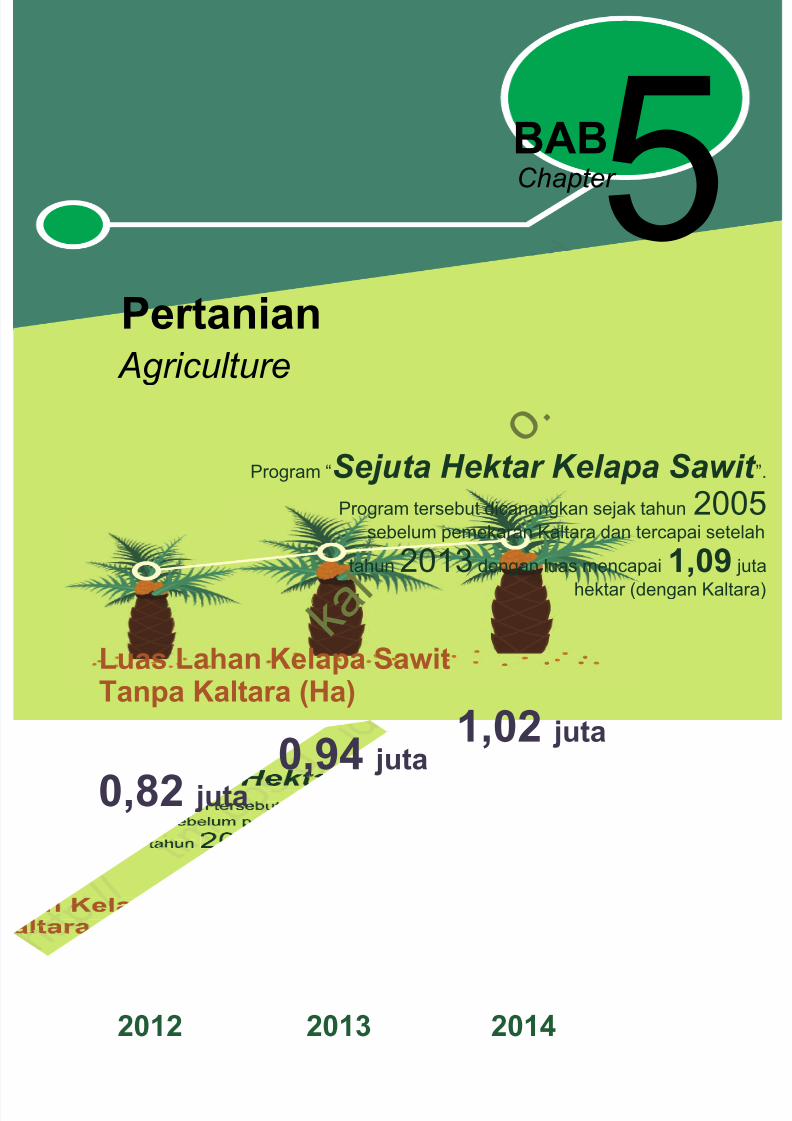
8/20/2019 Kalimantan Timur Dalam Angka Tahun 2015
http://slidepdf.com/reader/full/kalimantan-timur-dalam-angka-tahun-2015 291/623
5Pertanian
BABChapter
Agriculture
Program “ Sejuta Hektar Kelapa Sawit ”.
Program tersebut dicanangkan sejak tahun 2005sebelum pemekaran Kaltara dan tercapai setelah
tahun
2013 dengan luas mencapai
1,09 juta
hektar (dengan Kaltara)
Luas Lahan Kelapa SawitTanpa Kaltara (Ha)
2012 2013 2014
0,82 juta 0,94 juta
1,02 juta
k a l
o .

8/20/2019 Kalimantan Timur Dalam Angka Tahun 2015
http://slidepdf.com/reader/full/kalimantan-timur-dalam-angka-tahun-2015 292/623
h t t p : / / k a l t i m
. b p s . g o . i d
8/20/2019 Kalimantan Timur Dalam Angka Tahun 2015
http://slidepdf.com/reader/full/kalimantan-timur-dalam-angka-tahun-2015 293/623
227K a l i m a n t a n T i m u r D a l a m A n g k a 2 0 1 5
Pertanian / Agriculture
5.1 PADI, PALAWIJA DANHORTIKULTURA
Perkembangan luas panen,produksi padi serta hasil per hektardi Kalimantan Timur pada tahun2014 mengalami penurunan daritahun sebelumnya. Secara riil luaspanen padi naik dari 102.912 hapada tahun 2013 menjadi 100.262ha pada tahun 2014. Kemudianuntuk hasil per hektarnyamenurun menjadi 42,55 kuintalper hektar.
Daerah kabupaten/kotayang memiliki luas panen danproduksi padi (sawah + ladang)terbesar adalah Kabupaten KutaiKartanegara. Luas panen padi di
kabupaten ini mencapai 39.679 hadengan produktivitas 49,02 kw/hasehingga produksi padi yangdicapai sebesar 194.501 ton padatahun 2014. Ini berarti 45,60persen produksi padi diKalimantan Timur dihasilkan olehKabupaten Kutai Kartanegara.Bahkan untuk jenis padi sawahproduksi dari Kutai Kartanegaramencapai 52,18 persen dari totalpadi sawah Kalimantan Timur.
Tanaman palawija diKalimantan Timur antara lain jagung, ubi kayu, ubi jalar, kacangtanah, kedelai dan kacang hijau.
5.1 RICE PLANT, FOOD
CROPS AND
HORTICULTURE
The growth of harvested area,yield per hectare paddy productionin Kalimantan Timur in 2013increased from the previous year.In real terms paddy harvested area fell from 101,960 ha in year 2012to 102,912 ha in 2013. While the
yield per hectare increased to42,70 quintals per hectare.
Regency/municipality has anarea of harvest and production of paddy largest is the regency KutaiKartanegara that is by 41,247 haarea and yield 49.06 kw/ha with paddy production reached 202,338tons by the year 2012. This means36.01 percent of rice production inKalimantan Timur produced by theKutai Kartanegara regency. Thiscan be seen on the type of paddy paddy fields with a total production of amounting to 45.35
percent.
Crops in Kalimantan Timur,among others, maize, cassava,sweet potatoes, peanuts, soybeansand green beans.
.
di
9 hakw/ha
a i ya. 01 tonberart
uksiur
ares per he
Regencrea of
paddyKar
8/20/2019 Kalimantan Timur Dalam Angka Tahun 2015
http://slidepdf.com/reader/full/kalimantan-timur-dalam-angka-tahun-2015 294/623
228
Pertanian / Agriculture
K a l i m a n t a n T i m u r D a l a m A n g k a 2 0 1 5
Selama periode 2010-2014, luaspanen tanaman ini mengalamifluktuasi. Tahun 2014 beberapakomoditi palawija tersebutmengalami penurunan luas panen,kecuali tanaman jagung, ubi kayudan kacang tanah.
Pada jenis tanaman sayur-sayuran yang perkembangannyasangat berfluktuasi, sebagianbesar mengalami peningkatan,
baik produksi total maupunproduksi per hektarnya. Jenistanaman sayuran yang terbanyakdihasilkan di provinsi ini adalahketimun dan bawang merah yangproduksinya masing-masingmencapai 14.468 ton dan 10.306ton pada tahun 2014.
5.2 PERKEBUNAN
Jenis-jenis tanamanperkebunan yang dikembangkan di
Kalimantan Timur antara lain:karet, kelapa, kopi, lada, coklat,kelapa sawit, gula aren dan lainnyayang merupakan gabungan daribeberapa tanaman perkebunan.Usaha tanaman perkebunan initerbagi menjadi perkebunan besarpemerintah, perkebunan besarswasta dan perkebunan rakyat.
During the period 2009-2014, thiscrop harvest area has fluctuated.In2014 half of commodity cropsharvested area is decreased,except for maize, cassava, and peanuts.
On vegetable crops whose
development is highly fluctuation,largely decreased both total production and production per
hectare. Most vegetable crops produced in this province iscucumber and Swamp Cabbagesthat each production reached14,468 and 10,306 tons in 2013.
5.2 PLANTATION
The types of crops beingdeveloped in Kalimantan Timurinclude: rubber, coconut, coffee, pepper, cocoa, palm oil, palmsugar and combination of severalcrops. Plantation business isdivided into large plantation, private estates and smallholder.
.
ven t is
r and S
k a l t i m . b p
N
each p ,468 and
8/20/2019 Kalimantan Timur Dalam Angka Tahun 2015
http://slidepdf.com/reader/full/kalimantan-timur-dalam-angka-tahun-2015 295/623
229K a l i m a n t a n T i m u r D a l a m A n g k a 2 0 1 5
Pertanian / Agriculture
Areal perkebunan diKalimantan Timur secarakeseluruhan pada tahun 2014adalah 1.187.421 ha denganproduksi 9.714.443 ton. Wilayahterbesar dari luas perkebunanditanami kelapa sawit. Produksikelapa sawit mencapai 9.628.072ton dari luas tanaman 1.020.413ha. Produksi terbesar kedua adalahperkebunan karet sebesar 63.281ton dan perkebunan kelapa 11.424
ton dari luas tanaman 113.485 hadan 26.674 ha.
Tercatat pada perkebunan
besar produksi kelapa sawitmencapai 275.025 ton dari luastanaman 22.342 ha. Sementaraperkebunan besar swasta tercatat7.118.437 ton produksi kelapasawit dengan luas 761.119 ha, danperkebunan Rakyat memproduksi1.654.337 ton.
Dari tahun ke tahun luasperkebunan kelapa sawit selalumeningkat, sejalan dengan
program gubernur dalam upayameluncurkan program "satu jutahektar kelapa sawit" sehingga areapabrik akan meningkat dari tahunke tahun.
Plantation area in KalimantanTimur as a whole in 2012 was1,102,632 ha with a production of6,989,209 tons. The greatest portion of the plantation area be planted of oil palm. Production oil palm reached 6,901,602 tons fromarea planted 944,826 ha. Thesecond largest production is rubber plantation amounted 59,963 tonsand coconut plantation 13,266tons from the planted area of
101,156 ha and 17,272 ha.
Data recorded large plantations of production plant palm oil 274,193 tons from the planted area of 22,367 ha. While private large estates recorded5,109,170 tons of palm oil production with an area of 713,449ha, and Smallholders plantations produce 1,518,239 tonnes.
From year to year area of palm oil plantation always anincrease, in line with the governor's
program to launch the program "amillion hectares of palm oil" so thatthe plant area will be increased from year to year.
: /
o .
pa, dan,
produks
un kelap
17,2
ta rtations
alm oil plante priv
8/20/2019 Kalimantan Timur Dalam Angka Tahun 2015
http://slidepdf.com/reader/full/kalimantan-timur-dalam-angka-tahun-2015 296/623
230
Pertanian / Agriculture
K a l i m a n t a n T i m u r D a l a m A n g k a 2 0 1 5
5.3 KEHUTANAN
Luas hutan Kalimantan Timurtahun 2014 sekitar 8.256.767hektar. Terbagi menjadi 6 (enam) jenis hutan yaitu hutan lindung,hutan suaka alam dan wisata,hutan produksi terbatas, hutanproduksi tetap, hutan produksiyang dapat dikonversi, dan hutanpendidikan/penelitian. Dari 6(enam) jenis hutan tersebut yang
terluas adalah hutan produksitetap dan hutan produksi terbatasmasing-masing 3.024.576 ha dan2.881.569 ha. Daerah kabupaten/kota yang mempunyai kawasanhutan terluas yaitu KabupatenKutai Timur dengan luas arealhutan mencapai 2.110.024 ha
Terkait denganpembentukan hutan HPH dan HTI juga Program reboisasi danrehabilitasi lahan hutan. Jumlahhutan konsesi di Kalimantan Timursebanyak 63 perusahaan denganluas 4.193.354 ha konsesi hutan,sementara Hutan TanamanIndustri (HTI) pada tahun 2014
tercatat 1.489.147 ha dikelola oleh38 perusahaan perkebunan.
5.3. FORESTRY
Forest area of KalimantanTimur in 2013 about 8,563,508 ha,consisting of 6 (six) types of forestthat is protected forest, forest preserves and tours, limited production forest, permanent forest production, forest production can be converted, and forest education / research . Of 6
(six) is the largest forest type is permanent forest and limited production forest respectively3,249,132 and 3,121,900 ha.Regency/municipality has thelargest forest area Kutai Timur toreach 2,198,344 ha.
Related to forestestablishment the HPH and HTI program also reforestation andrehabilitation program of forestland. The number of concessions forest in Kalimantan Timur asmany 76 companies with an areaof 4,926,062.80 ha of forestconcessions, while the Industrial
Plantation Forest (HTI) in 2013listed 1,665,170 ha is managed by44 plantation companies.
estorestn ore
m .
ganan HTIasi da
tan . Julimanta
erusaha4 ha k
u
32 anency/m
argest f reac
8/20/2019 Kalimantan Timur Dalam Angka Tahun 2015
http://slidepdf.com/reader/full/kalimantan-timur-dalam-angka-tahun-2015 297/623

8/20/2019 Kalimantan Timur Dalam Angka Tahun 2015
http://slidepdf.com/reader/full/kalimantan-timur-dalam-angka-tahun-2015 298/623
232
Pertanian / Agriculture
K a l i m a n t a n T i m u r D a l a m A n g k a 2 0 1 5
Pemotongan hewan ternakuntuk konsumsi bisa dilakukan dirumah potong hewan dan di luarrumah potong hewan. Hewanternak yang dipotong di rumahpotong sebanyak 42.536 ekor,terdiri dari 3 (tiga) jenis hewanternak saja yaitu sapi, kerbau danbabi. Sedangkan yang dipotong diluar rumah potong hewanberjumlah 78.061 ekor dari 6(enam) jenis hewan ternak. Dari
keseluruhan hewan ternak potongyang terbanyak dipotong adalahsapi dan kambing yaitu 55.781ekor dan 41.754 ekor. Ini terlihatpengaruhnya terhadap produksidaging. Kontribusi daging sapiterhadap produksi dagingmerupakan yang terbanyakdibandingkan dengan ternaklainnya yaitu 8.811,72 ton atau80,90 persen dari total produksidaging ternak yang berjumlah10.891,02 ton.
Untuk jenis unggas, padaakhir tahun 2014 total populasi-nya sebesar 51.744.439 ekor yangberasal dari 4 jenis unggas yang
dibudidayakan (ayam kampung,ayam ras pedaging, ayam raspetelur dan itik). Adapun unggasterbanyak adalah ayam raspedaging yaitu 46.553.307 ekor.Demikian pula dengan jumlahunggas bibit yang masuk,terbanyak adalah jenis ayam raspedaging mencapai 4.783.359ekor.
Slaughtering animals for foodcan do at slaughterhouse andoutside slaughterhouse. Cattleslaughtered in slaughter houses is38.352 head from 3 (three) typesof livestock that is cow, buffalo,and goats. While that was cut outof the abattoir is 70.585 headinclude 6 (enam) kinds of farmanimals. Of the entire piece thatmost farm animals are cows andgoats cut the tail and 35 930
52,500 tails.It looks its effect onbeef production, beef production isthe largest meat productioncompared with other livestock thatis 8,608.27 tons or 80.08 percent oftotal livestock meat productionamounted to 10,238.73 tonnes.
For this type of poultry, by theend of 2013 showed a populationof poultry 50,768,271 head fromthe 4 types of farmed poultry
(village hen, broiler, layer chickenand duck), and the highest is for43,802,742 broiler. The number ofbird seed into the type of broilerreach 3,186,200 head.
.oo s
: m
. a
atauproduks
berju
s ung01 4 to
74
ion , beegest m
re wit , .
total liv amou
8/20/2019 Kalimantan Timur Dalam Angka Tahun 2015
http://slidepdf.com/reader/full/kalimantan-timur-dalam-angka-tahun-2015 299/623
233K a l i m a n t a n T i m u r D a l a m A n g k a 2 0 1 5
Pertanian / Agriculture
Produksi daging yangdihasilkan dari ke 4 (empat) jenisunggas tersebut pada tahun 2014yaitu ayam kampung 4.758,70 ton,ayam ras pedaging 43.644,20 ton,ayam ras petelur 308,80 ton danitik 95,10 ton. Sementara ituproduksi telur yang dihasilkan dariayam ras, ayam kampung dan itiksebanyak 9.232,7 ton.
5.5 PERIKANAN
Jumlah rumah tanggaperikanan mengalami peningkatankarena adanya reklamasi lahandari batubara menjadi area danauuntuk perikanan. Fenomena initerjadi terutama di daerah KutaiTimur dan Berau.
Produksi perikanan laut danperikanan darat menghasilkansebesar 211.792,80 ton di tahun2014.
Sarana penangkapan ikan lautpada tahun 2014 terdiri dariperahu tanpa motor, perahudengan motor tempel dan kapalmotor. Jumlah total armada padatahun 2014 sebanyak 24.051 unit.Bila dibandingkan dengan tahun2013 yang jumlah armadanyamencapai 22.169 unit, makaterjadi peningkatan jumlaharmada perikanan laut.
Meat production resulting from the 4 (four) types of poultry in2012 was 5,54.,90 tons of chicken,broiler 41,782.1 tons, 515.90 tonsof chicken and ducks laying 57.00tons. Meanwhile, production ofeggs produced from of chickenbroiler, chicken village and ducks is13,657.1 tons.
5.5 FISHERY
The number of fishinghouseholds has increased becauseof land reclamation from coal tolakes. This phenomenon occursmainly in regencies Berau and EastKutai.
Production of marine fisheries and aquaculture produceby 214,651.1 tonnes in 2013.
Means of the fishing sea in2013 consisted of boat without amotor, a boat with outboard motorand motors boat. The number oftotal fleet in 2014 is 24,051 units.When compared to the year 2013with a fleet reached 22,169 units,then a increase in the number ofsea fishing fleet.
numol ds has
and recl
t p t i m
ut danng asi
ton i t
nangk
kes. Tmain yKut
8/20/2019 Kalimantan Timur Dalam Angka Tahun 2015
http://slidepdf.com/reader/full/kalimantan-timur-dalam-angka-tahun-2015 300/623
234
Pertanian / Agriculture
K a l i m a n t a n T i m u r D a l a m A n g k a 2 0 1 5
PENJELASAN TEKNIS
1. Data penggunaan lahandikumpul-kan setiap awal tahun,meliputi:a. Lahan sawah mencakup
sawah pengairan, tadahhujan, sawah pasang surut,rembesan, lebak dansebagainya.
b. Lahan untuk bangunan dan
halaman sekitarnya : Lahanyang terdapat di sekitarbangunan dan biasanya diberipagar atau batas, tanpamemperhatikan ditanami atautidak. Bila lahan sekitar rumahtersebut tidak jelas batas-batasnya dengan tegal/kebun,dimasukkan ke dalam kebun/tegal.
c. Tegal/kebun/ladang/huma: Lahan kering yang ditanamitanaman musiman atautahunan seperti padi ladang,palawija/hortikultura danletak-nya terpisah denganhalaman sekitar rumah.
d. Tambak : Lahan yang biasa-nya dipergunakan untuk me-melihara ikan, udang ataubinatang air lainnya. Letaktambak ini tidak jauh dari lautdan airnya asin atau payau.
e. Kolam/tebat/empang: Lahanyang dipergunakan untukpemeliharaan/pembenihanikan dan biota air lainnya.
TECHNICAL NOTES
1. Using of soil data is collectedevery year, consist of:
a. Wetland area, involvesirrigated rice field, rice fielddependent on rain, seepagerice field in swampy area,etc.
b. Land for building and yard
environs; Area issurrounding the buildingand usually is built fence orboundary, without look at planted or not. If landboundary of house environsis unclear with dry- field/plantation, so it isinvolved plantation/dry- field.
c. Dryfield/plantation/dryland /newly cleared land; drylandis seasonal plant or annual plant such as dryland paddy,crops planted/ horticultureand its location is separated from yard house environs.
d. Fishpond; Land is usuallyused to raise fish, shrimp oranother. Location of fishpond is not far from thesea and its water is salty orbriny.
e. Fishpond/dam; land is used for seeding/cultivation of fish and another.
i m . b p
/
uma : ditana
manrti pa i
ortikultuerp
ndingusually
oun ar p antbo
8/20/2019 Kalimantan Timur Dalam Angka Tahun 2015
http://slidepdf.com/reader/full/kalimantan-timur-dalam-angka-tahun-2015 301/623
235K a l i m a n t a n T i m u r D a l a m A n g k a 2 0 1 5
Pertanian / Agriculture
f. Lahan yang sementara tidakdiusahakan: Lahan yangbiasanya diusahakan tetapiuntuk sementara (lebih darisatu tahun dan kurang daridua tahun) tidak diusahakan.
g. Lahan untuk tanaman kayu-kayuan: Lahan yangditumbuhi kayu-kayuan/bambu, baik yangtumbuh sendiri maupun yangsengaja ditanami, misalnya
semak-semak dan pohon-pohon yang hasil utamanyakayu. Disini tidak termasuklahan kehutanan.
2. Data luas panen tanamanpangan dikumpulkan dariseluruh kecamatan di Provinsi
Kalimantan Timur setiap bulanoleh Badan Pusat Statistik (BPS),kecuali luas panen buah-buahansetiap triwulanan. Luas panentanaman pangan merupakanluas panen bersih.
3. Data luas panen dan produksisayur-sayuran yang dicatatadalah yang dipanen sekaligus.
4. Produksi per hektar padi, jagung,ubi kayu, ubi jalar, kacang tanah,kacang kedelai diperkirakanmelalui sampel survei ubinandengan plot 2,5 x 2,5 m. Setiapubinan mewakili 100 hektarpanen. Pelaksanaan ubinandisesuaikan dengan saat panen.
f. Land is not managed for awhile; land is usually managed for a while (more than a yearand less than two years) is notmanaged
g. Land for various trees; land isgrown by varioustrees/bamboo, either self-growor planted expressly, such asbushes and trees that is its main product is woods. Not included forest area.
2. Data of harvested area for food plants is collected at whole subdistricts in Kalimantan Timurevery month by BPS-Statistics,except harvested area for fruitsevery three months. Harvestedarea of food plants is netto-harvested area.
3. Data of harvested area and production for vegetables isharvested vegetables at once.
4. Productions per hectare for rice plant, corn, cassava, sweet potato, peanut, and soybean are predicted by tile survey samplewith plot 2.5 x 2.5 m. Every tilerepresented 100 hectares ofharvested area. Realization of tile
is adjusted with harvested time.
. b g o . i
nsi
ulanik (BPS)ah-bua
. Luasgan m
ersih..
pan
..
. Data o pland
8/20/2019 Kalimantan Timur Dalam Angka Tahun 2015
http://slidepdf.com/reader/full/kalimantan-timur-dalam-angka-tahun-2015 302/623
236
Pertanian / Agriculture
K a l i m a n t a n T i m u r D a l a m A n g k a 2 0 1 5
5. Padi sawah adalah padi yangditanam di lahan sawah.
6. Padi ladang adalah padi yangditanam di tegal/kebun/ladangatau huma.
7. Wujud produksi padi danpalawija adalah: kering giling(padi), pipilan kering (jagung),ubi basah (ubi kayu dan ubi jalar) dan biji kering (kacangtanah dan kedelai).
8. Faktor konversi dari gabahkering giling ke beras sebelumtahun 1989 adalah 68 persen,mulai tahun 1989 menjadi 65persen.
9. Pengeluaran adalah yang benar-benar digunakan untukmendapatkan produksi tersebutdan bukan dicadangkan. Penge-luaran tidak mencakup nilai bagihasil, sewa tanah dan perkiraansewa tanah milik sendiri, danbiaya selamatan.
10. Nilai Produksi adalah perkiraannilai ditingkat petani. Apabila pe-tani menjual hasil pertaniannyadi pasar maka nilai penjualanharus dikurangi dengan ongkospemasaran.
5. Wetland paddy is paddy that is planted in the wetland.
6. Dryland paddy is paddy that is planted in the dryfield/ plantation/ dryland or newlycleared land.
7. Concrete of production for paddyand food crops are mill dry(paddy), dry shelled (corn), wettuber (cassava and sweet potato)
and dry seed (peanut andsoybean).
8. Conversion factors of mill dryunhulled to rice before 1989 is 68 percents, then from 1989 itbecomes 65 percents.
9. Export is used for getting products and un-reserved. Exportis not involved sharing value, landrental, and prediction of own landrental and ceremonial meal cost.
10. Production value is prediction ofvalue in farmer level. If the farmers sell his yield in the marketso selling value must be reducedmarketing cost.
nar- untu k
tersebgkan. Pe .
ca up nnah da
ilik
e
ersionhulled t
percenec
8/20/2019 Kalimantan Timur Dalam Angka Tahun 2015
http://slidepdf.com/reader/full/kalimantan-timur-dalam-angka-tahun-2015 303/623
237K a l i m a n t a n T i m u r D a l a m A n g k a 2 0 1 5
Pertanian / Agriculture
11. Perkebunan besar adalah usahaperkebunan yang dilakukan olehbadan usaha atau badan hukumdi atas tanah negara yangmendapat izin usaha di instansiyang berwenang. Di luar batasantersebut merupakanperkebunan rakyat.
12. Bentuk produksi perkebunanadalah: karet kering (karet),daun kering (teh dan tembakau),biji kering (kopi dan coklat), kulitkering (kayu manis dan kina),serat kering (rami), bunga kering(cengkeh), refined sugar (tebudari perkebunan besar), gulamangkok (tebu dari perkebunanrakyat), equivalent kopra(kopra), biji dan bunga (pala)
serta minyak daun (sereh).
11. Private estate is estate businessthat is done by business firm orlaw firm on the state land whichget business license in thecompetent department. Out ofborders form people estate.
12. Concrete of estate production isdry rubber (rubber), dry leaf (teaand tobacco), dry seed (coffee
and cocoa), dry bark (cinnamonand quinine), dry fiber (hemp),dry flower (clove), refined sugar(sugar cane from private estate),bowl sugar (sugar cone from people estate), equivalent copra(copra), seed and flower(nutmeg) and leaf oil (citronella).
a , rinine),
flower (
h t t p : / / k a t
. b a)
..
sugar caow
pe
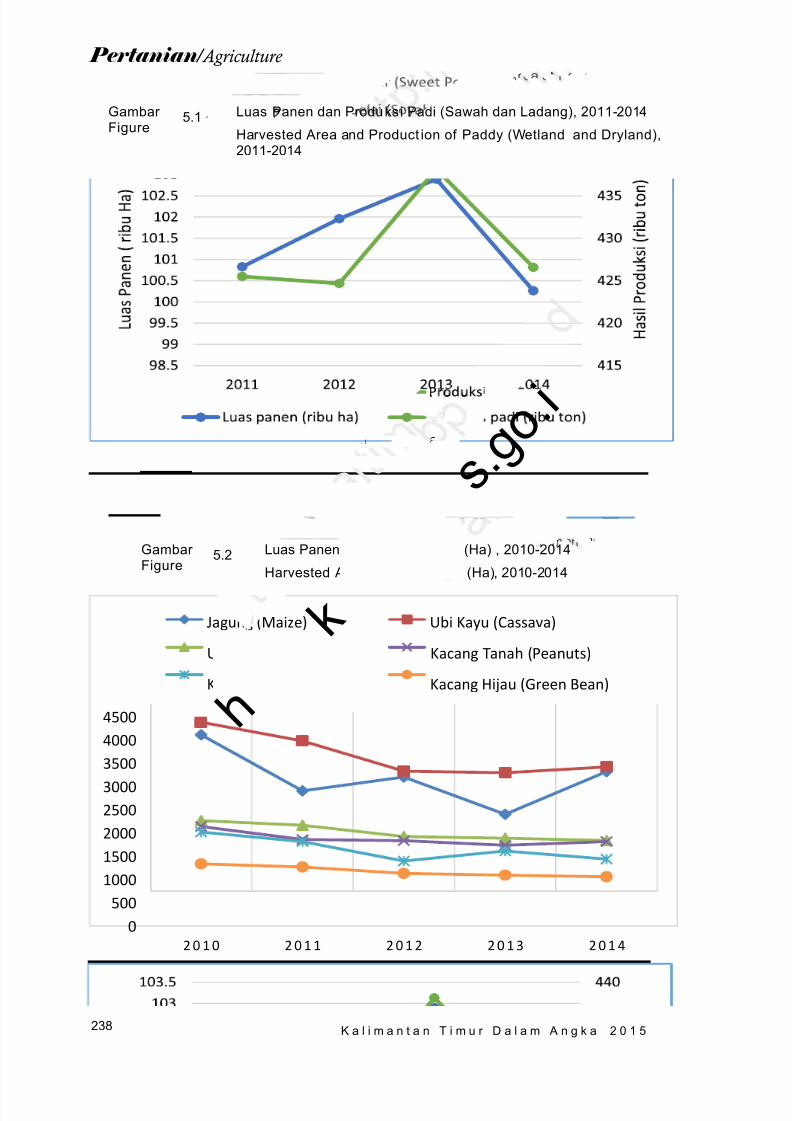
8/20/2019 Kalimantan Timur Dalam Angka Tahun 2015
http://slidepdf.com/reader/full/kalimantan-timur-dalam-angka-tahun-2015 304/623
238
Pertanian / Agriculture
K a l i m a n t a n T i m u r D a l a m A n g k a 2 0 1 5
Gambar Figure
5.1 Luas Panen dan Produksi Padi (Sawah dan Ladang), 2011-2014
Harvested Area and Product ion of Paddy (Wetland and Dryland),2011-2014
Gambar Figure
5.2 Luas Panen Tanaman Palawija (Ha) , 2010-2014
Harvested Area of Food Crops (Ha), 2010-2014
0500
100015002000250030003500
40004500
2 0 1 0 2 0 1 1 2 0 1 2 2 0 1 3 2 0 1 4
Jagung (Maize) Ubi Kayu (Cassava)
Ubi Jalar (Sweet Potatoes) Kacang Tanah (Peanuts)
Kedelai (Soyabeans) Kacang Hijau (Green Bean)
s . g o . i
. aman Pal
rea of Foo
h
k
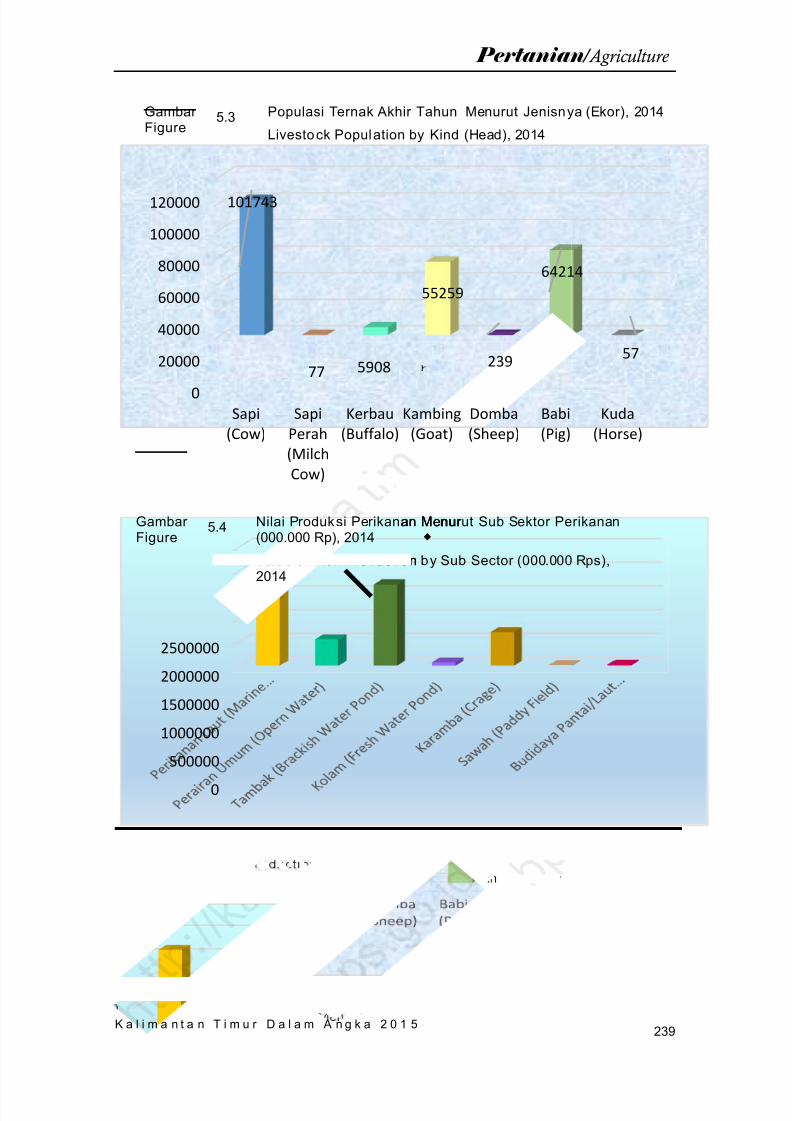
8/20/2019 Kalimantan Timur Dalam Angka Tahun 2015
http://slidepdf.com/reader/full/kalimantan-timur-dalam-angka-tahun-2015 305/623
239K a l i m a n t a n T i m u r D a l a m A n g k a 2 0 1 5
Pertanian / Agriculture
Gambar Figure
5.3 Populasi Ternak Akhir Tahun Menurut Jenisnya (Ekor), 2014
Livestock Population by Kind (Head), 2014
Gambar Figure
5.4 Nilai Produksi Perikanan Menurut Sub Sektor Perikanan(000.000 Rp), 2014
Value of Fish Production by Sub Sector (000.000 Rps),2014
0
20000
40000
60000
80000
100000
120000
Sapi(Cow)
SapiPerah(MilchCow)
Kerbau(Buffalo)
Kambing(Goat)
Domba(Sheep)
Babi(Pig)
Kuda(Horse)
101743
77 5908
55259
239
64214
57
0500000
1000000
1500000
2000000
2500000
l .an Menur
o uc on
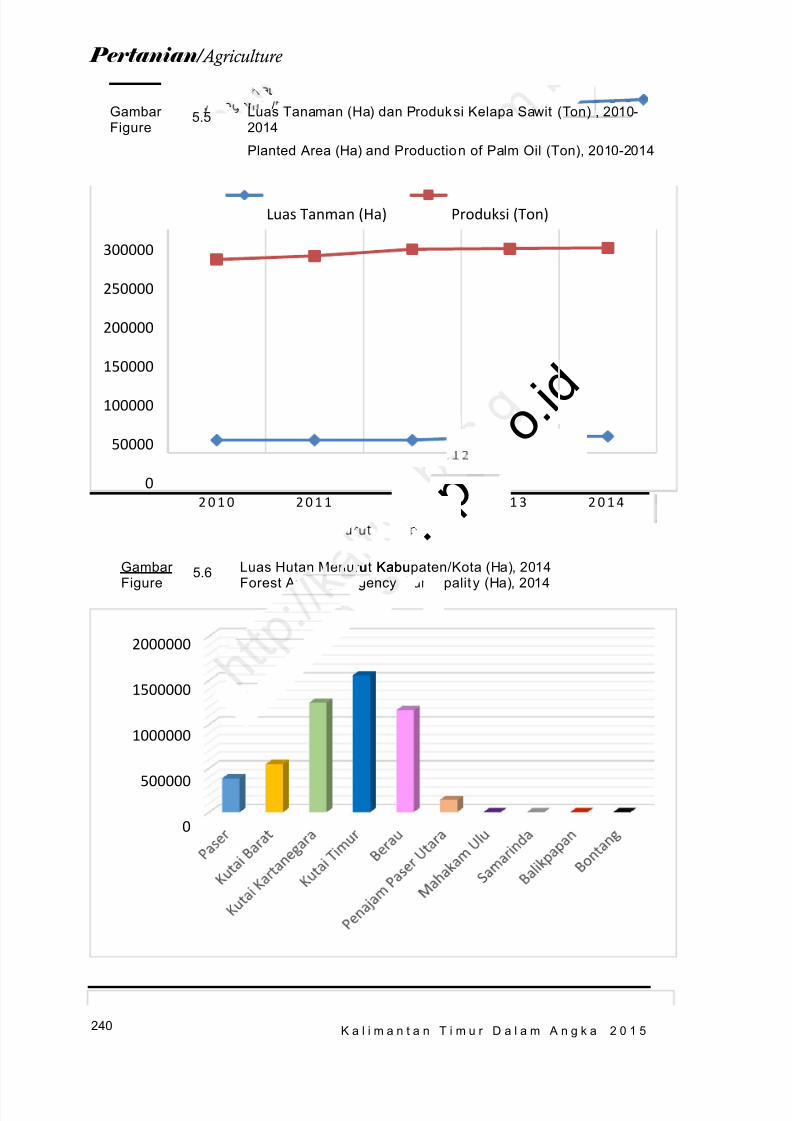
8/20/2019 Kalimantan Timur Dalam Angka Tahun 2015
http://slidepdf.com/reader/full/kalimantan-timur-dalam-angka-tahun-2015 306/623
240
Pertanian / Agriculture
K a l i m a n t a n T i m u r D a l a m A n g k a 2 0 1 5
Gambar Figure
5.5 Luas Tanaman (Ha) dan Produksi Kelapa Sawit (Ton) , 2010-2014
Planted Area (Ha) and Production of Palm Oil (Ton) , 2010-2014
Gambar Figure 5.6
Luas Hutan Menurut Kabupaten/Kota (Ha), 2014Forest Area by Regency/Municipalit y (Ha), 2014
0
50000
100000
150000
200000
250000
300000
2 0 1 0 2 0 1 1 2 0 1 2 2 0 1 3 2 0 1 4
Luas Tanman (Ha) Produksi (Ton)
0
500000
1000000
1500000
2000000
p o . i d
.ru Kabu
Regency
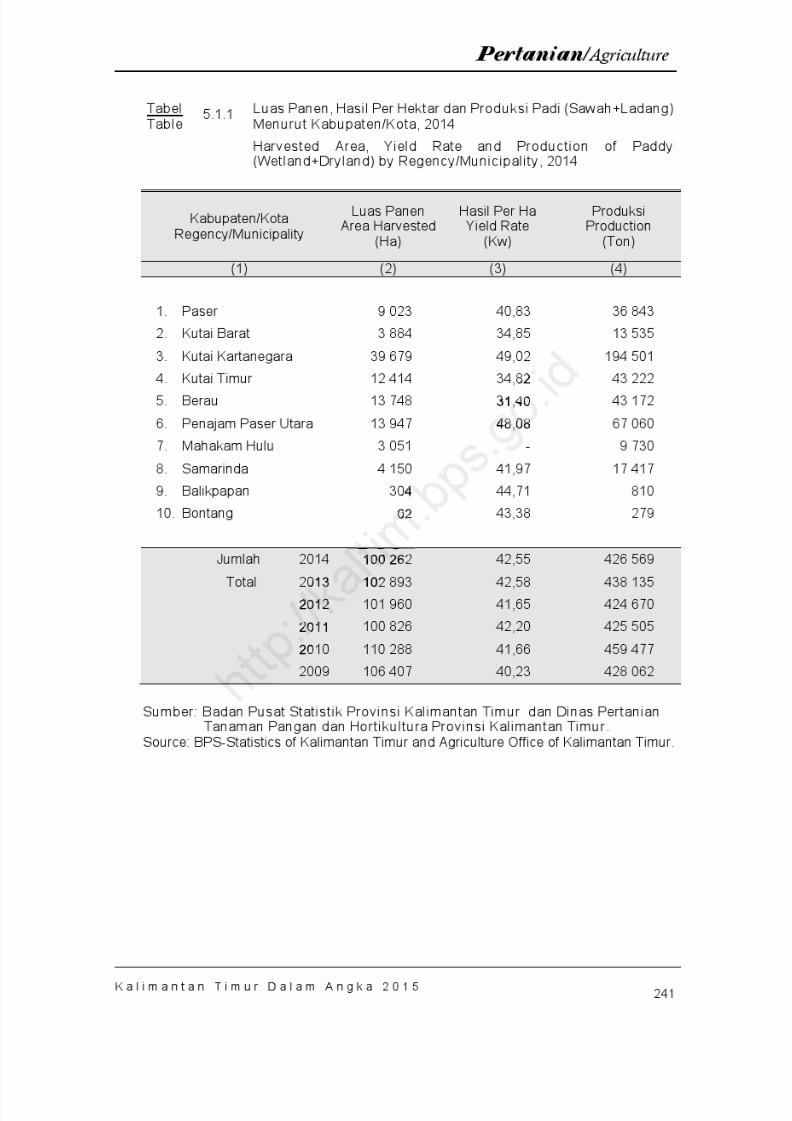
8/20/2019 Kalimantan Timur Dalam Angka Tahun 2015
http://slidepdf.com/reader/full/kalimantan-timur-dalam-angka-tahun-2015 307/623
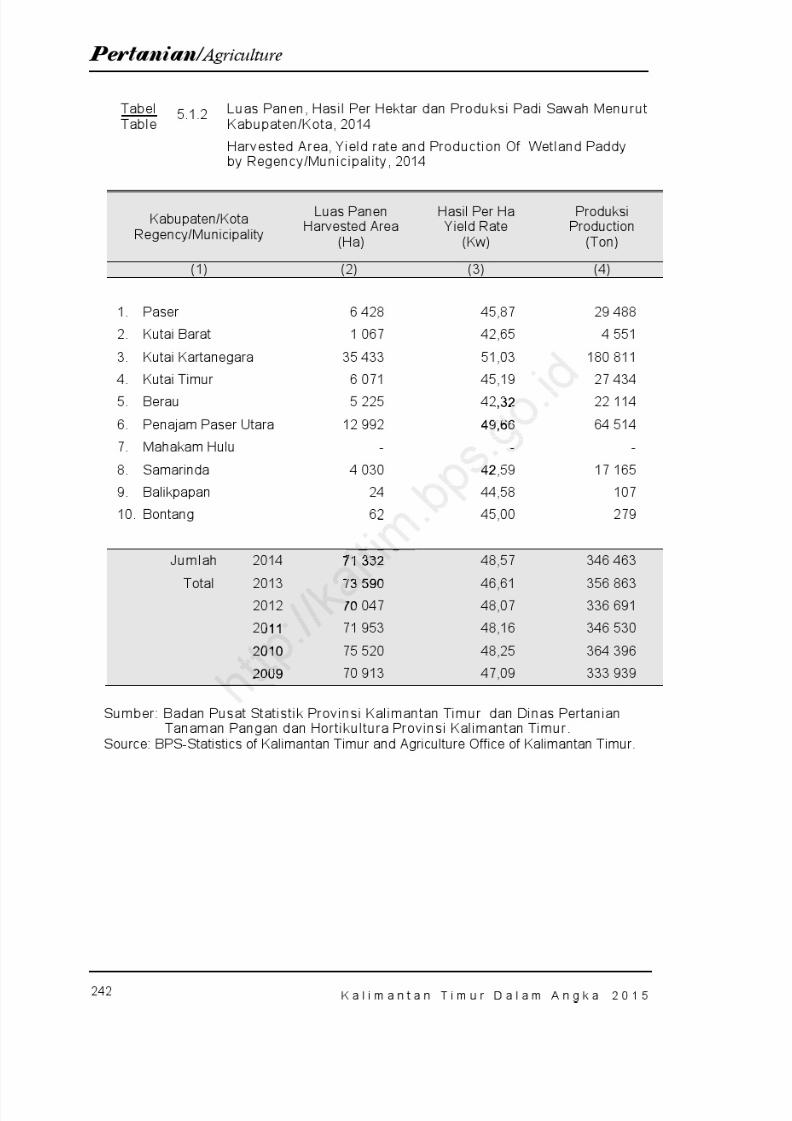
8/20/2019 Kalimantan Timur Dalam Angka Tahun 2015
http://slidepdf.com/reader/full/kalimantan-timur-dalam-angka-tahun-2015 308/623
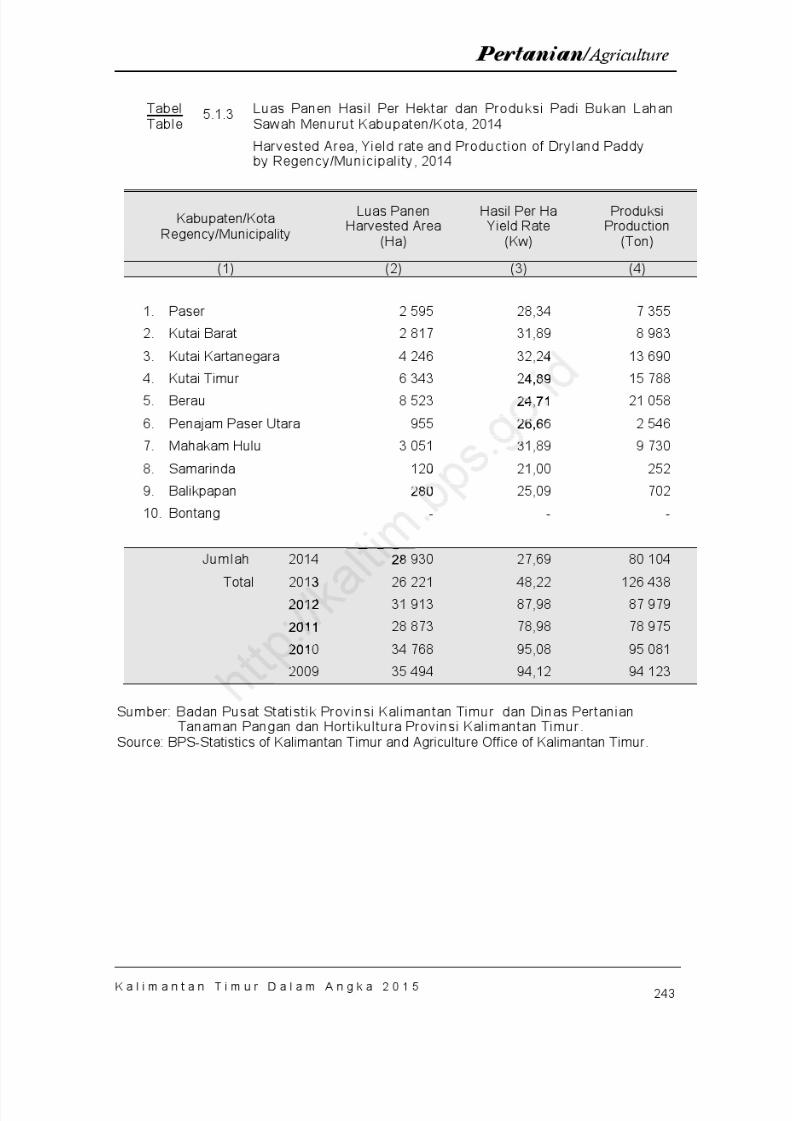
8/20/2019 Kalimantan Timur Dalam Angka Tahun 2015
http://slidepdf.com/reader/full/kalimantan-timur-dalam-angka-tahun-2015 309/623
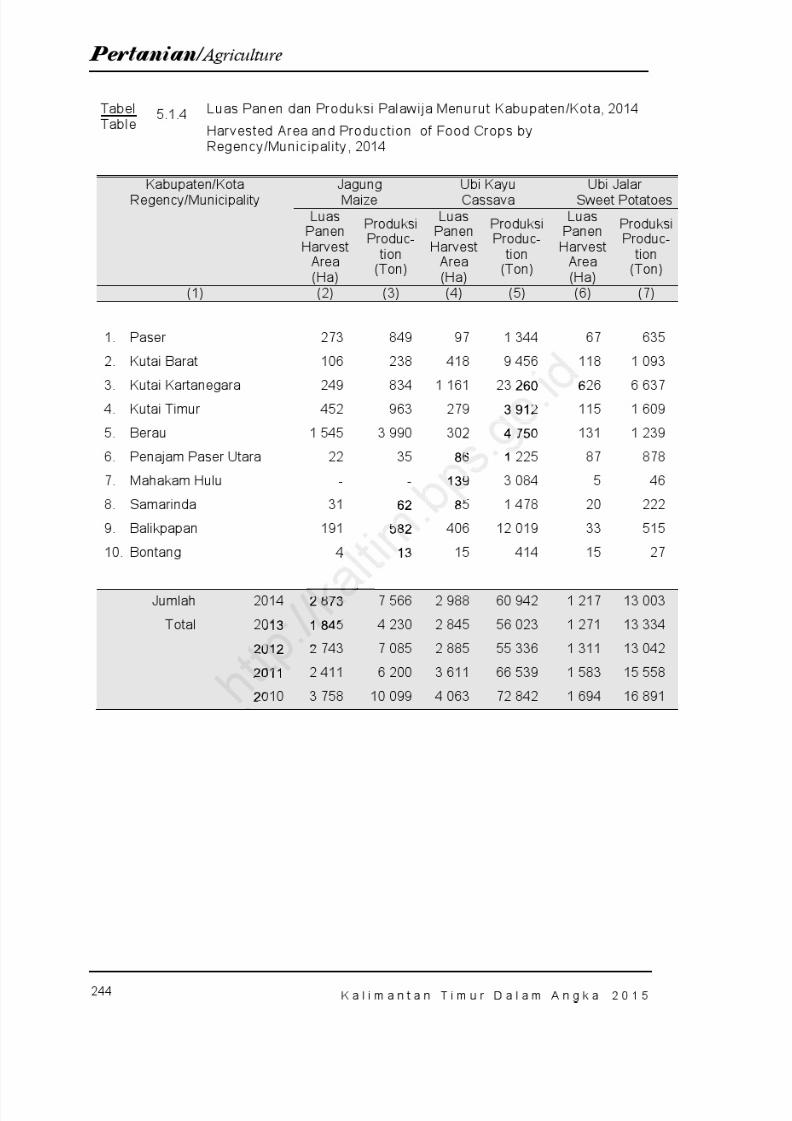
8/20/2019 Kalimantan Timur Dalam Angka Tahun 2015
http://slidepdf.com/reader/full/kalimantan-timur-dalam-angka-tahun-2015 310/623

8/20/2019 Kalimantan Timur Dalam Angka Tahun 2015
http://slidepdf.com/reader/full/kalimantan-timur-dalam-angka-tahun-2015 311/623
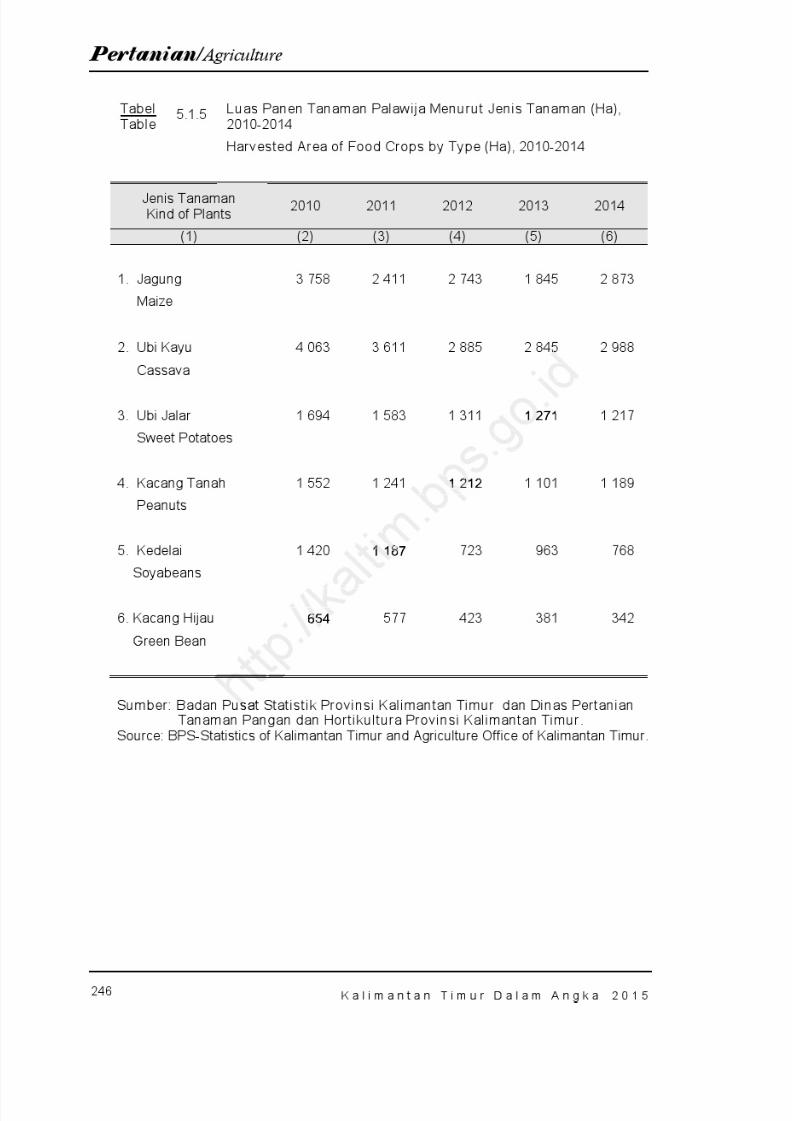
8/20/2019 Kalimantan Timur Dalam Angka Tahun 2015
http://slidepdf.com/reader/full/kalimantan-timur-dalam-angka-tahun-2015 312/623
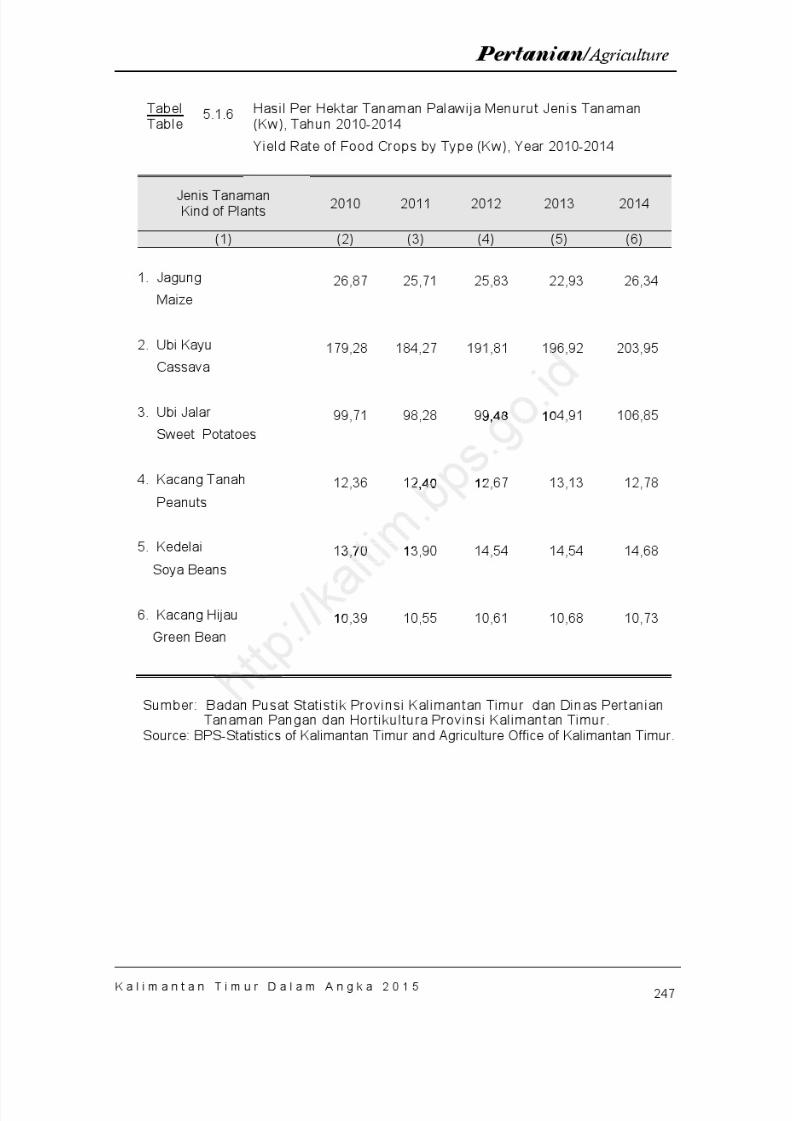
8/20/2019 Kalimantan Timur Dalam Angka Tahun 2015
http://slidepdf.com/reader/full/kalimantan-timur-dalam-angka-tahun-2015 313/623
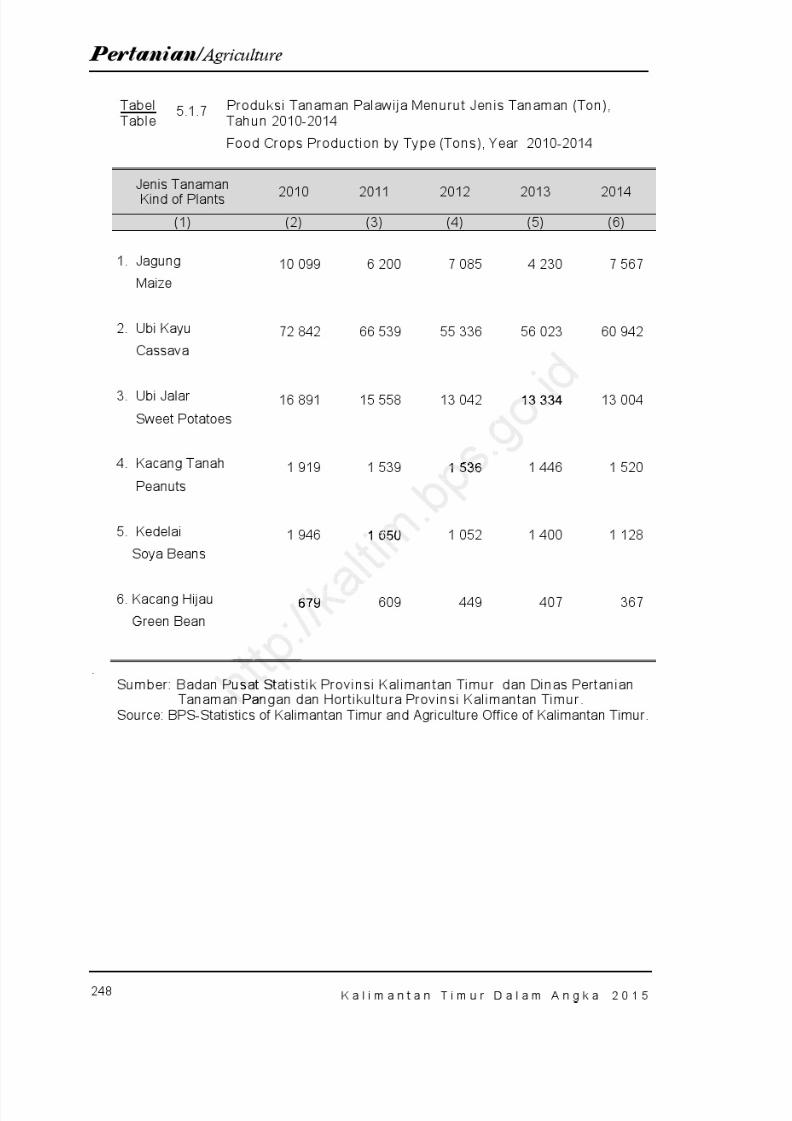
8/20/2019 Kalimantan Timur Dalam Angka Tahun 2015
http://slidepdf.com/reader/full/kalimantan-timur-dalam-angka-tahun-2015 314/623
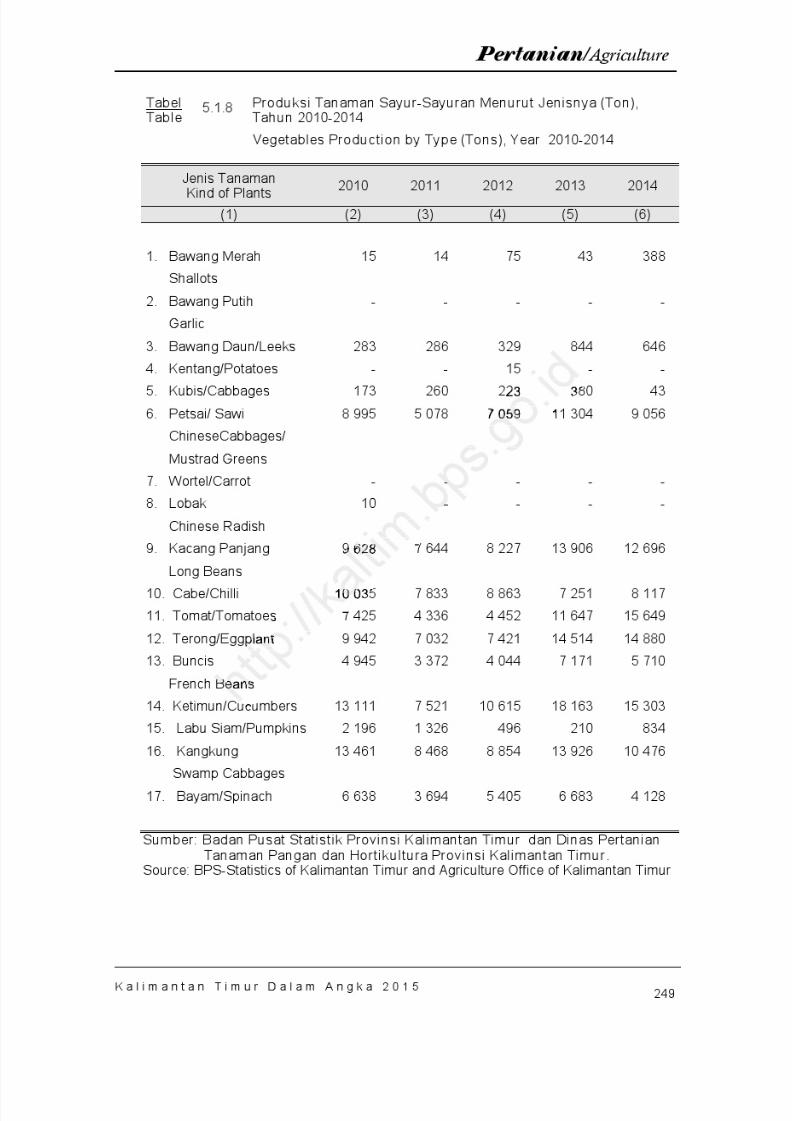
8/20/2019 Kalimantan Timur Dalam Angka Tahun 2015
http://slidepdf.com/reader/full/kalimantan-timur-dalam-angka-tahun-2015 315/623
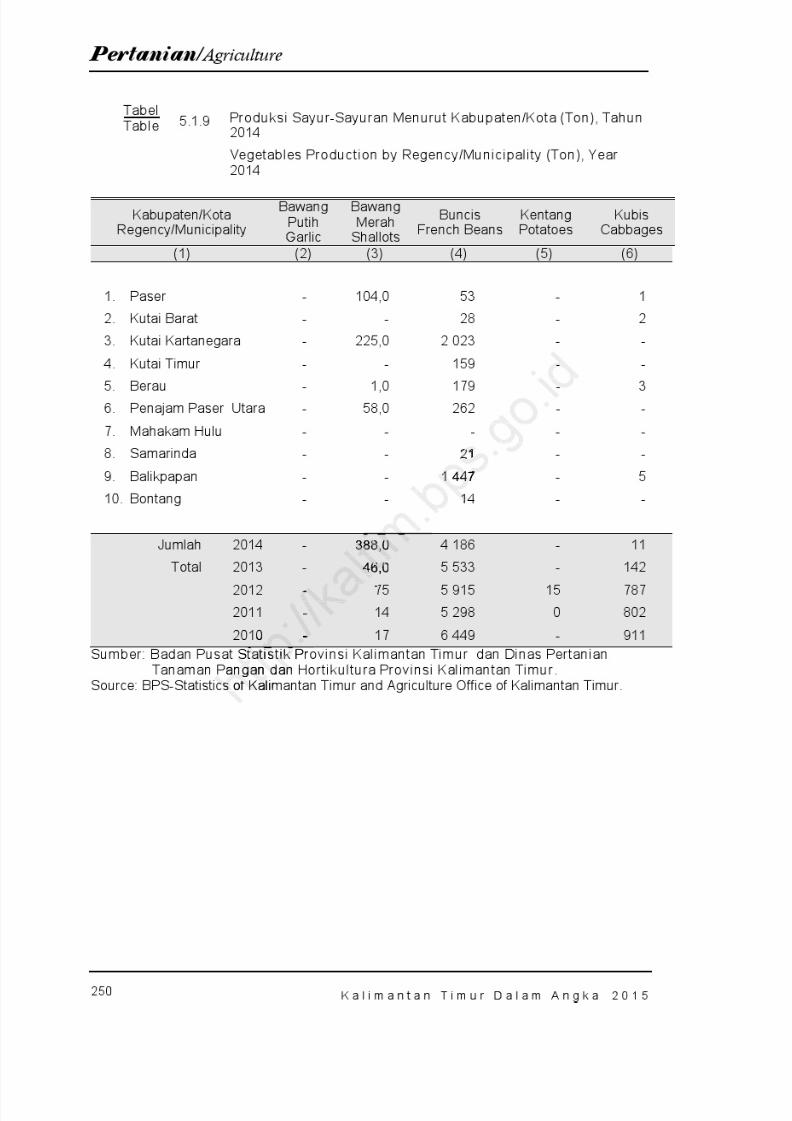
8/20/2019 Kalimantan Timur Dalam Angka Tahun 2015
http://slidepdf.com/reader/full/kalimantan-timur-dalam-angka-tahun-2015 316/623
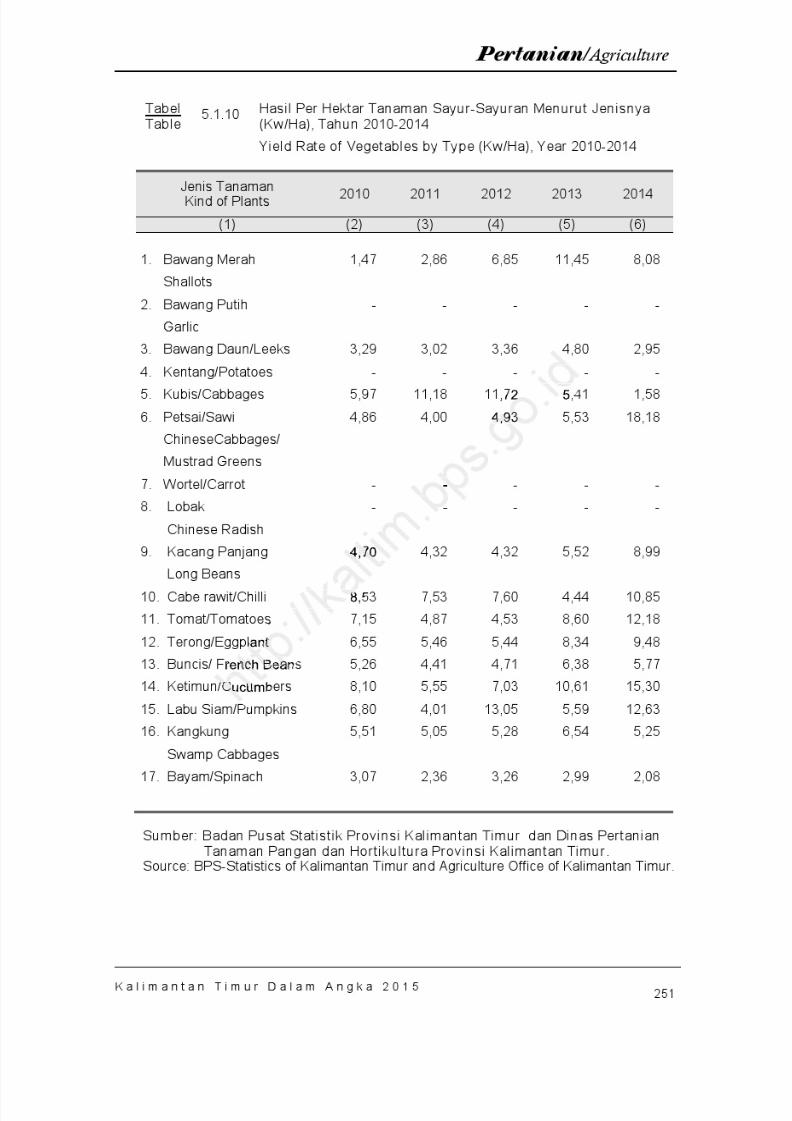
8/20/2019 Kalimantan Timur Dalam Angka Tahun 2015
http://slidepdf.com/reader/full/kalimantan-timur-dalam-angka-tahun-2015 317/623
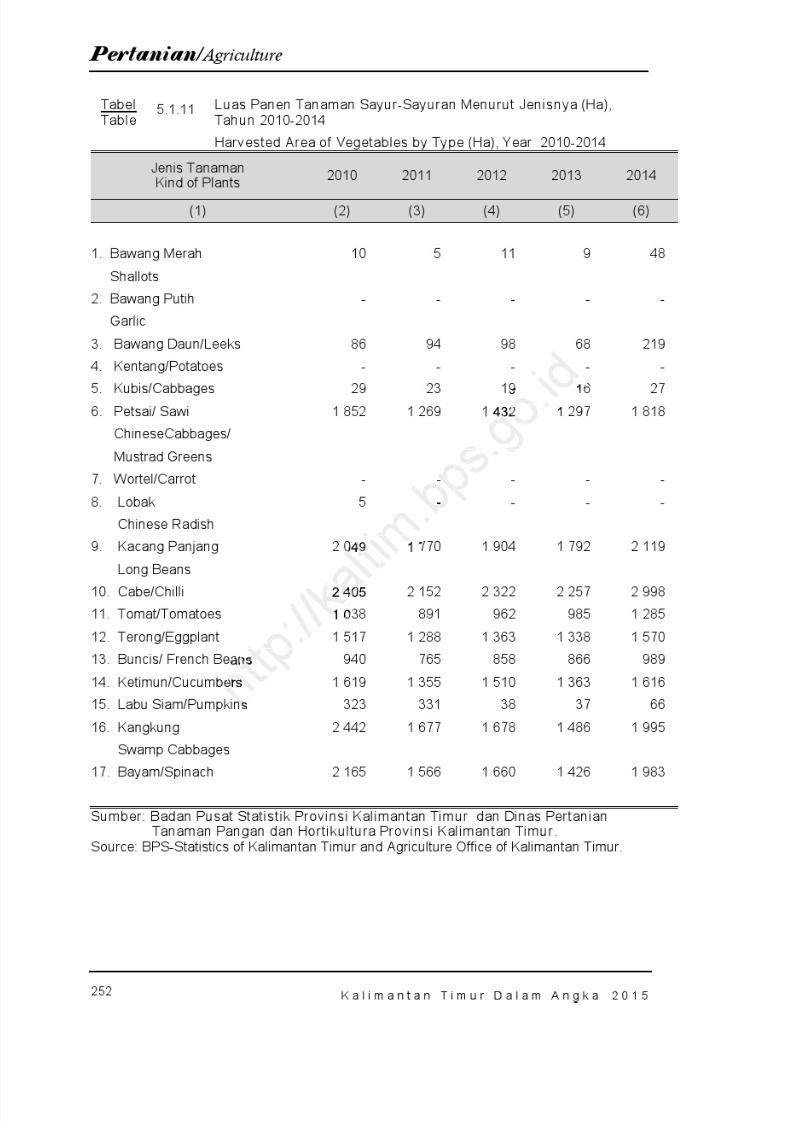
8/20/2019 Kalimantan Timur Dalam Angka Tahun 2015
http://slidepdf.com/reader/full/kalimantan-timur-dalam-angka-tahun-2015 318/623

8/20/2019 Kalimantan Timur Dalam Angka Tahun 2015
http://slidepdf.com/reader/full/kalimantan-timur-dalam-angka-tahun-2015 319/623
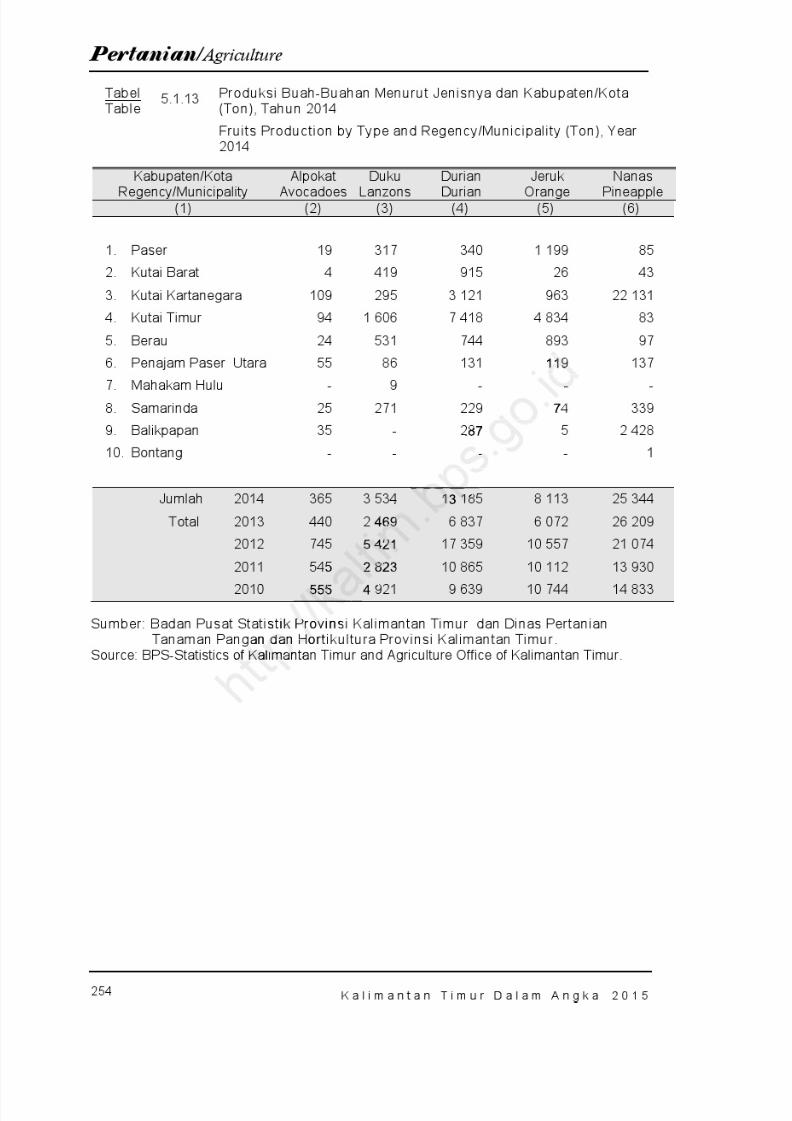
8/20/2019 Kalimantan Timur Dalam Angka Tahun 2015
http://slidepdf.com/reader/full/kalimantan-timur-dalam-angka-tahun-2015 320/623
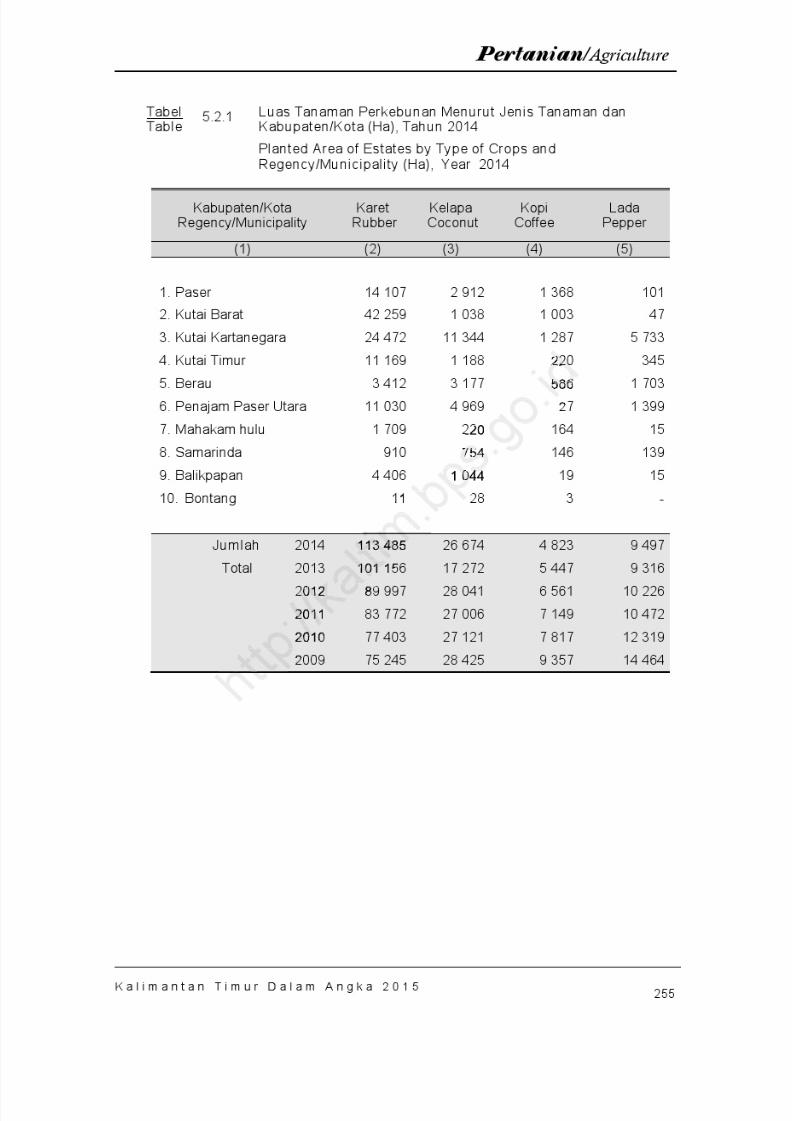
8/20/2019 Kalimantan Timur Dalam Angka Tahun 2015
http://slidepdf.com/reader/full/kalimantan-timur-dalam-angka-tahun-2015 321/623

8/20/2019 Kalimantan Timur Dalam Angka Tahun 2015
http://slidepdf.com/reader/full/kalimantan-timur-dalam-angka-tahun-2015 322/623
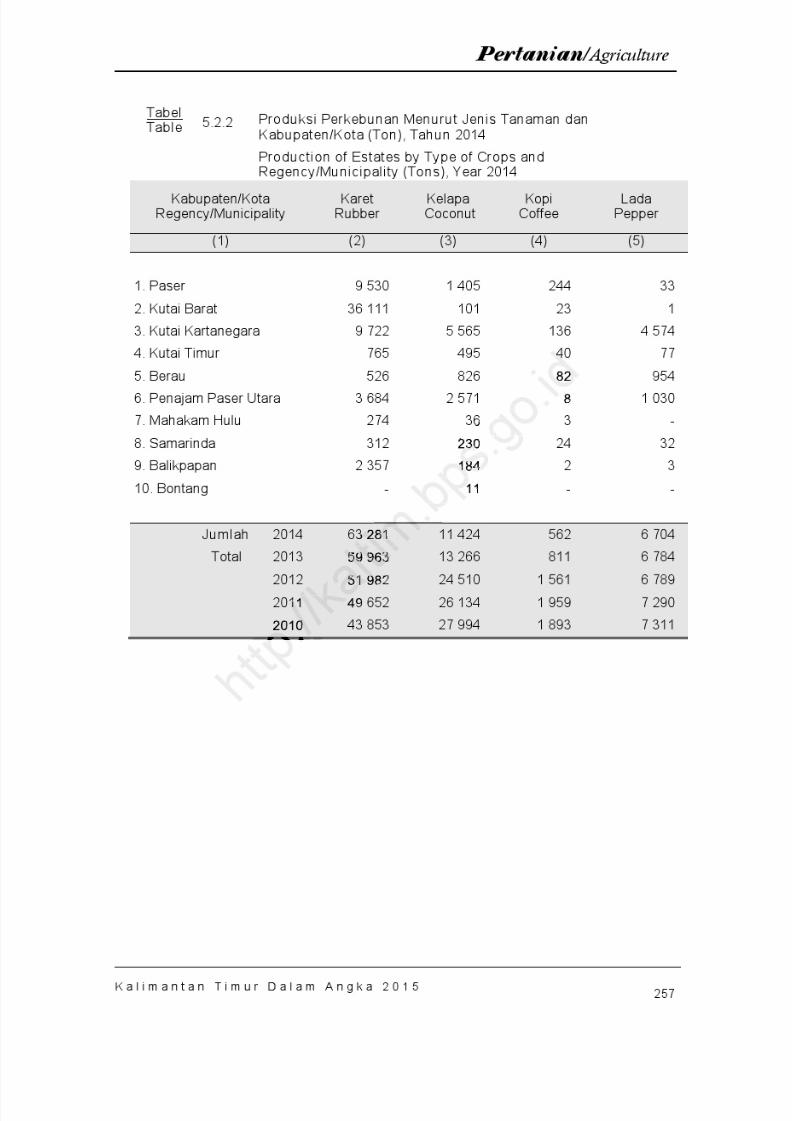
8/20/2019 Kalimantan Timur Dalam Angka Tahun 2015
http://slidepdf.com/reader/full/kalimantan-timur-dalam-angka-tahun-2015 323/623
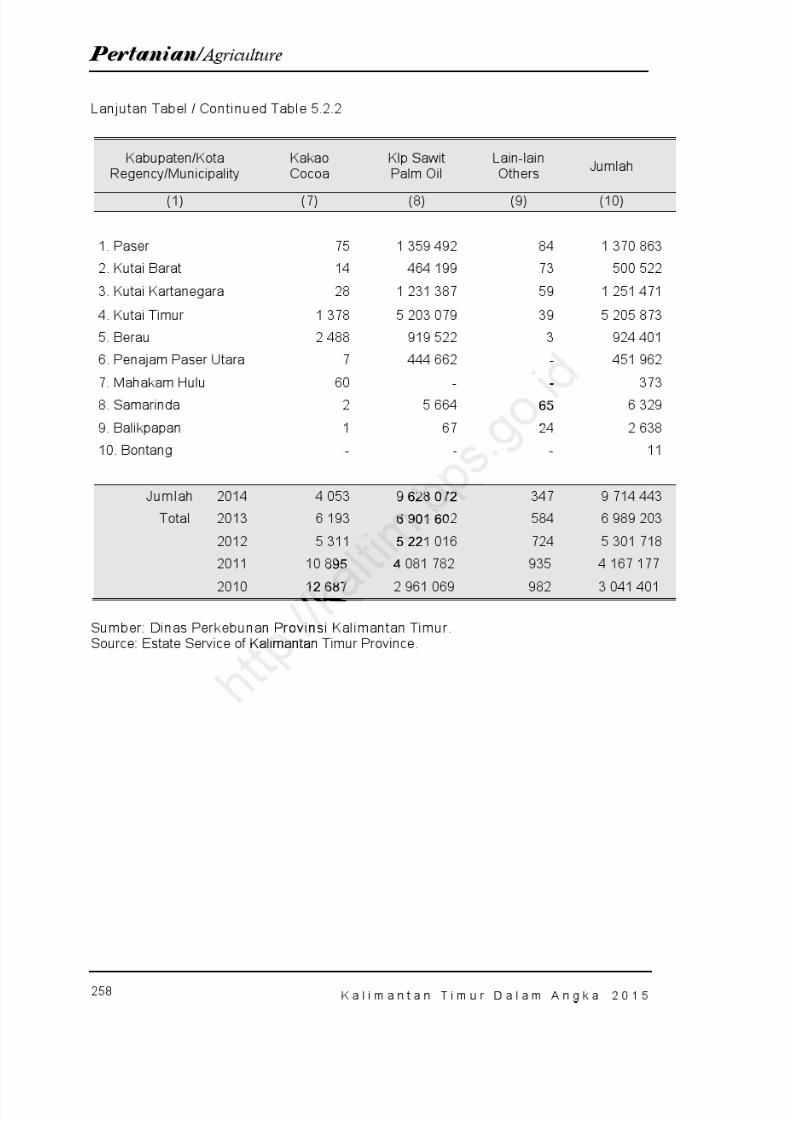
8/20/2019 Kalimantan Timur Dalam Angka Tahun 2015
http://slidepdf.com/reader/full/kalimantan-timur-dalam-angka-tahun-2015 324/623

8/20/2019 Kalimantan Timur Dalam Angka Tahun 2015
http://slidepdf.com/reader/full/kalimantan-timur-dalam-angka-tahun-2015 325/623
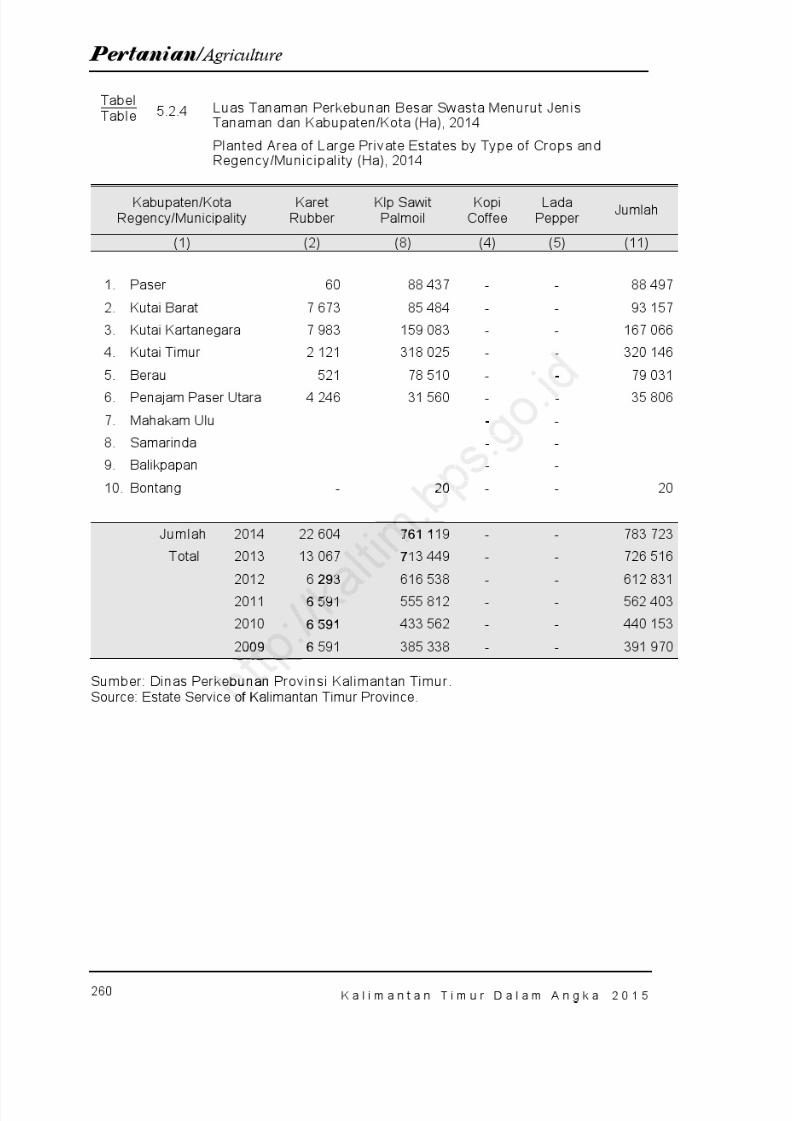
8/20/2019 Kalimantan Timur Dalam Angka Tahun 2015
http://slidepdf.com/reader/full/kalimantan-timur-dalam-angka-tahun-2015 326/623
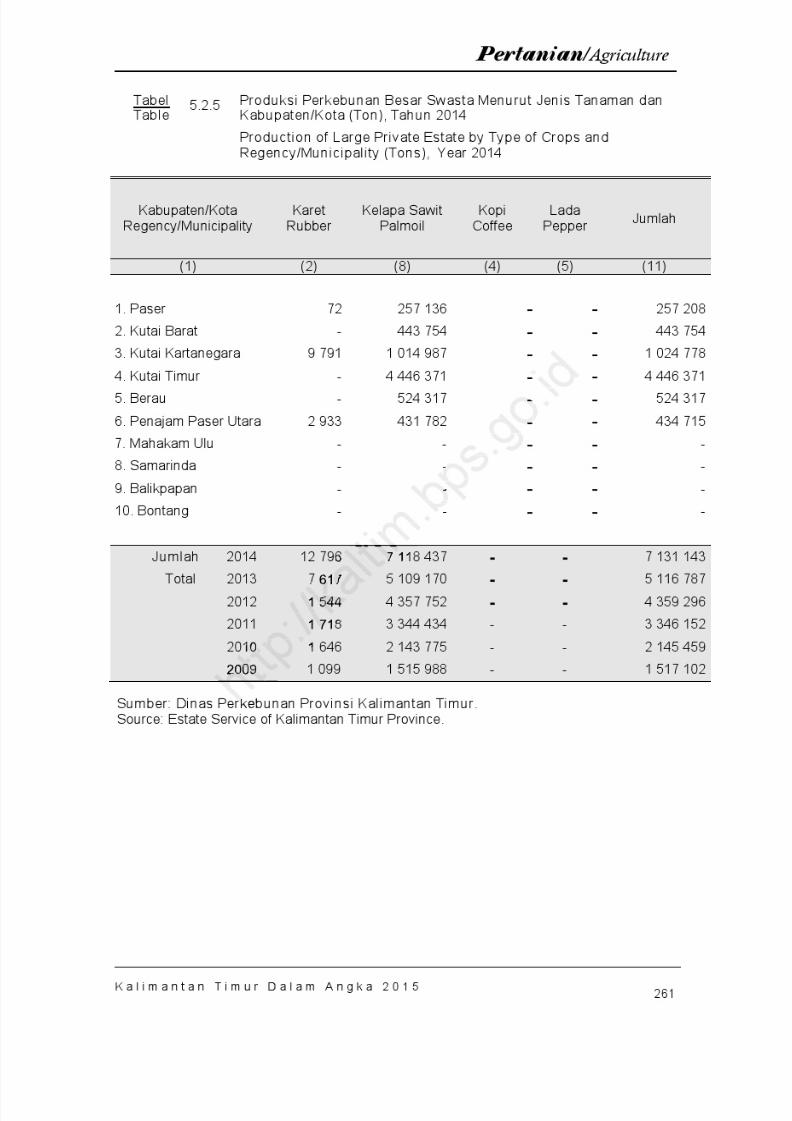
8/20/2019 Kalimantan Timur Dalam Angka Tahun 2015
http://slidepdf.com/reader/full/kalimantan-timur-dalam-angka-tahun-2015 327/623
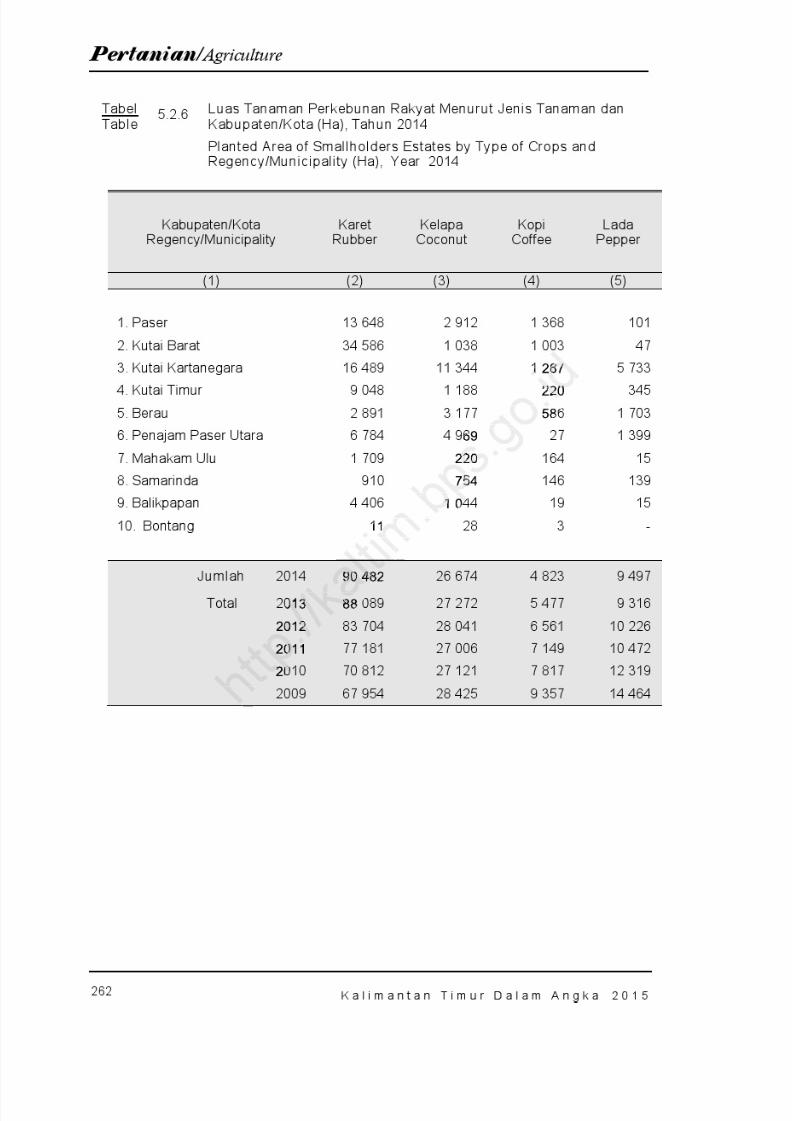
8/20/2019 Kalimantan Timur Dalam Angka Tahun 2015
http://slidepdf.com/reader/full/kalimantan-timur-dalam-angka-tahun-2015 328/623
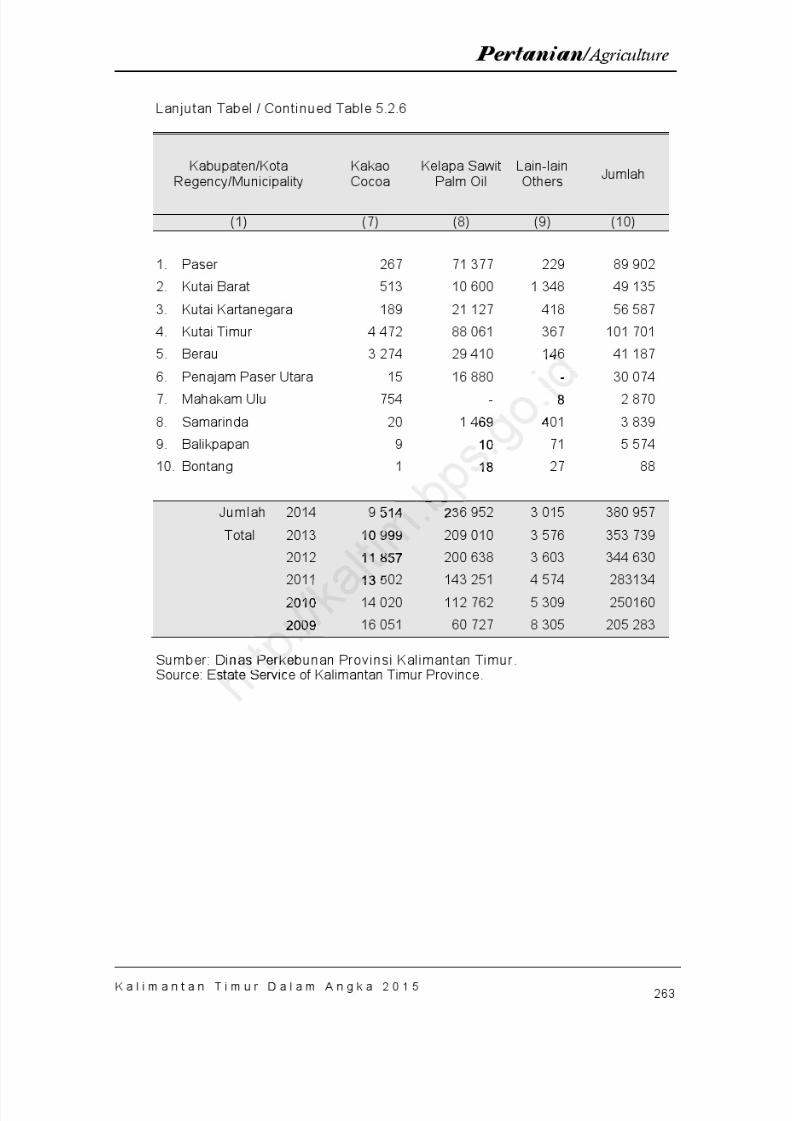
8/20/2019 Kalimantan Timur Dalam Angka Tahun 2015
http://slidepdf.com/reader/full/kalimantan-timur-dalam-angka-tahun-2015 329/623
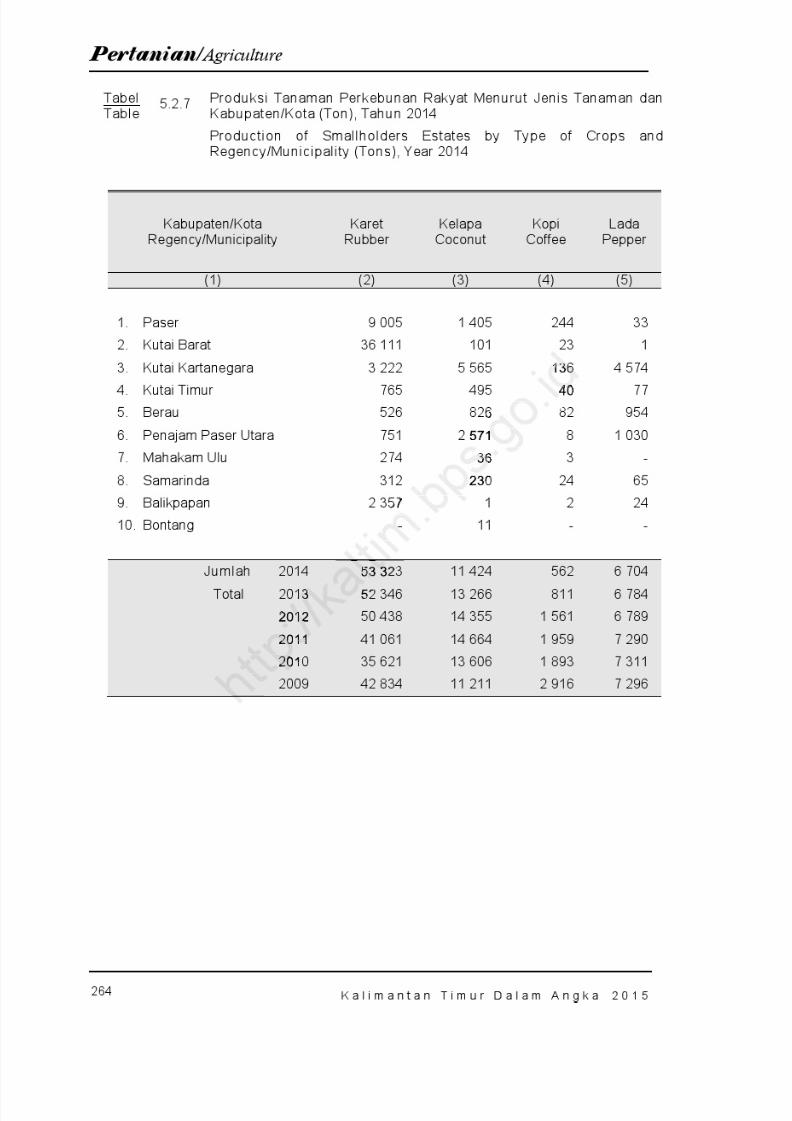
8/20/2019 Kalimantan Timur Dalam Angka Tahun 2015
http://slidepdf.com/reader/full/kalimantan-timur-dalam-angka-tahun-2015 330/623
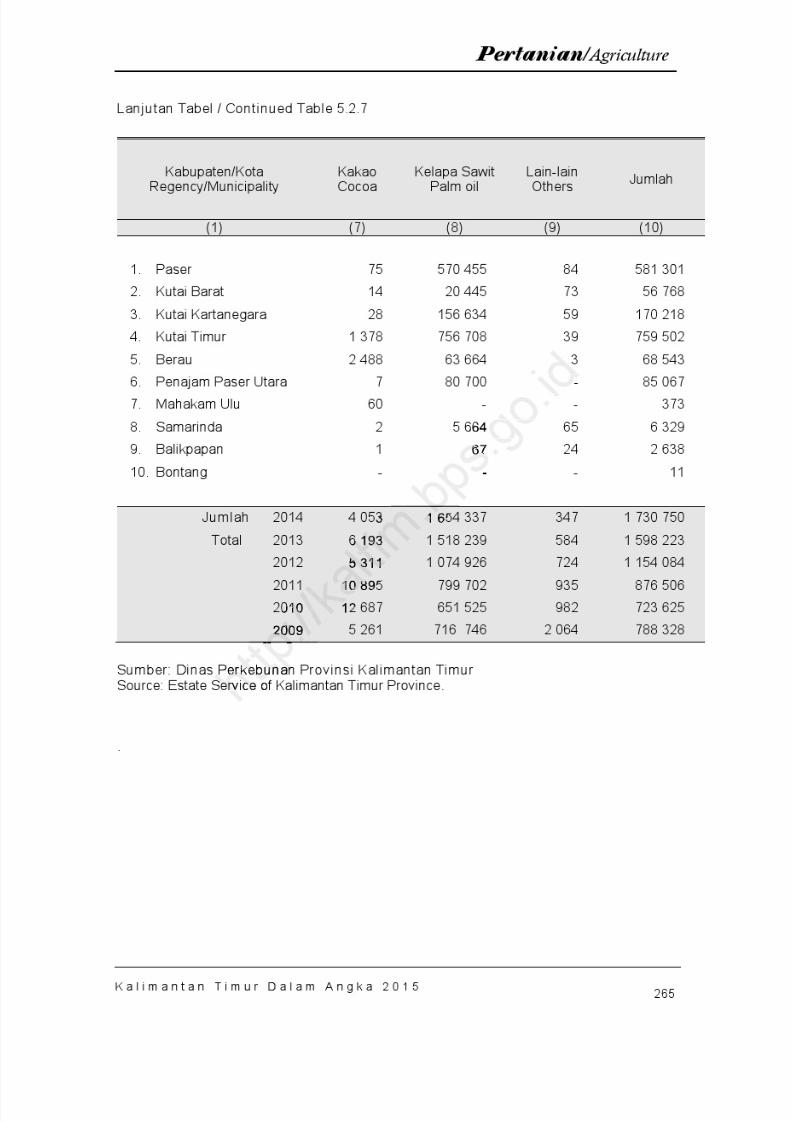
8/20/2019 Kalimantan Timur Dalam Angka Tahun 2015
http://slidepdf.com/reader/full/kalimantan-timur-dalam-angka-tahun-2015 331/623
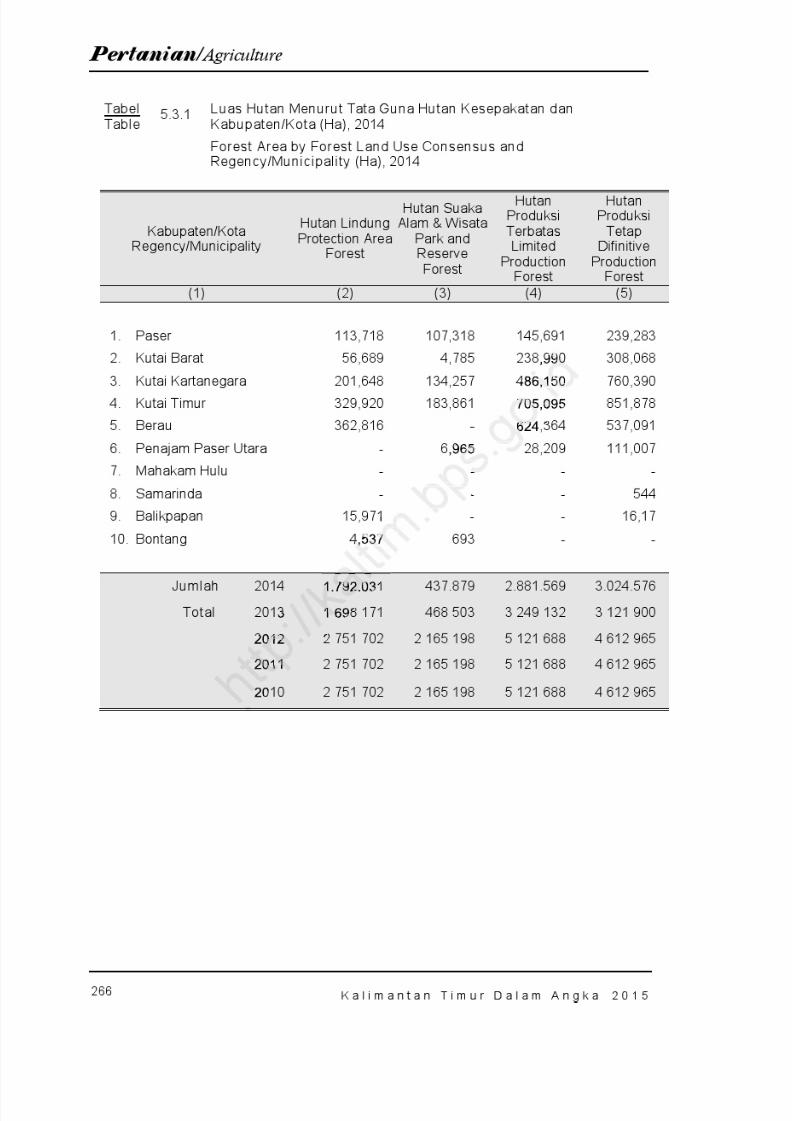
8/20/2019 Kalimantan Timur Dalam Angka Tahun 2015
http://slidepdf.com/reader/full/kalimantan-timur-dalam-angka-tahun-2015 332/623
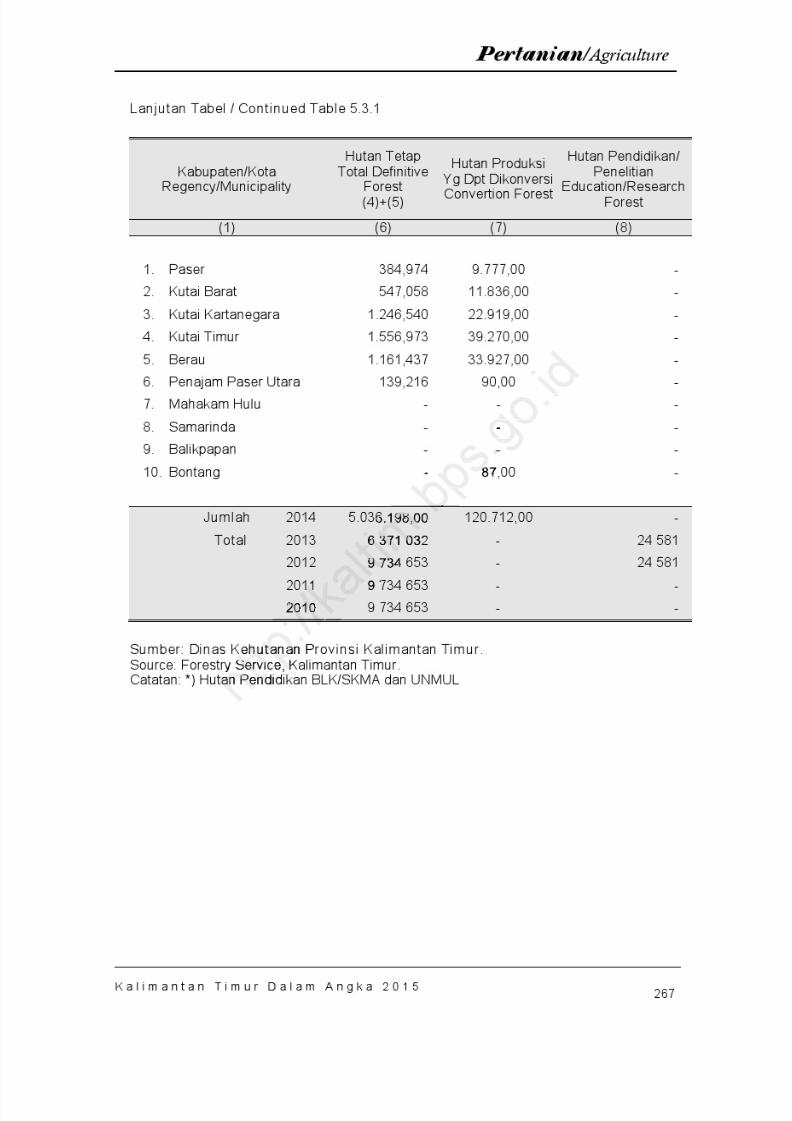
8/20/2019 Kalimantan Timur Dalam Angka Tahun 2015
http://slidepdf.com/reader/full/kalimantan-timur-dalam-angka-tahun-2015 333/623
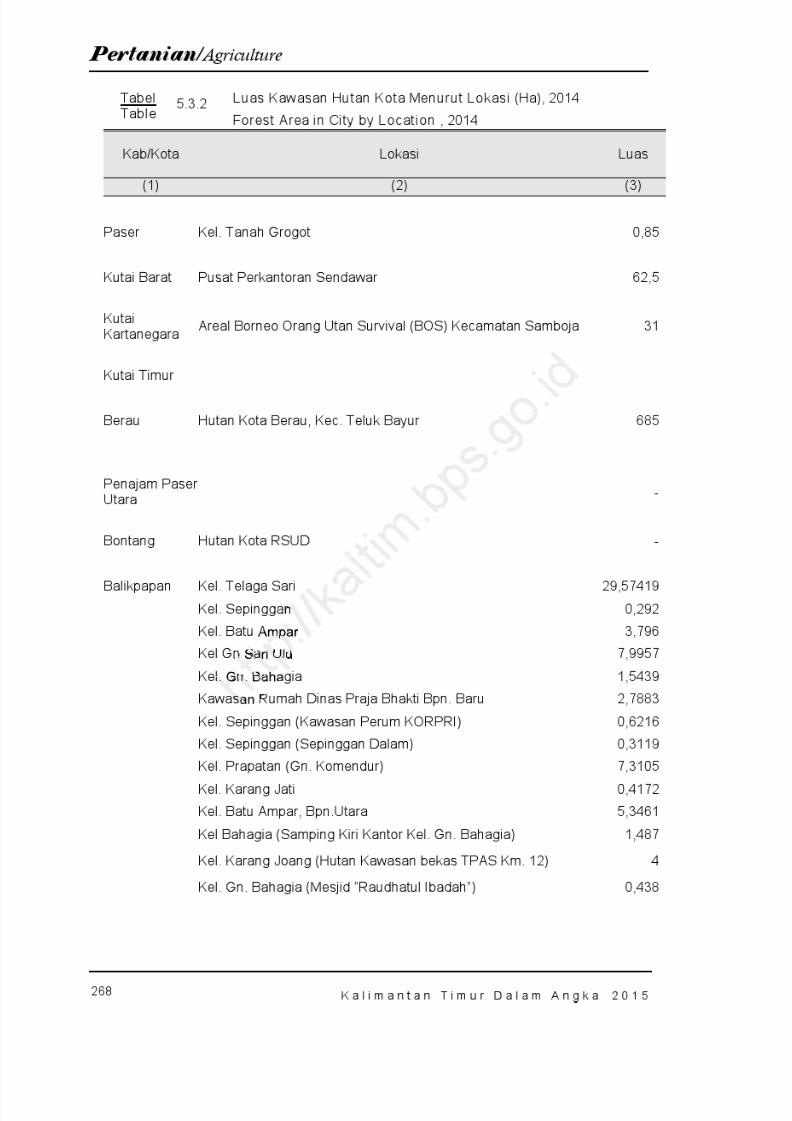
8/20/2019 Kalimantan Timur Dalam Angka Tahun 2015
http://slidepdf.com/reader/full/kalimantan-timur-dalam-angka-tahun-2015 334/623

8/20/2019 Kalimantan Timur Dalam Angka Tahun 2015
http://slidepdf.com/reader/full/kalimantan-timur-dalam-angka-tahun-2015 335/623

8/20/2019 Kalimantan Timur Dalam Angka Tahun 2015
http://slidepdf.com/reader/full/kalimantan-timur-dalam-angka-tahun-2015 336/623
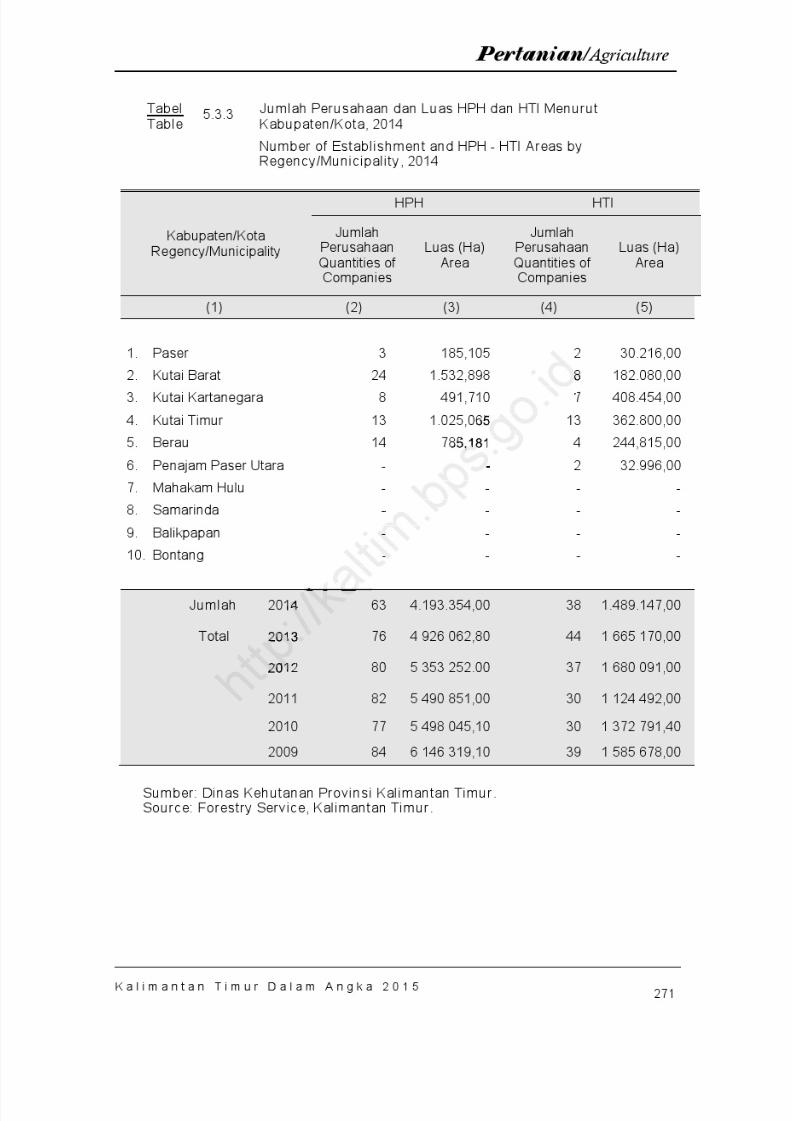
8/20/2019 Kalimantan Timur Dalam Angka Tahun 2015
http://slidepdf.com/reader/full/kalimantan-timur-dalam-angka-tahun-2015 337/623
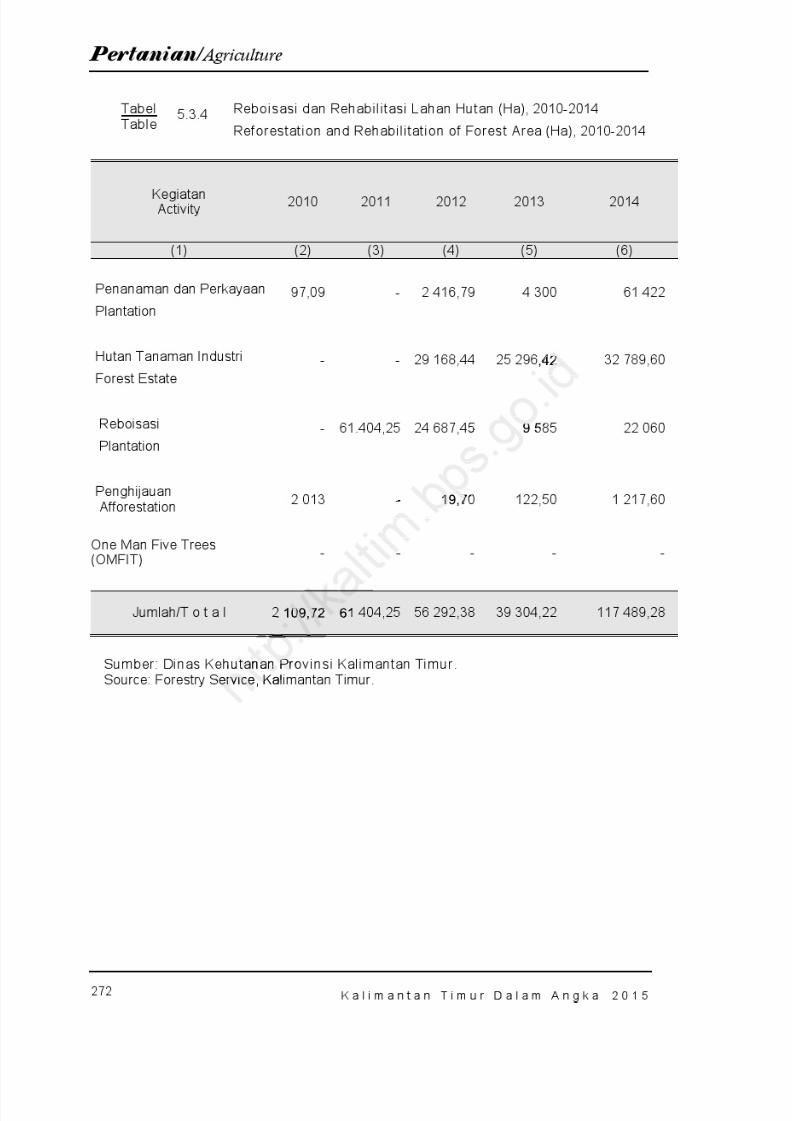
8/20/2019 Kalimantan Timur Dalam Angka Tahun 2015
http://slidepdf.com/reader/full/kalimantan-timur-dalam-angka-tahun-2015 338/623
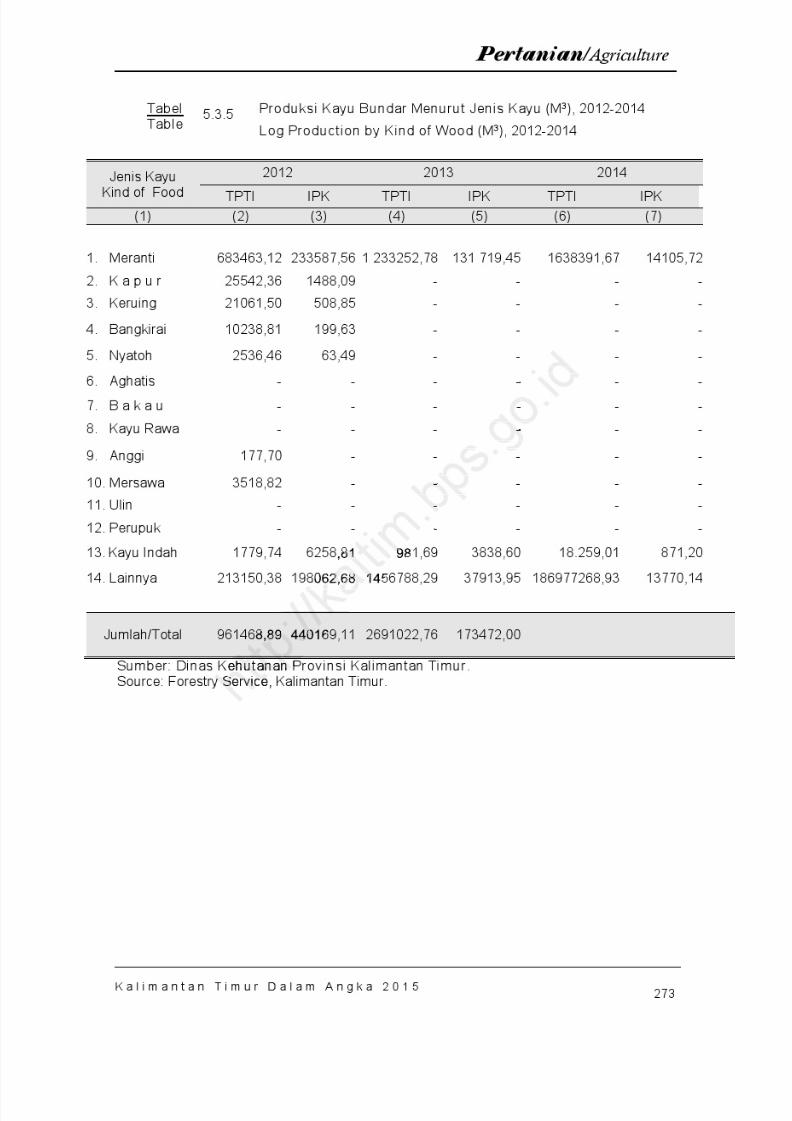
8/20/2019 Kalimantan Timur Dalam Angka Tahun 2015
http://slidepdf.com/reader/full/kalimantan-timur-dalam-angka-tahun-2015 339/623

8/20/2019 Kalimantan Timur Dalam Angka Tahun 2015
http://slidepdf.com/reader/full/kalimantan-timur-dalam-angka-tahun-2015 340/623
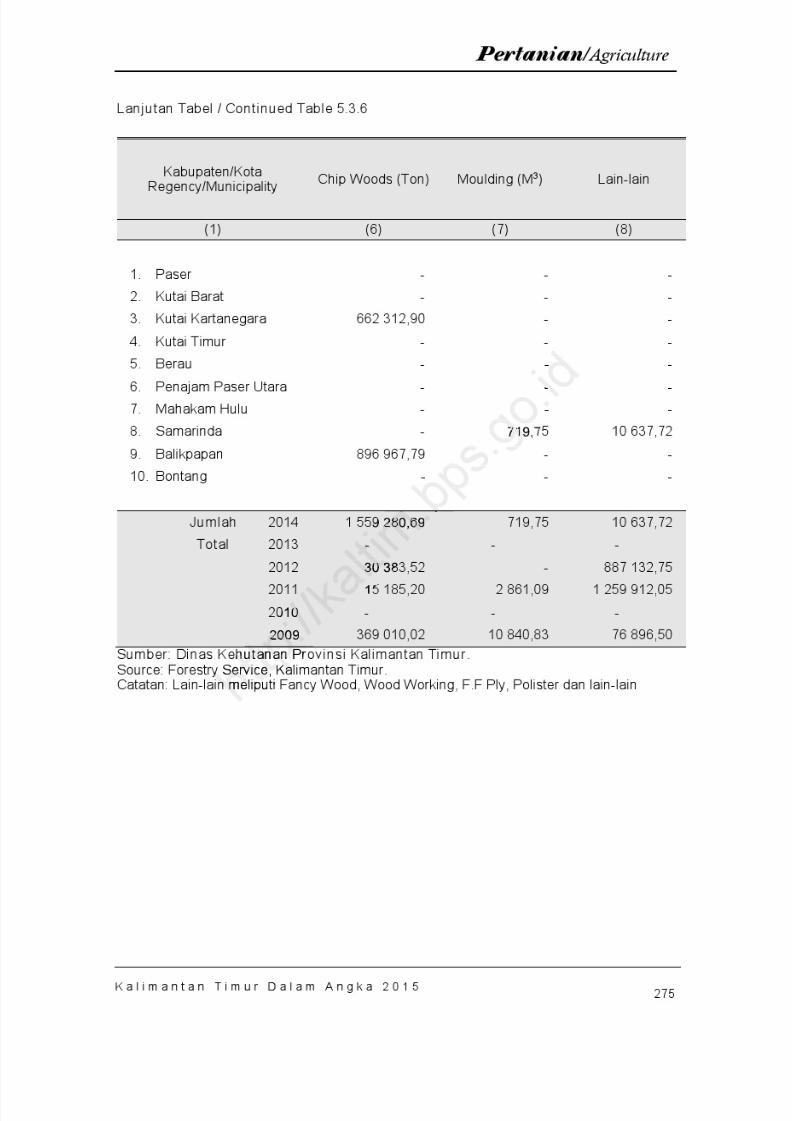
8/20/2019 Kalimantan Timur Dalam Angka Tahun 2015
http://slidepdf.com/reader/full/kalimantan-timur-dalam-angka-tahun-2015 341/623

8/20/2019 Kalimantan Timur Dalam Angka Tahun 2015
http://slidepdf.com/reader/full/kalimantan-timur-dalam-angka-tahun-2015 342/623
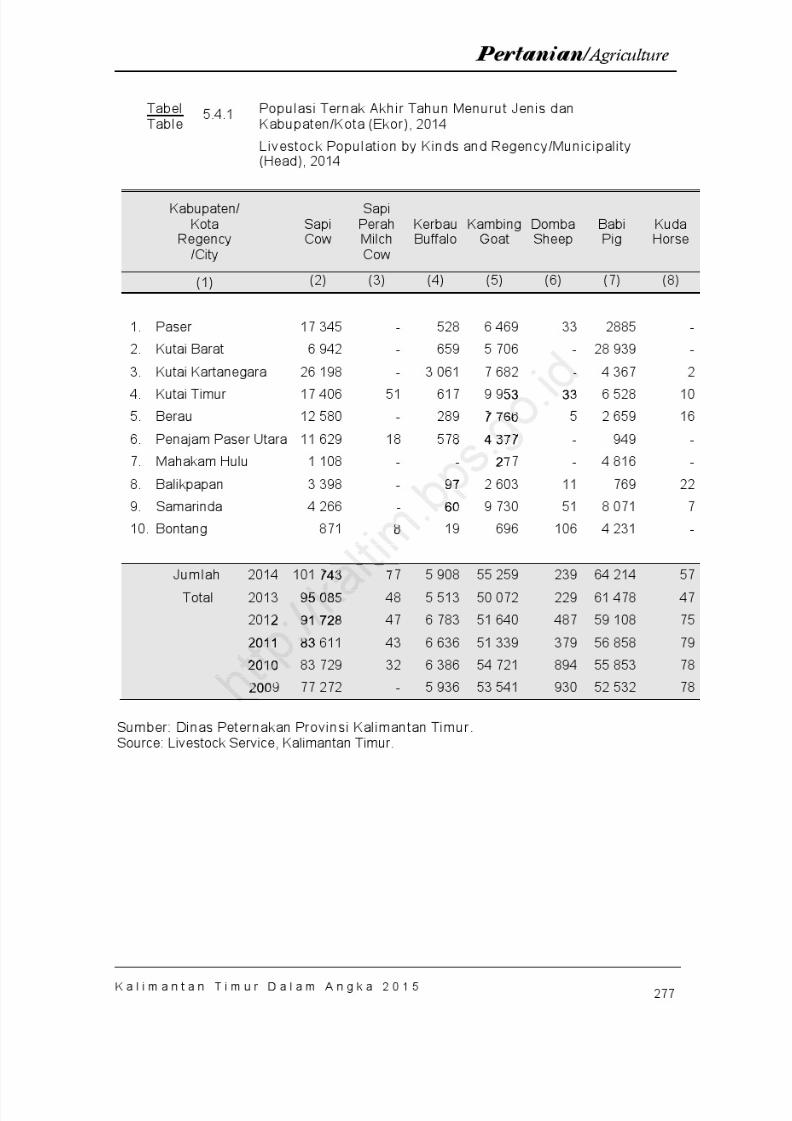
8/20/2019 Kalimantan Timur Dalam Angka Tahun 2015
http://slidepdf.com/reader/full/kalimantan-timur-dalam-angka-tahun-2015 343/623
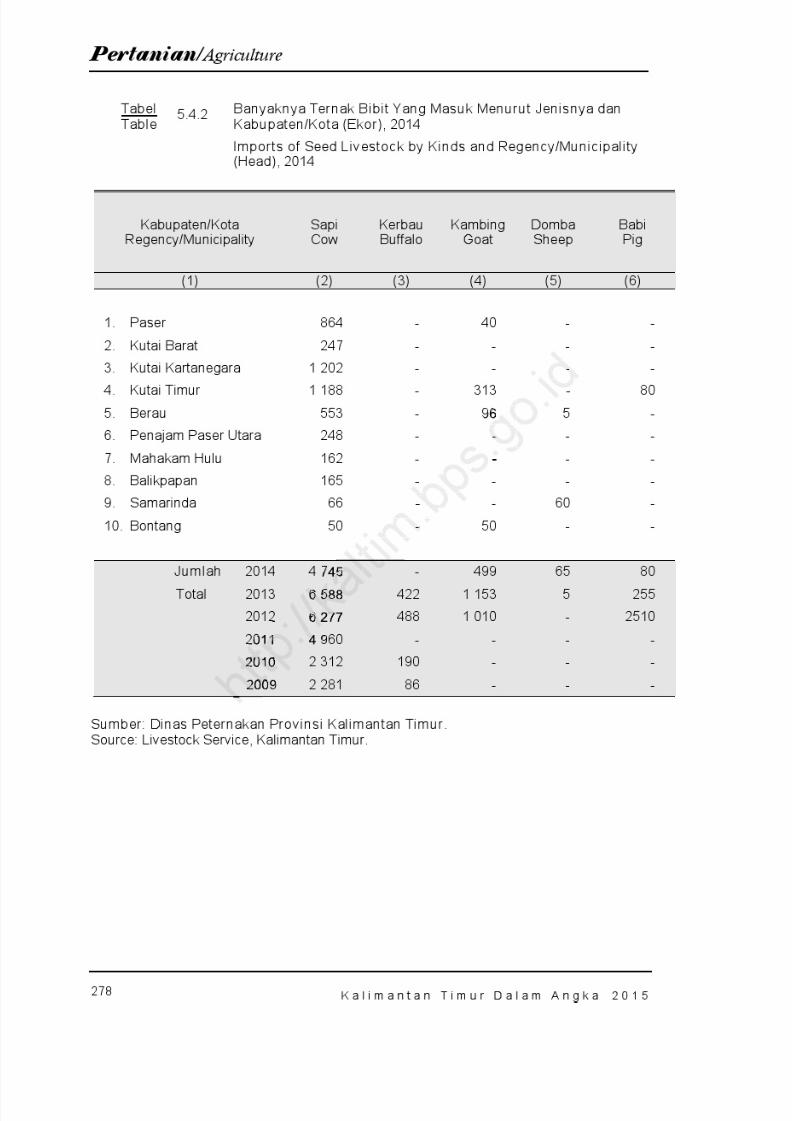
8/20/2019 Kalimantan Timur Dalam Angka Tahun 2015
http://slidepdf.com/reader/full/kalimantan-timur-dalam-angka-tahun-2015 344/623
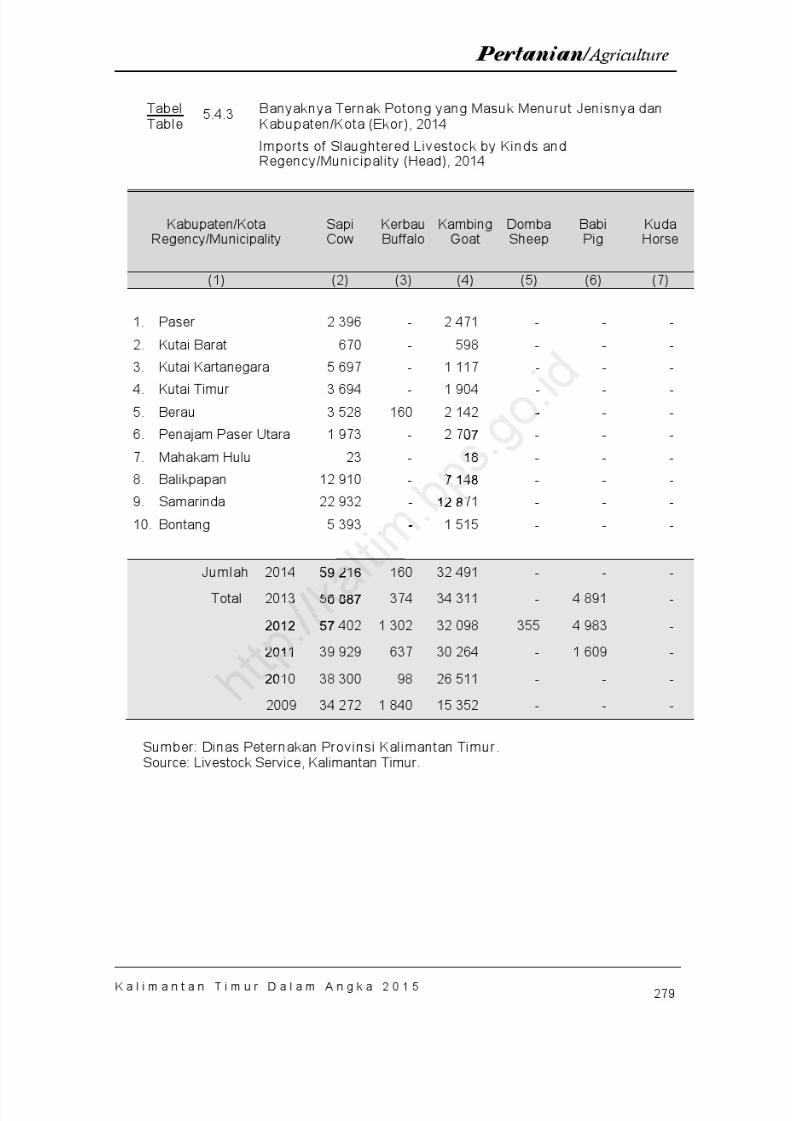
8/20/2019 Kalimantan Timur Dalam Angka Tahun 2015
http://slidepdf.com/reader/full/kalimantan-timur-dalam-angka-tahun-2015 345/623
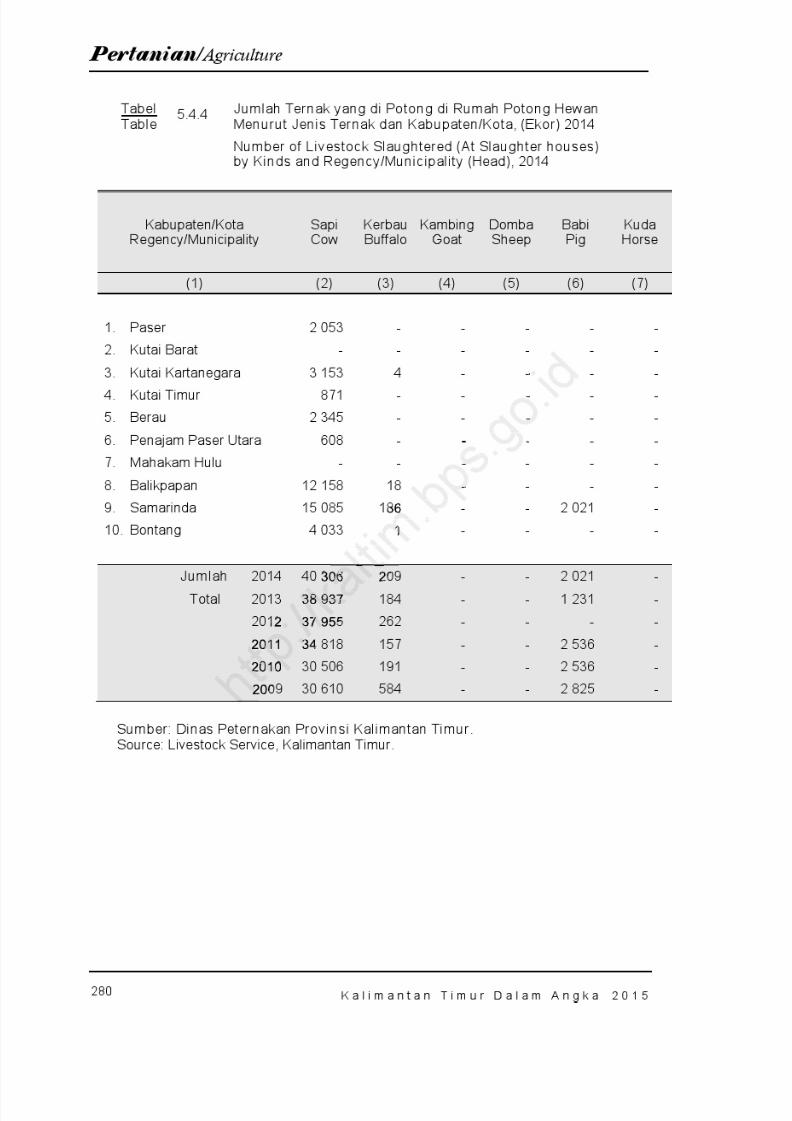
8/20/2019 Kalimantan Timur Dalam Angka Tahun 2015
http://slidepdf.com/reader/full/kalimantan-timur-dalam-angka-tahun-2015 346/623
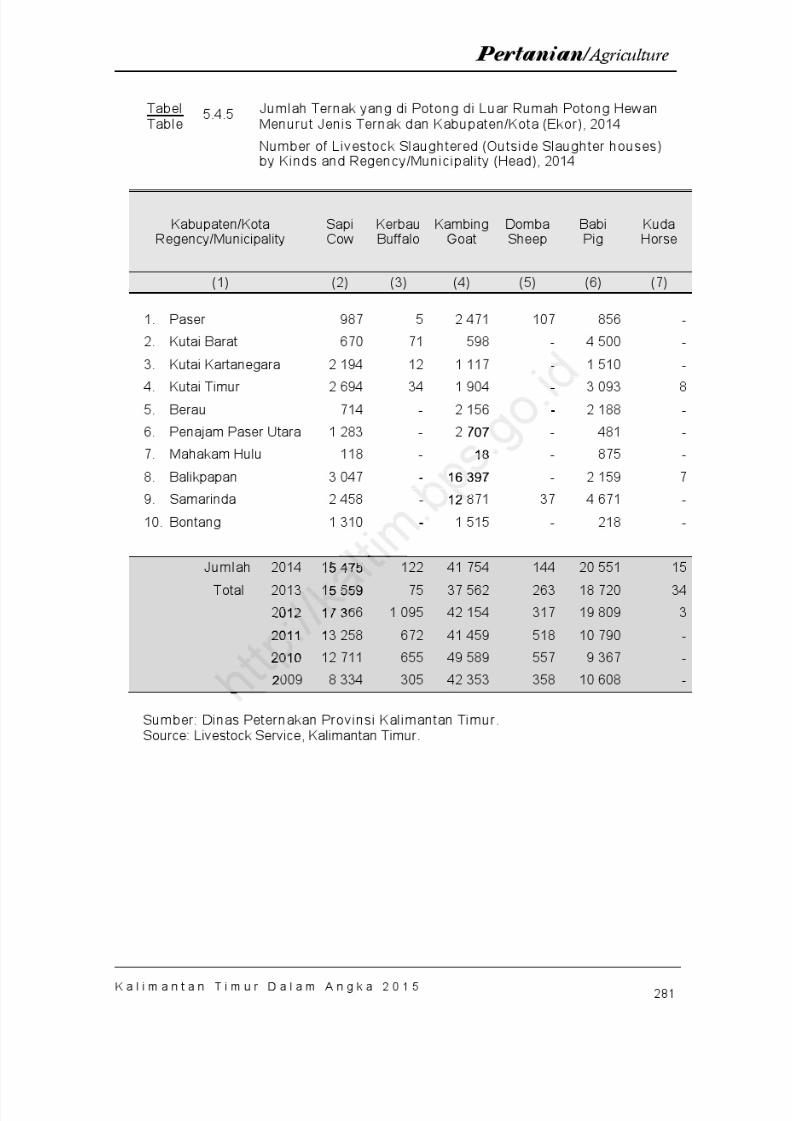
8/20/2019 Kalimantan Timur Dalam Angka Tahun 2015
http://slidepdf.com/reader/full/kalimantan-timur-dalam-angka-tahun-2015 347/623
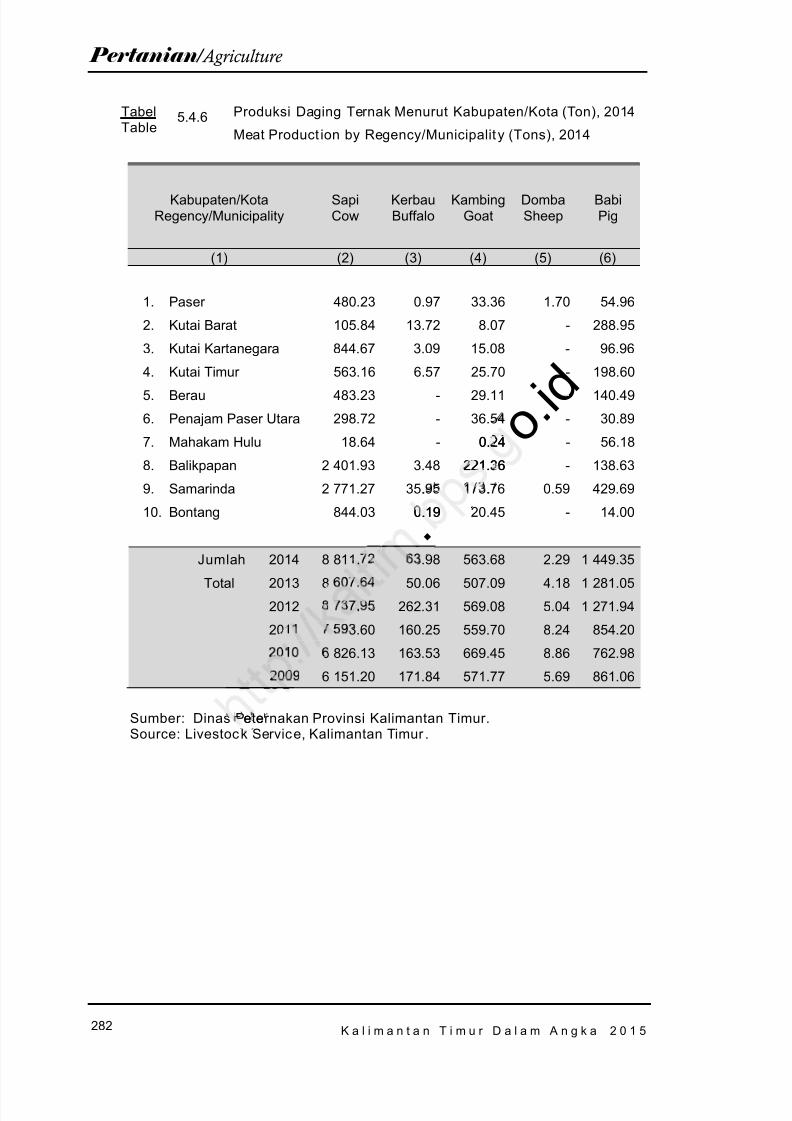
8/20/2019 Kalimantan Timur Dalam Angka Tahun 2015
http://slidepdf.com/reader/full/kalimantan-timur-dalam-angka-tahun-2015 348/623
282
Pertanian / Agriculture
K a l i m a n t a n T i m u r D a l a m A n g k a 2 0 1 5
TabelTable
5.4.6 Produksi Daging Ternak Menurut Kabupaten/Kota (Ton), 2014
Meat Product ion by Regency/Municipalit y (Tons), 2014
Kabupaten/KotaRegency/Municipality
SapiCow
KerbauBuffalo
KambingGoat
DombaSheep
BabiPig
(1) (2) (3) (4) (5) (6)
1. Paser 480.23 0.97 33.36 1.70 54.96
2. Kutai Barat 105.84 13.72 8.07 - 288.95
3. Kutai Kartanegara 844.67 3.09 15.08 - 96.96
4. Kutai Timur 563.16 6.57 25.70 - 198.60
5. Berau 483.23 - 29.11 - 140.49
6. Penajam Paser Utara 298.72 - 36.54 - 30.89
7. Mahakam Hulu 18.64 - 0.24 - 56.18
8. Balikpapan 2 401.93 3.48 221.36 - 138.63
9. Samarinda 2 771.27 35.95 173.76 0.59 429.69
10. Bontang 844.03 0.19 20.45 - 14.00
Jumlah 2014 8 811.72 63.98 563.68 2.29 1 449.35
Total 2013 8 607.64 50.06 507.09 4.18 1 281.05
2012 8 737.95 262.31 569.08 5.04 1 271.94
2011 7 593.60 160.25 559.70 8.24 854.20
2010 6 826.13 163.53 669.45 8.86 762.98
2009 6 151.20 171.84 571.77 5.69 861.06
Sumber: Dinas Peternakan Provinsi Kalimantan Timur.Source: Livestock Service, Kalimantan Timur .
.
o . i d--0.24
221.36
. .
0.19.
.
.
e e
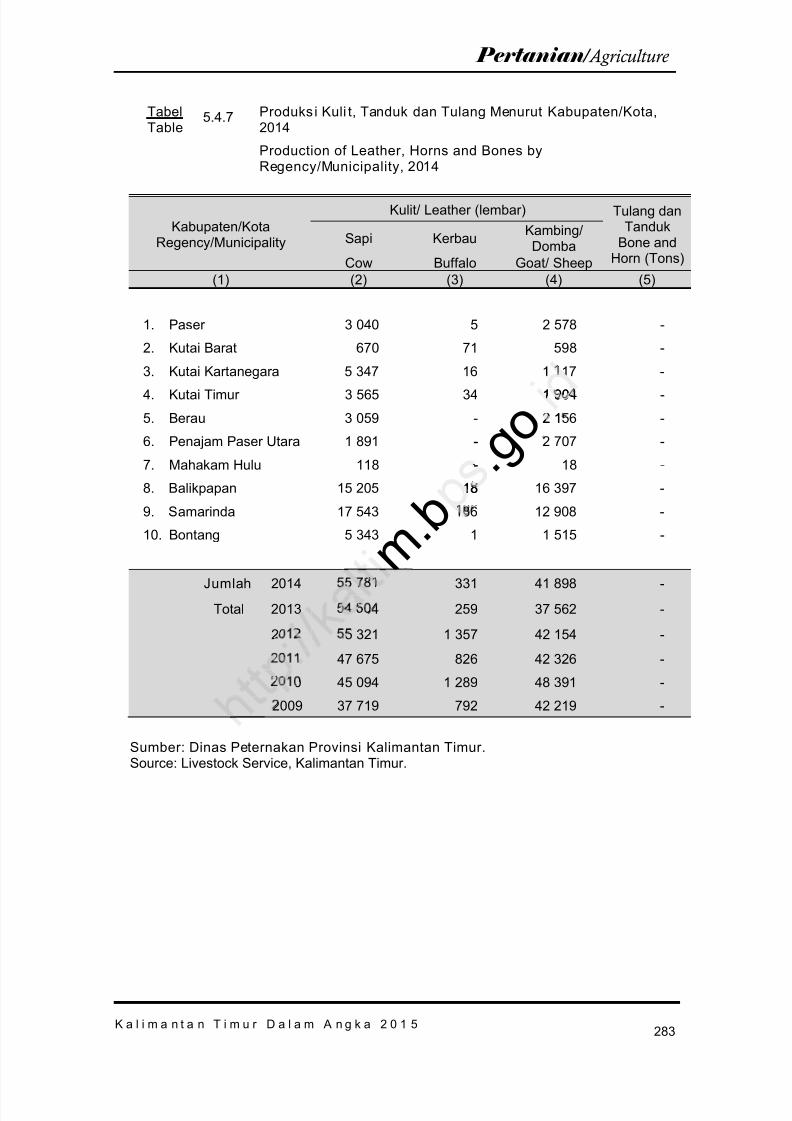
8/20/2019 Kalimantan Timur Dalam Angka Tahun 2015
http://slidepdf.com/reader/full/kalimantan-timur-dalam-angka-tahun-2015 349/623
283K a l i m a n t a n T i m u r D a l a m A n g k a 2 0 1 5
Pertanian / Agriculture
TabelTable
5.4.7 Produks i Kuli t, Tanduk dan Tulang Menurut Kabupaten/Kota,2014
Production of Leather, Horns and Bones byRegency/Municipality, 2014
Kabupaten/KotaRegency/Municipality
Kulit/ Leather (lembar) Tulang danTanduk
Bone andHorn (Tons)
Sapi Kerbau Kambing/Domba
Cow Buffalo Goat/ Sheep(1) (2) (3) (4) (5)
1. Paser 3 040 5 2 578 -
2. Kutai Barat 670 71 598 -
3. Kutai Kartanegara 5 347 16 1 117 -
4. Kutai Timur 3 565 34 1 904 -
5. Berau 3 059 - 2 156 -
6. Penajam Paser Utara 1 891 - 2 707 -
7. Mahakam Hulu 118 - 18 -
8. Balikpapan 15 205 18 16 397 -
9. Samarinda 17 543 186 12 908 -
10. Bontang 5 343 1 1 515 -
Jumlah 2014 55 781 331 41 898 -
Total 2013 54 504 259 37 562 -
2012 55 321 1 357 42 154 -
2011 47 675 826 42 326 -
2010 45 094 1 289 48 391 -
2009 37 719 792 42 219 -
Sumber: Dinas Peternakan Provinsi Kalimantan Timur.
Source: Livestock Service, Kalimantan Timur.
m . b
. g o
1 904
2 1
-
-
18
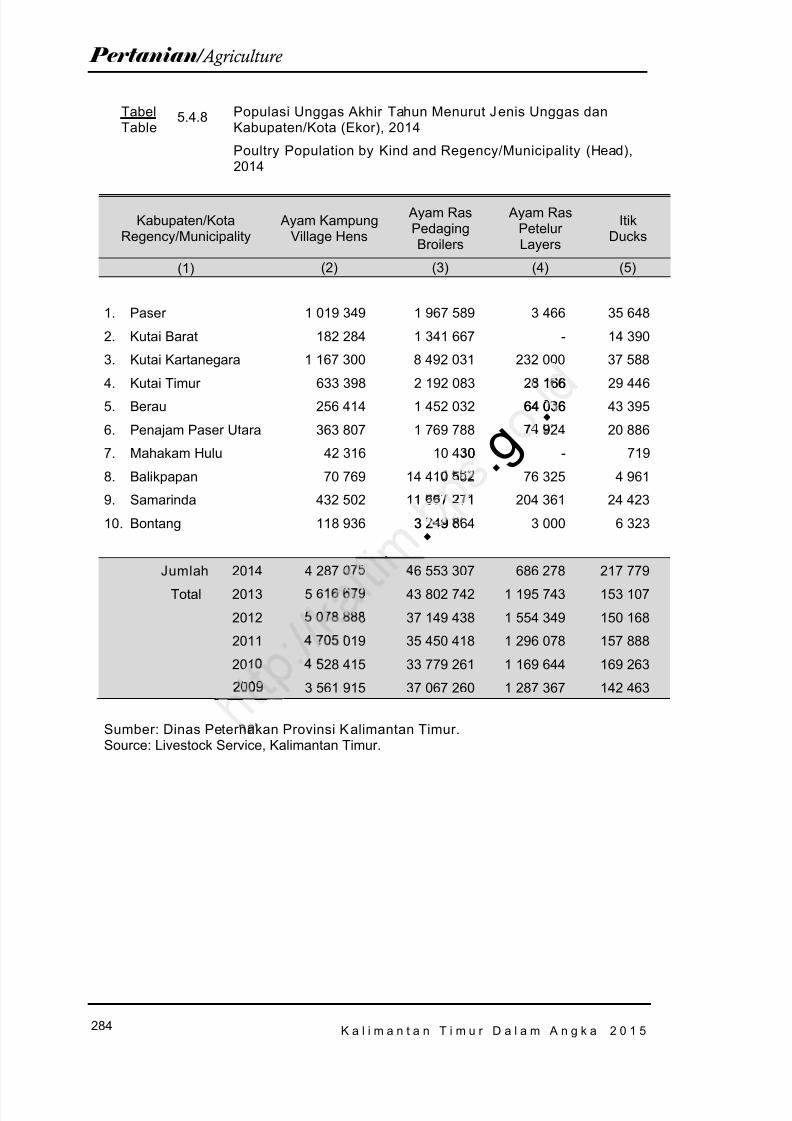
8/20/2019 Kalimantan Timur Dalam Angka Tahun 2015
http://slidepdf.com/reader/full/kalimantan-timur-dalam-angka-tahun-2015 350/623
284
Pertanian / Agriculture
K a l i m a n t a n T i m u r D a l a m A n g k a 2 0 1 5
TabelTable
5.4.8 Populasi Unggas Akhir Tahun Menurut Jenis Unggas danKabupaten/Kota (Ekor), 2014
Poultry Population by Kind and Regency/Municipality (Head),2014
Kabupaten/KotaRegency/Municipality
Ayam KampungVillage Hens
Ayam RasPedagingBroilers
Ayam RasPetelur Layers
ItikDucks
(1) (2) (3) (4) (5)
1. Paser 1 019 349 1 967 589 3 466 35 648
2. Kutai Barat 182 284 1 341 667 - 14 390
3. Kutai Kartanegara 1 167 300 8 492 031 232 000 37 588
4. Kutai Timur 633 398 2 192 083 28 166 29 4465. Berau 256 414 1 452 032 64 036 43 395
6. Penajam Paser Utara 363 807 1 769 788 74 924 20 886
7. Mahakam Hulu 42 316 10 430 - 719
8. Balikpapan 70 769 14 410 552 76 325 4 961
9. Samarinda 432 502 11 667 271 204 361 24 423
10. Bontang 118 936 3 249 864 3 000 6 323
Jumlah 2014 4 287 075 46 553 307 686 278 217 779Total 2013 5 616 679 43 802 742 1 195 743 153 107
2012 5 078 888 37 149 438 1 554 349 150 168
2011 4 705 019 35 450 418 1 296 078 157 888
2010 4 528 415 33 779 261 1 169 644 169 263
2009 3 561 915 37 067 260 1 287 367 142 463
Sumber: Dinas Peternakan Provinsi Kalimantan Timur.Source: Livestock Service, Kalimantan Timur.
. . g
.
16664 036
0
3 249
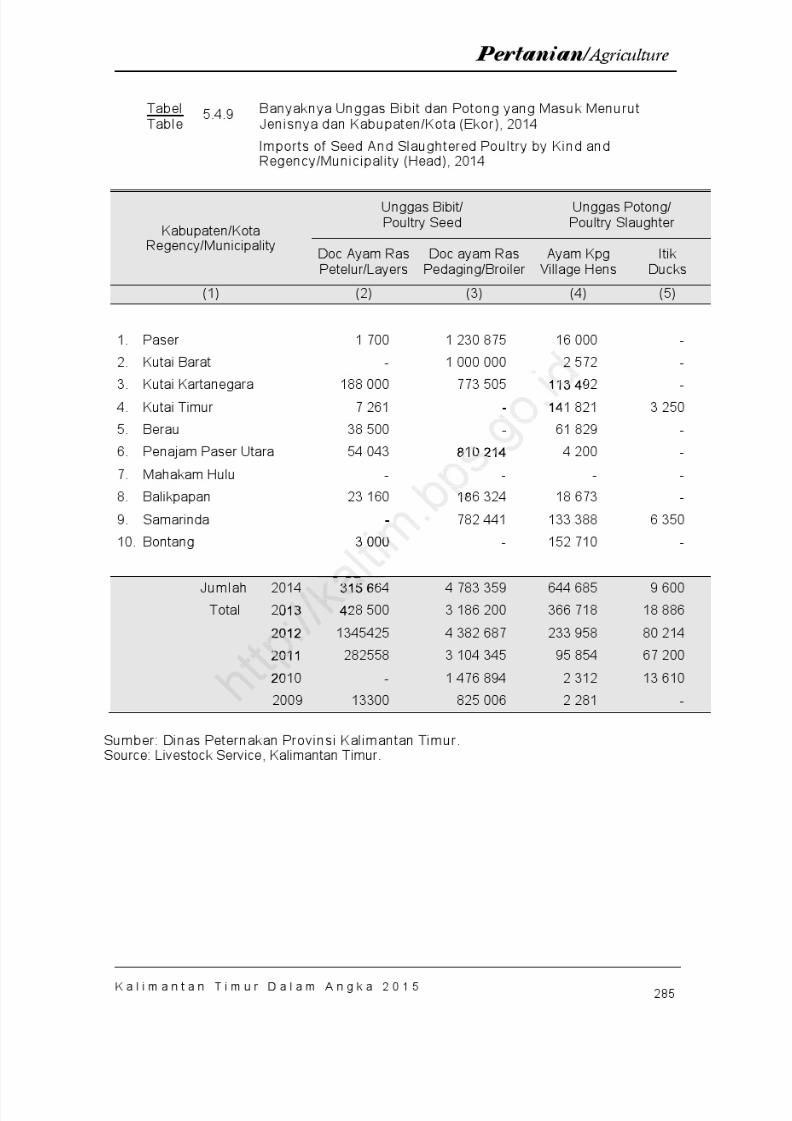
8/20/2019 Kalimantan Timur Dalam Angka Tahun 2015
http://slidepdf.com/reader/full/kalimantan-timur-dalam-angka-tahun-2015 351/623
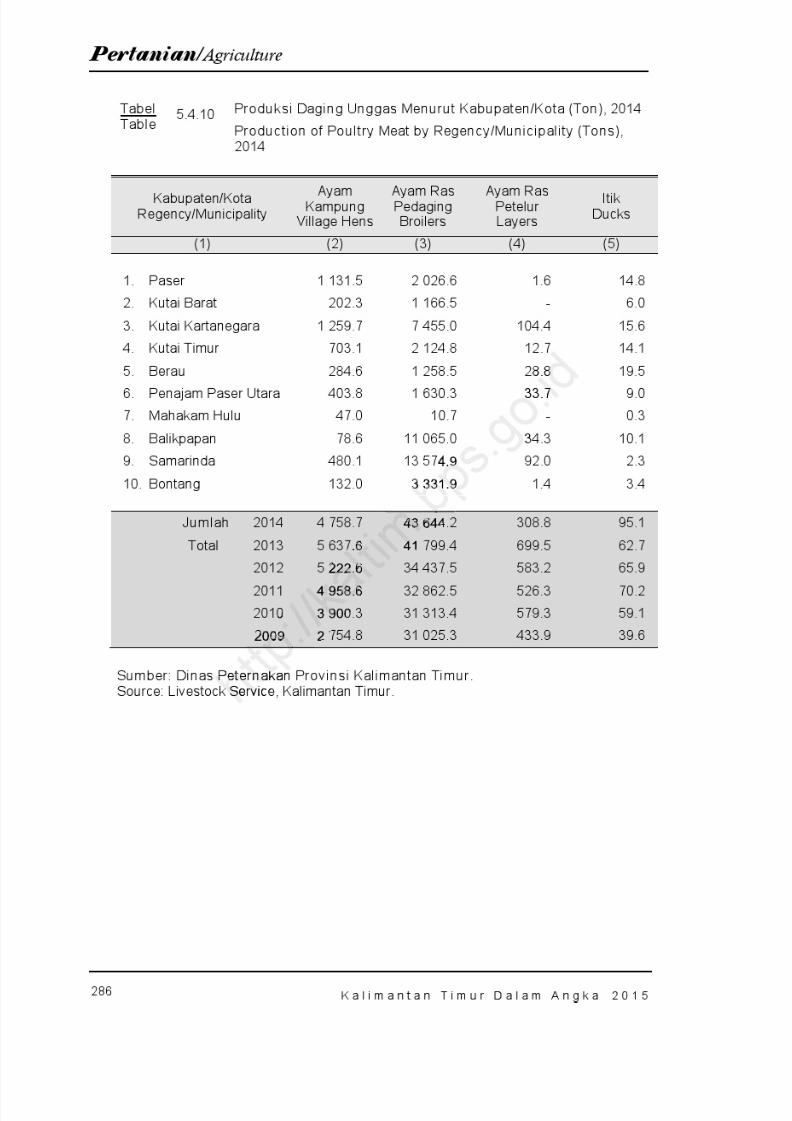
8/20/2019 Kalimantan Timur Dalam Angka Tahun 2015
http://slidepdf.com/reader/full/kalimantan-timur-dalam-angka-tahun-2015 352/623
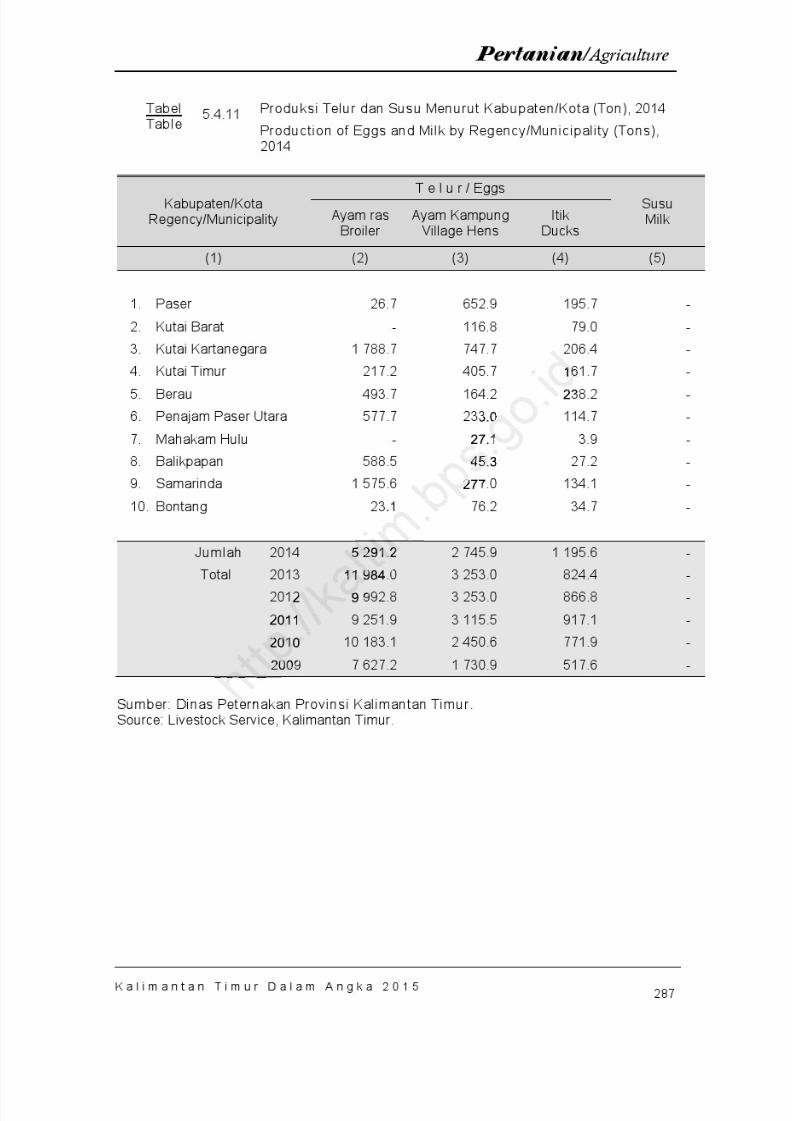
8/20/2019 Kalimantan Timur Dalam Angka Tahun 2015
http://slidepdf.com/reader/full/kalimantan-timur-dalam-angka-tahun-2015 353/623
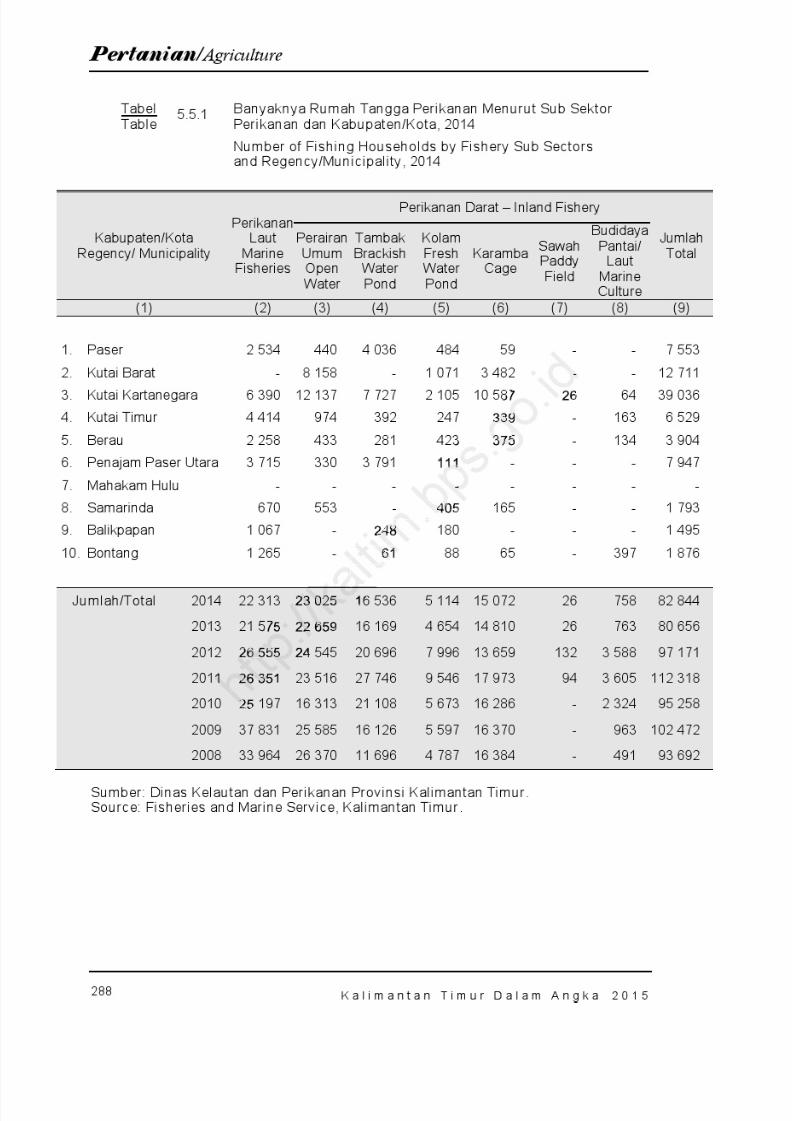
8/20/2019 Kalimantan Timur Dalam Angka Tahun 2015
http://slidepdf.com/reader/full/kalimantan-timur-dalam-angka-tahun-2015 354/623

8/20/2019 Kalimantan Timur Dalam Angka Tahun 2015
http://slidepdf.com/reader/full/kalimantan-timur-dalam-angka-tahun-2015 355/623
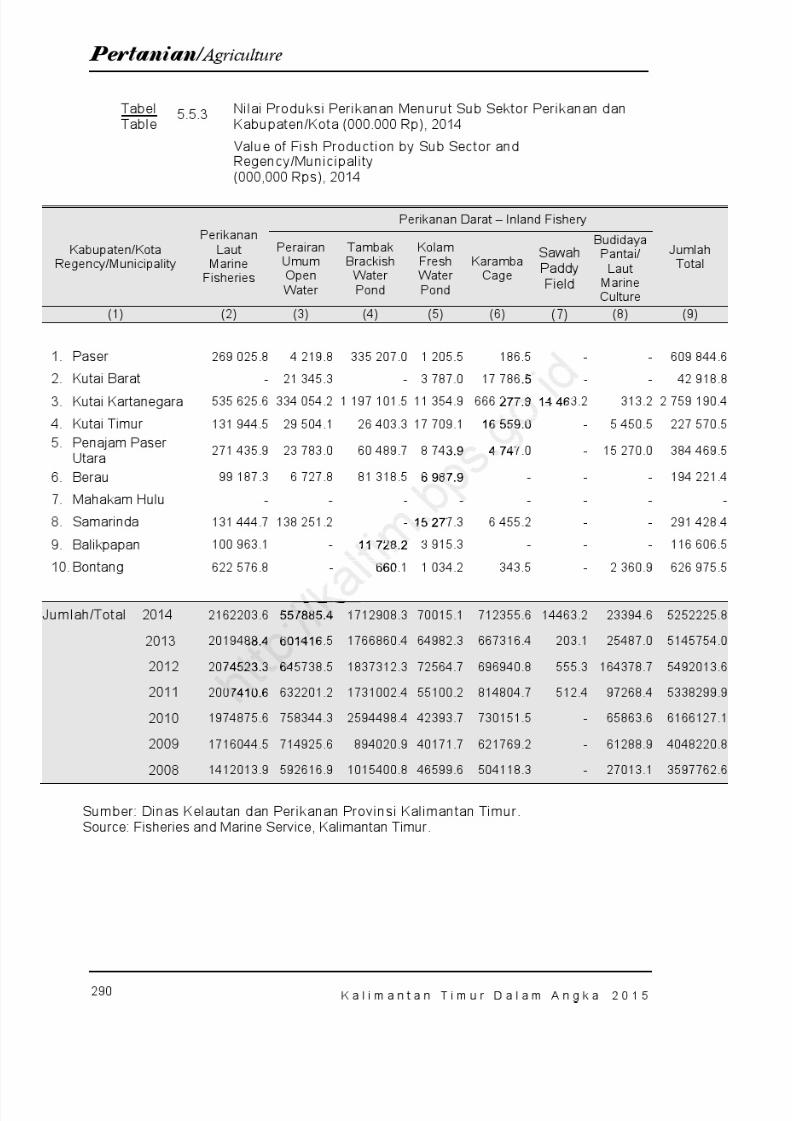
8/20/2019 Kalimantan Timur Dalam Angka Tahun 2015
http://slidepdf.com/reader/full/kalimantan-timur-dalam-angka-tahun-2015 356/623
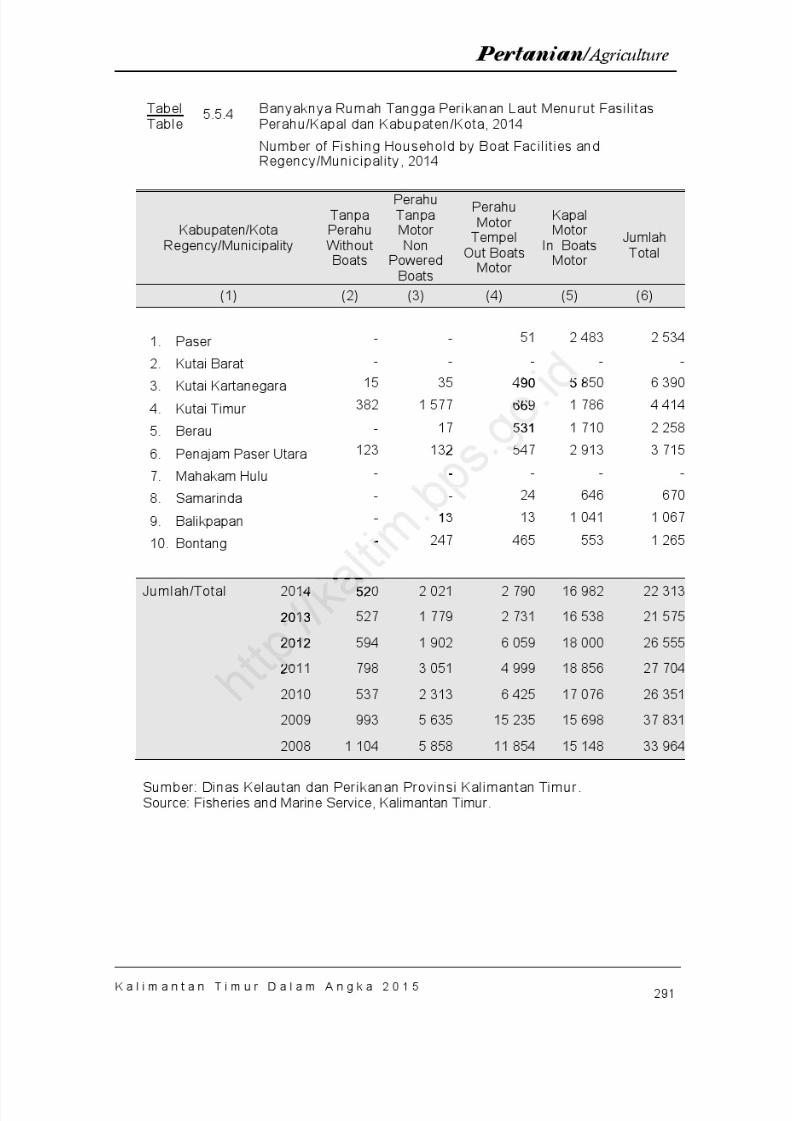
8/20/2019 Kalimantan Timur Dalam Angka Tahun 2015
http://slidepdf.com/reader/full/kalimantan-timur-dalam-angka-tahun-2015 357/623
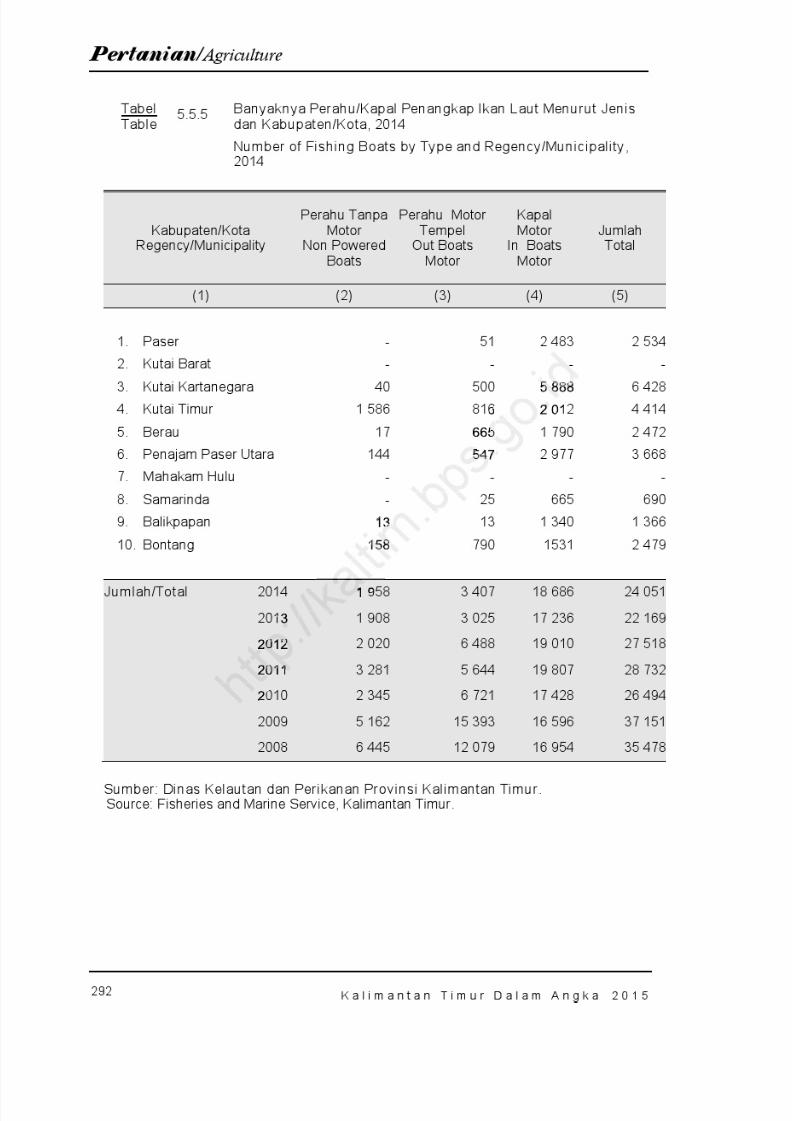
8/20/2019 Kalimantan Timur Dalam Angka Tahun 2015
http://slidepdf.com/reader/full/kalimantan-timur-dalam-angka-tahun-2015 358/623
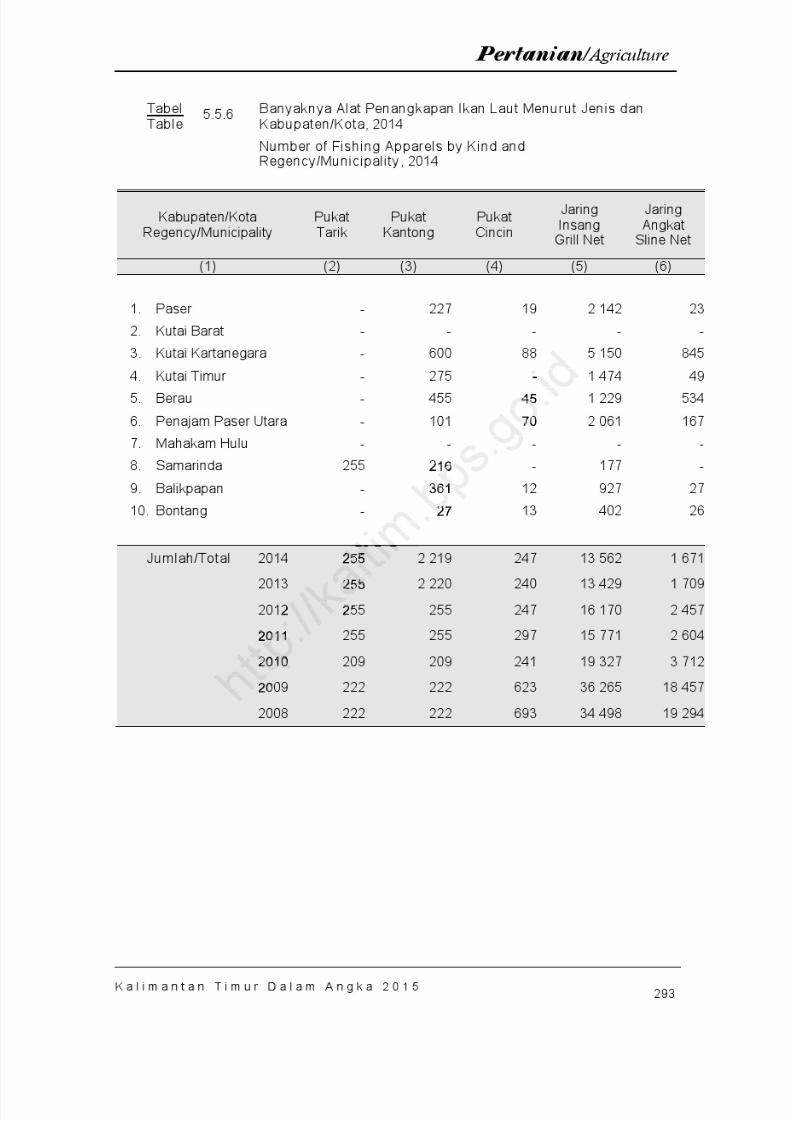
8/20/2019 Kalimantan Timur Dalam Angka Tahun 2015
http://slidepdf.com/reader/full/kalimantan-timur-dalam-angka-tahun-2015 359/623
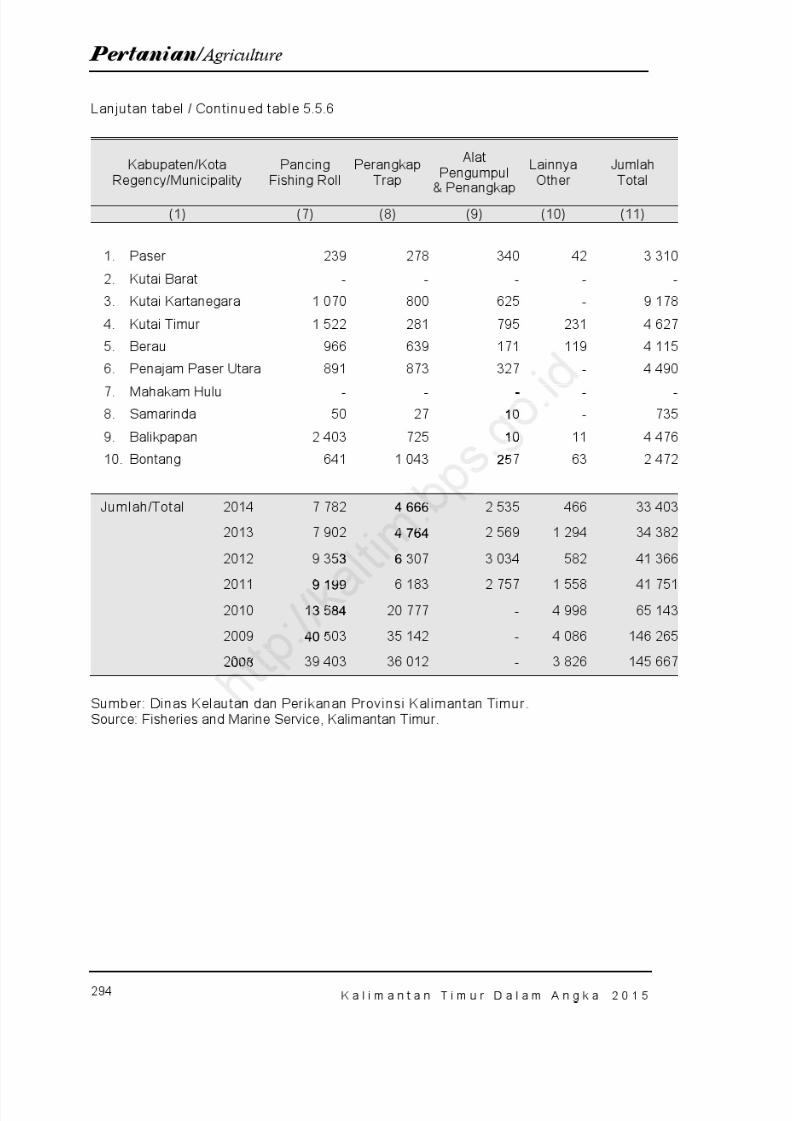
8/20/2019 Kalimantan Timur Dalam Angka Tahun 2015
http://slidepdf.com/reader/full/kalimantan-timur-dalam-angka-tahun-2015 360/623
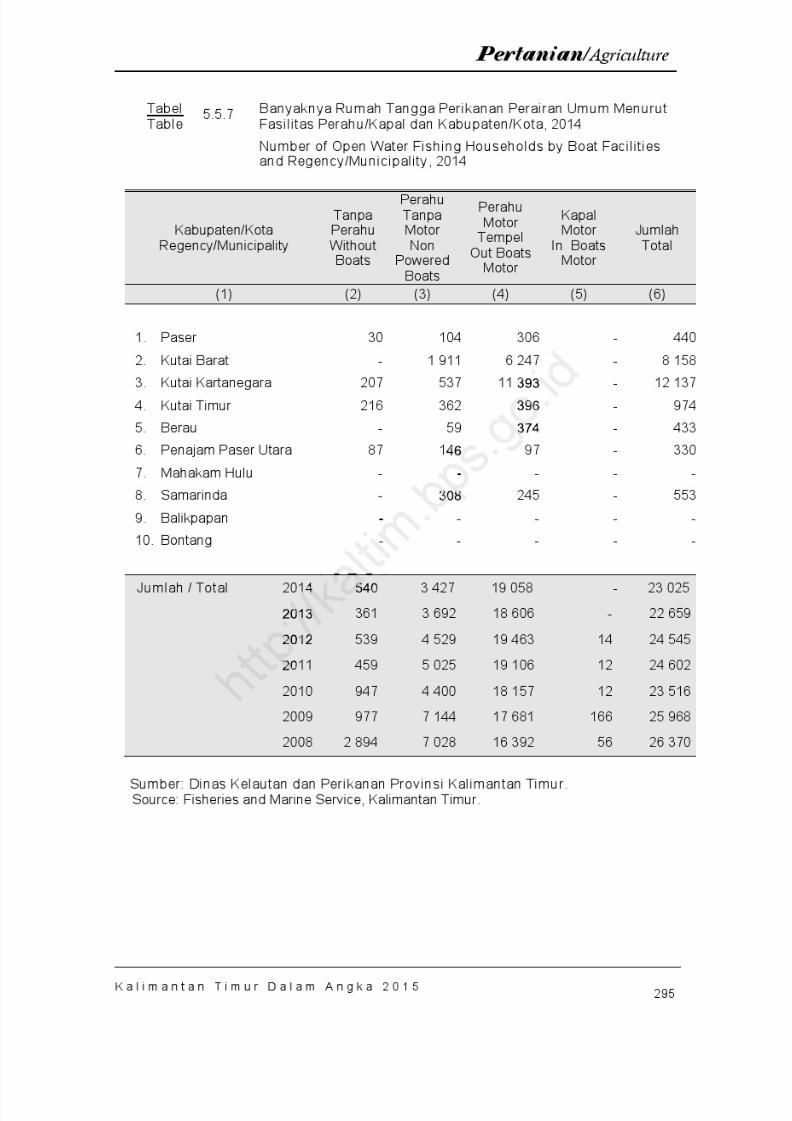
8/20/2019 Kalimantan Timur Dalam Angka Tahun 2015
http://slidepdf.com/reader/full/kalimantan-timur-dalam-angka-tahun-2015 361/623
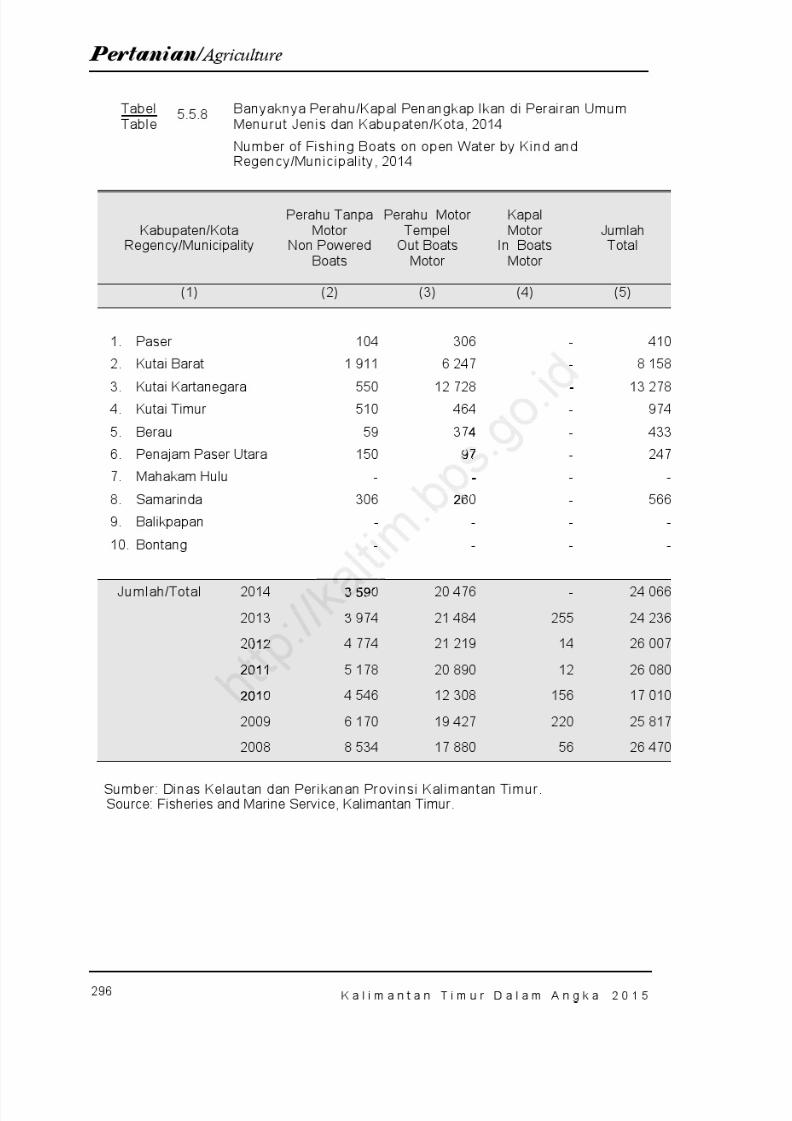
8/20/2019 Kalimantan Timur Dalam Angka Tahun 2015
http://slidepdf.com/reader/full/kalimantan-timur-dalam-angka-tahun-2015 362/623
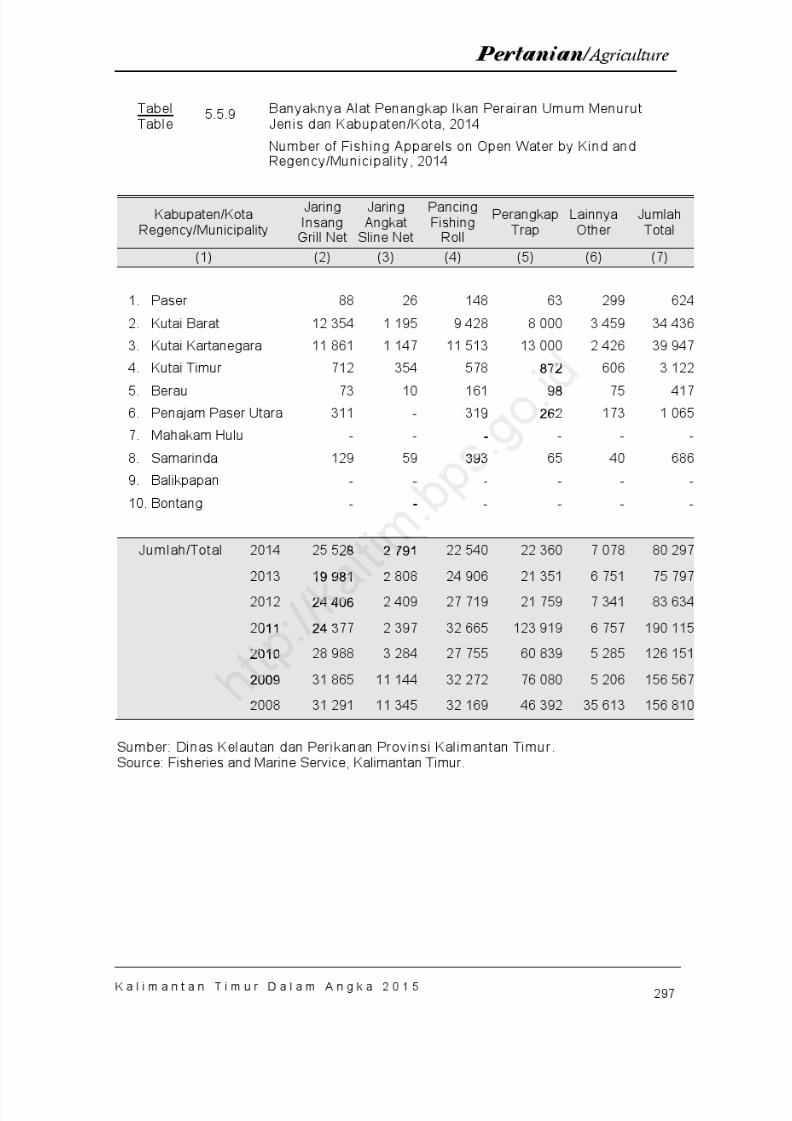
8/20/2019 Kalimantan Timur Dalam Angka Tahun 2015
http://slidepdf.com/reader/full/kalimantan-timur-dalam-angka-tahun-2015 363/623
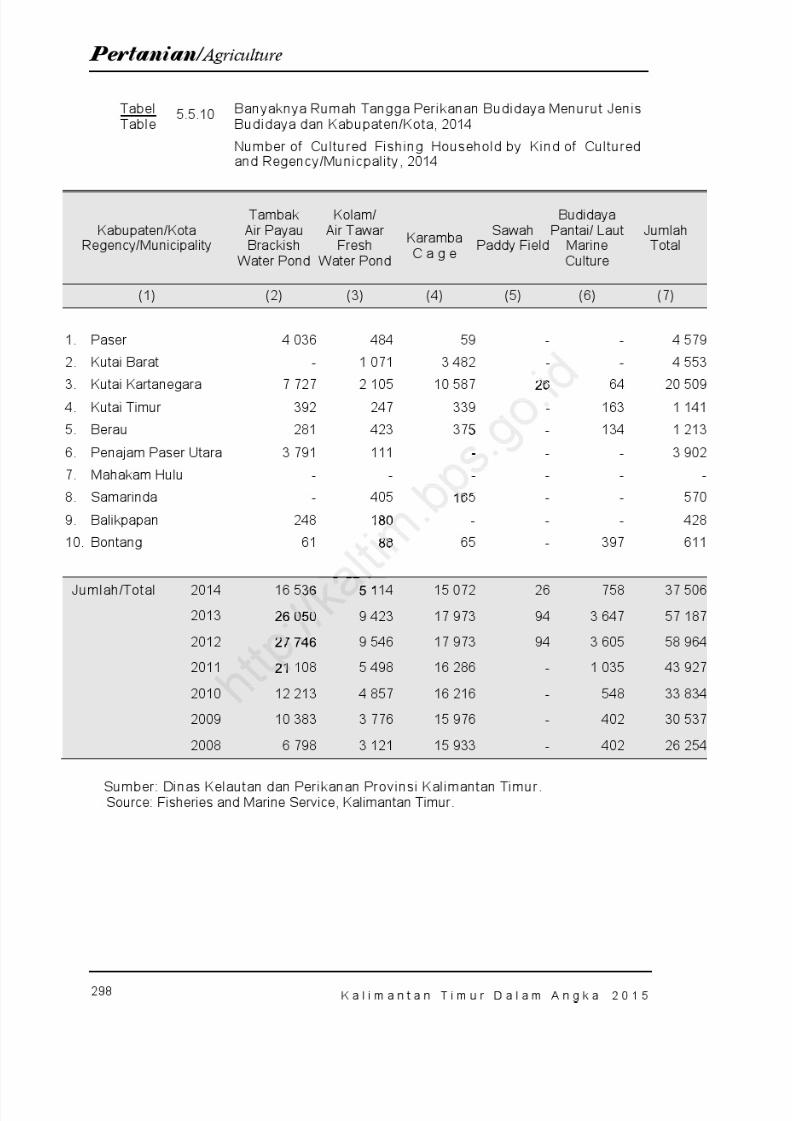
8/20/2019 Kalimantan Timur Dalam Angka Tahun 2015
http://slidepdf.com/reader/full/kalimantan-timur-dalam-angka-tahun-2015 364/623
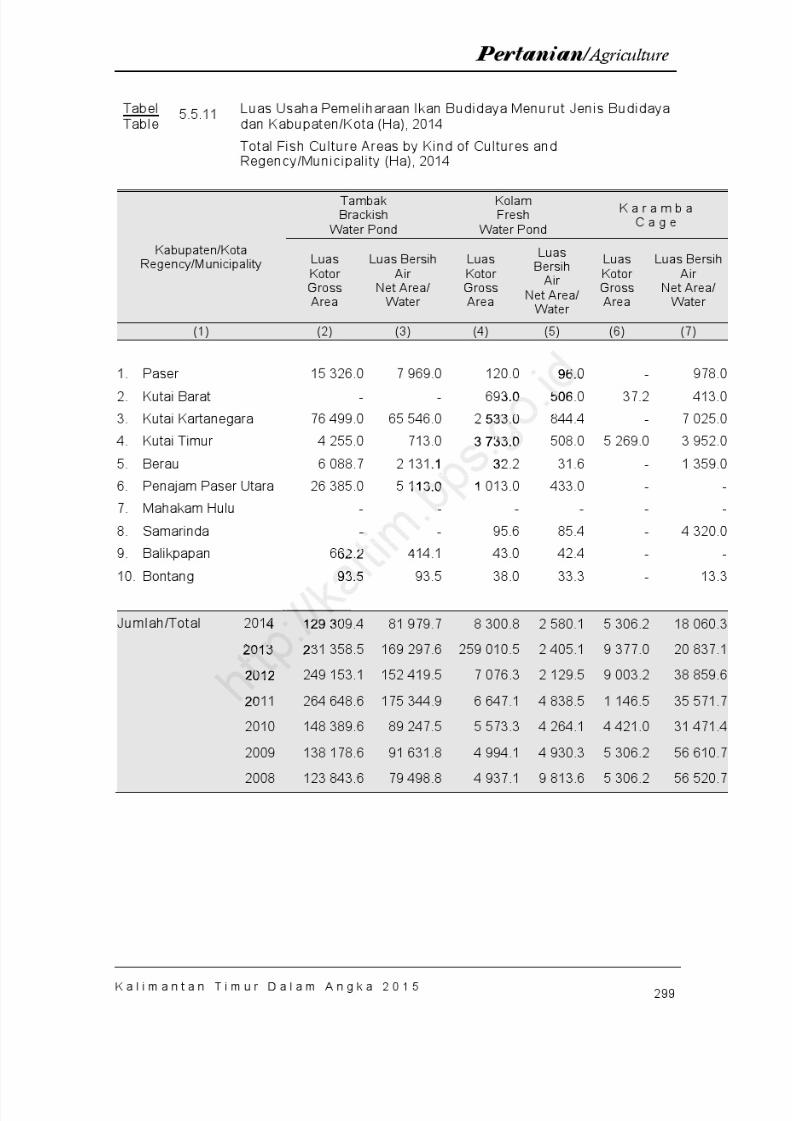
8/20/2019 Kalimantan Timur Dalam Angka Tahun 2015
http://slidepdf.com/reader/full/kalimantan-timur-dalam-angka-tahun-2015 365/623
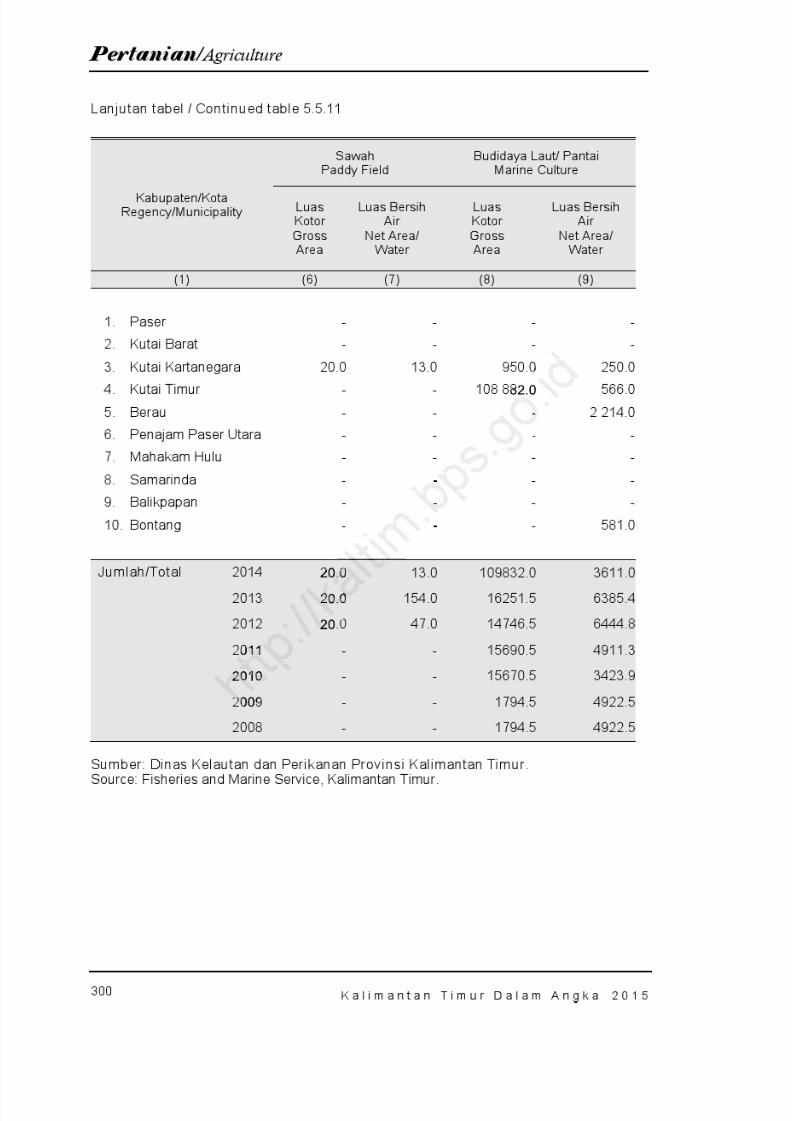
8/20/2019 Kalimantan Timur Dalam Angka Tahun 2015
http://slidepdf.com/reader/full/kalimantan-timur-dalam-angka-tahun-2015 366/623
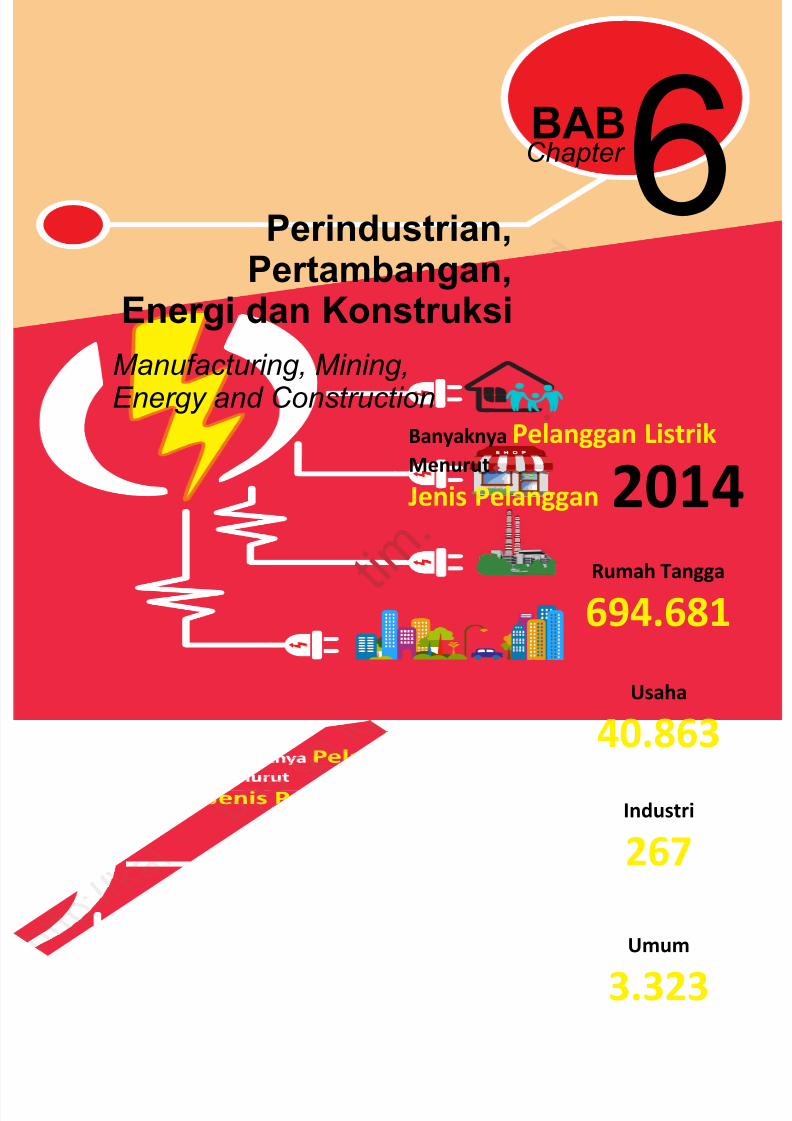
8/20/2019 Kalimantan Timur Dalam Angka Tahun 2015
http://slidepdf.com/reader/full/kalimantan-timur-dalam-angka-tahun-2015 367/623
6Perindustrian,Pertambangan,
Energi dan Konstruksi
BABChapter
Manufacturing, Mining,Energy and Construction
Banyaknya Pelanggan ListrikMenurut
Jenis Pelanggan 2014Rumah Tangga
694.681
Usaha
40.863
Industri
267
Umum
3.323
. .
t i m .

8/20/2019 Kalimantan Timur Dalam Angka Tahun 2015
http://slidepdf.com/reader/full/kalimantan-timur-dalam-angka-tahun-2015 368/623
h t t p : / / k a l t i m
. b p s . g o . i d

8/20/2019 Kalimantan Timur Dalam Angka Tahun 2015
http://slidepdf.com/reader/full/kalimantan-timur-dalam-angka-tahun-2015 369/623
303K a l i m a n t a n T i m u r D a l a m A n g k a 2 0 1 5
Perindustrian, Pertambangan, Energi dan Konstruksi/ Manufacturing, Mining, Energy and Construction
6.1. PERINDUSTRIAN
Penggolongan sektor industriberdasarkan jumlah tenaga kerjanyadibedakan menjadi industri besar,industri sedang, industri kecil danindustri kerajinan rumah tangga. Datamengenai industri besar dan sedangtersedia setiap tahun, sedangkandata mengenai industri kecil danrumah tangga tidak tersedia pada
publikasi ini. Perusahaan industribesar adalah usaha industri dengantenaga kerja lebih dari 100 orang, danindustri sedang adalah usaha industridengan tenaga kerja antara 20-99orang.
Banyaknya perusahaan IndustriBesar dan Sedang di KalimantanTimur pada tahun 2013 tercatat 140perusahaan dengan menyerap30.407 tenaga kerja, dengan totalpengeluaran untuk tenaga kerjaberkisar Rp 1,63 triliun. Dilihat dari jumlah perusahaan, pada tahun 2013mengalami peningkatan dibandingtahun 2012, dan nilai tambahnya juga
meningkat namun penyerapantenaga kerja terjadi penurunan.
6.1. MANUFACTURING
INDUSTRY
Manufacturing consist of fourcategories : large, medium, small andhousehold manufacturing industries.This grouping is based on number ofworkers involved. Data on large andmedium manufacturing industriesare available yearly, whole small andhousehold industries is not available.
Large industrial companies areindustrial enterprises with aworkforce of more than 100 people,and the midle industry is the industrialenterprises with a workforce ofbetween 20-99 people.
In 2013 number of large andmedium industry establishment inKalimantan Timur was 140 whichinvolved 31,965 workers, while thelabor cost about 1.41 trillion rupiahs.Compared to previous year thenumber of establishment wasincreased, labor and value added inthis manufacturing is increased andindustrial growth rate is accelerating.
.
ri alenterp
e o mo
. rintan
tat 1 40 menyer
engantena
triliun.aan, panin
e mi eterprises
betwee
8/20/2019 Kalimantan Timur Dalam Angka Tahun 2015
http://slidepdf.com/reader/full/kalimantan-timur-dalam-angka-tahun-2015 370/623
304 K a l i m a n t a n T i m u r D a l a m A n g k a 2 0 1 5
Perindustrian, Pertambangan, Energi dan Konstruksi/ Manufacturing, Mining, Energy and Construction
6.2. PERTAMBANGAN
Kegiatan pertambangan diKalimantan Timur mencakuppertambangan migas dan non-migas.Dari kegiatan tersebut, minyak bumidan gas alam merupakan hasiltambang yang sangat besarpengaruhnya dalam perekonomianKalimantan Timur khususnya danIndonesia pada umumnya, karena
hingga kini kedua hasil tambangtersebut merupakan komoditi eksporutama.
Perkembangan produksi batubara misalnya, sejak tahun 2004 terusmeningkat setiap tahunnya dan padatahun 2014 produksi batubara telahmencapai 234.661.519 ton, ataumeningkat 2,37% dibanding tahun
2013.Produksi Minyak Bumi
mengalami penurunan dari 42,98 jutabarrel menjadi 35,21 juta barrel padatahun 2014. Demikian pula untukproduksi Gas Bumi pada tahun 2014mengalami penurunan dari 713,55 juta MMBTU menjadi 605,58 juta
MMBTU.
6.2. MINING
Activities mining in Kalimantan Timur
comprises oil and gas mining, non-oiland gas mining. Both of them, has avery important role in KalimantanTimur economy and also Indonesia.The commodities of mining sector,known as main export commoditiesrecently is a coal.
For example, since 2004 thegrowth of coal production inKalimantan Timur, increased fromyear to year. In 2014 it has increased2.37% or coal production reached234,661,519 tons.
Oil Total production in 2014decreased from 42.98 million barrelsto 35.21 million barrels. While, gas production also decreased from713.55 juta MMBTU to 605.58 jutaMMBTU.
l
o . i d
n
Bumi42,98 j
a barrelian pul
i pa ana
examph of
mantanear to y.. %
234
8/20/2019 Kalimantan Timur Dalam Angka Tahun 2015
http://slidepdf.com/reader/full/kalimantan-timur-dalam-angka-tahun-2015 371/623
305K a l i m a n t a n T i m u r D a l a m A n g k a 2 0 1 5
Perindustrian, Pertambangan, Energi dan Konstruksi/ Manufacturing, Mining, Energy and Construction
6.3. LISTRIK
Listrik adalah komoditas penting
bagi keberlangsungan sendi-sendikehidupan manusia saat ini. Tanpapasokan energi listrik, hampirdipastikan banyak dunia usaha,rumah tangga maupun sektor yanglain lumpuh karenanya. Sebagianbesar sumber energi listrik di ProvinsiKalimantan Timur hingga saat inimasih dipasok oleh PerusahaanUmum Listrik Negara. Selama tahun2014, tenaga listrik yang diproduksisebesar 3.077.657 MWh, terjual2.815.556,21 MWh, dipakai sendiri49.585.262 MWh dan mengalamipenyusutan sebesar 29,99 MWh.
6.4. AIR MINUM
Jumlah perusahaan air minumpada tahun 2014 tidak mengalamiperubahan dan semuanya berstatussebagai perusahaan milik pemerintah(14 buah). Kapasitas ProduksiPotensial yang dihasilkan meningkatdibanding tahun sebelumnya dari7.083 liter/detik menjadi 7.264
liter/detik. Sementara itu, kapasitasproduksi efektif juga meningkat dari5.980 liter/detik menjadi 6.751liter/detik, sehingga berpengaruhterhadap efektifitas produksi dari84,43 persen menjadi 92,94 persen.
6.3. ELECTRICITY
Nowaday electricity is animportant commodity forcontinuation of human’s life. Withoutelectricity supply, business sector,household or other sectors could be powerless. Up now, most of electricityresource in Kalimantan Timur stillsupplied by State Electricity Company(PLN). In 2014, electricity produced
was 3.077.657 MWh, electricity soldwas 2,815,556.21 MWh, for ownused 51,718.77 MWh anddepreciation about 255,443.56 MWh.
6.4. WATER SUPPLY
In 2014 the number of drinkingwater supply establishment (PAM)didn’t change which all arecompanies state (14 units). Comparedto previous year, its potential capacityincreased from 7,083 litre/second to7,264 litre/second. Effective capacityalso increased from 5,980litre/second to 6,751 litre/second.Thus, its effectivity of production alsoincreased from 84.43 percent to 92.94 percent.
M
s .
minummenga a
nya bermilik pe
apasitasi asi
n
, 56.2151,718.7
ciation a
6.4
8/20/2019 Kalimantan Timur Dalam Angka Tahun 2015
http://slidepdf.com/reader/full/kalimantan-timur-dalam-angka-tahun-2015 372/623
306 K a l i m a n t a n T i m u r D a l a m A n g k a 2 0 1 5
Perindustrian, Pertambangan, Energi dan Konstruksi/ Manufacturing, Mining, Energy and Construction
PENJELASAN TEKNIS
1. Industri pengolahan dikelom-pokkan ke dalam 4 golonganberdasarkan banyaknya pekerja,yaitu:a. Industri Besar adalah peru-
sahaan yang mempunyaipekerja 100 orang atau lebih;
b. Industri Sedang adalahperusahaan yang mempu-nyai pekerja 20-99 orang;
c. Industri Kecil adalah peru-sahaan yang mempunyaipekerja 5-19 orang; dan
d. Industri Rumah Tangga adalah usaha kerajinanrumah tangga yangmempunyai pekerja antara 1-4 orang.
2. Klasifikasi Industri Pengolah-an :10. Industri makanan11. Industri Minuman12. Industri Pengolahan
Tembakau.13. Industri Tekstil.14. Industri Pakaian Jadi
15. Industri Kulit, Barang dariKulit dan Alas Kaki16. Industri Kayu, Barang dari
Kayu dan Gabus (tidaktermasuk furnitur) danBarang Anyaman Bambu,Rotan dan Sejenisnya
17. Industri Kertas dan Barangdari Kertas
TECHNICAL NOTES
1. According to the number ofemployee, a manufacturingindustry is categorized into 4groups:a. Large scale manufacturing is a
manufacturing establishmenthaving at least 100 employees;
b. Medium scale manufacturingis a manufacturingestablishment having 20-99employees.
c. Small scale manufacturing is amanufacturing establishmenthaving 5-19 employees.
d. Household industry is amanufacturing establishmenthaving 1 – 4 employees.
2. Classification of manufacturingindustry:10. Manufacture of food11. Manufacture of beverage12. Manufacture of tobacco13. Manufacture of textile14. Manufacture of wearing
apparel15.
Manufacture of leather product16. Manufacture of Wood,
articles of wood and cork(excluding furniture) andGoods Woven Bamboo,Rattan and the like
17. Manufacture of paper and paper products
nts.
scale m
/ / l t i m
. b a - an
anPen
u..sti
nu acturaving 5
d.. Housm
8/20/2019 Kalimantan Timur Dalam Angka Tahun 2015
http://slidepdf.com/reader/full/kalimantan-timur-dalam-angka-tahun-2015 373/623
307K a l i m a n t a n T i m u r D a l a m A n g k a 2 0 1 5
Perindustrian, Pertambangan, Energi dan Konstruksi/ Manufacturing, Mining, Energy and Construction
18. Industri Percetakan danReproduksi dari MediaRekaman
19. Industri Produk dari BatuBara dan PengilanganMinyak Bumi
20. Industri Bahan Kimia danBarang dari Bahan Kimia
21. Industri Farmasi, ProdukObat Kimia dan ObatTradisional
22. Industri Karet, Barang dari
Karet dan Plastik23. Industri Bahan Galian bukan
Logam24. Industri Logam Dasar25. Industri Bahan Logam,
Bukan Mesin danPeralatannya
26. Industri Komputer, BarangElektronik dan Optik
27. Industri Peralatan Listrik28. Industri Mesin dan
Perlengkapan ytdl29. Industri Kendaraan
Bermotor, Trailer dan SemiTrailer
30. Industri Alat Angkutan Lain31. Industri Furnitur
32. Industri Pengolahan Lainnya33. Jasa Reparasi dan
Pemasangan Mesin danPeralatan
18. Manufacture of Printing andReproduction of RecordedMedia
19. Manufacture of Products from Coal and PetroleumRefinery
20. Manufacture of Chemicalsand articles of Chemicals
21. Manufacture ofPharmaceutical, ChemicalMedicinal Products andTraditional Medicine
22. Manufacture of Rubber,Products from Rubber andPlastics
23. Manufacture of Excavatedmaterial instead of metal
24. Manufacture of basic metals25. Manufacture of Material
Metal, Not Machines andFittings
26. Manufacture of Computers,Electronics and Optics
27. Manufacture of Electricalequipment
28. Manufacture of Machineryand equipment ytdl
29. Manufacture of MotorVehicles, Trailers and Semi-
Trailers30. Manufacture of Other
Transport Equipment31. Manufacture of Furniture32. Manufacture of Other
Processing33. Services Repair and
Installation of Machineryand Equipment
ng
stri kin
ytdlK
r, Trailr
i Al
actuoducts f
Plastics3. Man
m24.
8/20/2019 Kalimantan Timur Dalam Angka Tahun 2015
http://slidepdf.com/reader/full/kalimantan-timur-dalam-angka-tahun-2015 374/623
308 K a l i m a n t a n T i m u r D a l a m A n g k a 2 0 1 5
Perindustrian, Pertambangan, Energi dan Konstruksi/ Manufacturing, Mining, Energy and Construction
3. Data air minum dikumpulkan olehBadan Pusat Statistik Provinsimelalui survei pada PerusahaanAir Minum. Sistem pencacahan-nya adalah dengan cara mengirimdaftar pertanyaan kepadaperusahaan air minum(pencacahan lengkap).
4. Data statistik pertambanganberSumberdari DepartemenPertambangann ProvinsiKalimantan Timur.
3. Data on drinking water supplyare collected by BPS-Statistics ofKalimantan Timur through asurvey of drinking water supplycompanies. In this case BPS usescomplete enumeration methodand interview.
4. The data for mining statistics areobtained from mining agency ofKalimantan Timur province.
h t t p : / / k a l t i m
. b p s . g o . i
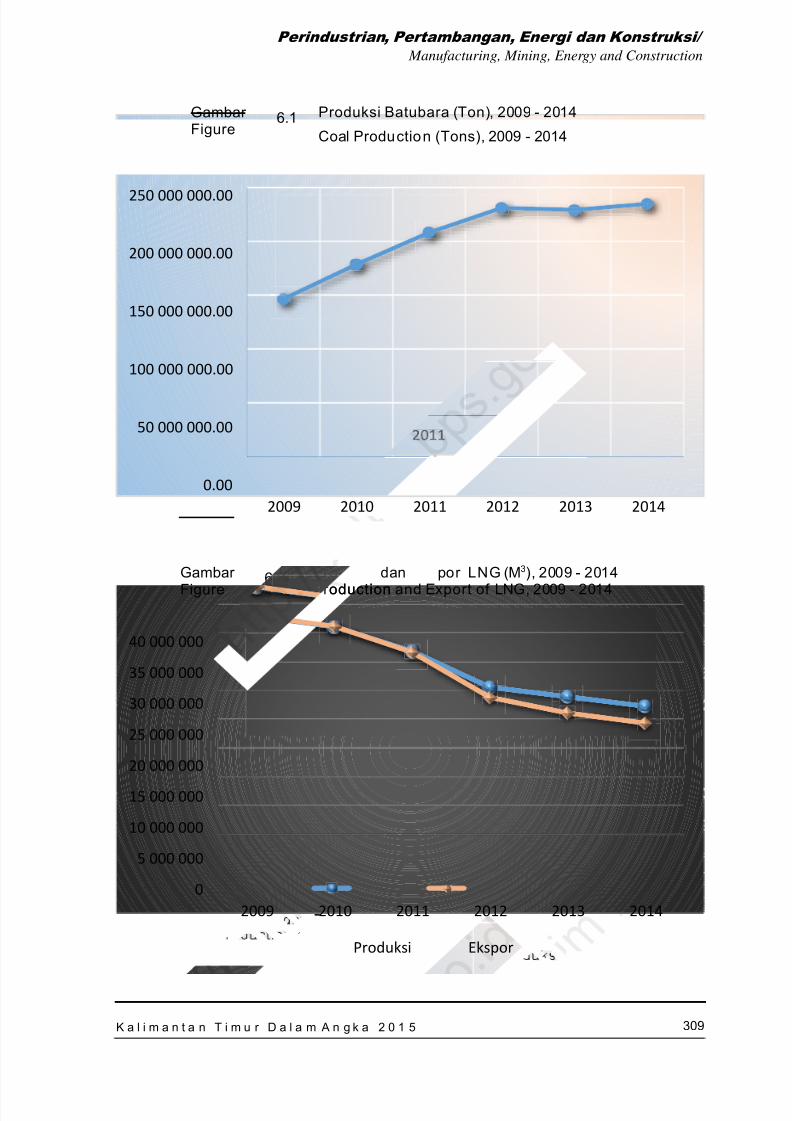
8/20/2019 Kalimantan Timur Dalam Angka Tahun 2015
http://slidepdf.com/reader/full/kalimantan-timur-dalam-angka-tahun-2015 375/623
309K a l i m a n t a n T i m u r D a l a m A n g k a 2 0 1 5
Perindustrian, Pertambangan, Energi dan Konstruksi/ Manufacturing, Mining, Energy and Construction
Gambar Figure
6.1 Produksi Batubara (Ton), 2009 - 2014
Coal Production (Tons), 2009 - 2014
Gambar Figure 6.2 Produksi dan Ekspor LNG (M3
), 2009 - 2014Production and Export of LNG, 2009 - 2014
0.00
50 000 000.00
100 000 000.00
150 000 000.00
200 000 000.00
250 000 000.00
2009 2010 2011 2012 2013 2014
0
5 000 000
10 000 000
15 000 00020 000 000
25 000 000
30 000 000
35 000 000
40 000 000
2009 2010 2011 2012 2013 2014
Produksi Ekspor
.uksi danoduction
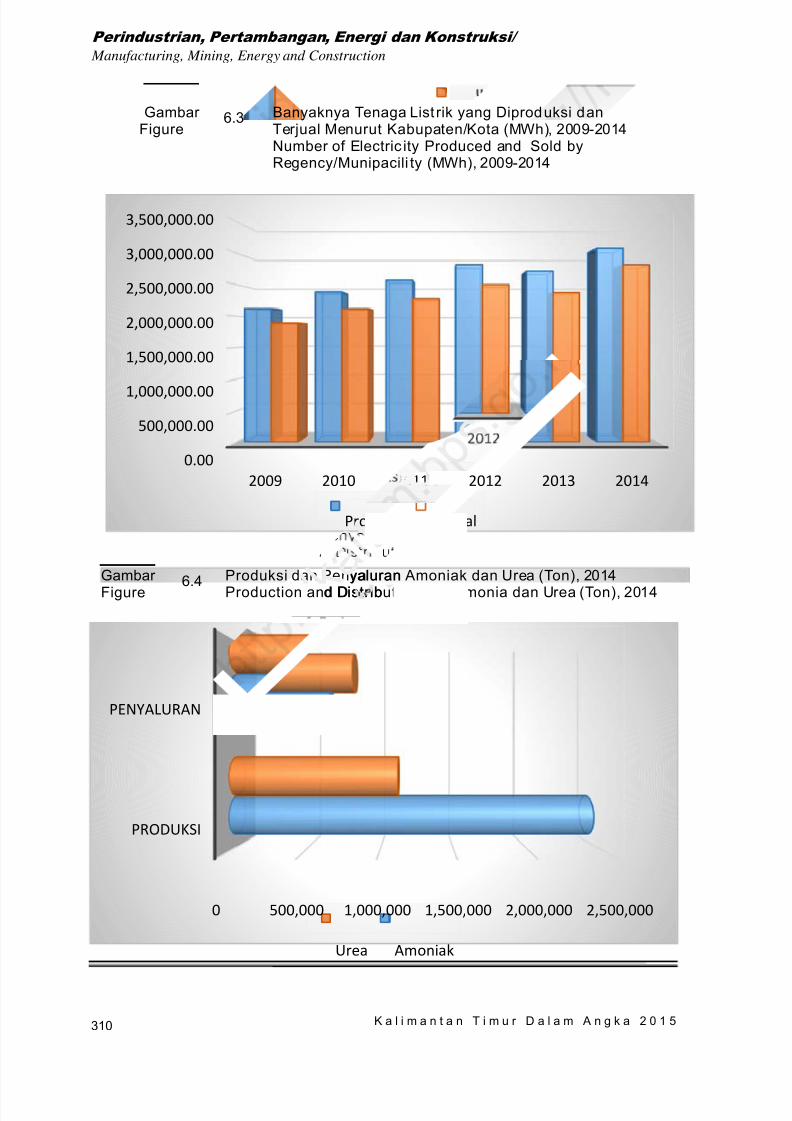
8/20/2019 Kalimantan Timur Dalam Angka Tahun 2015
http://slidepdf.com/reader/full/kalimantan-timur-dalam-angka-tahun-2015 376/623
310 K a l i m a n t a n T i m u r D a l a m A n g k a 2 0 1 5
Perindustrian, Pertambangan, Energi dan Konstruksi/ Manufacturing, Mining, Energy and Construction
Gambar Figure
6.3 Banyaknya Tenaga List rik yang Diproduksi danTerjual Menurut Kabupaten/Kota (MWh), 2009-2014Number of Electric ity Produced and Sold byRegency/Munipacili ty (MWh), 2009-2014
Gambar Figure
6.4 Produksi dan Penyaluran Amoniak dan Urea (Ton), 2014Production and Distribution of Ammonia dan Urea (Ton), 2014
0.00
500,000.00
1,000,000.00
1,500,000.00
2,000,000.00
2,500,000.00
3,000,000.00
3,500,000.00
2009 2010 2011 2012 2013 2014
Produksi Terjual
0 500,000 1,000,000 1,500,000 2,000,000 2,500,000
PRODUKSI
PENYALURAN
Urea Amoniak
i
yalurand Distrib
Terj
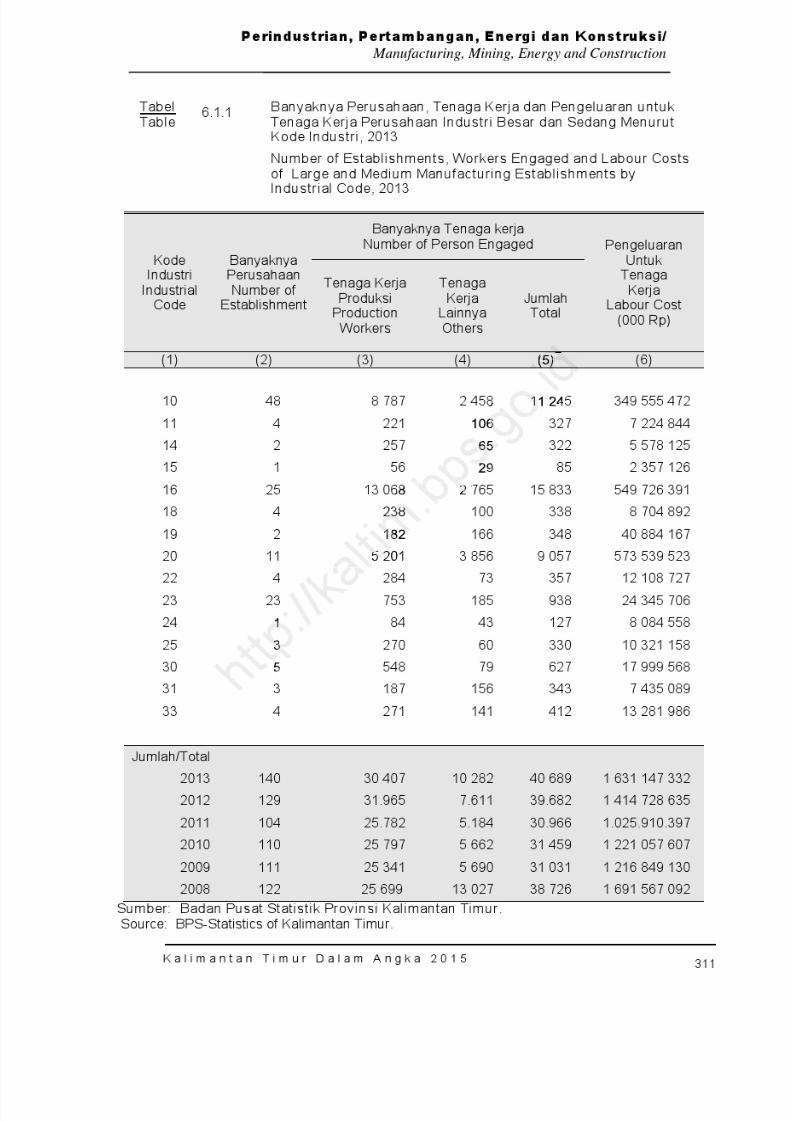
8/20/2019 Kalimantan Timur Dalam Angka Tahun 2015
http://slidepdf.com/reader/full/kalimantan-timur-dalam-angka-tahun-2015 377/623
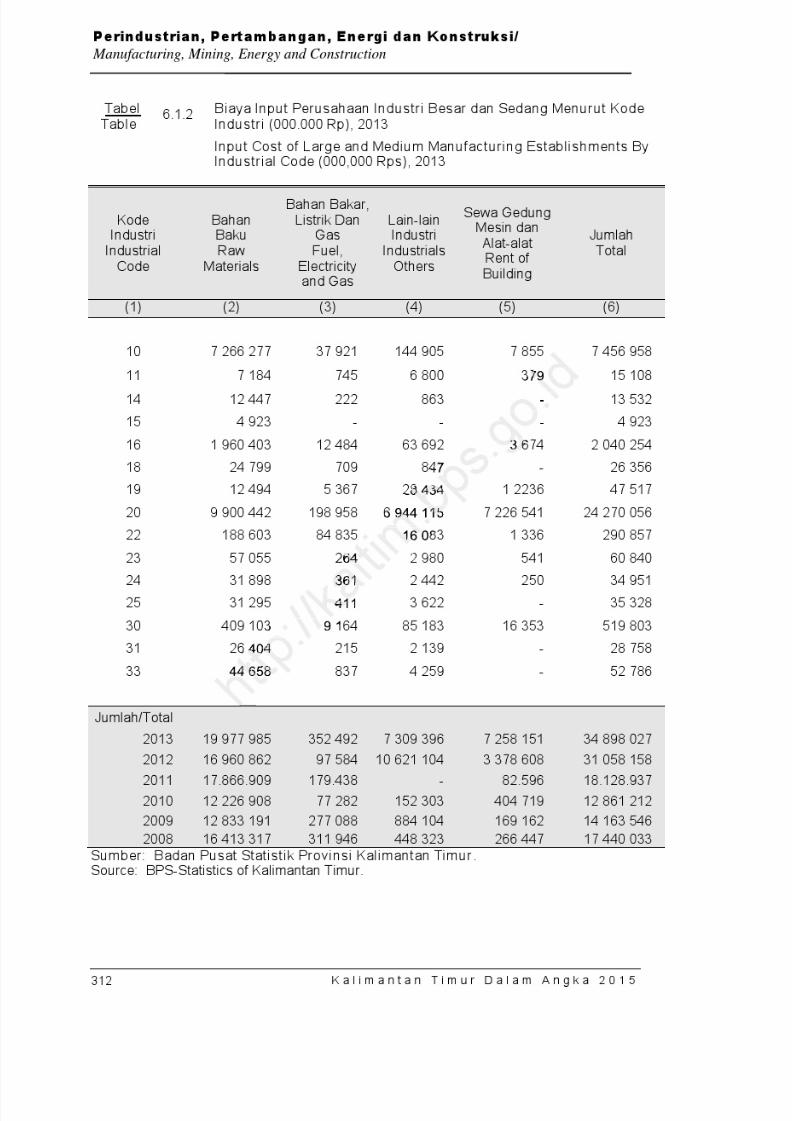
8/20/2019 Kalimantan Timur Dalam Angka Tahun 2015
http://slidepdf.com/reader/full/kalimantan-timur-dalam-angka-tahun-2015 378/623
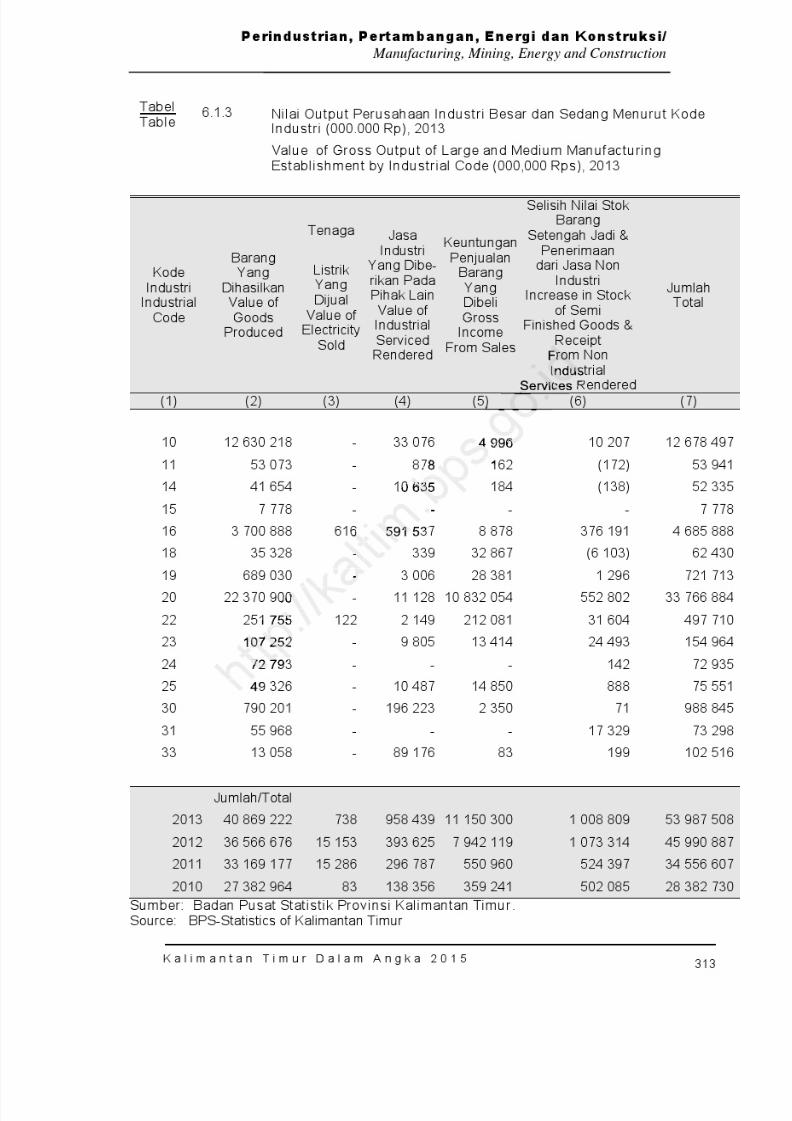
8/20/2019 Kalimantan Timur Dalam Angka Tahun 2015
http://slidepdf.com/reader/full/kalimantan-timur-dalam-angka-tahun-2015 379/623
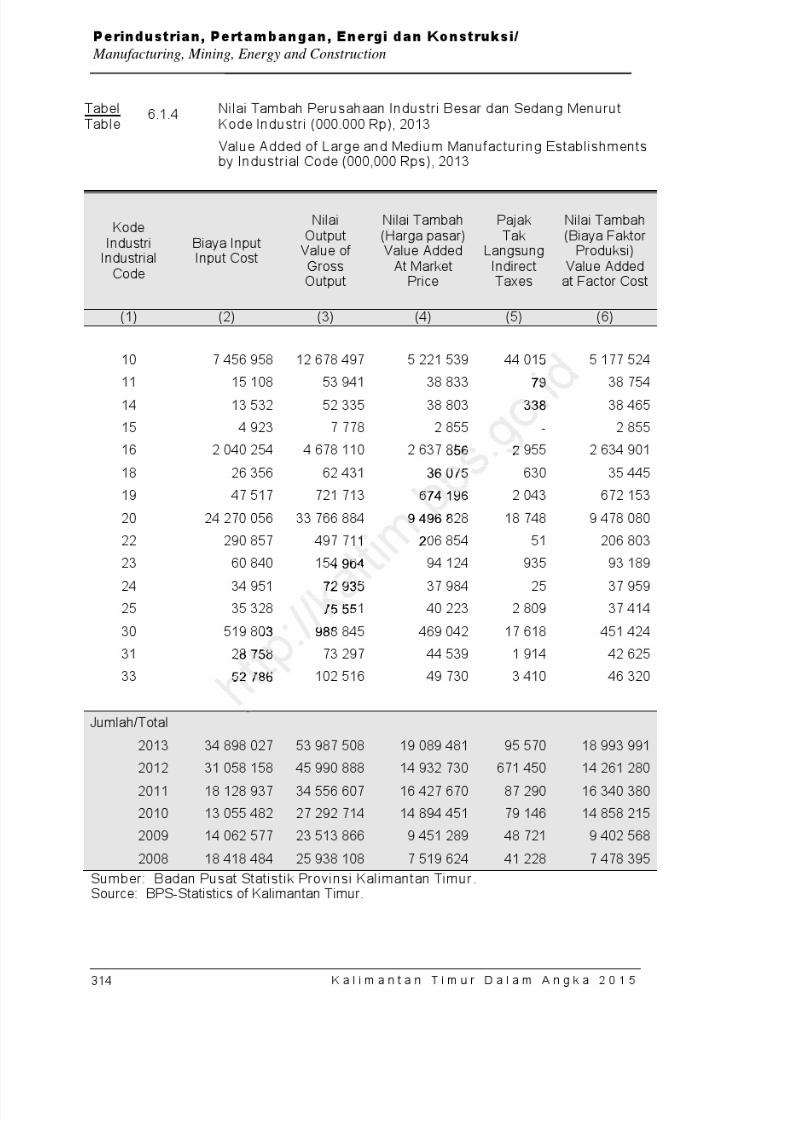
8/20/2019 Kalimantan Timur Dalam Angka Tahun 2015
http://slidepdf.com/reader/full/kalimantan-timur-dalam-angka-tahun-2015 380/623
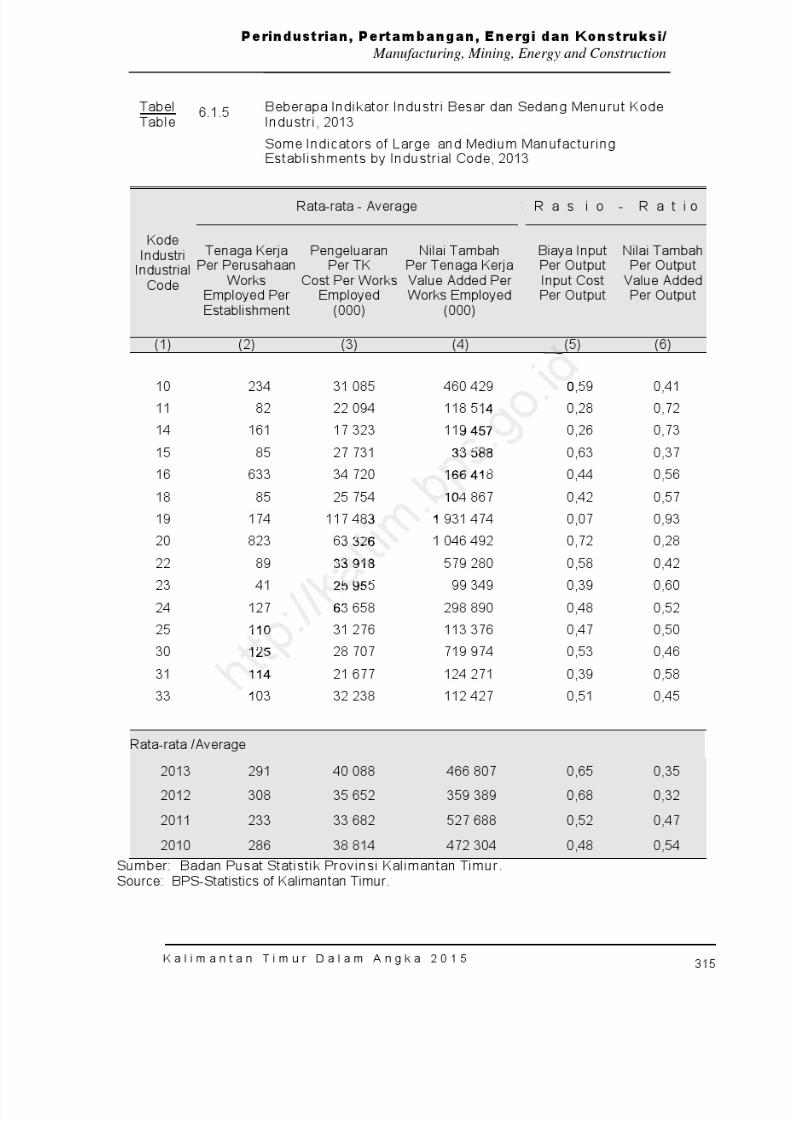
8/20/2019 Kalimantan Timur Dalam Angka Tahun 2015
http://slidepdf.com/reader/full/kalimantan-timur-dalam-angka-tahun-2015 381/623
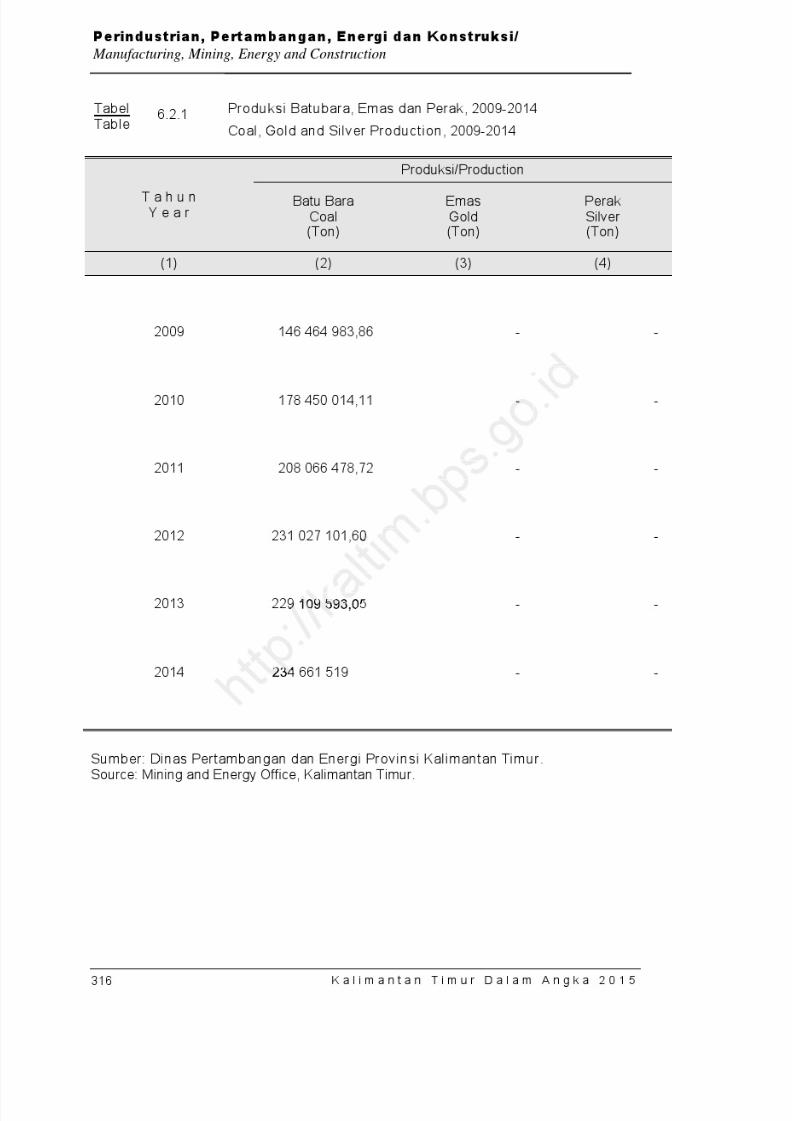
8/20/2019 Kalimantan Timur Dalam Angka Tahun 2015
http://slidepdf.com/reader/full/kalimantan-timur-dalam-angka-tahun-2015 382/623
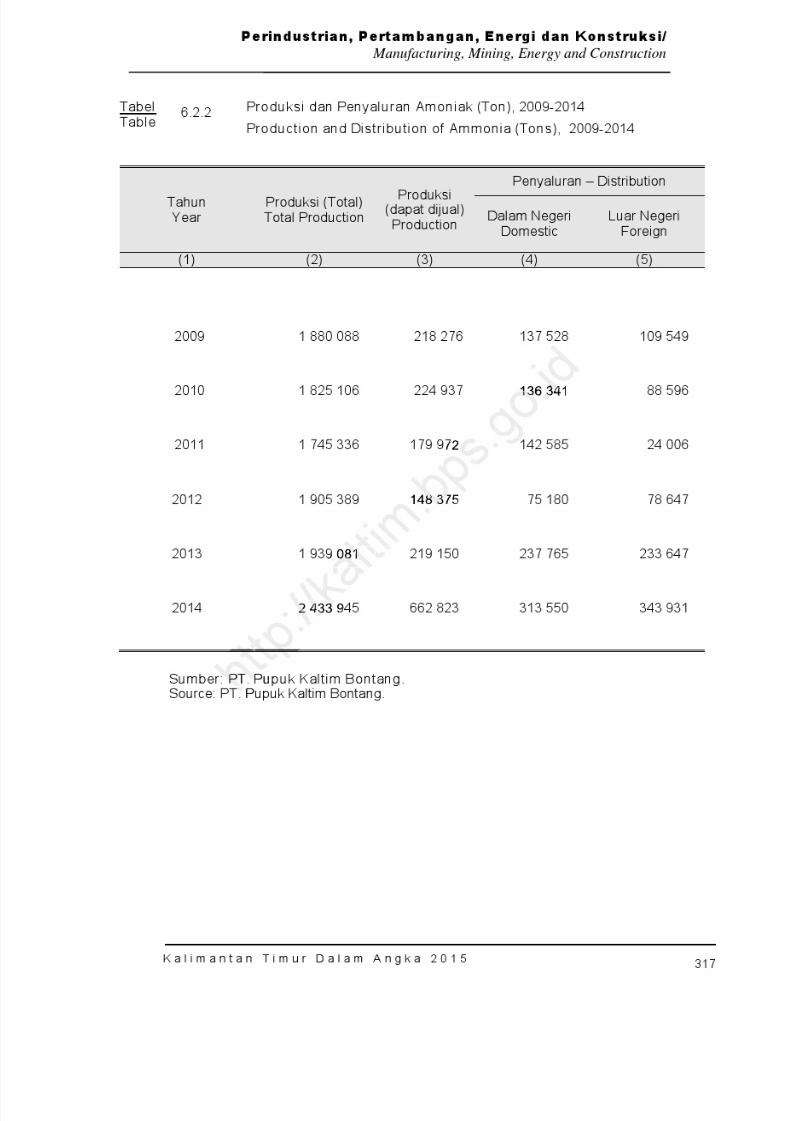
8/20/2019 Kalimantan Timur Dalam Angka Tahun 2015
http://slidepdf.com/reader/full/kalimantan-timur-dalam-angka-tahun-2015 383/623
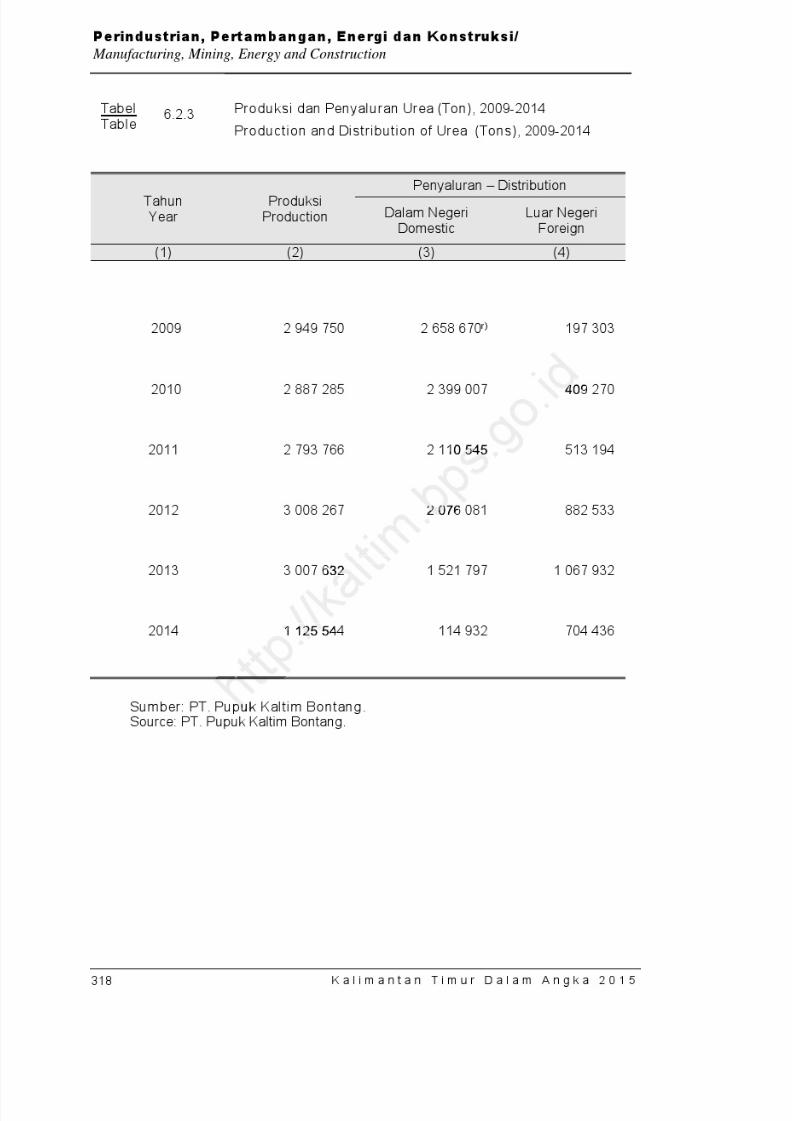
8/20/2019 Kalimantan Timur Dalam Angka Tahun 2015
http://slidepdf.com/reader/full/kalimantan-timur-dalam-angka-tahun-2015 384/623
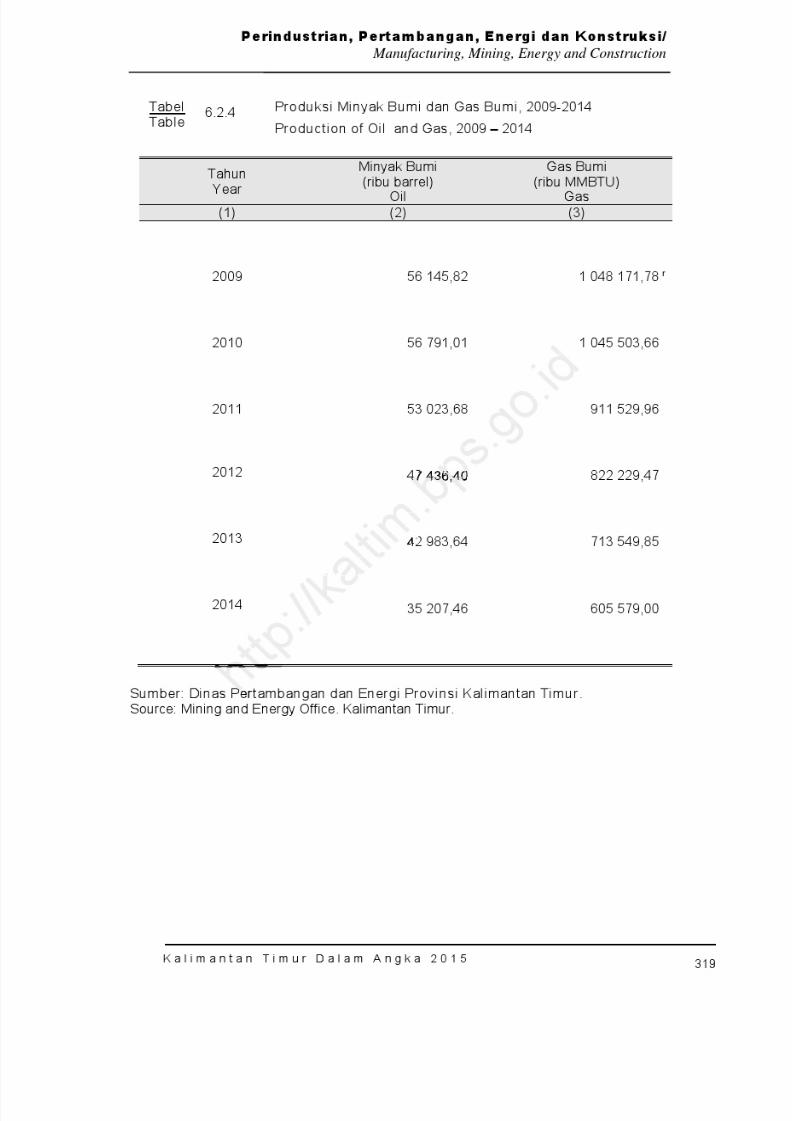
8/20/2019 Kalimantan Timur Dalam Angka Tahun 2015
http://slidepdf.com/reader/full/kalimantan-timur-dalam-angka-tahun-2015 385/623
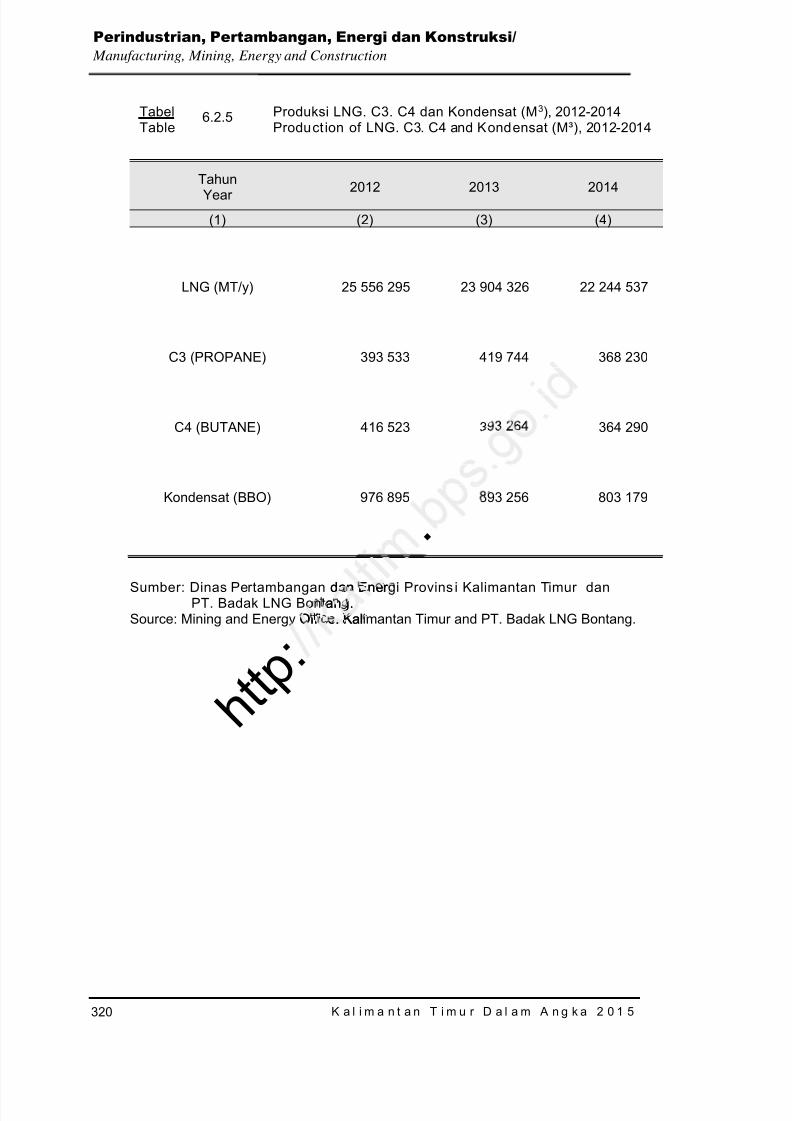
8/20/2019 Kalimantan Timur Dalam Angka Tahun 2015
http://slidepdf.com/reader/full/kalimantan-timur-dalam-angka-tahun-2015 386/623
K a l i m a n t a n T i m u r D a l a m A n g k a 2 0 1 5
320
Perindustrian, Pertambangan, Energi dan Konstruksi/ Manufacturing, Mining, Energy and Construction
TabelTable
6.2.5 Produksi LNG. C3. C4 dan Kondensat (M 3), 2012-2014Product ion of LNG. C3. C4 and Kondensat (M³), 2012-2014
TahunYear 2012 2013 2014(1) (2) (3) (4)
LNG (MT/y) 25 556 295 23 904 326 22 244 537
C3 (PROPANE) 393 533 419 744 368 230
C4 (BUTANE) 416 523 393 264 364 290
Kondensat (BBO) 976 895 893 256 803 179
Sumber: Dinas Pertambangan dan Energi Provins i Kalimantan Timur danPT. Badak LNG Bontang.
Source: Mining and Energy Office. Kalimantan Timur and PT. Badak LNG Bontang.
. dan Ener
ang.
h t t p : Office. Kal.
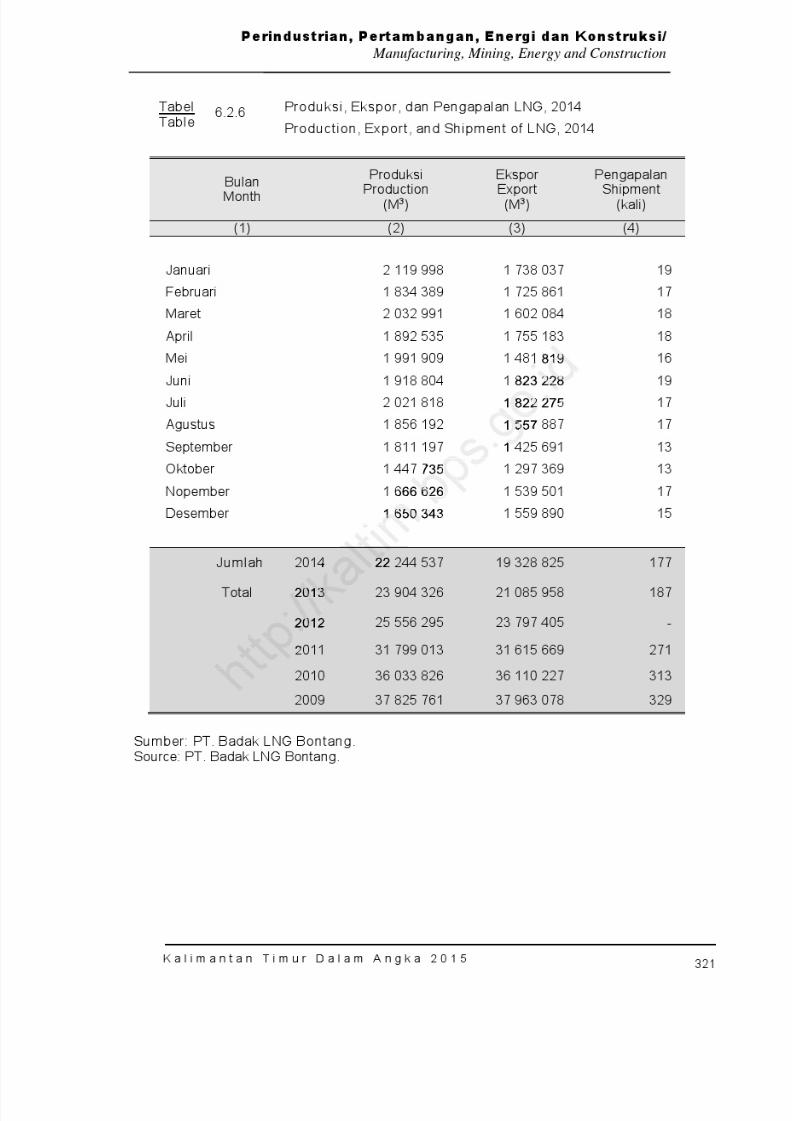
8/20/2019 Kalimantan Timur Dalam Angka Tahun 2015
http://slidepdf.com/reader/full/kalimantan-timur-dalam-angka-tahun-2015 387/623
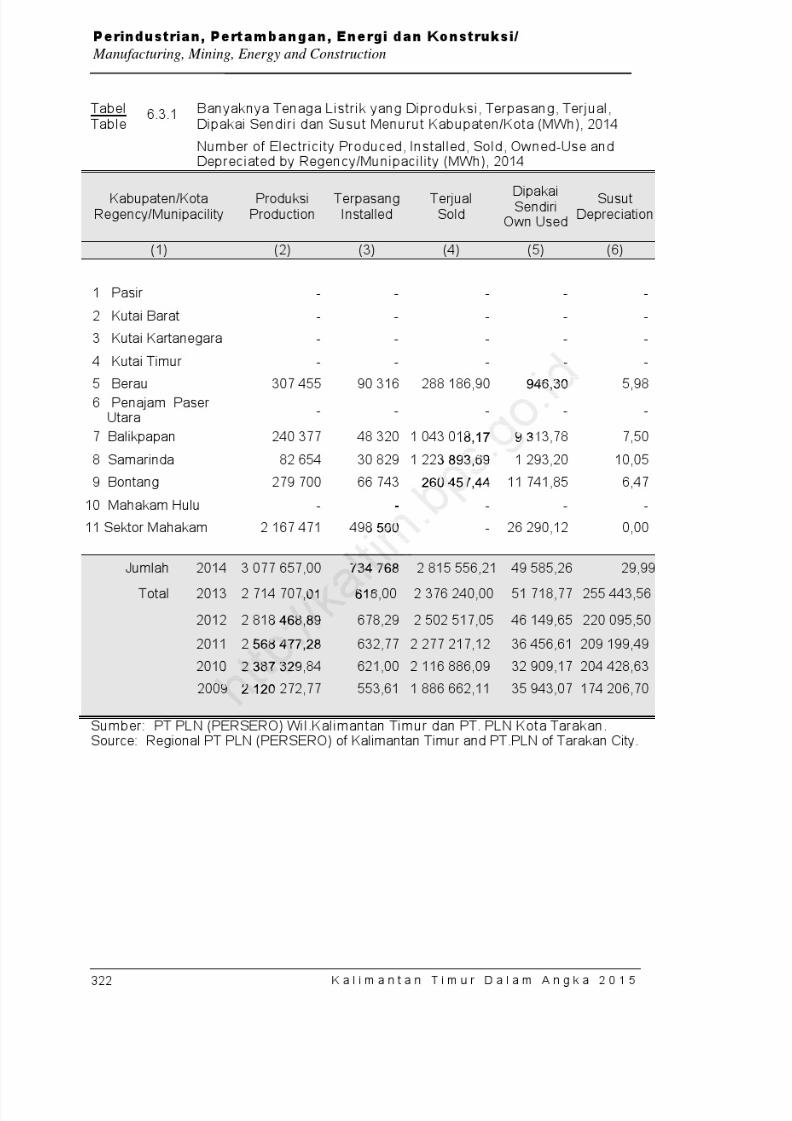
8/20/2019 Kalimantan Timur Dalam Angka Tahun 2015
http://slidepdf.com/reader/full/kalimantan-timur-dalam-angka-tahun-2015 388/623
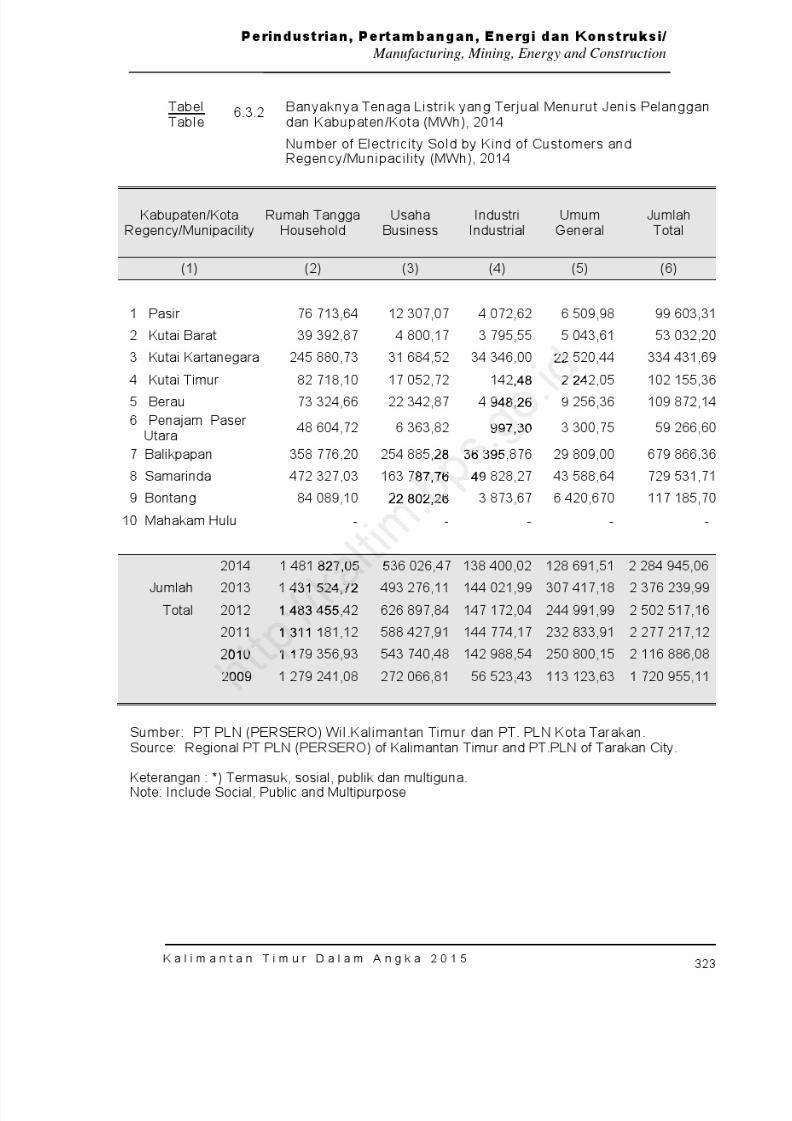
8/20/2019 Kalimantan Timur Dalam Angka Tahun 2015
http://slidepdf.com/reader/full/kalimantan-timur-dalam-angka-tahun-2015 389/623
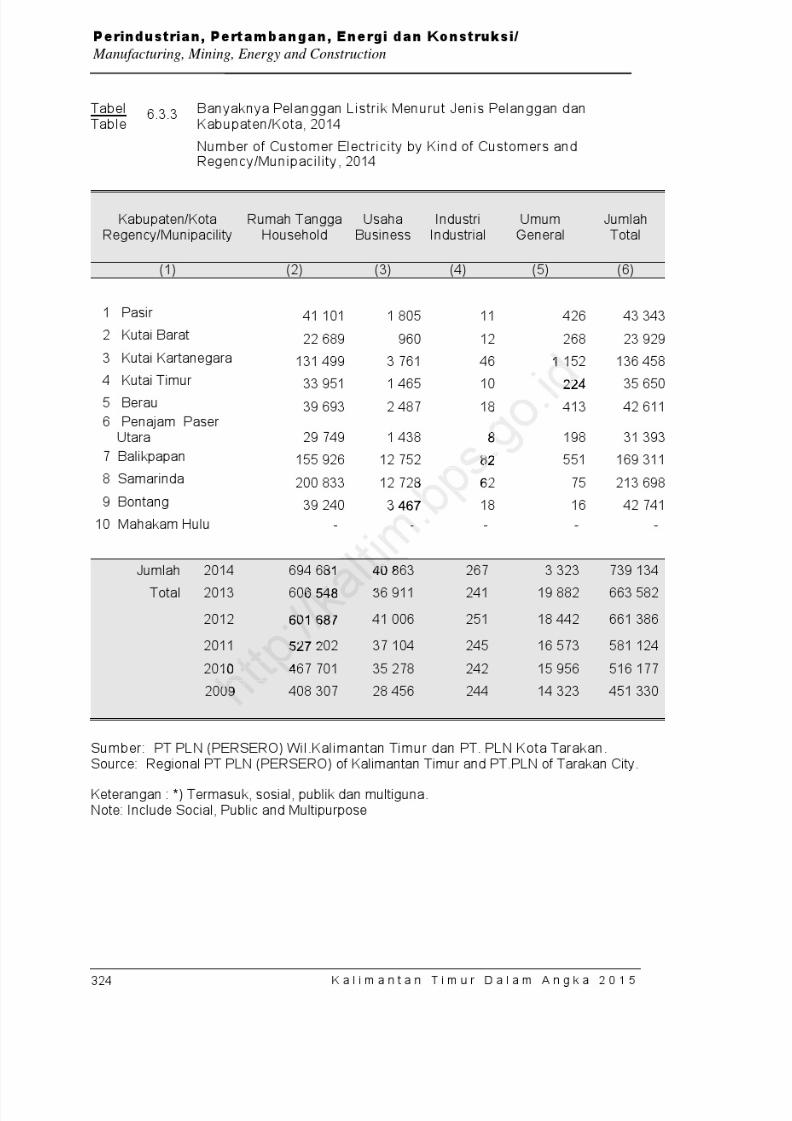
8/20/2019 Kalimantan Timur Dalam Angka Tahun 2015
http://slidepdf.com/reader/full/kalimantan-timur-dalam-angka-tahun-2015 390/623
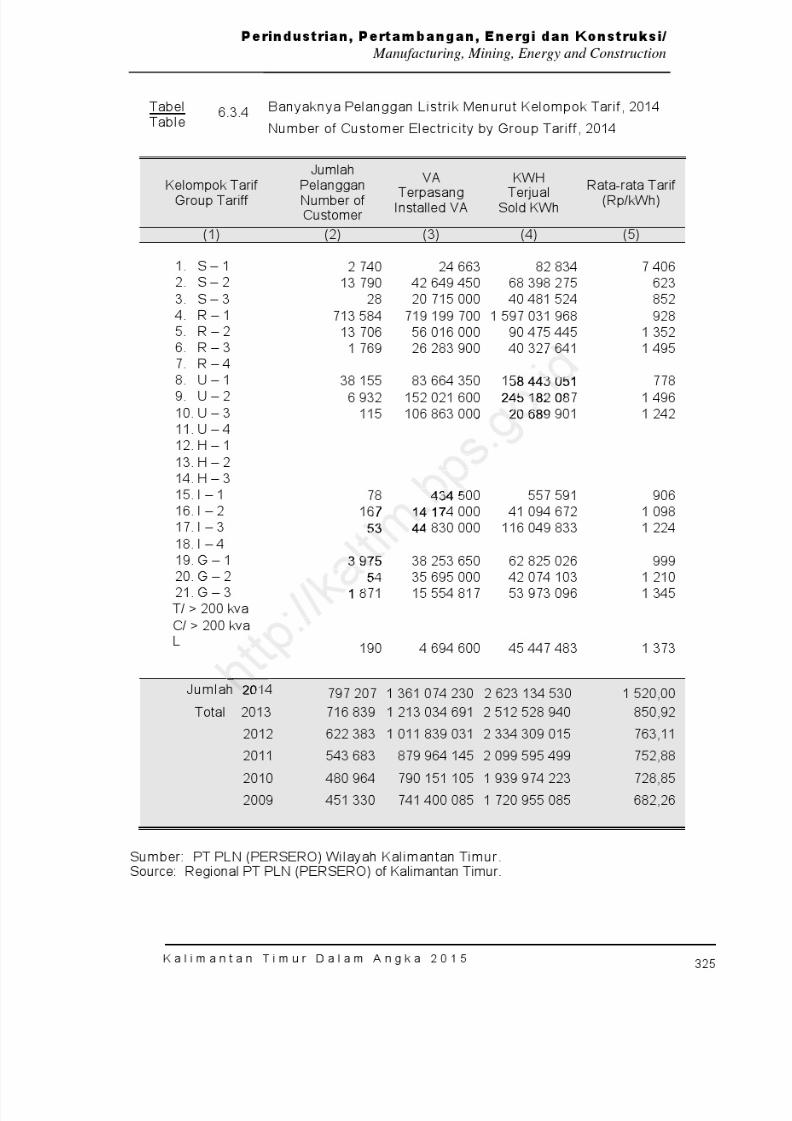
8/20/2019 Kalimantan Timur Dalam Angka Tahun 2015
http://slidepdf.com/reader/full/kalimantan-timur-dalam-angka-tahun-2015 391/623
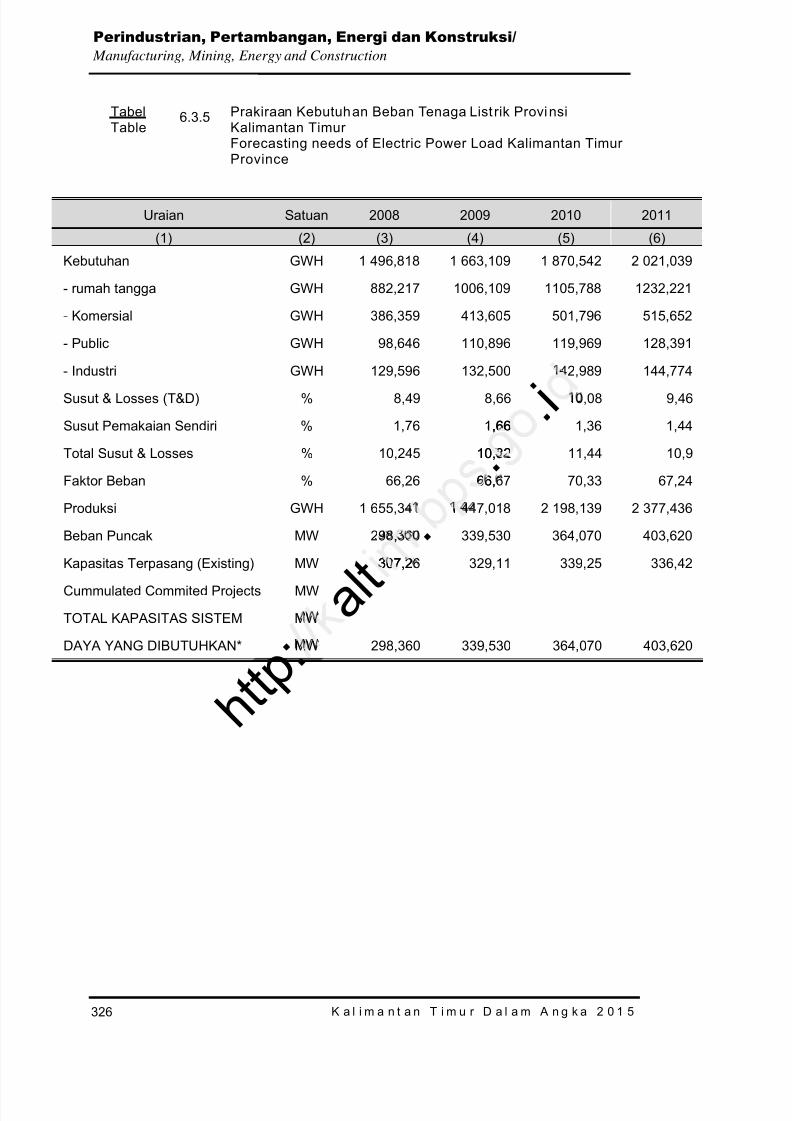
8/20/2019 Kalimantan Timur Dalam Angka Tahun 2015
http://slidepdf.com/reader/full/kalimantan-timur-dalam-angka-tahun-2015 392/623
K a l i m a n t a n T i m u r D a l a m A n g k a 2 0 1 5
326
Perindustrian, Pertambangan, Energi dan Konstruksi/ Manufacturing, Mining, Energy and Construction
TabelTable
6.3.5 Prakiraan Kebutuhan Beban Tenaga List rik ProvinsiKalimantan Timur Forecasting needs of Electric Power Load Kalimantan TimurProvince
Uraian Satuan 2008 2009 2010 2011
(1) (2) (3) (4) (5) (6)
Kebutuhan GWH 1 496,818 1 663,109 1 870,542 2 021,039
- rumah tangga GWH 882,217 1006,109 1105,788 1232,221
- Komersial GWH 386,359 413,605 501,796 515,652
- Public GWH 98,646 110,896 119,969 128,391
- Industri GWH 129,596 132,500 142,989 144,774
Susut & Losses (T&D) % 8,49 8,66 10,08 9,46
Susut Pemakaian Sendiri % 1,76 1,66 1,36 1,44
Total Susut & Losses % 10,245 10,32 11,44 10,9
Faktor Beban % 66,26 66,67 70,33 67,24
Produksi GWH 1 655,341 1 447,018 2 198,139 2 377,436
Beban Puncak MW 298,360 339,530 364,070 403,620
Kapasitas Terpasang (Existing) MW 307,26 329,11 339,25 336,42
Cummulated Commited Projects MW
TOTAL KAPASITAS SISTEM MW
DAYA YANG DIBUTUHKAN* MW 298,360 339,530 364,070 403,620
h t t p : a l t
. .
. i,66
10,32
66,
,,
307,2
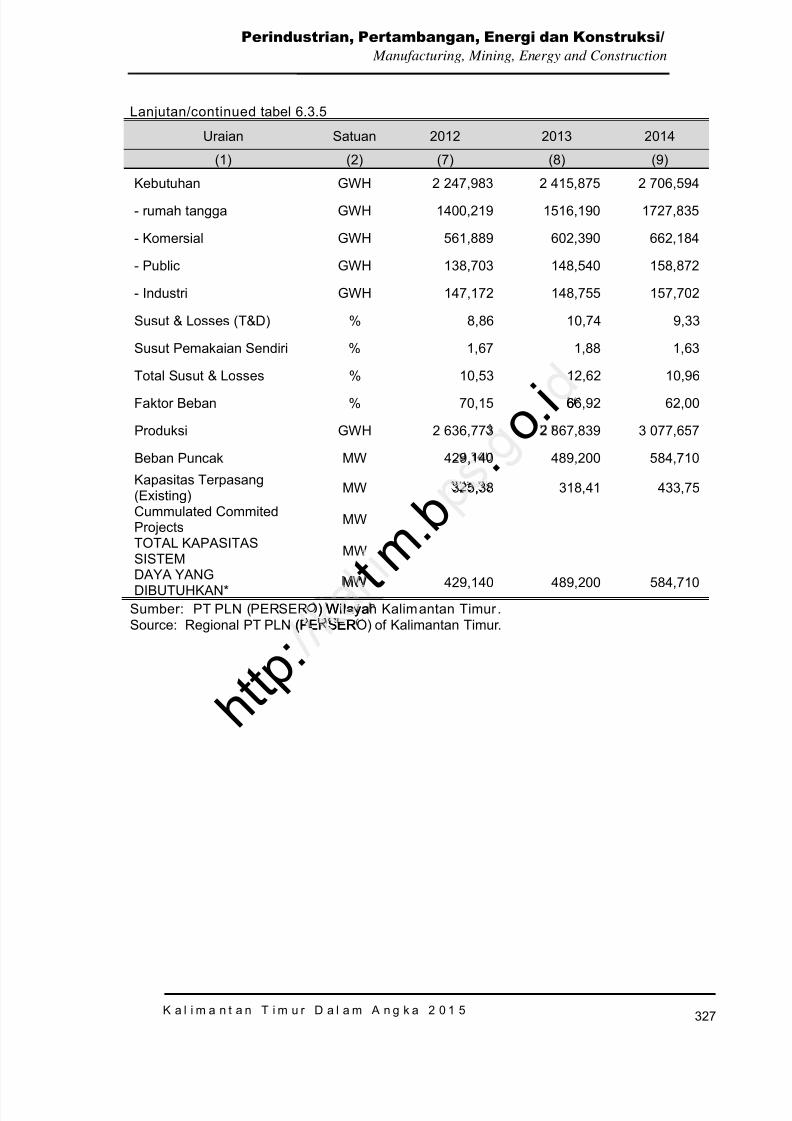
8/20/2019 Kalimantan Timur Dalam Angka Tahun 2015
http://slidepdf.com/reader/full/kalimantan-timur-dalam-angka-tahun-2015 393/623
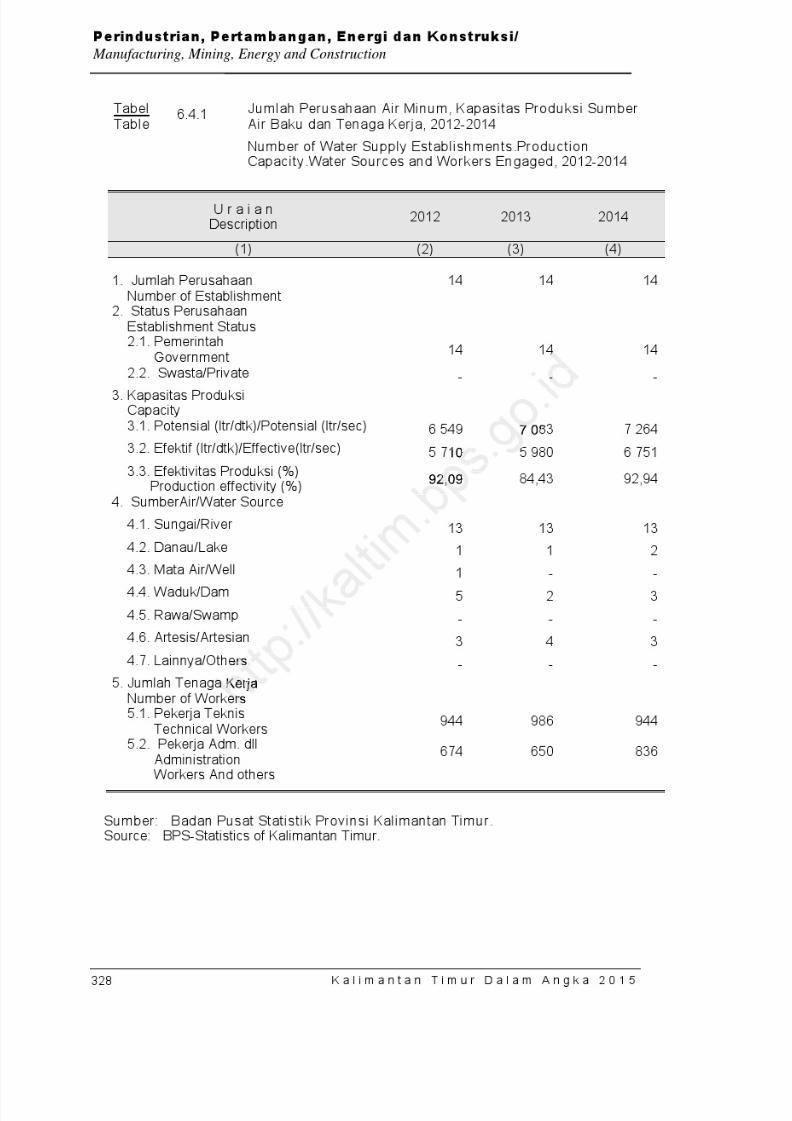
8/20/2019 Kalimantan Timur Dalam Angka Tahun 2015
http://slidepdf.com/reader/full/kalimantan-timur-dalam-angka-tahun-2015 394/623
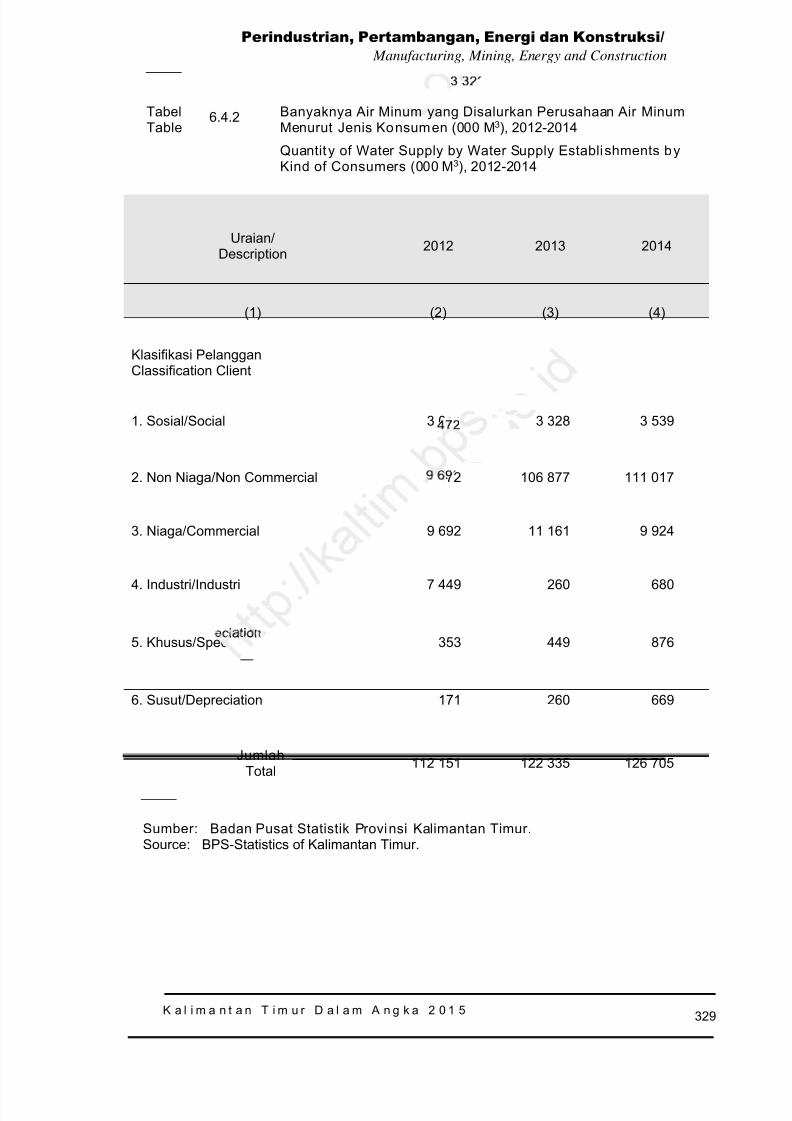
8/20/2019 Kalimantan Timur Dalam Angka Tahun 2015
http://slidepdf.com/reader/full/kalimantan-timur-dalam-angka-tahun-2015 395/623
K a l i m a n t a n T i m u r D a l a m A n g k a 2 0 1 5
329
Perindustrian, Pertambangan, Energi dan Konstruksi/ Manufacturing, Mining, Energy and Construction
TabelTable
6.4.2 Banyaknya Air Minum yang Disalurkan Perusahaan Air MinumMenurut Jenis Konsumen (000 M 3), 2012-2014
Quantit y of Water Supply by Water Supply Establi shments byKind of Consumers (000 M 3), 2012-2014
Uraian/Description 2012 2013 2014
(1) (2) (3) (4)
Klasifikasi PelangganClassification Client
1. Sosial/ Social 3 014 3 328 3 539
2. Non Niaga/ Non Commercial 91 472 106 877 111 017
3. Niaga/ Commercial 9 692 11 161 9 924
4. Industri/ Industri 7 449 260 680
5. Khusus/ Specials 353 449 876
6. Susut/ Depreciation 171 260 669
JumlahTotal 112 151 122 335 126 705
Sumber: Badan Pusat Statistik Provinsi Kalimantan Timur.Source : BPS-Statistics of Kalimantan Timur.

8/20/2019 Kalimantan Timur Dalam Angka Tahun 2015
http://slidepdf.com/reader/full/kalimantan-timur-dalam-angka-tahun-2015 396/623
K a l i m a n t a n T i m u r D a l a m A n g k a 2 0 1 5
330
Perindustrian, Pertambangan, Energi dan Konstruksi/ Manufacturing, Mining, Energy and Construction
TabelTable
6.4.3 Nilai Air Minum yang Disalurkan Perusahaan Air MinumMenurut Jenis Konsumen (000 Rp), 2012-2014
Value of Water Supplied by Water Supply Establishments byKind of Consumer (000 Rps), 2012-2014
Uraian/Description 2012 2013 2014
(1) (2) (3) (4)
Klasifikasi PelangganClassification Client
1. Sosial/ Social 6 855 859 8 473 776 9 302 787
2. Non Niaga/ Non Commercial 374 534 944 481 846 924 506 145 056
3. Niaga/ Commercial 69 986 909 83 340 085 82 359 931
4. Industri/ Industri 1 851 654 3 548 317 9 924 318
5. Khusus/ Specials 2 272 807 3 993 278 8 644 054
Jumlah/ Total 455 502 173 581 202 380 616 376 146
Sumber: Badan Pusat Statistik Provinsi Kalimantan Timur.Source : BPS-Statistics of Kalimantan Timur.
.
.
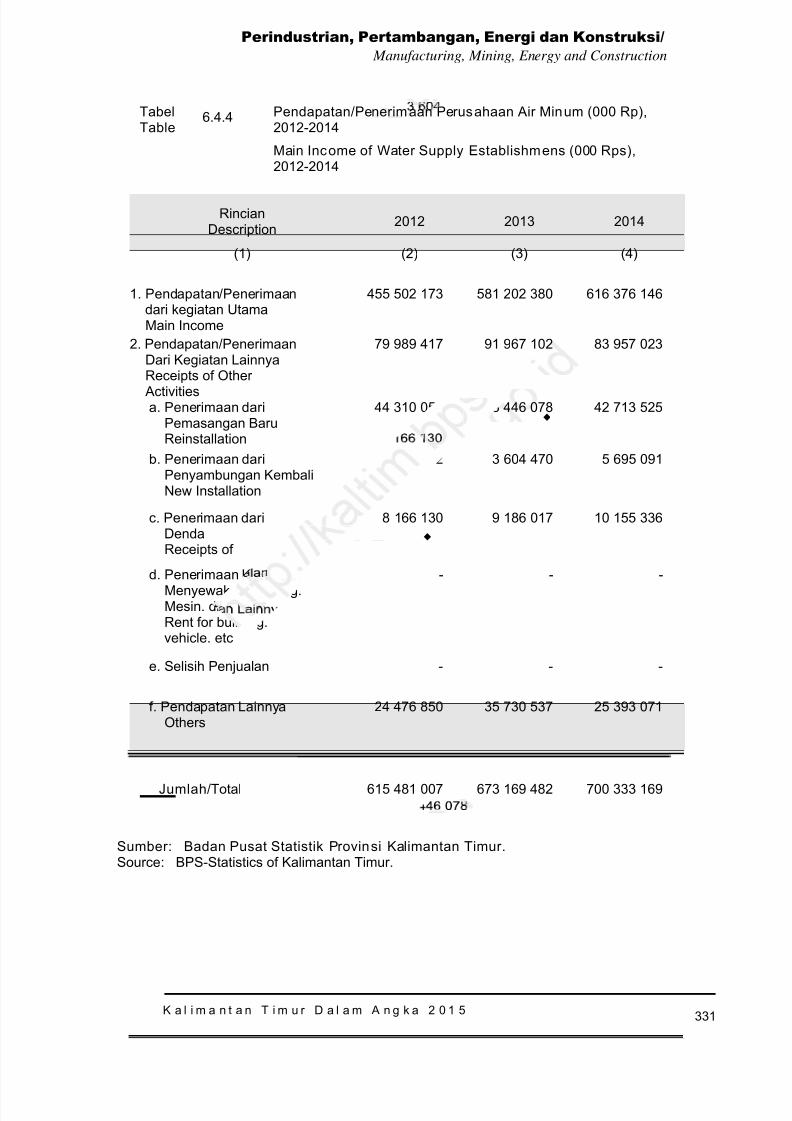
8/20/2019 Kalimantan Timur Dalam Angka Tahun 2015
http://slidepdf.com/reader/full/kalimantan-timur-dalam-angka-tahun-2015 397/623
K a l i m a n t a n T i m u r D a l a m A n g k a 2 0 1 5
331
Perindustrian, Pertambangan, Energi dan Konstruksi/ Manufacturing, Mining, Energy and Construction
TabelTable
6.4.4 Pendapatan/Penerimaan Perusahaan Air Minum (000 Rp),2012-2014
Main Income of Water Supply Establishmens (000 Rps),2012-2014
RincianDescription 2012 2013 2014
(1) (2) (3) (4)
1. Pendapatan/Penerimaandari kegiatan UtamaMain Income
455 502 173 581 202 380 616 376 146
2. Pendapatan/PenerimaanDari Kegiatan LainnyaReceipts of Other
Activities
79 989 417 91 967 102 83 957 023
a. Penerimaan dari Pemasangan Baru Reinstallation
44 310 055 43 446 078 42 713 525
b. Penerimaan dari Penyambungan Kembali New Installation
3 036 382 3 604 470 5 695 091
c. Penerimaan dari Denda Receipts of
8 166 130 9 186 017 10 155 336
d. Penerimaan Kotor dari Menyewakan Gedung. Mesin. dll Rent for building. vehicle. etc
- - -
e. Selisih Penjualan - - -
f. Pendapatan Lainnya Others
24 476 850 35 730 537 25 393 071
Jumlah /Total 615 481 007 673 169 482 700 333 169
Sumber: Badan Pusat Statistik Provinsi Kalimantan Timur.Source : BPS-Statistics of Kalimantan Timur.
.
.
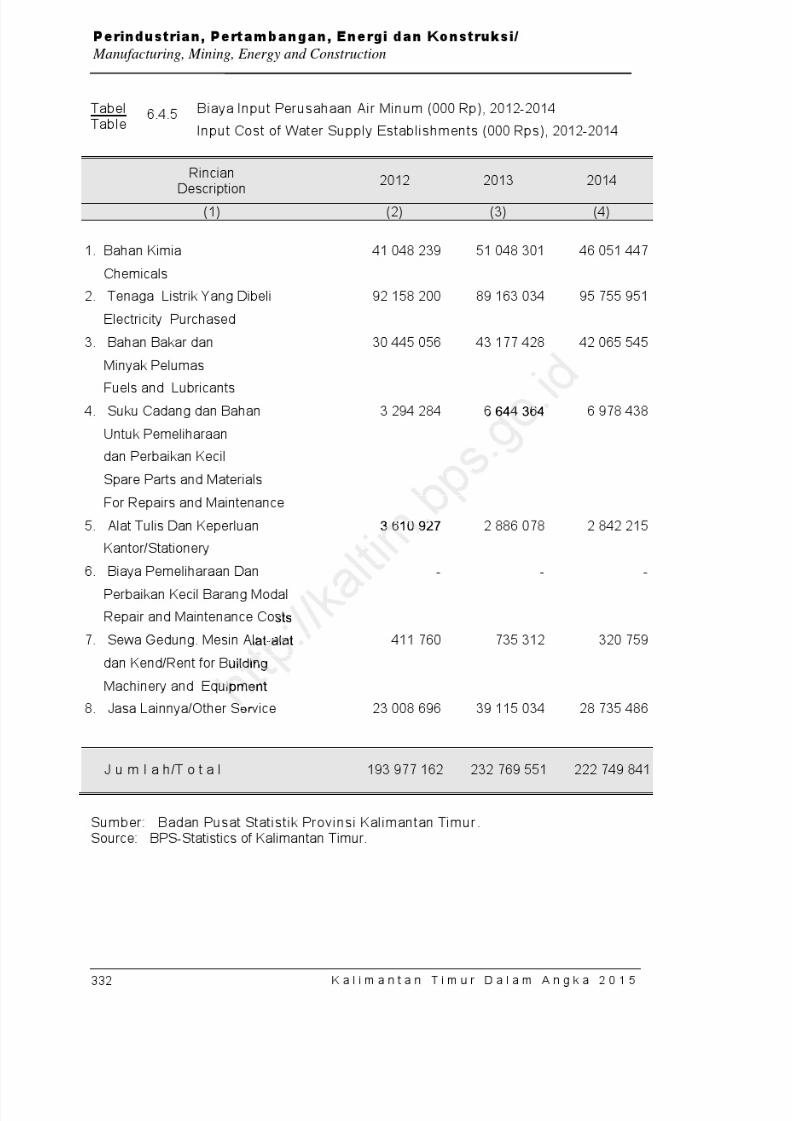
8/20/2019 Kalimantan Timur Dalam Angka Tahun 2015
http://slidepdf.com/reader/full/kalimantan-timur-dalam-angka-tahun-2015 398/623

8/20/2019 Kalimantan Timur Dalam Angka Tahun 2015
http://slidepdf.com/reader/full/kalimantan-timur-dalam-angka-tahun-2015 399/623
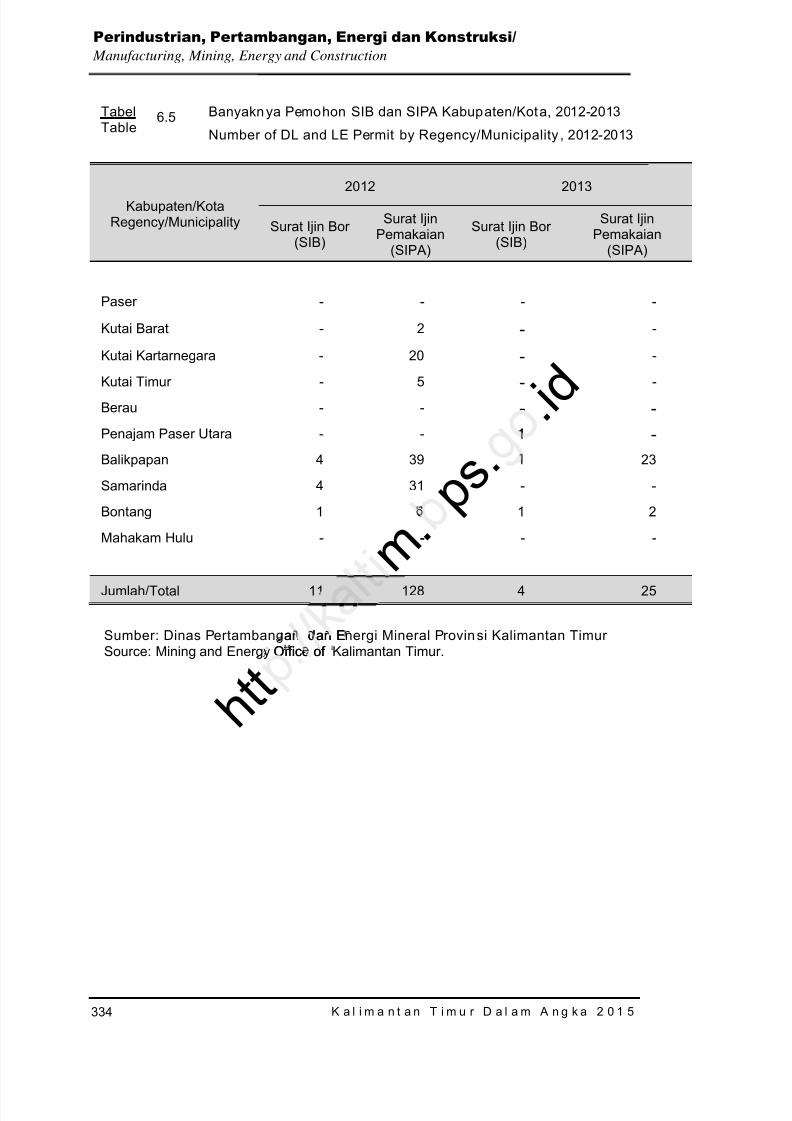
8/20/2019 Kalimantan Timur Dalam Angka Tahun 2015
http://slidepdf.com/reader/full/kalimantan-timur-dalam-angka-tahun-2015 400/623
K a l i m a n t a n T i m u r D a l a m A n g k a 2 0 1 5
334
Perindustrian, Pertambangan, Energi dan Konstruksi/ Manufacturing, Mining, Energy and Construction
TabelTable
6.5 Banyakn ya Pemohon SIB dan SIPA Kabupaten/Kota, 2012-2013
Number of DL and LE Permit by Regency/Municipality , 2012-2013
Kabupaten/KotaRegency/Municipality
2012 2013
Surat Ijin Bor(SIB)
Surat IjinPemakaian
(SIPA)
Surat Ijin Bor(SIB)
Surat IjinPemakaian
(SIPA)
Paser - - - -
Kutai Barat - 2 - -
Kutai Kartarnegara - 20 - -
Kutai Timur - 5 - -Berau - - - -Penajam Paser Utara - - 1 -Balikpapan 4 39 1 23
Samarinda 4 31 - -
Bontang 1 8 1 2
Mahakam Hulu - - - -
Jumlah/ Total 11 128 4 25
Sumber: Dinas Pertambangan dan Energi Mineral Provin si Kalimantan TimurSource: Mining and Energy Office of Kalimantan Timur.
m . p
s . . i d-
1
-
an dan E
h t t Office of
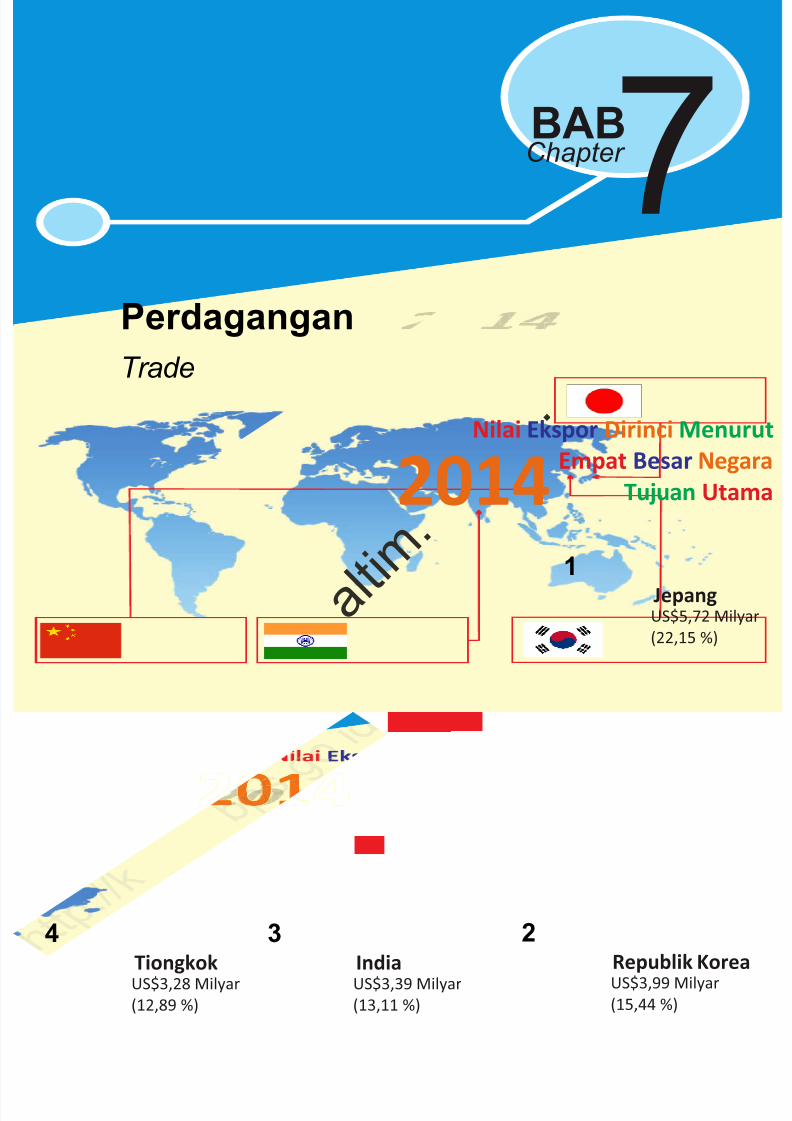
8/20/2019 Kalimantan Timur Dalam Angka Tahun 2015
http://slidepdf.com/reader/full/kalimantan-timur-dalam-angka-tahun-2015 401/623
7Perdagangan
BABChapter
Trade
JepangUS$5,72 Milyar(22,15 %)
Republik KoreaUS$3,99 Milyar(15,44 %)
IndiaUS$3,39 Milyar(13,11 %)
TiongkokUS$3,28 Milyar(12,89 %)
Nilai Ekspor Dirinci MenurutEmpat Besar Negara
Tujuan Utama20141
234
a l t i m .
.

8/20/2019 Kalimantan Timur Dalam Angka Tahun 2015
http://slidepdf.com/reader/full/kalimantan-timur-dalam-angka-tahun-2015 402/623
h t t p : / / k a l t i m
. b p s . g o . i d
8/20/2019 Kalimantan Timur Dalam Angka Tahun 2015
http://slidepdf.com/reader/full/kalimantan-timur-dalam-angka-tahun-2015 403/623
337
Perdagangan / Trade
K a l i m a n t a n T i m u r D a l a m A n g k a 2 0 1 5
7.1. E K S P O R
Perdagangan luar negerimerupakan sektor ekonomi yangsangat berperan dalam menunjangpembangunan ekonomi Indonesiapada umumnya dan KalimantanTimur pada khususnya. Dari kegiatanekspor dapat diperoleh devisa yangmerupakan salah satu sumber danauntuk pembangunan, sementara dari
kegiatan impor dapat diperolehbahan baku dan barang modal yangdiperlukan dalam pembangunan.
Definisi ekspor adalahpengiriman barang dagangan keluarnegeri melalui pelabuhan diseluruhwilayah Republik Indonesia, baikbersifat komersial maupun bukankomersial. Sedangkan yangdimaksudkan Impor adalahpengiriman barang dagangan dariluar negeri ke pelabuhan di seluruhwilayah Indonesia kecuali wilayahbebas yang dianggap luar negeri,yang bersifat komersial maupunbukan komersial.
Nilai ekspor adalah nilai transaksibarang ekspor sampai diatas kapalpelabuhan muat dalam keadaan freeon board (f.o.b), sedangkan nilaiimpor adalah nilai transaksi barangdagangan yang diimpor dari luarnegeri dalam keadaan cost,insurance, and freight (c.i.f).
7.1. EXPORT
Export and import has animportant role in supportingIndonesia economic development,especially for Kalimantan Timur.Through the export activities can beobtained foreign exchange which canbe used as one of Source for fundingthe development. While from theimport activities can be obtained raw
materials and capital goods that alsoneeded for development.
Definition of exports aretransaction activities of merchandisegoods that sending to abroad throughIndonesia ports, either commercial ornon-commercial purposes. Whileimports are merchandise goods thatacquired from abroad throughIndonesian ports, and also boundedarea which are regarded as “abroad”either commercial or non-commercial
purposes.
The export value is thetransaction value of export goods tothe port of loading on the vessel in astate of free on board (fob), while theimport value is the transaction valueof merchandise imported fromabroad in a state cost, insurance, and
freight (cif).
api
o .
ik
ukanyan
a aaganga
uhan d ia ec
ianggako
eve op
Definiransact
gooIn
8/20/2019 Kalimantan Timur Dalam Angka Tahun 2015
http://slidepdf.com/reader/full/kalimantan-timur-dalam-angka-tahun-2015 404/623
338
Perdagangan / Trade
K a l i m a n t a n T i m u r D a l a m A n g k a 2 0 1 5
Perkembangan nilai eksporKalimantan Timur selama 2011 –2014menunjukkan angka yang menurun.Pada tahun 2013 nilai ekspor sebesarUS$ 31,00 milyar dan tahun 2014menurun menjadi US$ 25,82 milyar.Akan tetapi, nilai ekspor tahun 2011merupakan nilai ekspor tertinggiyaitu US$ 37,97 milyar.
Kalimantan Timur da-lammenghasilkan devisa negara melaluiperdaga-ngan luar negeri (ekspor)dibedakan menurut migas dannonmigas. Perkemba-ngan ekspornonmigas mulai memperlihatkan ke-naikan yang cukup berarti. Jumlahekspor nonmigas sudah lebih tinggidiban-ding migas. Tahun 2014 ekspornonmigas menca-pai US$ 14,96milyar, atau turun 17,63 % dibanding
ta-hun 2013. Sedangkan un-tukmigas tahun 2014 tercatat US$ 10,87milyar dengan persentase penurunan15,39 %.
Besarnya nilai ekspor KalimantanTimur bila diamati dari pelabuhanmuat, maka total nilai ekspor dipelabuhan Bontang mencapai US$9,48 milyar, dan masih merupakanpelabuhan terbesar untukmengekspor barang-barangKalimantan Timur ke Luar negeri.Sedangkan peringkat kedua tahun2014 adalah pelabuhan Samarindadengan nilai US$ 4,80 milyar.
Export value of KalimantanTimur in 2012-2013 has showeddecreasing. In 2012 the export valuewas US $ 33.79 billion and in 2013decreased to US$ 31.00 billion. Butexports value in 2011 higher is US $37.97 billion.
Kalimantan Timur in generating foreign exchange through foreigntrade (exports) are distinguished
according to the oil and non oil andgas. The development of non-oilexports began to show a significantincrease. The number of non-oilexports are higher than oil-gas. In2014 non-oil exports reached US$14,96 billion, down 17,63% comparedto the year 2013. As for the oil and gasreached US$ 10,87 billion, with the percentage decrease of 15.39%.
The amount of the export value ofKalimantan Timur when observed from the port of loading, the totalvalue of exports at the port of
Bontang reached US$ 9.48 billion, andstill is the largest port for exportinggoods to foreign countries ofKalimantan Timur . While secondranking in 2014 is the port ofSamarinda with a value of US$ 4.80billion.
oi aelopme
an to s
uk10,87,nuruna
spor Kaliti daril nil
. T es are
4 non-14,96 bilto tre
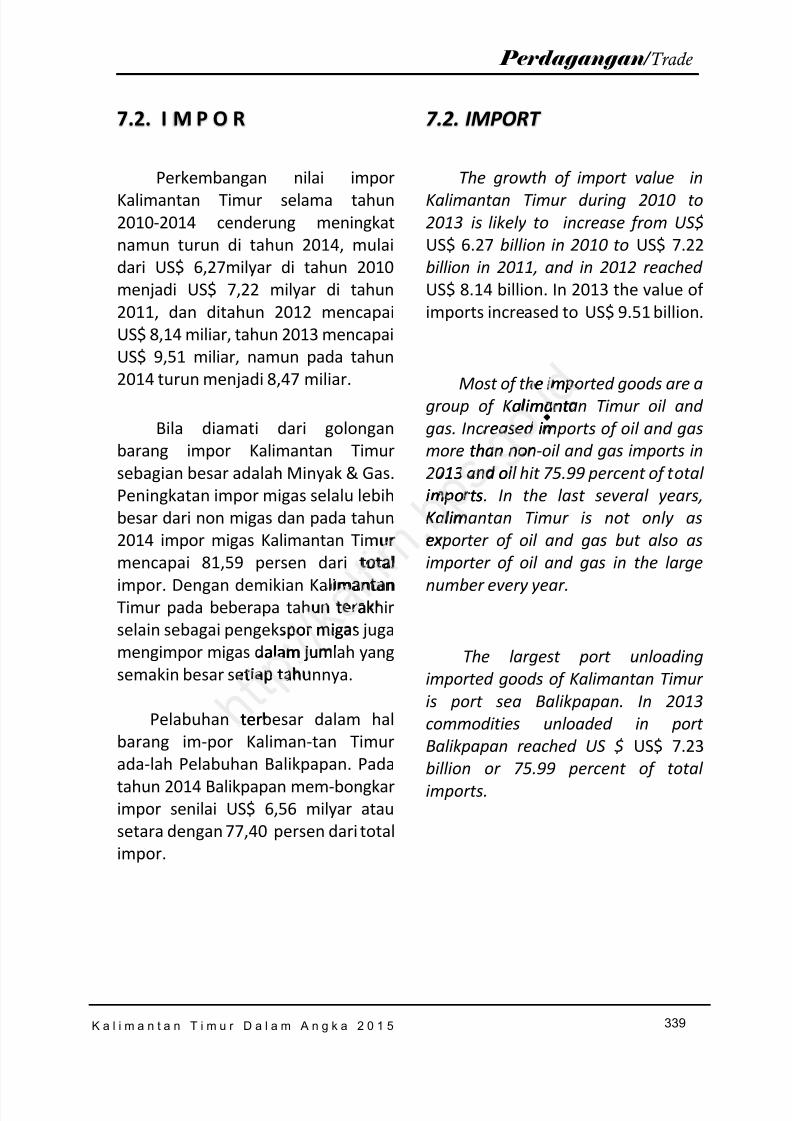
8/20/2019 Kalimantan Timur Dalam Angka Tahun 2015
http://slidepdf.com/reader/full/kalimantan-timur-dalam-angka-tahun-2015 405/623
339
Perdagangan / Trade
K a l i m a n t a n T i m u r D a l a m A n g k a 2 0 1 5
7.2. I M P O R
Perkembangan nilai imporKalimantan Timur selama tahun2010-2014 cenderung meningkatnamun turun di tahun 2014, mulaidari US$ 6,27milyar di tahun 2010menjadi US$ 7,22 milyar di tahun2011, dan ditahun 2012 mencapaiUS$ 8,14 miliar, tahun 2013 mencapaiUS$ 9,51 miliar, namun pada tahun
2014 turun menjadi 8,47 miliar.
Bila diamati dari golonganbarang impor Kalimantan Timursebagian besar adalah Minyak & Gas.Peningkatan impor migas selalu lebihbesar dari non migas dan pada tahun2014 impor migas Kalimantan Timurmencapai 81,59 persen dari totalimpor. Dengan demikian KalimantanTimur pada beberapa tahun terakhirselain sebagai pengekspor migas jugamengimpor migas dalam jumlah yangsemakin besar setiap tahunnya.
Pelabuhan terbesar dalam halbarang im-por Kaliman-tan Timur
ada-lah Pelabuhan Balikpapan. Padatahun 2014 Balikpapan mem-bongkarimpor senilai US$ 6,56 milyar atausetara dengan 77,40 persen dari totalimpor.
7.2. IMPORT
The growth of import value inKalimantan Timur during 2010 to2013 is likely to increase from US$US$ 6.27 billion in 2010 to US$ 7.22billion in 2011, and in 2012 reachedUS$ 8.14 billion. In 2013 the value ofimports increased to US$ 9.51 billion .
Most of the imported goods are agroup of Kalimantan Timur oil andgas. Increased imports of oil and gasmore than non-oil and gas imports in2013 and oil hit 75.99 percent of totalimports. In the last several years,Kalimantan Timur is not only asexporter of oil and gas but also asimporter of oil and gas in the largenumber every year.
The largest port unloadingimported goods of Kalimantan Timuris port sea Balikpapan. In 2013commodities unloaded in portBalikpapan reached US $ US$ 7.23
billion or 75.99 percent of totalimports.
. e impa imant
eas ed i
urtotal
mantanun tera
por migalam ju
tiap ta
ter
than no13 an o
importsKalie
8/20/2019 Kalimantan Timur Dalam Angka Tahun 2015
http://slidepdf.com/reader/full/kalimantan-timur-dalam-angka-tahun-2015 406/623
340 K a l i m a n t a n T i m u r D a l a m A n g k a 2 0 1 5
Perdagangan /Trade
PENJELASAN TEKNIS
1. Sistem pencatatan statistikimpor adalah “ Special Trade”
dengan wilayah pencatatanmeliputi seluruh wilayahpabean di Kalimantan Timur,sedangkan sistem pencatatanstatistik ekspor adalah“General Trade ” denganwilayah pencatatan meliputiseluruh geografis KalimantanTimur.
2. Pengesahan dokumen ekspordan impor dilakukan oleh Beadan Cukai berdasarkan Perse-tujuan Muat/Bongkar Barang.
3. Data ekspor berasal daridokumen Pemberitahuan Eks-por Barang (PEB) yang diisioleh eksportir.
4. Data impor berasal daridokumen Pemberitahuan Im-por Untuk Dipakai (PIUD) yangdiisi oleh importir.
5. Barang-barang yang dikirim keluar daerah untuk diolahdicatat sebagai ekspor, se-dangkan hasil olahan yangdikembalikan ke daerahKalimantan Timur dicatatsebagai impor.
6. Barang-barang dari luar daerahyang diolah dan diperbaiki didalam daerah KalimantanTimur dicatat sebagai barangimpor meskipun barang olahantersebut akan kembali ke luar
daerah.
TECHNICAL NOTES
1. The recording of importstatistics is based on “specialtrade” system covering allKalimantan Timur Customsareas, while the recording ofexport statistics is based on“general trade” system whichcovers all Kalimantan Timurgeographical areas.
2. The legalization of export andimport documents isconducted by the custom andexcise office based ondocuments known asloading/unloadingagreement.
3. The export data are compiledbased on export documents
known as export declarations(PEB) filled by exporters.
4. The import data are compiledbased on import documentsknown as Import Declarations for Used (PIUD) filled byimporters.
5. Goods sent to out of region for processing purposes arerecorded as export. While its product sent to KalimantanTimur are recorded as import.
6. Goods from out of regionwhich processed and modifiedin Kalimantan Timur are stillrecorded as imports althoughthe products will be returned
to out of region.
t i m m- yang
g dikiriuntuk
ai eko
tiodocucte y
cise odocumloada
.
8/20/2019 Kalimantan Timur Dalam Angka Tahun 2015
http://slidepdf.com/reader/full/kalimantan-timur-dalam-angka-tahun-2015 407/623
341
Perdagangan / Trade
K a l i m a n t a n T i m u r D a l a m A n g k a 2 0 1 5
7. Sistem pengolahan dokumenimpor/ekspor adalah sistem“Carry Over ” yaitu dokumenditunggu selama satu bulan,setelah bulan berjalan, dandokumen-dokumen yang ter-lambat akan diolah untukbulan berikutnya.
7. The carry-over system is usedin processing export andimport documents.Documents are processedone month after the currentmonth, while those receivedlater will be processed for thesucceeding month.
h t t p : / / k a l t i m
. b p s . g o . i d
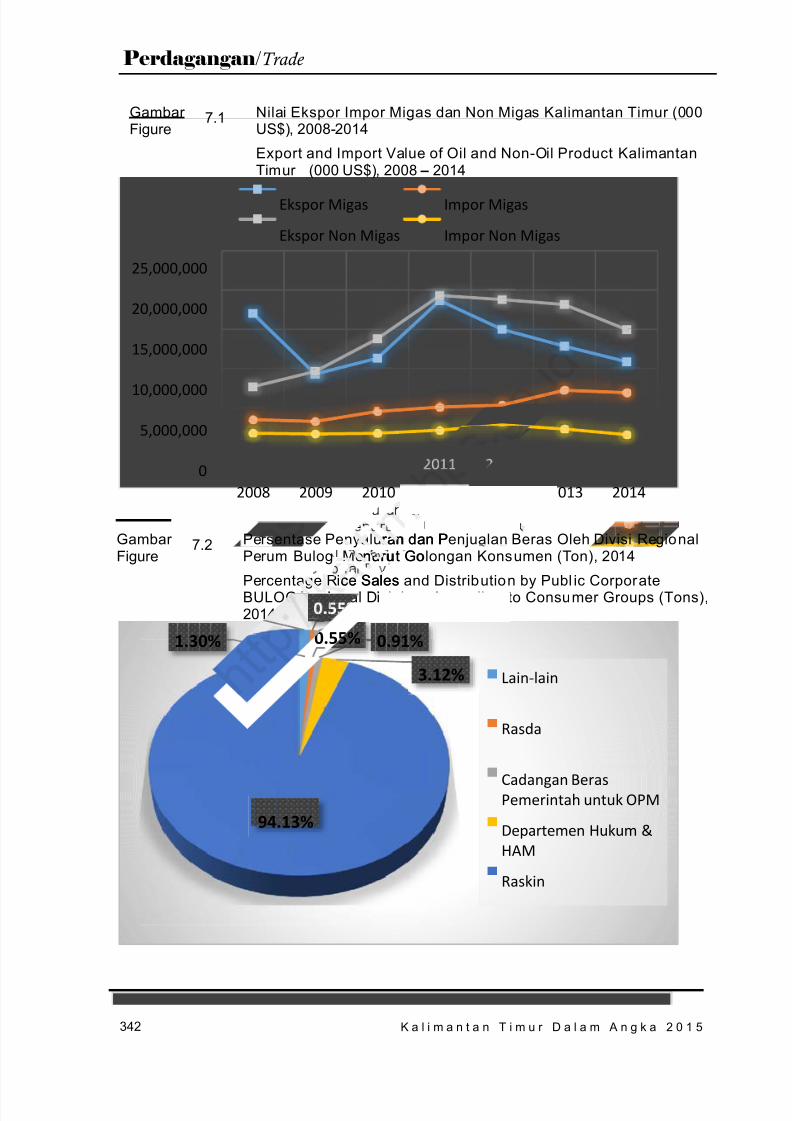
8/20/2019 Kalimantan Timur Dalam Angka Tahun 2015
http://slidepdf.com/reader/full/kalimantan-timur-dalam-angka-tahun-2015 408/623
342 K a l i m a n t a n T i m u r D a l a m A n g k a 2 0 1 5
Perdagangan /Trade
Gambar Figure
7.1 Nilai Ekspor Impor Migas dan Non Migas Kalimantan Timur (000US$), 2008-2014
Export and Import Value of Oil and Non-Oil Product KalimantanTimur (000 US$), 2008 – 2014
Gambar Figure
7.2 Persentase Penyaluran dan Penjualan Beras Oleh Divisi RegionalPerum Bulog Menurut Golongan Konsumen (Ton), 2014
Percentage Rice Sales and Distribution by Publ ic CorporateBULOG Regional Division , According to Consumer Groups (Tons),2014
0
5,000,000
10,000,000
15,000,000
20,000,000
25,000,000
2008 2009 2010 2011 2012 2013 2014
Ekspor Migas Impor Migas
Ekspor Non Migas Impor Non Migas
1.30% 0.55% 0.91%
3.12%
94.13%
Lain-lain
Rasda
Cadangan BerasPemerintah untuk OPM
Departemen Hukum &HAM
Raskin
ran dan Pnurut Go
ce Salesgional Di
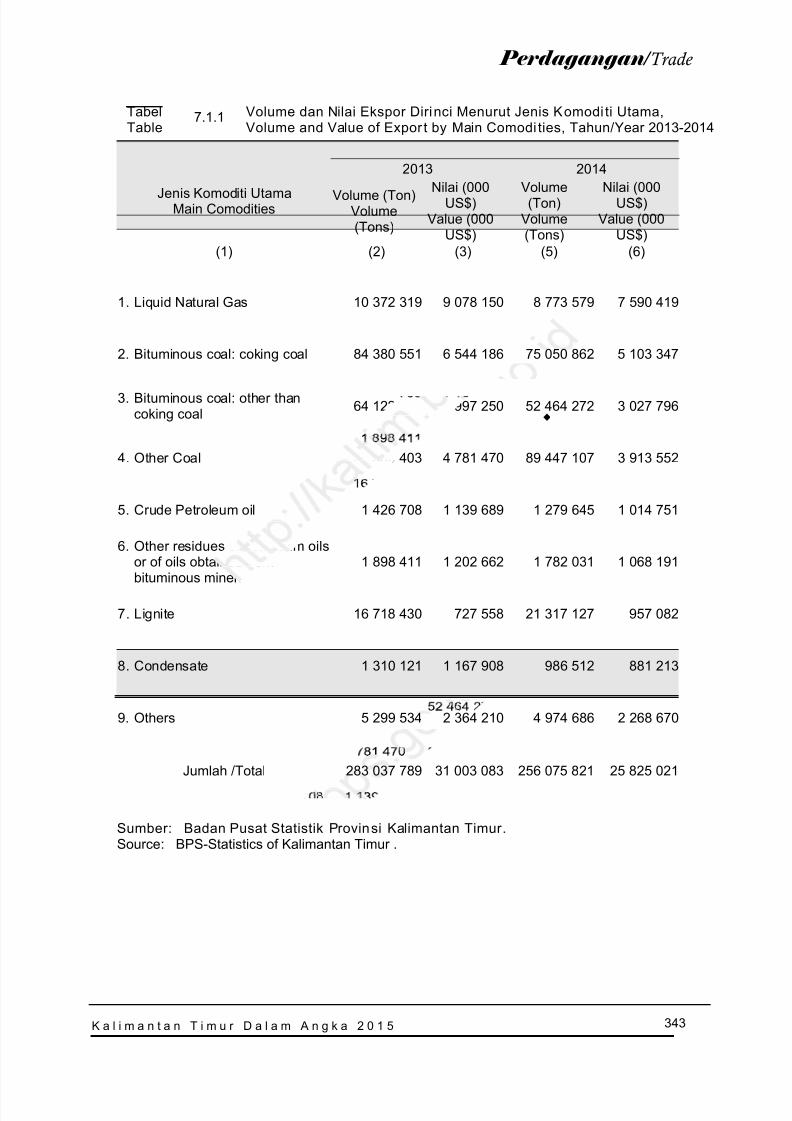
8/20/2019 Kalimantan Timur Dalam Angka Tahun 2015
http://slidepdf.com/reader/full/kalimantan-timur-dalam-angka-tahun-2015 409/623
343
Perdagangan / Trade
K a l i m a n t a n T i m u r D a l a m A n g k a 2 0 1 5
TabelTable
7.1.1 Volume dan Nilai Ekspor Dirinci Menurut Jenis Komodi ti Utama,Volume and Value of Expor t by Main Comodi ties, Tahun/ Year 2013-2014
Jenis Komoditi UtamaMain Comodities
2013 2014
Volume (Ton)Volume(Tons)
Nilai (000US$)Value (000
US$)
Volume(Ton)Volume(Tons)
Nilai (000US$)Value (000
US$)(1) (2) (3) (5) (6)
1. Liquid Natural Gas 10 372 319 9 078 150 8 773 579 7 590 419
2. Bituminous coal: coking coal 84 380 551 6 544 186 75 050 862 5 103 347
3. Bituminous coal: other thancoking coal 64 122 312 3 997 250 52 464 272 3 027 796
4. Other Coal 97 509 403 4 781 470 89 447 107 3 913 552
5. Crude Petroleum oil 1 426 708 1 139 689 1 279 645 1 014 751
6. Other residues of petroleum oilsor of oils obtained frombituminous mineral
1 898 411 1 202 662 1 782 031 1 068 191
7. Lignite 16 718 430 727 558 21 317 127 957 082
8. Condensate 1 310 121 1 167 908 986 512 881 213
9. Others 5 299 534 2 364 210 4 974 686 2 268 670
Jumlah / Total 283 037 789 31 003 083 256 075 821 25 825 021
Sumber: Badan Pusat Statistik Provinsi Kalimantan Timur .Source : BPS-Statistics of Kalimantan Timur .
.
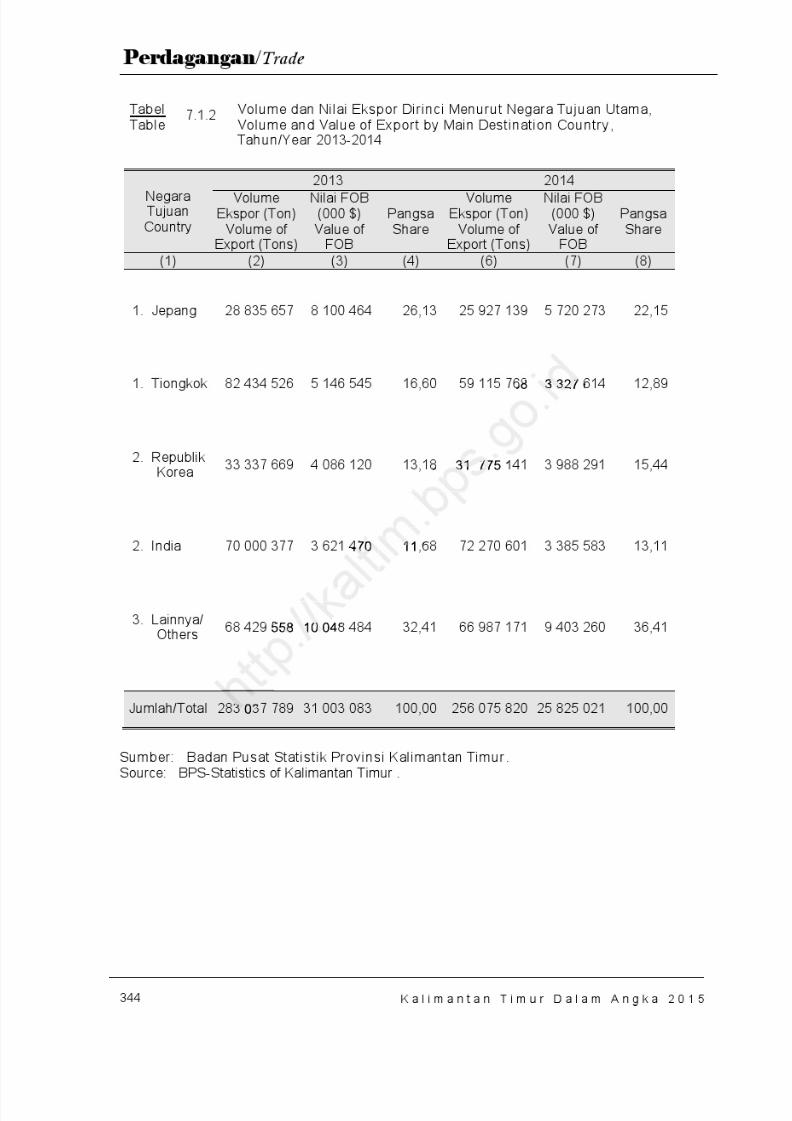
8/20/2019 Kalimantan Timur Dalam Angka Tahun 2015
http://slidepdf.com/reader/full/kalimantan-timur-dalam-angka-tahun-2015 410/623
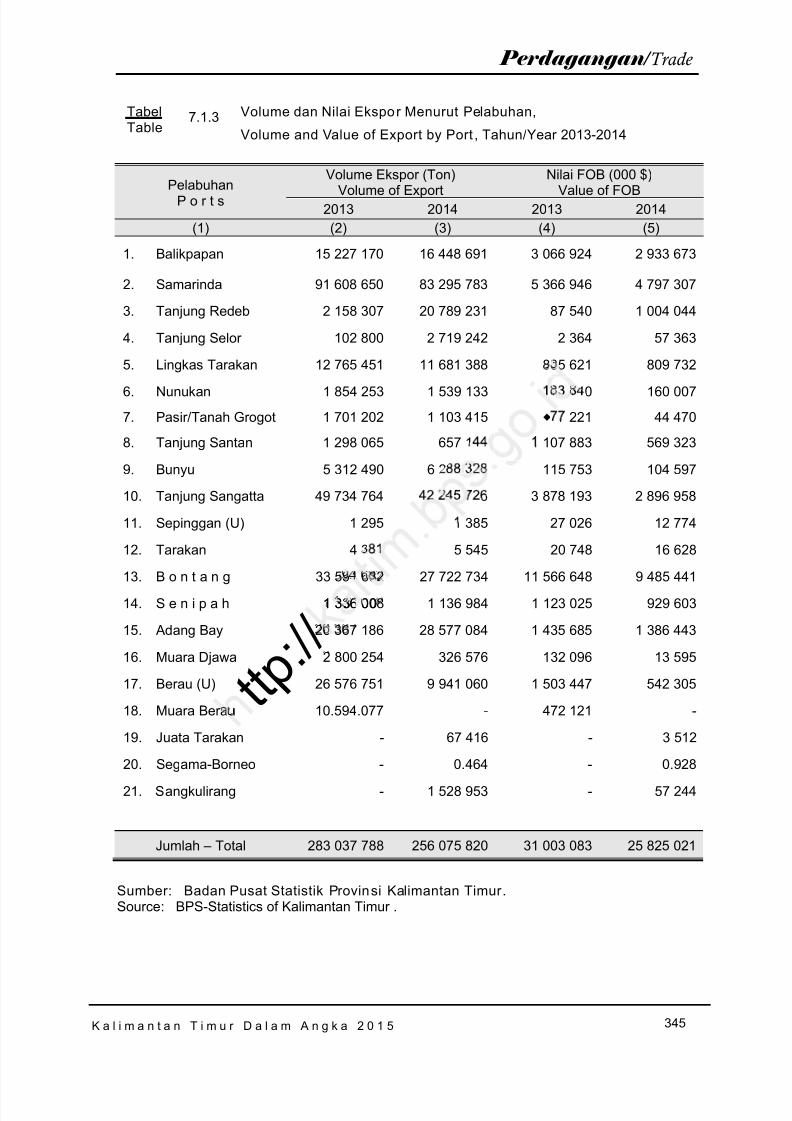
8/20/2019 Kalimantan Timur Dalam Angka Tahun 2015
http://slidepdf.com/reader/full/kalimantan-timur-dalam-angka-tahun-2015 411/623
345
Perdagangan / Trade
K a l i m a n t a n T i m u r D a l a m A n g k a 2 0 1 5
TabelTable
7.1.3 Volume dan Nilai Ekspor Menurut Pelabuhan,
Volume and Value of Export by Port , Tahun/ Year 2013-2014
PelabuhanP o r t s
Volume Ekspor (Ton)
Volume of Export
Nilai FOB (000 $)
Value of FOB2013 2014 2013 2014
(1) (2) (3) (4) (5)
1. Balikpapan 15 227 170 16 448 691 3 066 924 2 933 673
2. Samarinda 91 608 650 83 295 783 5 366 946 4 797 307
3. Tanjung Redeb 2 158 307 20 789 231 87 540 1 004 044
4. Tanjung Selor 102 800 2 719 242 2 364 57 363
5. Lingkas Tarakan 12 765 451 11 681 388 835 621 809 732
6. Nunukan 1 854 253 1 539 133 183 840 160 007
7. Pasir/Tanah Grogot 1 701 202 1 103 415 77 221 44 470
8. Tanjung Santan 1 298 065 657 144 1 107 883 569 323
9. Bunyu 5 312 490 6 288 328 115 753 104 597
10. Tanjung Sangatta 49 734 764 42 245 726 3 878 193 2 896 958
11. Sepinggan (U) 1 295 1 385 27 026 12 774
12. Tarakan 4 381 5 545 20 748 16 628
13. B o n t a n g 33 594 682 27 722 734 11 566 648 9 485 44114. S e n i p a h 1 336 008 1 136 984 1 123 025 929 603
15. Adang Bay 26 367 186 28 577 084 1 435 685 1 386 443
16. Muara Djawa 2 800 254 326 576 132 096 13 595
17. Berau (U) 26 576 751 9 941 060 1 503 447 542 305
18. Muara Berau 10.594.077 - 472 121 -
19. Juata Tarakan - 67 416 - 3 512
20. Segama-Borneo - 0.464 - 0.92821. Sangkulirang - 1 528 953 - 57 244
Jumlah – Total 283 037 788 256 075 820 31 003 083 25 825 021
Sumber: Badan Pusat Statistik Provinsi Kalimantan Timur .Source : BPS-Statistics of Kalimantan Timur .
.
t t p : / /
1 336 00
u
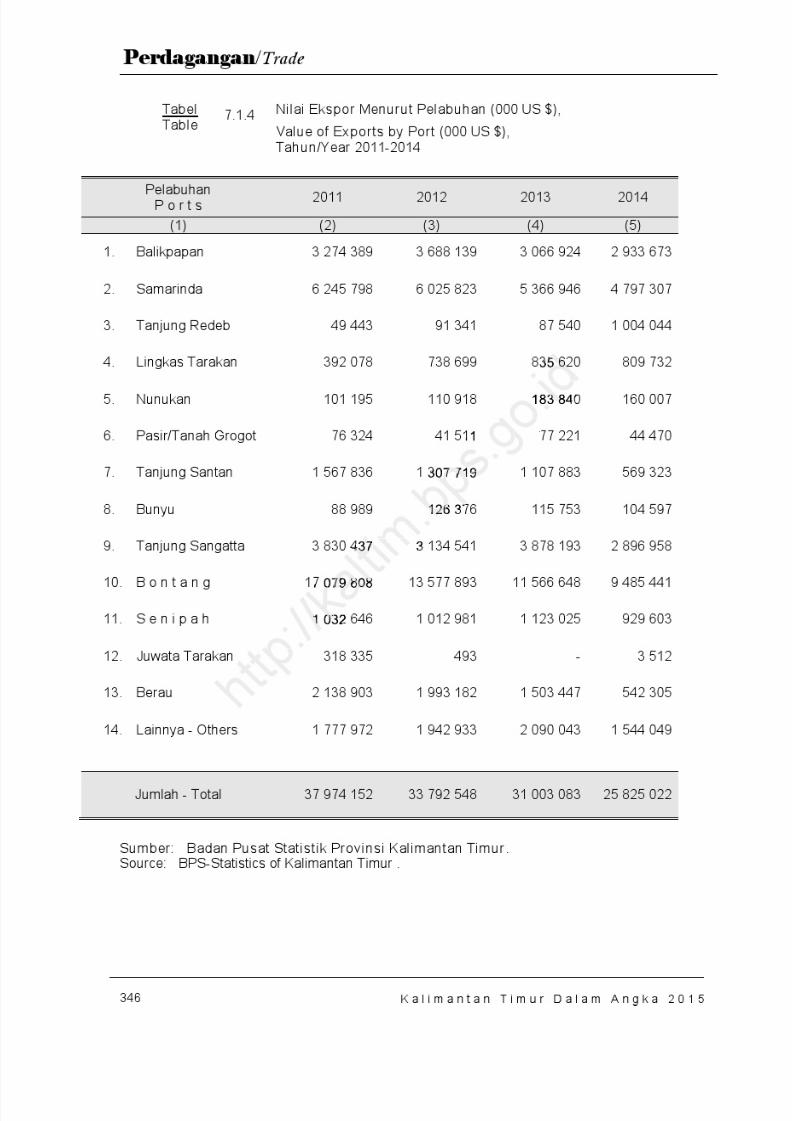
8/20/2019 Kalimantan Timur Dalam Angka Tahun 2015
http://slidepdf.com/reader/full/kalimantan-timur-dalam-angka-tahun-2015 412/623
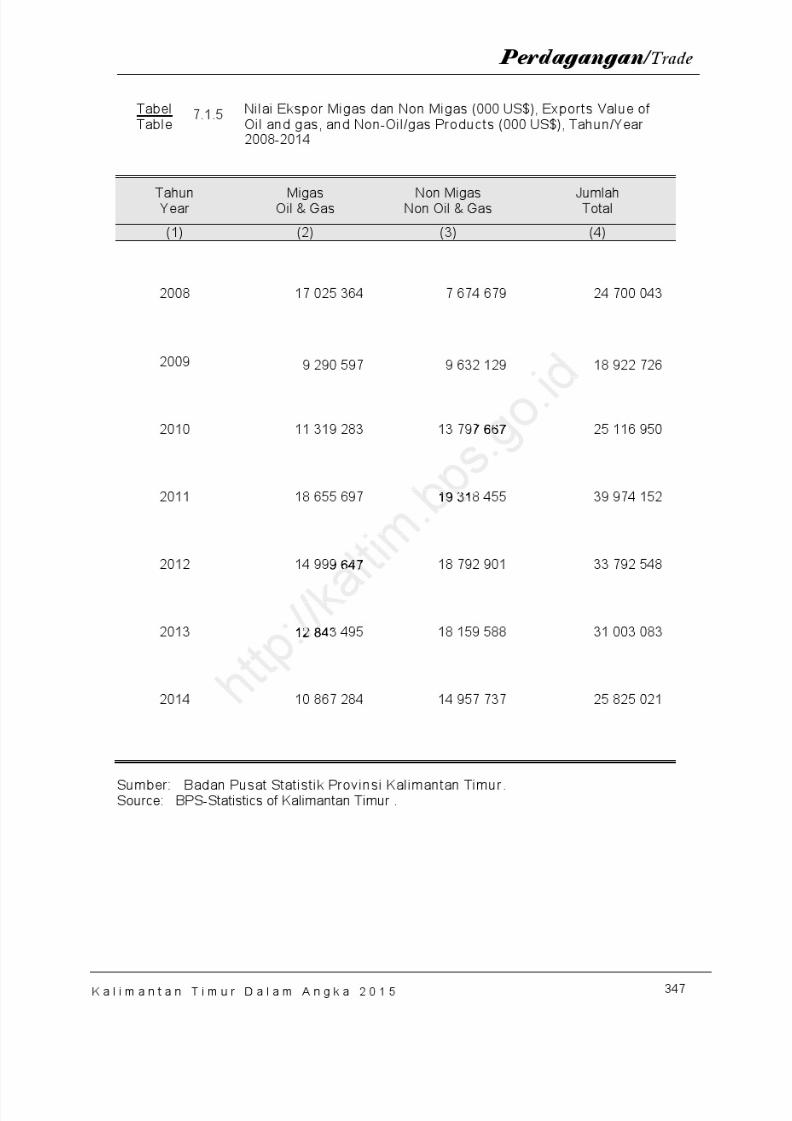
8/20/2019 Kalimantan Timur Dalam Angka Tahun 2015
http://slidepdf.com/reader/full/kalimantan-timur-dalam-angka-tahun-2015 413/623

8/20/2019 Kalimantan Timur Dalam Angka Tahun 2015
http://slidepdf.com/reader/full/kalimantan-timur-dalam-angka-tahun-2015 414/623
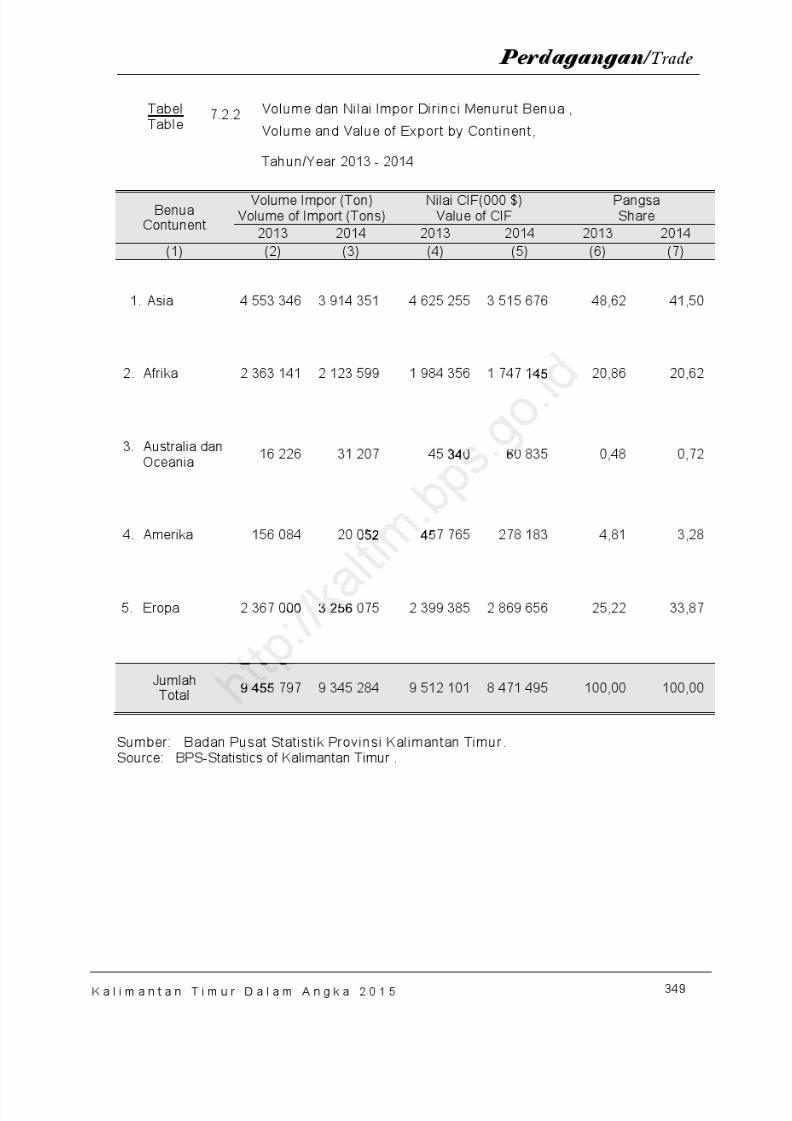
8/20/2019 Kalimantan Timur Dalam Angka Tahun 2015
http://slidepdf.com/reader/full/kalimantan-timur-dalam-angka-tahun-2015 415/623
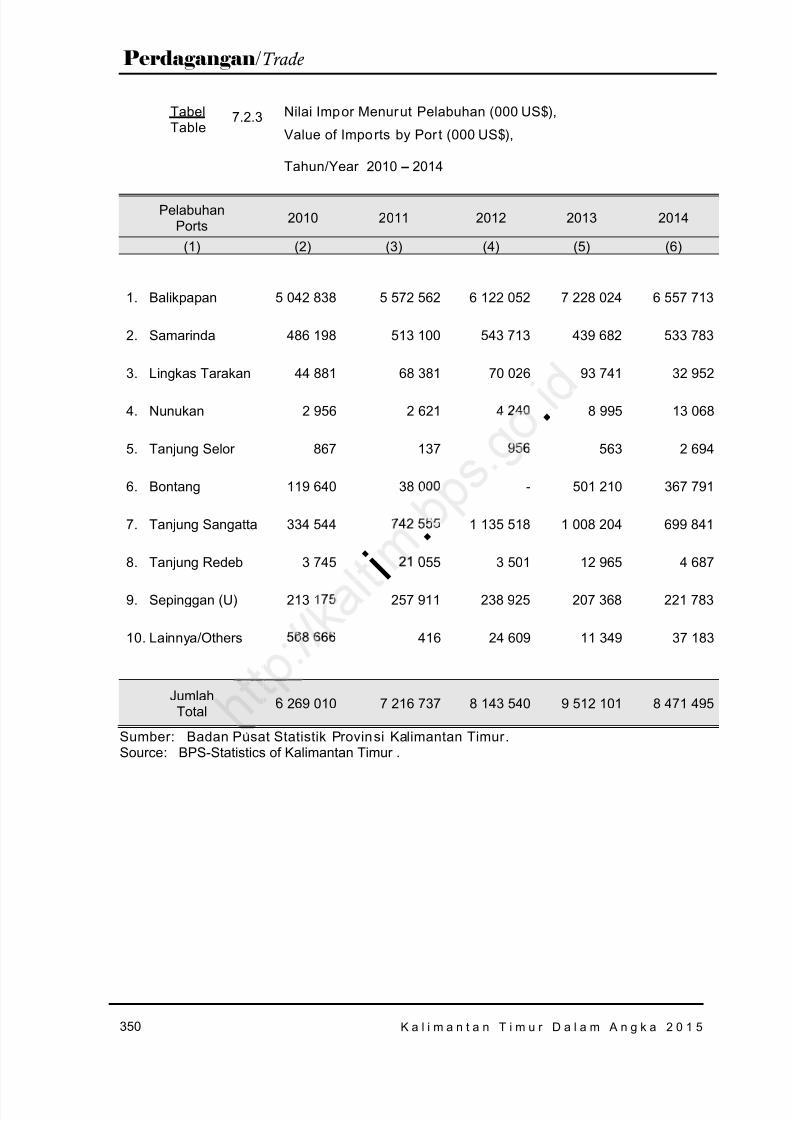
8/20/2019 Kalimantan Timur Dalam Angka Tahun 2015
http://slidepdf.com/reader/full/kalimantan-timur-dalam-angka-tahun-2015 416/623
350 K a l i m a n t a n T i m u r D a l a m A n g k a 2 0 1 5
Perdagangan /Trade
TabelTable
7.2.3 Nilai Impor Menurut Pelabuhan (000 US$),
Value of Imports by Por t (000 US$),
Tahun/ Year 2010 – 2014
PelabuhanPorts 2010 2011 2012 2013 2014
(1) (2) (3) (4) (5) (6)
1. Balikpapan 5 042 838 5 572 562 6 122 052 7 228 024 6 557 713
2. Samarinda 486 198 513 100 543 713 439 682 533 783
3. Lingkas Tarakan 44 881 68 381 70 026 93 741 32 952
4. Nunukan 2 956 2 621 4 240 8 995 13 068
5. Tanjung Selor 867 137 956 563 2 694
6. Bontang 119 640 38 000 - 501 210 367 791
7. Tanjung Sangatta 334 544 742 555 1 135 518 1 008 204 699 841
8. Tanjung Redeb 3 745 21 055 3 501 12 965 4 687
9. Sepinggan (U) 213 175 257 911 238 925 207 368 221 783
10. Lainnya/ Others 568 666 416 24 609 11 349 37 183
JumlahTotal 6 269 010 7 216 737 8 143 540 9 512 101 8 471 495
Sumber: Badan Pusat Statistik Provinsi Kalimantan Timur .Source : BPS-Statistics of Kalimantan Timur .
.
. i
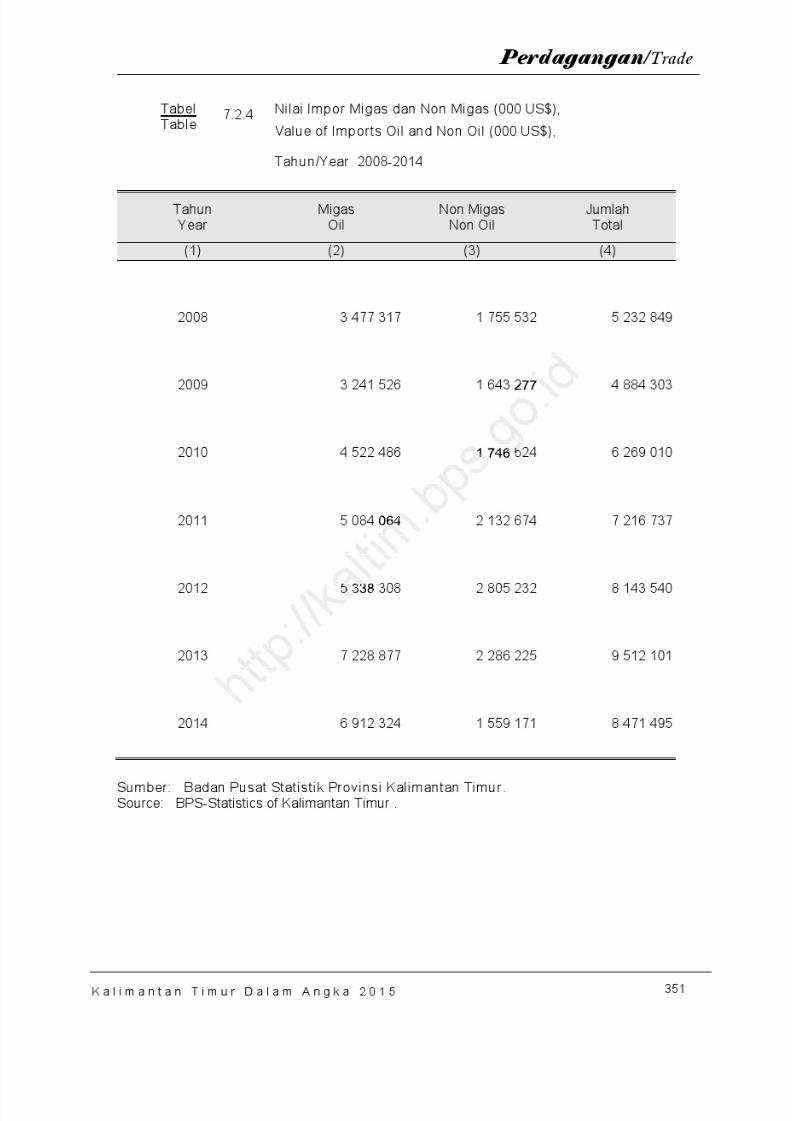
8/20/2019 Kalimantan Timur Dalam Angka Tahun 2015
http://slidepdf.com/reader/full/kalimantan-timur-dalam-angka-tahun-2015 417/623

8/20/2019 Kalimantan Timur Dalam Angka Tahun 2015
http://slidepdf.com/reader/full/kalimantan-timur-dalam-angka-tahun-2015 418/623
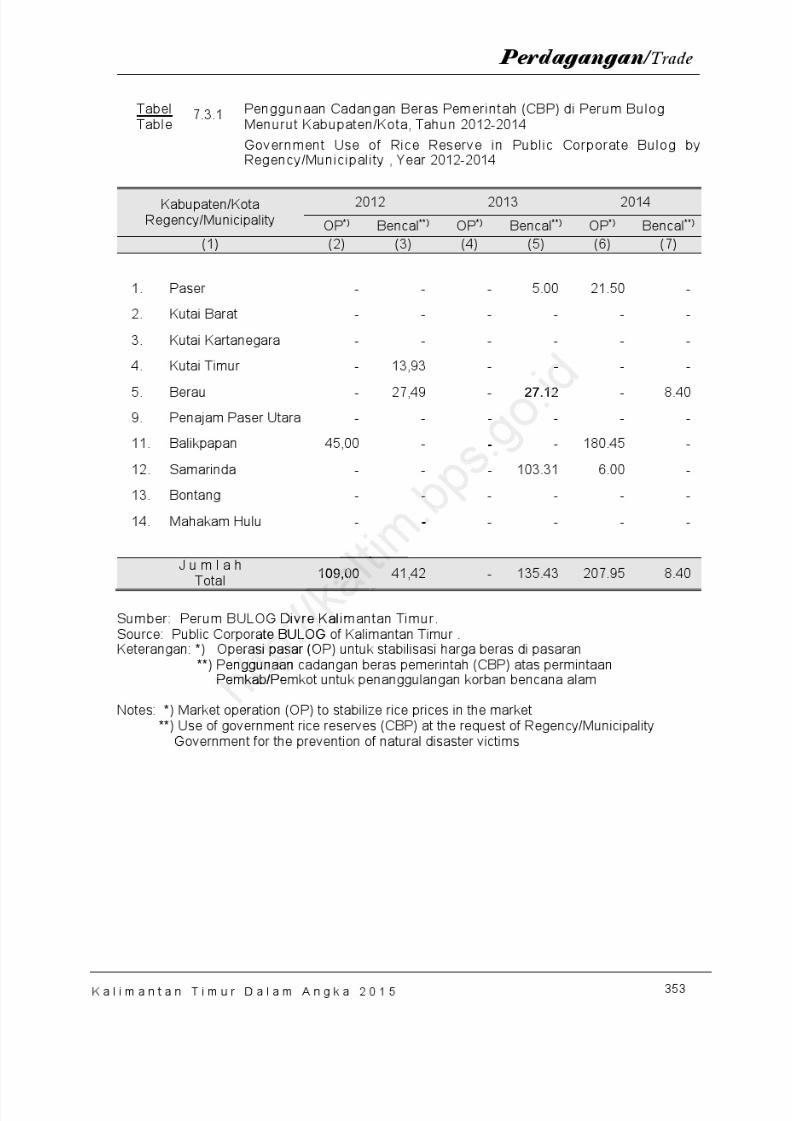
8/20/2019 Kalimantan Timur Dalam Angka Tahun 2015
http://slidepdf.com/reader/full/kalimantan-timur-dalam-angka-tahun-2015 419/623
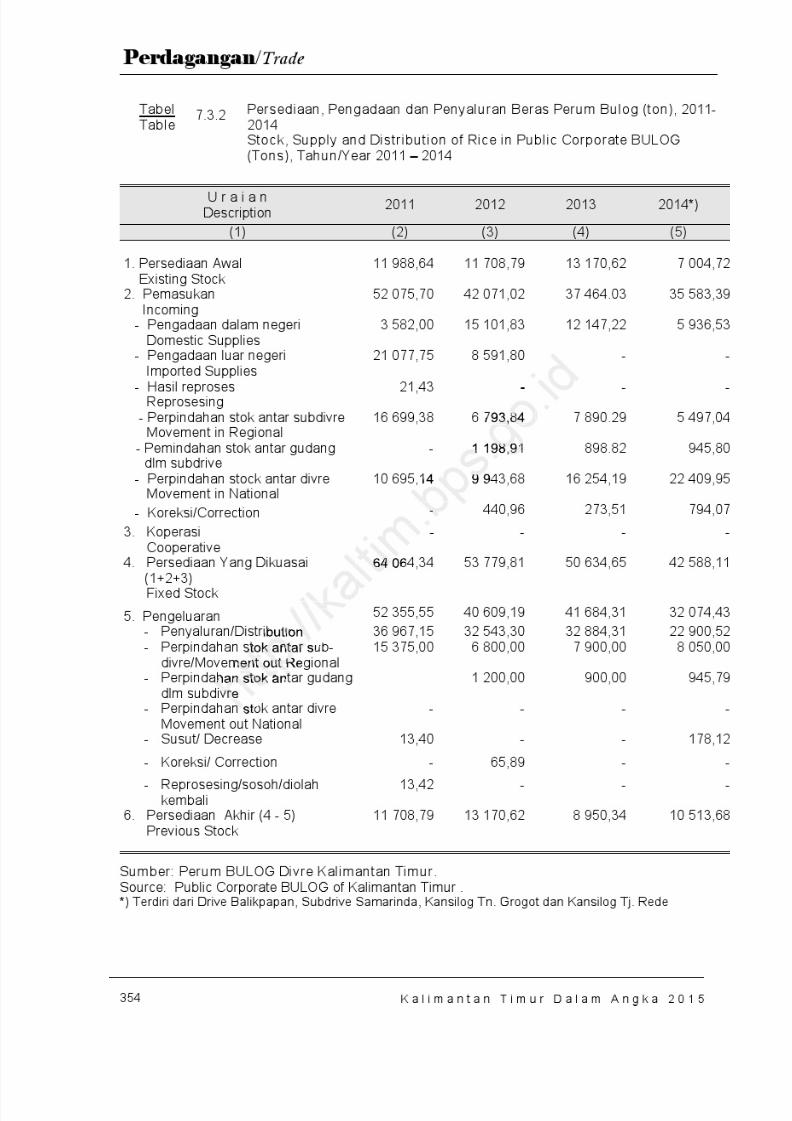
8/20/2019 Kalimantan Timur Dalam Angka Tahun 2015
http://slidepdf.com/reader/full/kalimantan-timur-dalam-angka-tahun-2015 420/623
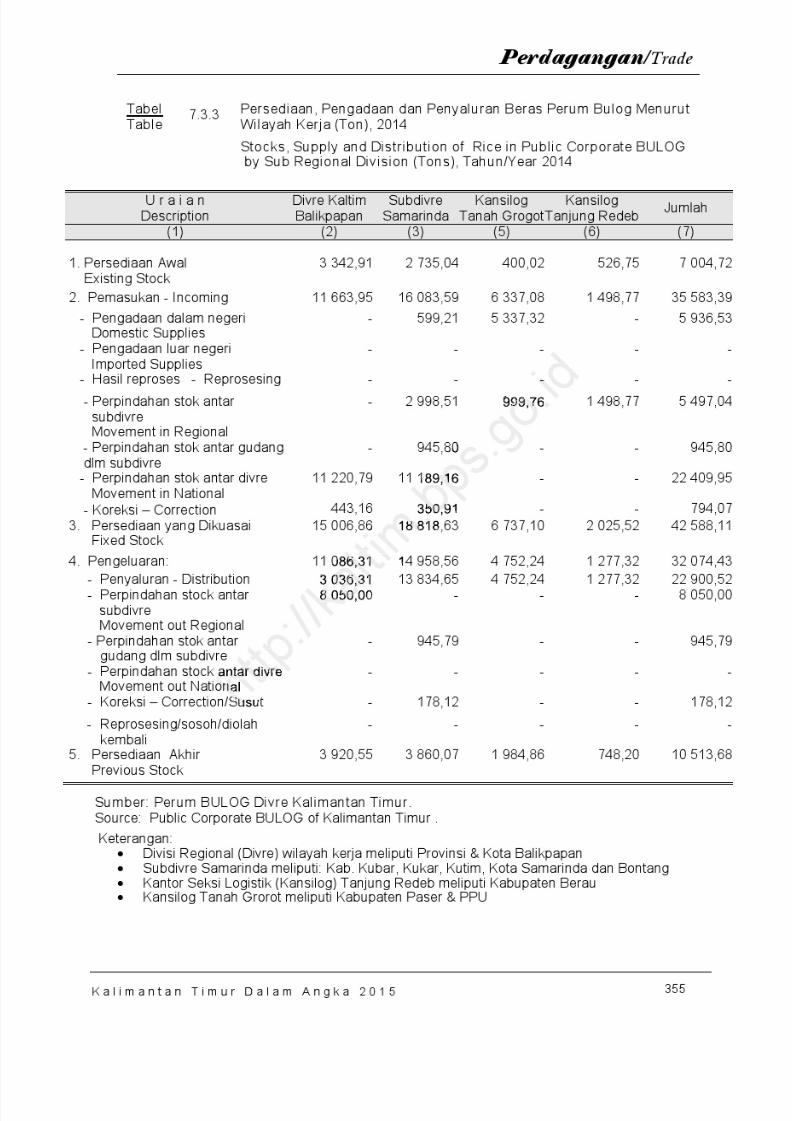
8/20/2019 Kalimantan Timur Dalam Angka Tahun 2015
http://slidepdf.com/reader/full/kalimantan-timur-dalam-angka-tahun-2015 421/623
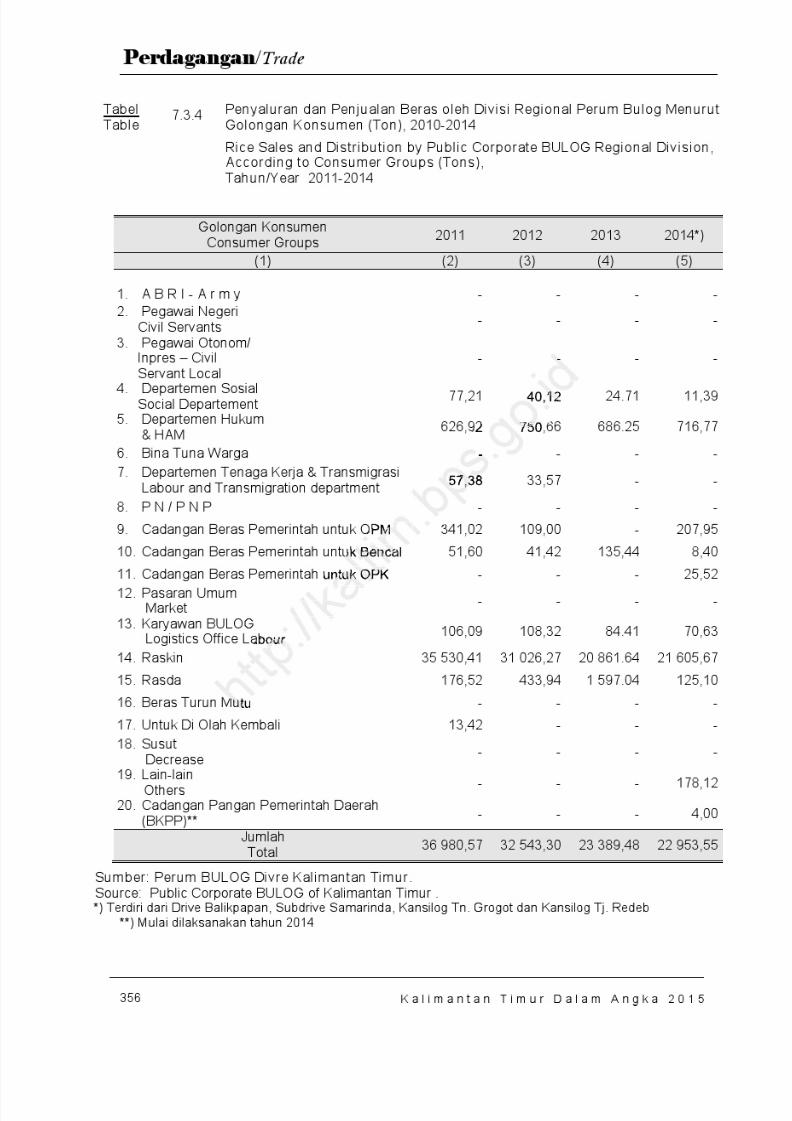
8/20/2019 Kalimantan Timur Dalam Angka Tahun 2015
http://slidepdf.com/reader/full/kalimantan-timur-dalam-angka-tahun-2015 422/623
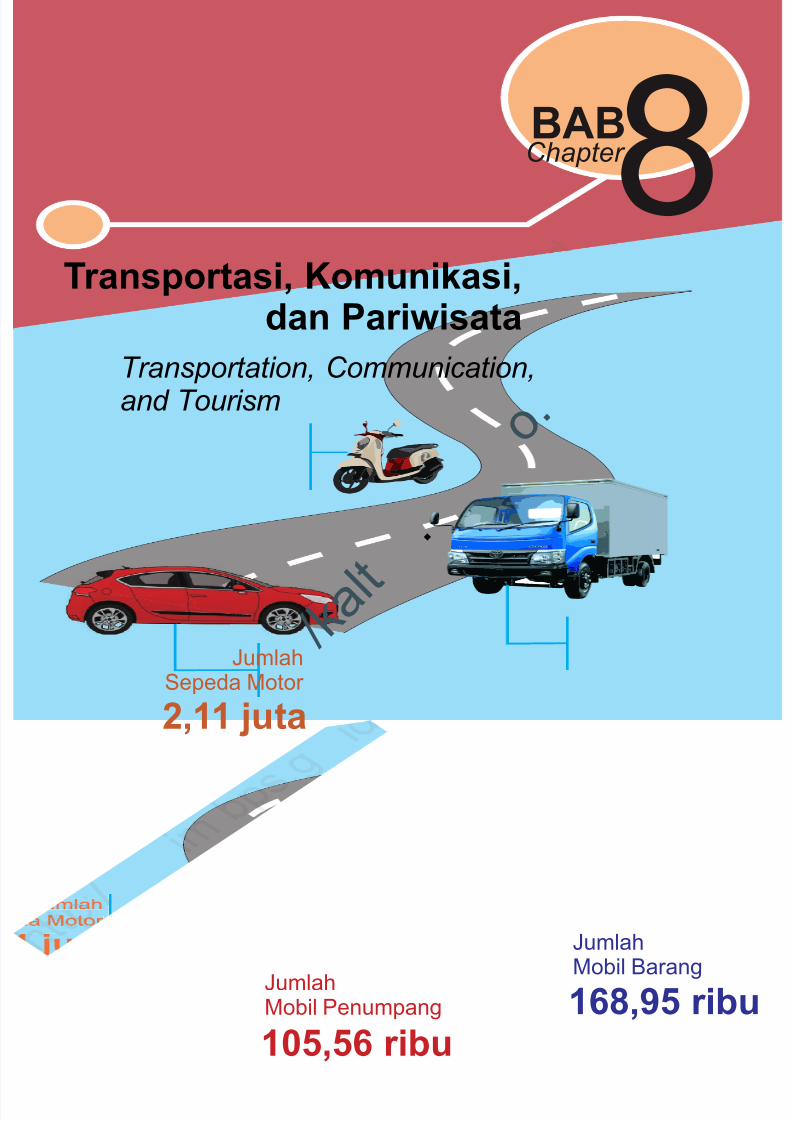
8/20/2019 Kalimantan Timur Dalam Angka Tahun 2015
http://slidepdf.com/reader/full/kalimantan-timur-dalam-angka-tahun-2015 423/623
8Transportasi, Komunikasi,dan Pariwisata
BABChapter
Transportation, Communication,and Tourism
JumlahSepeda Motor
2,11 juta
JumlahMobil Penumpang
105,56 ribu
JumlahMobil Barang
168,95 ribu
/ k a l t
o .
.

8/20/2019 Kalimantan Timur Dalam Angka Tahun 2015
http://slidepdf.com/reader/full/kalimantan-timur-dalam-angka-tahun-2015 424/623
h t t p : / / k a l t i m
. b p s . g o . i d
8/20/2019 Kalimantan Timur Dalam Angka Tahun 2015
http://slidepdf.com/reader/full/kalimantan-timur-dalam-angka-tahun-2015 425/623
359
T r a n s p o r t a s i , Ko m u n i k a s i , d a n Pa r i w i s a t a /Transportation, Communication, and Tourism
K a l i m a n t a n T i m u r D a l a m A n g k a 2 0 1 5
8.1. JALAN RAYA
Jalan merupakan prasaranapengangkutan yang penting untukmemperlancar kegiatan perekonomi-an. Makin meningkatnya usaha pem-bangunan menuntut pulapeningkatan pembangunan jalanguna memudahkan mobilitaspenduduk dan memperlancar lalulintas barang dari satu daerah ke
daerah lain.
Panjang jalan negara di seluruhwilayah Provinsi Kalimantan Timurpada tahun 2014 mencapai 1.493,68km. Panjang jalan di bawahwewenang Provinsi 1.596,38 km,sedang jalan di bawah wewenangKabupaten/Kota mencapai 9.005,18km.
8.2. ANGKUTAN DARAT
Untuk memenuhi transportasidarat, kendaraan angkutan utamayang harus tersedia adalah
kendaraan bermotor. Menurut datayang dikeluarkan oleh KepolisianNegara RI Daerah Kalimantan Timurpada tahun 2014, jumlah kendaraanbermotor sebanyak 2.233.278 buahdengan jumlah terbesar terdapat diKota Samarinda (29,41 persen).
8.1. MAIN ROAD
Road is infrastructure ofimportant transportation toaccelerate economy activities. Moreincreasing of development is also followed by development of roads to facilitate people’s mobility andexpedite of goods from an area toanother.
Length of state roads in wholearea of Kalimantan Timur province in2014 reached 1,493.68 km. Length ofroad under province authority is1,596.38 km and road under authorityRegency/Municipality is 9,005.18 km.
8.2. LANDWAYS
TRANSPORTATION
To fulfill land transportation,main transportation which availableis motor vehicles. Regional Police
reported that the number of motorvehicles 2,233,278 units in 2014. Thelargest number is in Samarinda (29.41 percents).
a
i d
,ng
5,18
ARAT
emenuan
t o st f Kalim
4 reachroad u ,596
Re
8/20/2019 Kalimantan Timur Dalam Angka Tahun 2015
http://slidepdf.com/reader/full/kalimantan-timur-dalam-angka-tahun-2015 426/623
360
T r a n s p o r t a s i , Ko m u n i k a s i , d a n Pa r i w i s a t a /Transportation, Communication, and Tourism
K a l i m a n t a n T i m u r D a l a m A n g k a 2 0 1 5
Dilihat dari jenis kendaraanuntuk mobil penumpang pada tahun2014 jumlah terbanyak adalah jenisStation Wagon yaitu 49.553 unit.Untuk jenis kendaraan mobil barangterbanyak adalah kendaraan jenispick up sebanyak 89.011 sedangkan jenis mobil bus terbanyak jenismini/microbus sebanyak 21.997 unit.Jenis kendaraan sepeda motor yangterbanyak jenis Sepeda Motor Solosebanyak 1.971.629 unit.
Pada tahun 2014 jumlahkecelakaan lalu lintas menurundibandingkan dengan tahunsebelumnya yaitu dari 1.094 menjadi1.041. Jumlah kerugian material dankorban juga mengalami penurunandibanding tahun sebelumnya. Jumlahkecelakaan tertinggi terjadi diKabupaten Kutai Kartanegara yangmencapai 32,11 persen dari total
kecelakaan di Provinsi KalimantanTimur.
8.3. ANGKUTAN LAUT
Lalu lintas kapal antar pulautahun 2013 melalui lebih dari limabelas pelabuhan yang ada di wilayahKalimantan Timur. Kapal tibasebanyak 31.726 kapal dengan jumlah penumpang sebanyak369.779 orang dan kapal berangkat31.726 kapal dengan jumlahpenumpang 290.611 orang. Biladiamati dari lalu lintas kapal makaterbesar melalui pelabuhan diSamarinda, namun bila diamati darilalu lintas penumpang terbesar
melalui pelabuhan Balikpapan.
Looked at type of motor vehicles for passenger cars in 2014, the mostnumber is type of Station Wagon(49,553 units). For type of load car,the most type is pickup 89,011 units,and for type of bus car the most typeis mini/microbus in the amount of21,997 units. For motorcycle the mosttype is solo motorcycles by thenumber about 1,971,629 units.
In 2014, number of traffic
accidents was decreased comparedwith the previous years, from 1,094 to1,041 accidents. Number of missingitem and victims was increased too. And the highest number of accident ishappened in Balikpapan reached32.11 percent of total accidents inKalimantan Timur.
8.3. SEA TRANSPORTATION
Traffic ship Inter-island inKalimantan Timur in 2013 have over fifteen port. Frequency ship arrived
were 31,726 ships with a number of passenger were 369,779 people andship departing 31,726 ships, with290,611 passenger. When observed from the largest ship traffic throughthe port of Samarinda, but whenobserved from the largest passengertraffic through the port of Balikpapan.
a
an
T
apal aui
creaus ears
ents. N.victims
e ig e ppened
2.11 pKa i
8/20/2019 Kalimantan Timur Dalam Angka Tahun 2015
http://slidepdf.com/reader/full/kalimantan-timur-dalam-angka-tahun-2015 427/623
361
T r a n s p o r t a s i , Ko m u n i k a s i , d a n Pa r i w i s a t a /Transportation, Communication, and Tourism
K a l i m a n t a n T i m u r D a l a m A n g k a 2 0 1 5
8.4. ANGKUTAN UDARA
Sektor perhubungan udara selaindominan dalam melaksanakanmobilitas manusia dari suatu tempatke tempat lain, juga merupakan salahsatu sektor yang terkait erat dengansektor pariwisata dalam mendukungperjalanan wisatawan ke suatutempat.
Saat ini, transportasi melaluiudara sangat memegang perananpenting. Di Kalimantan Timur, dimanadi beberapa daerah merupakandaerah pengeboran minyak, batubaradan lainnya, memerlukan mobilitasangkutan udara yang tinggi antardaerah terutama untuk tujuanJakarta. Dengan demikian, fungsi
transportasi udara untuk kegiatantersebut sangat vital.
Di Kalimantan Timur, terdapat12 Pelabuhan Udara sepertiSepinggan Balikpapan, TemindungSamarinda, dan Kalimarau Berau.Bandar Udara InternasionalBalikpapan, pada tahun 2014 ini telah
memberangkatkan dan menurunkanpenumpang paling banyak. Padatahun 2014 telah memberangkatkansebanyak 3,95 juta lebih penumpangdan telah menurunkan sekitar 3,79 juta penumpang.
8.4. AIR TRANSPORTATION
The air transport sector inaddition to the dominant inimplementing the mobility of people from one place to another, also is onesector that is closely related to thetourism sector in supporting thetourist trip somewhere.
Air transportations have an
important role in Kalimantan Timur. Air transportation sector is not onlydominant in human mobility activity from a place to another, but also oneof sectors that related to tourismsectors in supporting tourists journeyto a place and as well as in the severalarea who has a drilling area like acoal, oil, etc. it needs high mobilityinter-regional especially to go tocapital Jakarta.
In Kalimantan Timur, there are12 airports such as Sepinggan inBalikpapan, Temindung inSamarinda, and Kalimarau in Berau,.Most of passengers departed andarrived at International Airportsepinggan in Balikpapan. In 2012Sepinggan Airport have beendispatched about 3.95 millions passengers and had drop off passengers about 3.79 millions.
inta tion sin u
place t
a
gsi
giatan
mur, tUdara
papan,an Ka
r
sectorssectors ito a par
8/20/2019 Kalimantan Timur Dalam Angka Tahun 2015
http://slidepdf.com/reader/full/kalimantan-timur-dalam-angka-tahun-2015 428/623
362
T r a n s p o r t a s i , Ko m u n i k a s i , d a n Pa r i w i s a t a /Transportation, Communication, and Tourism
K a l i m a n t a n T i m u r D a l a m A n g k a 2 0 1 5
8.5. PARIWISATA DAN
PERHOTELAN
Saat ini sektor pariwisatamerupakan salah satu sektorprimadona dalam menghasilkandevisa negara. Selain itu jugadiharapkan sebagai sektor yang padatkarya yakni sektor yang banyakmenyerap tenaga kerja, dan
diharapkan berperan dalammeningkatkan pendapatanmasyarakat.
Tercatat bahwa museum NegeriMulawarman yang merupakan salahsatu obyek pariwisata yang menarikbaik bagi wisatawan domestikmaupun asing mengalamipeningkatan pengunjung sepanjangtahun 2012-2014.
Pada tahun 2014 jumlahpengunjung di museum ini kembalimeningkat dibandingkan tahunsebelumnya yang juga mengalamipeningkatan dibanding dengan tahun2012. Pengunjung museum tahun2014 sebanyak 116 929 orang, danmasih didominasi oleh pengunjungdomestik.
8.5. HOTEL AND TOURISM
Nowadays, tourism sectors areone of important sectors in producing foreign exchange. It is also hopedmany absorb of labours, and it ishoped to have a main role inincreasing of society income.
Mulawarman Museum is one ofthe interesting tourism objects totourist of domestic and foreign. Manytourists visited this place during in2012-2014.
In 2014 number of visitor inmuseum is increasing. Visitorsreached 116,929 people anddominated by domestic visitors.
: / / k i
o . i d
i
jang
201seu
u awarinteres
ourist ottouris
0
8/20/2019 Kalimantan Timur Dalam Angka Tahun 2015
http://slidepdf.com/reader/full/kalimantan-timur-dalam-angka-tahun-2015 429/623
363
T r a n s p o r t a s i , Ko m u n i k a s i , d a n Pa r i w i s a t a /Transportation, Communication, and Tourism
K a l i m a n t a n T i m u r D a l a m A n g k a 2 0 1 5
Sektor kepariwisataan tidakterlepas dari dukungan sektorperhotelan. Sepanjang tahun 2014
tingkat penghunian kamar hotelberbintang sebesar 56,73 persen,menurun dibandingkan dengan tahunsebelumnya yaitu 61,24 persen.
Jumlah wisatawan dalam negeri(wisnus) dan manca negara (wisman)adalah tolok ukur dari semakindiminatinya Kalimantan Timursebagai salah satu tujuan wisata.Tahun 2014 jumlah wisatawanmencapai 1.530.894 orang, terdiridari 46.464 orang wisman dan1.484.430 orang wisnus.
Tourism sector can not beseparated from the support of thehospitality sector. Throughout year2014 occupancy rate star hotels wasof 61,24 to 56,73 percent, that meanhas decreased compared with the previous year's.
The number of domestic tourists(wisnus) and foreigners (tourists) is ameasure of the enthuses Kalimantan
Timur as one tourist destination. In2014 the number of tourists reached1.530.894 people, consisting of46.464 people foreign tourists andwisnus 1.484.430 people.
h t t p : / / k a l t i m
. b p
tourmber o
4 peo4 peop
snus .
8/20/2019 Kalimantan Timur Dalam Angka Tahun 2015
http://slidepdf.com/reader/full/kalimantan-timur-dalam-angka-tahun-2015 430/623
364
T r a n s p o r t a s i , Ko m u n i k a s i , d a n Pa r i w i s a t a /Transportation, Communication, and Tourism
K a l i m a n t a n T i m u r D a l a m A n g k a 2 0 1 5
PENJELASAN TEKNIS
1. Data pengangkutan dan komu-
nikasi meliputi:a. Panjang Jalanb. Angkutan Daratc. Angkutan Udarad. Angkutan Laute. Angkutan Antar Pulauf. Pos dan Telekomunikasi
2. Konsep dan definisi untuk hotel
dan pariwisata mengikutirekomendasi World TourismOrganization (WTO) danInternational Union of OfficeTravel Organization (IUOTO).
3. Tamu Asing ialah setiap pe-ngunjung yang mengunjungisuatu negara di luar tempattinggalnya, didorong oleh satu
atau beberapa keperluan tanpabermaksud memperolehpenghasilan di tempat yangdikunjungi dan lamanya kun- jungan tersebut tidak lebih darisatu tahun. Definisi inimencakup 2 (dua) kategoritamu asing, yaitu:a. Wisatawan (turis) ialah
setiap pengunjung sepertidefinisi di atas yang tinggalpaling sedikit 24 jam, akantetapi tidak lebih dari 1(satu) tahun di tempat yangdikunjungi, dengan maksudantara lain: berlibur,rekreasi, olah raga, bisnis,menghadiri pertemuan,studi dan kun-jungan
dengan alasan kesehatan.
TECHNICAL NOTES
1. Data on transportations andcommunications cover:a. Length of roadsb. Land transportationsc. Air transportationsd. Sea transportationse. Inter-island transportations
f. Post and Telecommunications
2. The concept and definition of
hotel and tourism follows therecommendation of WorldTourism Organization (WTO)and International Union ofOffice Organization (IUOTO).
3. A Foreign visitors is any personvisiting a country other than hisusual place of residence for anyreason other than for earningincome in the visited country,and the length of stay is notmore than one year. Thisdefinition covers two categoriesof foreign visitors, namely:a. “Tourist” is any visitor
staying for at least 24hours, but not more than
one year in the visitedcountry with the intentionof visiting and for any ofthese purposes: pleasure,recreation and sports,business, attendingmeetings, study and visit for health reasons.
urisrndation
i m .
paroleh
t yanganya k
dak lebiDe ini
(dua)tu:
OrgaIntern
ffice Or
. A Forvis
8/20/2019 Kalimantan Timur Dalam Angka Tahun 2015
http://slidepdf.com/reader/full/kalimantan-timur-dalam-angka-tahun-2015 431/623
365
T r a n s p o r t a s i , Ko m u n i k a s i , d a n Pa r i w i s a t a /Transportation, Communication, and Tourism
K a l i m a n t a n T i m u r D a l a m A n g k a 2 0 1 5
b. Excursionis ialah setiappengunjung seperti definisi diatas yang tinggal kurang dari24 jam di tempat yangdikunjungi (termasuk “ Cruise passengers ”). CruisePassengers ialah setiappengunjung yang tiba disuatu negara dengan kapalatau kereta api dimanamereka tidak menginap diakomodasi yang tersedia dinegara tersebut.
4. Akomodasi ialah suatu usahayang menggunakan suatubangunan atau sebagiandaripadanya yang khususdisediakan, dimana setiaporang dapat menginap danmemperoleh pelayanan sertafasilitas lainnya denganpembayaran. Akomodasi
dibedakan antara hotel danakomodasi lainnya. Dinamakanhotel apabila mempunyai res-toran yang berada di bawahmanajemen hotel tersebut,sedang akomodasi lainnyaapabila tidak mempunyairestoran.
5. Hotel berbintang yaitu hotelyang telah memenuhipersyaratan yang telahditentukan seperti persyaratanfisik, bentuk pelayanan yangdiberikan, kualifikasi tenagakerja, jumlah kamar danlainnya. Hotel tidak berbintangyaitu hotel yang belummemenuhi persyaratan yang
telah ditentukan.
b. “Excursionist” is any visitorlike the definition above whostaying less than 24 hours inthe visited country (including“cruise passengers”). Cruise passengers are visitorsarriving in a country, such as:by ship or train and notstaying in anyaccommodation available invisited country.
4. Accommodation is anestablishment using a buildingor a part of a building, especially prepared to any person to stay,and obtain service as well asother facilities against payment. Accomodation is segregatedinto hotel and other
accommodations. Hotelsdefined here is having arestaurant under hotelmanagement, otherwise calledas other accommodations.
5. A classified hotel is anaccommodation which meetspecified standards regarding physical requirements, services provided manpowerqualification, number of roomsavailable, etc. An unclassifiedhotel is an accommodationwhich has not yet met therequirement previously
mentioned.
. b p
asi
danama a
punyai r da di
oteomoda
ti a
o atiolishme
r a part preparan
8/20/2019 Kalimantan Timur Dalam Angka Tahun 2015
http://slidepdf.com/reader/full/kalimantan-timur-dalam-angka-tahun-2015 432/623
366
T r a n s p o r t a s i , Ko m u n i k a s i , d a n Pa r i w i s a t a /Transportation, Communication, and Tourism
K a l i m a n t a n T i m u r D a l a m A n g k a 2 0 1 5
6. Tingkat penghunian kamarhotel adalah persentasebanyaknya malam kamar yangdihuni terhadap banyaknyamalam kamar yang tersedia.
7. Rata-rata lamanya tamumenginap adalah hasil bagiantara banyaknya malamtempat tidur yang terpakaidengan banyaknya tamu yangmenginap di hotel dan
akomodasi lainnya.
6. Room occupancy rate is thenumber of roomnights occupieddivided by the number ofroomninght available,multiplied by 100 percent.
7. Average length of stay is thenumber of bed-night useddivided by the number of gueststaying at the accommodationthe hotel and anotheraccommodation.
h t t p : / / k a l t i m
. b p s . g o . i
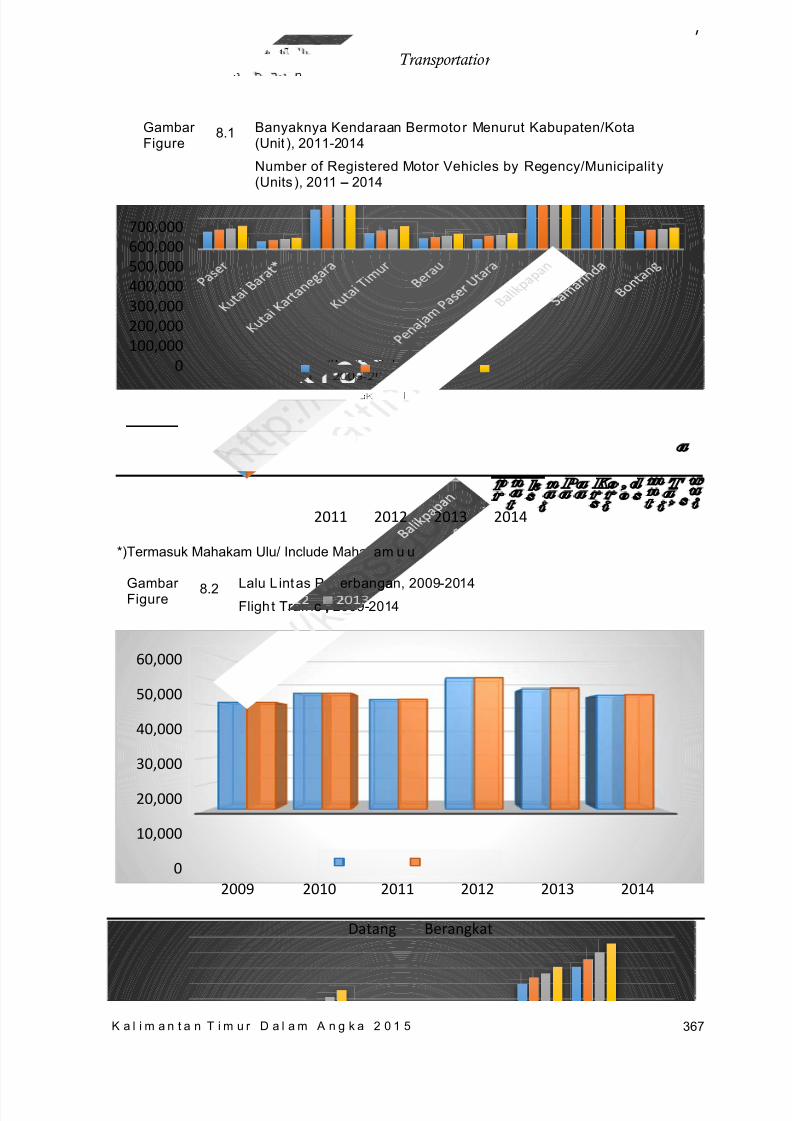
8/20/2019 Kalimantan Timur Dalam Angka Tahun 2015
http://slidepdf.com/reader/full/kalimantan-timur-dalam-angka-tahun-2015 433/623
367
T r a n s p o r t a s i , Ko m u n i k a s i , d a n Pa r i w i s a t a /Transportation, Communication, and Tourism
K a l i m a n t a n T i m u r D a l a m A n g k a 2 0 1 5
*)Termasuk Mahakam Ulu/ Include Mahakam ulu
Gambar Figure
8.2 Lalu Lint as Penerbangan, 2009-2014
Fligh t Traff ic , 2009-2014
0100,000200,000300,000400,000500,000600,000700,000
2011 2012 2013 2014
0
10,000
20,000
30,000
40,000
50,000
60,000
2009 2010 2011 2012 2013 2014
Datang Berangkat
Gambar Figure
8.1 Banyaknya Kendaraan Bermotor Menurut Kabupaten/Kota(Unit ), 2011-2014
Number of Registered Motor Vehicles by Regency/Municipalit y(Units ), 2011 – 2014
am u u
erbanga
c ,,
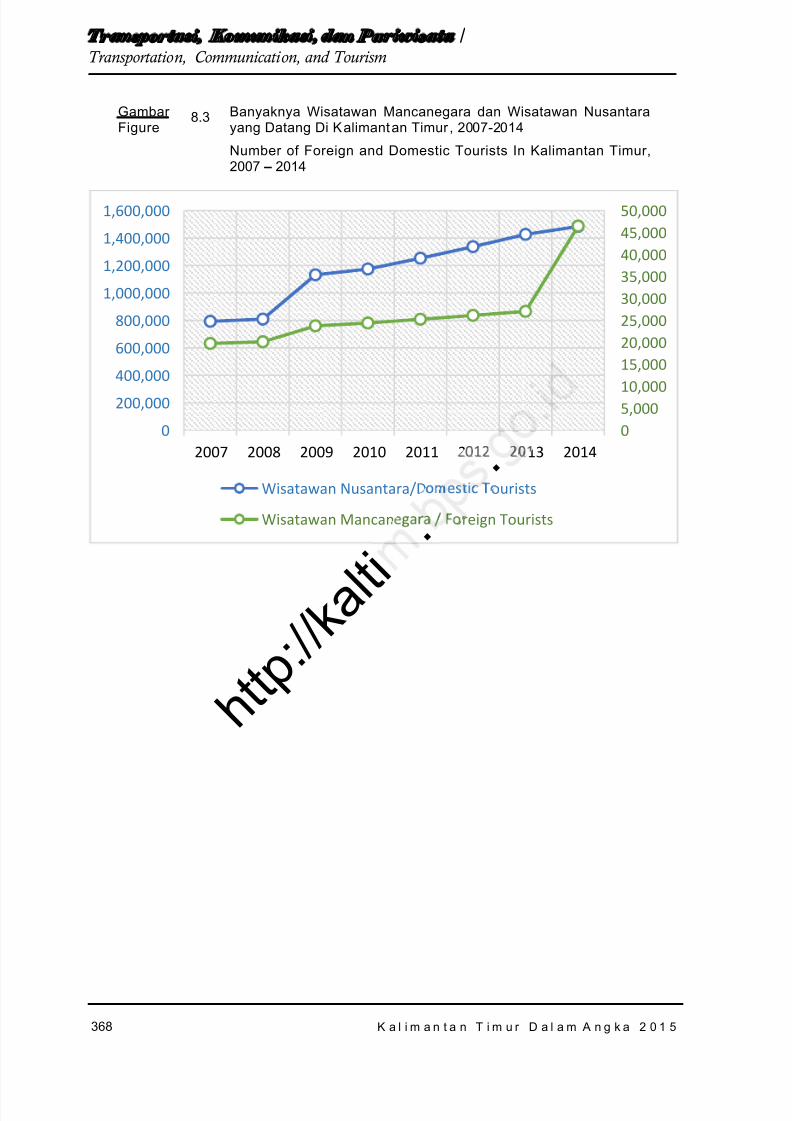
8/20/2019 Kalimantan Timur Dalam Angka Tahun 2015
http://slidepdf.com/reader/full/kalimantan-timur-dalam-angka-tahun-2015 434/623
368
T r a n s p o r t a s i , Ko m u n i k a s i , d a n Pa r i w i s a t a /Transportation, Communication, and Tourism
K a l i m a n t a n T i m u r D a l a m A n g k a 2 0 1 5
Gambar Figure
8.3 Banyaknya Wisatawan Mancanegara dan Wisatawan Nusantarayang Datang Di Kalimant an Timur , 2007-2014
Number of Foreign and Domestic Tourists In Kalimantan Timur,2007 – 2014
05,00010,000
15,00020,00025,00030,00035,00040,00045,00050,000
0
200,000
400,000
600,000
800,000
1,000,000
1,200,000
1,400,000
1,600,000
2007 2008 2009 2010 2011 2012 2013 2014
Wisatawan Nusantara/Domestic Tourists
Wisatawan Mancanegara / Foreign Tourists
. .
h t t p : / / k a l t i
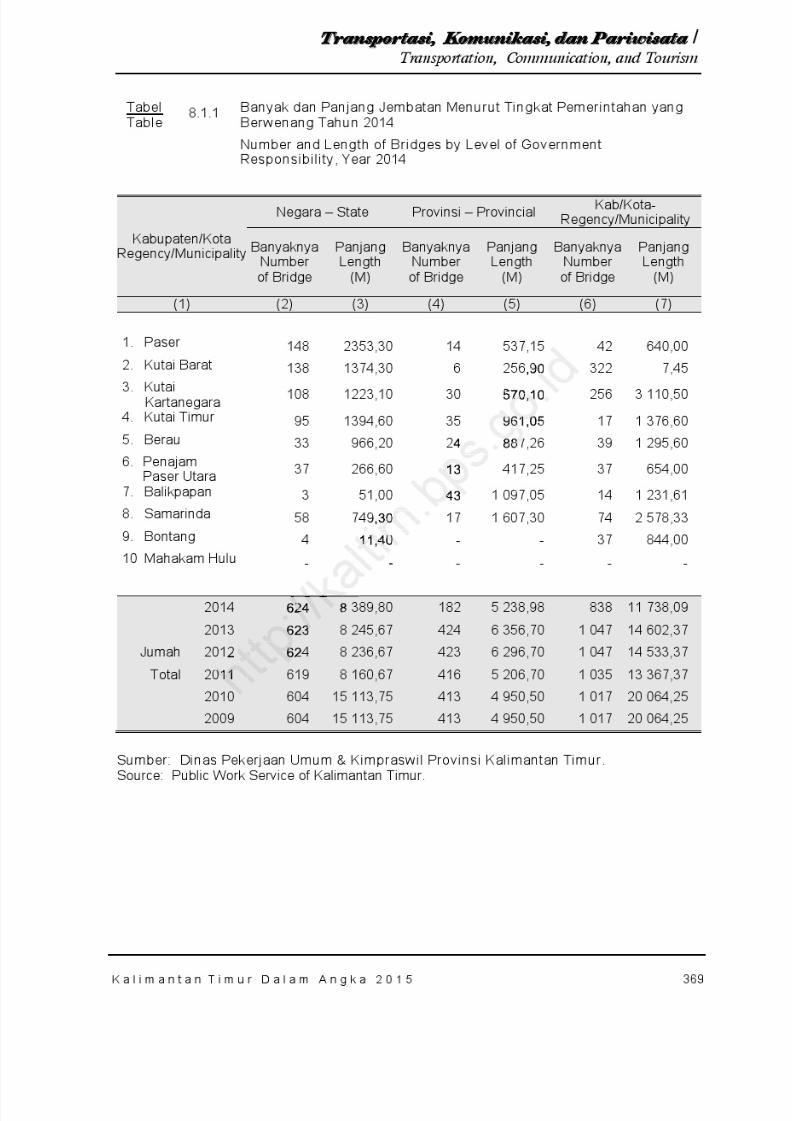
8/20/2019 Kalimantan Timur Dalam Angka Tahun 2015
http://slidepdf.com/reader/full/kalimantan-timur-dalam-angka-tahun-2015 435/623
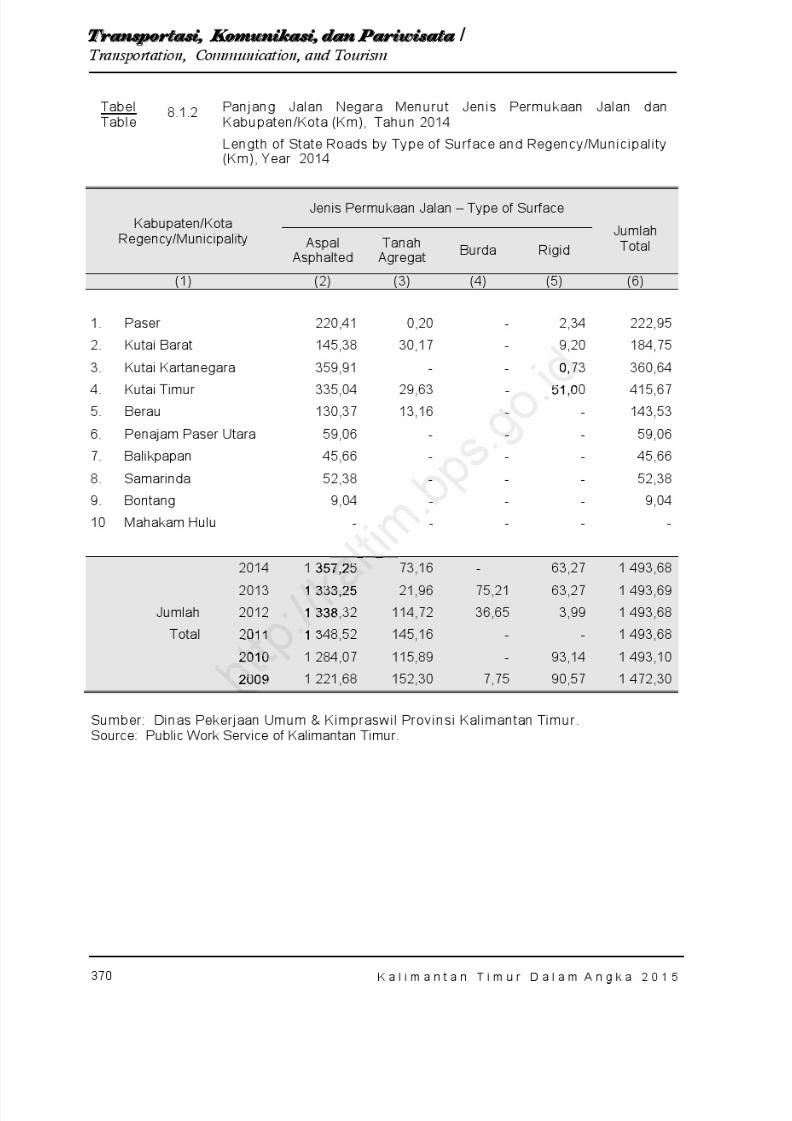
8/20/2019 Kalimantan Timur Dalam Angka Tahun 2015
http://slidepdf.com/reader/full/kalimantan-timur-dalam-angka-tahun-2015 436/623
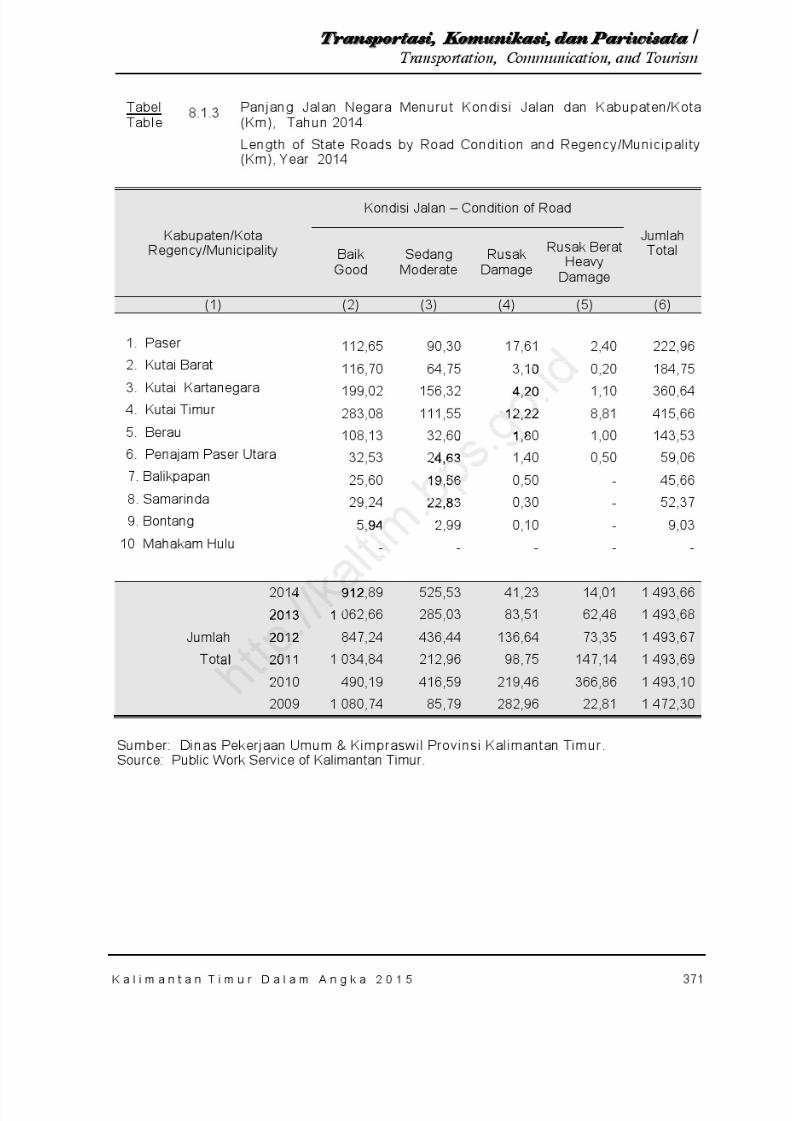
8/20/2019 Kalimantan Timur Dalam Angka Tahun 2015
http://slidepdf.com/reader/full/kalimantan-timur-dalam-angka-tahun-2015 437/623
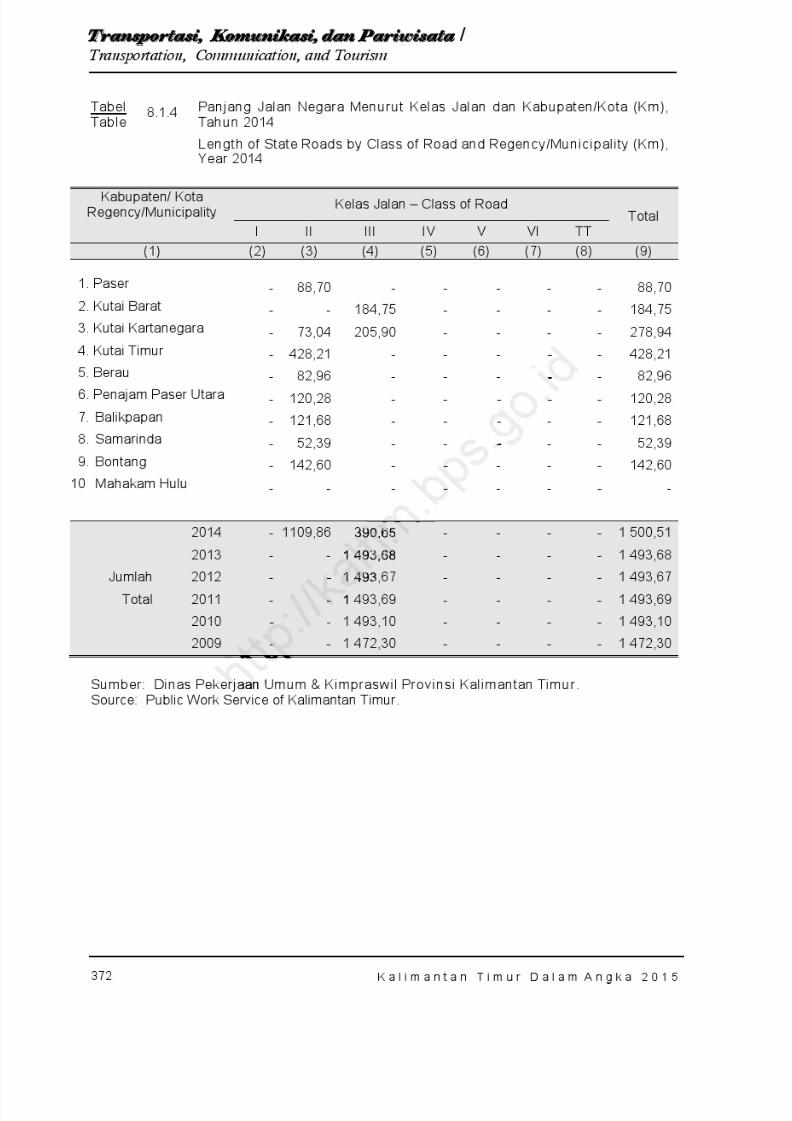
8/20/2019 Kalimantan Timur Dalam Angka Tahun 2015
http://slidepdf.com/reader/full/kalimantan-timur-dalam-angka-tahun-2015 438/623
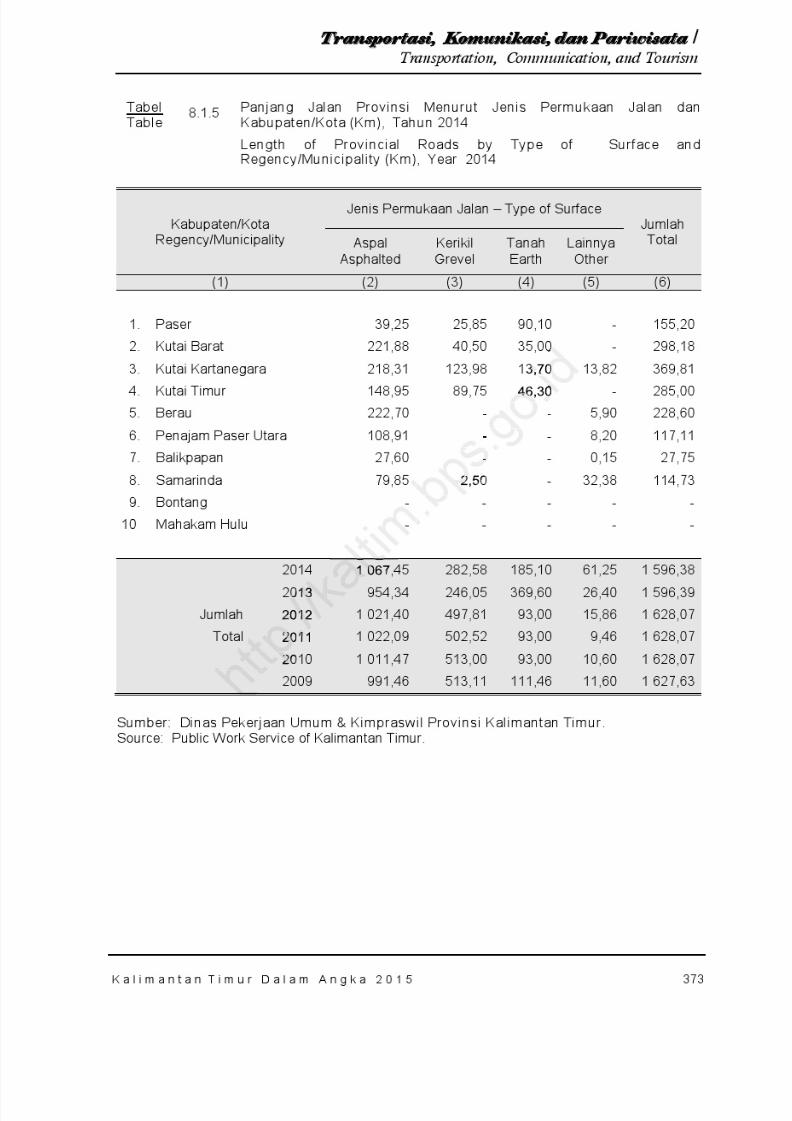
8/20/2019 Kalimantan Timur Dalam Angka Tahun 2015
http://slidepdf.com/reader/full/kalimantan-timur-dalam-angka-tahun-2015 439/623
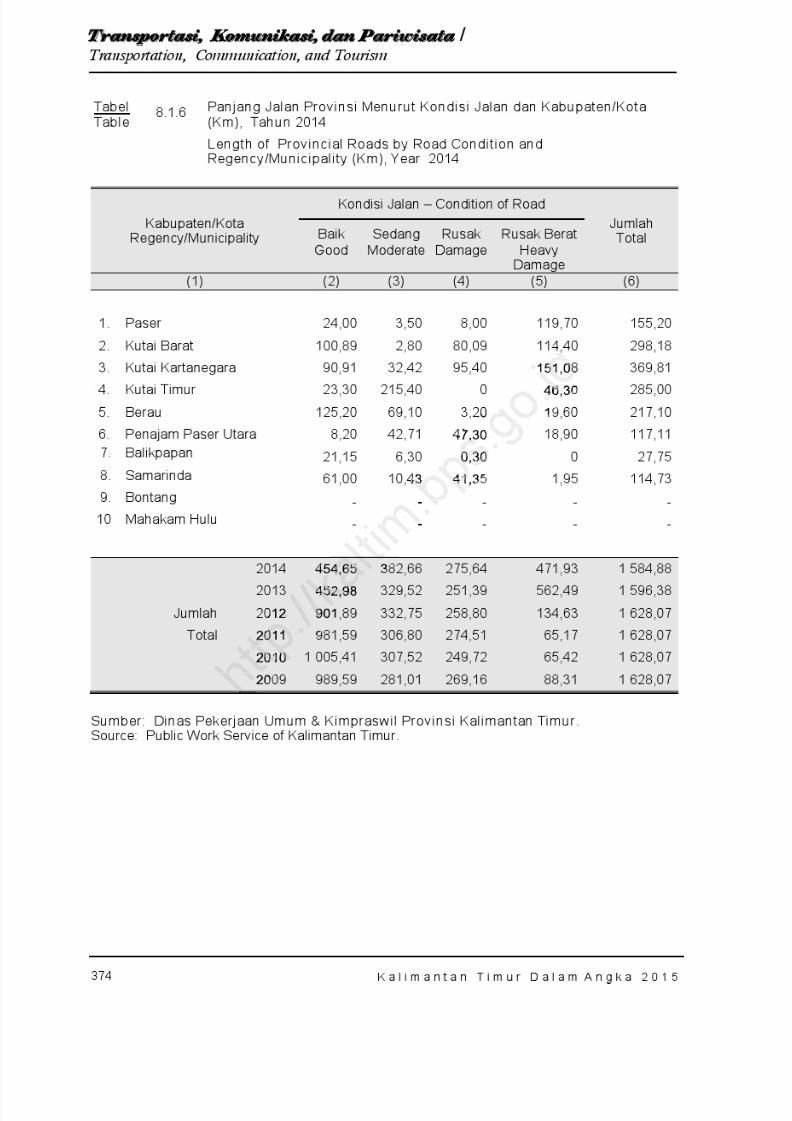
8/20/2019 Kalimantan Timur Dalam Angka Tahun 2015
http://slidepdf.com/reader/full/kalimantan-timur-dalam-angka-tahun-2015 440/623
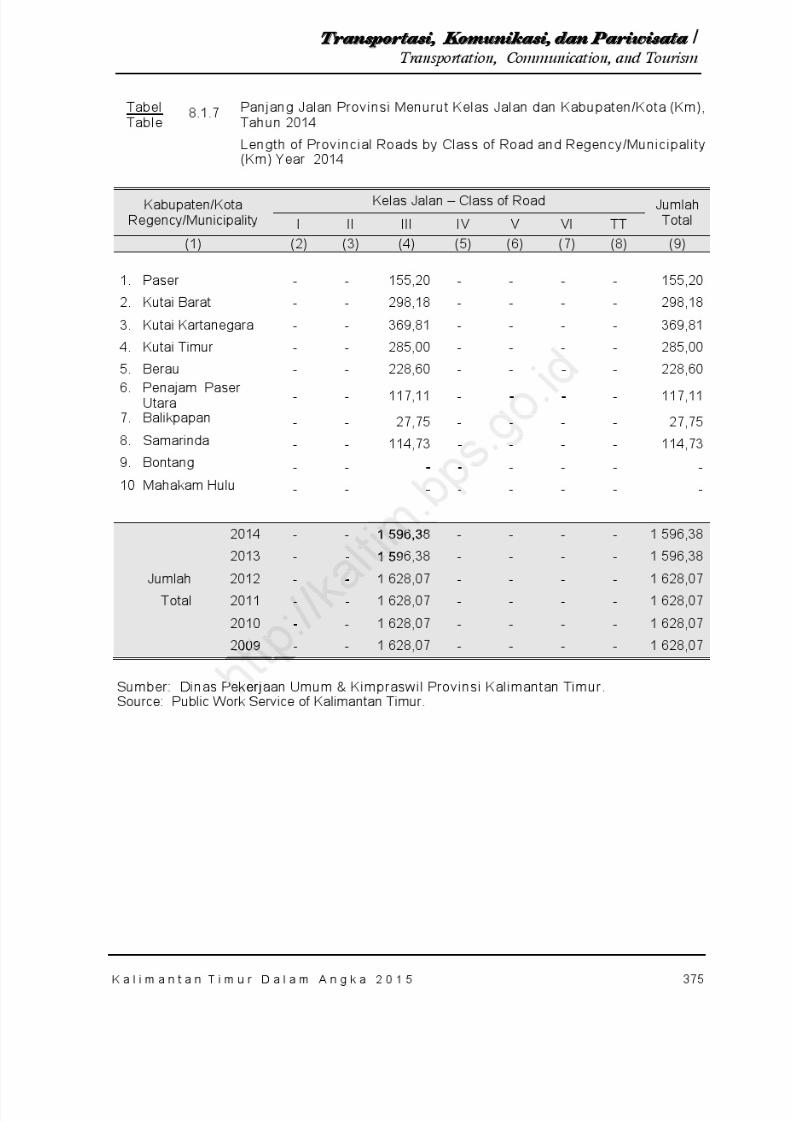
8/20/2019 Kalimantan Timur Dalam Angka Tahun 2015
http://slidepdf.com/reader/full/kalimantan-timur-dalam-angka-tahun-2015 441/623
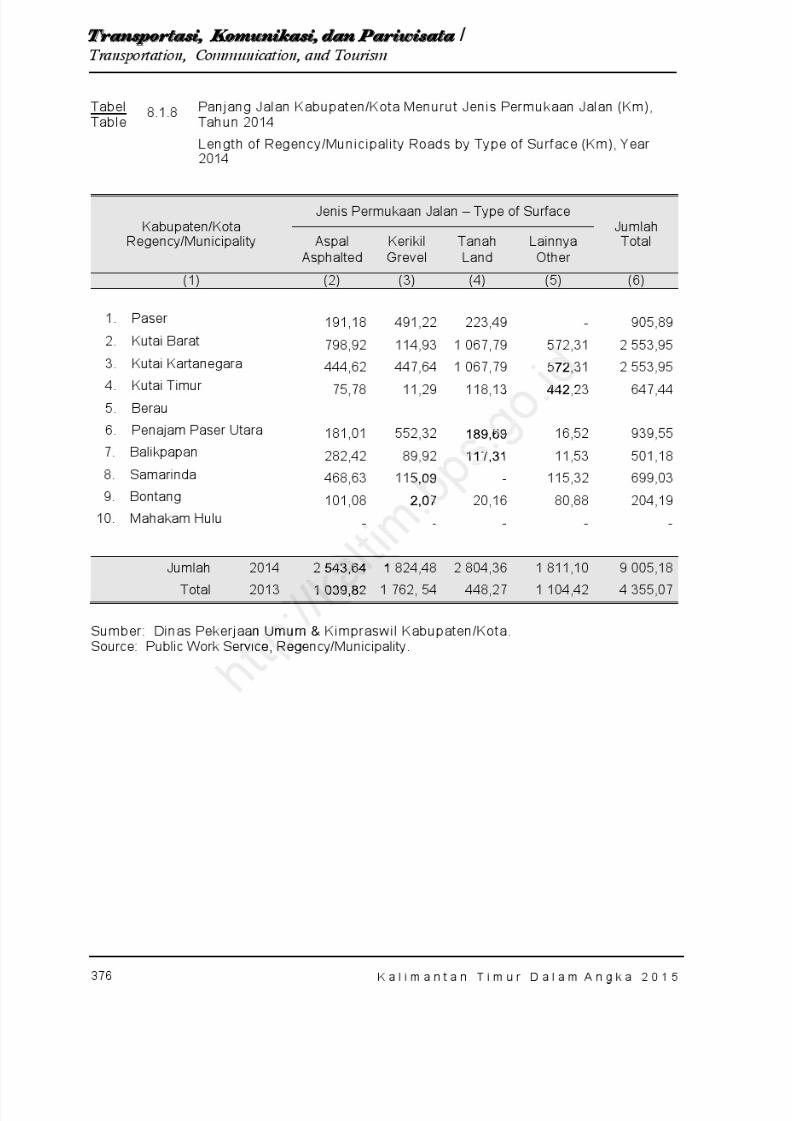
8/20/2019 Kalimantan Timur Dalam Angka Tahun 2015
http://slidepdf.com/reader/full/kalimantan-timur-dalam-angka-tahun-2015 442/623
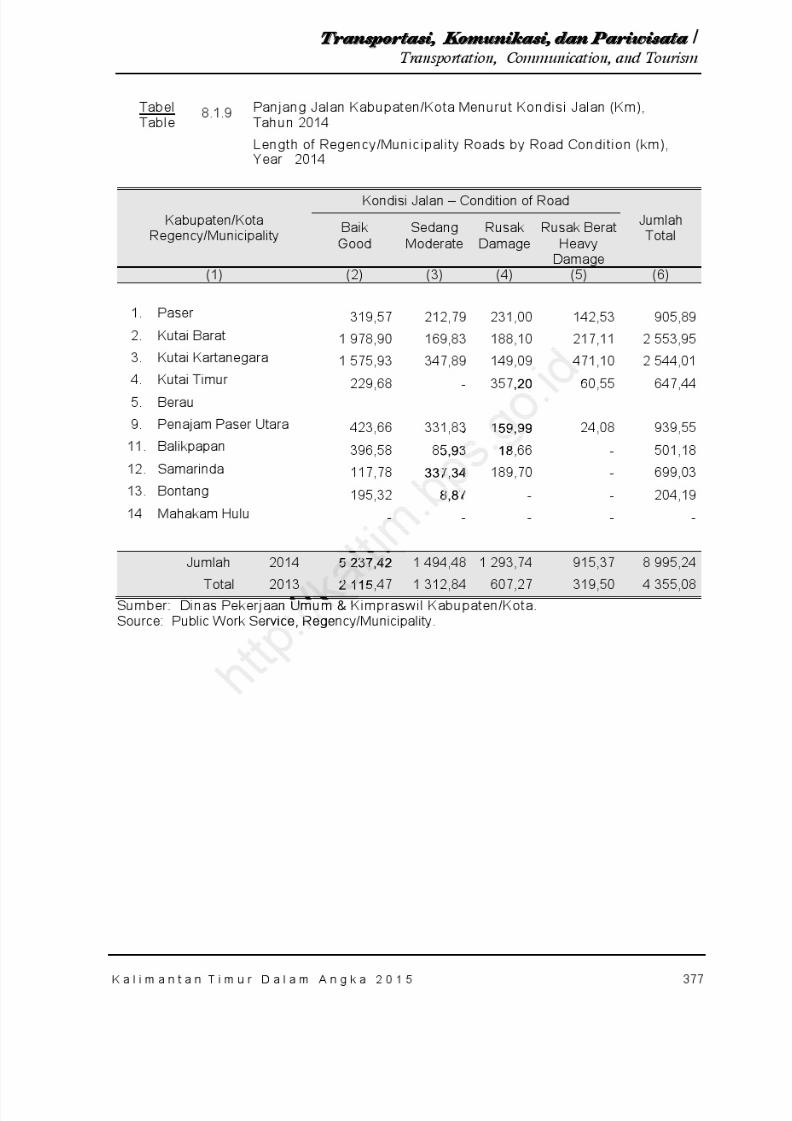
8/20/2019 Kalimantan Timur Dalam Angka Tahun 2015
http://slidepdf.com/reader/full/kalimantan-timur-dalam-angka-tahun-2015 443/623
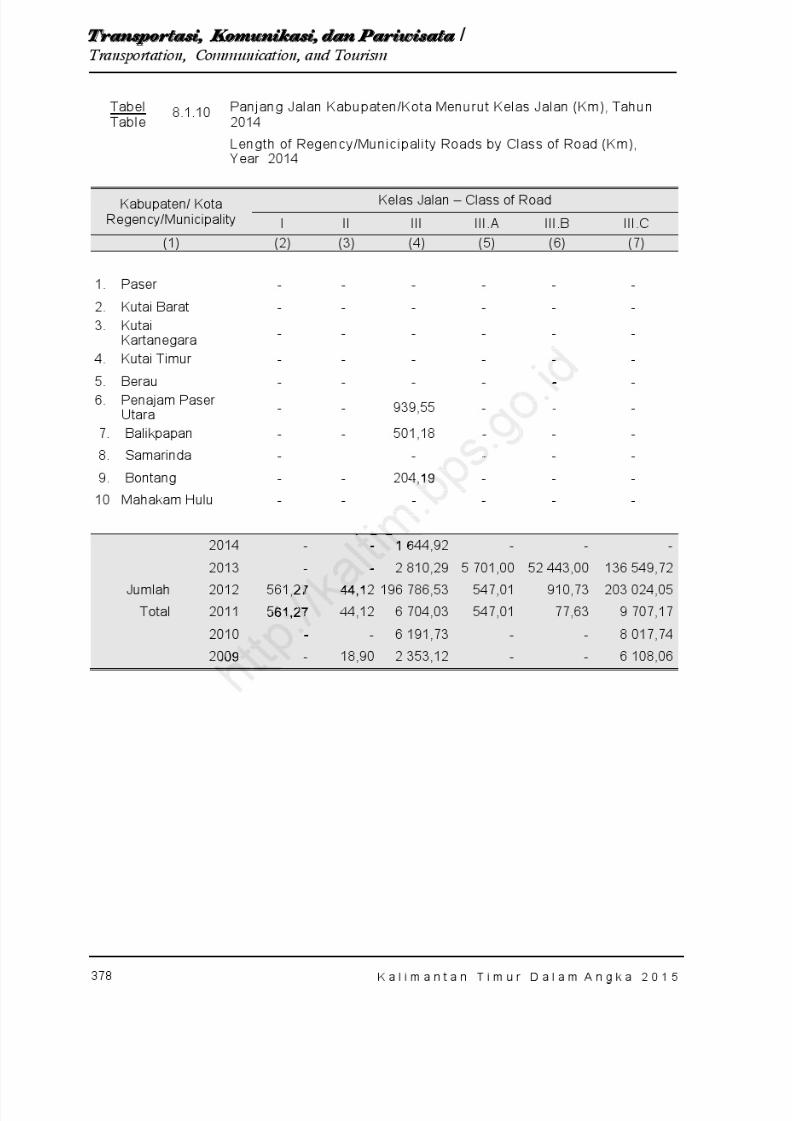
8/20/2019 Kalimantan Timur Dalam Angka Tahun 2015
http://slidepdf.com/reader/full/kalimantan-timur-dalam-angka-tahun-2015 444/623
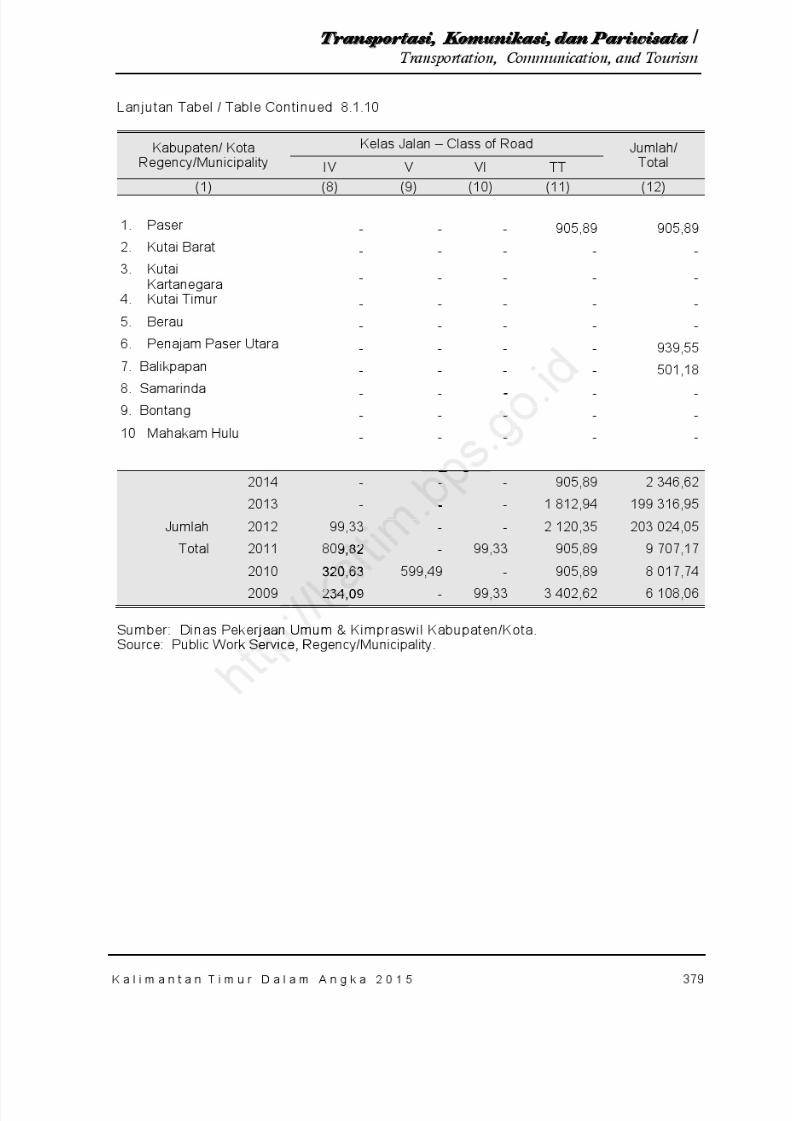
8/20/2019 Kalimantan Timur Dalam Angka Tahun 2015
http://slidepdf.com/reader/full/kalimantan-timur-dalam-angka-tahun-2015 445/623
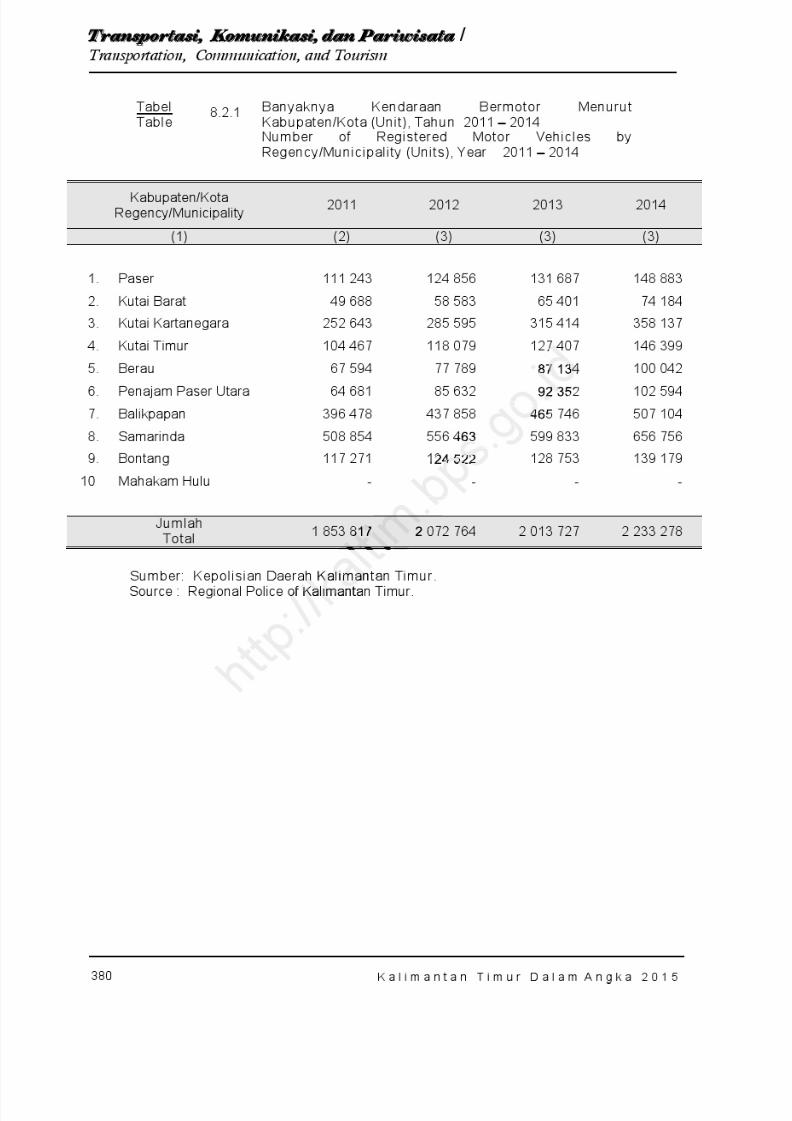
8/20/2019 Kalimantan Timur Dalam Angka Tahun 2015
http://slidepdf.com/reader/full/kalimantan-timur-dalam-angka-tahun-2015 446/623
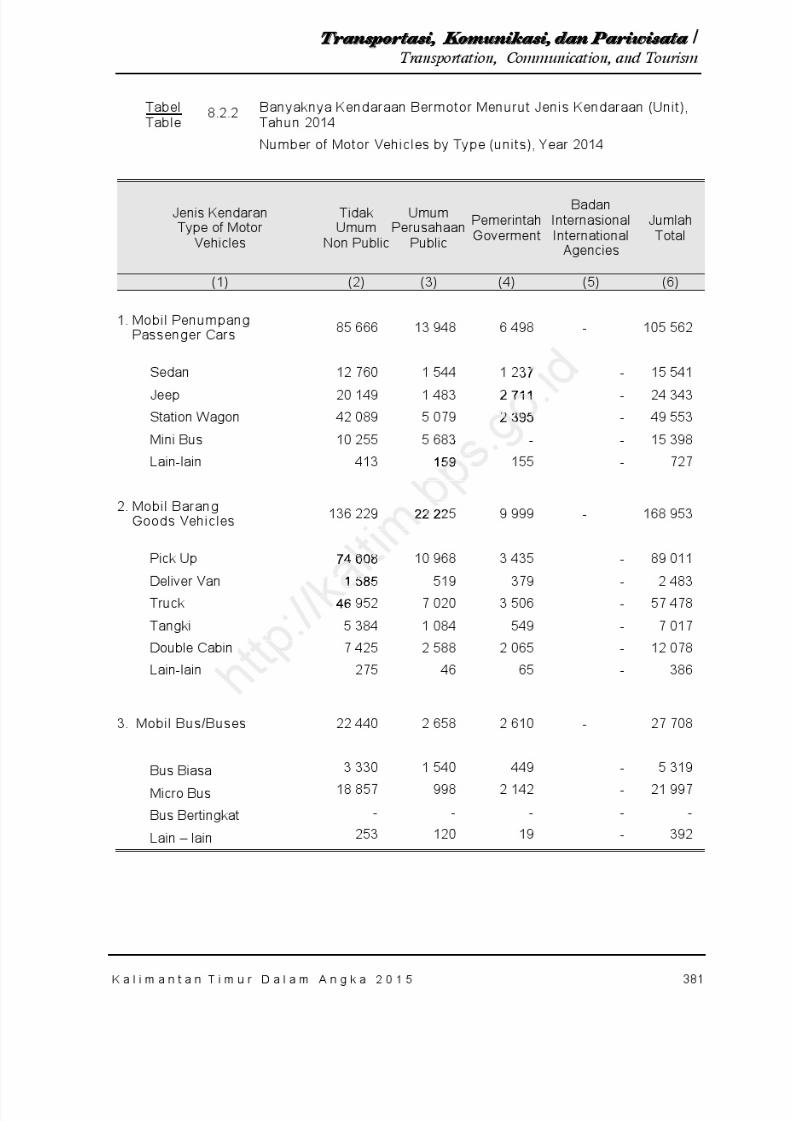
8/20/2019 Kalimantan Timur Dalam Angka Tahun 2015
http://slidepdf.com/reader/full/kalimantan-timur-dalam-angka-tahun-2015 447/623
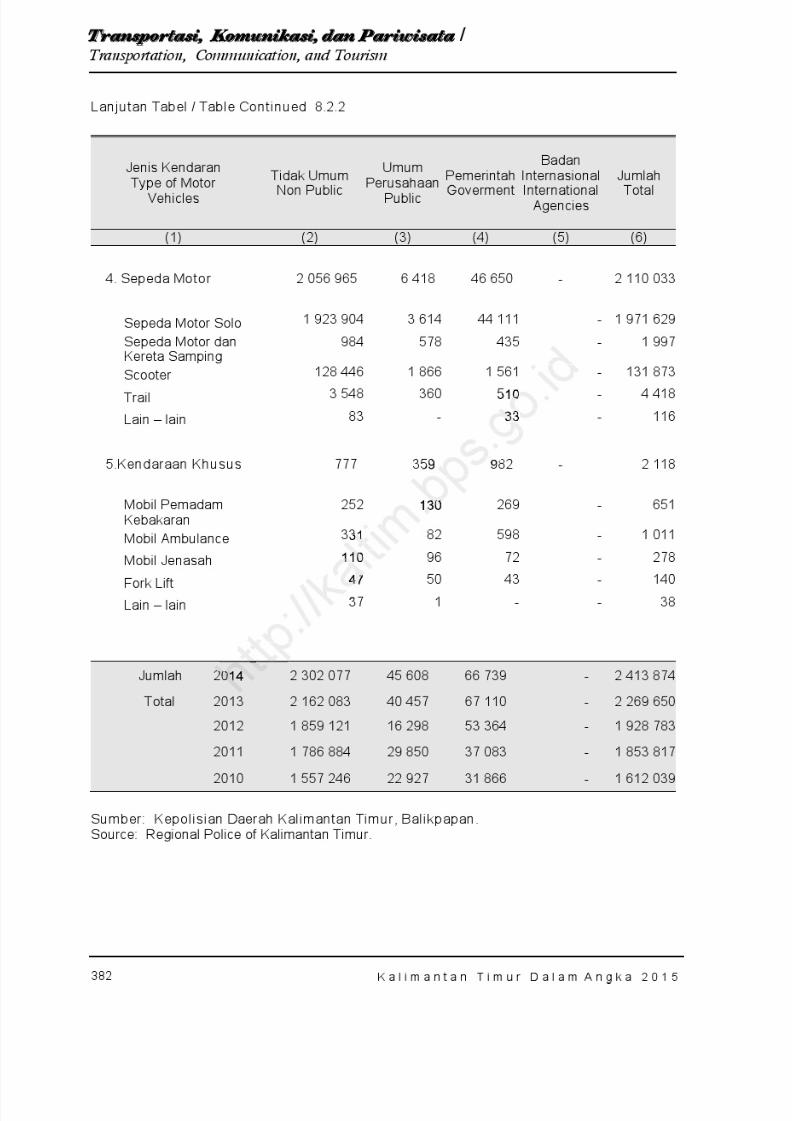
8/20/2019 Kalimantan Timur Dalam Angka Tahun 2015
http://slidepdf.com/reader/full/kalimantan-timur-dalam-angka-tahun-2015 448/623
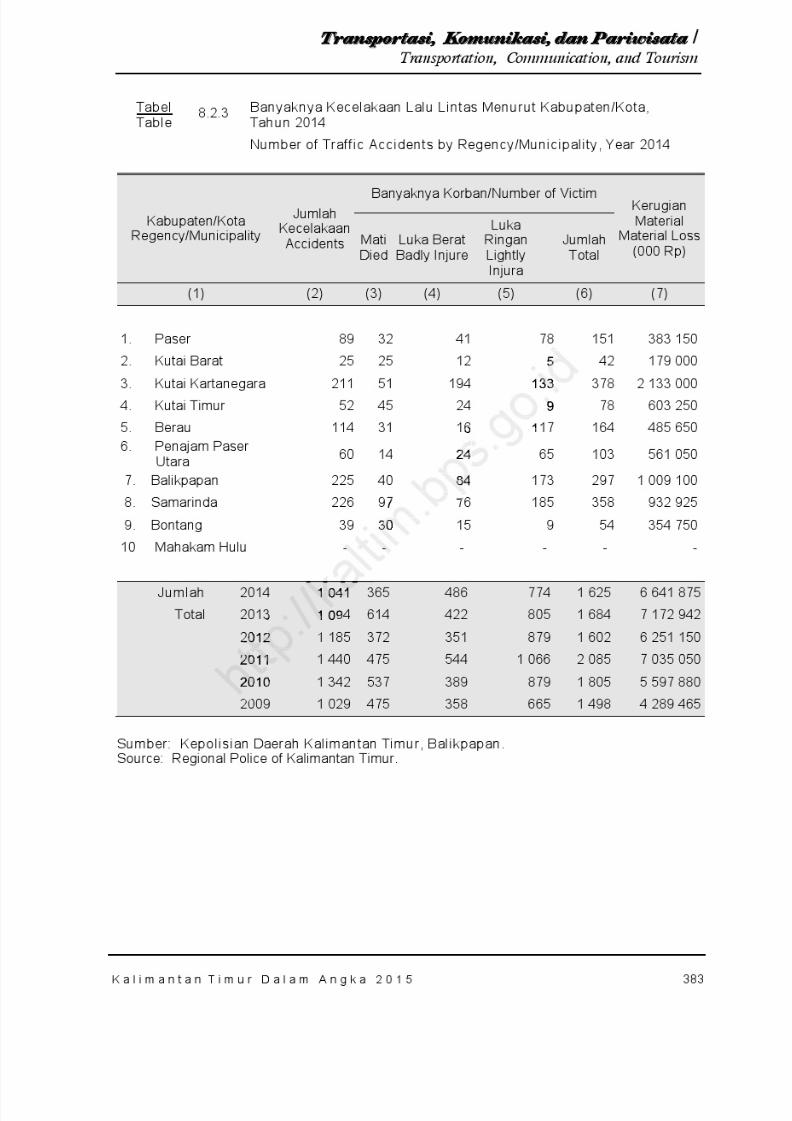
8/20/2019 Kalimantan Timur Dalam Angka Tahun 2015
http://slidepdf.com/reader/full/kalimantan-timur-dalam-angka-tahun-2015 449/623
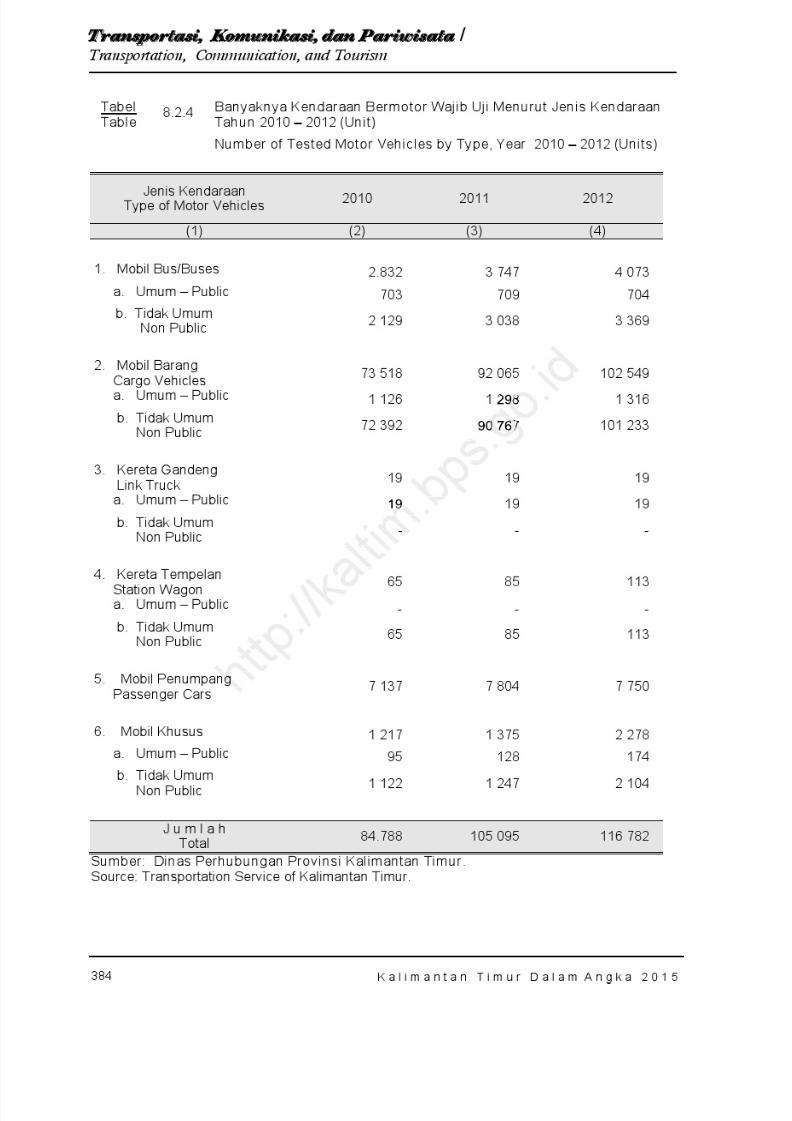
8/20/2019 Kalimantan Timur Dalam Angka Tahun 2015
http://slidepdf.com/reader/full/kalimantan-timur-dalam-angka-tahun-2015 450/623
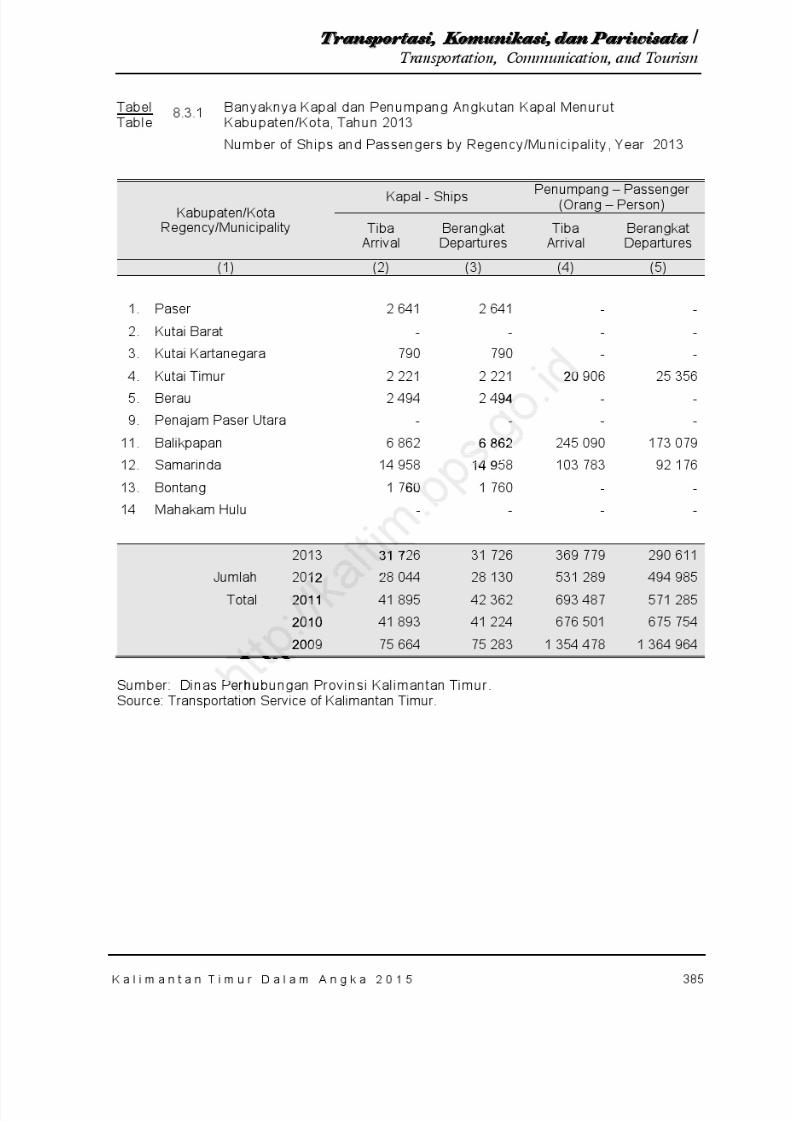
8/20/2019 Kalimantan Timur Dalam Angka Tahun 2015
http://slidepdf.com/reader/full/kalimantan-timur-dalam-angka-tahun-2015 451/623
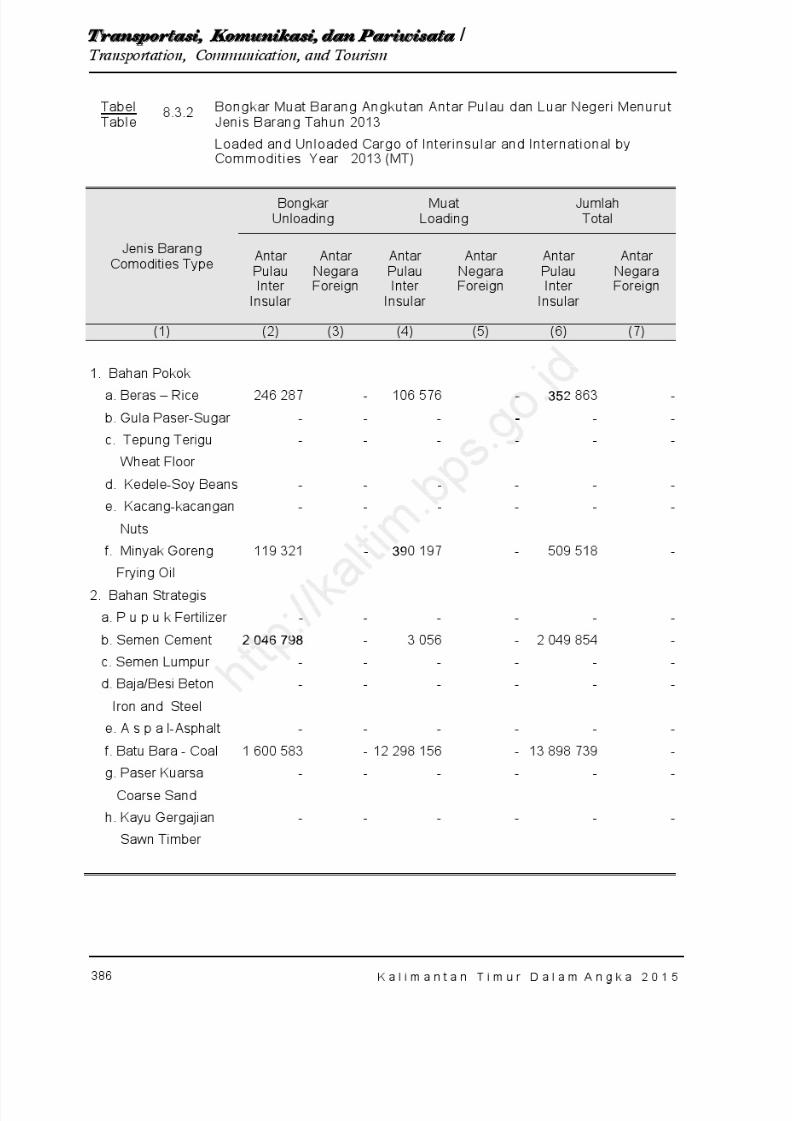
8/20/2019 Kalimantan Timur Dalam Angka Tahun 2015
http://slidepdf.com/reader/full/kalimantan-timur-dalam-angka-tahun-2015 452/623
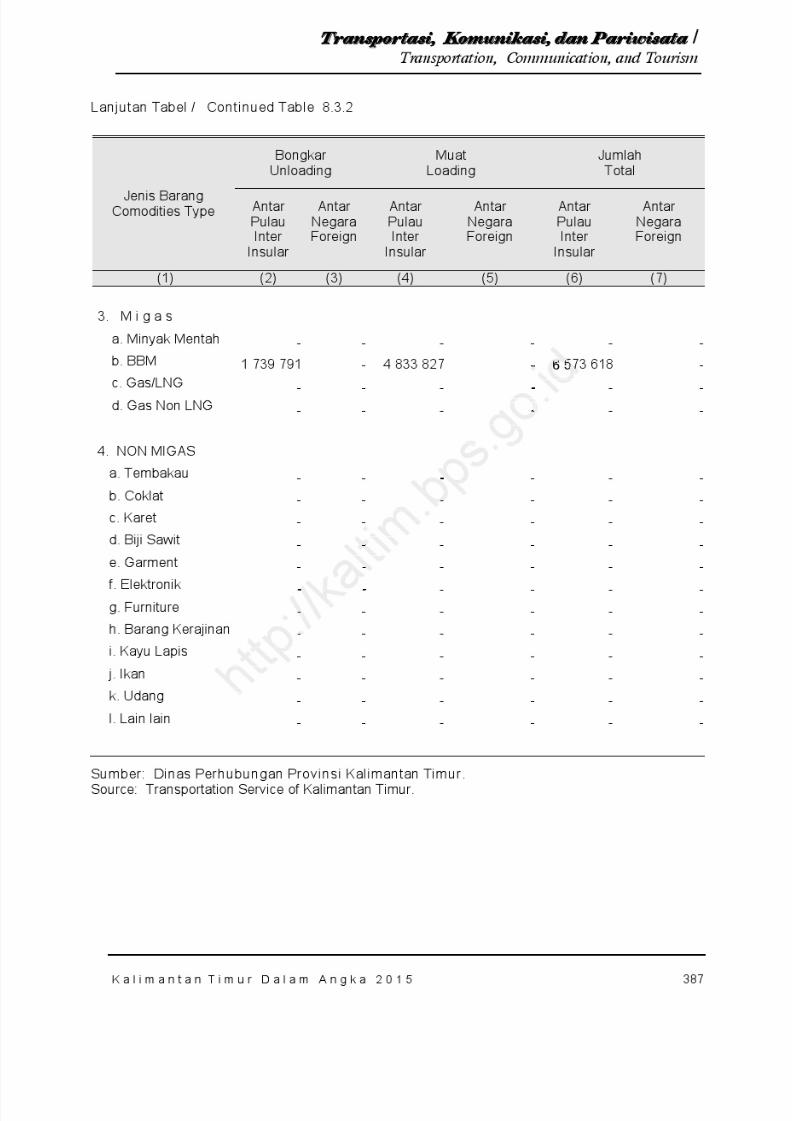
8/20/2019 Kalimantan Timur Dalam Angka Tahun 2015
http://slidepdf.com/reader/full/kalimantan-timur-dalam-angka-tahun-2015 453/623
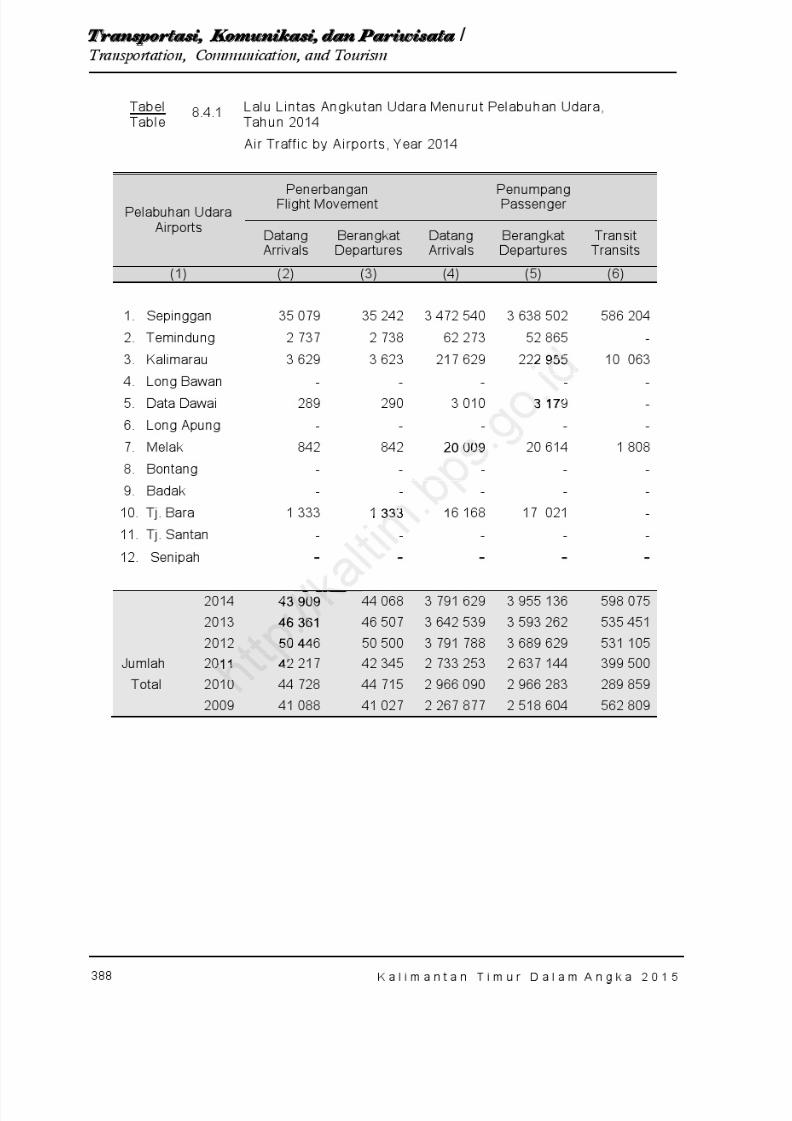
8/20/2019 Kalimantan Timur Dalam Angka Tahun 2015
http://slidepdf.com/reader/full/kalimantan-timur-dalam-angka-tahun-2015 454/623
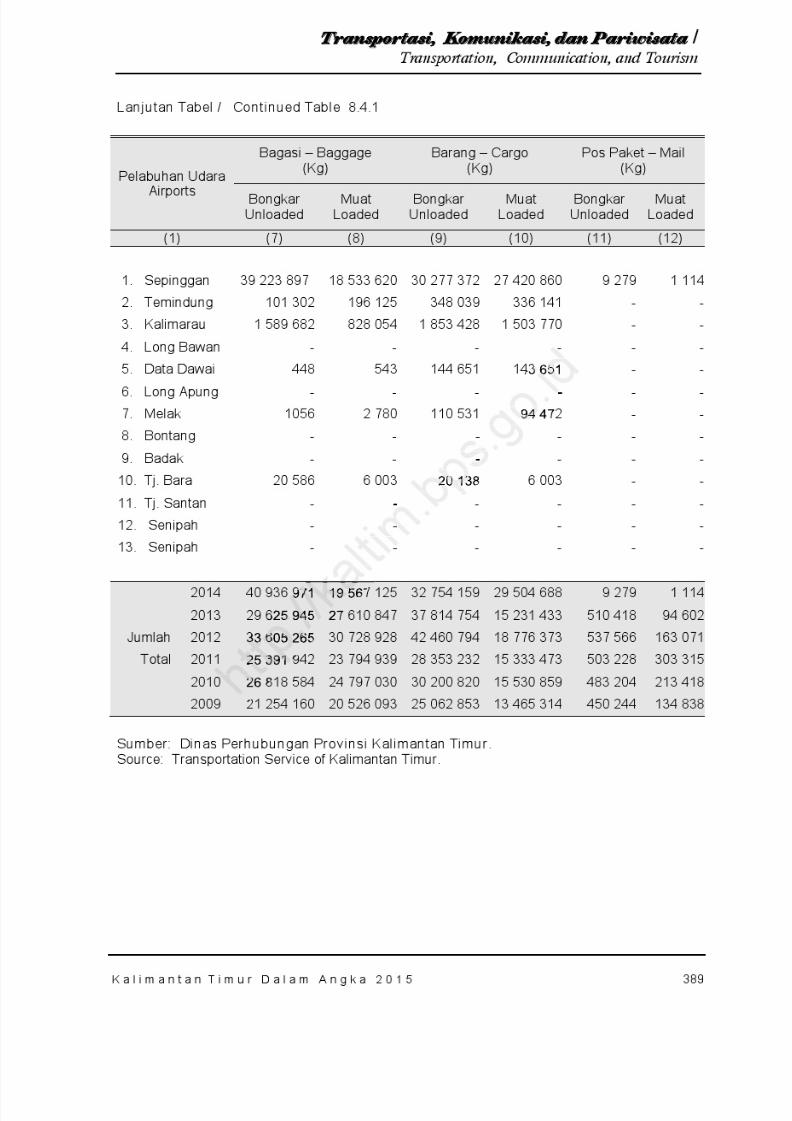
8/20/2019 Kalimantan Timur Dalam Angka Tahun 2015
http://slidepdf.com/reader/full/kalimantan-timur-dalam-angka-tahun-2015 455/623
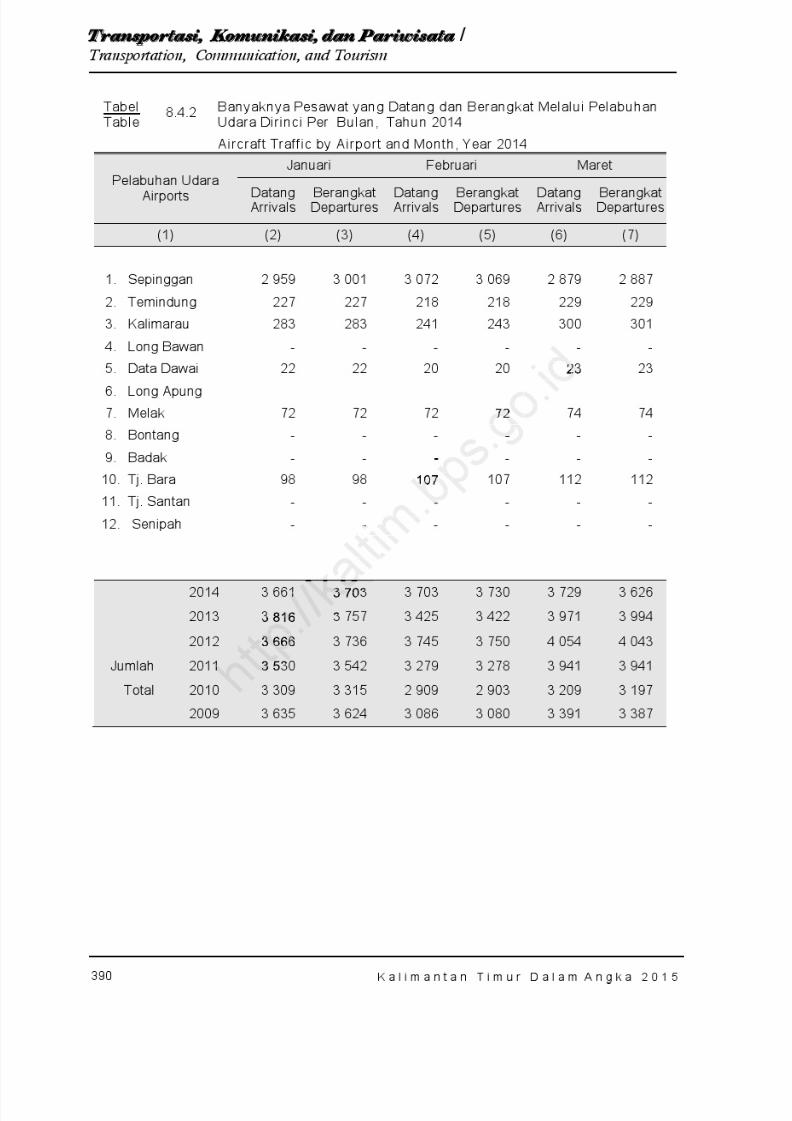
8/20/2019 Kalimantan Timur Dalam Angka Tahun 2015
http://slidepdf.com/reader/full/kalimantan-timur-dalam-angka-tahun-2015 456/623
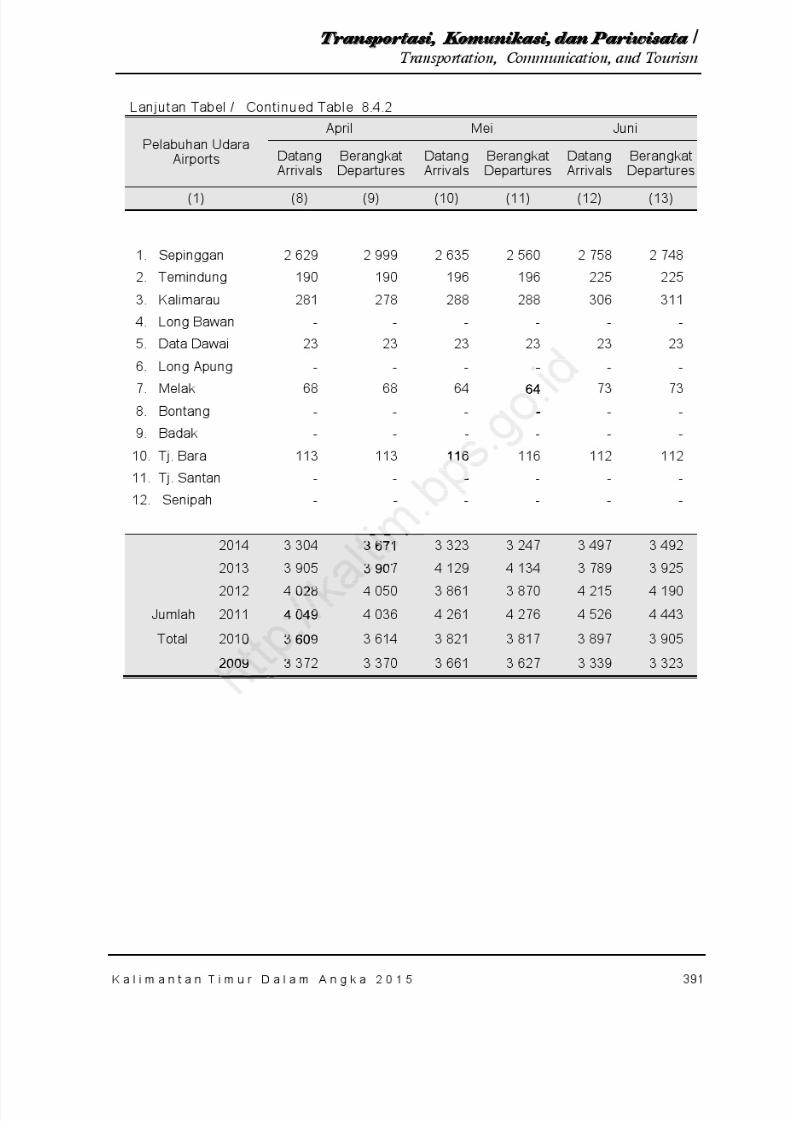
8/20/2019 Kalimantan Timur Dalam Angka Tahun 2015
http://slidepdf.com/reader/full/kalimantan-timur-dalam-angka-tahun-2015 457/623

8/20/2019 Kalimantan Timur Dalam Angka Tahun 2015
http://slidepdf.com/reader/full/kalimantan-timur-dalam-angka-tahun-2015 458/623
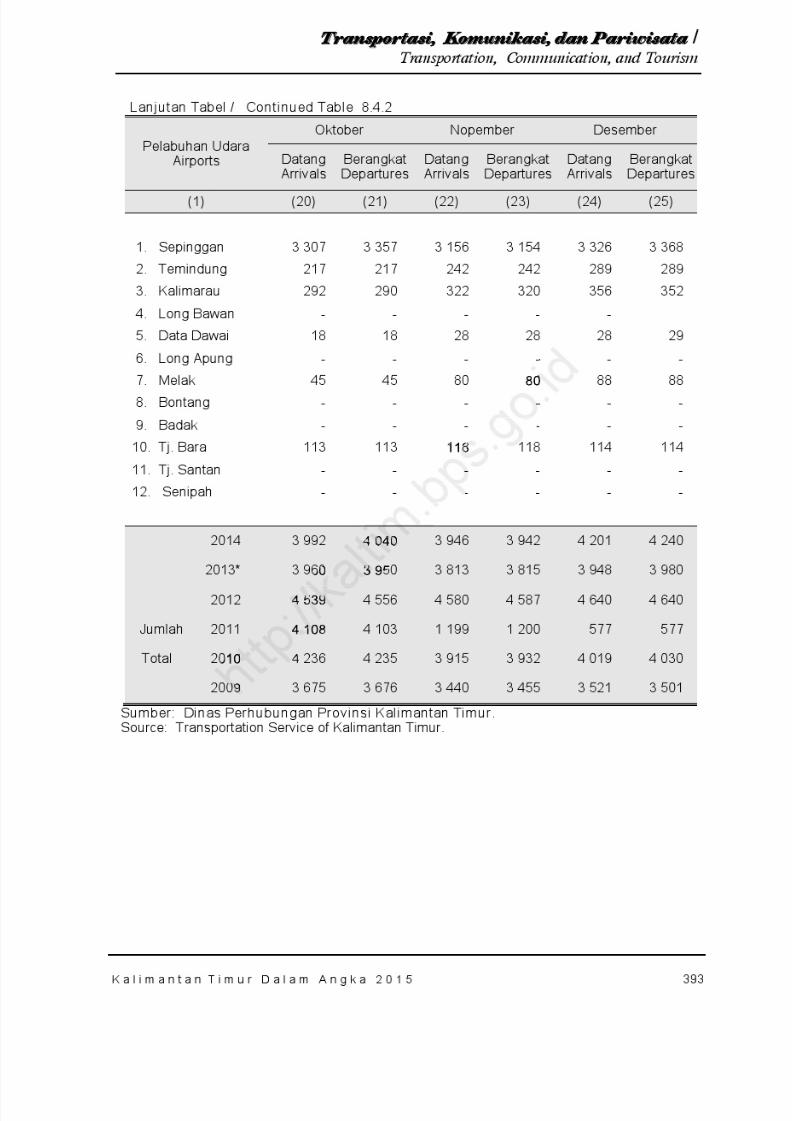
8/20/2019 Kalimantan Timur Dalam Angka Tahun 2015
http://slidepdf.com/reader/full/kalimantan-timur-dalam-angka-tahun-2015 459/623
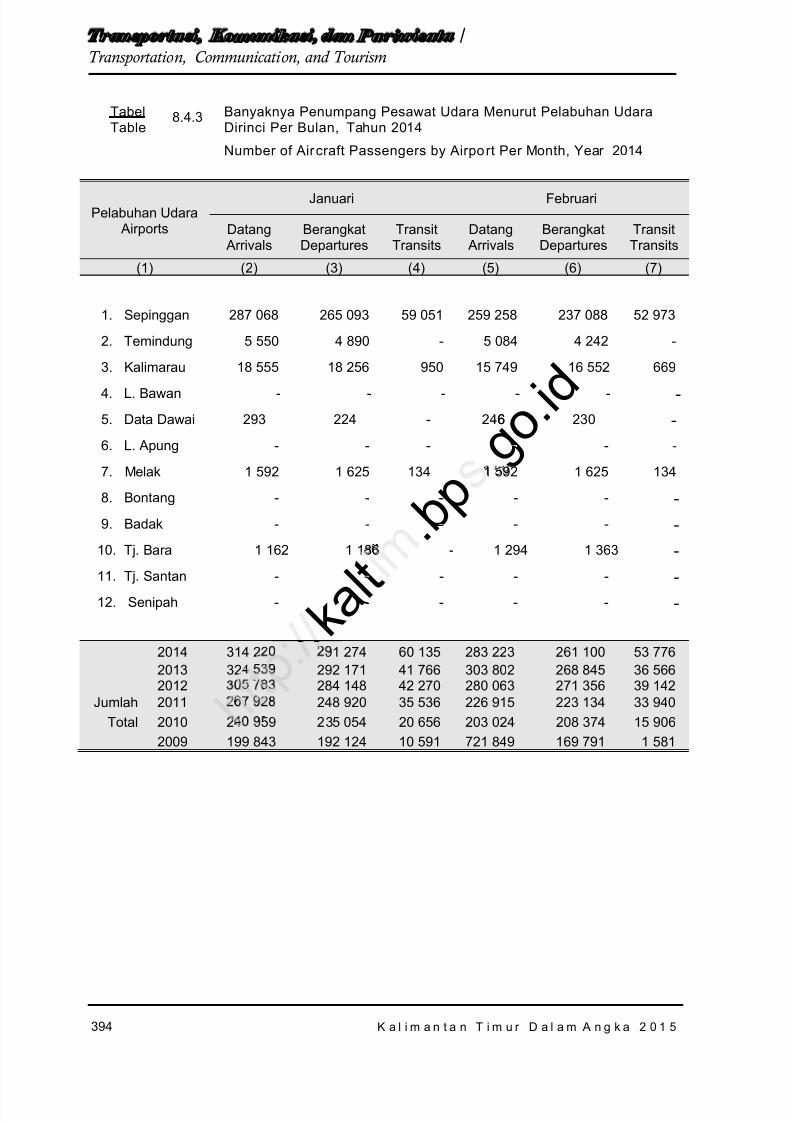
8/20/2019 Kalimantan Timur Dalam Angka Tahun 2015
http://slidepdf.com/reader/full/kalimantan-timur-dalam-angka-tahun-2015 460/623
394
T r a n s p o r t a s i , Ko m u n i k a s i , d a n Pa r i w i s a t a /Transportation, Communication, and Tourism
K a l i m a n t a n T i m u r D a l a m A n g k a 2 0 1 5
TabelTable
8.4.3 Banyaknya Penumpang Pesawat Udara Menurut Pelabuhan UdaraDirinci Per Bulan, Tahun 2014
Number of Aircraft Passengers by Airport Per Month, Year 2014
Pelabuhan Udara Airports
Januari Februari
Datang Arrivals
BerangkatDepartures
TransitTransits
Datang Arrivals
BerangkatDepartures
TransitTransits
(1) (2) (3) (4) (5) (6) (7)
1. Sepinggan 287 068 265 093 59 051 259 258 237 088 52 973
2. Temindung 5 550 4 890 - 5 084 4 242 -
3. Kalimarau 18 555 18 256 950 15 749 16 552 669
4. L. Bawan - - - - - -5. Data Dawai 293 224 - 246 230 -6. L. Apung - - - - - -
7. Melak 1 592 1 625 134 1 592 1 625 134
8. Bontang - - - - - -9. Badak - - - - - -
10. Tj. Bara 1 162 1 186 - 1 294 1 363 -
11. Tj. Santan - - - - - -12. Senipah - - - - - -
2014 314 220 291 274 60 135 283 223 261 100 53 7762013 324 539 292 171 41 766 303 802 268 845 36 5662012 305 783 284 148 42 270 280 063 271 356 39 142
Jumlah 2011 267 928 248 920 35 536 226 915 223 134 33 940Total 2010 240 959 235 054 20 656 203 024 208 374 15 906
2009 199 843 192 124 10 591 721 849 169 791 1 581
k a l t . b p
g o . i d6
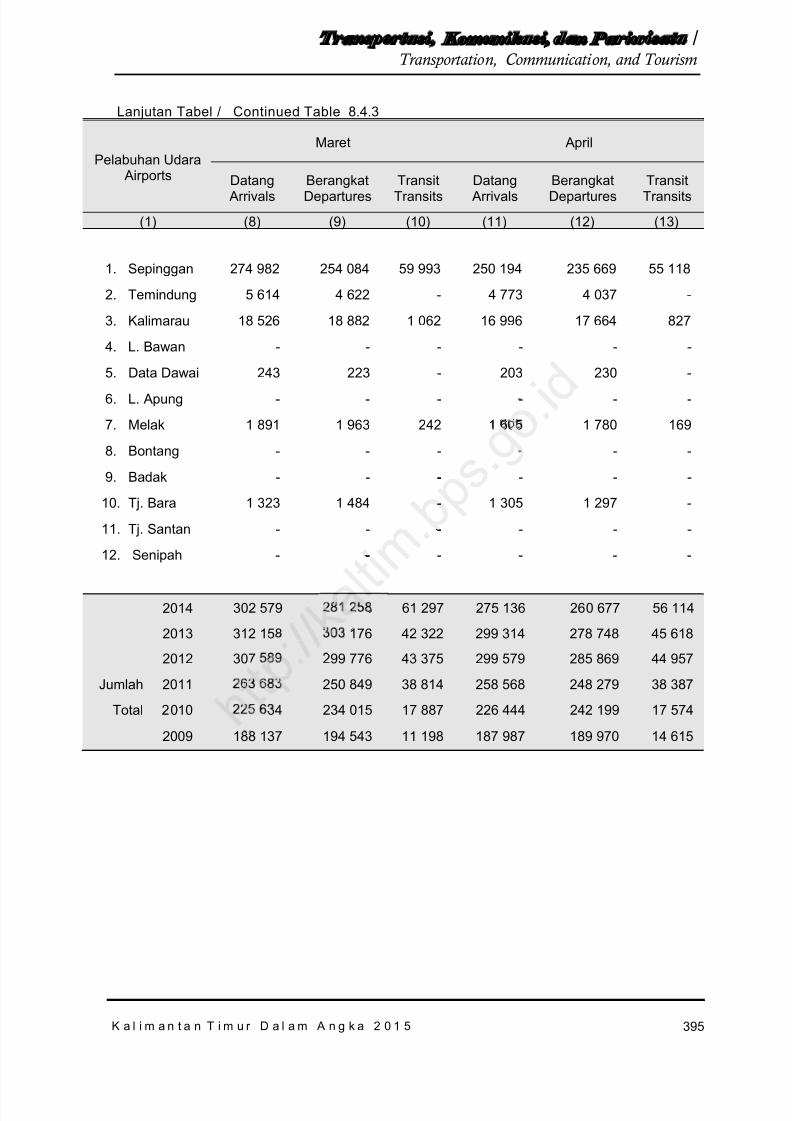
8/20/2019 Kalimantan Timur Dalam Angka Tahun 2015
http://slidepdf.com/reader/full/kalimantan-timur-dalam-angka-tahun-2015 461/623
395
T r a n s p o r t a s i , Ko m u n i k a s i , d a n Pa r i w i s a t a /Transportation, Communication, and Tourism
K a l i m a n t a n T i m u r D a l a m A n g k a 2 0 1 5
Lanjutan Tabel / Continued Table 8.4.3
Pelabuhan Udara Airports
Maret April
Datang Arrivals
BerangkatDepartures
TransitTransits
Datang Arrivals
BerangkatDepartures
TransitTransits
(1) (8) (9) (10) (11) (12) (13)
1. Sepinggan 274 982 254 084 59 993 250 194 235 669 55 118
2. Temindung 5 614 4 622 - 4 773 4 037 -
3. Kalimarau 18 526 18 882 1 062 16 996 17 664 827
4. L. Bawan - - - - - -
5. Data Dawai 243 223 - 203 230 -
6. L. Apung - - - - - -
7. Melak 1 891 1 963 242 1 665 1 780 169
8. Bontang - - - - - -
9. Badak - - - - - -
10. Tj. Bara 1 323 1 484 - 1 305 1 297 -
11. Tj. Santan - - - - - -
12. Senipah - - - - - -
2014 302 579 281 258 61 297 275 136 26 0 677 56 114
2013 312 158 303 176 42 322 299 314 278 748 45 618
2012 307 589 299 776 43 375 299 579 285 869 44 957
Jumlah 2011 263 683 250 849 38 814 258 568 248 279 38 387
Total 2010 225 634 234 015 17 887 226 444 242 199 17 574
2009 188 137 194 543 11 198 187 987 189 970 14 615
-
--
-
-

8/20/2019 Kalimantan Timur Dalam Angka Tahun 2015
http://slidepdf.com/reader/full/kalimantan-timur-dalam-angka-tahun-2015 462/623
396
T r a n s p o r t a s i , Ko m u n i k a s i , d a n Pa r i w i s a t a /Transportation, Communication, and Tourism
K a l i m a n t a n T i m u r D a l a m A n g k a 2 0 1 5
Lanjutan Tabel / Continued Table 8.4.3
Pelabuhan Udara Airports
Mei Juni
Datang
Arrivals
Berangkat
Departures
Transit
Transits
Datang
Arrivals
Berangkat
Departures
Transit
Transits(1) (14) (15) (16) (17) (18) (19)
1. Sepinggan 299 343 315 964 52 901 327 576 355 280 69 294
2. Temindung 4 861 3 966 - 5 813 4 717 -
3. Kalimarau 17 809 19 379 902 19 573 20 676 1 038
4. L. Bawan - - - - - -
5. Data Dawai 283 324 - 294 334 -
6. L. Apung - - - - - -
7. Melak 1 647 1 749 130 2 125 2 070 187
8. Bontang - - - - - -
9. Badak - - - - - -
10. Tj. Bara 1 404 1 532 - 1 570 1 567 -
11. Tj. Santan - - - - - -
12. Senipah - - - - - -
2014 325 347 342 914 53 933 356 951 384 644 70 529
2013 299 760 297 741 46 026 315 193 333 430 46 698
2012 311 153 297 313 45 861 306 021 317 281 49 380
Jumlah 2011 269 781 260 035 36 400 279 240 279 768 38 996
Total 2010 235 850 254 977 13 171 237 534 245 791 18 542
2009 205 905 210 620 17 499 199 804 218 545 16 558
t i m . b
s . g . i d-
2 1251
-
-
--
-
-
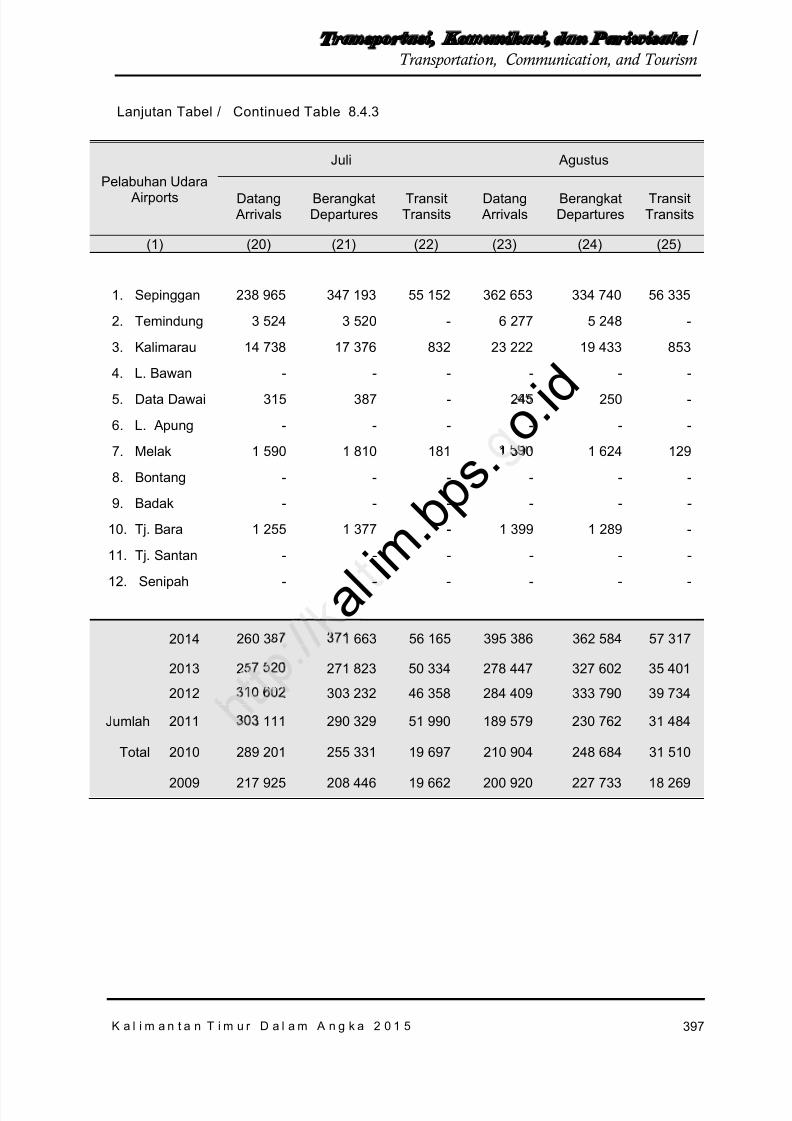
8/20/2019 Kalimantan Timur Dalam Angka Tahun 2015
http://slidepdf.com/reader/full/kalimantan-timur-dalam-angka-tahun-2015 463/623
397
T r a n s p o r t a s i , Ko m u n i k a s i , d a n Pa r i w i s a t a /Transportation, Communication, and Tourism
K a l i m a n t a n T i m u r D a l a m A n g k a 2 0 1 5
Lanjutan Tabel / Continued Table 8.4.3
Pelabuhan Udara Airports
Juli Agustus
Datang Arrivals
BerangkatDepartures
TransitTransits
Datang Arrivals
BerangkatDepartures
TransitTransits
(1) (20) (21) (22) (23) (24) (25)
1. Sepinggan 238 965 347 193 55 152 362 653 334 740 56 335
2. Temindung 3 524 3 520 - 6 277 5 248 -
3. Kalimarau 14 738 17 376 832 23 222 19 433 853
4. L. Bawan - - - - - -
5. Data Dawai 315 387 - 245 250 -
6. L. Apung - - - - - -
7. Melak 1 590 1 810 181 1 590 1 624 129
8. Bontang - - - - - -
9. Badak - - - - - -
10. Tj. Bara 1 255 1 377 - 1 399 1 289 -
11. Tj. Santan - - - - - -
12. Senipah - - - - - -
2014 26 0 387 371 663 56 165 395 386 362 584 57 317
2013 257 520 271 823 50 334 278 447 327 602 35 401
2012 310 602 303 232 46 358 284 409 333 790 39 734
Jumlah 2011 303 111 290 329 51 990 189 579 230 762 31 484
Total 2010 289 201 255 331 19 697 210 904 248 684 31 510
2009 217 925 208 446 19 662 200 920 227 733 18 269
a l i m . b p
s . o . i d-
-
-
-
-
--
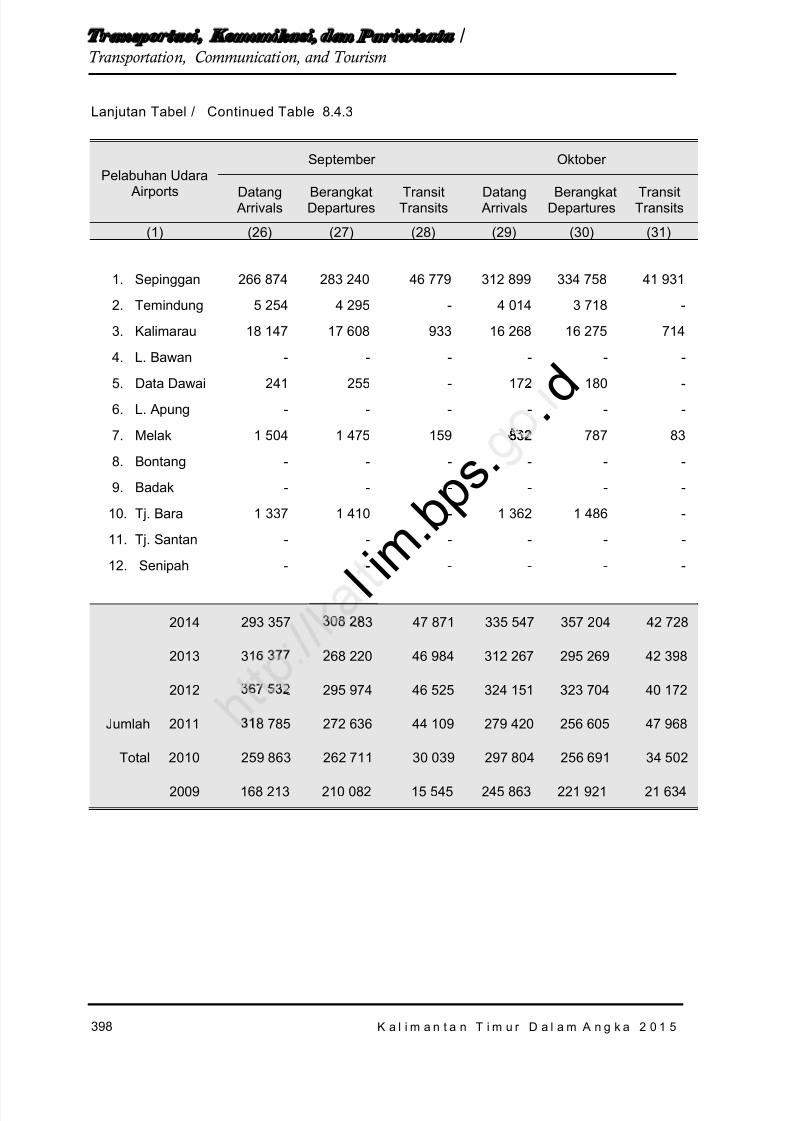
8/20/2019 Kalimantan Timur Dalam Angka Tahun 2015
http://slidepdf.com/reader/full/kalimantan-timur-dalam-angka-tahun-2015 464/623
398
T r a n s p o r t a s i , Ko m u n i k a s i , d a n Pa r i w i s a t a /Transportation, Communication, and Tourism
K a l i m a n t a n T i m u r D a l a m A n g k a 2 0 1 5
Lanjutan Tabel / Continued Table 8.4.3
Pelabuhan Udara
Airports
September Oktober
Datang Arrivals
BerangkatDepartures
TransitTransits
Datang Arrivals
BerangkatDepartures
TransitTransits
(1) (26) (27) (28) (29) (30) (31)
1. Sepinggan 266 874 283 240 46 779 312 899 334 758 41 931
2. Temindung 5 254 4 295 - 4 014 3 718 -
3. Kalimarau 18 147 17 608 933 16 268 16 275 714
4. L. Bawan - - - - - -
5. Data Dawai 241 255 - 172 180 -6. L. Apung - - - - - -
7. Melak 1 504 1 475 159 832 787 83
8. Bontang - - - - - -
9. Badak - - - - - -
10. Tj. Bara 1 337 1 410 - 1 362 1 486 -
11. Tj. Santan - - - - - -
12. Senipah - - - - - -
2014 293 357 3 08 283 47 871 335 547 357 2 04 42 728
2013 316 377 268 220 46 984 312 267 295 269 42 398
2012 367 532 295 974 46 525 324 151 323 704 40 172
Jumlah 2011 318 785 272 636 44 109 279 420 256 605 47 968
Total 2010 259 863 262 711 30 039 297 804 256 691 34 502
2009 168 213 210 082 15 545 245 863 221 921 21 634
l i m . b p
s . . d-
832
-
-
--
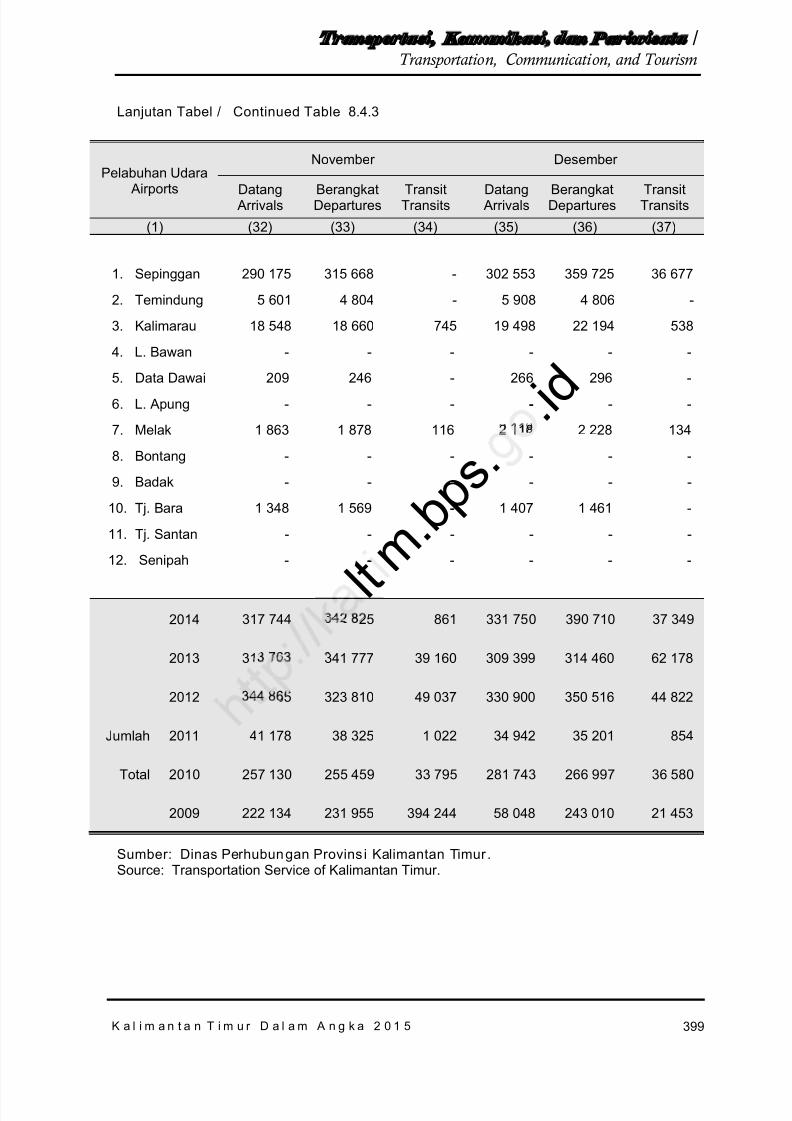
8/20/2019 Kalimantan Timur Dalam Angka Tahun 2015
http://slidepdf.com/reader/full/kalimantan-timur-dalam-angka-tahun-2015 465/623
399
T r a n s p o r t a s i , Ko m u n i k a s i , d a n Pa r i w i s a t a /Transportation, Communication, and Tourism
K a l i m a n t a n T i m u r D a l a m A n g k a 2 0 1 5
Lanjutan Tabel / Continued Table 8.4.3
Pelabuhan Udara
Airports
November Desember
Datang Arrivals BerangkatDepartures TransitTransits Datang Arrivals BerangkatDepartures TransitTransits(1) (32) (33) (34) (35) (36) (37)
1. Sepinggan 290 175 315 668 - 302 553 359 725 36 677
2. Temindung 5 601 4 804 - 5 908 4 806 -
3. Kalimarau 18 548 18 660 745 19 498 22 194 538
4. L. Bawan - - - - - -
5. Data Dawai 209 246 - 266 296 -6. L. Apung - - - - - -
7. Melak 1 863 1 878 116 2 118 2 228 134
8. Bontang - - - - - -
9. Badak - - - - - -
10. Tj. Bara 1 348 1 569 - 1 407 1 461 -
11. Tj. Santan - - - - - -
12. Senipah - - - - - -
2014 317 744 342 825 861 331 75 0 39 0 710 37 349
2013 313 763 341 777 39 160 309 399 314 460 62 178
2012 344 865 323 810 49 037 330 900 350 516 44 822
Jumlah 2011 41 178 38 325 1 022 34 942 35 201 854
Total 2010 257 130 255 459 33 795 281 743 266 997 36 580
2009 222 134 231 955 394 244 58 048 243 010 21 453
Sumber: Dinas Perhubungan Provins i Kalimantan Timur .Source: Transportation Service of Kalimantan Timur.
l t m . b p
s . . i d-
--
-
-
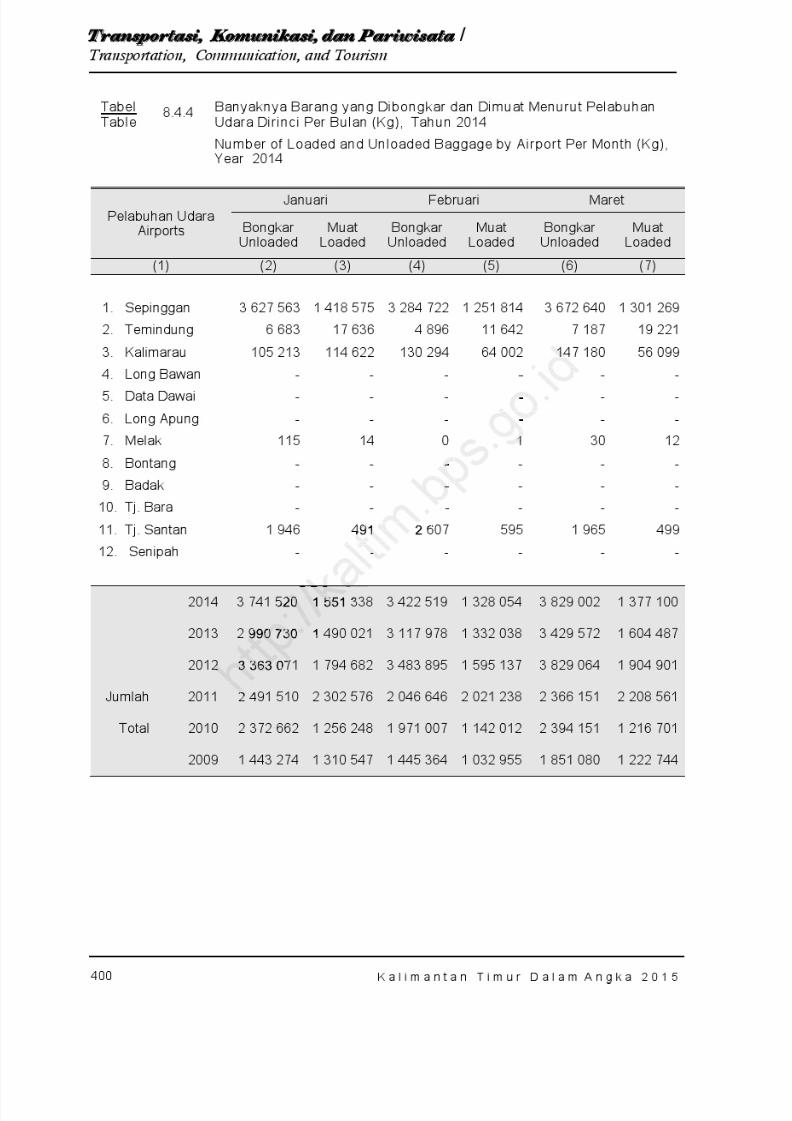
8/20/2019 Kalimantan Timur Dalam Angka Tahun 2015
http://slidepdf.com/reader/full/kalimantan-timur-dalam-angka-tahun-2015 466/623

8/20/2019 Kalimantan Timur Dalam Angka Tahun 2015
http://slidepdf.com/reader/full/kalimantan-timur-dalam-angka-tahun-2015 467/623
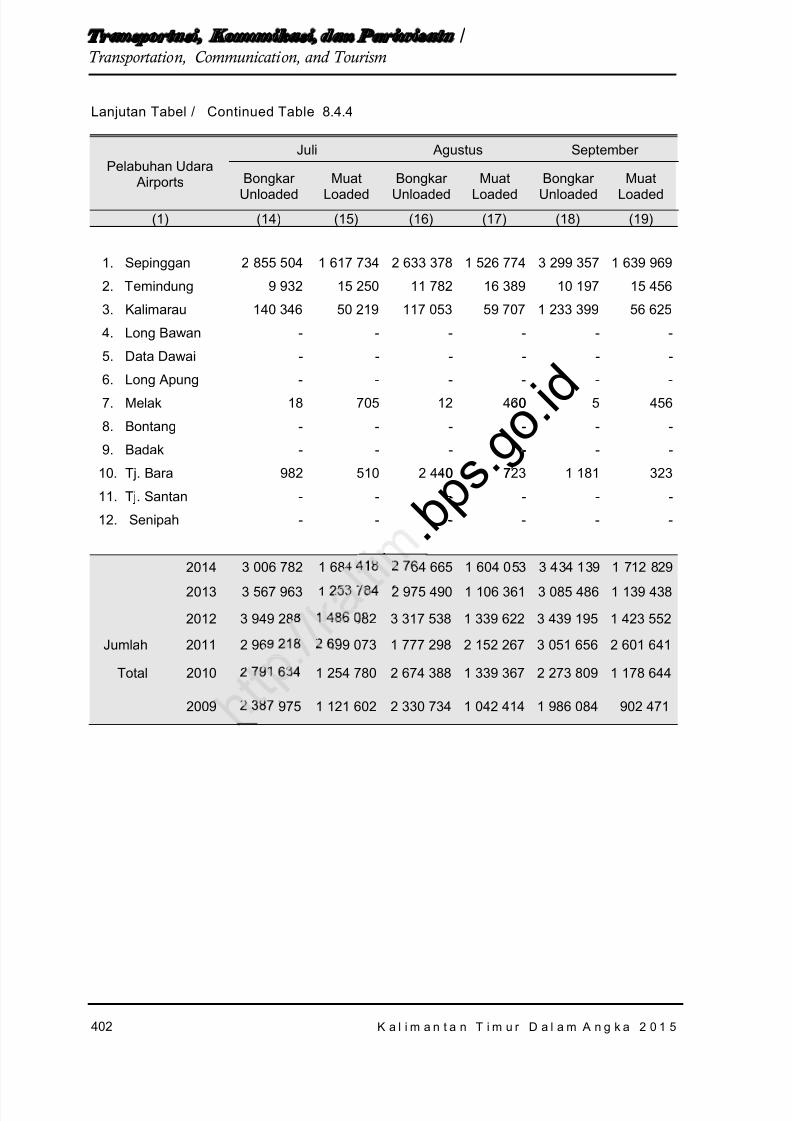
8/20/2019 Kalimantan Timur Dalam Angka Tahun 2015
http://slidepdf.com/reader/full/kalimantan-timur-dalam-angka-tahun-2015 468/623
402
T r a n s p o r t a s i , Ko m u n i k a s i , d a n Pa r i w i s a t a /Transportation, Communication, and Tourism
K a l i m a n t a n T i m u r D a l a m A n g k a 2 0 1 5
Lanjutan Tabel / Continued Table 8.4.4
Pelabuhan Udara Airports
Juli Agustus September
Bongkar Unloaded
MuatLoaded
Bongkar Unloaded
MuatLoaded
Bongkar Unloaded
MuatLoaded
(1) (14) (15) (16) (17) (18) (19)
1. Sepinggan 2 855 5 04 1 617 734 2 633 378 1 526 774 3 299 357 1 639 969
2. Temindung 9 932 15 250 11 782 16 389 10 197 15 456
3. Kalimarau 140 346 50 219 117 053 59 707 1 233 399 56 625
4. Long Bawan - - - - - -
5. Data Dawai - - - - - -
6. Long Apung - - - - - -7. Melak 18 705 12 460 5 456
8. Bontang - - - - - -
9. Badak - - - - - -
10. Tj. Bara 982 510 2 440 723 1 181 323
11. Tj. Santan - - - - - -
12. Senipah - - - - - -
2014 3 006 782 1 684 418 2 764 665 1 6 04 053 3 434 139 1 712 829
2013 3 567 963 1 253 784 2 975 490 1 106 361 3 085 486 1 139 438
2012 3 949 288 1 486 082 3 317 538 1 339 622 3 439 195 1 423 552
Jumlah 2011 2 969 218 2 699 073 1 777 298 2 152 267 3 051 656 2 601 641
Total 2010 2 791 634 1 254 780 2 674 388 1 339 367 2 273 809 1 178 644
2009 2 387 975 1 121 602 2 330 734 1 042 414 1 986 084 902 471
. b p s . g o . i d0
-
--
0 7
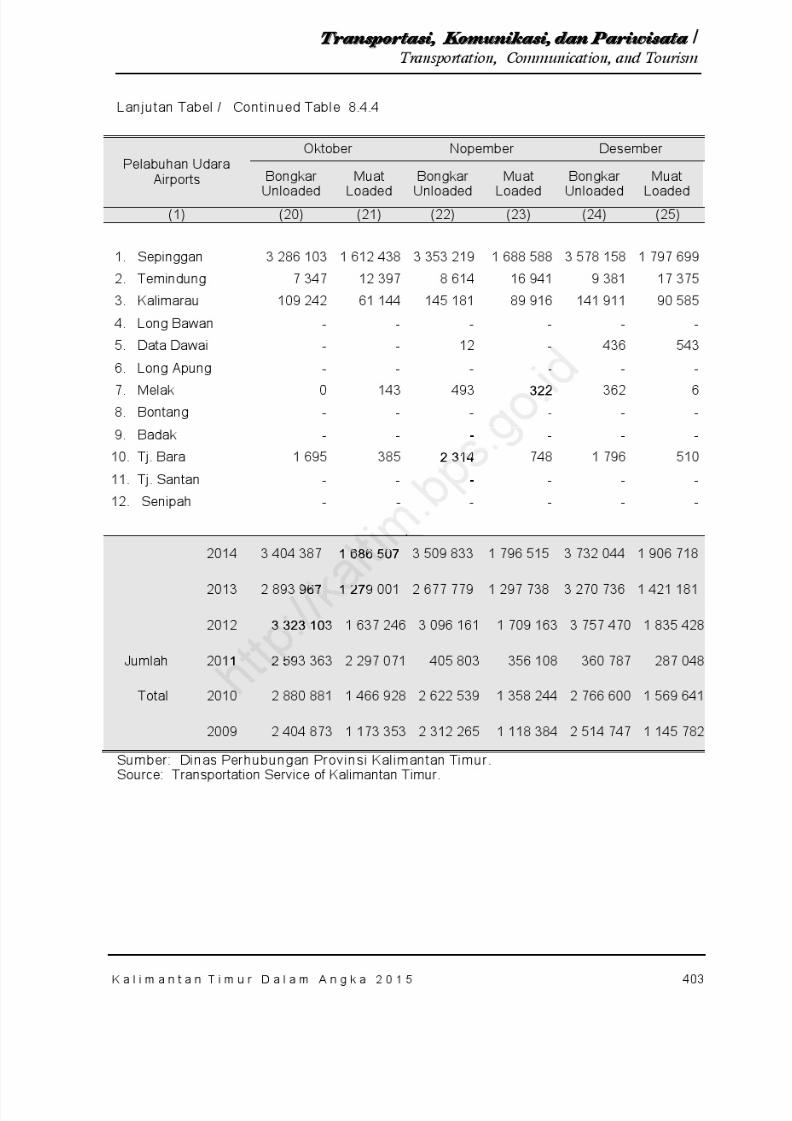
8/20/2019 Kalimantan Timur Dalam Angka Tahun 2015
http://slidepdf.com/reader/full/kalimantan-timur-dalam-angka-tahun-2015 469/623
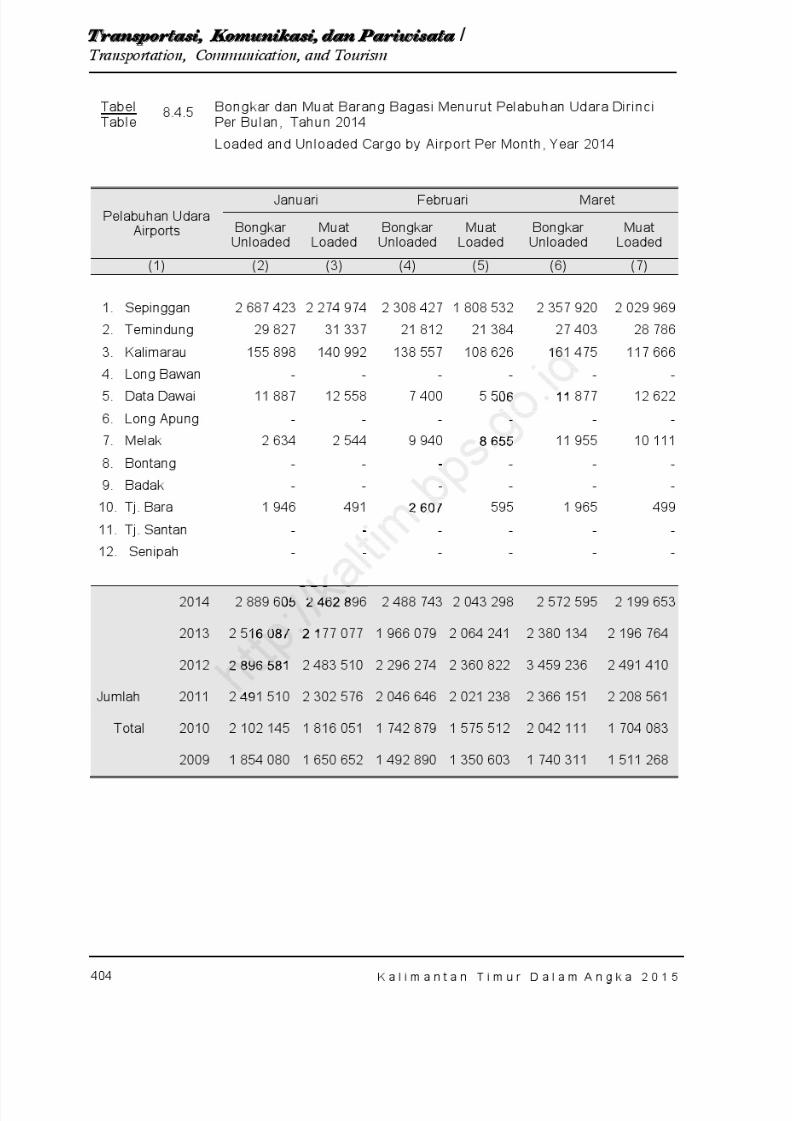
8/20/2019 Kalimantan Timur Dalam Angka Tahun 2015
http://slidepdf.com/reader/full/kalimantan-timur-dalam-angka-tahun-2015 470/623
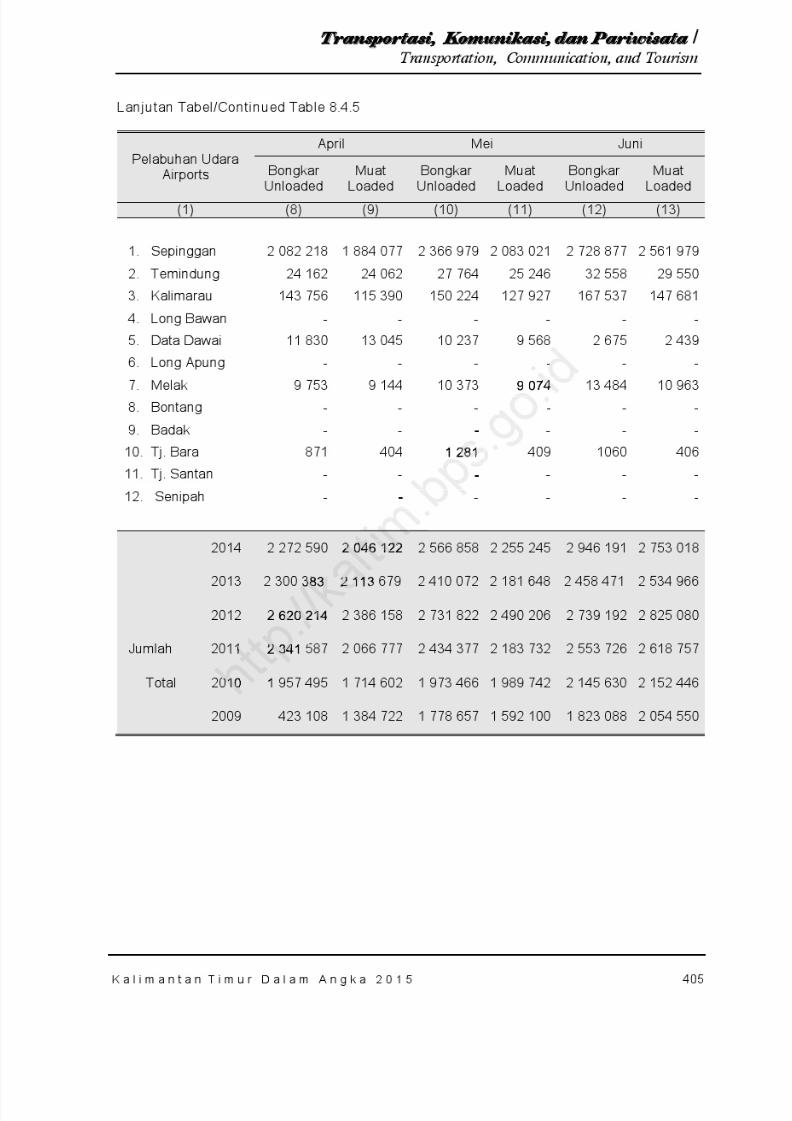
8/20/2019 Kalimantan Timur Dalam Angka Tahun 2015
http://slidepdf.com/reader/full/kalimantan-timur-dalam-angka-tahun-2015 471/623

8/20/2019 Kalimantan Timur Dalam Angka Tahun 2015
http://slidepdf.com/reader/full/kalimantan-timur-dalam-angka-tahun-2015 472/623
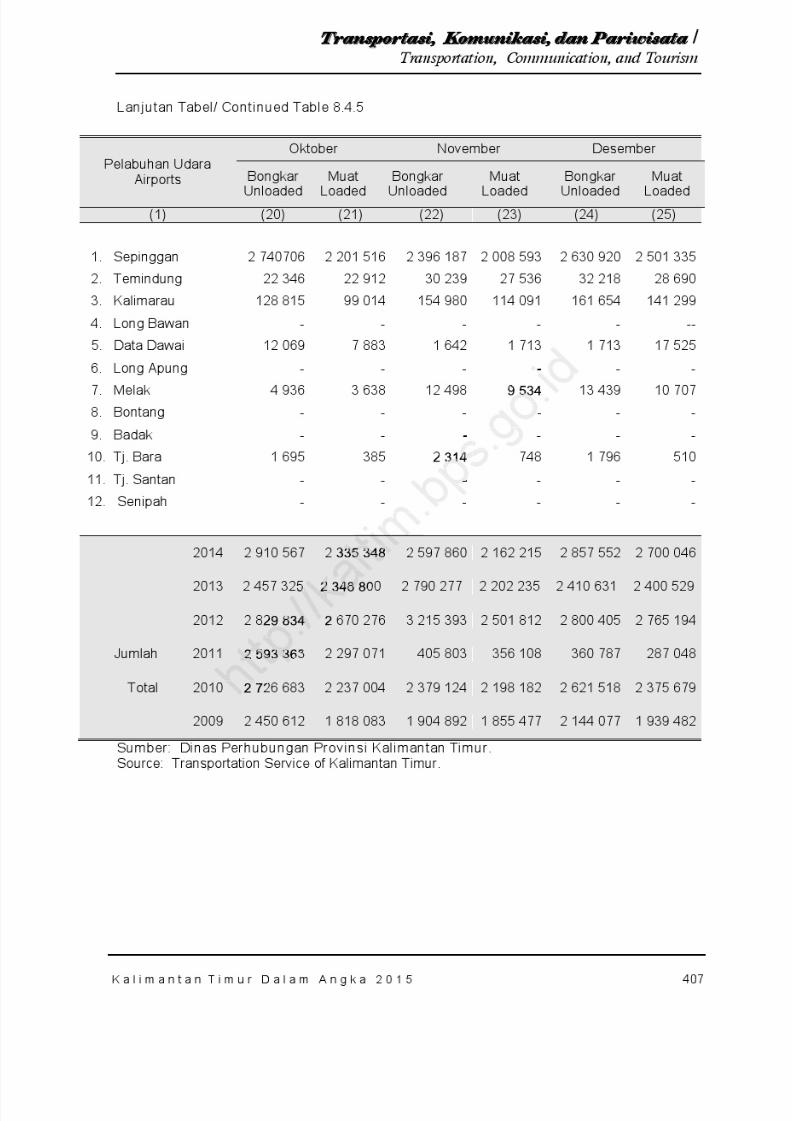
8/20/2019 Kalimantan Timur Dalam Angka Tahun 2015
http://slidepdf.com/reader/full/kalimantan-timur-dalam-angka-tahun-2015 473/623
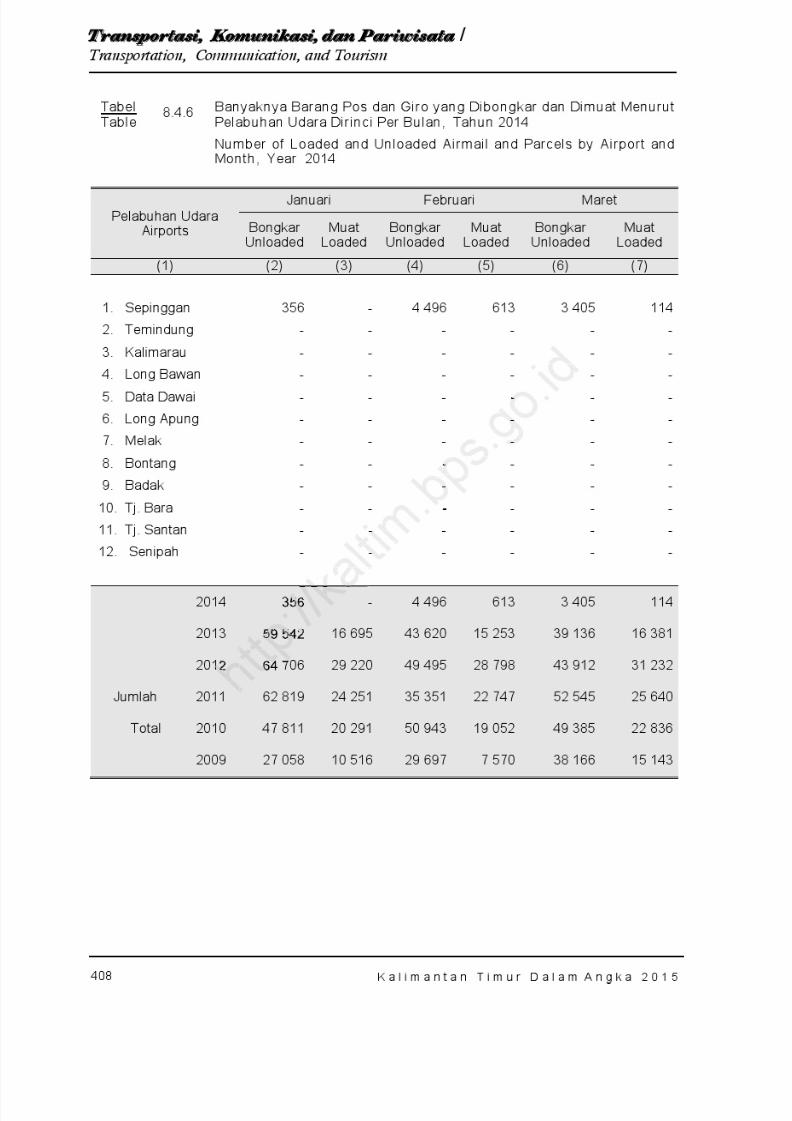
8/20/2019 Kalimantan Timur Dalam Angka Tahun 2015
http://slidepdf.com/reader/full/kalimantan-timur-dalam-angka-tahun-2015 474/623

8/20/2019 Kalimantan Timur Dalam Angka Tahun 2015
http://slidepdf.com/reader/full/kalimantan-timur-dalam-angka-tahun-2015 475/623
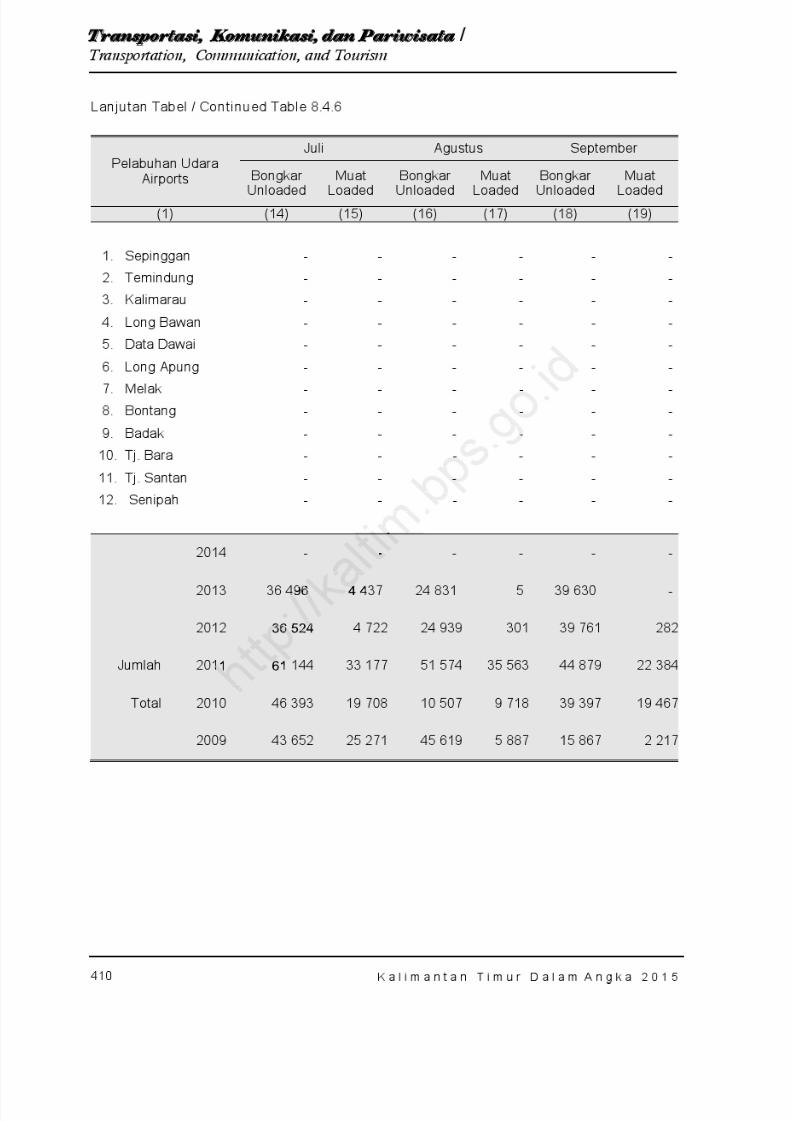
8/20/2019 Kalimantan Timur Dalam Angka Tahun 2015
http://slidepdf.com/reader/full/kalimantan-timur-dalam-angka-tahun-2015 476/623
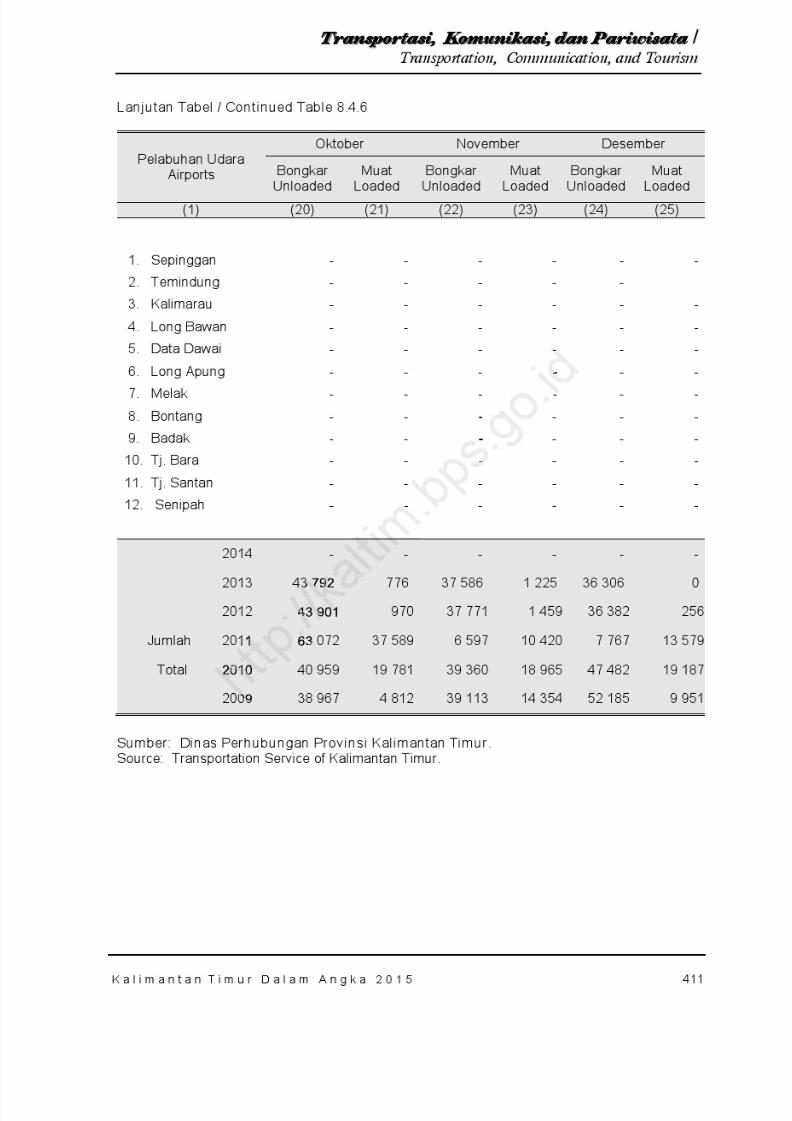
8/20/2019 Kalimantan Timur Dalam Angka Tahun 2015
http://slidepdf.com/reader/full/kalimantan-timur-dalam-angka-tahun-2015 477/623
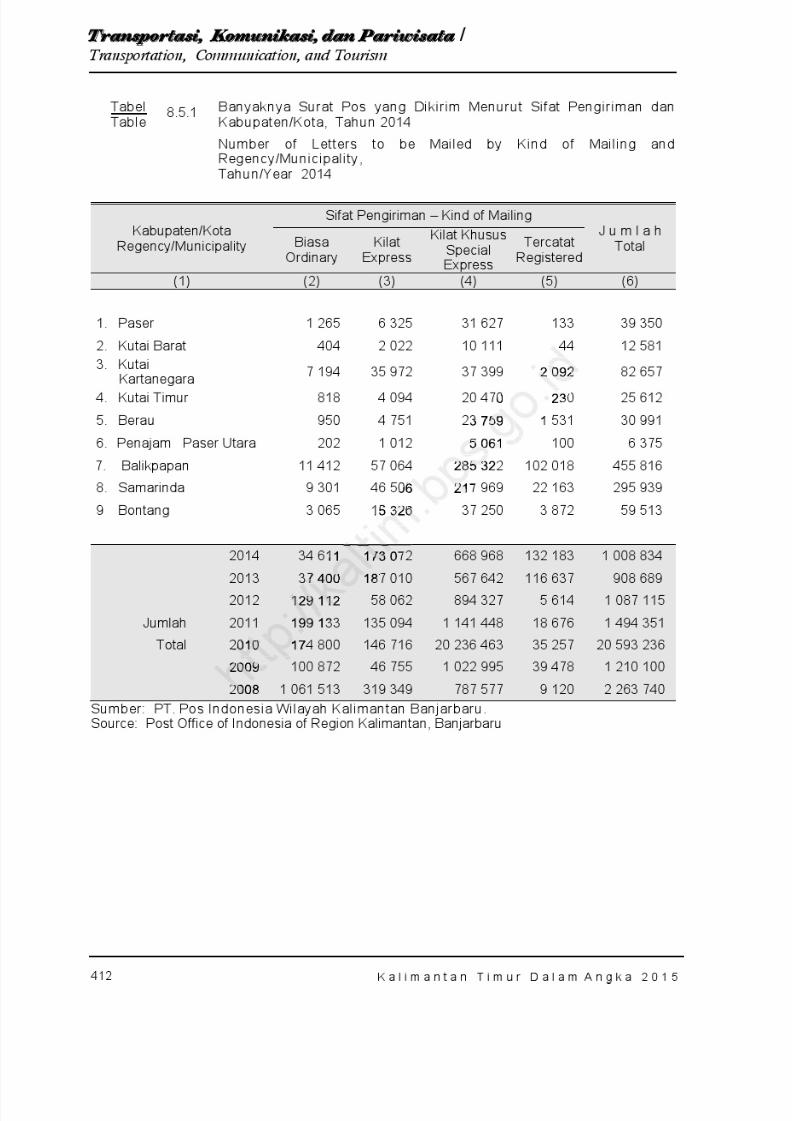
8/20/2019 Kalimantan Timur Dalam Angka Tahun 2015
http://slidepdf.com/reader/full/kalimantan-timur-dalam-angka-tahun-2015 478/623
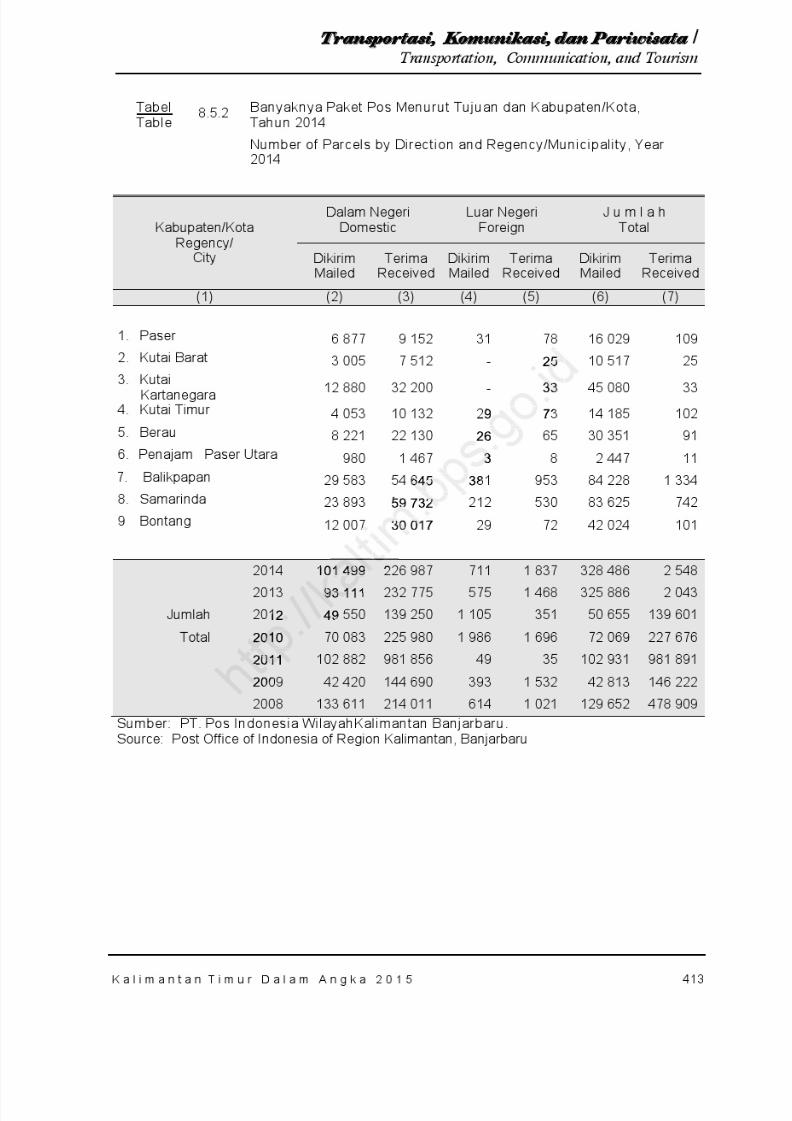
8/20/2019 Kalimantan Timur Dalam Angka Tahun 2015
http://slidepdf.com/reader/full/kalimantan-timur-dalam-angka-tahun-2015 479/623
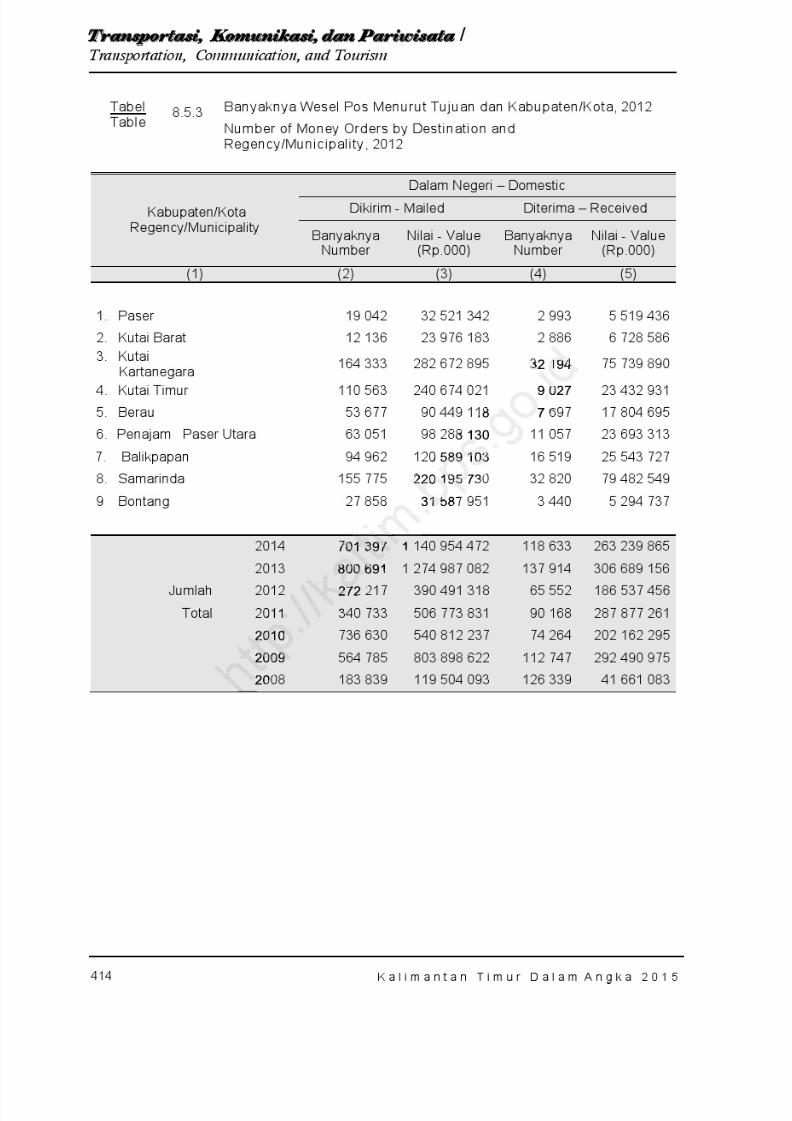
8/20/2019 Kalimantan Timur Dalam Angka Tahun 2015
http://slidepdf.com/reader/full/kalimantan-timur-dalam-angka-tahun-2015 480/623
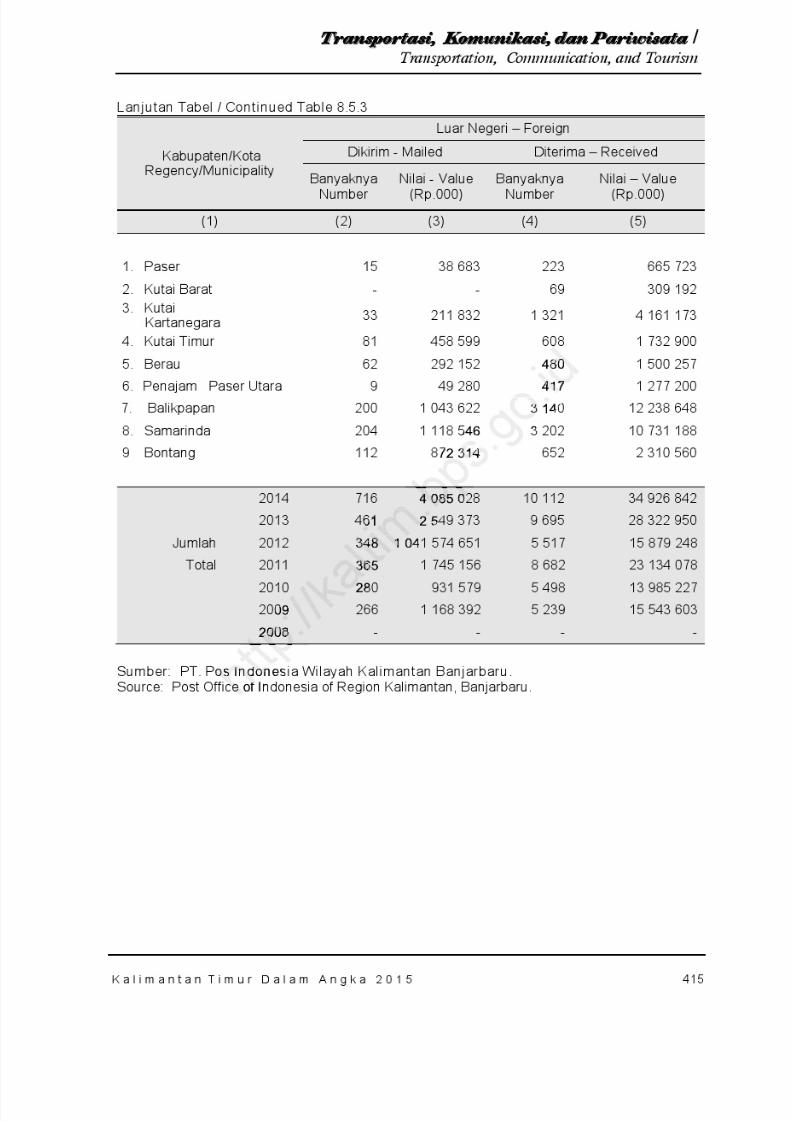
8/20/2019 Kalimantan Timur Dalam Angka Tahun 2015
http://slidepdf.com/reader/full/kalimantan-timur-dalam-angka-tahun-2015 481/623
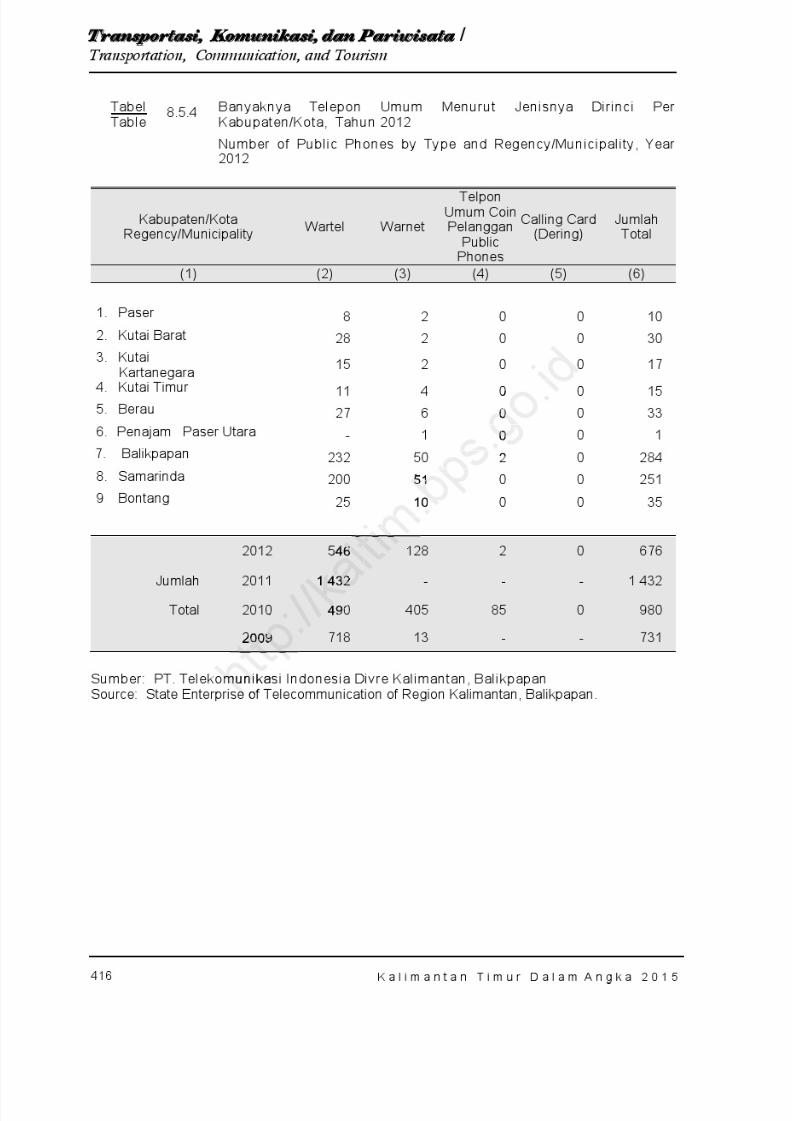
8/20/2019 Kalimantan Timur Dalam Angka Tahun 2015
http://slidepdf.com/reader/full/kalimantan-timur-dalam-angka-tahun-2015 482/623
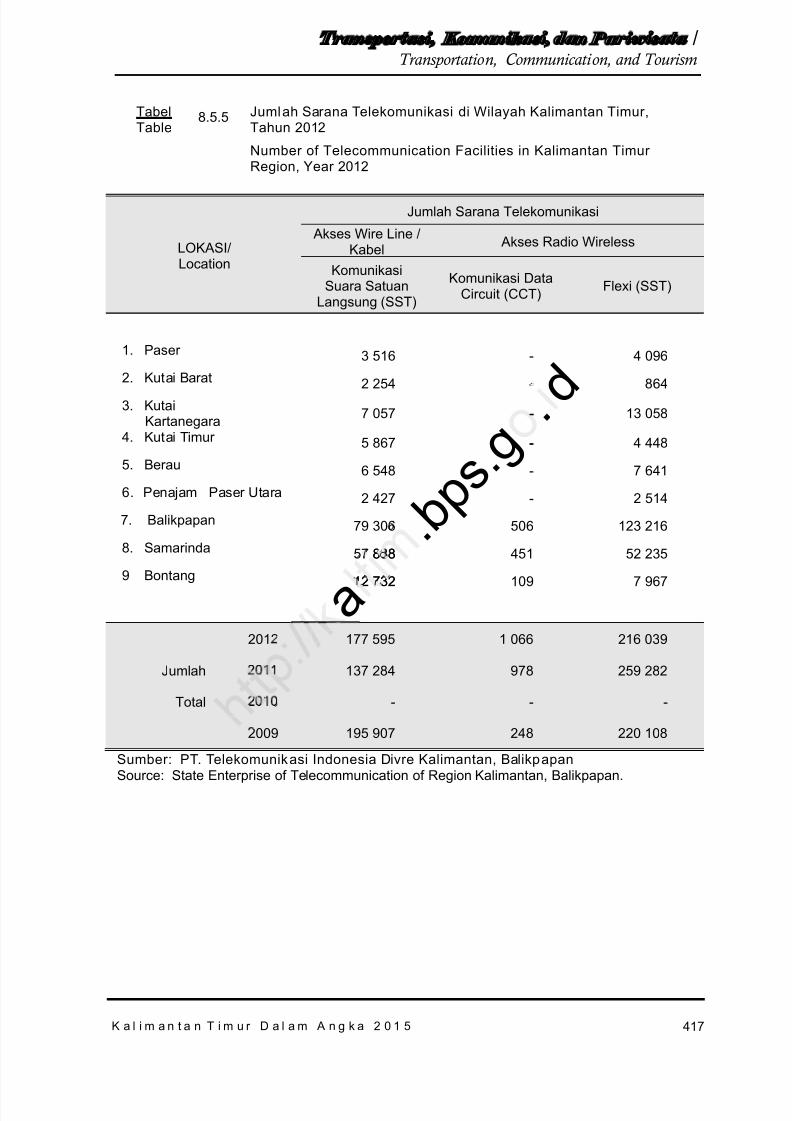
8/20/2019 Kalimantan Timur Dalam Angka Tahun 2015
http://slidepdf.com/reader/full/kalimantan-timur-dalam-angka-tahun-2015 483/623
417
T r a n s p o r t a s i , Ko m u n i k a s i , d a n Pa r i w i s a t a /Transportation, Communication, and Tourism
K a l i m a n t a n T i m u r D a l a m A n g k a 2 0 1 5
TabelTable
8.5.5 Jumlah Sarana Telekomunikasi di Wilayah Kalimantan Timur,Tahun 2012
Number of Telecommunication Facilities in Kalimantan TimurRegion, Year 2012
LOKASI/Location
Jumlah Sarana Telekomunikasi
Akses Wire Line /Kabel Akses Radio Wireless
KomunikasiSuara Satuan
Langsung (SST)
Komunikasi DataCircuit (CCT) Flexi (SST)
1. Paser 3 516 - 4 096
2. Kutai Barat 2 254 - 8643. Kutai
Kartanegara 7 057 - 13 058
4. Kutai Timur 5 867 - 4 4485. Berau 6 548 - 7 6416. Penajam Paser Utara 2 427 - 2 5147. Balikpapan 79 306 506 123 2168. Samarinda 57 888 451 52 235
9 Bontang 12 732 109 7 967
2012 177 595 1 066 216 039
Jumlah 2011 137 284 978 259 282
Total 2010 - - -
2009 195 907 248 220 108
Sumber: PT. Telekomunikasi Indonesia Divre Kalimantan, BalikpapanSource: State Enterprise of Telecommunication of Region Kalimantan, Balikpapan.
a . b p
s . g . d-
--
-
888
12 732
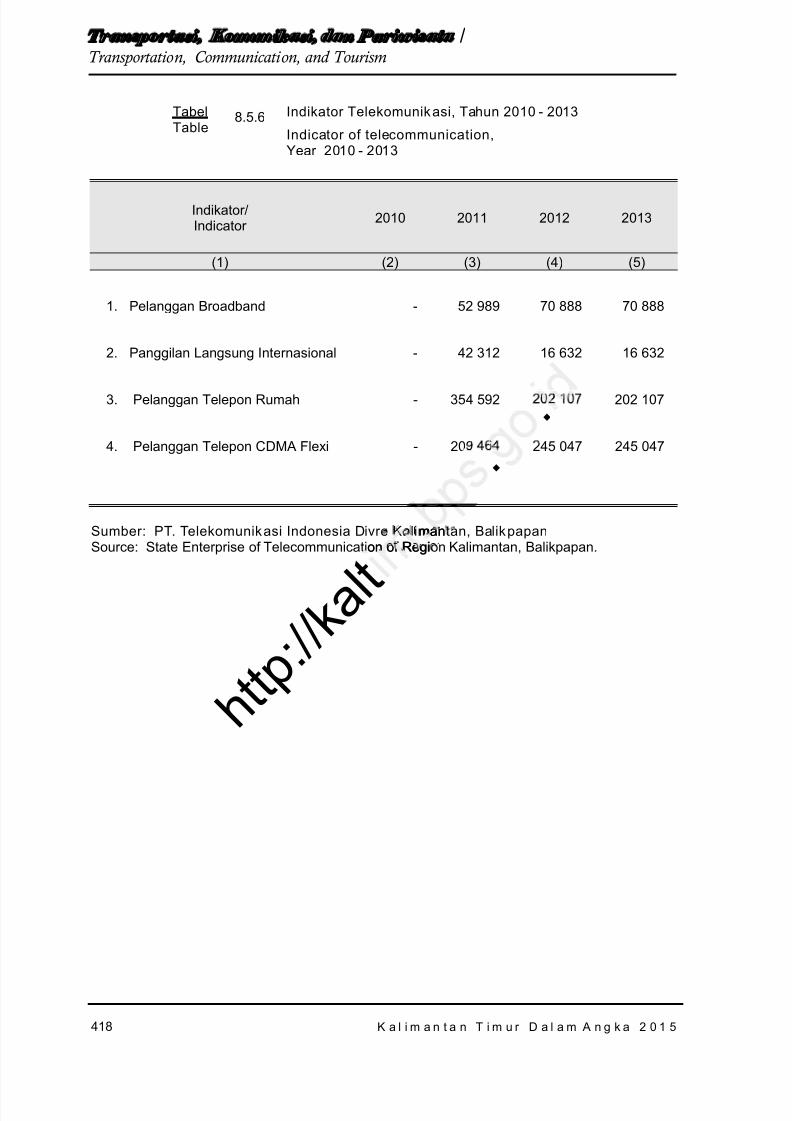
8/20/2019 Kalimantan Timur Dalam Angka Tahun 2015
http://slidepdf.com/reader/full/kalimantan-timur-dalam-angka-tahun-2015 484/623
418
T r a n s p o r t a s i , Ko m u n i k a s i , d a n Pa r i w i s a t a /Transportation, Communication, and Tourism
K a l i m a n t a n T i m u r D a l a m A n g k a 2 0 1 5
TabelTable
8.5.6 Indikator Telekomunik asi, Tahun 2010 - 2013
Indicator of telecommunication,Year 2010 - 2013
Indikator/Indicator 2010 2011 2012 2013
(1) (2) (3) (4) (5)
1. Pelanggan Broadband - 52 989 70 888 70 888
2. Panggilan Langsung Internasional - 42 312 16 632 16 632
3. Pelanggan Telepon Rumah - 354 592 202 107 202 107
4. Pelanggan Telepon CDMA Flexi - 209 464 245 047 245 047
Sumber: PT. Telekomunikasi Indonesia Divre Kalimantan, BalikpapanSource: State Enterprise of Telecommunication of Region Kalimantan, Balikpapan.
. .
h t t p : / / k a l t
a manon of Regi
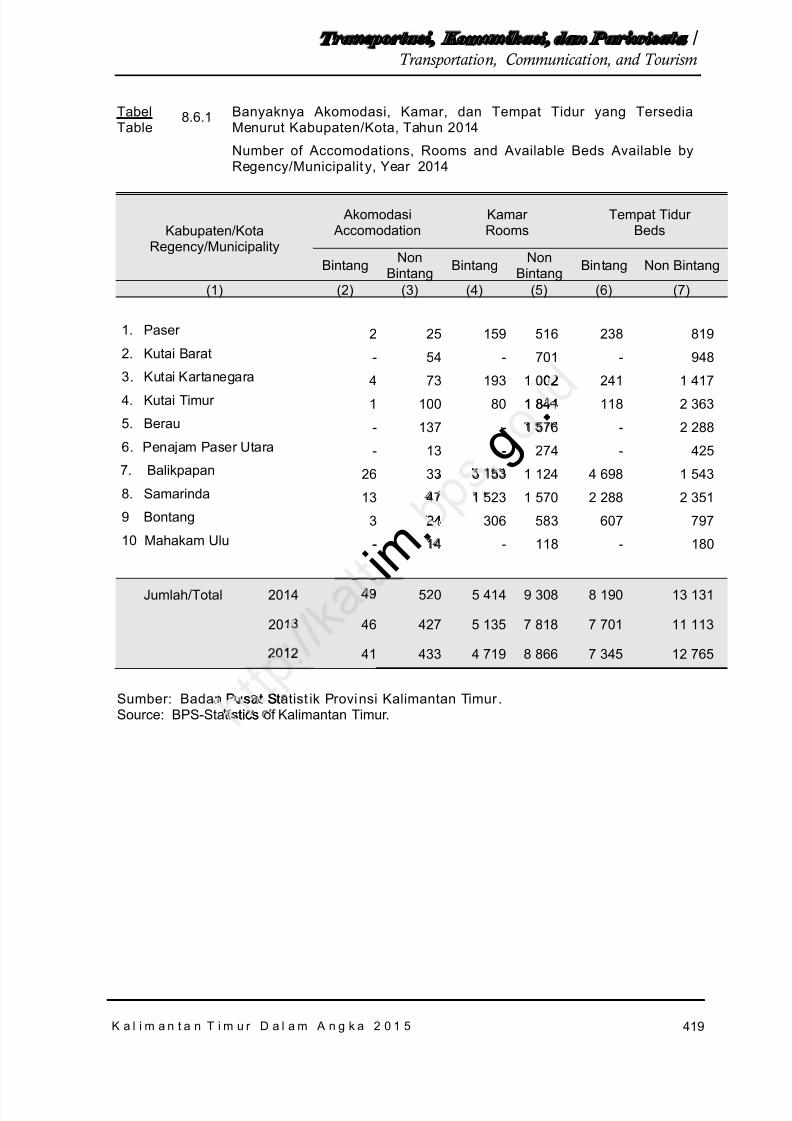
8/20/2019 Kalimantan Timur Dalam Angka Tahun 2015
http://slidepdf.com/reader/full/kalimantan-timur-dalam-angka-tahun-2015 485/623
419
T r a n s p o r t a s i , Ko m u n i k a s i , d a n Pa r i w i s a t a /Transportation, Communication, and Tourism
K a l i m a n t a n T i m u r D a l a m A n g k a 2 0 1 5
TabelTable
8.6.1 Banyaknya Akomodasi, Kamar, dan Tempat Tidur yang TersediaMenurut Kabupaten/Kota, Tahun 2014
Number of Accomodations, Rooms and Available Beds Available byRegency/Municipalit y, Year 2014
Kabupaten/KotaRegency/Municipality
Akomodasi Accomodation
Kamar Rooms
Tempat Tidur Beds
Bintang NonBintang Bintang Non
Bintang Bintang Non Bintang
(1) (2) (3) (4) (5) (6) (7)
1. Paser 2 25 159 516 238 8192. Kutai Barat - 54 - 701 - 948
3. Kutai Kartanegara 4 73 193 1 002 241 1 4174. Kutai Timur 1 100 80 1 844 118 2 3635. Berau - 137 - 1 576 - 2 2886. Penajam Paser Utara - 13 - 274 - 4257. Balikpapan 26 33 3 153 1 124 4 698 1 5438. Samarinda 13 47 1 523 1 570 2 288 2 3519 Bontang 3 24 306 583 607 79710 Mahakam Ulu - 14 - 118 - 180
Jumlah/ Total 2014 49 520 5 414 9 308 8 190 13 131
2013 46 427 5 135 7 818 7 701 11 113
2012 41 433 4 719 8 866 7 345 12 765
Sumber: Badan Pusat Statist ik Provinsi Kalimantan Timur .Source: BPS-Statistics of Kalimantan Timur.
i m .
g .02
1 844
-
-
24
-
Pusat Ststics
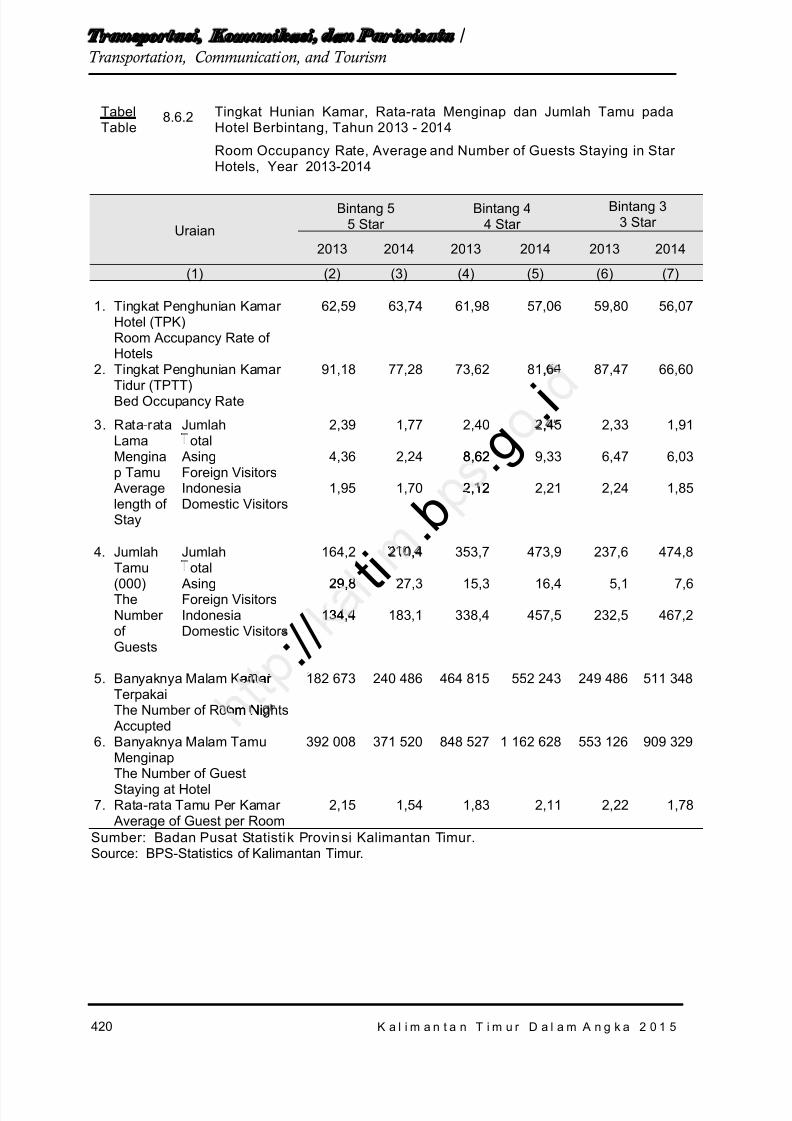
8/20/2019 Kalimantan Timur Dalam Angka Tahun 2015
http://slidepdf.com/reader/full/kalimantan-timur-dalam-angka-tahun-2015 486/623
420
T r a n s p o r t a s i , Ko m u n i k a s i , d a n Pa r i w i s a t a /Transportation, Communication, and Tourism
K a l i m a n t a n T i m u r D a l a m A n g k a 2 0 1 5
TabelTable
8.6.2 Tingkat Hunian Kamar, Rata-rata Menginap dan Jumlah Tamu padaHotel Berbintang, Tahun 2013 - 2014
Room Occupancy Rate, Average and Number of Guests Staying in StarHotels, Year 2013-2014
Uraian
Bintang 55 Star
Bintang 44 Star
Bintang 33 Star
2013 2014 2013 2014 2013 2014
(1) (2) (3) (4) (5) (6) (7)
1. Tingkat Penghunian KamarHotel (TPK)Room Accupancy Rate ofHotels
62,59 63,74 61,98 57,06 59,80 56,07
2. Tingkat Penghunian KamarTidur (TPTT)Bed Occupancy Rate
91,18 77,28 73,62 81,64 87,47 66,60
3. Rata-rataLamaMenginap Tamu
Averagelength ofStay
Jumlahotal
2,39 1,77 2,40 2,45 2,33 1,91
AsingForeign Visitors
4,36 2,24 8,62 9,33 6,47 6,03
IndonesiaDomestic Visitors
1,95 1,70 2,12 2,21 2,24 1,85
4. JumlahTamu(000)TheNumberofGuests
Jumlahotal
164,2 210,4 353,7 473,9 237,6 474,8
AsingForeign Visitors
29,8 27,3 15,3 16,4 5,1 7,6
IndonesiaDomestic Visitors
134,4 183,1 338,4 457,5 232,5 467,2
5. Banyaknya Malam KamarTerpakaiThe Number of Room Nights
Accupted
182 673 240 486 464 815 552 243 249 486 511 348
6. Banyaknya Malam TamuMenginapThe Number of GuestStaying at Hotel
392 008 371 520 848 527 1 162 628 553 126 909 329
7. Rata-rata Tamu Per Kamar Average of Guest per Room
2,15 1,54 1,83 2,11 2,22 1,78
Sumber: Badan Pusat Statistik Provinsi Kalimantan Timur.Source: BPS-Statistics of Kalimantan Timur.
: / / t i
. b . g
. i,
,
8,62,
2,12
,
9,8,
134,41
amar
om Ni
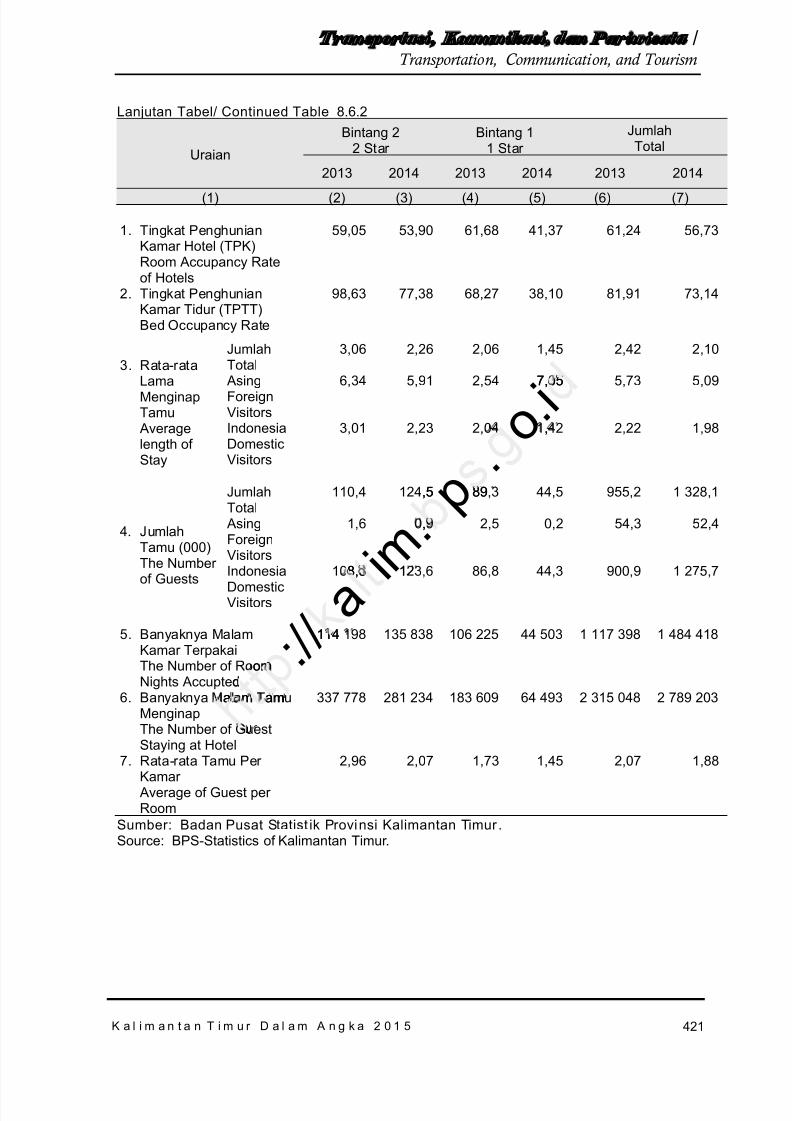
8/20/2019 Kalimantan Timur Dalam Angka Tahun 2015
http://slidepdf.com/reader/full/kalimantan-timur-dalam-angka-tahun-2015 487/623
421
T r a n s p o r t a s i , Ko m u n i k a s i , d a n Pa r i w i s a t a /Transportation, Communication, and Tourism
K a l i m a n t a n T i m u r D a l a m A n g k a 2 0 1 5
Lanjutan Tabel/ Continued Table 8.6.2
Uraian
Bintang 22 Star
Bintang 11 Star
JumlahTotal
2013 2014 2013 2014 2013 2014
(1) (2) (3) (4) (5) (6) (7)
1. Tingkat PenghunianKamar Hotel (TPK)Room Accupancy Rateof Hotels
59,05 53,90 61,68 41,37 61,24 56,73
2. Tingkat PenghunianKamar Tidur (TPTT)Bed Occupancy Rate
98,63 77,38 68,27 38,10 81,91 73,14
3. Rata-rata
LamaMenginapTamu
Averagelength ofStay
JumlahTotal
3,06 2,26 2,06 1,45 2,42 2,10
AsingForeignVisitors
6,34 5,91 2,54 7,05 5,73 5,09
IndonesiaDomesticVisitors
3,01 2,23 2,04 1,42 2,22 1,98
4. JumlahTamu (000)The Numberof Guests
JumlahTotal
110,4 124,5 89,3 44,5 955,2 1 328,1
AsingForeignVisitors
1,6 0,9 2,5 0,2 54,3 52,4
IndonesiaDomesticVisitors
108,8 123,6 86,8 44,3 900,9 1 275,7
5. Banyaknya MalamKamar TerpakaiThe Number of RoomNights Accupted
114 198 135 838 106 225 44 503 1 117 398 1 484 418
6. Banyaknya Malam TamuMenginapThe Number of GuestStaying at Hotel
337 778 281 234 183 609 64 493 2 315 048 2 789 203
7. Rata-rata Tamu PerKamar Average of Guest perRoom
2,96 2,07 1,73 1,45 2,07 1,88
Sumber: Badan Pusat Statist ik Provinsi Kalimantan Timur .Source: BPS-Statistics of Kalimantan Timur.
: / / a i m
. p . o
. i7,05
,
,5 89
,
8,8 1
omd
114
a am am

8/20/2019 Kalimantan Timur Dalam Angka Tahun 2015
http://slidepdf.com/reader/full/kalimantan-timur-dalam-angka-tahun-2015 488/623
422
T r a n s p o r t a s i , Ko m u n i k a s i , d a n Pa r i w i s a t a /Transportation, Communication, and Tourism
K a l i m a n t a n T i m u r D a l a m A n g k a 2 0 1 5
TabelTable
8.6.3 Tingkat Hunian Kamar, Rata-rata Menginap dan Jumlah Tamu padaBukan Hotel Berbintang, Tahun 2012 - 2014
Room Occupancy Rate, Average and Number of Guests Staying i nNon-Star Hotels, Year 2012-2014
Uraian< 10 10 – 24
2012 2013 2014 2012 2013 2014
(1) (1) (2) (3) (4) (5) (6)
1. Tingkat Penghunian KamarHotel (TPK)Room Accupancy Rate ofHotels
41,81 75,52 29,74 53,32 48,44 43,85
2. Tingkat Penghunian KamarTidur (TPTT)Bed Occupancy Rate
46,37 45,70 23,03 72,06 72,02 50,13
3. Rata-rataLamaMenginapTamu
Averagelength ofStay
JumlahTotal
5,37 6,39 2,56 3,27 3,00 1,98
AsingForeignVisitors
- - 5,51 5,06 4,26 4,27
IndonesiaDomesticVisitors
5,37 6,39 2,53 3,26 2,98 1,98
4. JumlahTamuThe Numberof Guests
JumlahTotal
50 188 5 815 32 273 548 125 237 104 515 626
AsingForeignVisitors
- - 374 3 308 2 580 731
IndonesiaDomesticVisitors
50 188 5 815 31 899 544 867 234 524 514 895
5. Banyaknya Malam KamarTerpakaiThe Number of RoomNights Accupted
134 647 32 796 907 257 413 431 -
6. Banyaknya Malam TamuMenginapThe Number of GuestStaying at Hotel
269 308 37 135 1 791 606 710 903 -
7. Rata-rata Tamu Per Kamar Average of Guest per Room 2,00 1,13 1,97 1,72 -
: / / k t i m . p
. . i, 6
, 6 3,
,
6,39
-
esiaestic
isitors
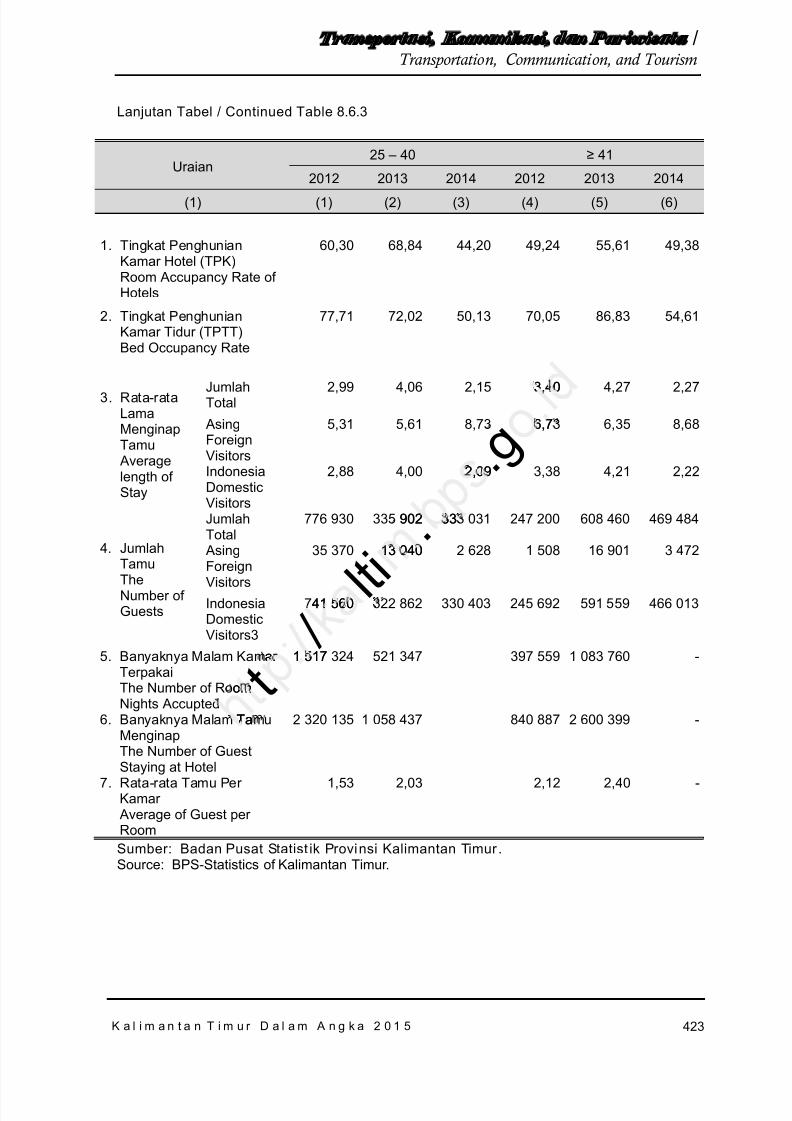
8/20/2019 Kalimantan Timur Dalam Angka Tahun 2015
http://slidepdf.com/reader/full/kalimantan-timur-dalam-angka-tahun-2015 489/623
423
T r a n s p o r t a s i , Ko m u n i k a s i , d a n Pa r i w i s a t a /Transportation, Communication, and Tourism
K a l i m a n t a n T i m u r D a l a m A n g k a 2 0 1 5
Lanjutan Tabel / Continued Table 8.6.3
Uraian25 – 40 ≥ 41
2012 2013 2014 2012 2013 2014
(1) (1) (2) (3) (4) (5) (6)
1. Tingkat PenghunianKamar Hotel (TPK)Room Accupancy Rate ofHotels
60,30 68,84 44,20 49,24 55,61 49,38
2. Tingkat PenghunianKamar Tidur (TPTT)Bed Occupancy Rate
77,71 72,02 50,13 70,05 86,83 54,61
3. Rata-rataLamaMenginapTamu
Averagelength ofStay
JumlahTotal
2,99 4,06 2,15 3,40 4,27 2,27
AsingForeignVisitors
5,31 5,61 8,73 6,73 6,35 8,68
IndonesiaDomesticVisitors
2,88 4,00 2,09 3,38 4,21 2,22
4. JumlahTamuTheNumber ofGuests
JumlahTotal
776 930 335 902 333 031 247 200 608 460 469 484
AsingForeignVisitors
35 370 13 040 2 628 1 508 16 901 3 472
IndonesiaDomesticVisitors3
741 560 322 862 330 403 245 692 591 559 466 013
5. Banyaknya Malam KamarTerpakaiThe Number of RoomNights Accupted
1 517 324 521 347 397 559 1 083 760 -
6. Banyaknya Malam TamuMenginapThe Number of Guest
Staying at Hotel
2 320 135 1 058 437 840 887 2 600 399 -
7. Rata-rata Tamu PerKamar
Average of Guest perRoom
1,53 2,03 2,12 2,40 -
Sumber: Badan Pusat Statist ik Provinsi Kalimantan Timur .Source: BPS-Statistics of Kalimantan Timur.
t / l t i
. . g
3,40
6,7
2,09,
902 33
13 0401
41 560
ar
om
1 517
Ta
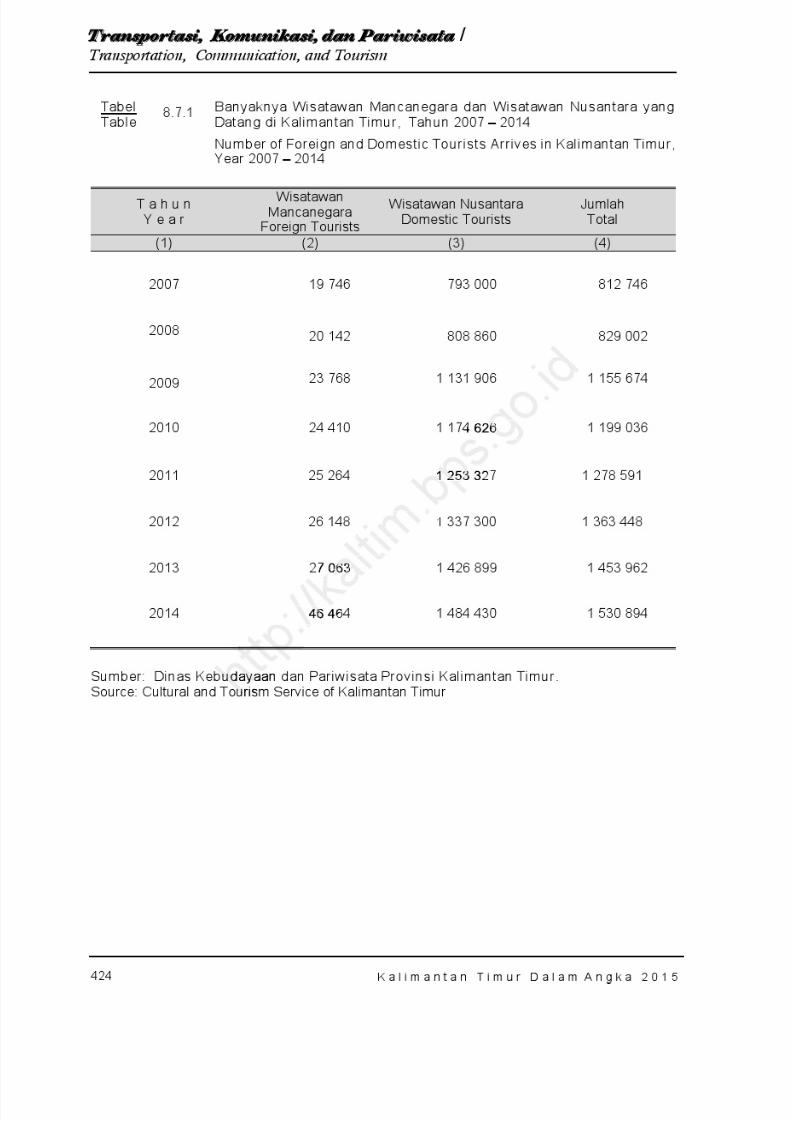
8/20/2019 Kalimantan Timur Dalam Angka Tahun 2015
http://slidepdf.com/reader/full/kalimantan-timur-dalam-angka-tahun-2015 490/623
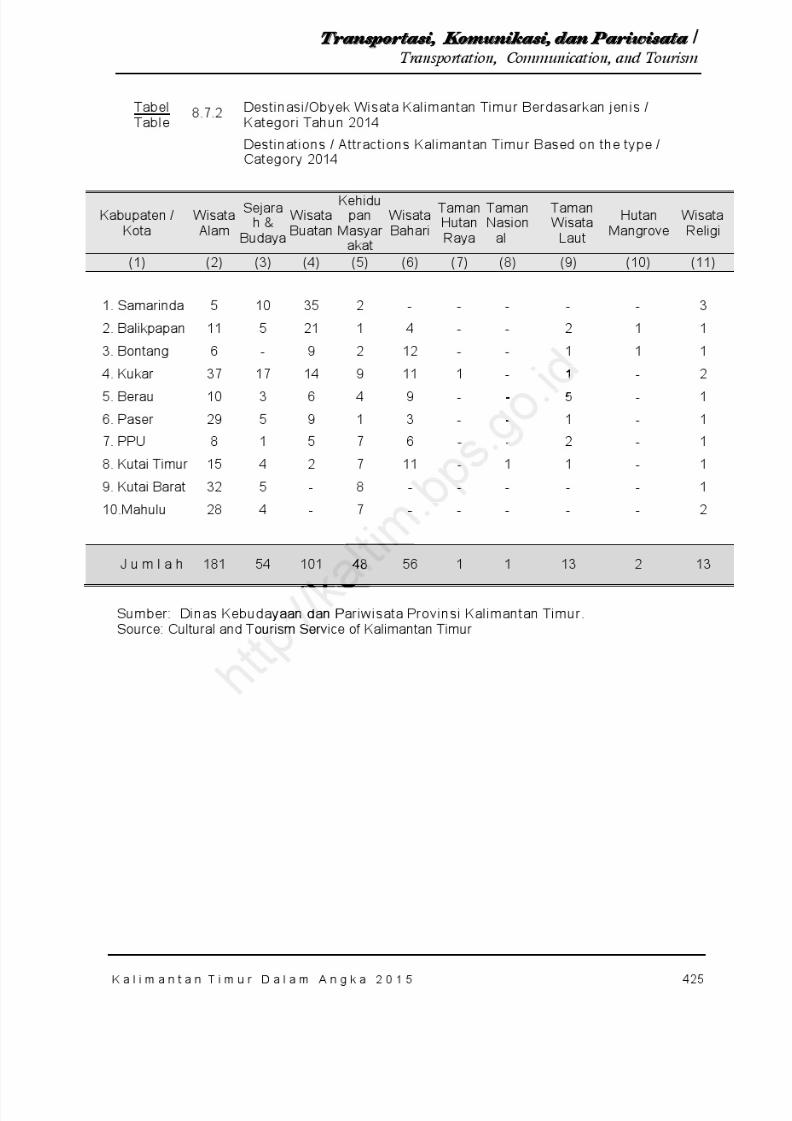
8/20/2019 Kalimantan Timur Dalam Angka Tahun 2015
http://slidepdf.com/reader/full/kalimantan-timur-dalam-angka-tahun-2015 491/623
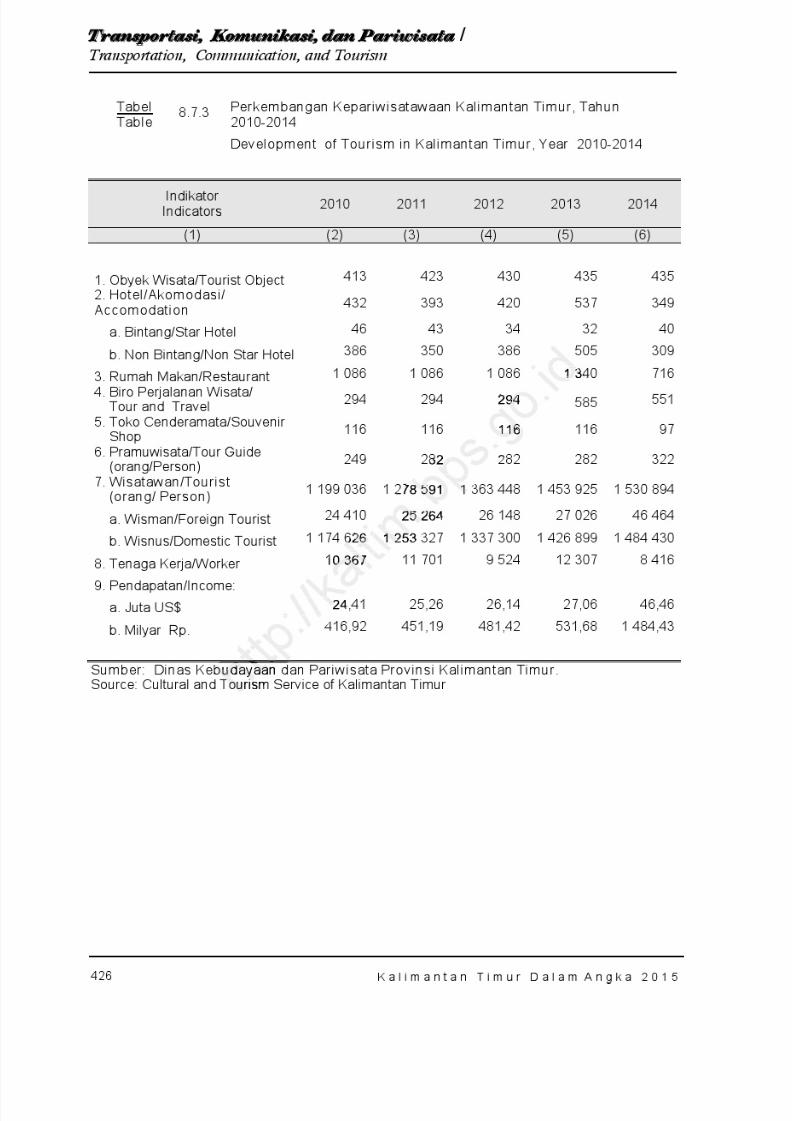
8/20/2019 Kalimantan Timur Dalam Angka Tahun 2015
http://slidepdf.com/reader/full/kalimantan-timur-dalam-angka-tahun-2015 492/623
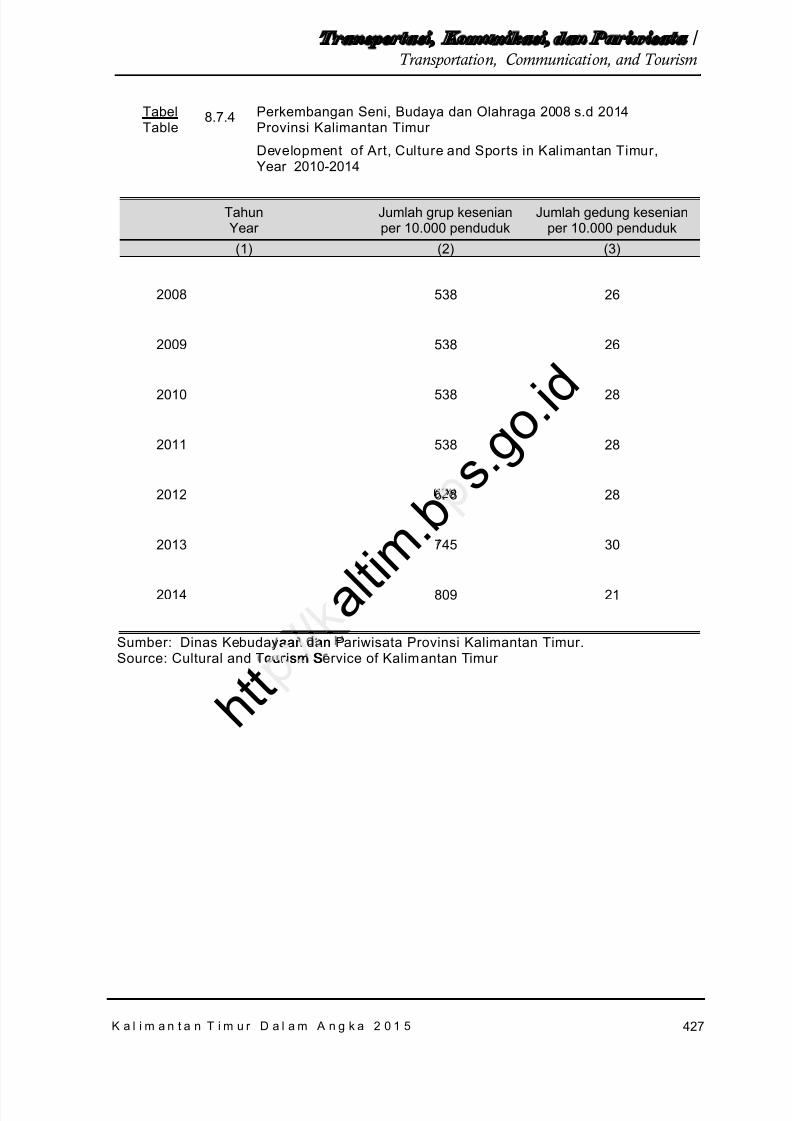
8/20/2019 Kalimantan Timur Dalam Angka Tahun 2015
http://slidepdf.com/reader/full/kalimantan-timur-dalam-angka-tahun-2015 493/623
427
T r a n s p o r t a s i , Ko m u n i k a s i , d a n Pa r i w i s a t a /Transportation, Communication, and Tourism
K a l i m a n t a n T i m u r D a l a m A n g k a 2 0 1 5
TabelTable
8.7.4 Perkembangan Seni, Budaya dan Olahraga 2008 s.d 2014Provinsi Kalimantan Timur
Development of Art, Culture and Sports in Kalimantan Timur,Year 2010-2014
TahunYear
Jumlah grup kesenianper 10.000 penduduk
Jumlah gedung kesenianper 10.000 penduduk
(1) (2) (3)
2008 538 26
2009 538 26
2010 538 28
2011 538 28
2012 628 28
2013 745 30
2014 809 21
Sumber: Dinas Kebudayaan dan Pariwisata Provinsi Kalimantan Timur.Source: Cultural and Tourism Service of Kalimantan Timur
a l t i m . b
s . g o . i d
aan an
h t t ourism S
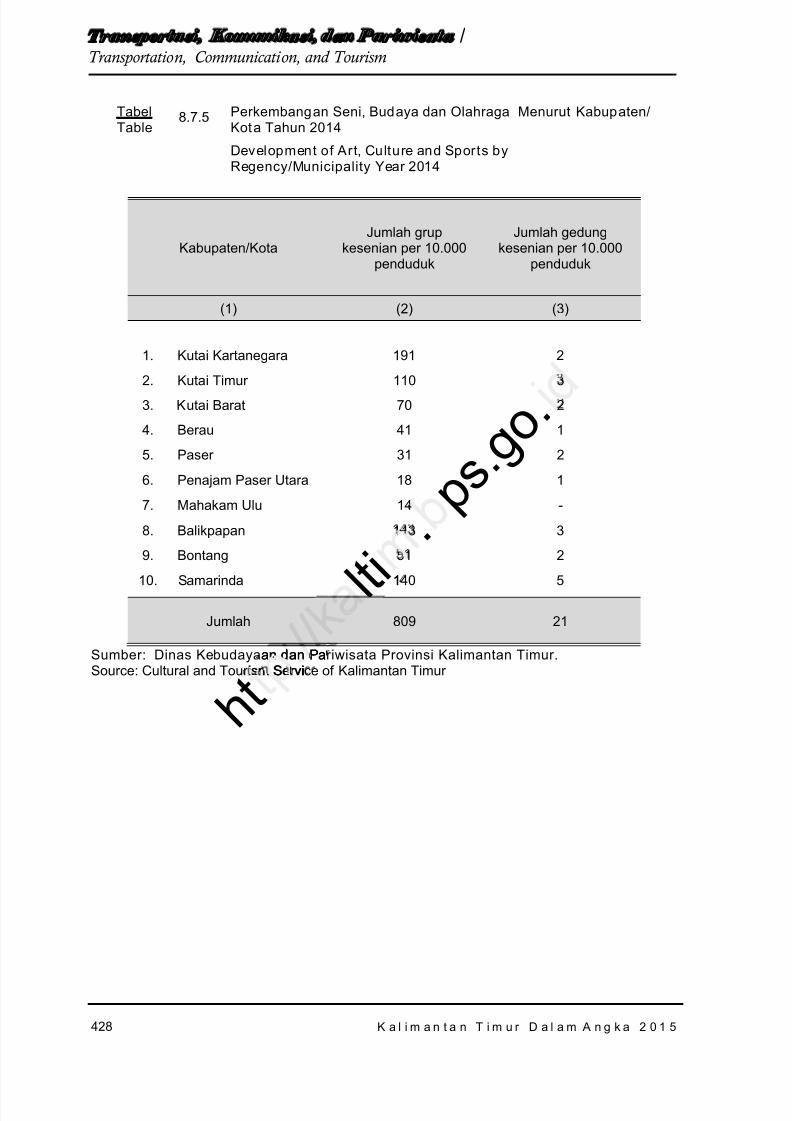
8/20/2019 Kalimantan Timur Dalam Angka Tahun 2015
http://slidepdf.com/reader/full/kalimantan-timur-dalam-angka-tahun-2015 494/623
428
T r a n s p o r t a s i , Ko m u n i k a s i , d a n Pa r i w i s a t a /Transportation, Communication, and Tourism
K a l i m a n t a n T i m u r D a l a m A n g k a 2 0 1 5
TabelTable
8.7.5 Perkembangan Seni, Budaya dan Olahraga Menurut Kabupaten/Kota Tahun 2014
Development of Art, Culture and Sports byRegency/Municipality Year 2014
Kabupaten/KotaJumlah grup
kesenian per 10.000penduduk
Jumlah gedungkesenian per 10.000
penduduk
(1) (2) (3)
1. Kutai Kartanegara 191 2
2. Kutai Timur 110 33. Kutai Barat 70 2
4. Berau 41 1
5. Paser 31 2
6. Penajam Paser Utara 18 1
7. Mahakam Ulu 14 -
8. Balikpapan 143 3
9. Bontang 51 2
10. Samarinda 140 5
Jumlah 809 21
Sumber: Dinas Kebudayaan dan Pariwisata Provinsi Kalimantan Timur.Source: Cultural and Tourism Service of Kalimantan Timur
l t i . p
s . g o .
1
an dan Pa
h t ism Servi
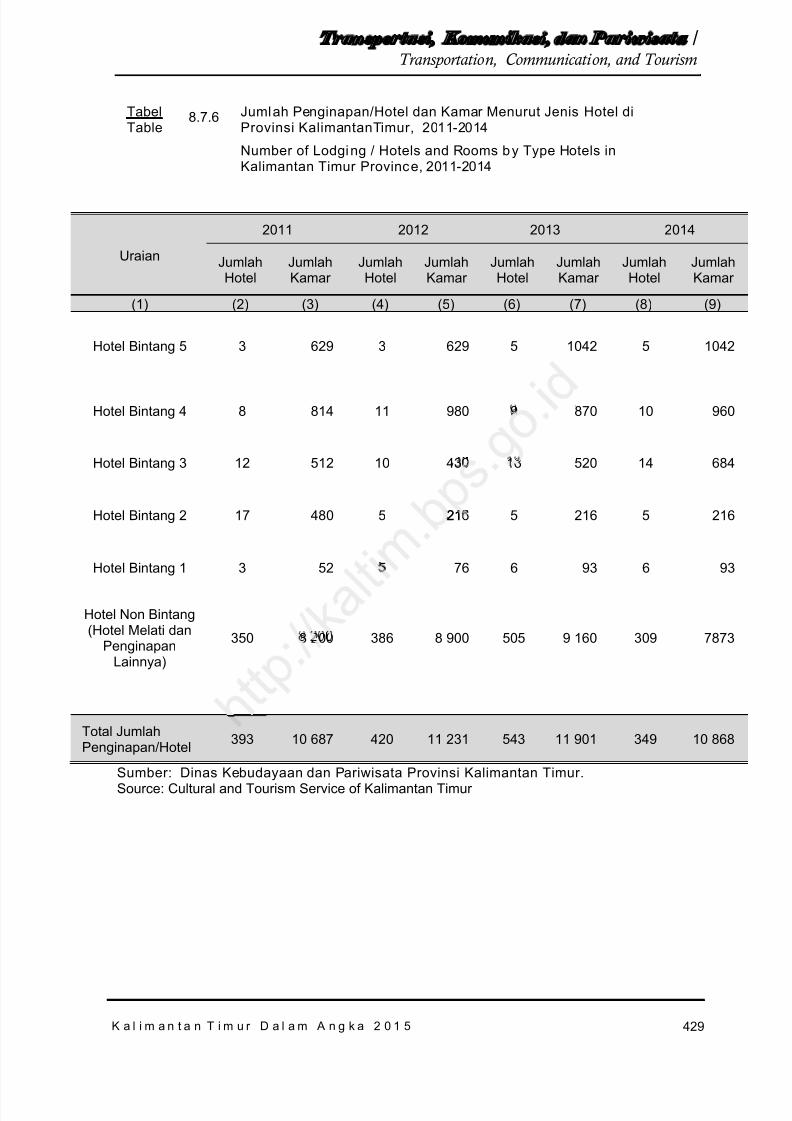
8/20/2019 Kalimantan Timur Dalam Angka Tahun 2015
http://slidepdf.com/reader/full/kalimantan-timur-dalam-angka-tahun-2015 495/623
429
T r a n s p o r t a s i , Ko m u n i k a s i , d a n Pa r i w i s a t a /Transportation, Communication, and Tourism
K a l i m a n t a n T i m u r D a l a m A n g k a 2 0 1 5
TabelTable
8.7.6 Jumlah Penginapan/Hotel dan Kamar Menurut Jenis Hotel diProvinsi KalimantanTimur, 2011-2014
Number of Lodging / Hotels and Rooms by Type Hotels inKalimantan Timur Province, 2011-2014
Uraian
2011 2012 2013 2014
JumlahHotel
JumlahKamar
JumlahHotel
JumlahKamar
JumlahHotel
JumlahKamar
JumlahHotel
JumlahKamar
(1) (2) (3) (4) (5) (6) (7) (8) (9)
Hotel Bintang 5 3 629 3 629 5 1042 5 1042
Hotel Bintang 4 8 814 11 980 9 870 10 960
Hotel Bintang 3 12 512 10 430 13 520 14 684
Hotel Bintang 2 17 480 5 216 5 216 5 216
Hotel Bintang 1 3 52 5 76 6 93 6 93
Hotel Non Bintang(Hotel Melati dan
PenginapanLainnya)
350 8 200 386 8 900 505 9 160 309 7873
Total JumlahPenginapan/Hotel 393 10 687 420 11 231 543 11 901 349 10 868
Sumber: Dinas Kebudayaan dan Pariwisata Provinsi Kalimantan Timur.Source: Cultural and Tourism Service of Kalimantan Timur
21
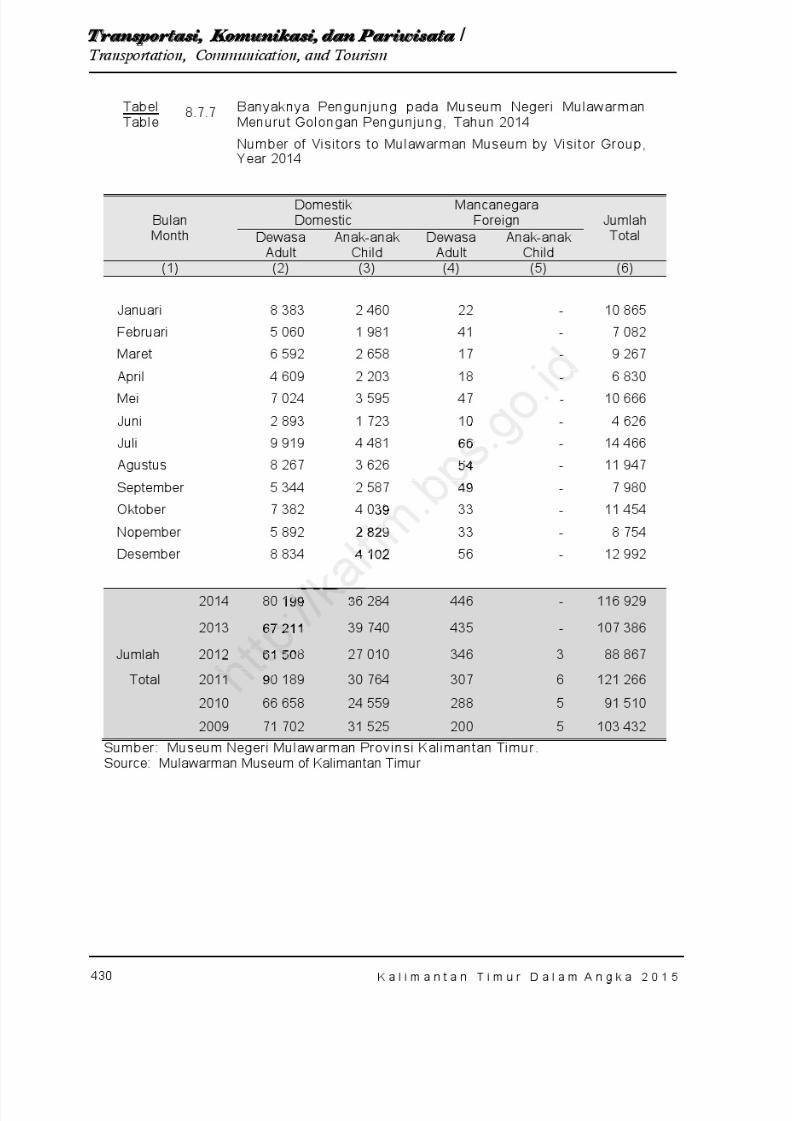
8/20/2019 Kalimantan Timur Dalam Angka Tahun 2015
http://slidepdf.com/reader/full/kalimantan-timur-dalam-angka-tahun-2015 496/623
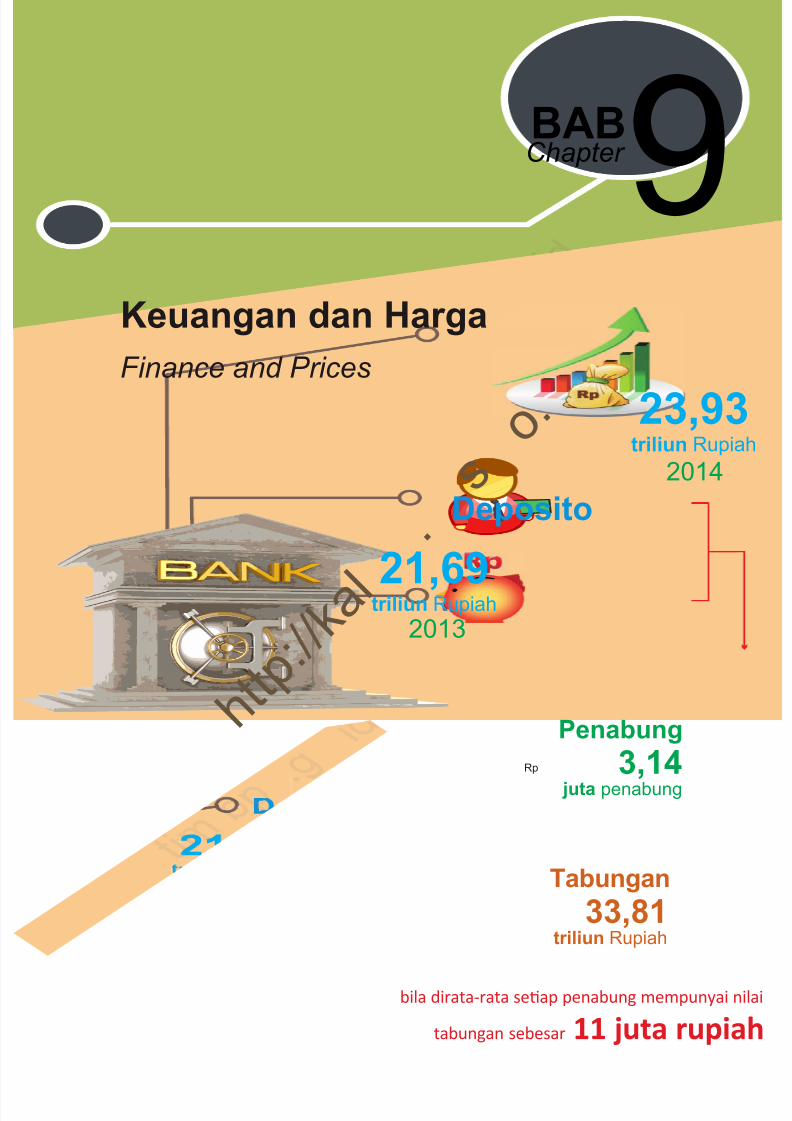
8/20/2019 Kalimantan Timur Dalam Angka Tahun 2015
http://slidepdf.com/reader/full/kalimantan-timur-dalam-angka-tahun-2015 497/623
9Keuangan dan Harga
BABChapter
Finance and Prices
Rp
Deposito
21,69triliun Rupiah
23,93triliun Rupiah
2013
2014
Penabung
3,14 juta penabung
Tabungan33,81
triliun Rupiah
bila dirata-rata se ap penabung mempunyai nilai
tabungan sebesar 11 juta rupiah
h t t p : / / k a l
. s
o .

8/20/2019 Kalimantan Timur Dalam Angka Tahun 2015
http://slidepdf.com/reader/full/kalimantan-timur-dalam-angka-tahun-2015 498/623
h t t p : / / k a l t i m
. b p s . g o . i d
8/20/2019 Kalimantan Timur Dalam Angka Tahun 2015
http://slidepdf.com/reader/full/kalimantan-timur-dalam-angka-tahun-2015 499/623
433
Ke u a n g a n d a n Ha r ga -Ha r ga / Finance and Prices
K a l i m a n t a n T i m u r D a l a m A n g k a 2 0 1 5
9.1 . KEUANGAN
Pada tahun anggaran 2014bagian terbesar pendapatan aslidaerah provinsi bersumber daripajak daerah ( local tax ) sebesar 5,43trilyun rupiah atau mencapai 81,48persen dari total PAD yangberjumlah sekitar 6,66 trilyunrupiah. Sumbangan retribusi daerahterhadap PAD sangat kecil dan tidakmencapai satu persen sementaraLaba perusahaan daerahmenyumbang PAD sebesar 4,65persen dan penerimaan lain-lainsebesar 13,64 persen.
9.2. PENANAMAN MODAL
DALAM NEGERI (PMDN)DAN PENANAMANMODAL ASING (PMA)
Pada tahun 2014, jumlahproyek penanaman modal dalamnegeri yang disetujui sebanyak 48
proyek. Sedangkan untuk realisasisebanyak 60 proyek dengan nilairealisasi investasi 12,94 triliunrupiah. Sementara penanamanmodal asing yang disetujui sebesar54 proyek dengan nilai investasisekitar US$ 3 miliar denganrealiasasi 297 proyek dengan nilaiUS$ 2,15 miliar.
9.1. FINANCE
The main source of provincerevenue original was from local tax,contributing 5.43 trillion rupiahs oraround 81.48 percent of the totalincome which was 6.66 trillionrupiahs in the year 2014. Localretribution contributed less than one percent from total original income province. Profit of regional
government institution contribute4.65 percent against originalincome province and the others13.64 percent.
9.2. DOMESTIC
INVESTMENTS ANDFOREIGN INVESTMENTS
Number of projects atdomestic investments in 2014 thataprroved were 48 projects, and the
realization were 60 projects withvalue investment about 12,94trillion rupiah. On the other hand, foreign investment that approved54 projects with value investmentabout US$ 3 billion, and therealization is 297 projects worth US$ 2,15 billion.
t
s .
hun
instent ag provin
4 percen
8/20/2019 Kalimantan Timur Dalam Angka Tahun 2015
http://slidepdf.com/reader/full/kalimantan-timur-dalam-angka-tahun-2015 500/623
434
Ke u a n g a n d a n Ha r ga -Har ga / Finance and Prices
K a l i m a n t a n T i m u r D a l a m A n g k a 2 0 1 5
9.3. PERBANKAN
Pada tahun 2014, lembagakeuangan di Kalimantan Timur yangberbentuk kantor bank berjumlah536 unit. Dari 536 unit kantor banktersebut 195 unit berada di KotaSamarinda, 175 unit di KotaBalikpapan, 39 unit di KabupatenKutai Kartanegara, dan 38 unit diKota Bontang, dan selebihnya
menyebar di kabupaten.Posisi kredit bank yang telah
disalurkan pada tahun 2014berjumlah 100,63 trilyun rupiah,dengan jumlah kredit terbesar padasektor pertambangan sebesar 16,52triliun rupiah.
Sedangkan posisi depositobank dirinci Menurutkabupaten/kota sampai denganDesember 2014 mengalamipeningkatan dibanding tahunsebelumnya dari 21,69 triliun rupiahmenjadi 23,93 triliun rupiah. Untuktabungan pada tahun 2014 (periodeJanuari-Desember) tercatat sekitar3,14 juta penabung dengan nilaitabungan sebesar 33,81 triliunrupiah, berarti setiap penabungmempunyai nilai tabungan rata-ratasebesar 11 juta rupiah.
9.3. BANKS
In the year 2014, number of
bank in Kalimantan Timur was 536units. From 536 units of bank werespread out in all overRegency/Municipality, there were195 units in Samarinda, 175 units inBalikpapan, 39 units in KutaiKartanegara, 38 units in Bontang,and other in another regencies.
Position of bank credit thathave been disbursed in 2014amounted to 100,63 trillion rupiah,with the largest credit amount in themining sector about 16,52 trillionrupiah.
Meanwhile until December2014 the outstanding of bankdeposit by Regency/Municipalityincreased as compared to the previous year, from 21,69 trillionrupiahs to 23,93 trillions rupiahs.Number of depositors in 2014(January-December) was reached3,14 millions customers with savings
deposits reached 33,81 trillionrupiahs. Which means the averagenumber of saving deposit perdepositor was 11 million rupiahs.
bankdisbur
i m .
ourutrdengan
engalading
, 9 triliuiun ru
to 100 e arges
ing secupiah.
8/20/2019 Kalimantan Timur Dalam Angka Tahun 2015
http://slidepdf.com/reader/full/kalimantan-timur-dalam-angka-tahun-2015 501/623
435
Ke u a n g a n d a n Ha r ga -Ha r ga / Finance and Prices
K a l i m a n t a n T i m u r D a l a m A n g k a 2 0 1 5
9.4. KOPERASI
Pertumbuhan koperasi sebagai
wadah kegiatan produktifmasyarakat dalam perekonomianrakyat terus berkembang. Tahun2014 jumlah koperasi mencapai5.283 unit usaha. Unit koperasiterbesar adalah yang bergerak pada
jenis koperasi serba usaha yangmencapai 2.728 unit usaha.
9.5. I N F L A S I
Selama tahun 2014,Kalimantan Timur mengalami inflasisebesar 7,44 persen. Inflasi di 3 kotaterpilih masing-masing yaitu: KotaSamarinda 6,58 persen, KotaBalikpapan 7,22 persen, dan KotaTarakan 11,33 persen. Inflasitertinggi terjadi di Kota Samarindapada bulan Desember.
9.6. P E G A D A I A N
Selama tahun 2014 banyaknya jaminan dari penerima kreditkepada Perum Pegadaian diKalimantan Timur adalah 24.433potong dengan nilai kredit sebesar143,81 miliar rupiah dengan nilaipelunasan sebesar 148,45 miliarrupiah. Sedang jumlah barang yangtelah dilelang sebanyak 1.175potong dengan nilai pelelangan 4,71
miliar rupiah.
9.4. COOPERATIVE
The growth of cooperation as a
vessel that is more directed at the public economic development,continuous to grow. In 2014, thenumber of cooperation was 5.283units. The main cooperation inKalimantan Timur is the cooperationwhich cooperative of all-roundeffort reach 2.728 units.
9.5. INFLATION
In 2014, inflation rate inKalimantan Timur was 7.44 percent,Samarinda was 6.58 percent,Balikpapan was 7.22 percent, andTarakan was 11.33 percentrespectively. The highest inflation inSamarinda on December.
9.6. PAWNING
In 2014, number of creditorguarantee in pawnshop services in
Kalimantan Timur reach 24.433units with value about 143,81 billionrupiahs and was paid off 148,45billion rupiahs. While number ofgoods which had been auctionedwas 1.175 units with value about4,71 billion rupiahs.
TION
: /
. aota
Inflasiamarin
.
A I A
In 20alimant
SamarBa
8/20/2019 Kalimantan Timur Dalam Angka Tahun 2015
http://slidepdf.com/reader/full/kalimantan-timur-dalam-angka-tahun-2015 502/623
436 K a l i m a n t a n T i m u r D a l a m A n g k a 2 0 1 5
Ke u a n g a n d a n Ha r g a -Ha r ga / Finance and Prices
PENJELASAN TEKNIS
1. Data statistik perbankan ber-sumber dari Bank Indonesia.
2. Data statistik penanamanmodal yang disetujuipemerintah terdiri dariPenanaman Modal Asing (PMA)dan Penanaman Modal DalamNegeri (PMDN) bersum-ber dari
Badan Perijinan PenanamanModal (BPPM).
3. Koperasi terdiri dari KoperasiUnit Desa (KUD) dan non KUD .Data mengenai koperasibersum-ber dari DepartemenKoperasi. KUD adalah suatu
organisasi ekonomi yangberwatak sosial dan merupakanwadah bagi pengembanganberbagai kegiatan ekonomimasyarakat pedesaan yangdiselenggarakan oleh dan untukmasyarakat itu sendiri (InpresNo.2 Tahun 1978). Non KUDadalah suatu organisasi
ekonomi rakyat yang berwataksosial, beranggotakan orang-orang atau berbadan hukumkoperasi yang merupakan tatasusunan ekonomi berbagaiusaha bersama berdasarkanatas azas kekeluargaan.
TECHNICAL NOTES
1. Banking statistics are obtained from the Bank Indonesia
2. Data on foreign and domesticinvestment approved bygovernment are obtained fromthe “Badan PerijinanPenanaman Modal”(Investment Licensing Board)
3. Cooperatives consist of KUD(Village Cooperatives Unit) andNon KUD (Non-VillageCooperatives Unit). The data for cooperatives are obtained from Ministery of
Cooperatives. Villagecooperatives unit are economicorganization operated by thecommunity, as a means todevelop the economic activitiesof the village community, runby and for the community(Presidential Instruction No. 2,1978). Non-village
Cooperatives Unit are alsoeconomic organization, whichgather non village memberwho share a common social function or role, or division oflabor, or profession in society.
i m .
. . i
g
anangan
ekonoesaan
o eitu sen
7
erativesillage Co
NonCoo f
8/20/2019 Kalimantan Timur Dalam Angka Tahun 2015
http://slidepdf.com/reader/full/kalimantan-timur-dalam-angka-tahun-2015 503/623
437
Ke u a n g a n d a n Ha r g a -Ha r ga / Finance and Prices
K a l i m a n t a n T i m u r D a l a m A n g k a 2 0 1 5
4. Data harga yang disajikan me-liputi:a. Harga eceran beras di
beberapa kotab. Harga eceran beberapa je-
nis barangc. Indeks Harga Konsumen
(IHK) dan laju inflasid. Indeks Harga Perdagangan
Besar (IHPB)e. Indeks Harga yang diterima
dan dibayar Petani
5. Harga eceran beras diolah darisurvei mingguan Badan PusatStatistik. Karena beragamnyakualitas beras, maka harga yangdisajikan adalah harga beraskualitas sedang.
6. IHK merupakan indikatorinflasi , yang dihitung setiapbulan berdasarkan perkemba-ngan harga barang-barang dan jasa yang dikonsumsi rumahtangga.
7. IHPB disajikan dalam bentuk in-deks umum dan juga sektoralyang meliputi: pertanian, Indus-tri, pertambangan dan pengga-lian, serta impor dan ekspor.
8. Nilai Tukar Petani (NTP) adalahperbandingan antara indeksharga yang diterima (It) dandibayar (Ib) petani.
4. Price statistics cover:a. Retail prices of rice in
several citiesb. Retail prices of several
commoditiesc. Consumer price index and
inflation ratesd. Wholesale price indexe. Indices of prices received
and paid by farmer
5. The retail price of rice is compiledthrough the weekly prices surveyconducted by BPS-StatisticsIndonesia in several cities. Due todifferent qualities of rice in eachcity, the medium quality rice isused.
6. The consumer price index is an
indicator of inflation, whereas thecalculation has been based ontrend of price for commodities ofhousehold consumption.
7. The wholesale price index is presented in general index andgroup of commodities, namelyagriculture, industry, mining andquarrying, export, and import.
8. Farmers Term of Trade is anindicator used to determinewelfare level of farmer. It measurethe exchange value of productsthat is produced or sold by farmercompare to the product needed by farmers for process production or
consumption.
rice
t
m . b
.
atorsetiapper em
ng-baraonsum
t e wecte
onesia idi fferencity,
s
8/20/2019 Kalimantan Timur Dalam Angka Tahun 2015
http://slidepdf.com/reader/full/kalimantan-timur-dalam-angka-tahun-2015 504/623
438 K a l i m a n t a n T i m u r D a l a m A n g k a 2 0 1 5
Ke u a n g a n d a n Ha r g a -Ha r ga / Finance and Prices
9. Metode yang digunakan dalampenghitungan Indeks HargaKonsumen (IHK) dan IndeksHarga Per dagangan Besar(IHPB) adalah:
Formula Laspeyres yang telahdimodifikasi , yaitu:
(Pn/Pn-1) Pn-1.QoIn = ----------------------------- X 100
Po.Qo
dimana:In = Indeks bulananPn = Harga pada bulan ke nPn-1 = Harga pada bulan ke n-1Po = Harga pada tahun dasarQo = Kuantitas pada thn dasar
9.The methods used in calculatingconsumer price index andwholesale price index is ModifiedLaspeyres Formula.
The Modified Laspeyres Formula is:
∑ (Pn /P n-1 ) Pn-1 Q0 In = -------------------------- X 100
∑ P0.Q0
In = monthly indexPn = price in month nPn-1 = price in month n-1P0 = price in the basic yearQ0 = quantity in the basic yea r
h t t p : / / k a l t i m
. b
y ince in mo
price in= price= qu
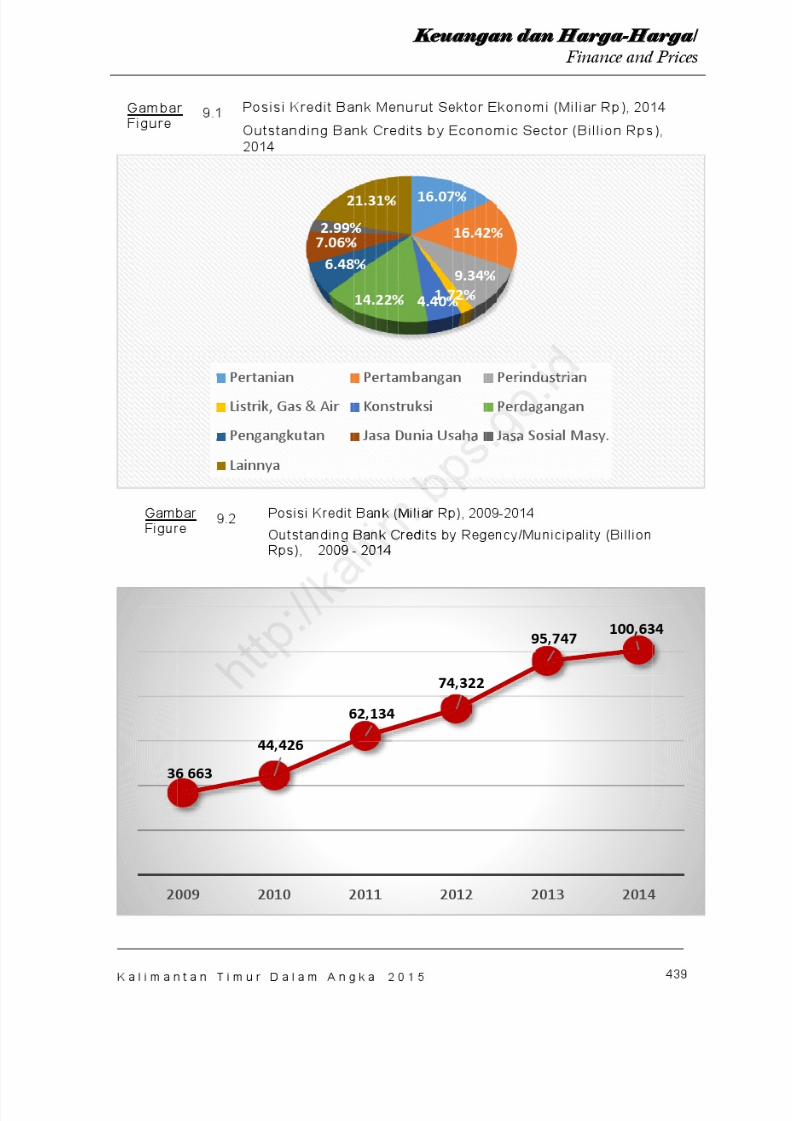
8/20/2019 Kalimantan Timur Dalam Angka Tahun 2015
http://slidepdf.com/reader/full/kalimantan-timur-dalam-angka-tahun-2015 505/623
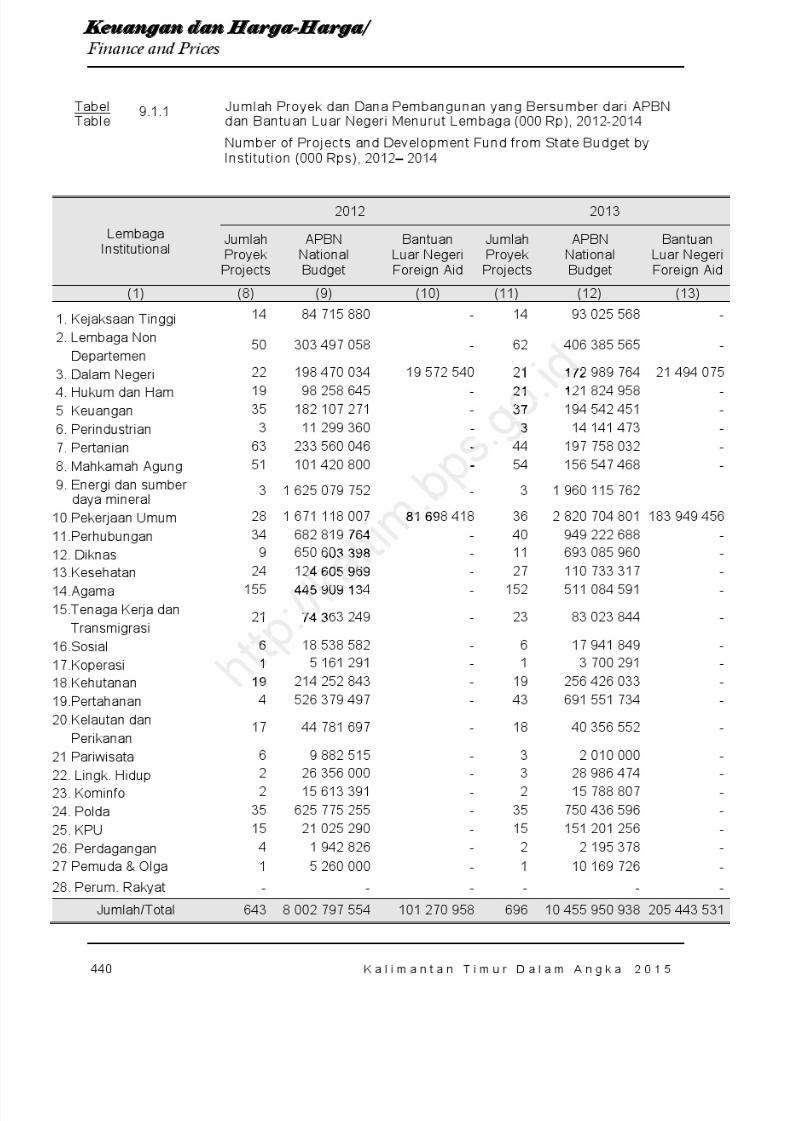
8/20/2019 Kalimantan Timur Dalam Angka Tahun 2015
http://slidepdf.com/reader/full/kalimantan-timur-dalam-angka-tahun-2015 506/623
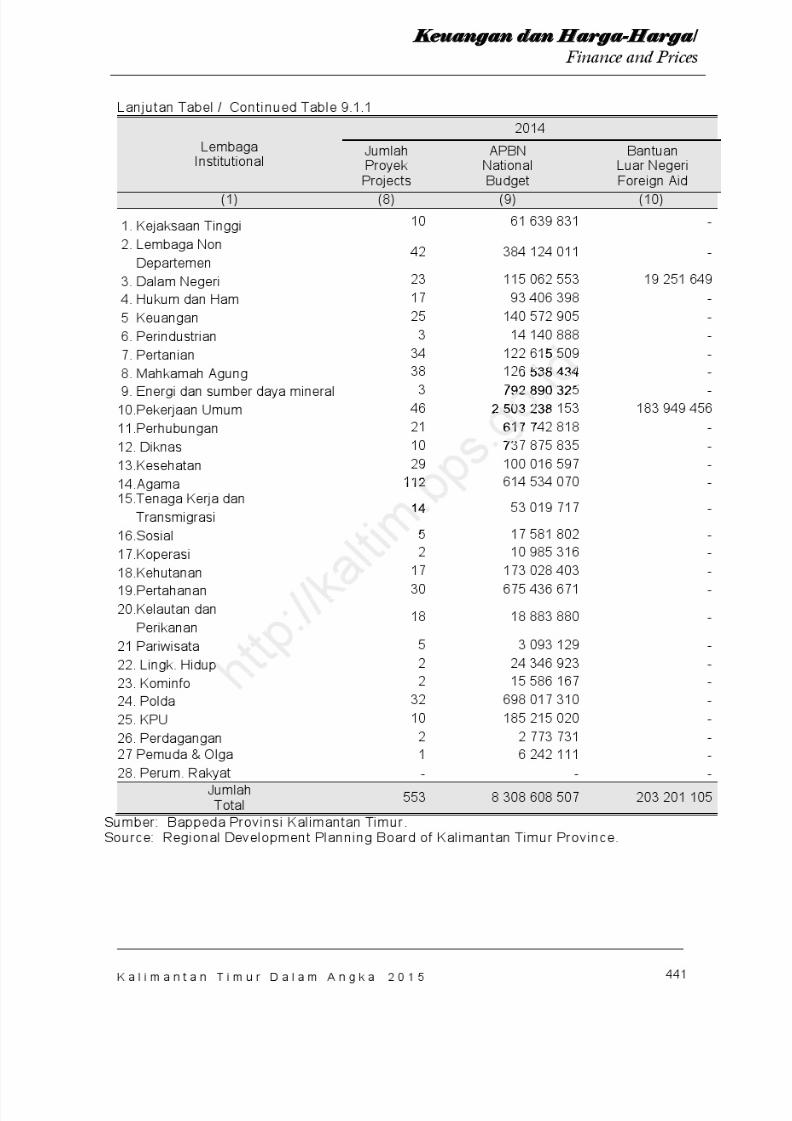
8/20/2019 Kalimantan Timur Dalam Angka Tahun 2015
http://slidepdf.com/reader/full/kalimantan-timur-dalam-angka-tahun-2015 507/623

8/20/2019 Kalimantan Timur Dalam Angka Tahun 2015
http://slidepdf.com/reader/full/kalimantan-timur-dalam-angka-tahun-2015 508/623

8/20/2019 Kalimantan Timur Dalam Angka Tahun 2015
http://slidepdf.com/reader/full/kalimantan-timur-dalam-angka-tahun-2015 509/623
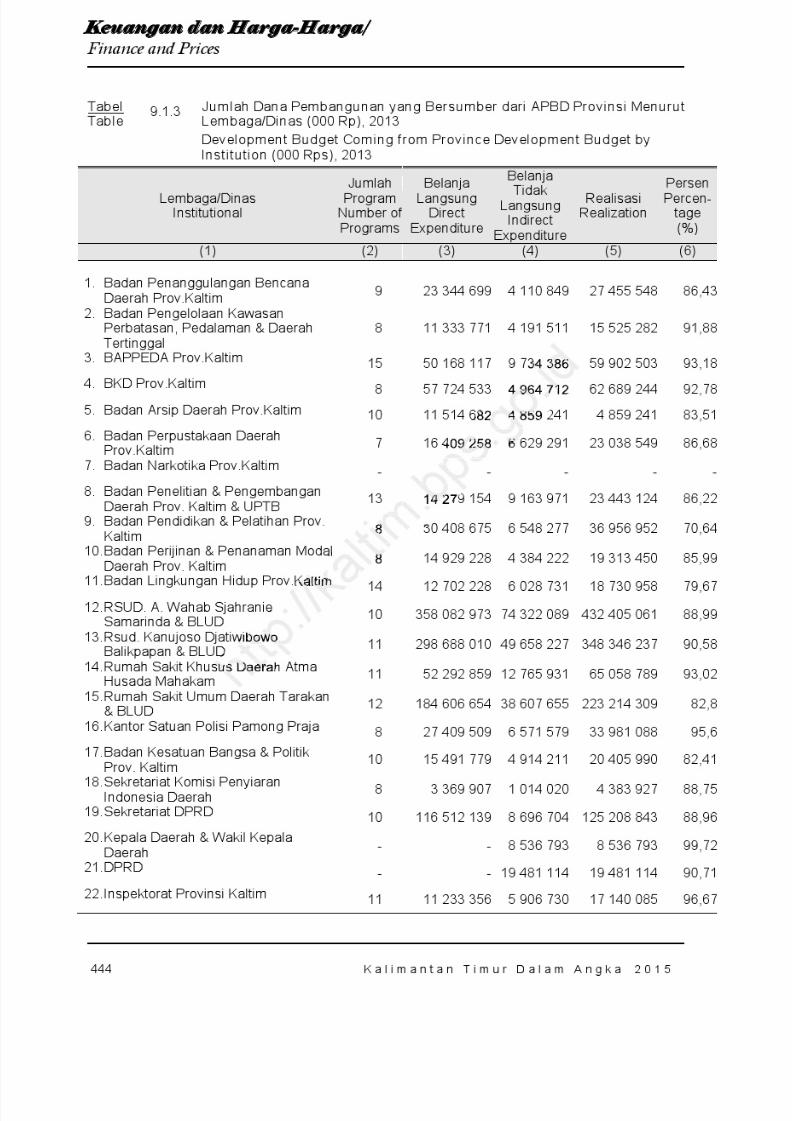
8/20/2019 Kalimantan Timur Dalam Angka Tahun 2015
http://slidepdf.com/reader/full/kalimantan-timur-dalam-angka-tahun-2015 510/623
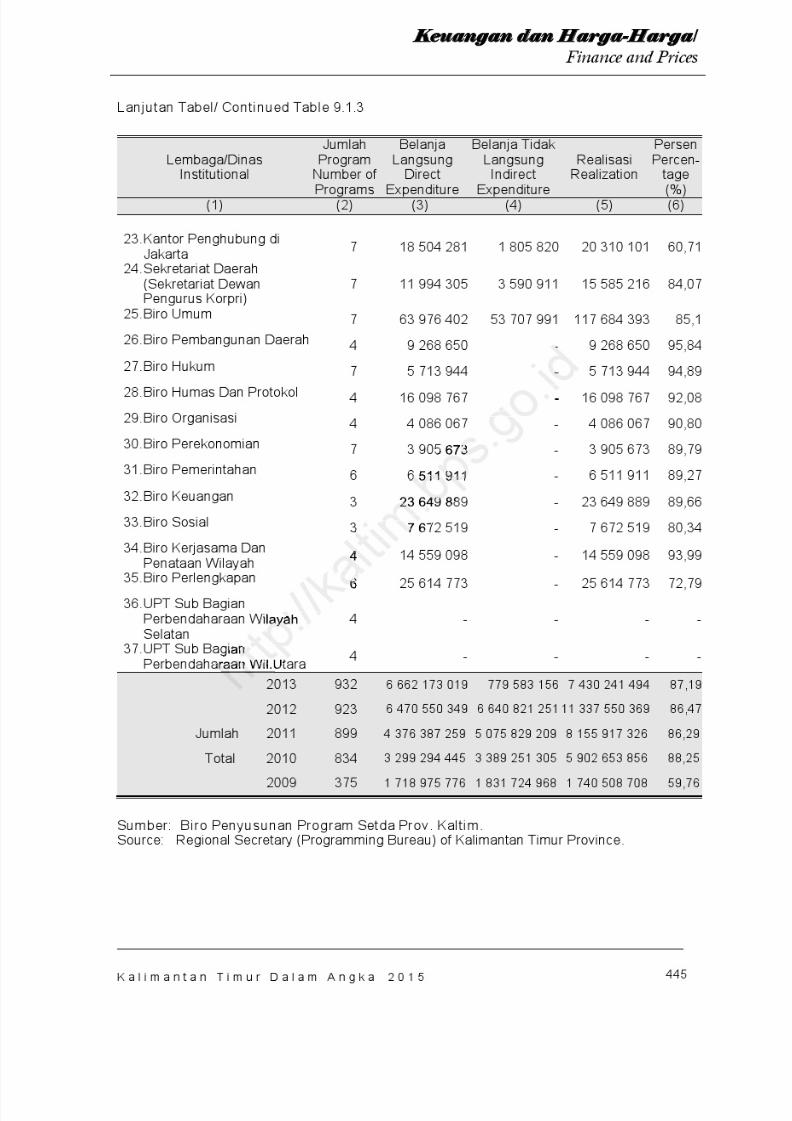
8/20/2019 Kalimantan Timur Dalam Angka Tahun 2015
http://slidepdf.com/reader/full/kalimantan-timur-dalam-angka-tahun-2015 511/623
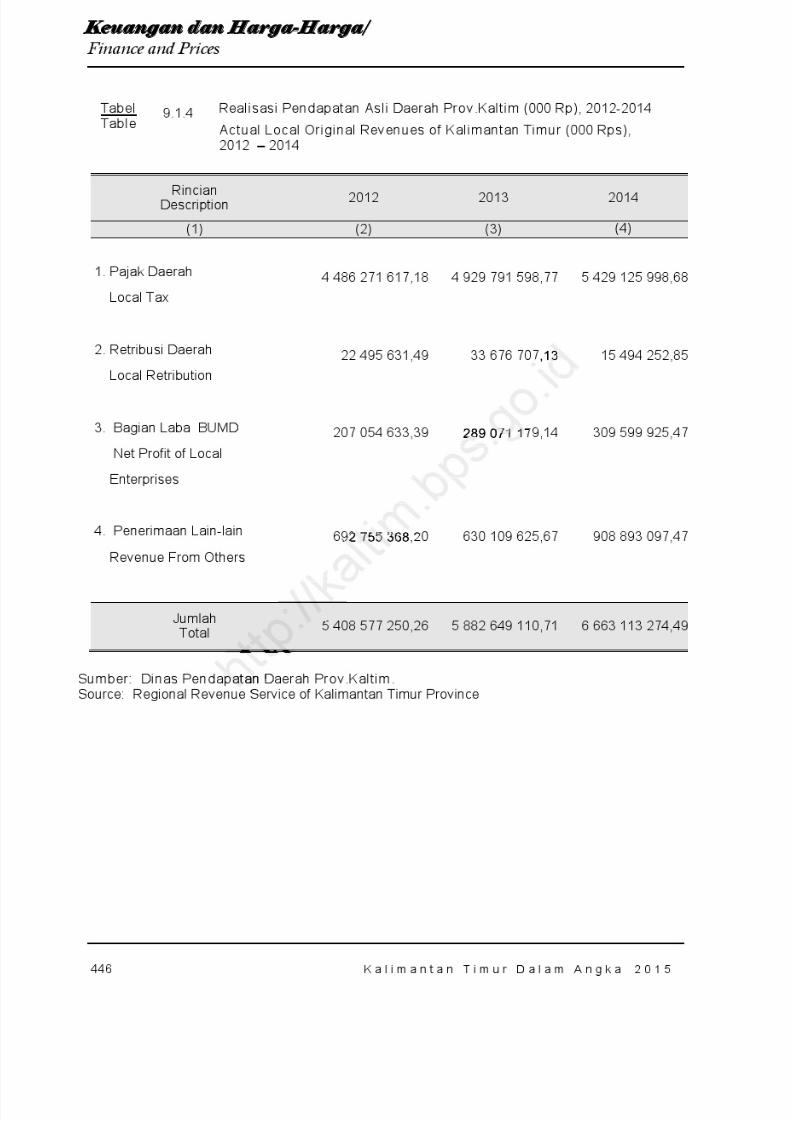
8/20/2019 Kalimantan Timur Dalam Angka Tahun 2015
http://slidepdf.com/reader/full/kalimantan-timur-dalam-angka-tahun-2015 512/623
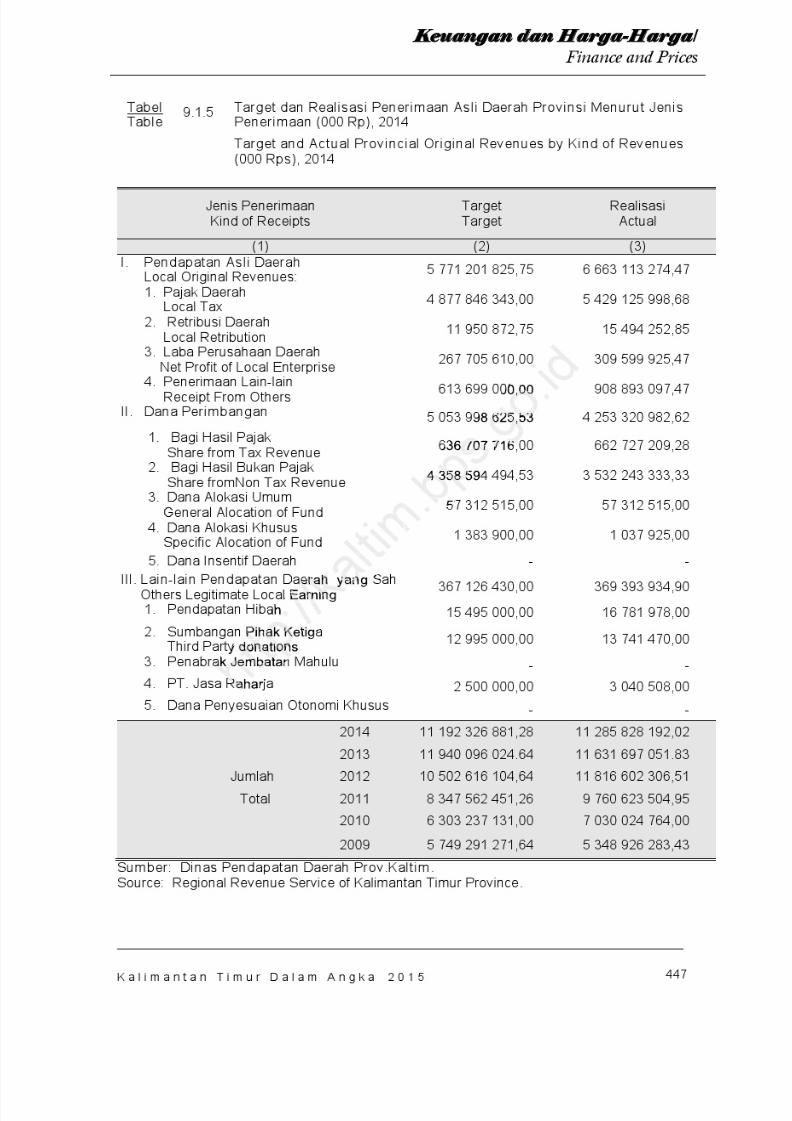
8/20/2019 Kalimantan Timur Dalam Angka Tahun 2015
http://slidepdf.com/reader/full/kalimantan-timur-dalam-angka-tahun-2015 513/623

8/20/2019 Kalimantan Timur Dalam Angka Tahun 2015
http://slidepdf.com/reader/full/kalimantan-timur-dalam-angka-tahun-2015 514/623
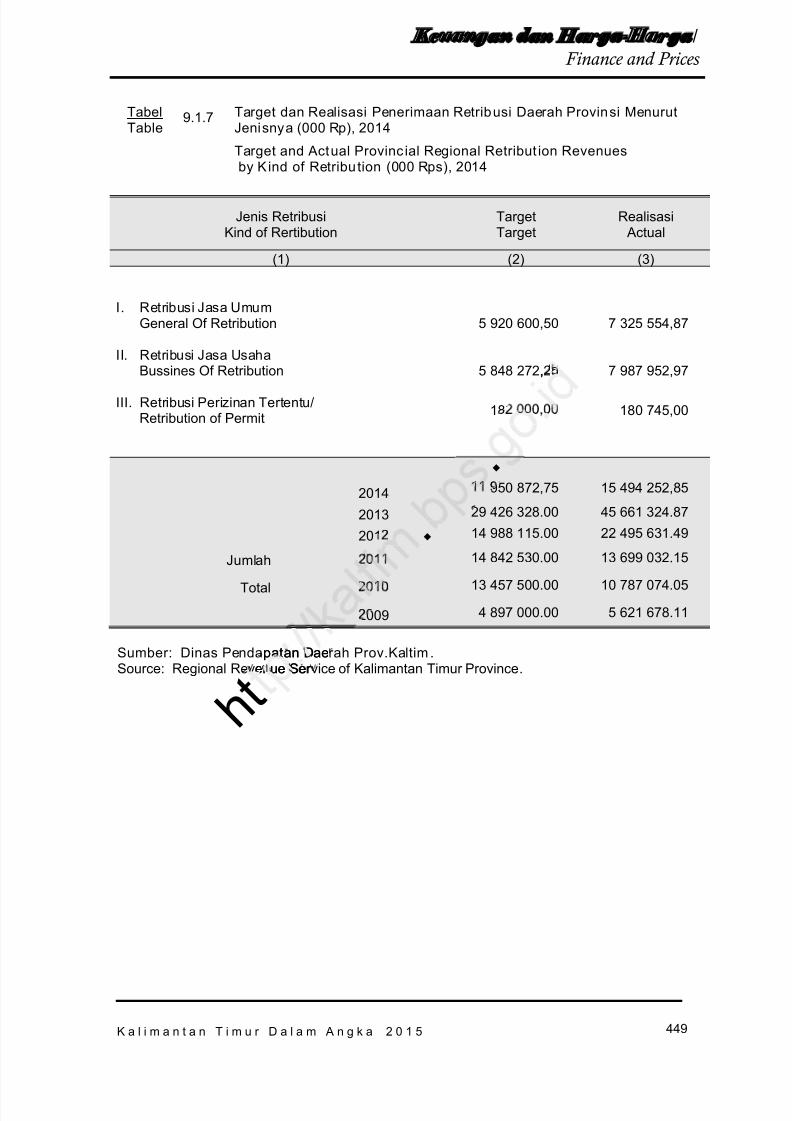
8/20/2019 Kalimantan Timur Dalam Angka Tahun 2015
http://slidepdf.com/reader/full/kalimantan-timur-dalam-angka-tahun-2015 515/623
449
K e u a n g a n d a n Ha r ga -Ha r ga / Finance and Prices
K a l i m a n t a n T i m u r D a l a m A n g k a 2 0 1 5
TabelTable
9.1.7 Target dan Realisasi Penerimaan Retribusi Daerah Provinsi MenurutJenisnya (000 Rp), 2014
Target and Actual Provinc ial Regional Retribut ion Revenuesby Kind of Retribu tion (000 Rps), 2014
Jenis RetribusiKind of Rertibution
TargetTarget
Realisasi Actual
(1) (2) (3)
I. Retribusi Jasa UmumGeneral Of Retribution 5 920 600,50 7 325 554,87
II. Retribusi Jasa UsahaBussines Of Retribution 5 848 272,25 7 987 952,97
III. Retribusi Perizinan Tertentu/Retribution of Permit 182 000,00 180 745,00
2014 11 950 872,75 15 494 252,85
2013 29 426 328.00 45 661 324.87
2012 14 988 115.00 22 495 631.49
Jumlah 2011 14 842 530.00 13 699 032.15
Total 2010 13 457 500.00 10 787 074.05
2009 4 897 000.00 5 621 678.11
Sumber: Dinas Pendapatan Daerah Prov.Kaltim .Source: Regional Revenue Service of Kalimantan Timur Province .
,
.
.
h t patan Dae
enue Ser
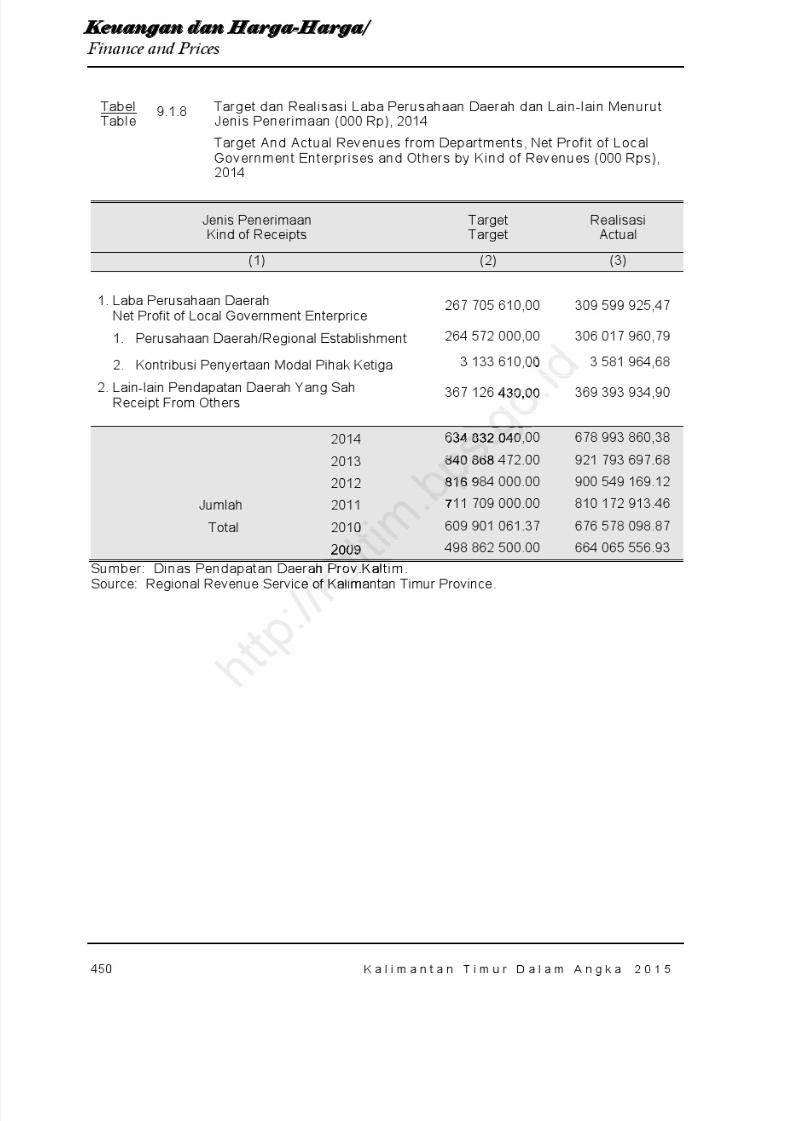
8/20/2019 Kalimantan Timur Dalam Angka Tahun 2015
http://slidepdf.com/reader/full/kalimantan-timur-dalam-angka-tahun-2015 516/623
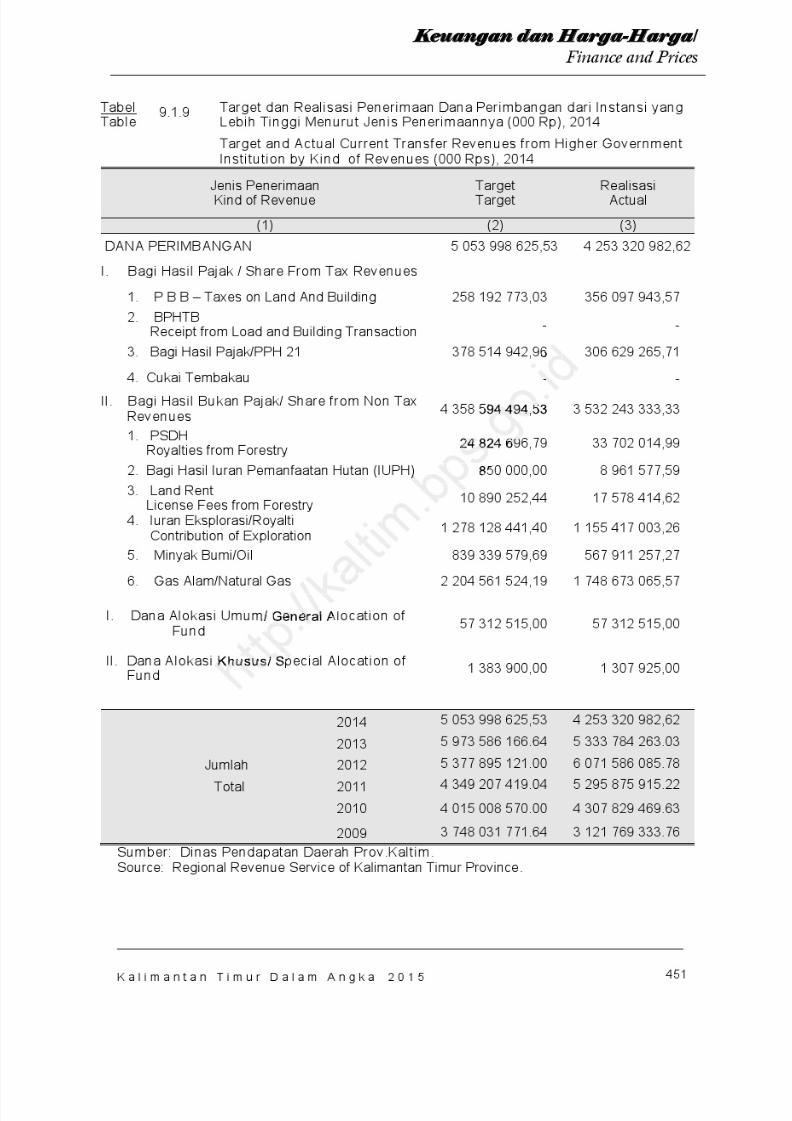
8/20/2019 Kalimantan Timur Dalam Angka Tahun 2015
http://slidepdf.com/reader/full/kalimantan-timur-dalam-angka-tahun-2015 517/623
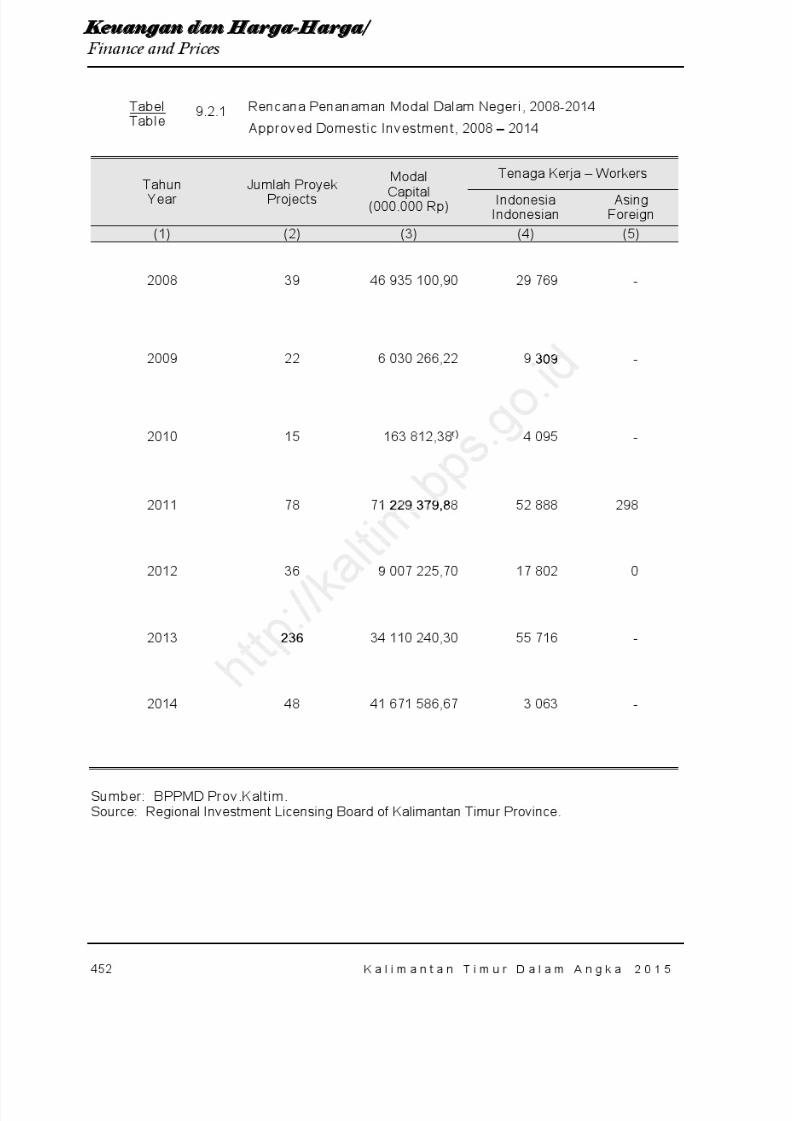
8/20/2019 Kalimantan Timur Dalam Angka Tahun 2015
http://slidepdf.com/reader/full/kalimantan-timur-dalam-angka-tahun-2015 518/623
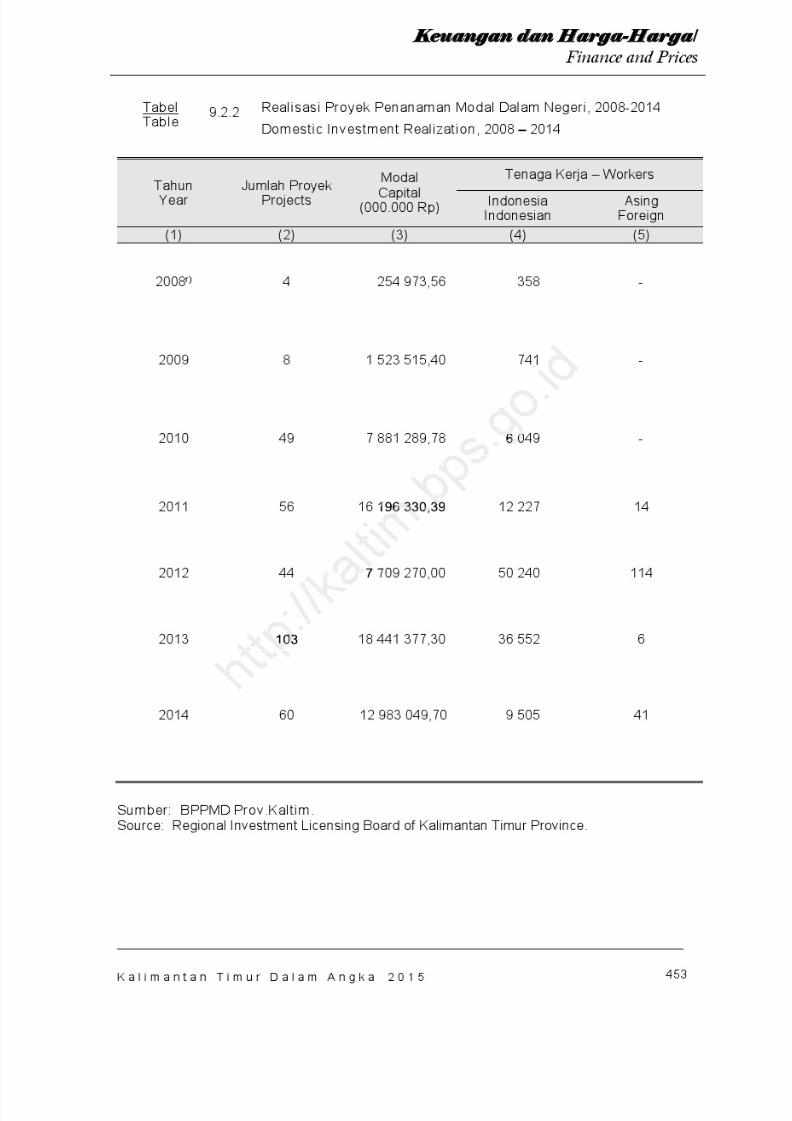
8/20/2019 Kalimantan Timur Dalam Angka Tahun 2015
http://slidepdf.com/reader/full/kalimantan-timur-dalam-angka-tahun-2015 519/623
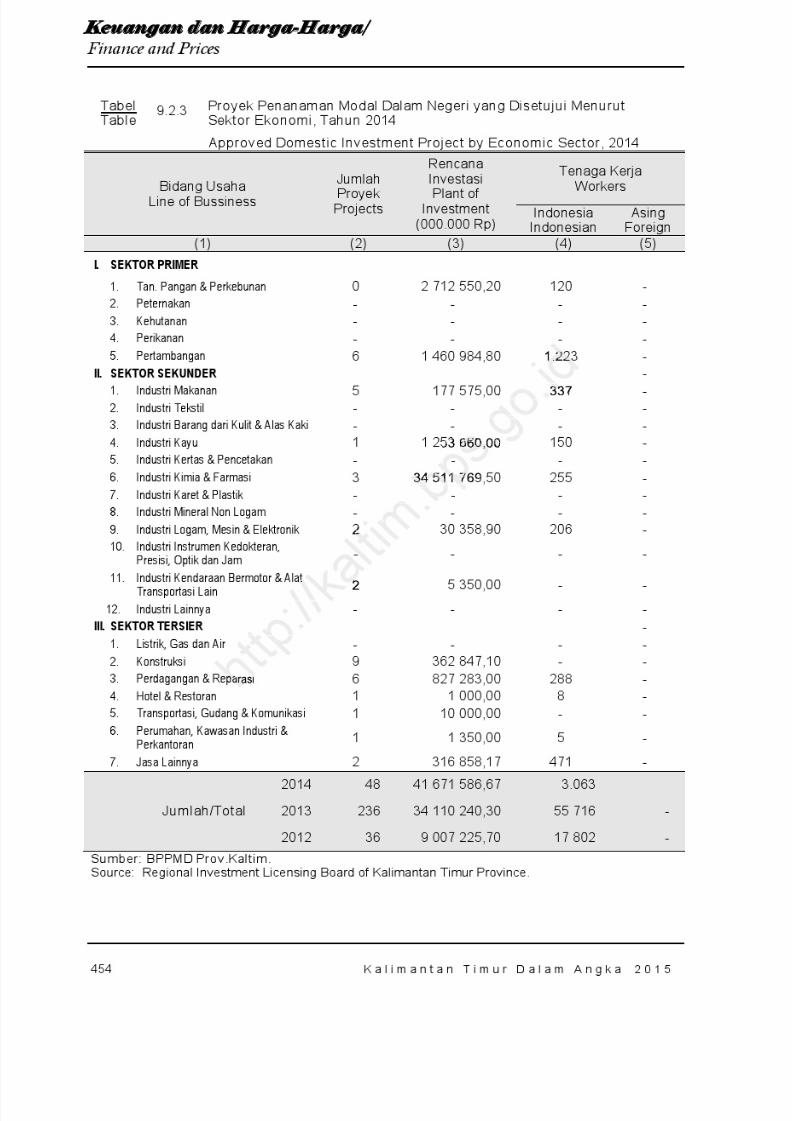
8/20/2019 Kalimantan Timur Dalam Angka Tahun 2015
http://slidepdf.com/reader/full/kalimantan-timur-dalam-angka-tahun-2015 520/623
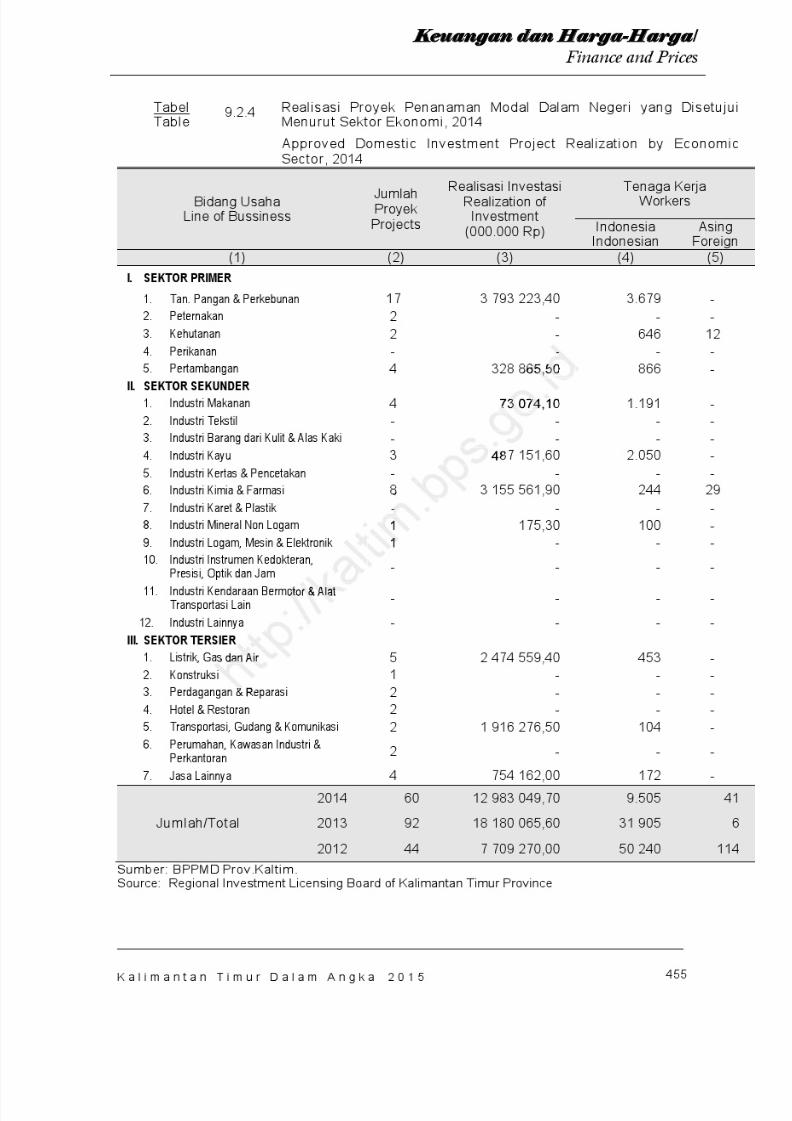
8/20/2019 Kalimantan Timur Dalam Angka Tahun 2015
http://slidepdf.com/reader/full/kalimantan-timur-dalam-angka-tahun-2015 521/623
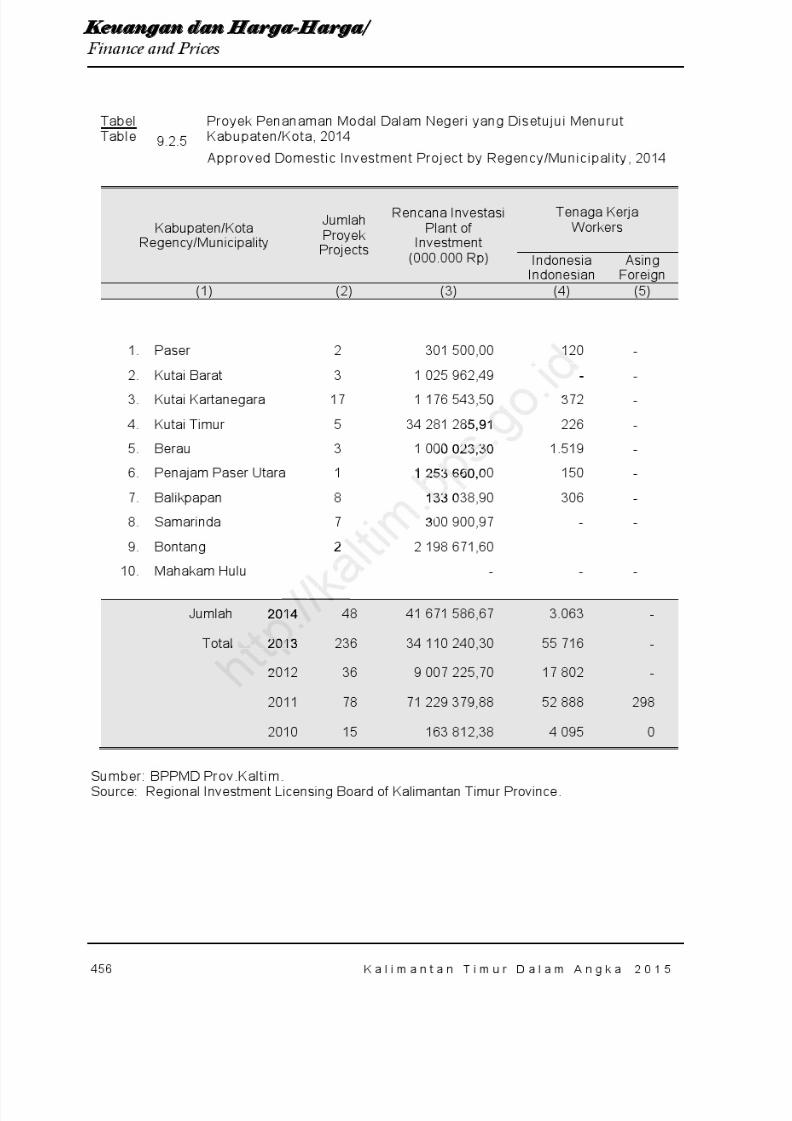
8/20/2019 Kalimantan Timur Dalam Angka Tahun 2015
http://slidepdf.com/reader/full/kalimantan-timur-dalam-angka-tahun-2015 522/623
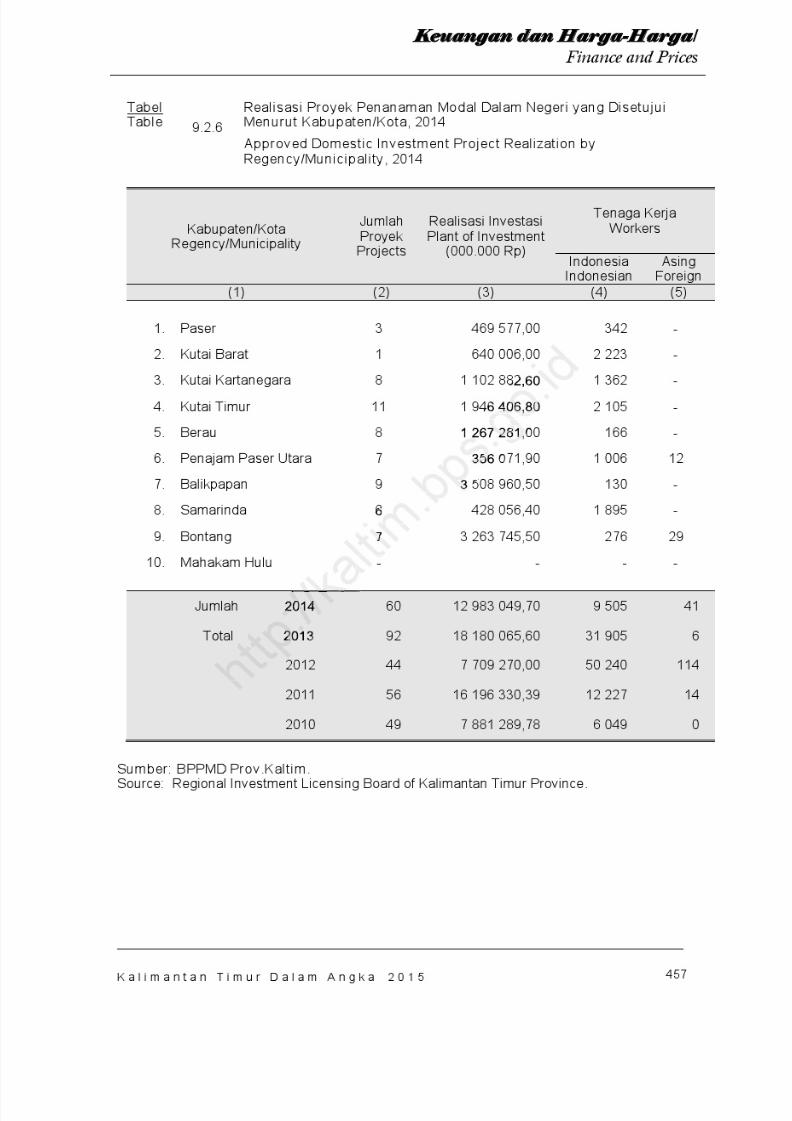
8/20/2019 Kalimantan Timur Dalam Angka Tahun 2015
http://slidepdf.com/reader/full/kalimantan-timur-dalam-angka-tahun-2015 523/623
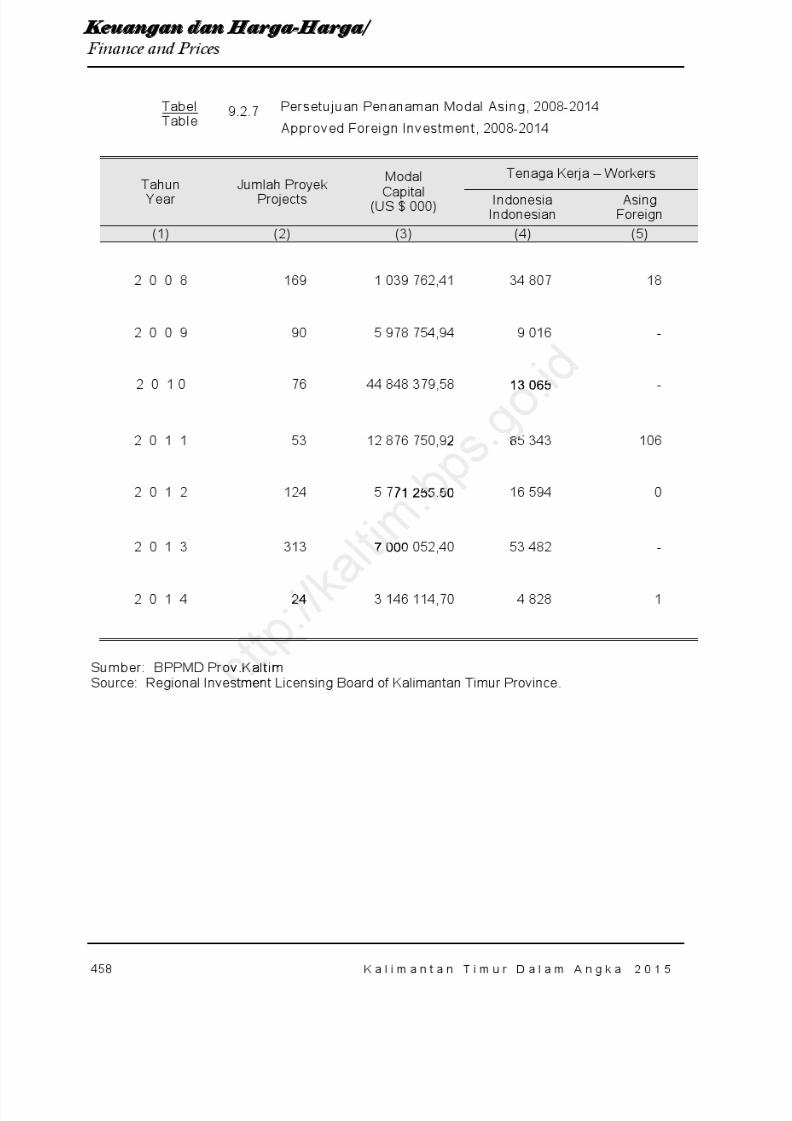
8/20/2019 Kalimantan Timur Dalam Angka Tahun 2015
http://slidepdf.com/reader/full/kalimantan-timur-dalam-angka-tahun-2015 524/623
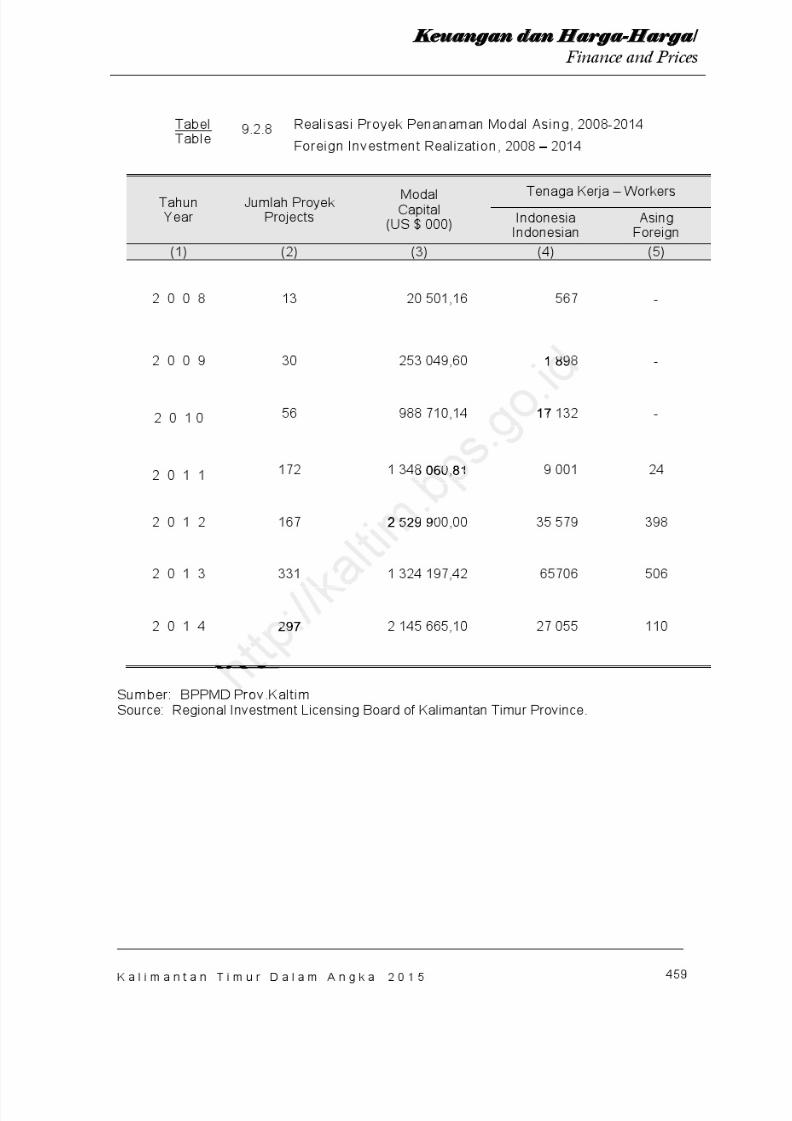
8/20/2019 Kalimantan Timur Dalam Angka Tahun 2015
http://slidepdf.com/reader/full/kalimantan-timur-dalam-angka-tahun-2015 525/623
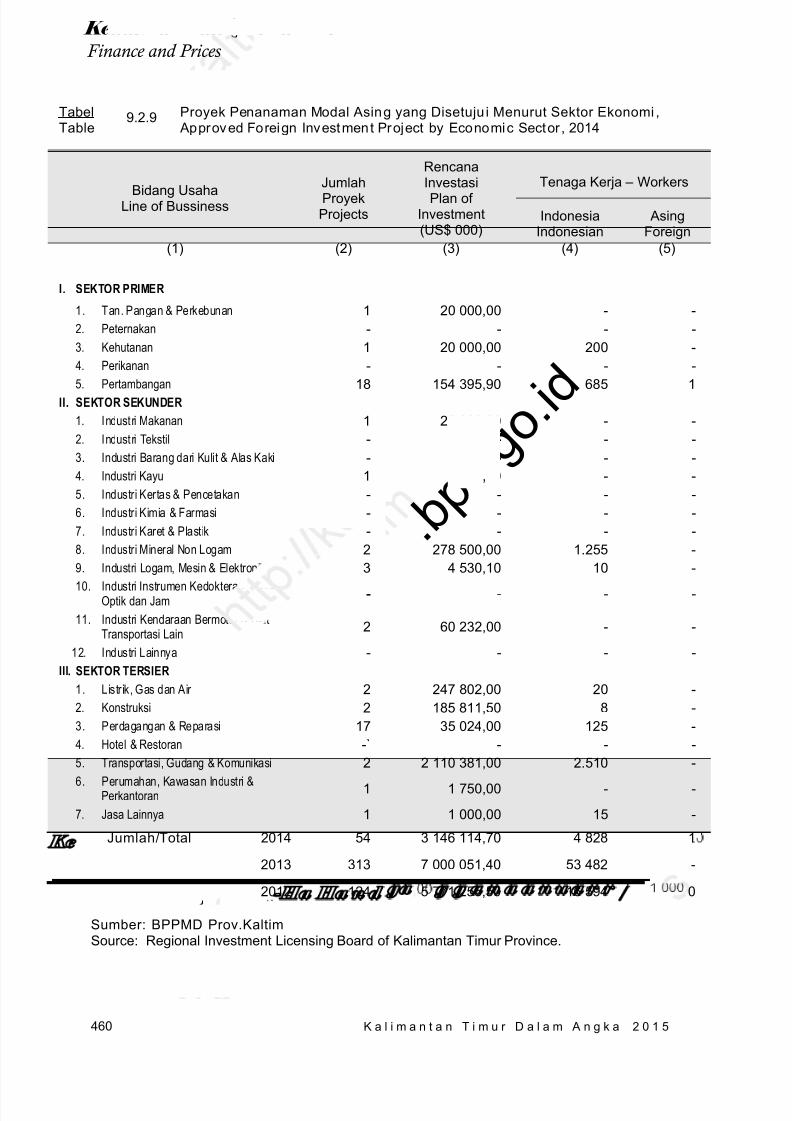
8/20/2019 Kalimantan Timur Dalam Angka Tahun 2015
http://slidepdf.com/reader/full/kalimantan-timur-dalam-angka-tahun-2015 526/623
460 K a l i m a n t a n T i m u r D a l a m A n g k a 2 0 1 5
Ke u a n g a n d a n Ha r g a -Ha r ga / Finance and Prices
TabelTable
9.2.9 Proyek Penanaman Modal Asing yang Disetuju i Menurut Sektor Ekonomi , Approved Foreign Investment Project by Economic Sector , 2014
Bidang UsahaLine of Bussiness
JumlahProyekProjects
RencanaInvestasiPlan of
Investment(US$ 000)
Tenaga Kerja – Workers
IndonesiaIndonesian
AsingForeign
(1) (2) (3) (4) (5)
I. SEKTOR PRIMER
1. Tan. Pangan & Perkebunan 1 20 000,00 - -2. Peternakan - - - -3. Kehutanan 1 20 000,00 200 -4. Perikanan - - - -
5. Pertambangan 18 154 395,90 685 1II. SEKTOR SEKUNDER
1. Industri Makanan 1 25 688,20 - -2. Industri Tekstil - - - -3. Industri Barang dari Kulit & Alas Kaki - - - -4. Industri Kayu 1 1 000,00 - -5. Industri Kertas & Pencetakan - - - -6. Industri Kimia & Farmasi - - - -7. Industri Karet & Plastik - - - -8. Industri Mineral Non Logam 2 278 500,00 1.255 -9. Industri Logam, Mesin & Elektronik 3 4 530,10 10 -10. Industri Instrumen Kedokteran, Presisi,
Optik dan Jam - - - -
11. Industri Kendaraan Bermotor & AlatTransportasi Lain 2 60 232,00 - -
12. Industri Lainnya - - - -III. SEKTOR TERSIER
1. Listrik, Gas dan Air 2 247 802,00 20 -2. Konstruksi 2 185 811,50 8 -3. Perdagangan & Reparasi 17 35 024,00 125 -4. Hotel & Restoran -` - - -
5. Transportasi, Gudang & Komunikasi 2 2 110 381,00 2.510 -6. Perumahan, Kawasan Industri &Perkantoran 1 1 750,00 - -
7. Jasa Lainnya 1 1 000,00 15 -
Jumlah/ Total 2014 54 3 146 114,70 4 828 1
2013 313 7 000 051,40 53 482 -
2012 124 5 771 255,50 16 594 0
Sumber: BPPMD Prov.KaltimSource: Regional Investment Licensing Board of Kalimantan Timur Province.
. b p . g o . i d
--
,,
-
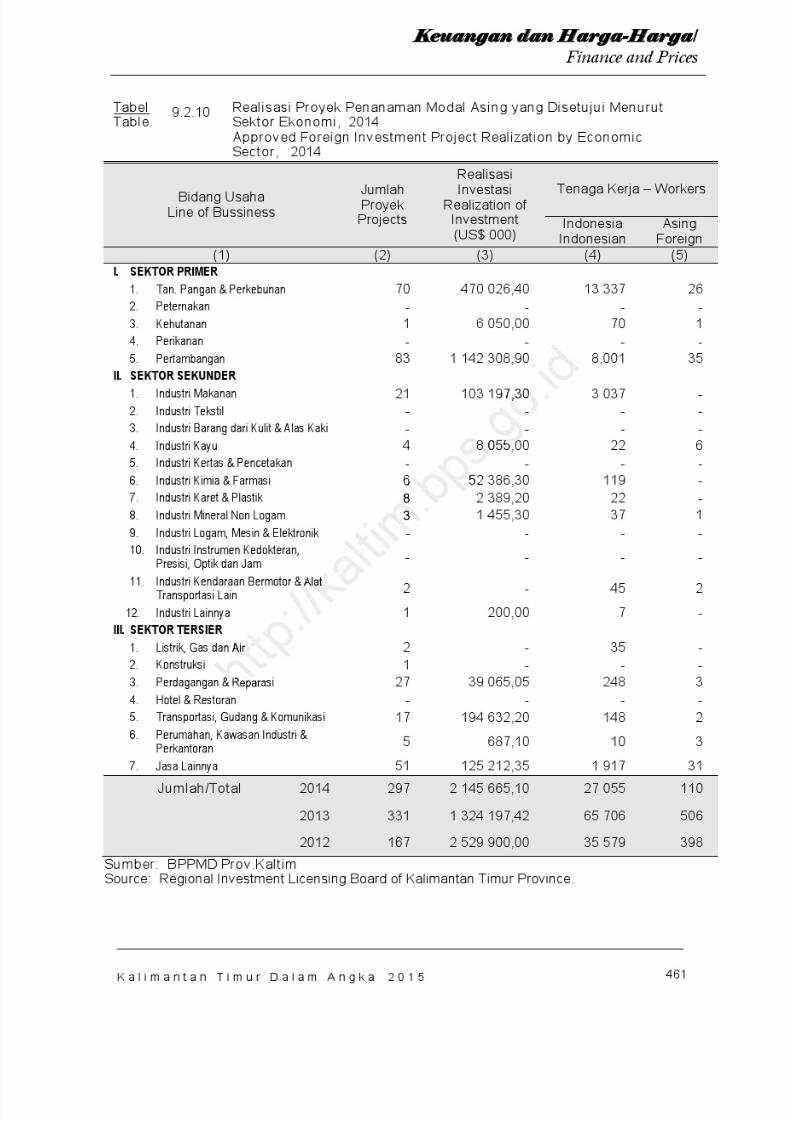
8/20/2019 Kalimantan Timur Dalam Angka Tahun 2015
http://slidepdf.com/reader/full/kalimantan-timur-dalam-angka-tahun-2015 527/623
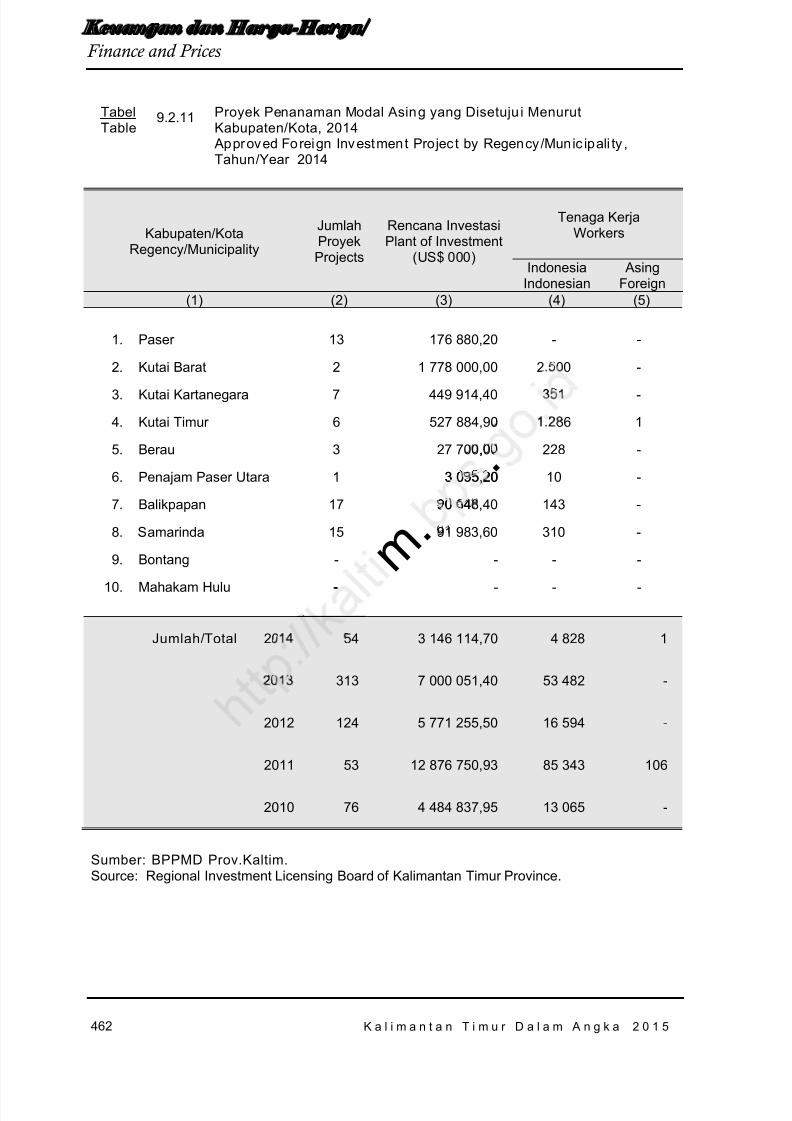
8/20/2019 Kalimantan Timur Dalam Angka Tahun 2015
http://slidepdf.com/reader/full/kalimantan-timur-dalam-angka-tahun-2015 528/623
462 K a l i m a n t a n T i m u r D a l a m A n g k a 2 0 1 5
Ke u a n g a n d a n Ha r g a -Ha r ga / Finance and Prices
TabelTable
9.2.11 Proyek Penanaman Modal Asing yang Disetuju i MenurutKabupaten/Kota, 2014
Approved Foreign Investment Projec t by Regency/Munic ipali ty ,Tahun /Year 2014
Kabupaten/KotaRegency/Municipality
JumlahProyekProjects
Rencana InvestasiPlant of Investment
(US$ 000)
Tenaga KerjaWorkers
IndonesiaIndonesian
AsingForeign
(1) (2) (3) (4) (5)
1. Paser 13 176 880,20 - -
2. Kutai Barat 2 1 778 000,00 2.500 -
3. Kutai Kartanegara 7 449 914,40 351 -
4. Kutai Timur 6 527 884,90 1.286 1
5. Berau 3 27 700,00 228 -
6. Penajam Paser Utara 1 3 095,20 10 -
7. Balikpapan 17 90 648,40 143 -
8. Samarinda 15 91 983,60 310 -
9. Bontang - - - -
10. Mahakam Hulu - - - -
Jumlah/ Total 2014 54 3 146 114,70 4 828 1
2013 313 7 000 051,40 53 482 -
2012 124 5 771 255,50 16 594 -
2011 53 12 876 750,93 85 343 106
2010 76 4 484 837,95 13 065 -
Sumber: BPPMD Prov.Kaltim.Source: Regional Investment Licensing Board of Kalimantan Timur Province.
m .
.,
3 095,20
90 64
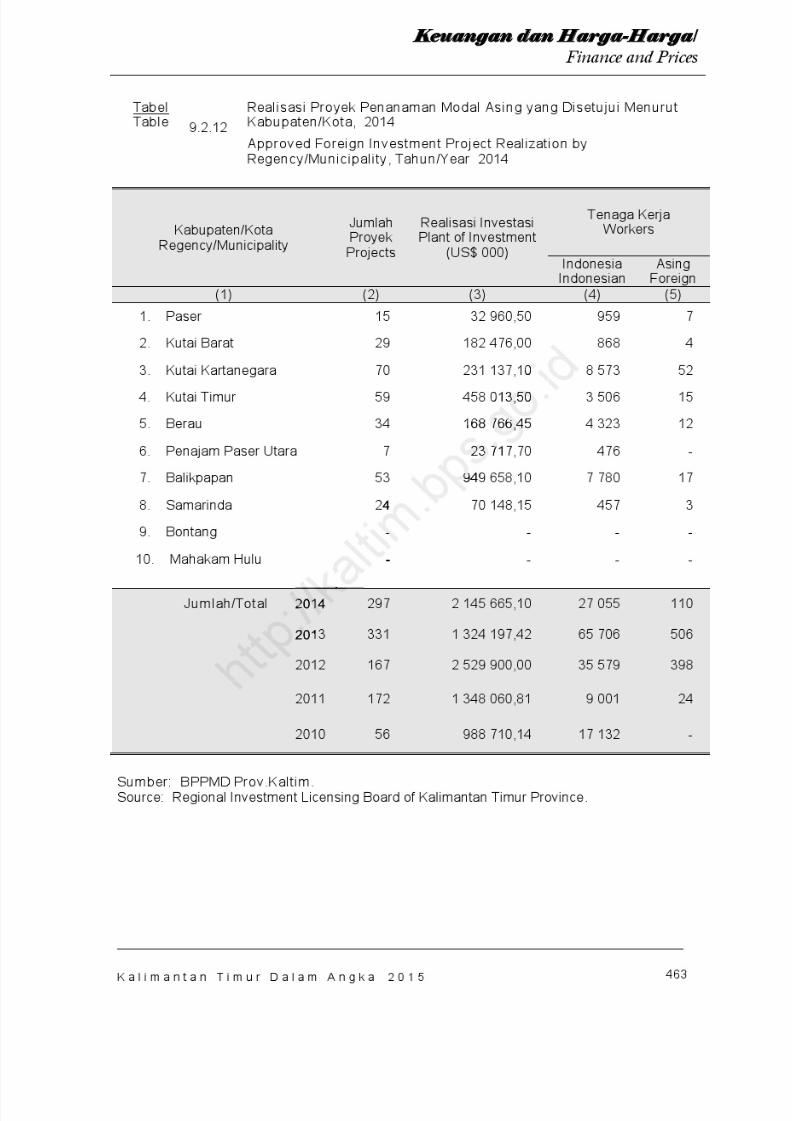
8/20/2019 Kalimantan Timur Dalam Angka Tahun 2015
http://slidepdf.com/reader/full/kalimantan-timur-dalam-angka-tahun-2015 529/623
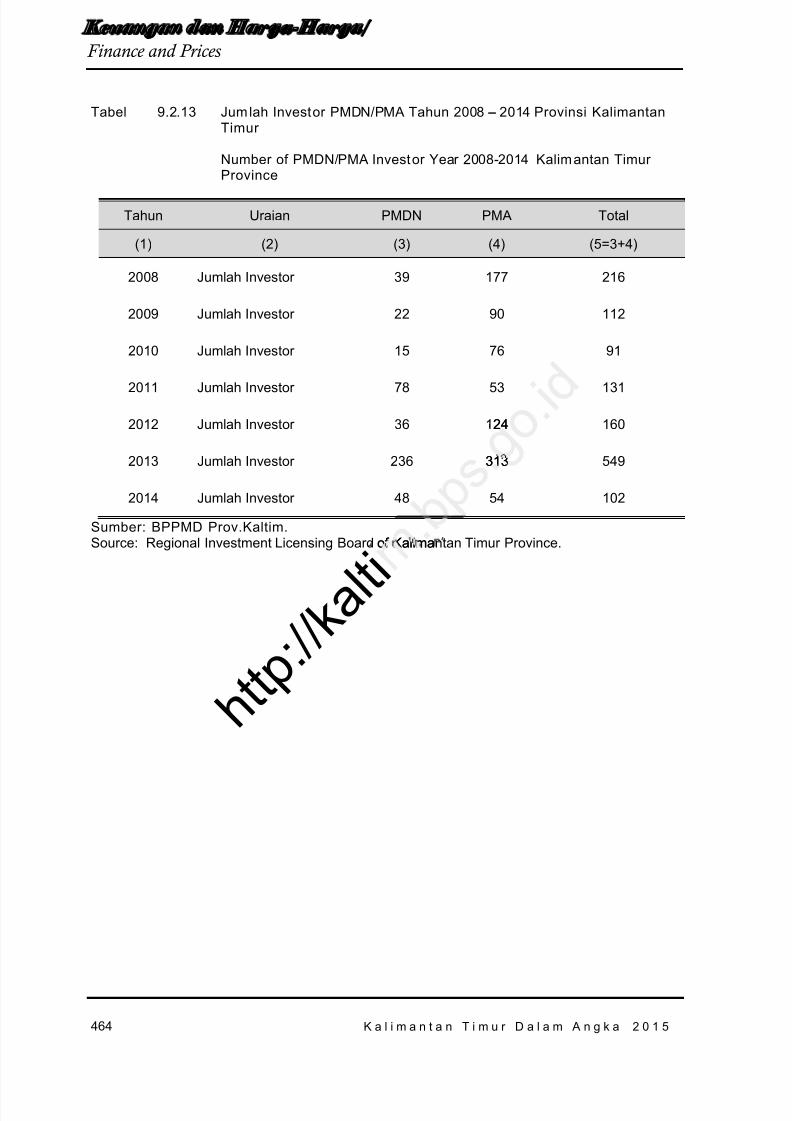
8/20/2019 Kalimantan Timur Dalam Angka Tahun 2015
http://slidepdf.com/reader/full/kalimantan-timur-dalam-angka-tahun-2015 530/623
464 K a l i m a n t a n T i m u r D a l a m A n g k a 2 0 1 5
Ke u a n g a n d a n Ha r g a -Ha r ga / Finance and Prices
Tabel 9.2.13 Jum lah Investor PMDN/PMA Tahun 2008 – 2014 Provinsi KalimantanTimur
Number of PMDN/PMA Investor Year 2008-2014 Kalimantan TimurProvince
Tahun Uraian PMDN PMA Total
(1) (2) (3) (4) (5=3+4)
2008 Jumlah Investor 39 177 216
2009 Jumlah Investor 22 90 112
2010 Jumlah Investor 15 76 91
2011 Jumlah Investor 78 53 131
2012 Jumlah Investor 36 124 160
2013 Jumlah Investor 236 313 549
2014 Jumlah Investor 48 54 102
Sumber: BPPMD Prov.Kaltim.Source: Regional Investment Licensing Board of Kalimantan Timur Province.
24
313
h t t p : / / k a l t i
of Kalima
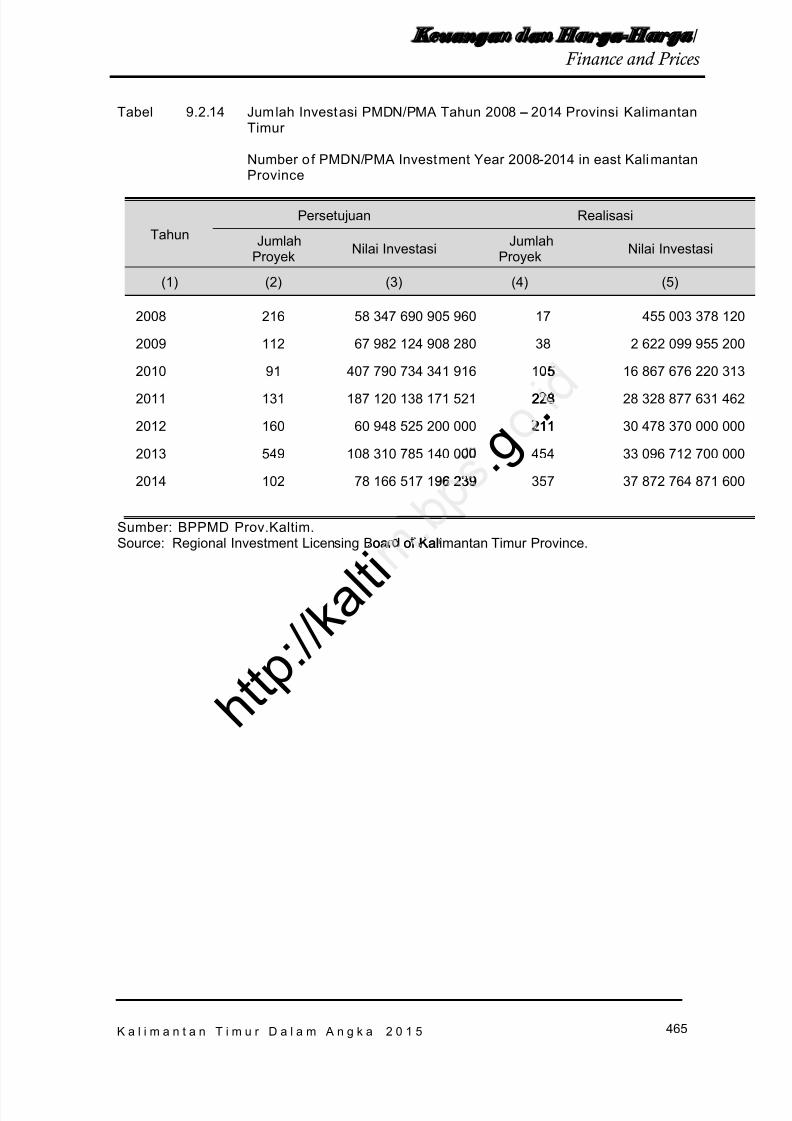
8/20/2019 Kalimantan Timur Dalam Angka Tahun 2015
http://slidepdf.com/reader/full/kalimantan-timur-dalam-angka-tahun-2015 531/623
465
K e u a n g a n d a n Ha r ga -Ha r ga / Finance and Prices
K a l i m a n t a n T i m u r D a l a m A n g k a 2 0 1 5
Tabel 9.2.14 Jumlah Investasi PMDN/PMA Tahun 2008 – 2014 Provinsi KalimantanTimur
Number of PMDN/PMA Investment Year 2008-2014 in east KalimantanProvince
TahunPersetujuan Realisasi
JumlahProyek Nilai Investasi Jumlah
Proyek Nilai Investasi
(1) (2) (3) (4) (5)
2008 216 58 347 690 905 960 17 455 003 378 120
2009 112 67 982 124 908 280 38 2 622 099 955 200
2010 91 407 790 734 341 916 105 16 867 676 220 313
2011 131 187 120 138 171 521 228 28 328 877 631 462
2012 160 60 948 525 200 000 211 30 478 370 000 000
2013 549 108 310 785 140 000 454 33 096 712 700 000
2014 102 78 166 517 196 239 357 37 872 764 871 600
Sumber: BPPMD Prov.Kaltim.Source: Regional Investment Licensing Board of Kalimantan Timur Province.
. g .
5
228
211
6 239
h t t p : / / k a l t i
oard of Kal
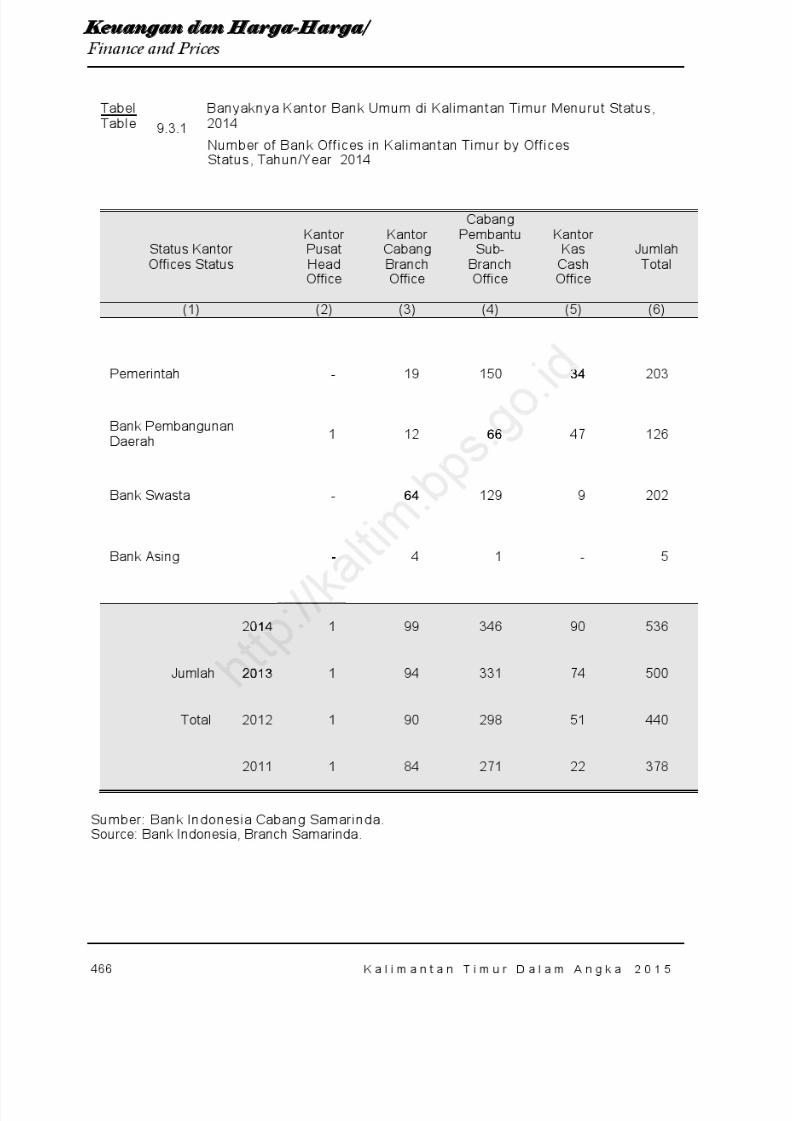
8/20/2019 Kalimantan Timur Dalam Angka Tahun 2015
http://slidepdf.com/reader/full/kalimantan-timur-dalam-angka-tahun-2015 532/623
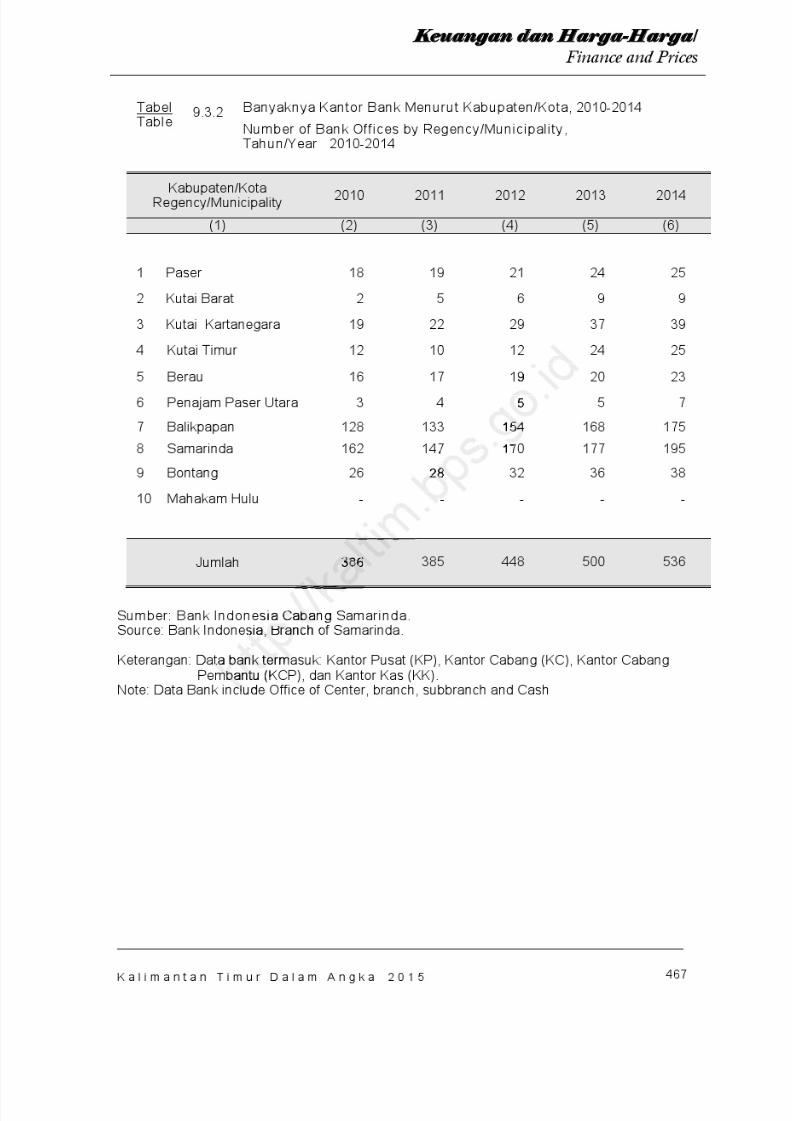
8/20/2019 Kalimantan Timur Dalam Angka Tahun 2015
http://slidepdf.com/reader/full/kalimantan-timur-dalam-angka-tahun-2015 533/623
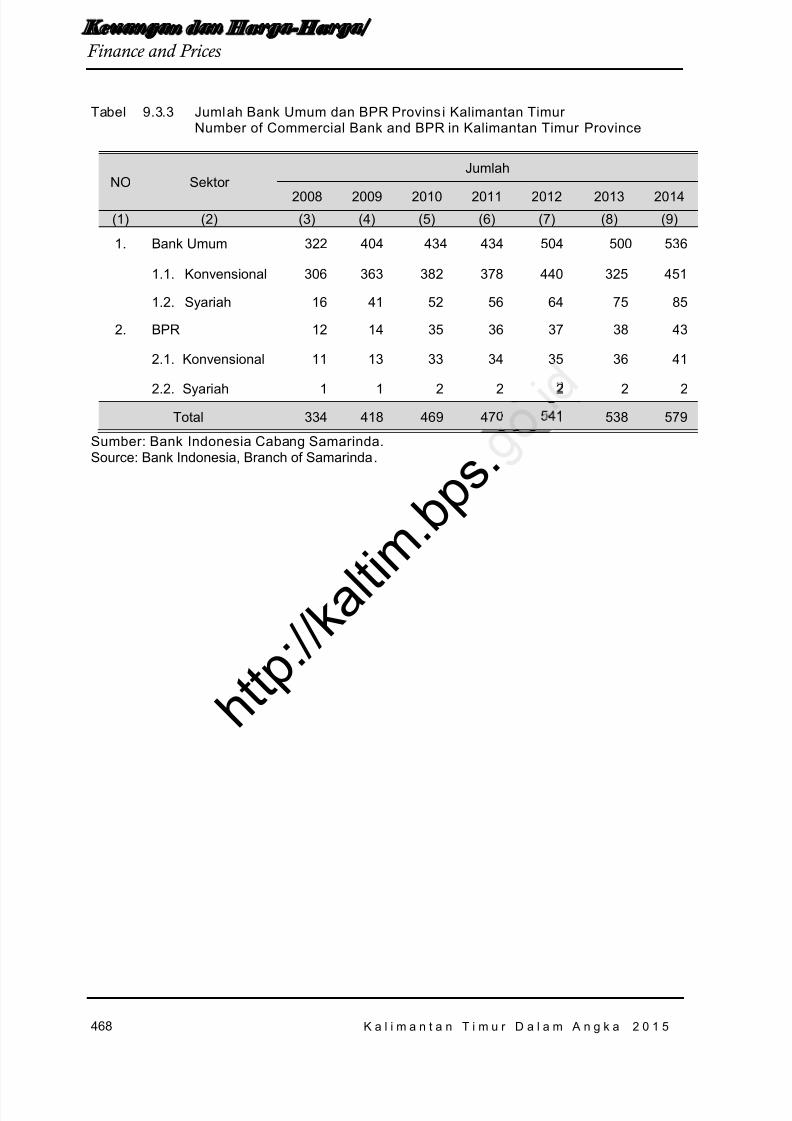
8/20/2019 Kalimantan Timur Dalam Angka Tahun 2015
http://slidepdf.com/reader/full/kalimantan-timur-dalam-angka-tahun-2015 534/623
468 K a l i m a n t a n T i m u r D a l a m A n g k a 2 0 1 5
Ke u a n g a n d a n Ha r g a -Ha r ga / Finance and Prices
Tabel 9.3.3 Jumlah Bank Umum dan BPR Provins i Kalimantan Timur Number of Commercial Bank and BPR in Kalimantan Timur Province
NO Sektor Jumlah
2008 2009 2010 2011 2012 2013 2014(1) (2) (3) (4) (5) (6) (7) (8) (9)
1. Bank Umum 322 404 434 434 504 500 536
1.1. Konvensional 306 363 382 378 440 325 451
1.2. Syariah 16 41 52 56 64 75 85
2. BPR 12 14 35 36 37 38 43
2.1. Konvensional 11 13 33 34 35 36 41
2.2. Syariah 1 1 2 2 2 2 2
Total 334 418 469 470 541 538 579
Sumber: Bank Indonesia Cabang Samarinda.Source: Bank Indonesia, Branch of Samarinda .
h t t p : / / k a l t i m
. b p s .
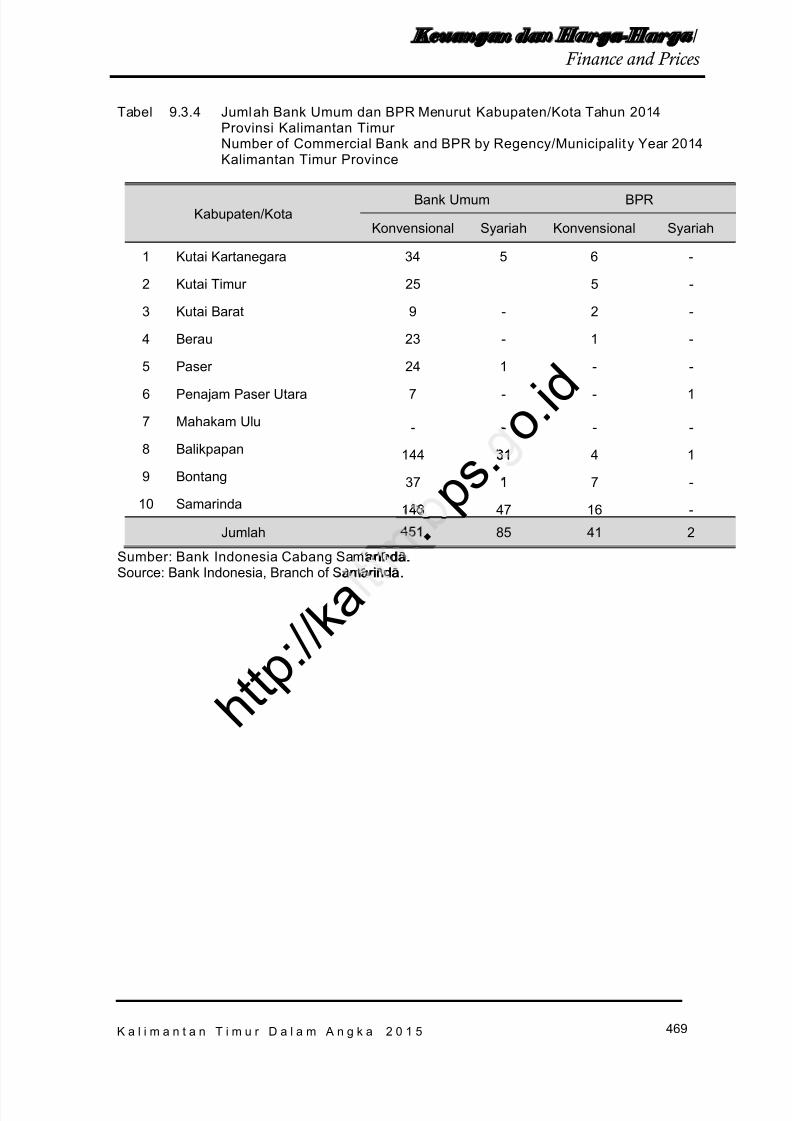
8/20/2019 Kalimantan Timur Dalam Angka Tahun 2015
http://slidepdf.com/reader/full/kalimantan-timur-dalam-angka-tahun-2015 535/623
469
K e u a n g a n d a n Ha r ga -Ha r ga / Finance and Prices
K a l i m a n t a n T i m u r D a l a m A n g k a 2 0 1 5
Tabel 9.3.4 Jumlah Bank Umum dan BPR Menurut Kabupaten/Kota Tahun 2014Provinsi Kalimantan TimurNumber of Commercial Bank and BPR by Regency/Municipality Year 2014Kalimantan Timur Province
Kabupaten/KotaBank Umum BPR
Konvensional Syariah Konvensional Syariah
1 Kutai Kartanegara 34 5 6 -
2 Kutai Timur 25 5 -
3 Kutai Barat 9 - 2 -
4 Berau 23 - 1 -
5 Paser 24 1 - -
6 Penajam Paser Utara 7 - - 1
7 Mahakam Ulu - - - -8 Balikpapan 144 31 4 19 Bontang 37 1 7 -
10 Samarinda 148 47 16 -
Jumlah 451 85 41 2
Sumber: Bank Indonesia Cabang Samarinda.
Source: Bank Indonesia, Branch of Samarinda .
p s . o
. i d31
48 .
h t t p : / / k a
arinda .
amarinda .
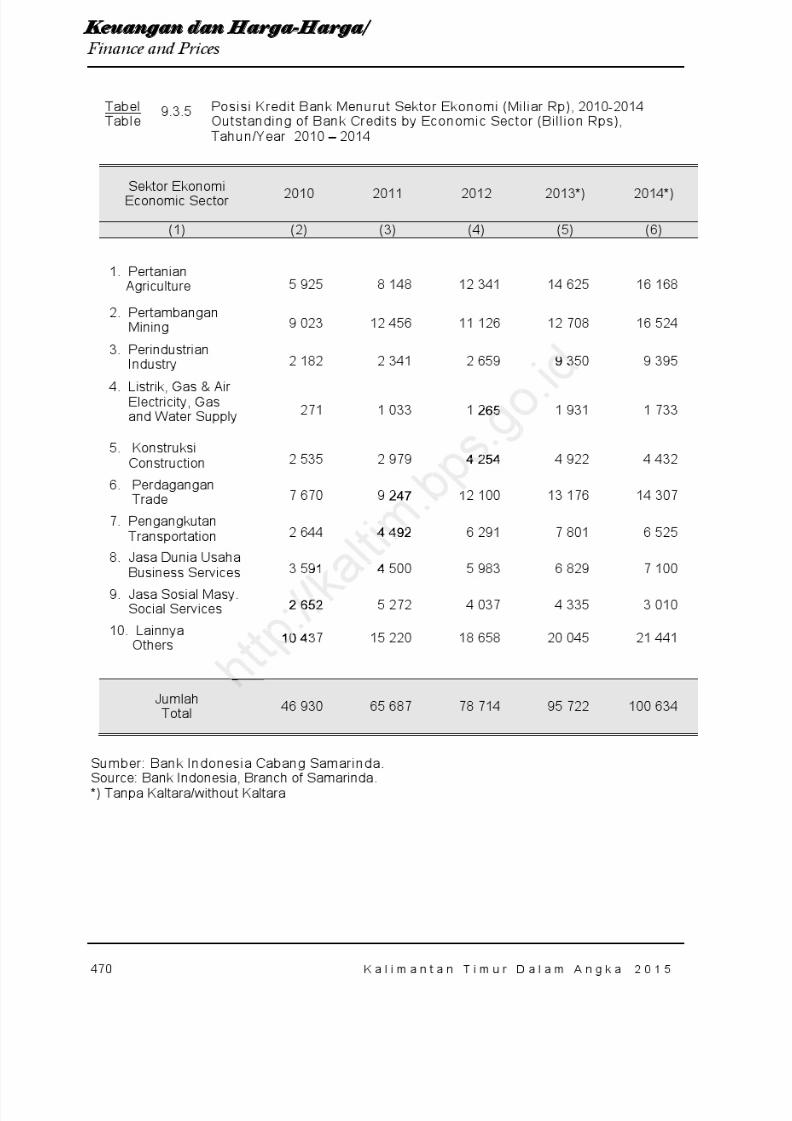
8/20/2019 Kalimantan Timur Dalam Angka Tahun 2015
http://slidepdf.com/reader/full/kalimantan-timur-dalam-angka-tahun-2015 536/623

8/20/2019 Kalimantan Timur Dalam Angka Tahun 2015
http://slidepdf.com/reader/full/kalimantan-timur-dalam-angka-tahun-2015 537/623
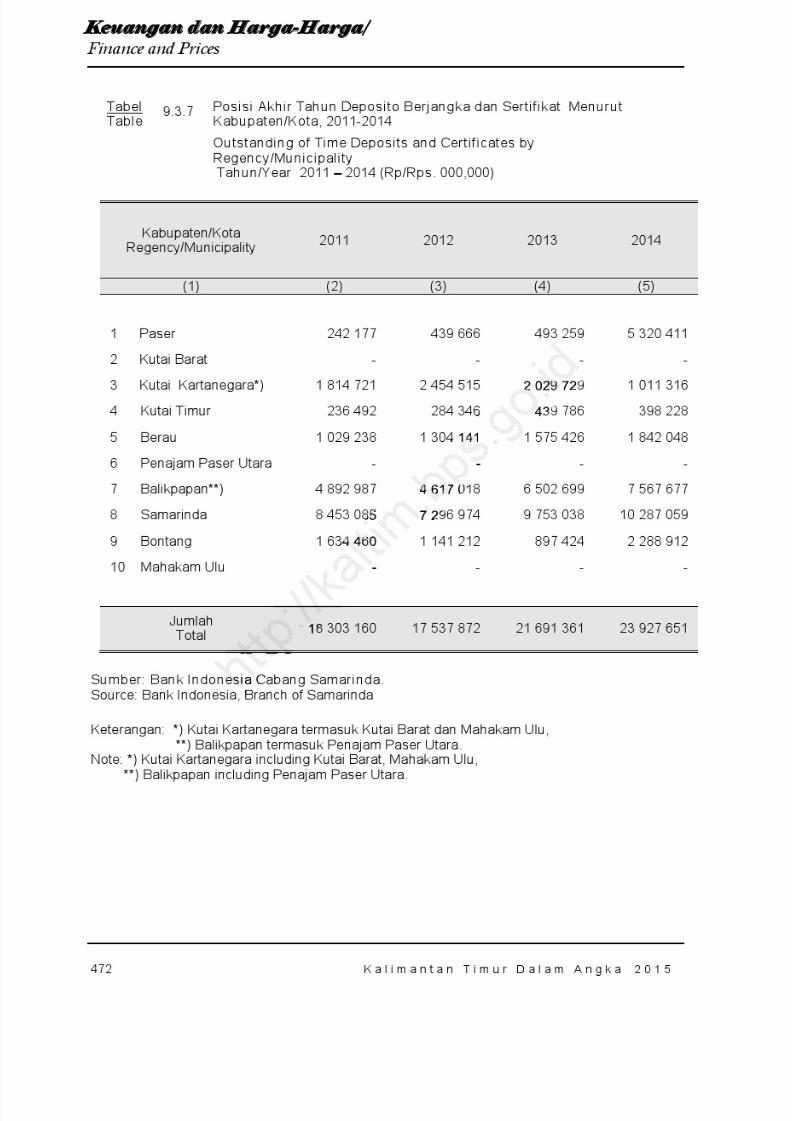
8/20/2019 Kalimantan Timur Dalam Angka Tahun 2015
http://slidepdf.com/reader/full/kalimantan-timur-dalam-angka-tahun-2015 538/623
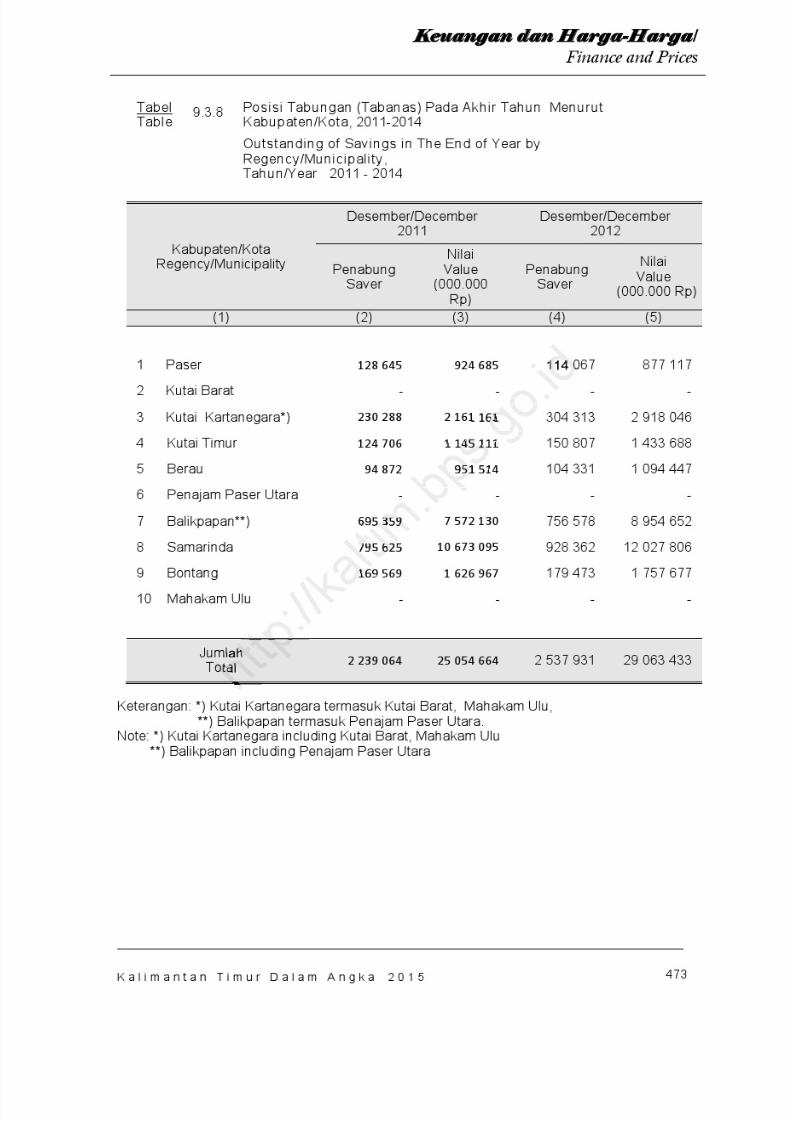
8/20/2019 Kalimantan Timur Dalam Angka Tahun 2015
http://slidepdf.com/reader/full/kalimantan-timur-dalam-angka-tahun-2015 539/623
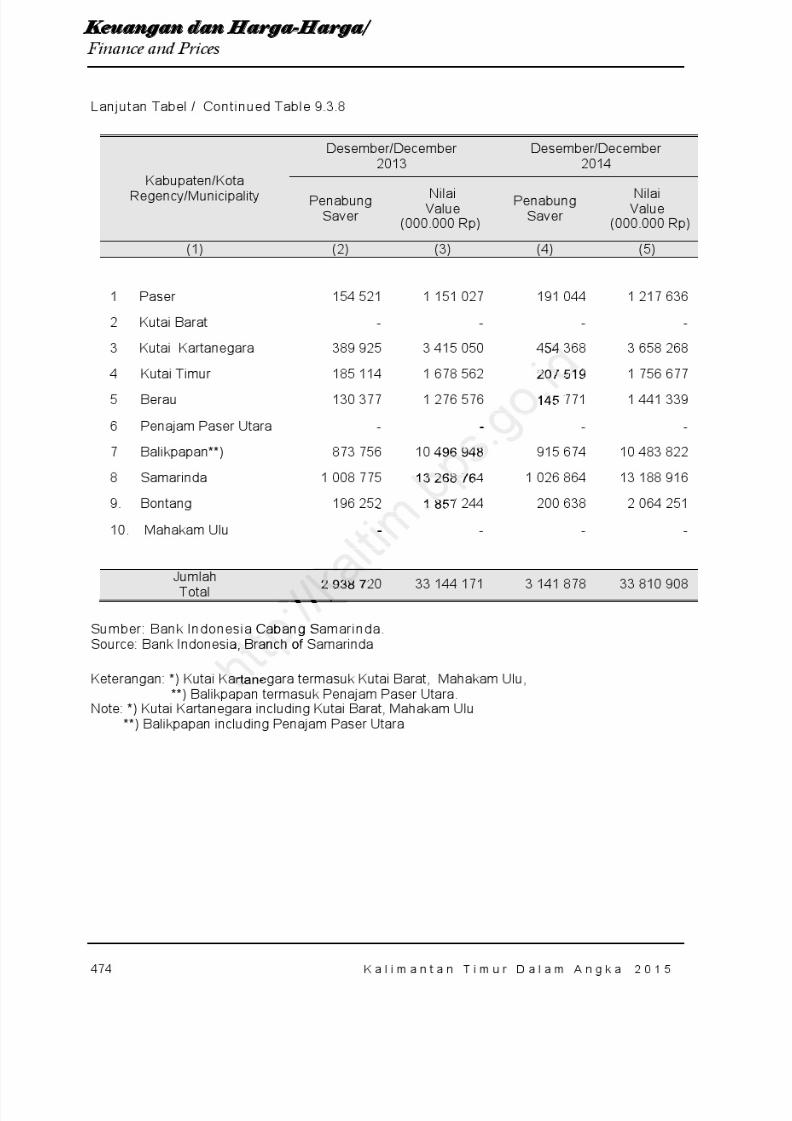
8/20/2019 Kalimantan Timur Dalam Angka Tahun 2015
http://slidepdf.com/reader/full/kalimantan-timur-dalam-angka-tahun-2015 540/623

8/20/2019 Kalimantan Timur Dalam Angka Tahun 2015
http://slidepdf.com/reader/full/kalimantan-timur-dalam-angka-tahun-2015 541/623
475
K e u a n g a n d a n Ha r ga -Ha r ga / Finance and Prices
K a l i m a n t a n T i m u r D a l a m A n g k a 2 0 1 5
TabelTable
9.4.1 Banyaknya Koperasi dan Kegiatannya, 2011-2014
Number of Cooperatives and Their Act iviti es,Tahun/Year 2011 - 2014
UraianDescription 2011 2012 2013 2014
(1) (3) (4) (5) (6)
1. Jumlah Koperasi Number of
Cooperatives
5 128 6 140 5 184 5 283
2. Anggota KoperasiMember of
Cooperatives
411 426 428 296 340 076 344 310
3. Volume Usaha Business Volume (000 000 Rp)
1 952 400 2 005 193 1607 129 2298 383
4. Modal – Capital 1)
(000 000 Rp)2 143 102 1 292 566 1 594 685 2016 352
5. Dana-dana – Funds (000 000 Rp)
- - - -
6. Sisa Hasil Usaha Surplus (000 000 Rp)
90 002 168 577 116 863 133 415
7. Cadangan – Reserve (000 000 Rp)
- - - -
Sumber: Dinas Perindust rian, Perdagangan dan Koperasi PPKM Provinsi Kaltim.Source: Regional Office of Industry, Trade and Cooperative of Kalimantan Timur Province.Keterangan: 1) Terdiri dari Modal Sendiri dan Modal Luar.Note: 1) Consisting of its own capital and outside capital
.
. .
h
rian, Pero n us r
ri dari Moo s own
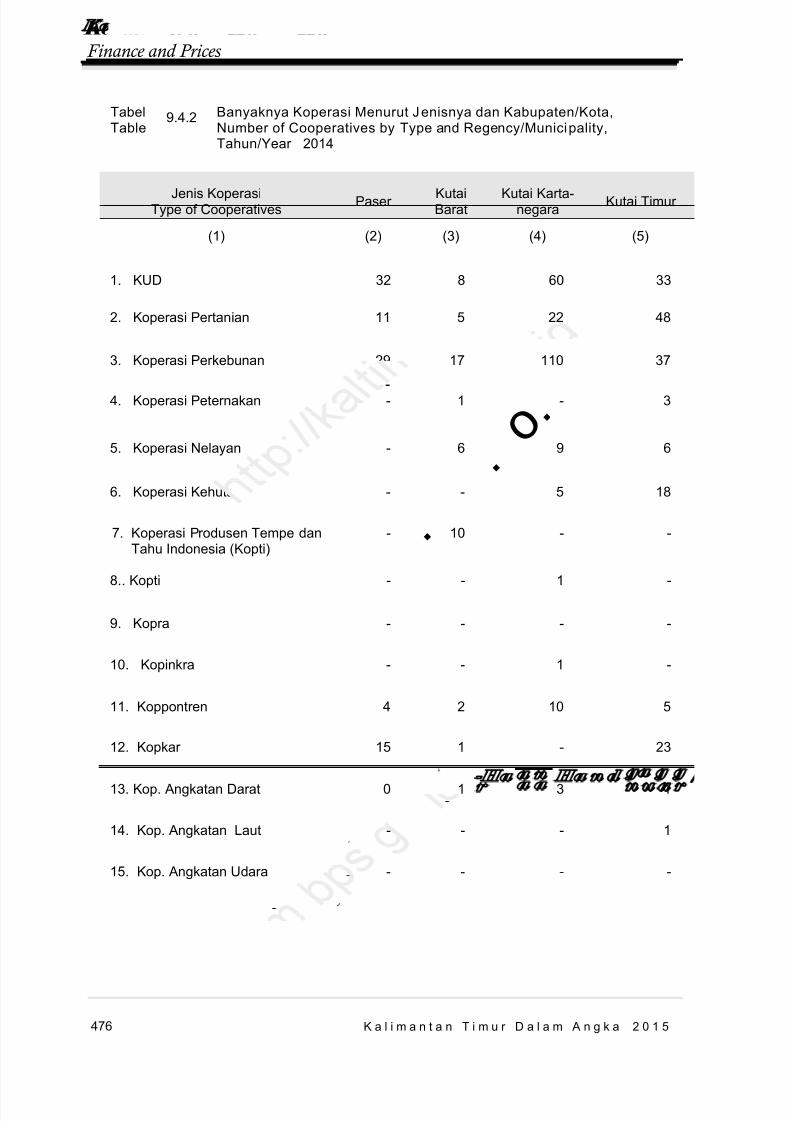
8/20/2019 Kalimantan Timur Dalam Angka Tahun 2015
http://slidepdf.com/reader/full/kalimantan-timur-dalam-angka-tahun-2015 542/623
476 K a l i m a n t a n T i m u r D a l a m A n g k a 2 0 1 5
Ke u a n g a n d a n Ha r g a -Ha r ga / Finance and Prices
TabelTable
9.4.2 Banyaknya Koperasi Menurut J enisnya dan Kabupaten/Kota,Number of Cooperatives by Type and Regency/Municipality,Tahun/ Year 2014
Jenis KoperasiType of Cooperatives Paser Kutai
BaratKutai Karta-
negara Kutai Timur
(1) (2) (3) (4) (5)
1. KUD 32 8 60 33
2. Koperasi Pertanian 11 5 22 48
3. Koperasi Perkebunan 29 17 110 37
4. Koperasi Peternakan - 1 - 3
5. Koperasi Nelayan - 6 9 6
6. Koperasi Kehutanan - - 5 18
7. Koperasi Produsen Tempe dan Tahu Indonesia (Kopti)
- 10 - -
8.. Kopti - - 1 -
9. Kopra - - - -
10. Kopinkra - - 1 -
11. Koppontren 4 2 10 5
12. Kopkar 15 1 - 23
13. Kop. Angkatan Darat 0 1 3 1
14. Kop. Angkatan Laut - - - 1
15. Kop. Angkatan Udara - - - -
o . . .
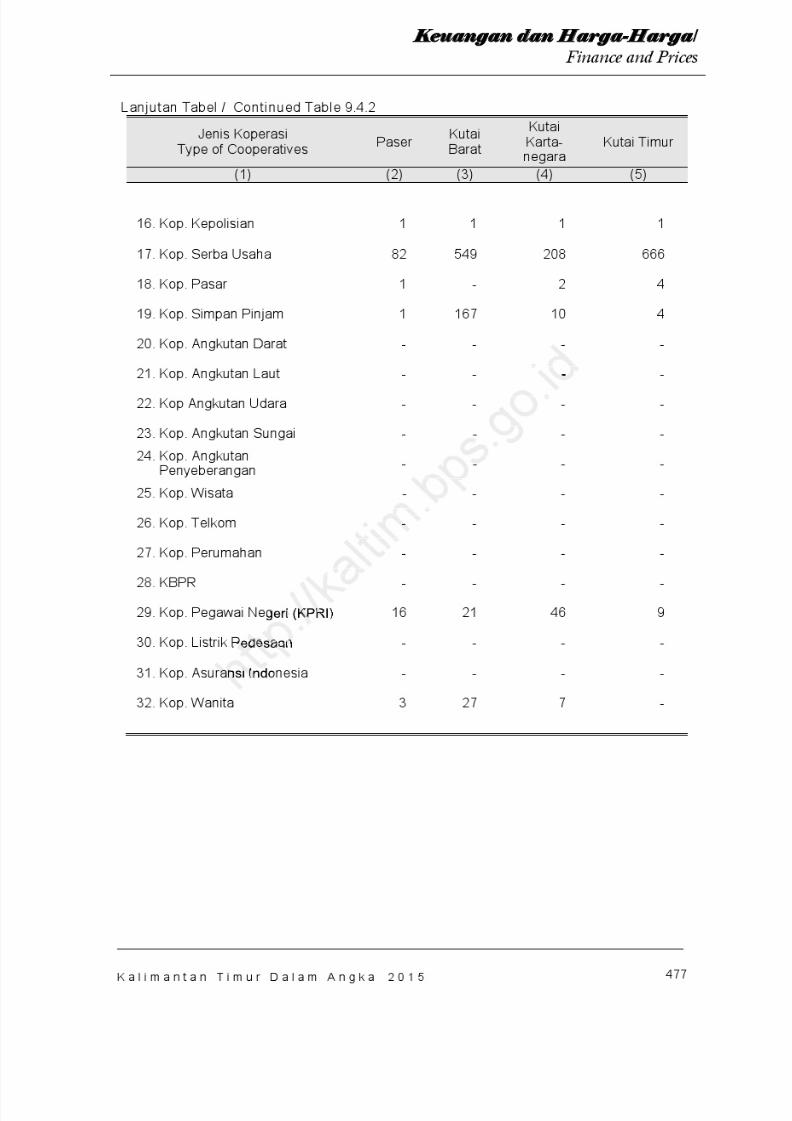
8/20/2019 Kalimantan Timur Dalam Angka Tahun 2015
http://slidepdf.com/reader/full/kalimantan-timur-dalam-angka-tahun-2015 543/623
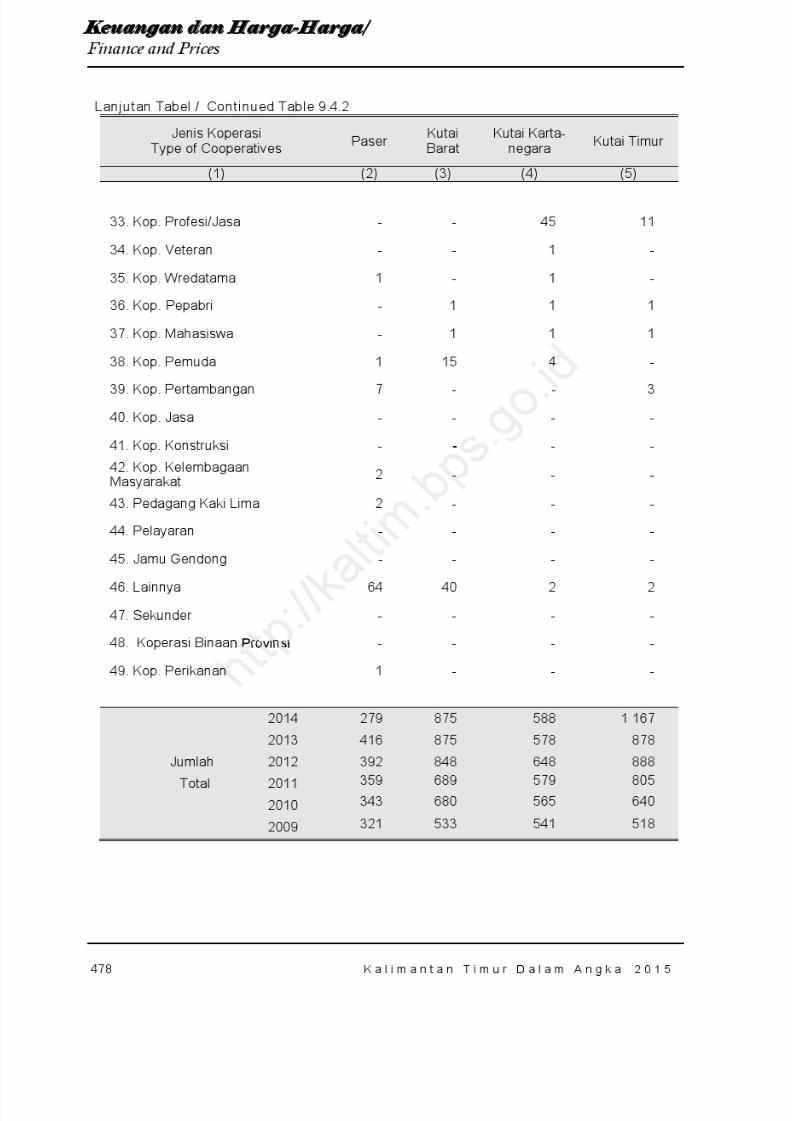
8/20/2019 Kalimantan Timur Dalam Angka Tahun 2015
http://slidepdf.com/reader/full/kalimantan-timur-dalam-angka-tahun-2015 544/623
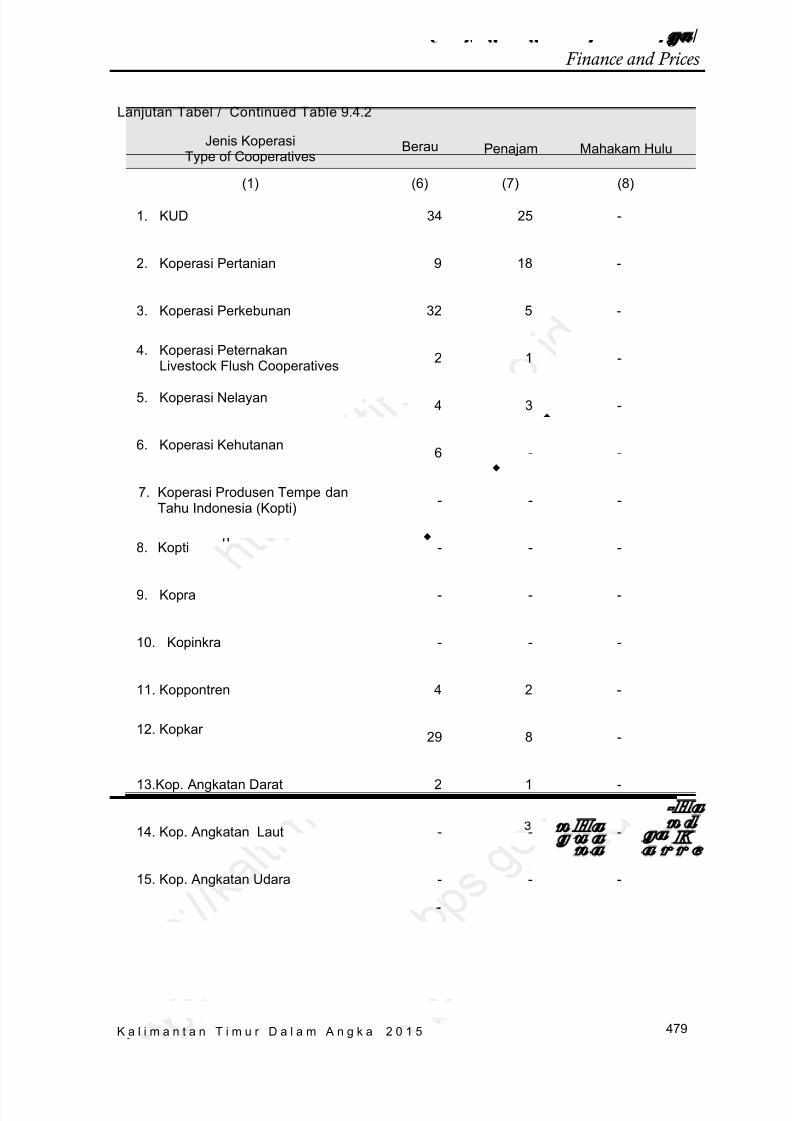
8/20/2019 Kalimantan Timur Dalam Angka Tahun 2015
http://slidepdf.com/reader/full/kalimantan-timur-dalam-angka-tahun-2015 545/623
479
K e u a n g a n d a n Ha r ga -Ha r ga / Finance and Prices
K a l i m a n t a n T i m u r D a l a m A n g k a 2 0 1 5
Lanjutan Tabel / Continued Table 9.4.2
Jenis KoperasiType of Cooperatives
Berau Penajam Mahakam Hulu
(1) (6) (7) (8)
1. KUD 34 25 -
2. Koperasi Pertanian 9 18 -
3. Koperasi Perkebunan 32 5 -
4. Koperasi Peternakan Livestock Flush Cooperatives 2 1 -
5. Koperasi Nelayan 4 3 -
6. Koperasi Kehutanan 6 - -
7. Koperasi Produsen Tempe dan Tahu Indonesia (Kopti) - - -
8. Kopti - - -
9. Kopra - - -
10. Kopinkra - - -
11. Koppontren 4 2 -
12. Kopkar 29 8 -
13.Kop. Angkatan Darat 2 1 -
14. Kop. Angkatan Laut - - -
15. Kop. Angkatan Udara - - -
. .
.

8/20/2019 Kalimantan Timur Dalam Angka Tahun 2015
http://slidepdf.com/reader/full/kalimantan-timur-dalam-angka-tahun-2015 546/623
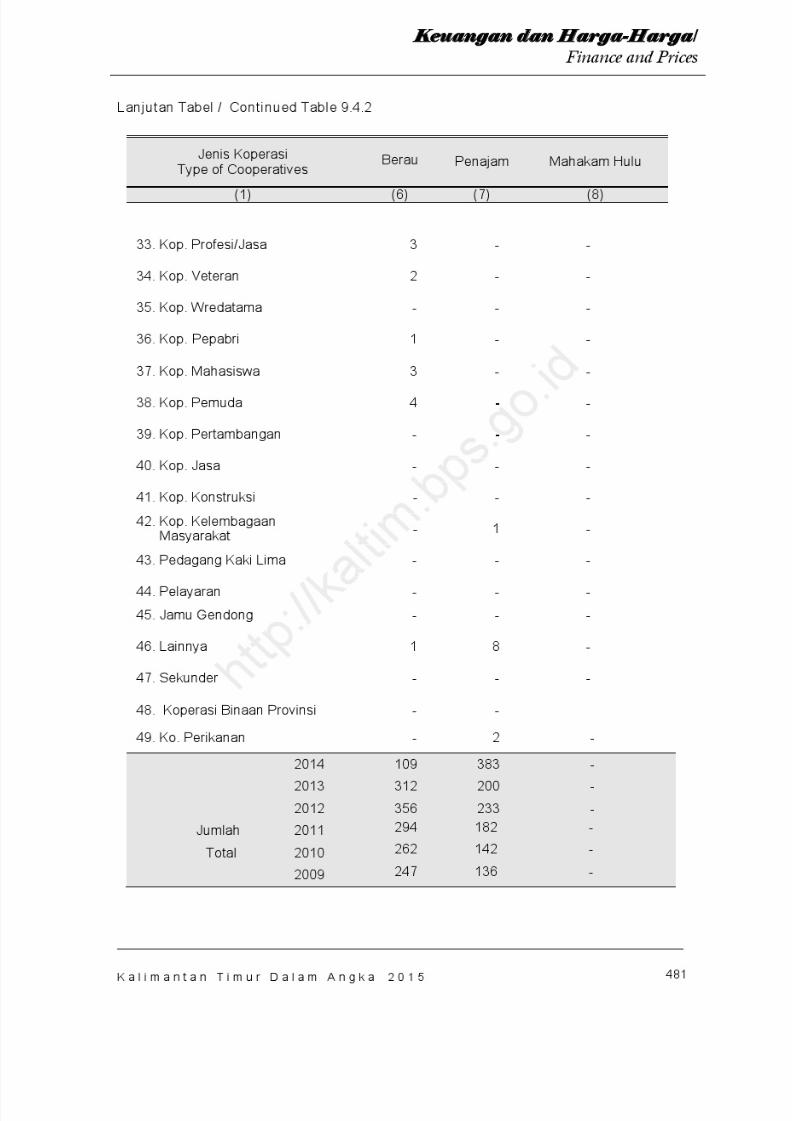
8/20/2019 Kalimantan Timur Dalam Angka Tahun 2015
http://slidepdf.com/reader/full/kalimantan-timur-dalam-angka-tahun-2015 547/623
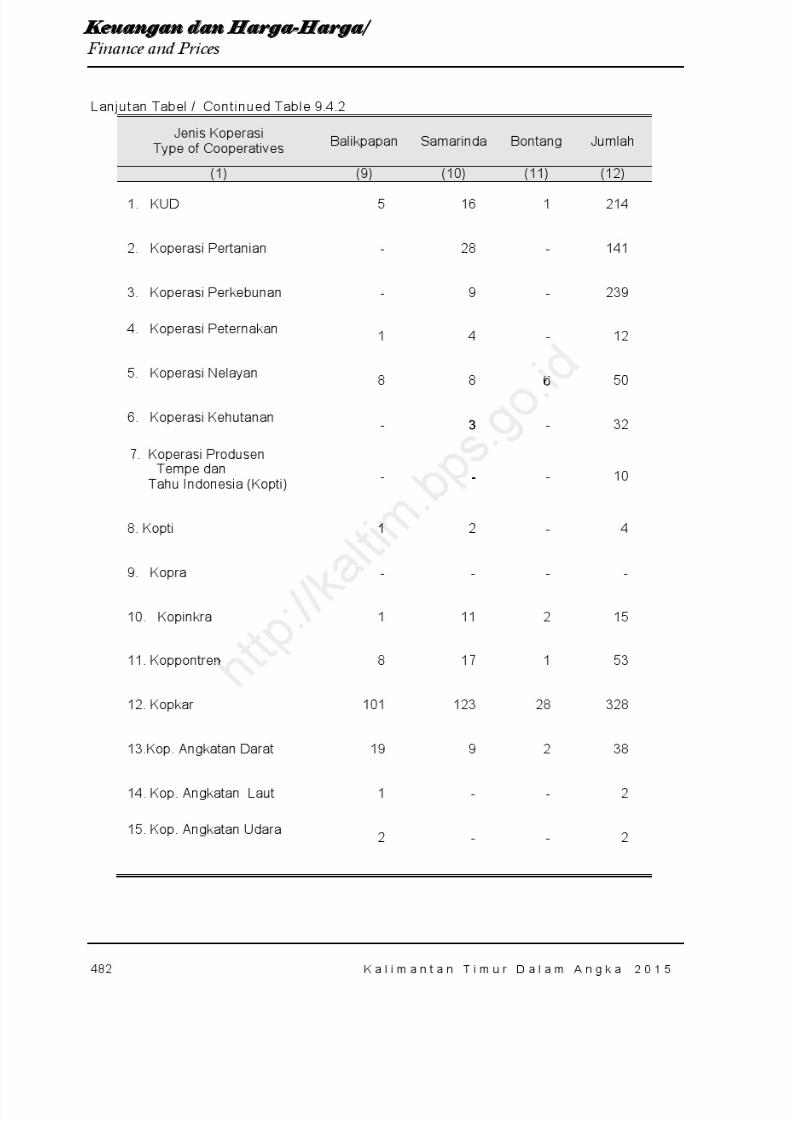
8/20/2019 Kalimantan Timur Dalam Angka Tahun 2015
http://slidepdf.com/reader/full/kalimantan-timur-dalam-angka-tahun-2015 548/623
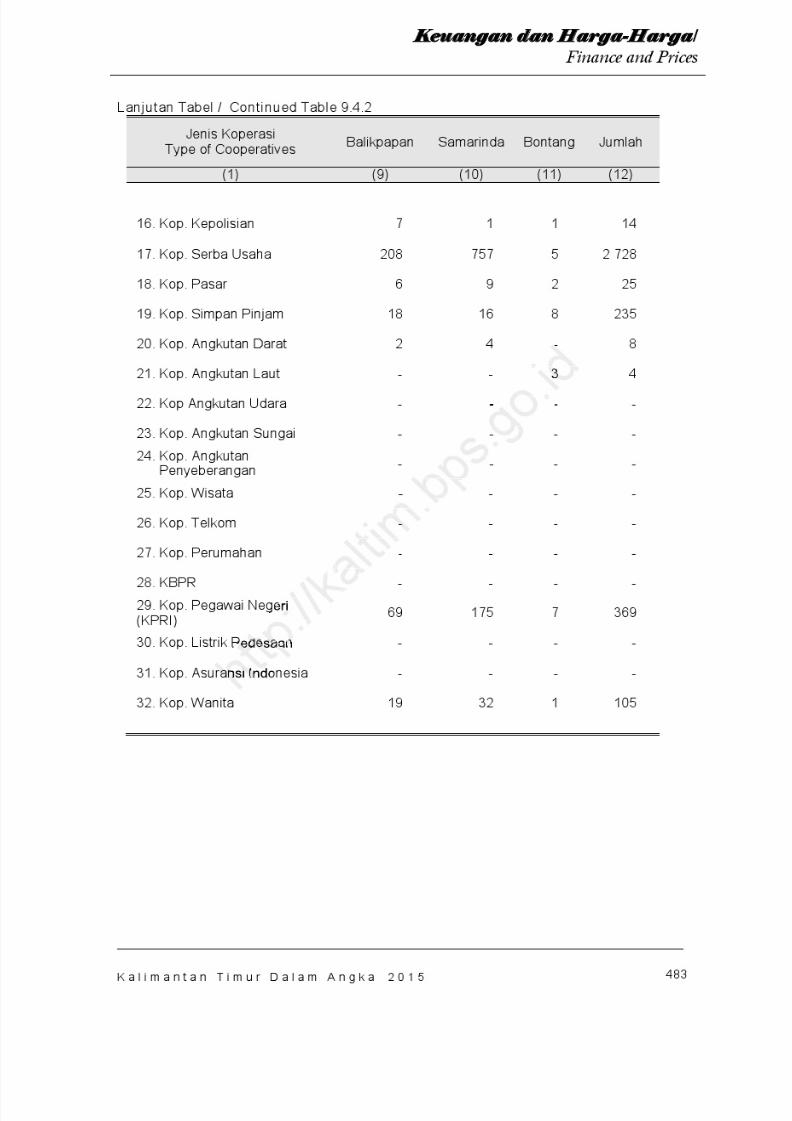
8/20/2019 Kalimantan Timur Dalam Angka Tahun 2015
http://slidepdf.com/reader/full/kalimantan-timur-dalam-angka-tahun-2015 549/623

8/20/2019 Kalimantan Timur Dalam Angka Tahun 2015
http://slidepdf.com/reader/full/kalimantan-timur-dalam-angka-tahun-2015 550/623
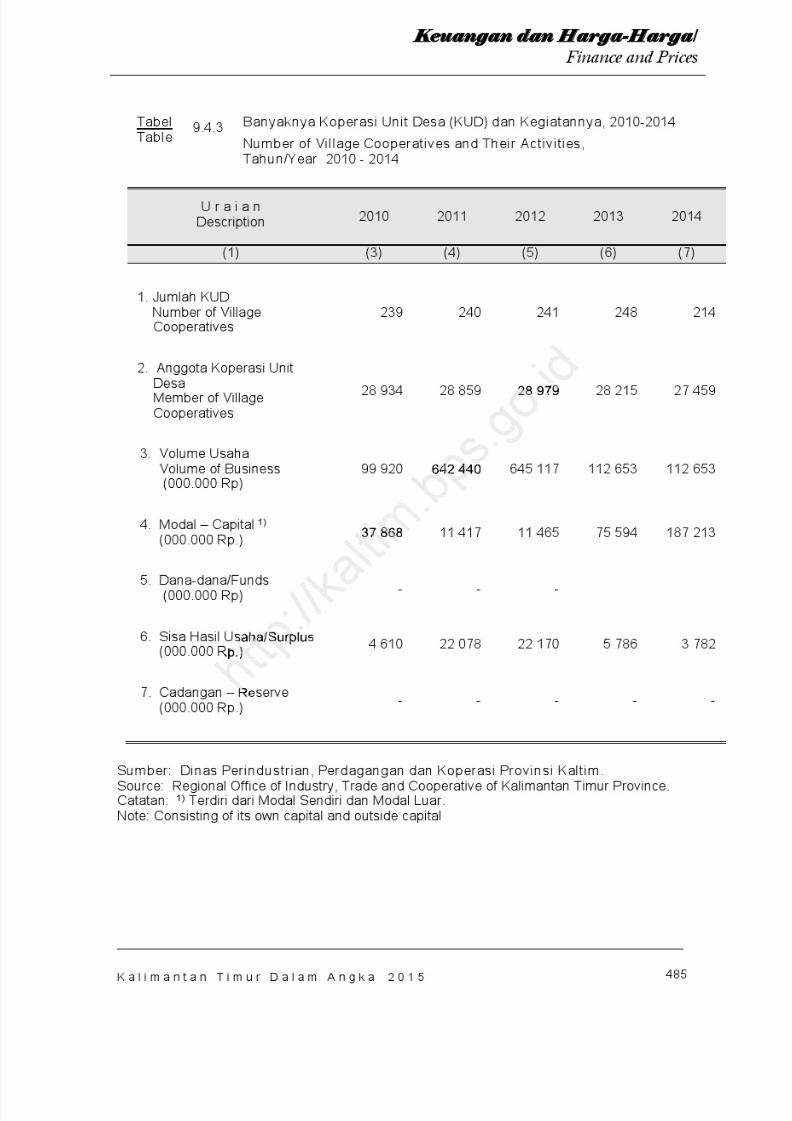
8/20/2019 Kalimantan Timur Dalam Angka Tahun 2015
http://slidepdf.com/reader/full/kalimantan-timur-dalam-angka-tahun-2015 551/623
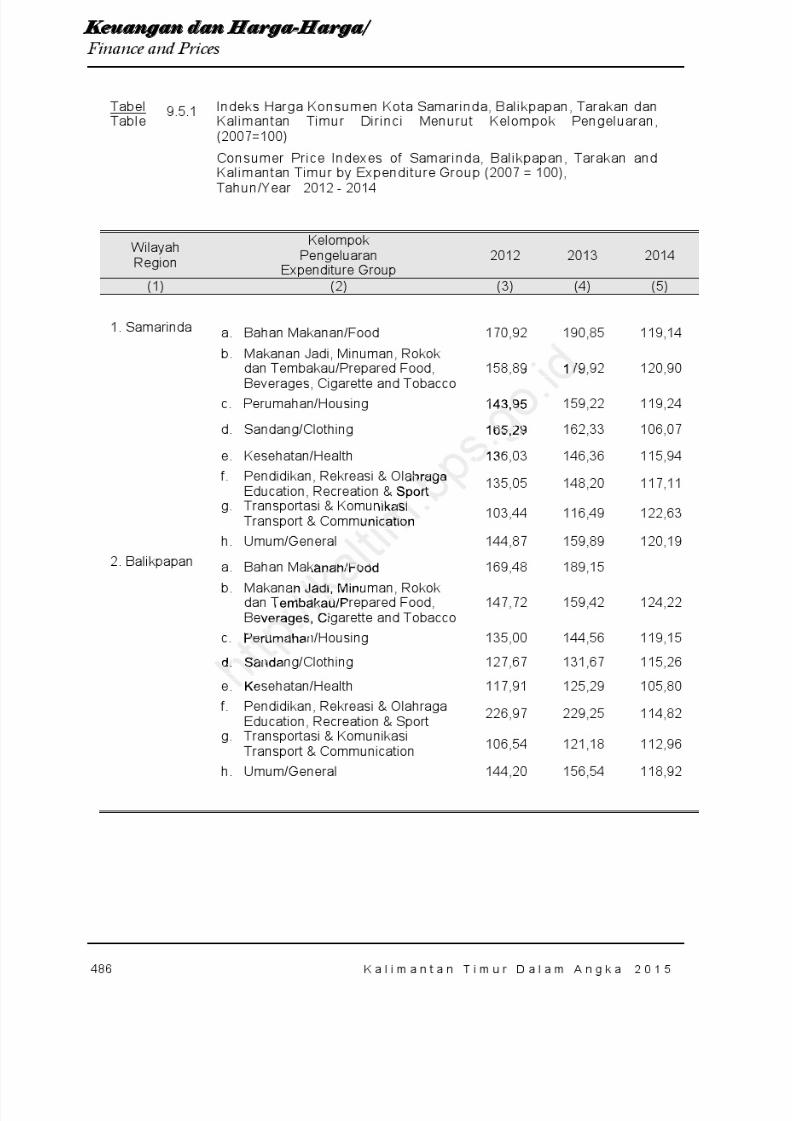
8/20/2019 Kalimantan Timur Dalam Angka Tahun 2015
http://slidepdf.com/reader/full/kalimantan-timur-dalam-angka-tahun-2015 552/623
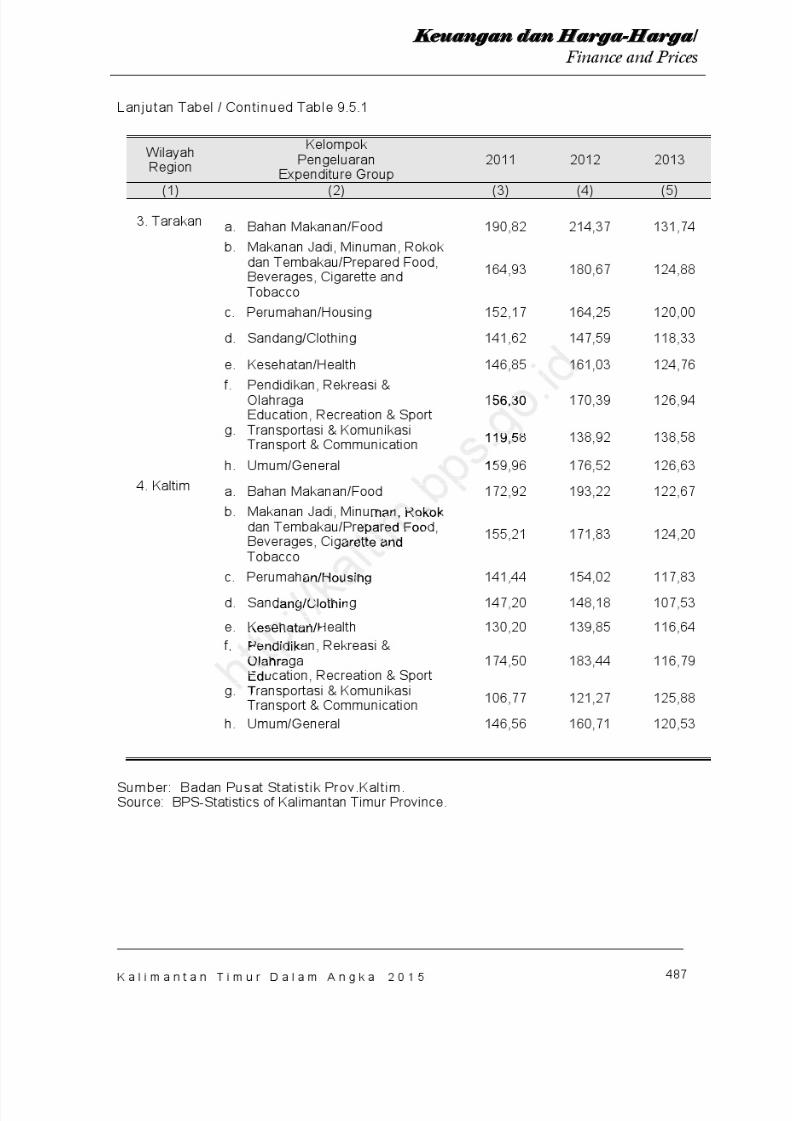
8/20/2019 Kalimantan Timur Dalam Angka Tahun 2015
http://slidepdf.com/reader/full/kalimantan-timur-dalam-angka-tahun-2015 553/623
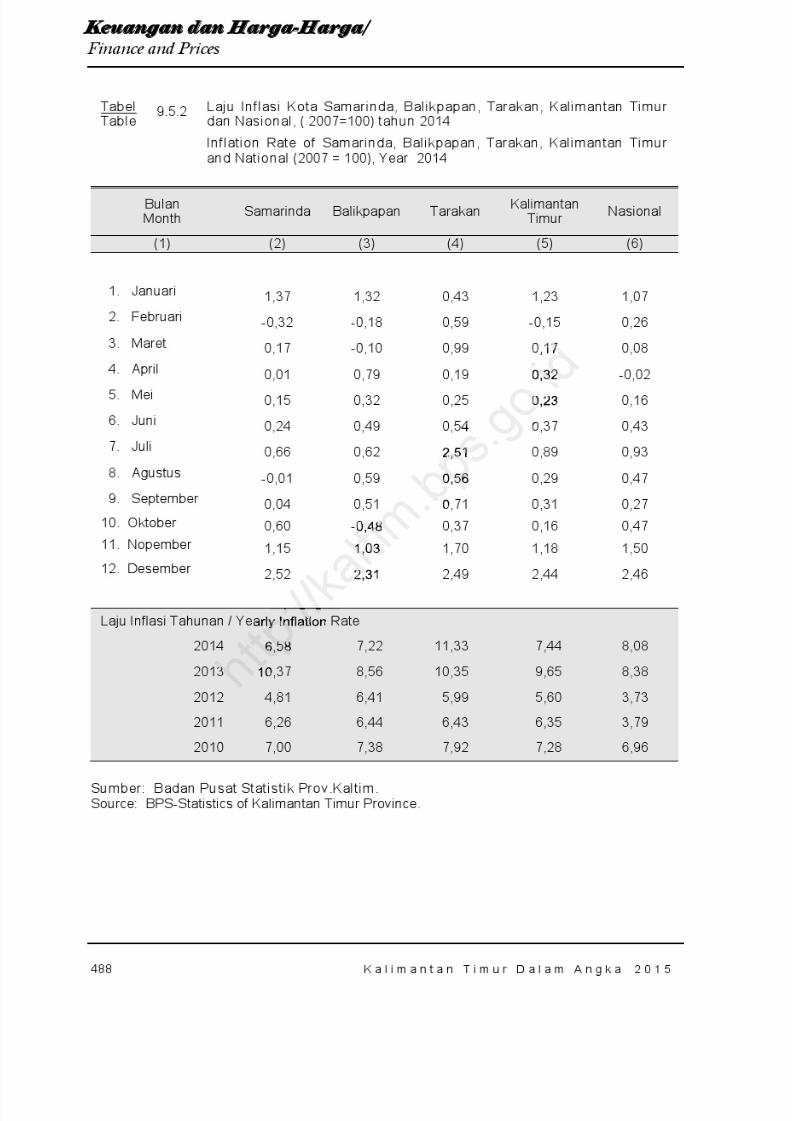
8/20/2019 Kalimantan Timur Dalam Angka Tahun 2015
http://slidepdf.com/reader/full/kalimantan-timur-dalam-angka-tahun-2015 554/623

8/20/2019 Kalimantan Timur Dalam Angka Tahun 2015
http://slidepdf.com/reader/full/kalimantan-timur-dalam-angka-tahun-2015 555/623
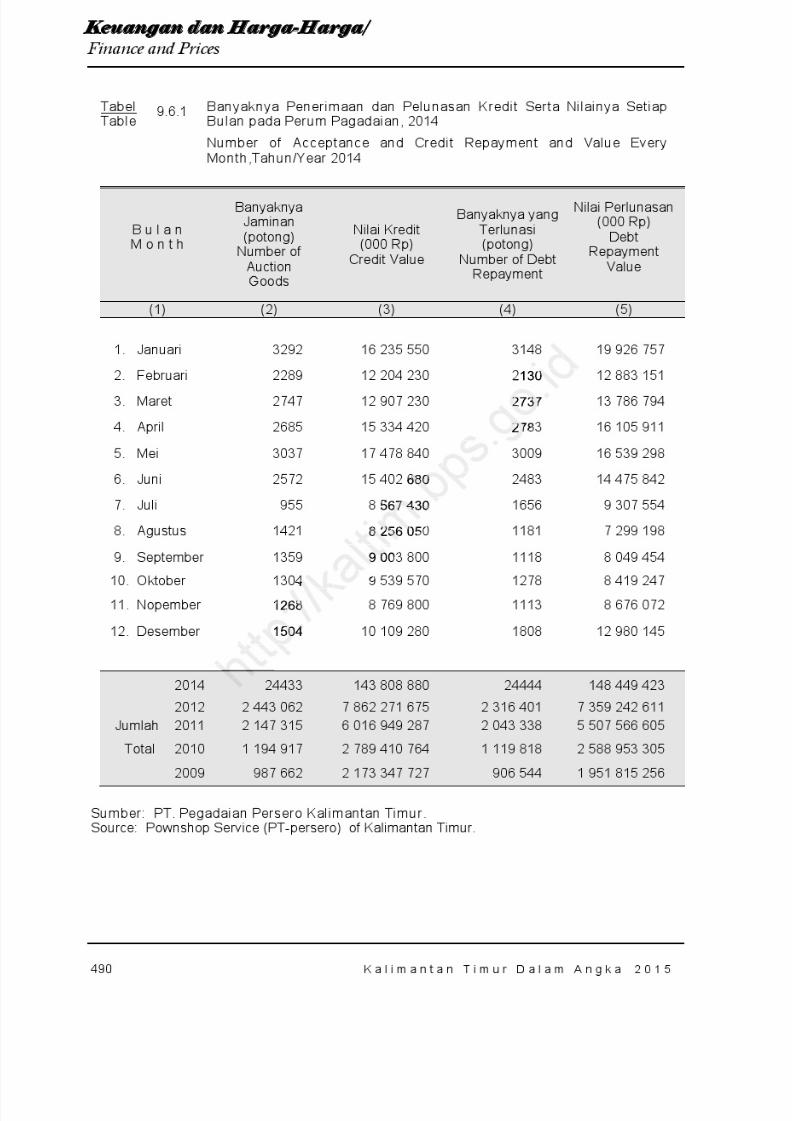
8/20/2019 Kalimantan Timur Dalam Angka Tahun 2015
http://slidepdf.com/reader/full/kalimantan-timur-dalam-angka-tahun-2015 556/623
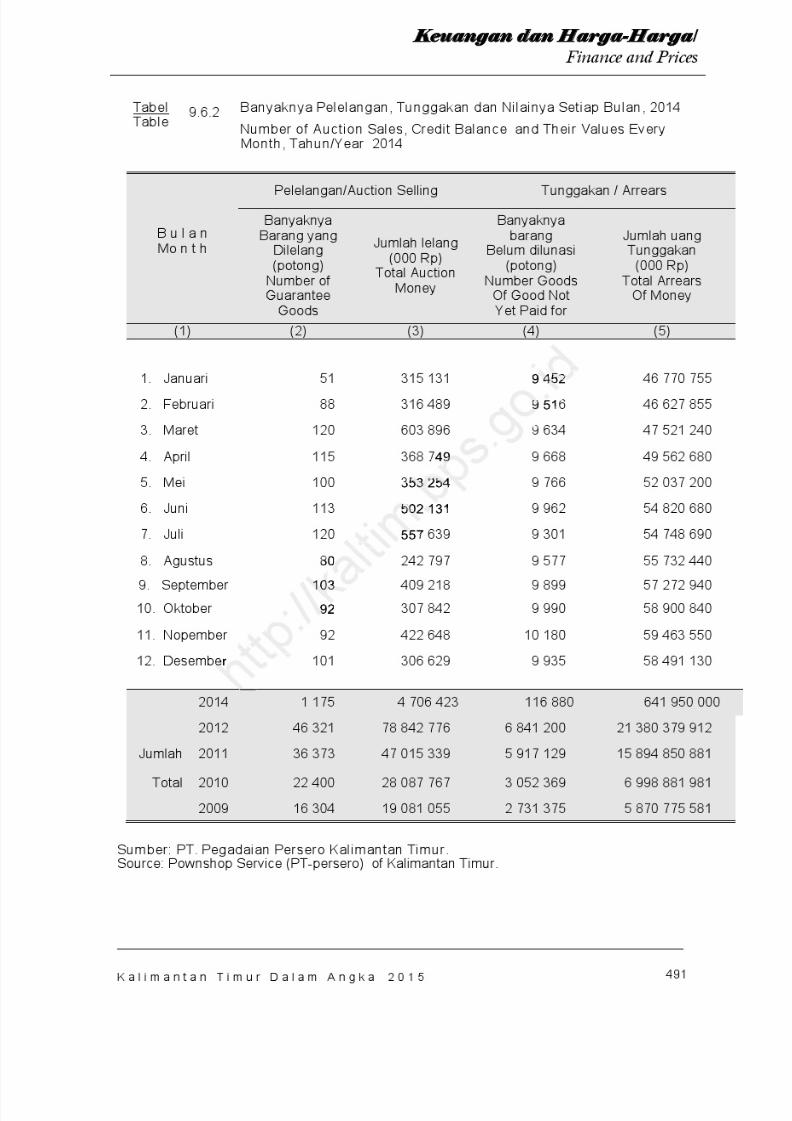
8/20/2019 Kalimantan Timur Dalam Angka Tahun 2015
http://slidepdf.com/reader/full/kalimantan-timur-dalam-angka-tahun-2015 557/623

8/20/2019 Kalimantan Timur Dalam Angka Tahun 2015
http://slidepdf.com/reader/full/kalimantan-timur-dalam-angka-tahun-2015 558/623
h t t p : / / k a l t i m
. b p s . g o . i d
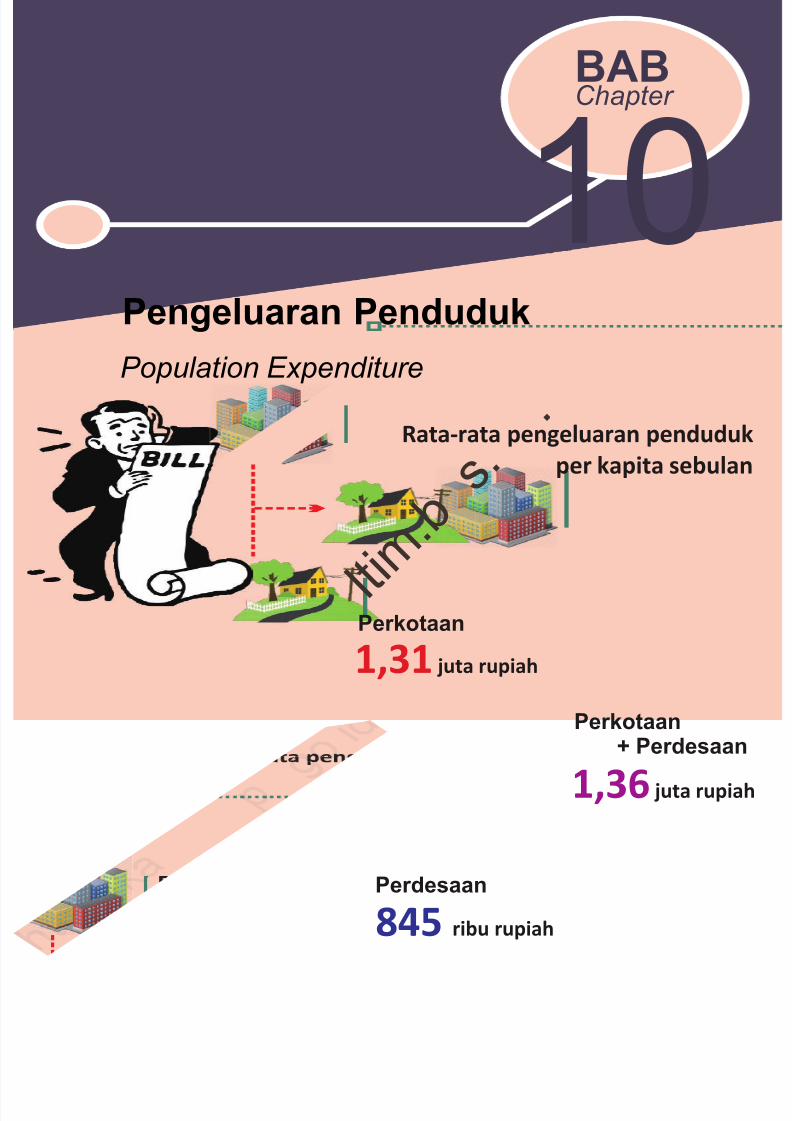
8/20/2019 Kalimantan Timur Dalam Angka Tahun 2015
http://slidepdf.com/reader/full/kalimantan-timur-dalam-angka-tahun-2015 559/623
10Pengeluaran Penduduk
BABChapter
Population Expenditure
Rata-rata pengeluaran pendudukper kapita sebulan
1,31 juta rupiah
Perkotaan
845 ribu rupiah
Perdesaan
1,36 juta rupiah
Perkotaan + Perdesaan
l t i m . b
s . .

8/20/2019 Kalimantan Timur Dalam Angka Tahun 2015
http://slidepdf.com/reader/full/kalimantan-timur-dalam-angka-tahun-2015 560/623
h t t p : / / k a l t i m
. b p s . g o . i d
8/20/2019 Kalimantan Timur Dalam Angka Tahun 2015
http://slidepdf.com/reader/full/kalimantan-timur-dalam-angka-tahun-2015 561/623
495
Pengeluaran Penduduk /
Population Expenditure
K a l i m a n t a n T i m u r D a l a m A n g k a 2 0 1 5
10. PENGELUARAN
PENDUDUK
Pada tahun 2014, sebagianbesar pengeluaran penduduk diKalimantan Timur digunakan untukmemenuhi kebutuhan konsumsibukan makanan seperti perumahan,sandang, aneka barang dan jasa, danlain-lain sedang selebihnyakonsumsi makanan. Hal ini dapatdilihat dari persentase pengeluaranpenduduk untuk makanan sebesar44,78 persen, sedangkanpengeluaran untuk non makananyang sebesar 55,22 persen.
Berdasarkan area, secara umumtingkat pengeluaran penduduk
perkotaan jauh lebih tinggidibanding penduduk pedesaan. Diperkotaan rata-rata pengeluaranper kapita sebulan sebesar1.307.385 rupiah sedangkan dipedesaan hanya sekitar 845.633rupiah. Sementara rata-ratapengeluaran per kapita sebulanuntuk daerah perkotaan danpedesaan mencapai 1.136.172rupiah, dengan rincian 508.801rupiah untuk konsumsi makanandan 627.372 rupiah untuk konsumsibukan makanan.
10. POPULATION
EXPENDITURE
In 2014, most consumption ofthe population in Kalimantan Timur(include Kalimantan Utara) is used for consumption needs non-foodsuch as housing, clothing,miscellaneous goods and services,and others. It can be seen from the percentage of the population for
food consumption reached 44.78 percent, while expenditures non- food consumption about 55.22 percent.
In general, average percapita monthly expenditure in urbanareas was higher than rural areas.The average per capita monthlyexpenditure in urban areas was1 ,307,385 rupiahs while in ruralareas was 845,633 rupiahs. Theaverage per capita monthlyexpenditure for both areas was1,136,172 rupiahs, where 508,801
rupiahs for food consumption and627,372 rupiahs for non-foodconsumption
. b p s .
.
uk
inggisaan..engelua
an sse an
a se itmentar
e
ptiohile e
consumen .
8/20/2019 Kalimantan Timur Dalam Angka Tahun 2015
http://slidepdf.com/reader/full/kalimantan-timur-dalam-angka-tahun-2015 562/623
496
Pengeluaran Penduduk /
Population Expenditure
K a l i m a n t a n T i m u r D a l a m A n g k a 2 0 1 5
Dari total pengeluaran tahun2014 untuk konsumsi makanan24,51 persen digunakan untukkonsumsi makanan dan minuman jadi; 11,34 persen digunakan untukkonsumsi padi-padian; dan 64,15persen untuk konsumsi lainnya.Sedangkan pengeluaran konsumsibukan makanan terutamadigunakan untuk perumahan, bahanbakar penerangan dan air sebesar47,13 persen dan aneka barang/jasa
sebesar 35,12 persen.
The consumption in 2014 for prepared food and drink inclinedincreased to 24.51 percent of total food expenditure, while 11.34 percent for cereals/rice and 64.15 percent for other consumption. Onthe other hand, usage mainexpenditure of non-food used forhousing, fuel, lamp and water 47.13 percent and 35.12 percent for goodsand services.
h t t p : / / k a l t i m
. b p s . g o . i d
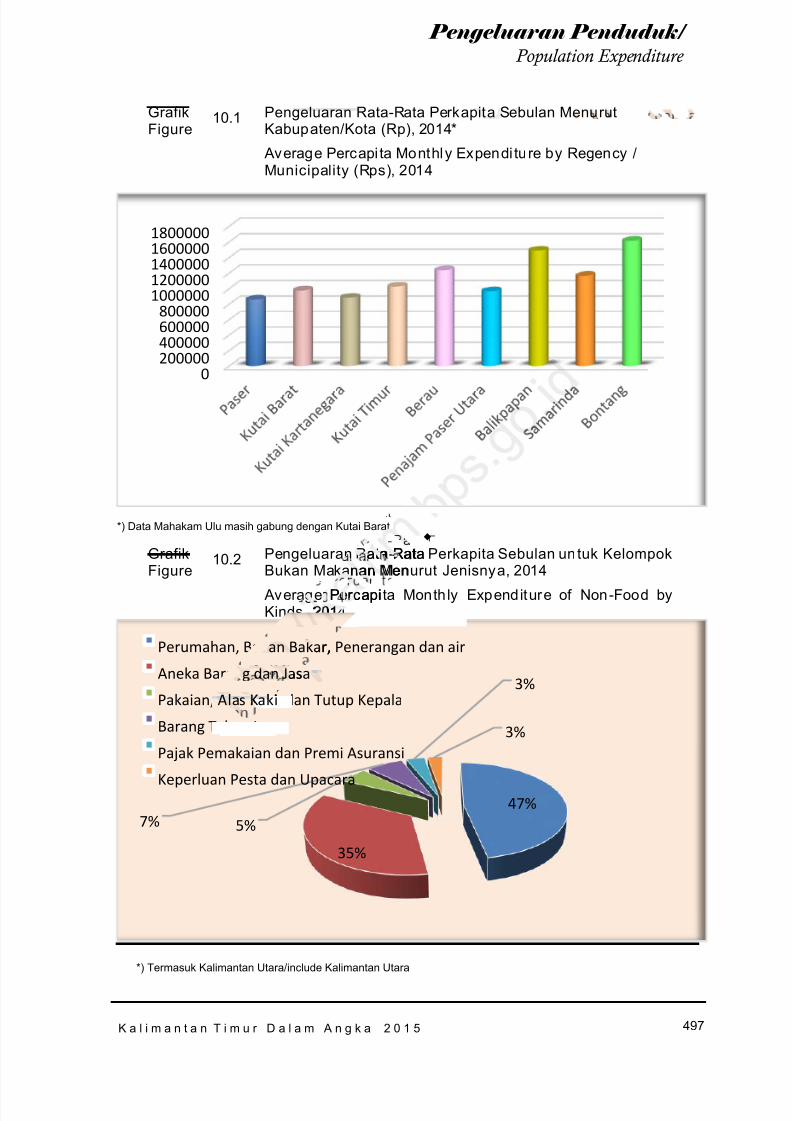
8/20/2019 Kalimantan Timur Dalam Angka Tahun 2015
http://slidepdf.com/reader/full/kalimantan-timur-dalam-angka-tahun-2015 563/623
497
Pengeluaran Penduduk /
Population Expenditure
K a l i m a n t a n T i m u r D a l a m A n g k a 2 0 1 5
GrafikFigure
10.1 Pengeluaran Rata-Rata Perkapita Sebulan MenurutKabupaten/Kota (Rp), 2014*
Average Percapi ta Monthly Expendi tu re by Regency /Municipality (Rps), 2014
*) Data Mahakam Ulu masih gabung dengan Kutai Barat
Grafik
Figure10.2 Pengeluaran Rata-Rata Perkapita Sebulan un tuk Kelompok
Bukan Makanan Menurut Jenisnya, 2014 Average Percapi ta Monthly Expenditure of Non-Food byKinds, 2014
*) Termasuk Kalimantan Utara/ include Kalimantan Utara
0200000400000600000800000
10000001200000140000016000001800000
47%
35%
5%7%
3%
3%
Perumahan, Bahan Bakar, Penerangan dan air
Aneka Barang dan Jasa
Pakaian, Alas Kaki, dan Tutup Kepala
Barang Tahan Lama
Pajak Pemakaian dan Premi Asuransi
Keperluan Pesta dan Upacara
.
ataa Rata
nan Men Percapi
, 201
an Bakar,
g dan Jas
Alas Kaki
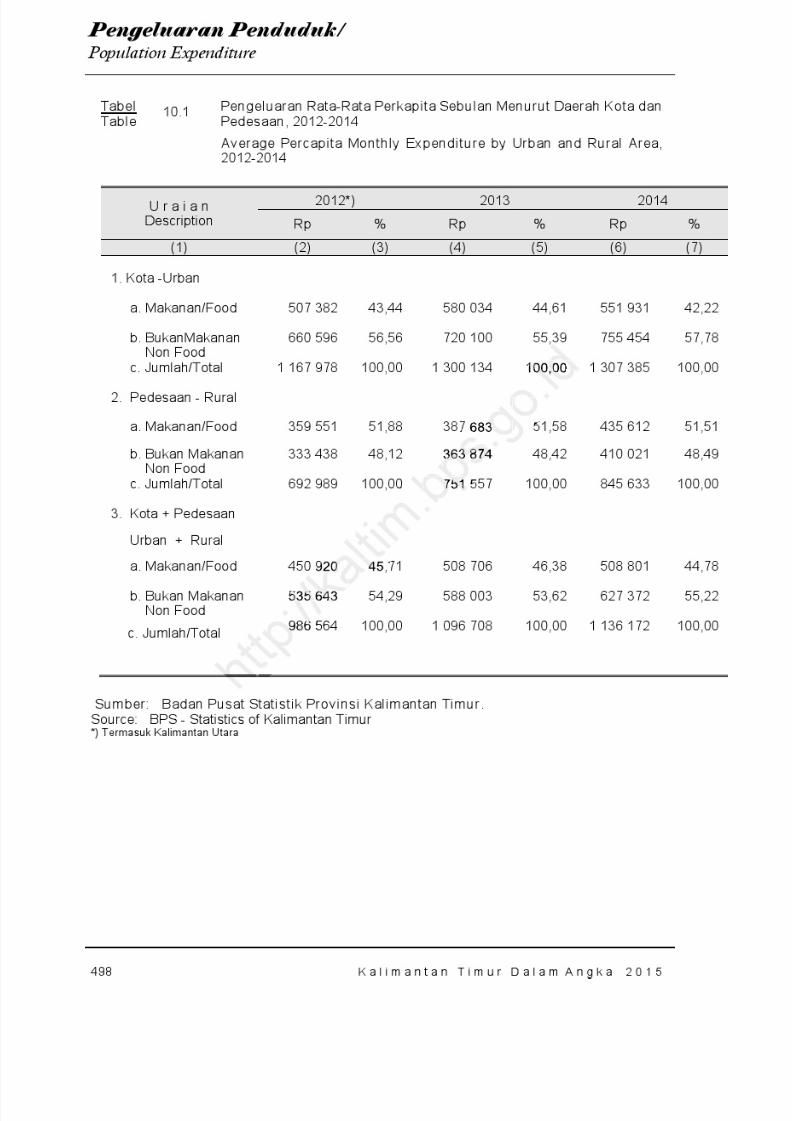
8/20/2019 Kalimantan Timur Dalam Angka Tahun 2015
http://slidepdf.com/reader/full/kalimantan-timur-dalam-angka-tahun-2015 564/623
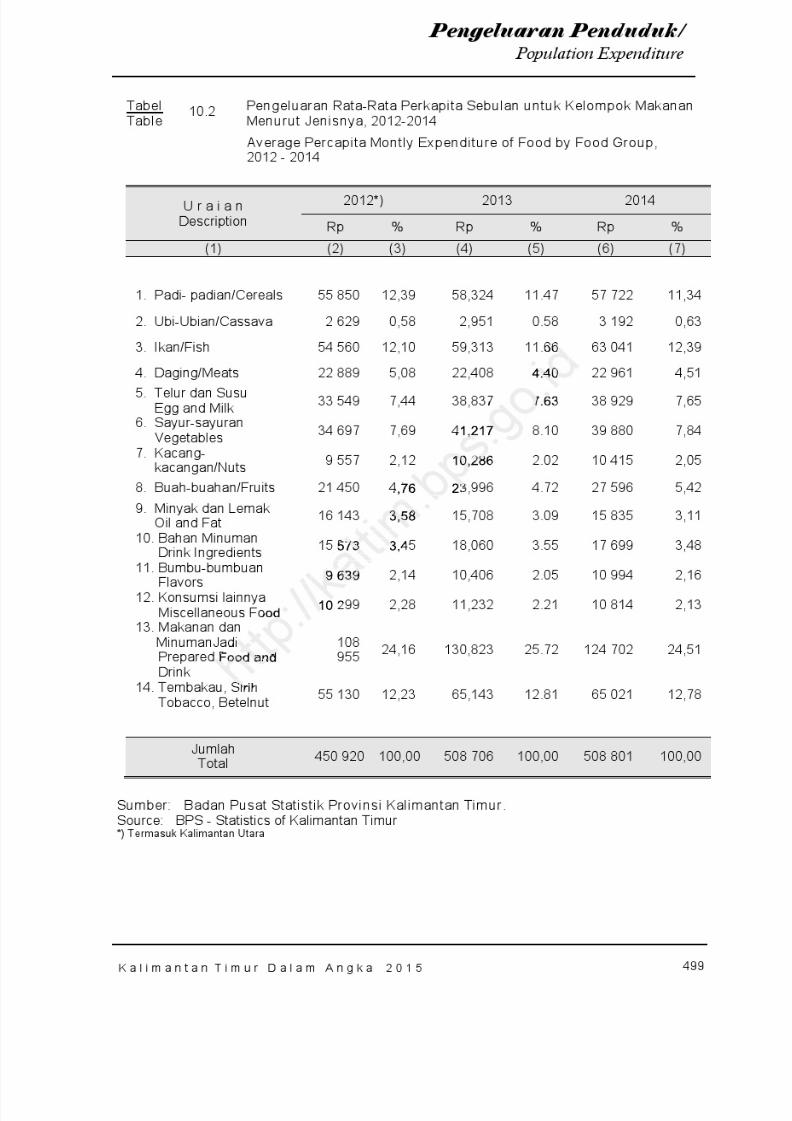
8/20/2019 Kalimantan Timur Dalam Angka Tahun 2015
http://slidepdf.com/reader/full/kalimantan-timur-dalam-angka-tahun-2015 565/623
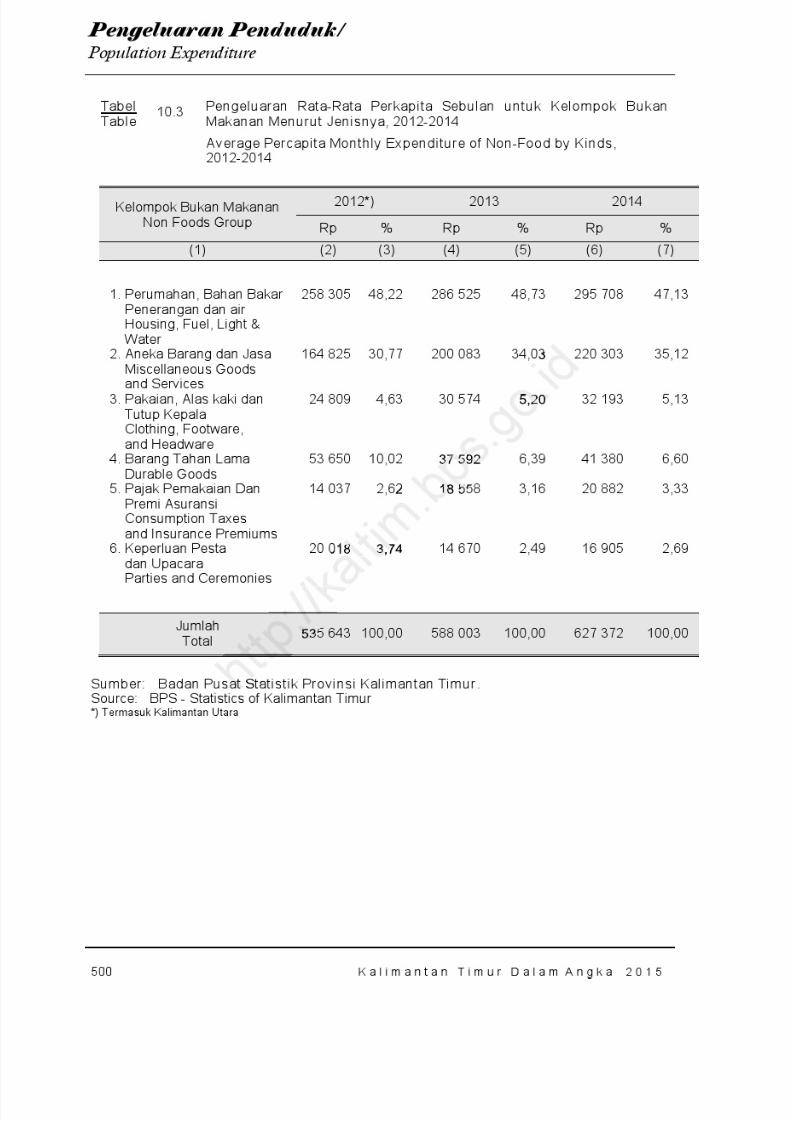
8/20/2019 Kalimantan Timur Dalam Angka Tahun 2015
http://slidepdf.com/reader/full/kalimantan-timur-dalam-angka-tahun-2015 566/623
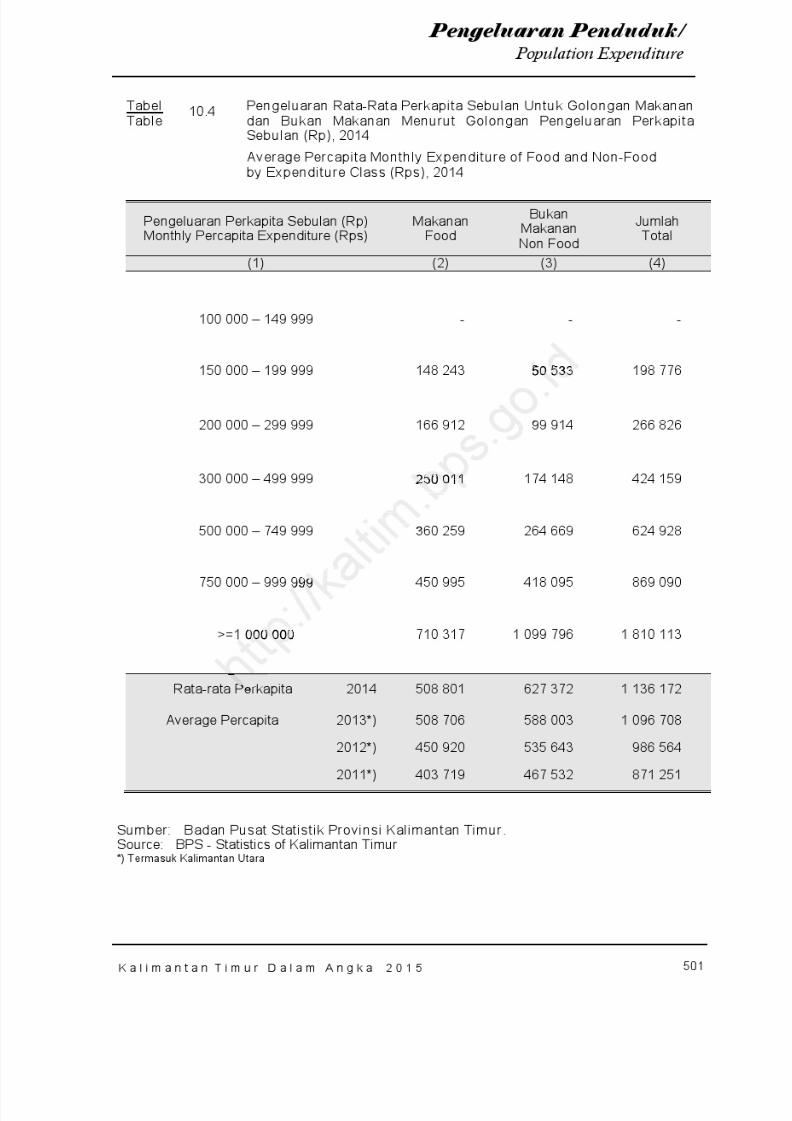
8/20/2019 Kalimantan Timur Dalam Angka Tahun 2015
http://slidepdf.com/reader/full/kalimantan-timur-dalam-angka-tahun-2015 567/623
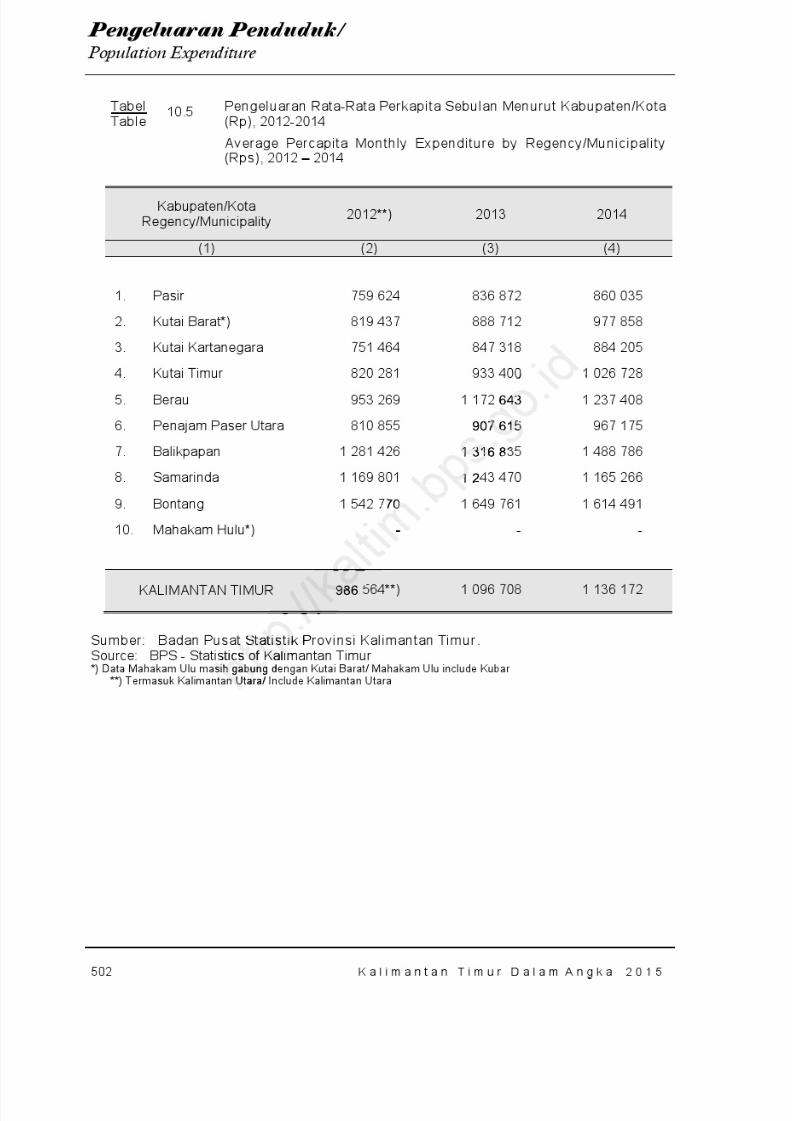
8/20/2019 Kalimantan Timur Dalam Angka Tahun 2015
http://slidepdf.com/reader/full/kalimantan-timur-dalam-angka-tahun-2015 568/623
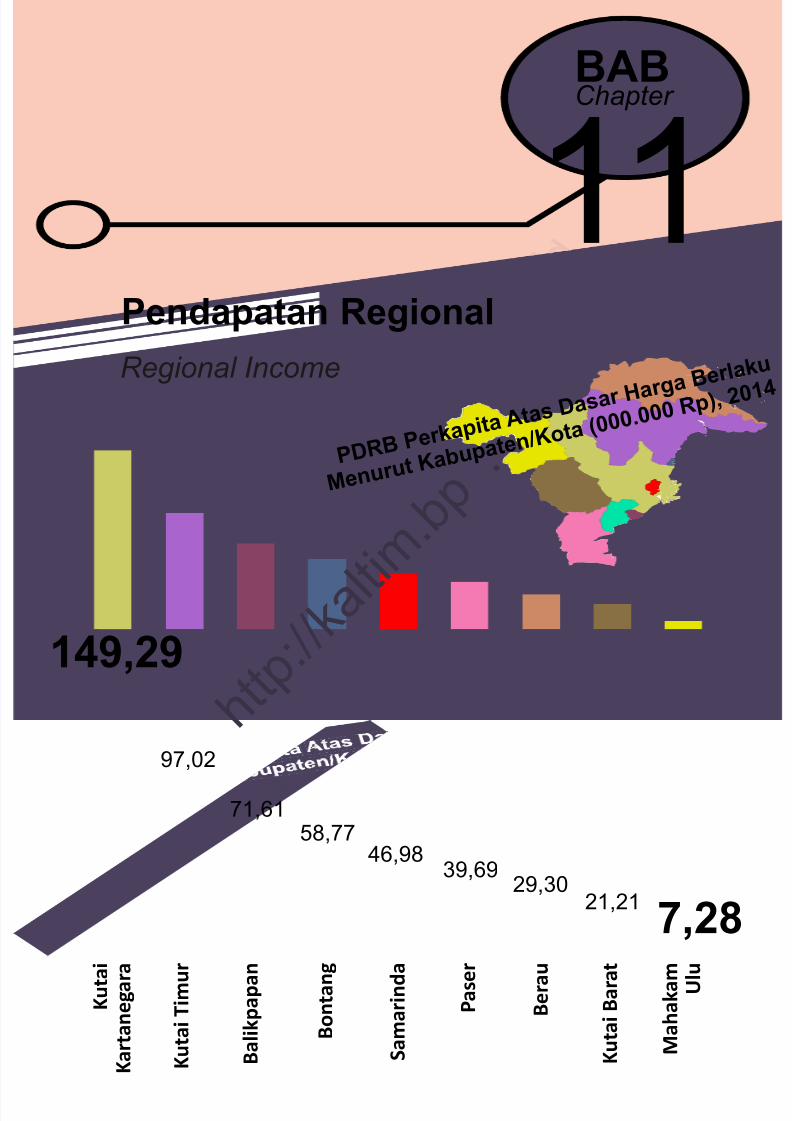
8/20/2019 Kalimantan Timur Dalam Angka Tahun 2015
http://slidepdf.com/reader/full/kalimantan-timur-dalam-angka-tahun-2015 569/623
11Pendapatan Regional
BABChapter
Regional Income
P D R B P e r k a p i t a A t a s D a s a r H a r g a B e r
l a k u
M e n u r u t K a b u p a t
e n/ K o t a ( 0 0 0. 0 0 0 R p ), 2 0 1 4
149,29
97,0271,61
58,7746,98
39,6929,30
21,21 7,28
K u t a i
K a r t a n e g a r a
K u t a i T i m u r
B a l i k p a p a n
B o n t a n g
S a m a r i n
d a
P a s e r
B e r a u
K u t a i B a r a t
M a h a k a m
U l u
h t t p : / / k a l t i m
. b p .

8/20/2019 Kalimantan Timur Dalam Angka Tahun 2015
http://slidepdf.com/reader/full/kalimantan-timur-dalam-angka-tahun-2015 570/623
h t t p : / / k a l t i m
. b p s . g o . i d
8/20/2019 Kalimantan Timur Dalam Angka Tahun 2015
http://slidepdf.com/reader/full/kalimantan-timur-dalam-angka-tahun-2015 571/623
K a l i m a n t a n T i m u r D a l a m A n g k a 2 0 1 5 505
Pendapatan Regional / Regional Income
11. PRODUK DOMESTIK
REGIONAL BRUTO
(PDRB)
Laju pertumbuhan ProdukDomestik Regional Bruto (PDRB)Provinsi Kalimantan Timur atasdasar harga konstan 2010 MenurutLapangan Usaha pada tahun 2014sebesar 2,02 persen dengan migas
dan non migas sebesar 4,02 persen.Jika dibandingkan dengan tahunsebelumnya sebesar 2,72 persendengan migas dan non migas 5,77persen, maka pada tahun 2014, lajupertumbuhan PDRB dengan migasdan tanpa migas mengalamipenurunan
Struktur ekonomi KalimantanTimur tahun 2014 dengan migasmaupun non migas tidak jauhberbeda dari tahun-tahunsebelumnya
PDRB dengan migasmenunjukkan bahwa sektor
ekonomi yang sangat berperandalam pembentukan PDRBKalimantan Timur adalah sektorPertambangan (47,98 persen),Industri Pengolahan (18,45 persen),Konstruksi (8,00 persen), sertasektor Pertanian (7,96 persen).
11. GROSS REGIONAL
DOMESTIC PRODUCTS (GRDP)
In 2014 growth of GRDP ofKalimantan Timur by industrialorigin was 2.02 percent while GRDPgrowth of non oil and gas was 4.02 percent. This figure was higher thanthe previous year economy growthof Kalimantan Timur in 2014 was2.72 percent and growth of non oiland gas was 5.77 percent. Thegrowth of economy both with oil ornon-oil and gas were decreased.
In 2014, the economicstructure of Kalimantan Timur wasnot significantly different than the previous with or without oil and gas.
GRDP with oil and gasshowed that mining sectorcontributed 47.98 percent;
Manufacturing Industries sector18.45 percent; Construction sectorcontributed 8,00 percent; and Agriculture sector contributed 7.96 percent.
Tt and gr
was
t t i m
. b p
antanan mig
i atahu
e
h of econ-oi an
8/20/2019 Kalimantan Timur Dalam Angka Tahun 2015
http://slidepdf.com/reader/full/kalimantan-timur-dalam-angka-tahun-2015 572/623
K a l i m a n t a n T i m u r D a l a m A n g k a 2 0 1 5506
Pendapatan Regional / Regional Income
PDRB Kalimantan TimurMenurut pengeluaran pada tahun2014, masih didominasi olehkomponen ekspor impor dengankontribusi 65,24 persen (netekspor). Disusul pengeluaranPembentukan Modal Tetap Brutosebesar 27,14 persen danpengeluaran untuk konsumsirumahtangga yaitu 16,30 persen.
PDRB tanpa dengan migasMenurut Kabupaten/Kota padatahun 2014 terbesar ada diKabupaten Kutai Kartanegaradengan nilai PDRB sebesar 128,28triliun rupiah disusul KabupatenKutai Timur dengan nilai 83,60 triliunrupiah, dan Kota Bontang dengannilai 41,54 triliun rupiah.
Sedang pertumbuhan ekonomitertinggi Menurut kabupaten/kotapada tahun 2014 ada di KabupatenBerau sebesar 7,92 persen.
East Kalimantan Accordingexpenditure GDP in 2014, stilldominated by the export ofcomponents imported by thecontribution of 65.24 percent (netexports). Followed expenditureGross Fixed Capital Formationamounted to 27.14 percent andspending on household consumptionis 16.30 percent.
GDP without the oil and gas According to Regency / City in 2014,the biggest in Kutai regency with avalue of 128.28 trillion GDP, followed by the East Kutai Regencyvalue of 83.60 trillion rupiah, andBontang with a value of 41.54 trillionrupiah.
Being the highest economicgrowth According to the district /city in 2014 in the district of Berau at7.92 percent.
gency
n Kutai r
h t t : t i m
. .
omien/kota
a upatsen.
128.2y t
e of 83ontang
rupia
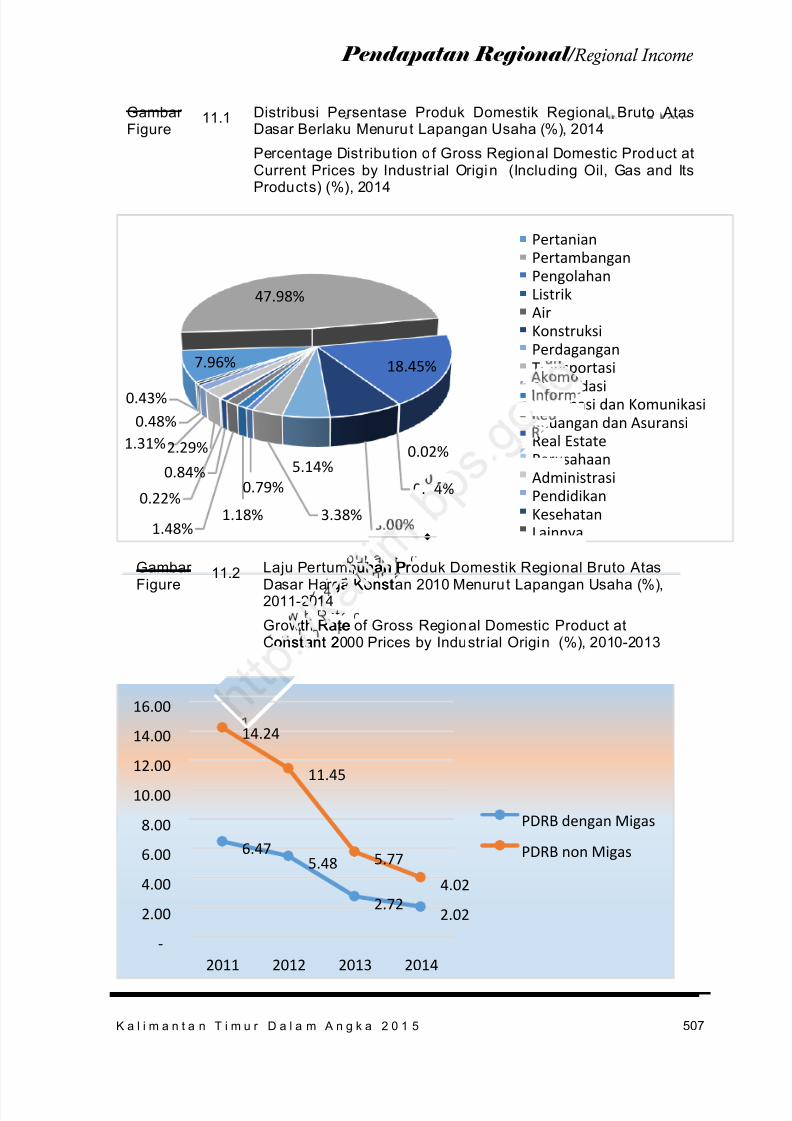
8/20/2019 Kalimantan Timur Dalam Angka Tahun 2015
http://slidepdf.com/reader/full/kalimantan-timur-dalam-angka-tahun-2015 573/623
K a l i m a n t a n T i m u r D a l a m A n g k a 2 0 1 5 507
Pendapatan Regional / Regional Income
Gambar Figure
11.1 Distribusi Persentase Produk Domestik Regional Bruto AtasDasar Berlaku Menurut Lapangan Usaha (%), 2014
Percentage Dist ribution o f Gross Regional Domestic Product atCurrent Prices by Industr ial Origin (Including Oil, Gas and Its
Products) (%), 2014
Gambar Figure 11.2
Laju Pertumbuhan Produk Domestik Regional Bruto AtasDasar Harga Konstan 2010 Menurut Lapangan Usaha (%),2011-2014
Growth Rate of Gross Regional Domestic Product atConstant 2000 Prices by Industr ial Origin (%), 2010-2013
6.475.48
2.722.02
14.24
11.45
5.77
4.02
-
2.00
4.00
6.00
8.00
10.00 12.00
14.00
16.00
2011 2012 2013 2014
PDRB dengan Migas
PDRB non Migas
7.96%
47.98%
18.45%
0.02%
0.04%
8.00%
5.14%
3.38%
0.79%
1.18%1.48%
0.84%
0.22%
2.29%1.31%0.48%
0.43%
PertanianPertambanganPengolahanListrikAirKonstruksiPerdaganganTransportasiAkomodasiInformasi dan KomunikasiKeuangan dan AsuransiReal EstatePerusahaanAdministrasiPendidikanKesehatanLainnya .
. 4%
uhan Pr ga Konst
1
th Rateonstant 2
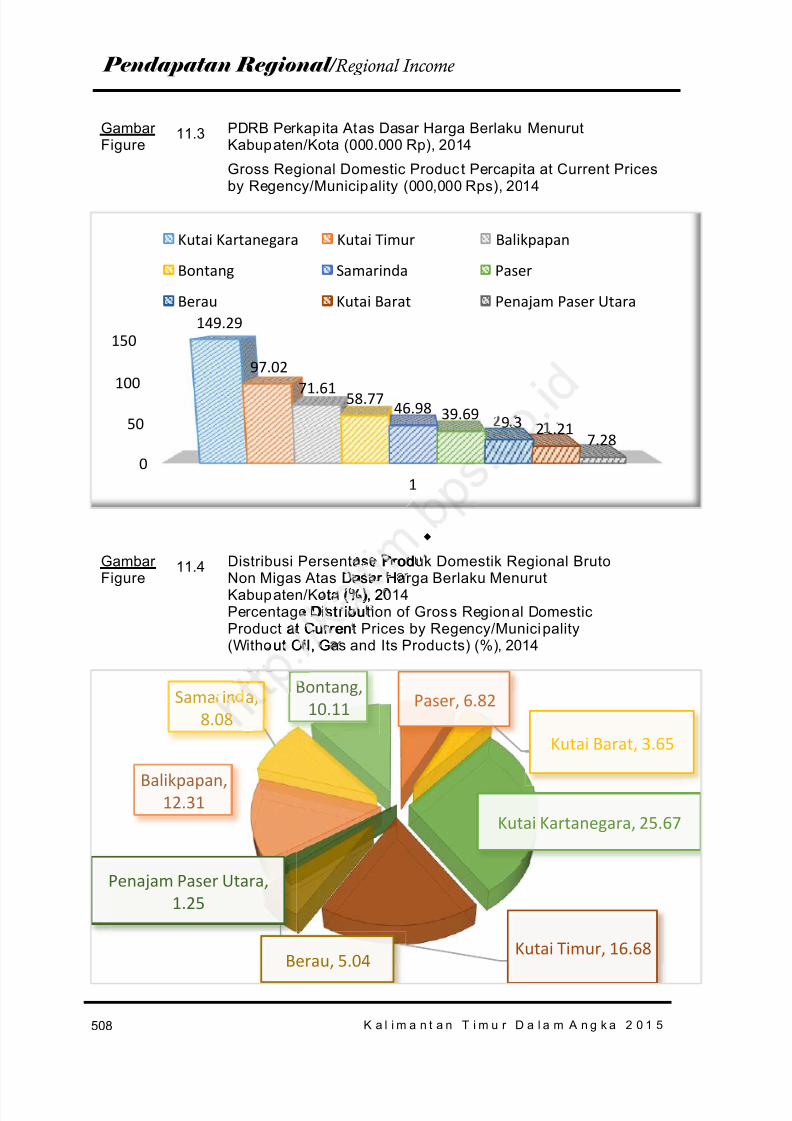
8/20/2019 Kalimantan Timur Dalam Angka Tahun 2015
http://slidepdf.com/reader/full/kalimantan-timur-dalam-angka-tahun-2015 574/623
K a l i m a n t a n T i m u r D a l a m A n g k a 2 0 1 5508
Pendapatan Regional / Regional Income
Gambar Figure
11.3 PDRB Perkapita Atas Dasar Harga Berlaku MenurutKabupaten/Kota (000.000 Rp), 2014
Gross Regional Domestic Produc t Percapita at Current Prices
by Regency/Municipality (000,000 Rps), 2014
Gambar Figure
11.4 Distribusi Persentase Produk Domestik Regional BrutoNon Migas Atas Dasar Harga Berlaku MenurutKabupaten/Kota (%), 2014Percentage Dist ribution of Gross Regional DomesticProduct at Current Prices by Regency/Municipality(Without Oil, Gas and Its Produc ts) (%), 2014
Paser, 6.82
Kutai Barat, 3.65
Kutai Kartanegara, 25.67
Kutai Timur, 16.68Berau, 5.04
Penajam Paser Utara,1.25
Balikpapan,12.31
Samarinda,8.08
Bontang,10.11
0
50
100
150
1
149.29
97.0271.61 58.77
46.98 39.69 29.3 21.217.28
Kutai Kartanegara Kutai Timur Balikpapan
Bontang Samarinda Paser
Berau Kutai Barat Penajam Paser Utara
. se Prod
Dasar Hta (%), 2
Distribuiat Curren
ut Oil, G
in a ,
9.3 2
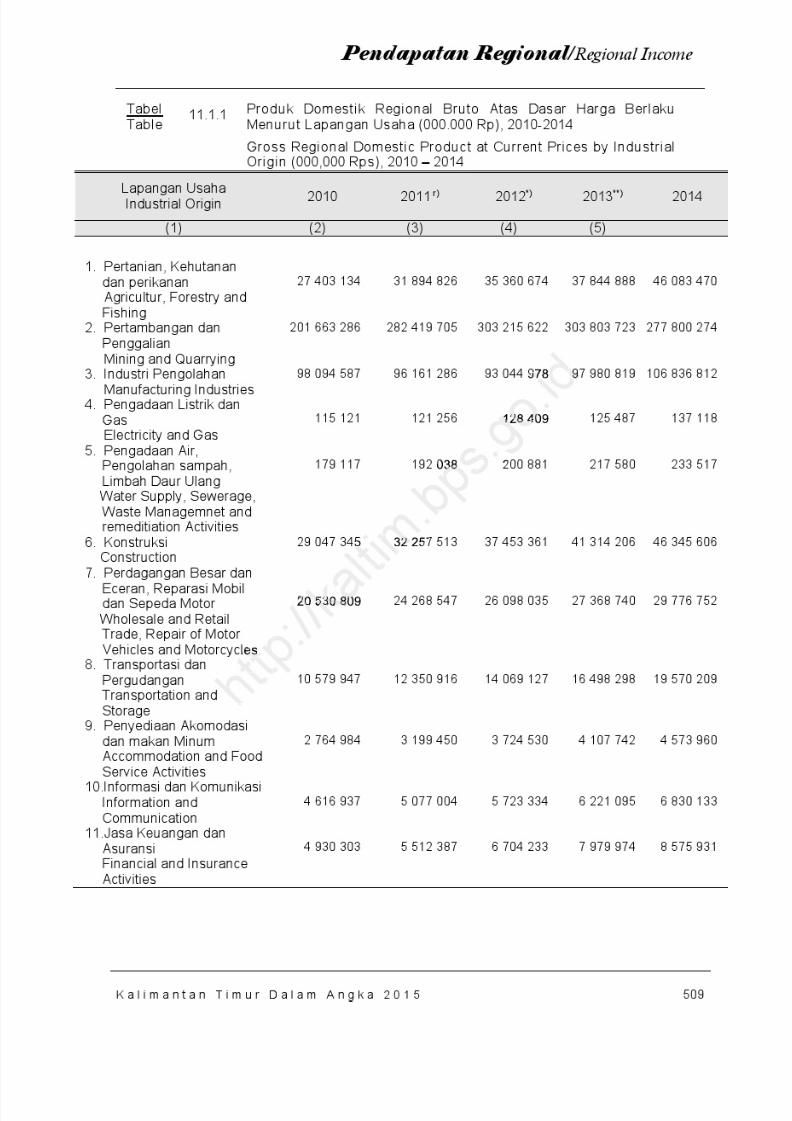
8/20/2019 Kalimantan Timur Dalam Angka Tahun 2015
http://slidepdf.com/reader/full/kalimantan-timur-dalam-angka-tahun-2015 575/623
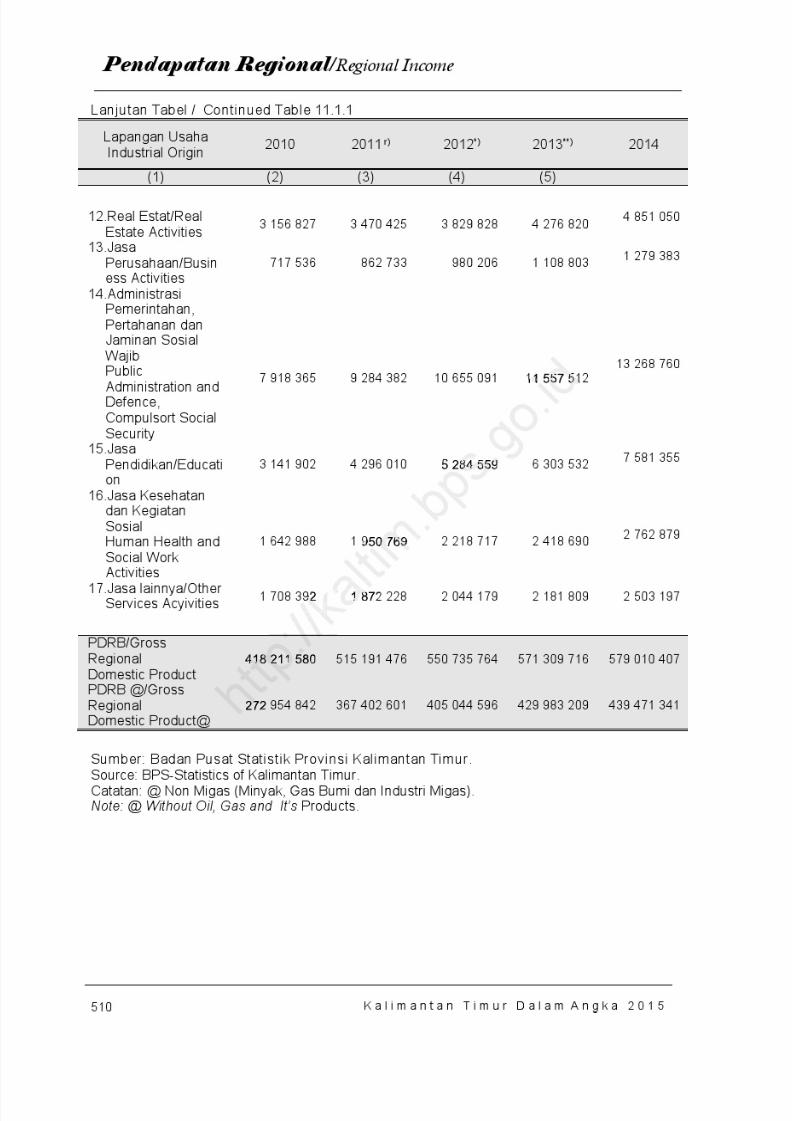
8/20/2019 Kalimantan Timur Dalam Angka Tahun 2015
http://slidepdf.com/reader/full/kalimantan-timur-dalam-angka-tahun-2015 576/623
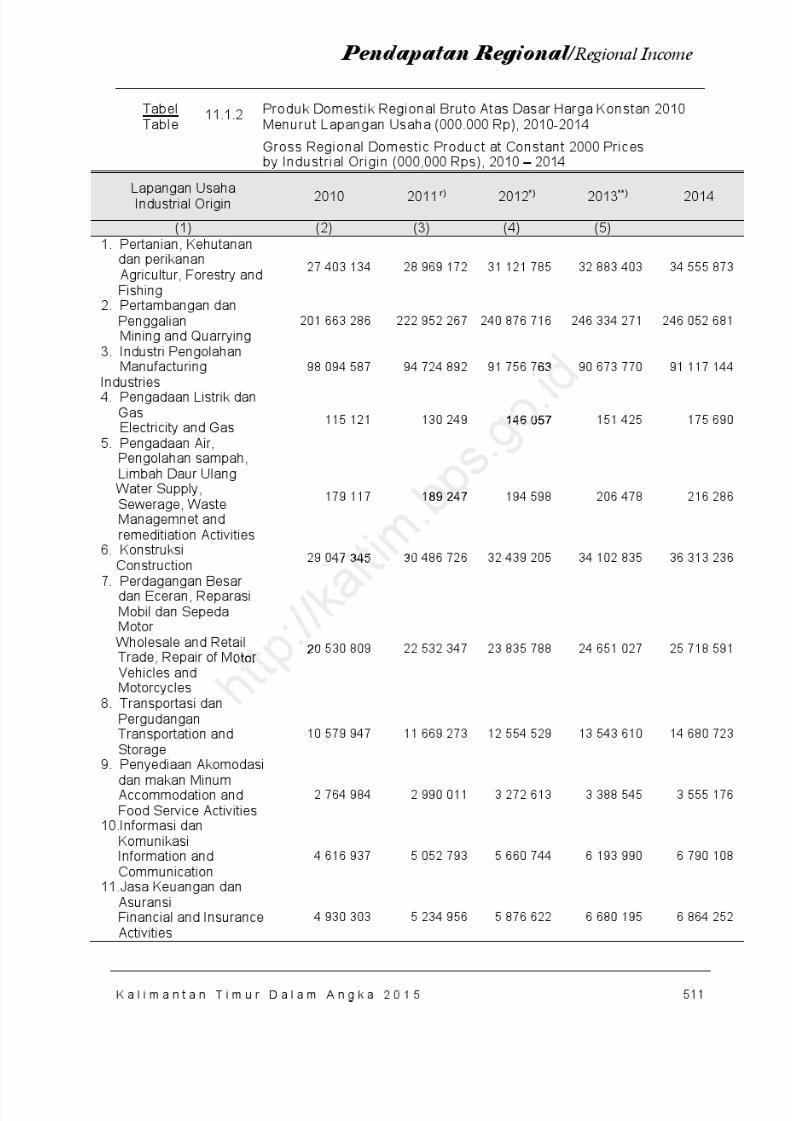
8/20/2019 Kalimantan Timur Dalam Angka Tahun 2015
http://slidepdf.com/reader/full/kalimantan-timur-dalam-angka-tahun-2015 577/623
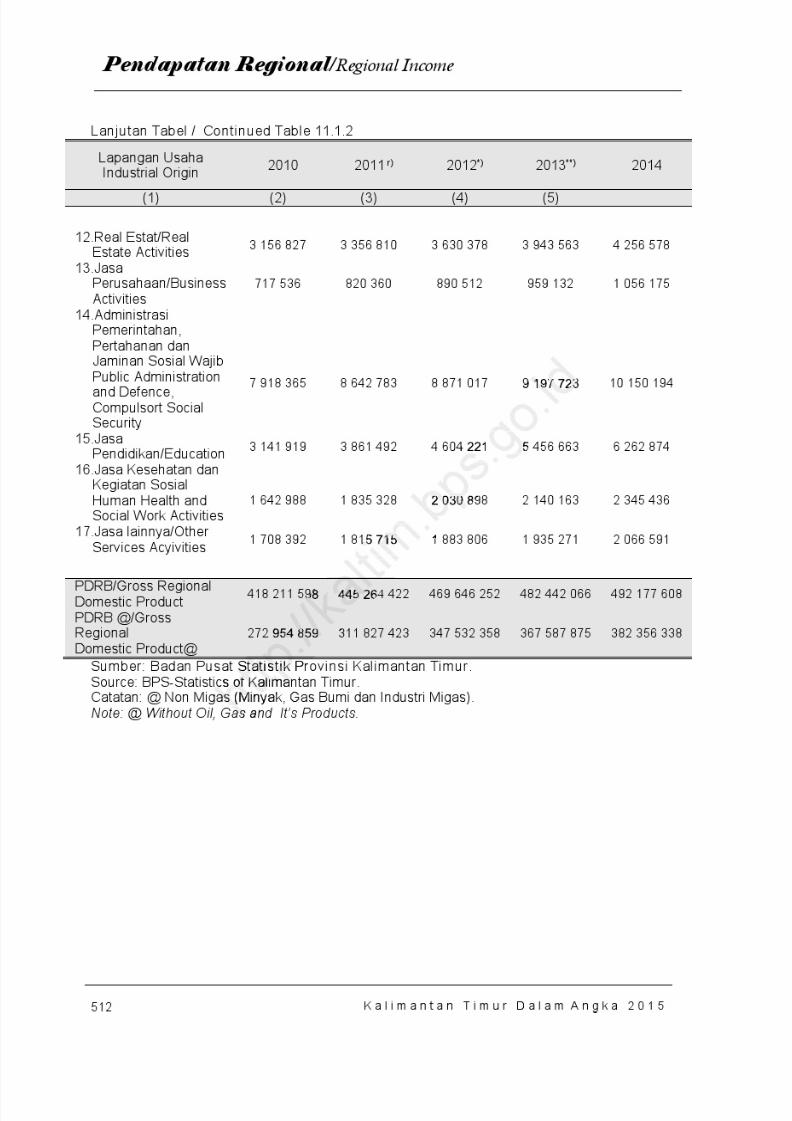
8/20/2019 Kalimantan Timur Dalam Angka Tahun 2015
http://slidepdf.com/reader/full/kalimantan-timur-dalam-angka-tahun-2015 578/623
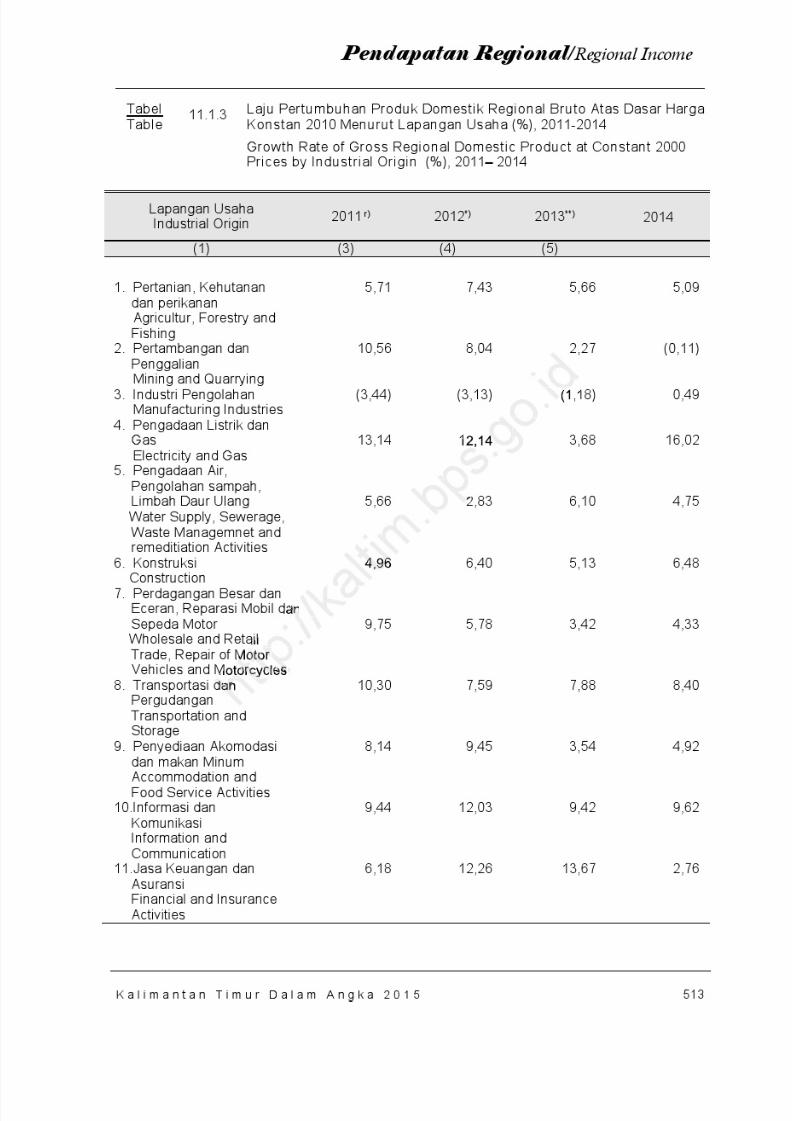
8/20/2019 Kalimantan Timur Dalam Angka Tahun 2015
http://slidepdf.com/reader/full/kalimantan-timur-dalam-angka-tahun-2015 579/623
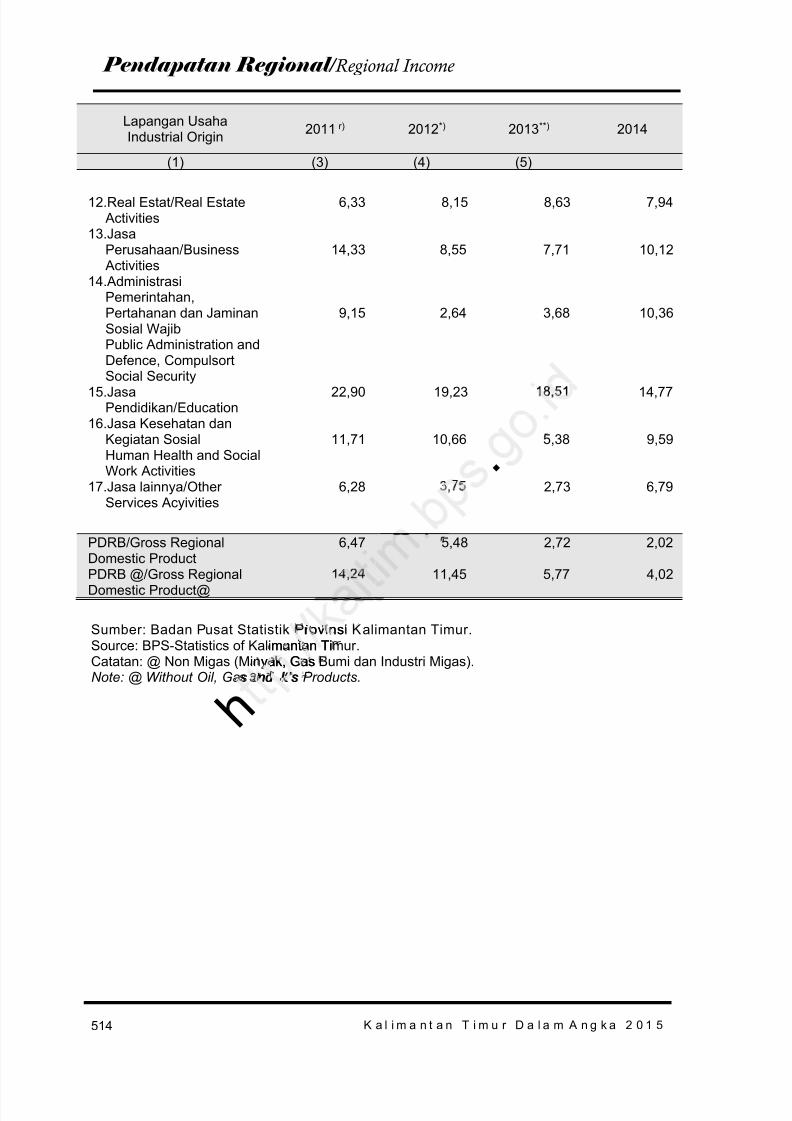
8/20/2019 Kalimantan Timur Dalam Angka Tahun 2015
http://slidepdf.com/reader/full/kalimantan-timur-dalam-angka-tahun-2015 580/623
K a l i m a n t a n T i m u r D a l a m A n g k a 2 0 1 5514
Pendapatan Regional / Regional Income
Lapangan UsahaIndustrial Origin 2011 r) 2012 *) 2013 **) 2014
(1) (3) (4) (5)
12.Real Estat/ Real Estate Activities
6,33 8,15 8,63 7,94
13.JasaPerusahaan/ Business
Activities14,33 8,55 7,71 10,12
14.AdministrasiPemerintahan,Pertahanan dan JaminanSosial WajibPublic Administration andDefence, CompulsortSocial Security
9,15 2,64 3,68 10,36
15.JasaPendidikan/ Education
22,90 19,23 18,51 14,77
16.Jasa Kesehatan danKegiatan SosialHuman Health and SocialWork Activities
11,71 10,66 5,38 9,59
17.Jasa lainnya/ OtherServices Acyivities
6,28 3,75 2,73 6,79
PDRB/ Gross RegionalDomestic Product
6,47 5,48 2,72 2,02
PDRB @/ Gross RegionalDomestic Product@ 14,24 11,45 5,77 4,02
Sumber: Badan Pusat Statistik Provinsi Kalimantan Timur.Source: BPS-Statistics of Kalimantan Timur .Catatan: @ Non Migas (Minyak, Gas Bumi dan Industri Migas).Note: @ Without Oil, Gas and It’s Products.
.
rov nsmantan Ti
h yak, Gas
s and It’s’
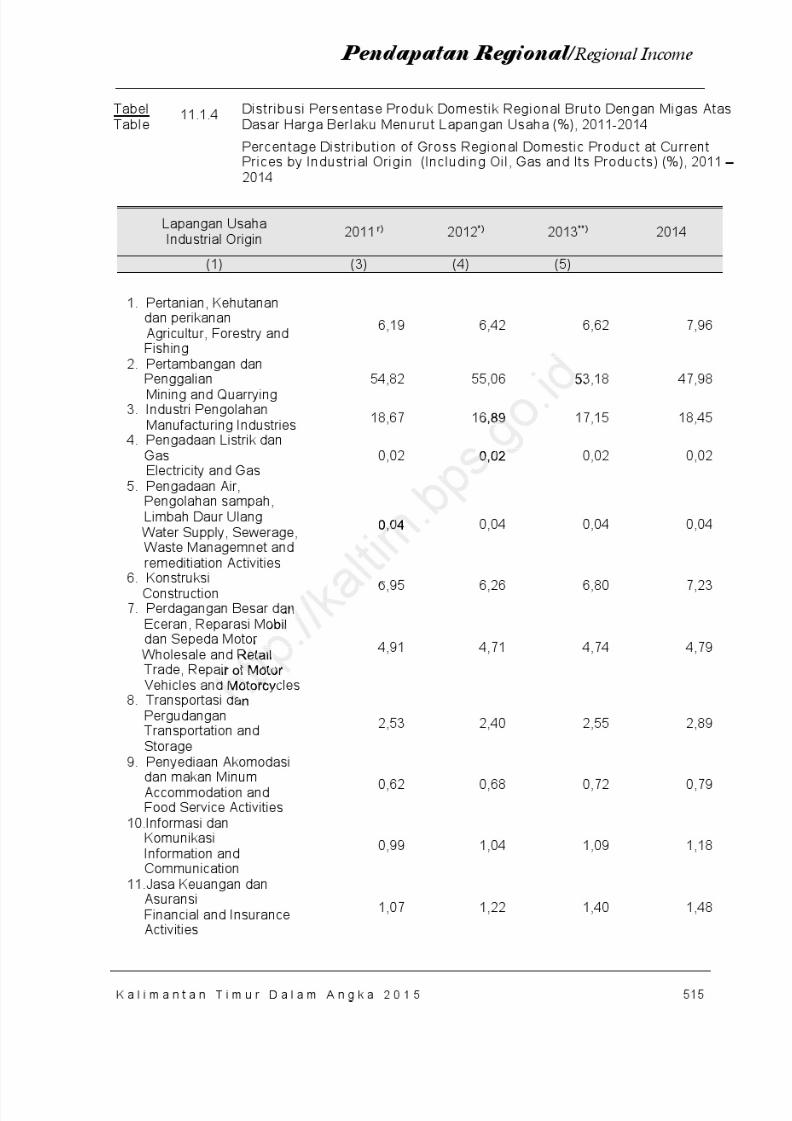
8/20/2019 Kalimantan Timur Dalam Angka Tahun 2015
http://slidepdf.com/reader/full/kalimantan-timur-dalam-angka-tahun-2015 581/623
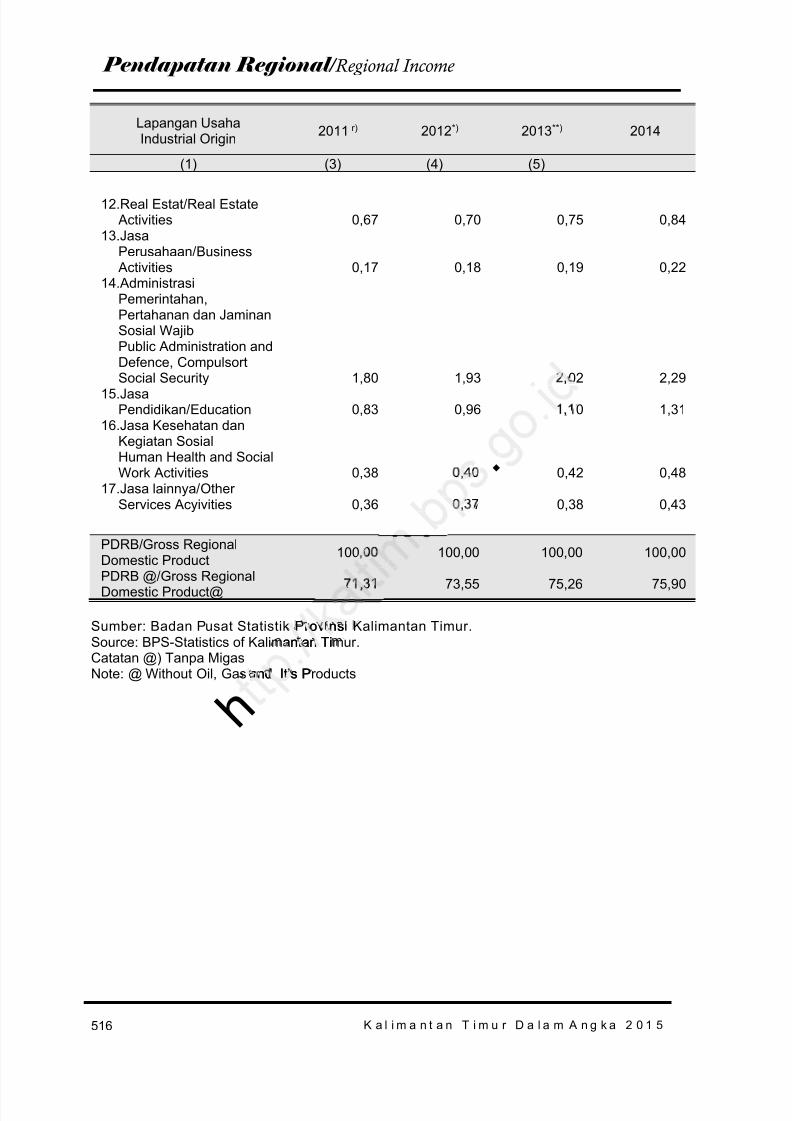
8/20/2019 Kalimantan Timur Dalam Angka Tahun 2015
http://slidepdf.com/reader/full/kalimantan-timur-dalam-angka-tahun-2015 582/623
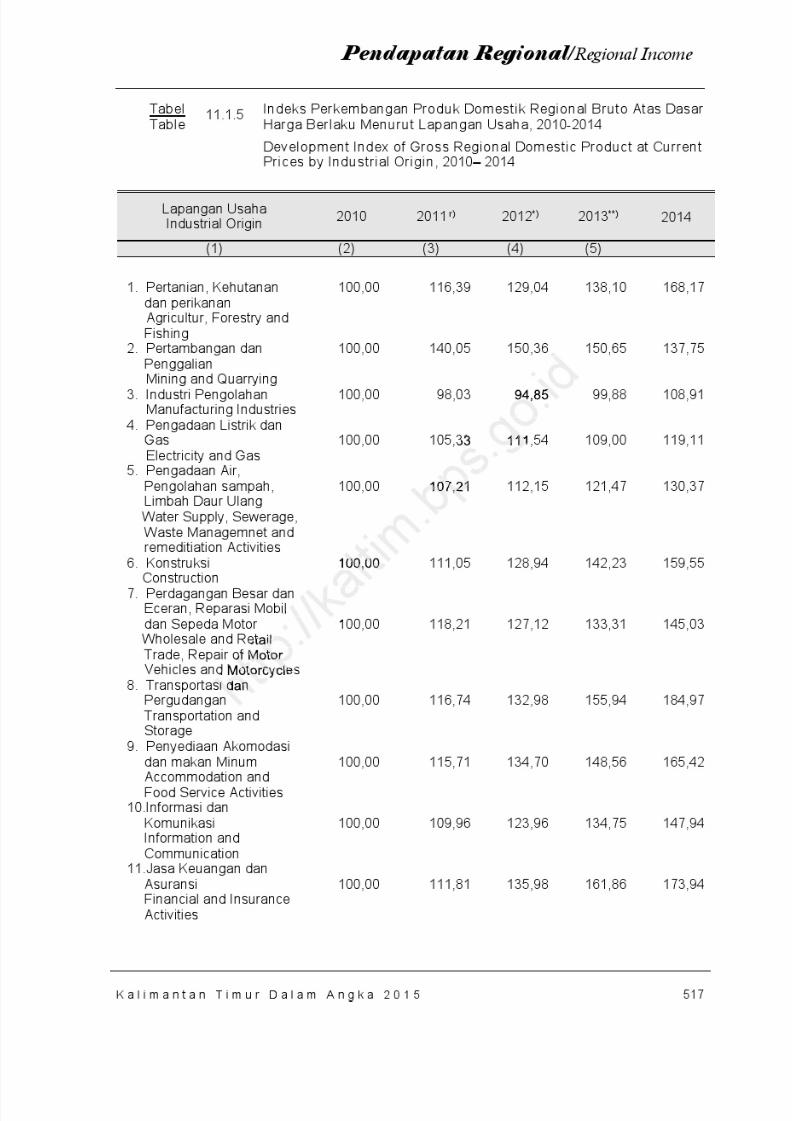
8/20/2019 Kalimantan Timur Dalam Angka Tahun 2015
http://slidepdf.com/reader/full/kalimantan-timur-dalam-angka-tahun-2015 583/623
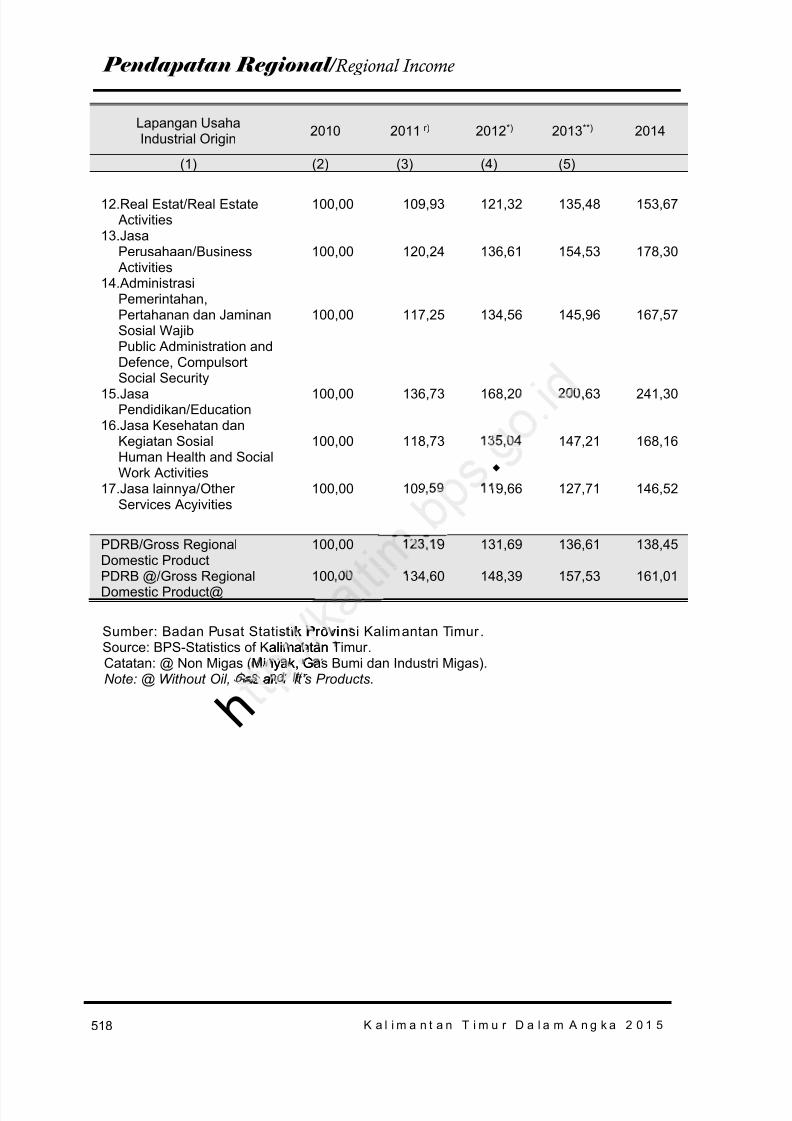
8/20/2019 Kalimantan Timur Dalam Angka Tahun 2015
http://slidepdf.com/reader/full/kalimantan-timur-dalam-angka-tahun-2015 584/623
K a l i m a n t a n T i m u r D a l a m A n g k a 2 0 1 5518
Pendapatan Regional / Regional Income
Lapangan UsahaIndustrial Origin 2010 2011 r) 2012 *) 2013 **) 2014
(1) (2) (3) (4) (5)
12.Real Estat/ Real Estate Activities
100,00 109,93 121,32 135,48 153,67
13.JasaPerusahaan/ Business
Activities100,00 120,24 136,61 154,53 178,30
14.AdministrasiPemerintahan,Pertahanan dan JaminanSosial WajibPublic Administration andDefence, Compulsort
Social Security
100,00 117,25 134,56 145,96 167,57
15.JasaPendidikan/ Education
100,00 136,73 168,20 200,63 241,30
16.Jasa Kesehatan danKegiatan SosialHuman Health and SocialWork Activities
100,00 118,73 135,04 147,21 168,16
17.Jasa lainnya/ OtherServices Acyivities
100,00 109,59 119,66 127,71 146,52
PDRB/ Gross RegionalDomestic Product
100,00 123,19 131,69 136,61 138,45
PDRB @/ Gross RegionalDomestic Product@
100,00 134,60 148,39 157,53 161,01
Sumber: Badan Pusat Statistik Provinsi Kalimantan Timur .Source: BPS-Statistics of Kalimantan Timur .Catatan: @ Non Migas (Minyak, Gas Bumi dan Industri Migas).Note: @ Without Oil, Gas and It’s Products.
.
ik Provinalimantan
h inyak, G
as an
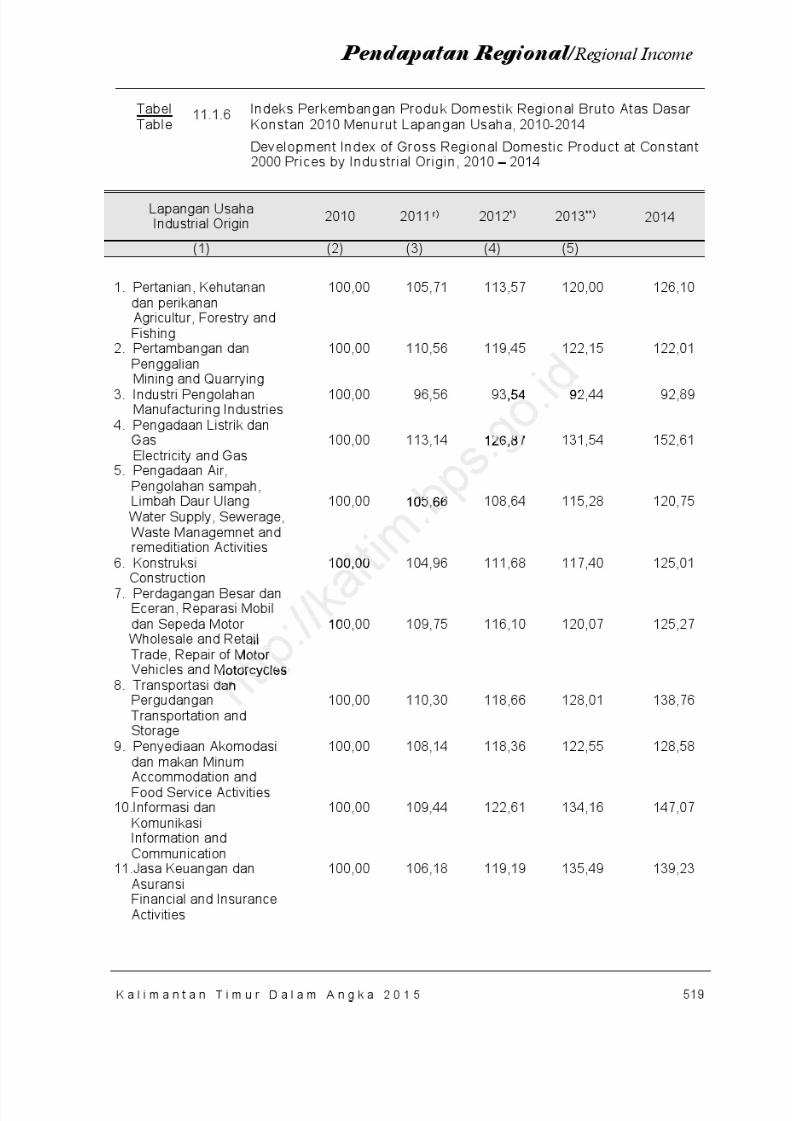
8/20/2019 Kalimantan Timur Dalam Angka Tahun 2015
http://slidepdf.com/reader/full/kalimantan-timur-dalam-angka-tahun-2015 585/623
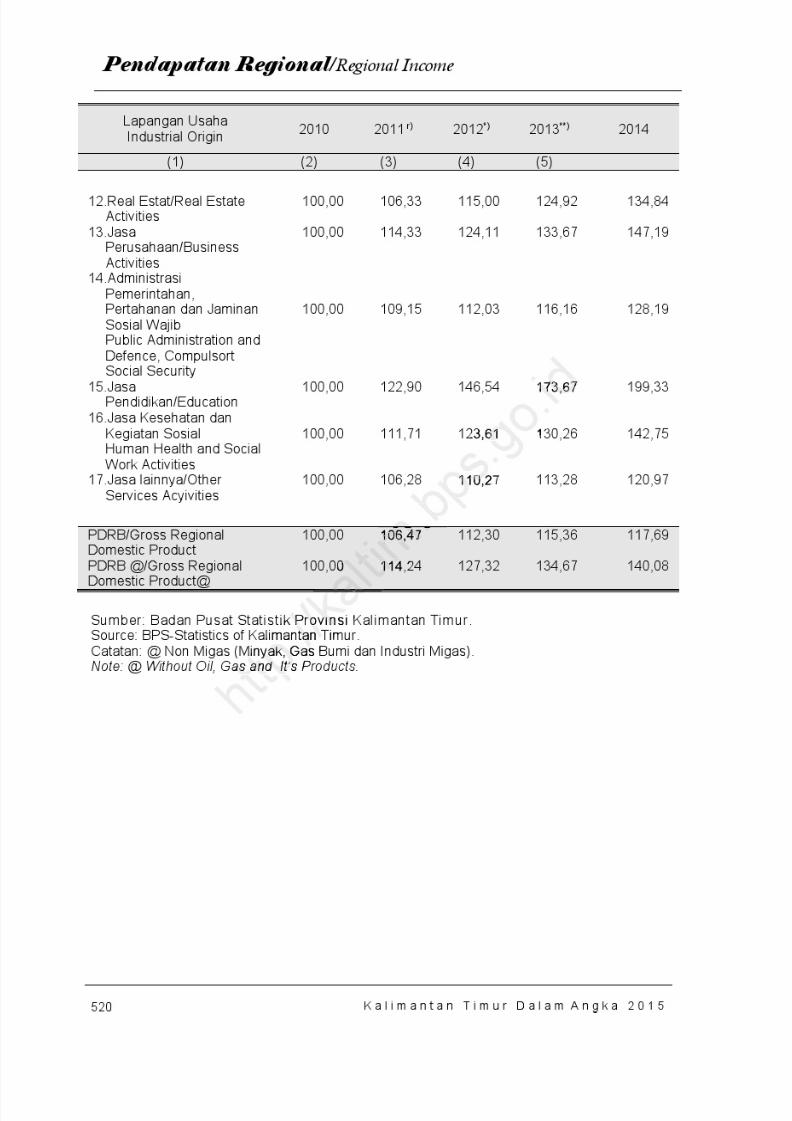
8/20/2019 Kalimantan Timur Dalam Angka Tahun 2015
http://slidepdf.com/reader/full/kalimantan-timur-dalam-angka-tahun-2015 586/623
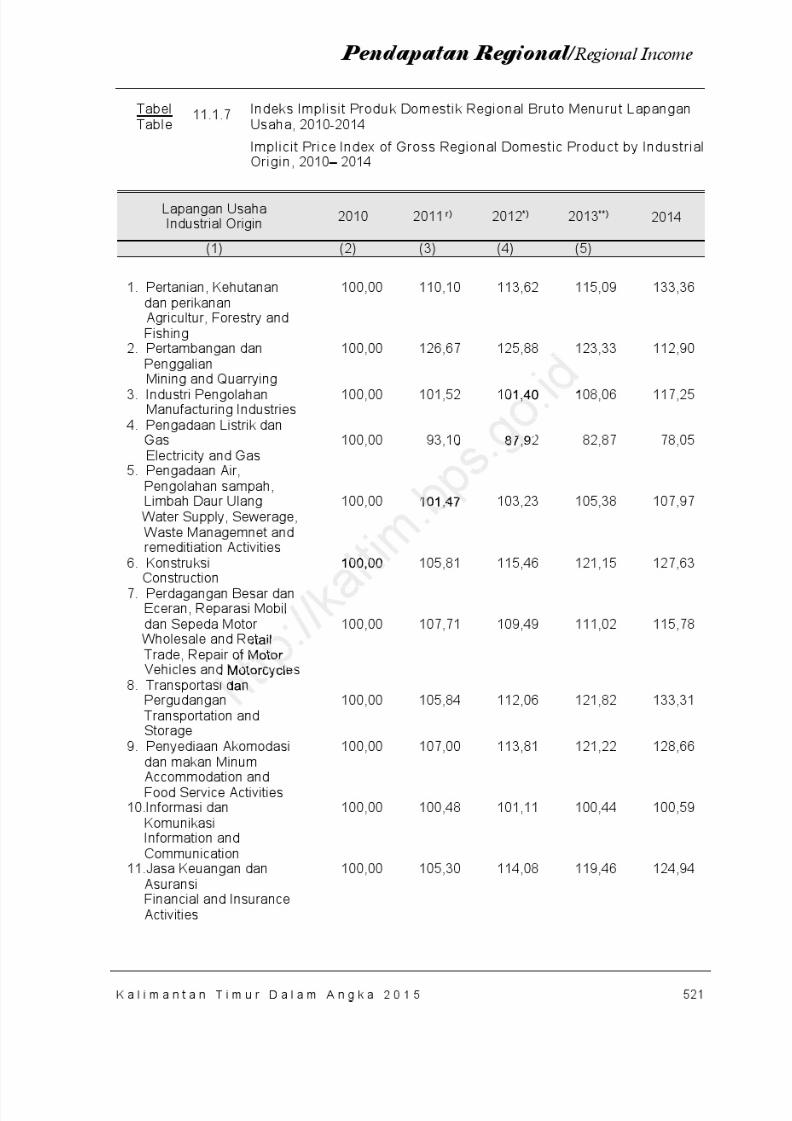
8/20/2019 Kalimantan Timur Dalam Angka Tahun 2015
http://slidepdf.com/reader/full/kalimantan-timur-dalam-angka-tahun-2015 587/623
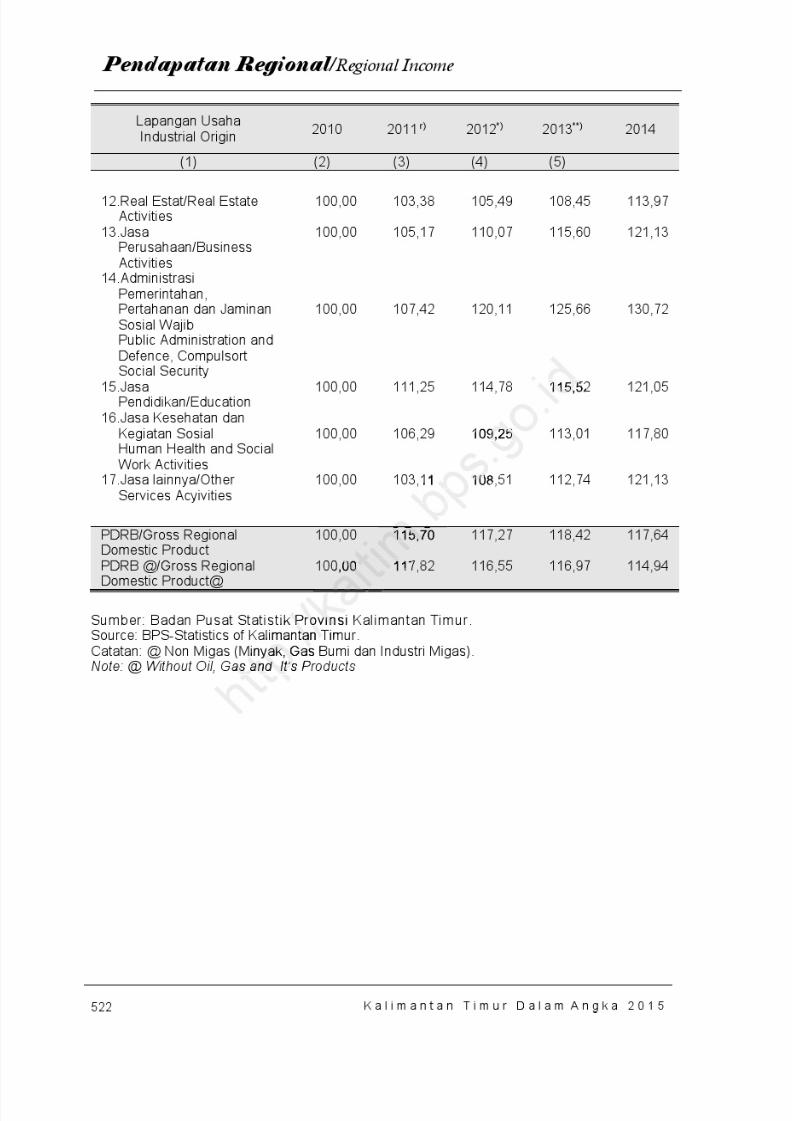
8/20/2019 Kalimantan Timur Dalam Angka Tahun 2015
http://slidepdf.com/reader/full/kalimantan-timur-dalam-angka-tahun-2015 588/623
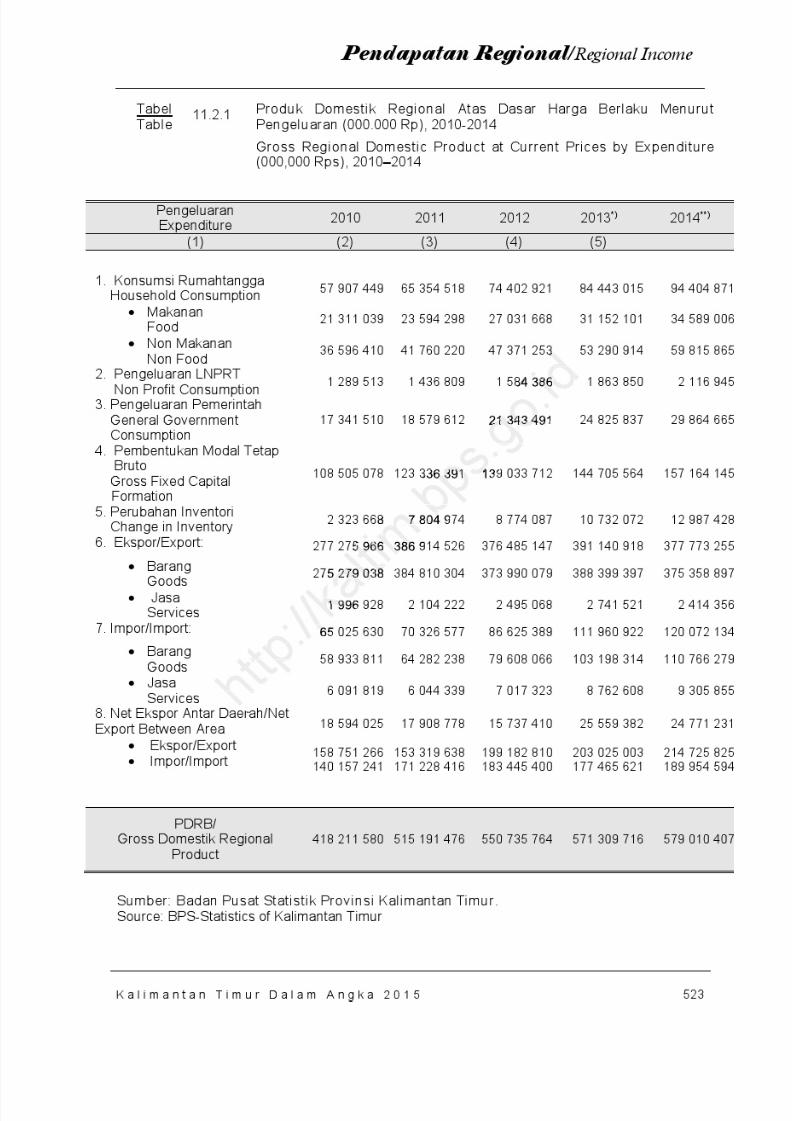
8/20/2019 Kalimantan Timur Dalam Angka Tahun 2015
http://slidepdf.com/reader/full/kalimantan-timur-dalam-angka-tahun-2015 589/623
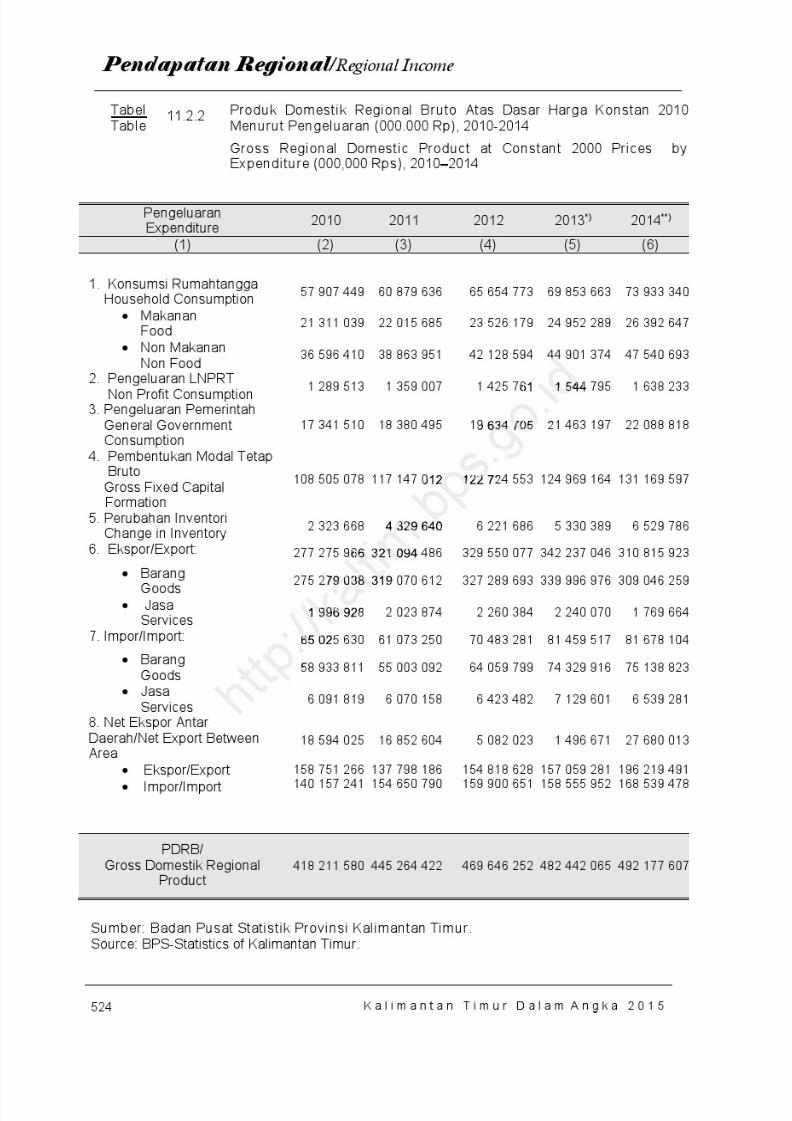
8/20/2019 Kalimantan Timur Dalam Angka Tahun 2015
http://slidepdf.com/reader/full/kalimantan-timur-dalam-angka-tahun-2015 590/623
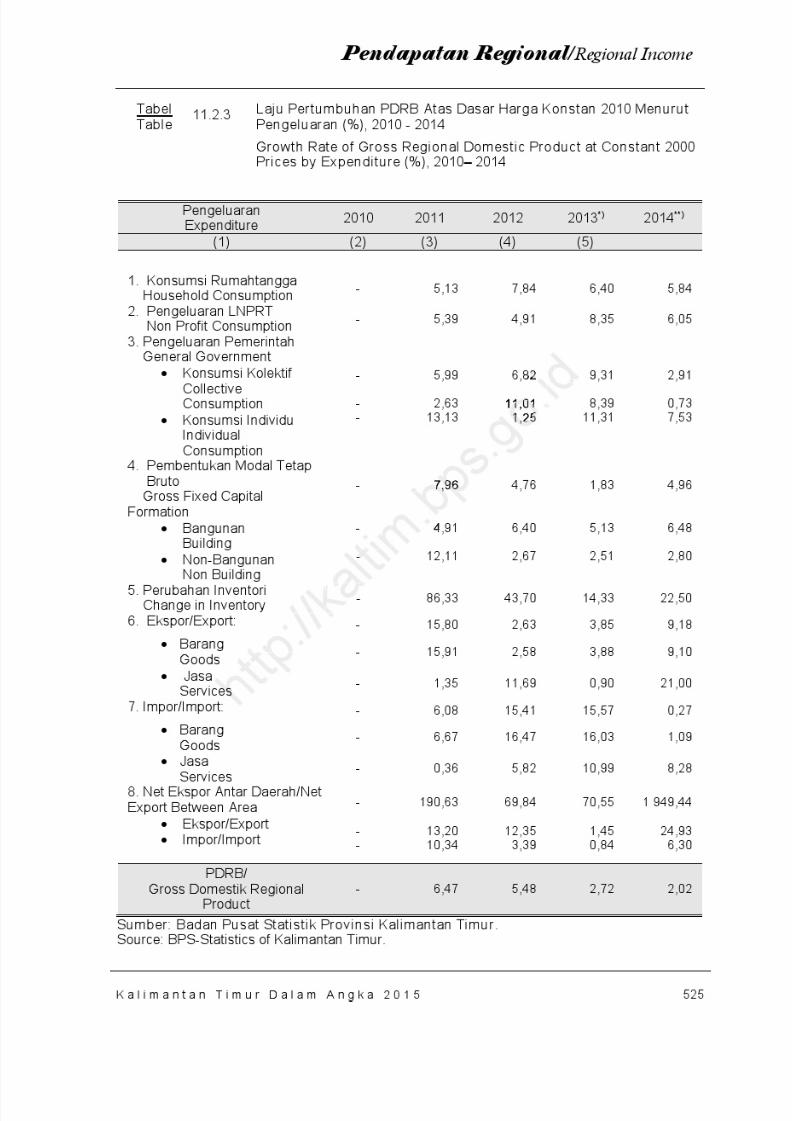
8/20/2019 Kalimantan Timur Dalam Angka Tahun 2015
http://slidepdf.com/reader/full/kalimantan-timur-dalam-angka-tahun-2015 591/623
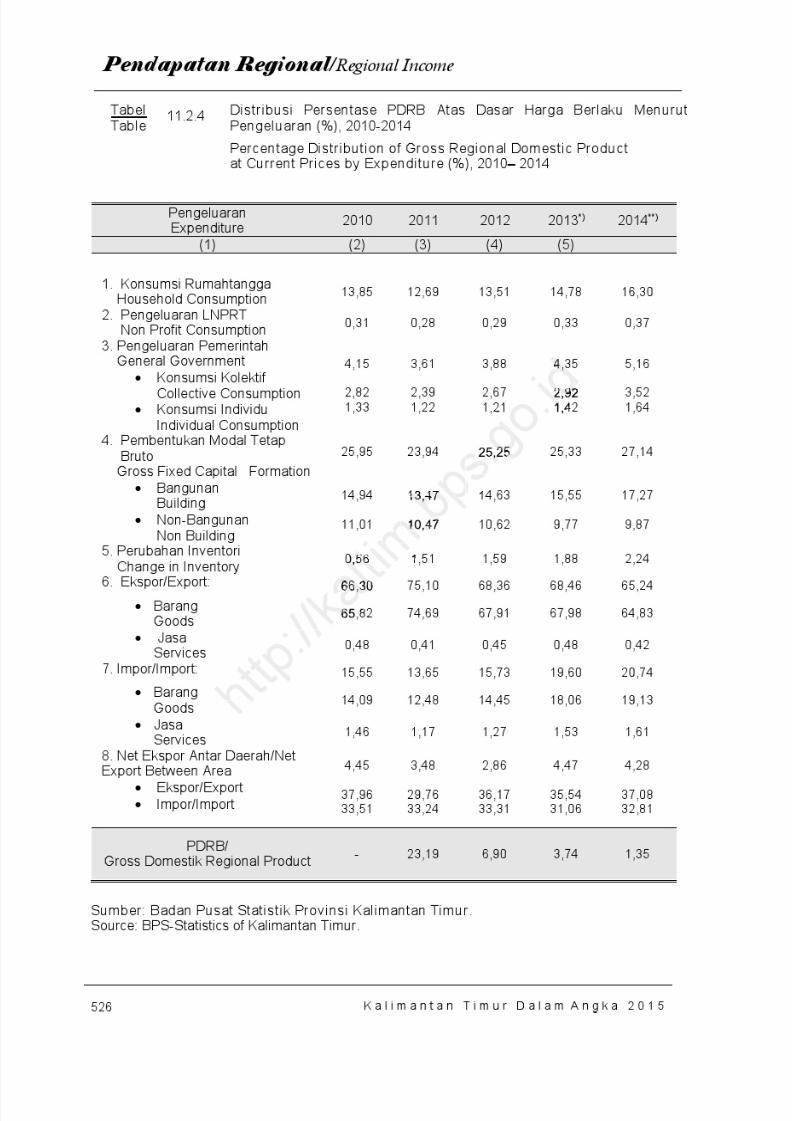
8/20/2019 Kalimantan Timur Dalam Angka Tahun 2015
http://slidepdf.com/reader/full/kalimantan-timur-dalam-angka-tahun-2015 592/623
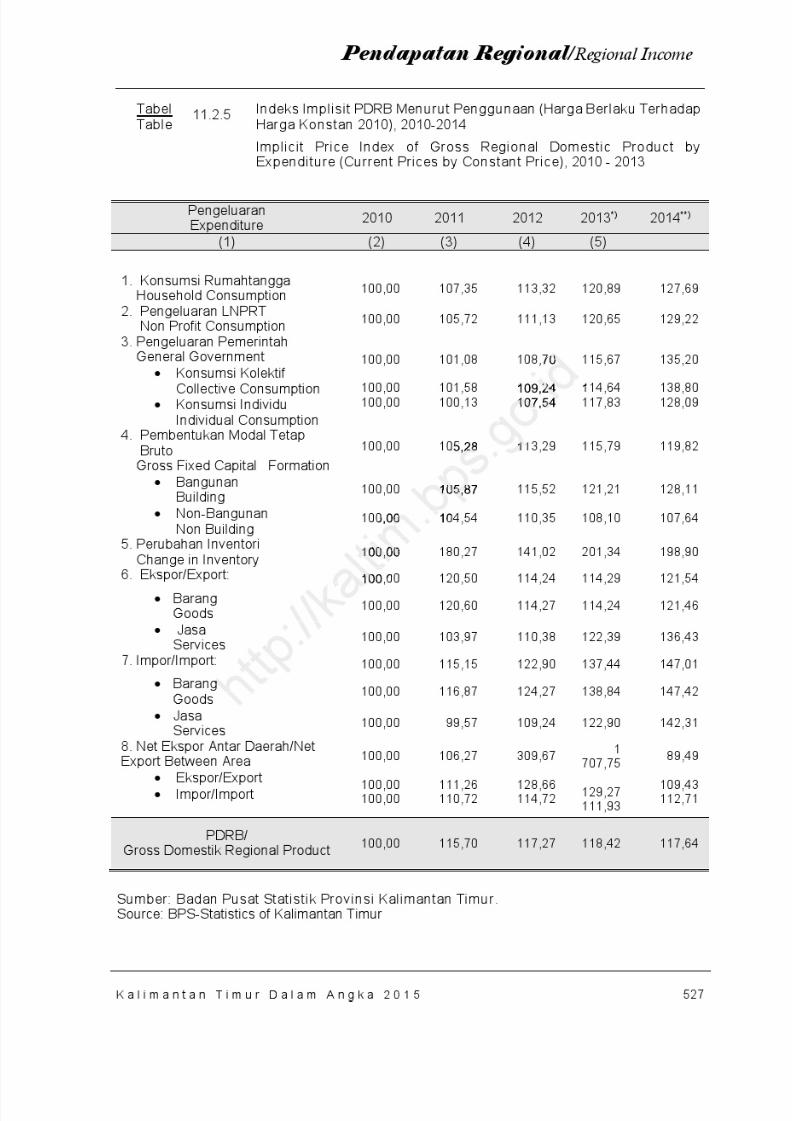
8/20/2019 Kalimantan Timur Dalam Angka Tahun 2015
http://slidepdf.com/reader/full/kalimantan-timur-dalam-angka-tahun-2015 593/623
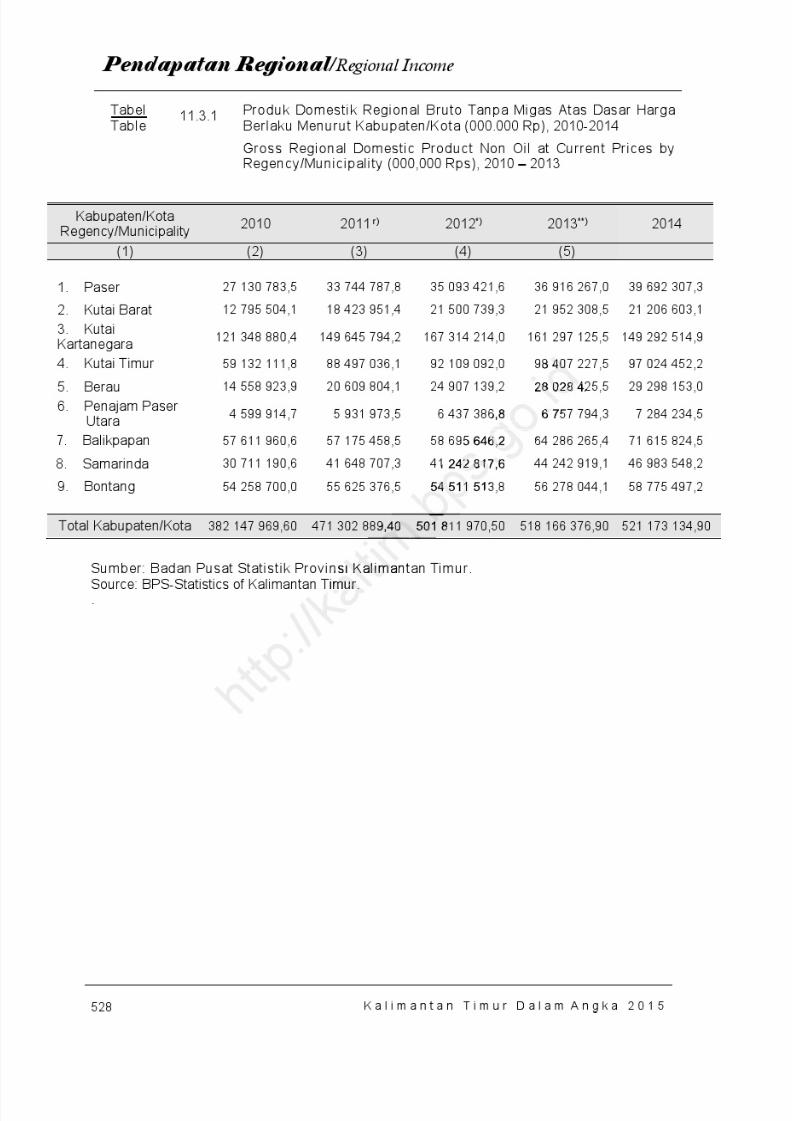
8/20/2019 Kalimantan Timur Dalam Angka Tahun 2015
http://slidepdf.com/reader/full/kalimantan-timur-dalam-angka-tahun-2015 594/623
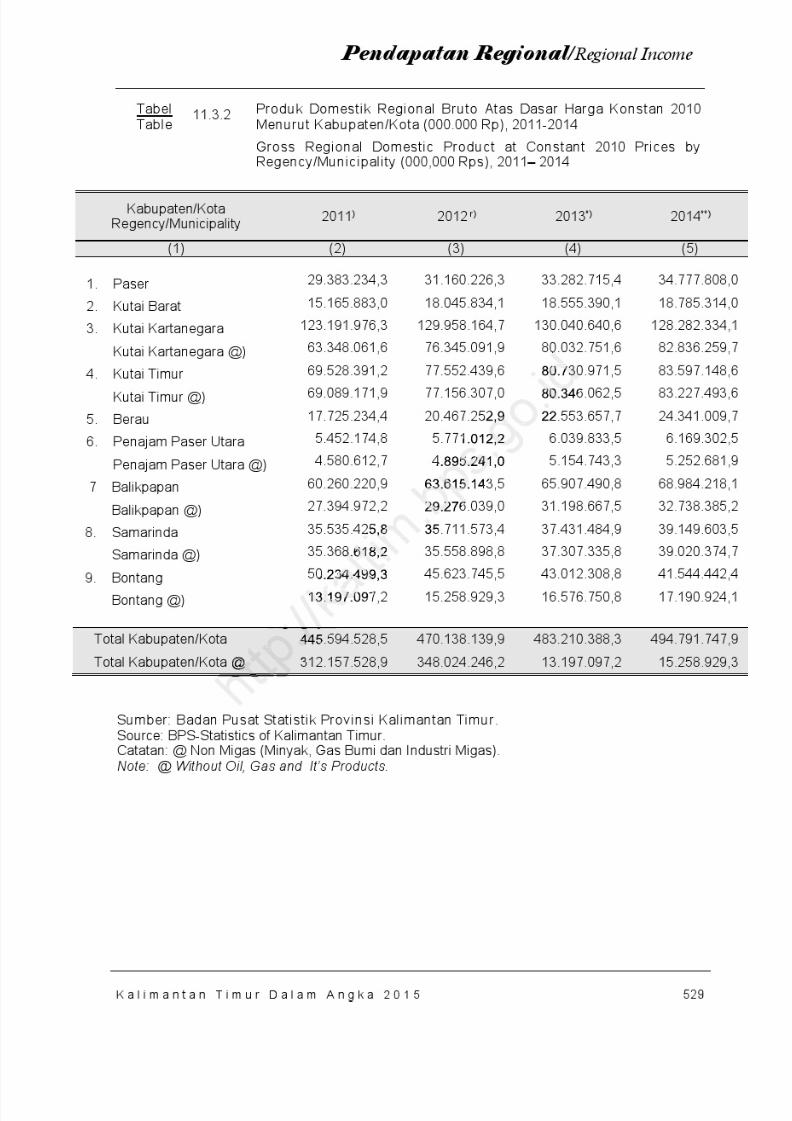
8/20/2019 Kalimantan Timur Dalam Angka Tahun 2015
http://slidepdf.com/reader/full/kalimantan-timur-dalam-angka-tahun-2015 595/623

8/20/2019 Kalimantan Timur Dalam Angka Tahun 2015
http://slidepdf.com/reader/full/kalimantan-timur-dalam-angka-tahun-2015 596/623
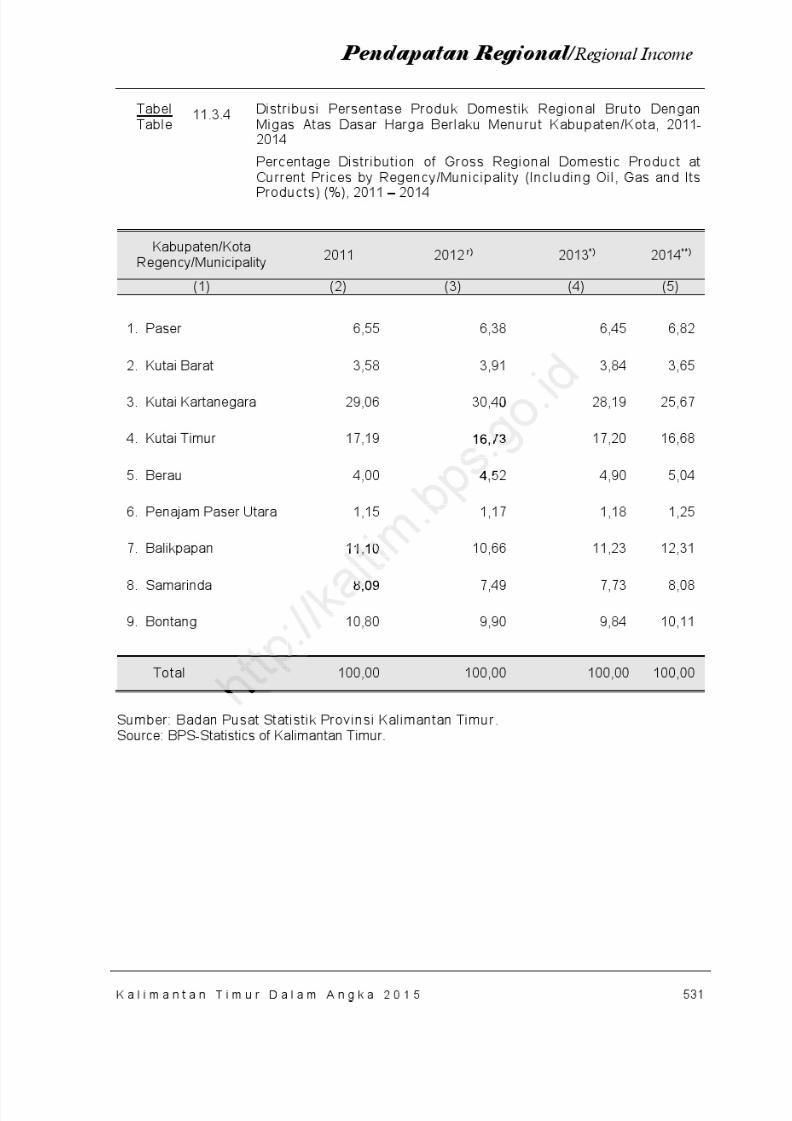
8/20/2019 Kalimantan Timur Dalam Angka Tahun 2015
http://slidepdf.com/reader/full/kalimantan-timur-dalam-angka-tahun-2015 597/623
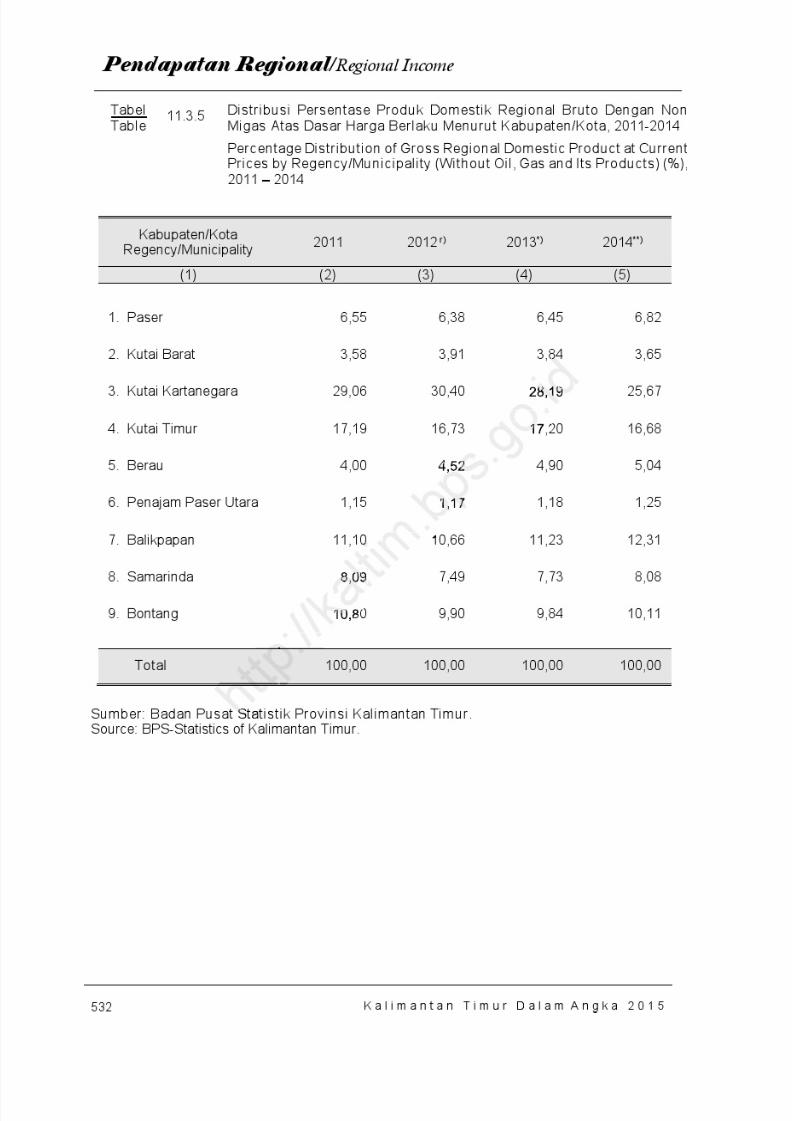
8/20/2019 Kalimantan Timur Dalam Angka Tahun 2015
http://slidepdf.com/reader/full/kalimantan-timur-dalam-angka-tahun-2015 598/623
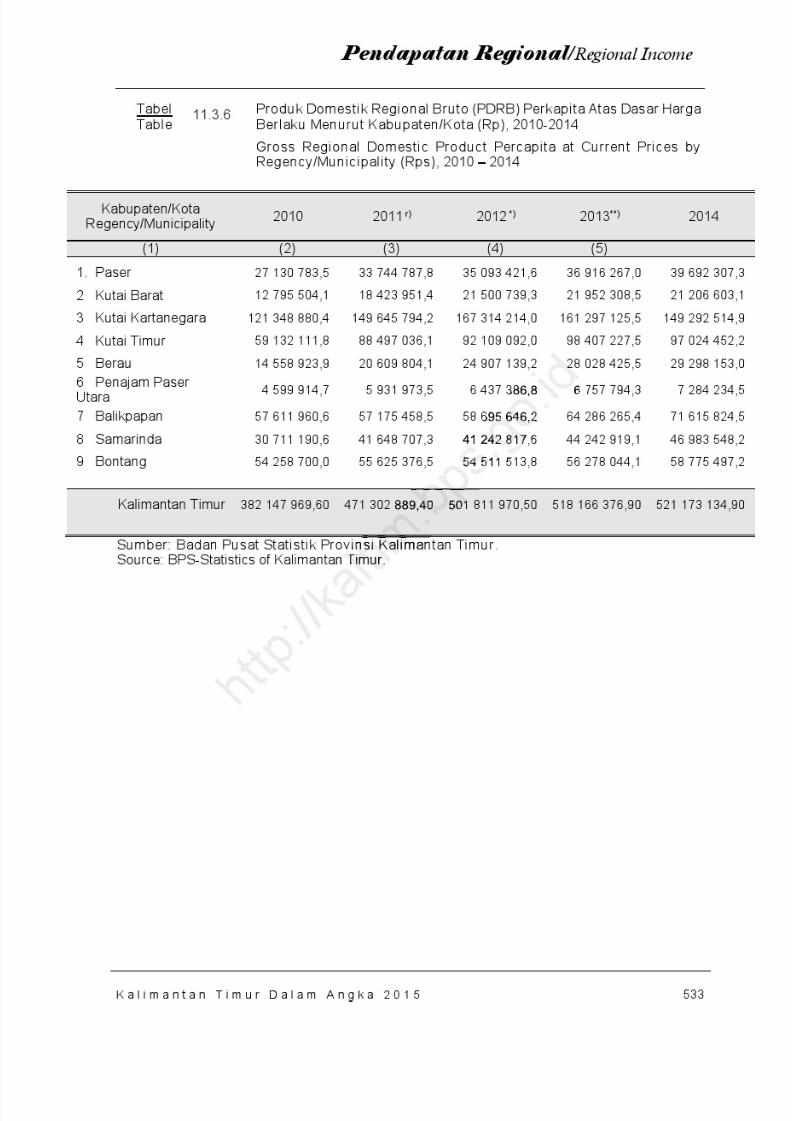
8/20/2019 Kalimantan Timur Dalam Angka Tahun 2015
http://slidepdf.com/reader/full/kalimantan-timur-dalam-angka-tahun-2015 599/623
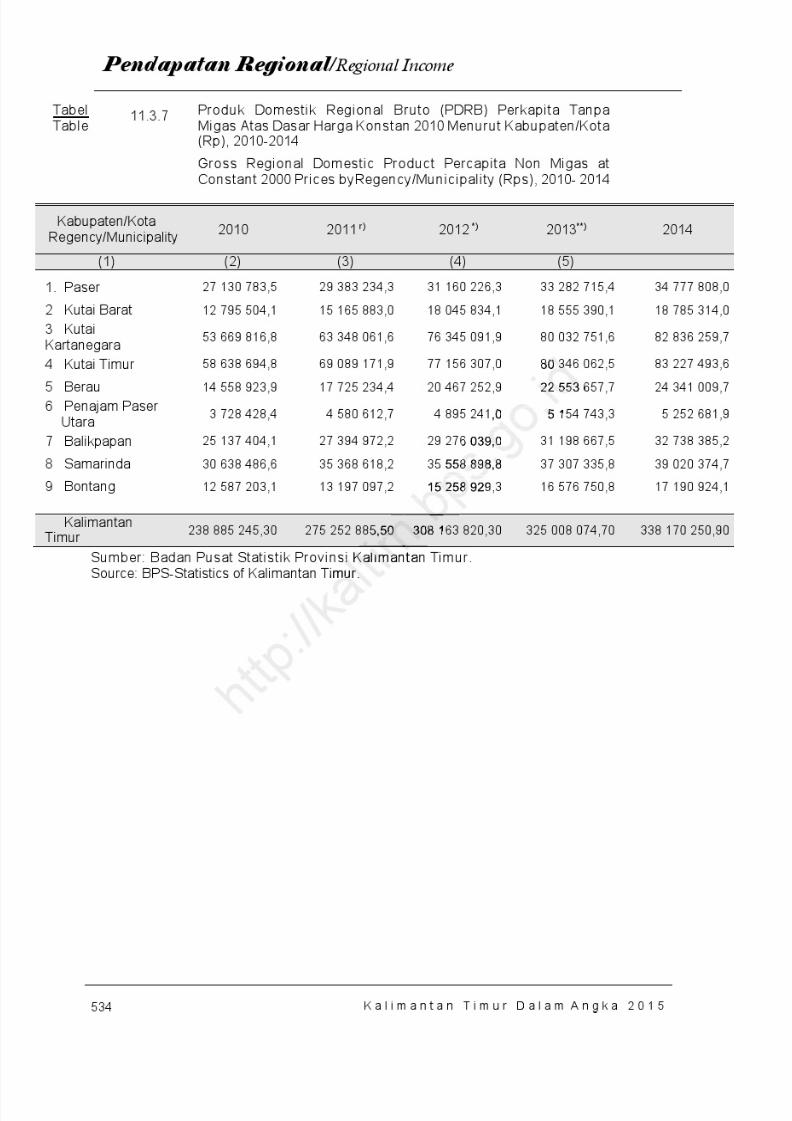
8/20/2019 Kalimantan Timur Dalam Angka Tahun 2015
http://slidepdf.com/reader/full/kalimantan-timur-dalam-angka-tahun-2015 600/623
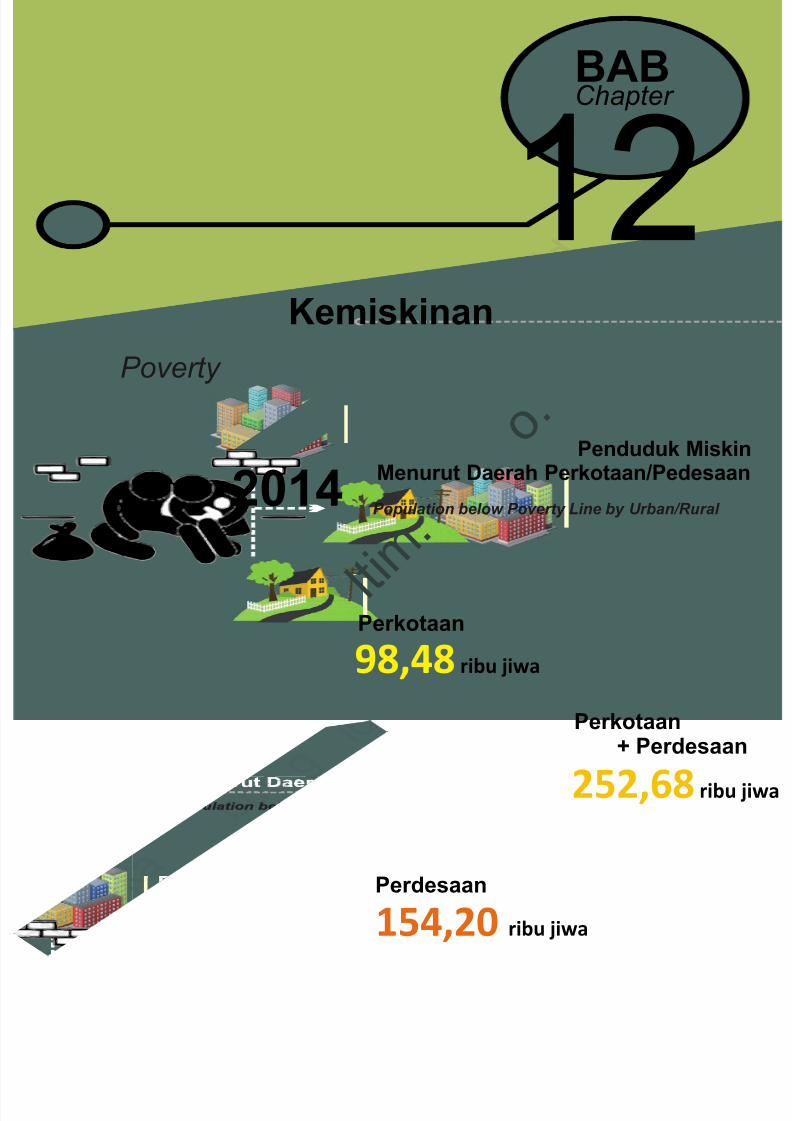
8/20/2019 Kalimantan Timur Dalam Angka Tahun 2015
http://slidepdf.com/reader/full/kalimantan-timur-dalam-angka-tahun-2015 601/623
12Kemiskinan
BABChapter
Poverty
98,48 ribu jiwa
Perkotaan
154,20 ribu jiwa
Perdesaan
252,68 ribu jiwa
Perkotaan + Perdesaan
Penduduk MiskinMenurut Daerah Perkotaan/Pedesaan
Population below Poverty Line by Urban/Rural 2014
l t i m .
o .

8/20/2019 Kalimantan Timur Dalam Angka Tahun 2015
http://slidepdf.com/reader/full/kalimantan-timur-dalam-angka-tahun-2015 602/623
h t t p : / / k a l t i m
. b p s . g o . i d
8/20/2019 Kalimantan Timur Dalam Angka Tahun 2015
http://slidepdf.com/reader/full/kalimantan-timur-dalam-angka-tahun-2015 603/623
537
Kemiskinan /
Poverty
K a l i m a n t a n T i m u r D a l a m A n g k a 2 0 1 5
12. PENDUDUK MISKIN
Jumlah penduduk miskin diKalimantan Timur (termasukKaltara) pada tahun 2014mengalami sedikit peningkatanyaitu dari 248,69 ribu jiwa di tahun2013 menjadi 252,68 ribu jiwa.Besar kecilnya jumlah pendudukmiskin dipengaruhi oleh ukurangaris kemiskinan, karena penduduk
miskin adalah penduduk yangmemiliki rata-rata pengeluaran perkapita per bulan di bawah gariskemiskinan.
Menurut kabupaten/kota, jumlah penduduk miskin terbanyakpada tahun 2013 ada di KabupatenKutai Kartanegara sebanyak 52,10ribu jiwa namun yang memilikipersentase penduduk miskinterbanyak adalah Kabupaten KutaiTimur sebesar 11,73 persen.
12. POOR POPULATION
The number of poor people inKalimantan Timur(include Kaltara)in 2014 was increased from 248,69thousand people to 252.68 thousand people. It's affected by poverty linebecause of the poor are people whohave an average expenditure perkapita per month below the povertyline.
In 2013 highest number of poor people in Regency/ Municipalitywas in Kutai Kartanegara with 52.10thousand poor people but thehighest percentage of poor peoplewas in Kutai Timur with 9.06 percent.
,10emi likimis i
patenpersen.
In 2013eople i
was intho
8/20/2019 Kalimantan Timur Dalam Angka Tahun 2015
http://slidepdf.com/reader/full/kalimantan-timur-dalam-angka-tahun-2015 604/623
538
Kemiskinan /
Poverty
K a l i m a n t a n T i m u r D a l a m A n g k a 2 0 1 5
PENJELASAN TEKNIS
1. Gini Ratio adalah salah satuukuran ketimpangan penda-patan penduduk secaramenyeluruh yang didasarkanpada kurva Lorenz yaitu kurva 2dimensi antara distribusipenduduk (persentase kumulatifpenduduk) dan distribusipengeluaran perkapita (persen-tase kumulatif pengeluaranperkapita).
2. Garis Kemiskinan tingkatminimum pendapatan yangdianggap perlu dipenuhi untukmemperoleh standar hidup yang
mencukupi di suatu negara
3. Penduduk Miskin adalahpenduduk yang memiliki rata-rata pengeluaran per kapita perbulan dibawah garis kemiskinan.
TECHNICAL NOTES
1. Gini Ratio is a measure of incomeinequality as a whole populationbased on the Lorenz curve is two-dimensional curves of populationdistribution (cumulative percentage of the population)and the distribution ofexpenditure per capita(percentage of cumulativeexpenditure per capita).
2. Poverty line is considered aminimum level of income thatneeds to be required to obtain anadequate standard of living in acountry.
3. Poor population is the population who have an averageexpenditure per capita permonth poverty line.
a l t i m .
o .
adalami i i r
per kapgaris ke
o per cap
vertyminimuneea
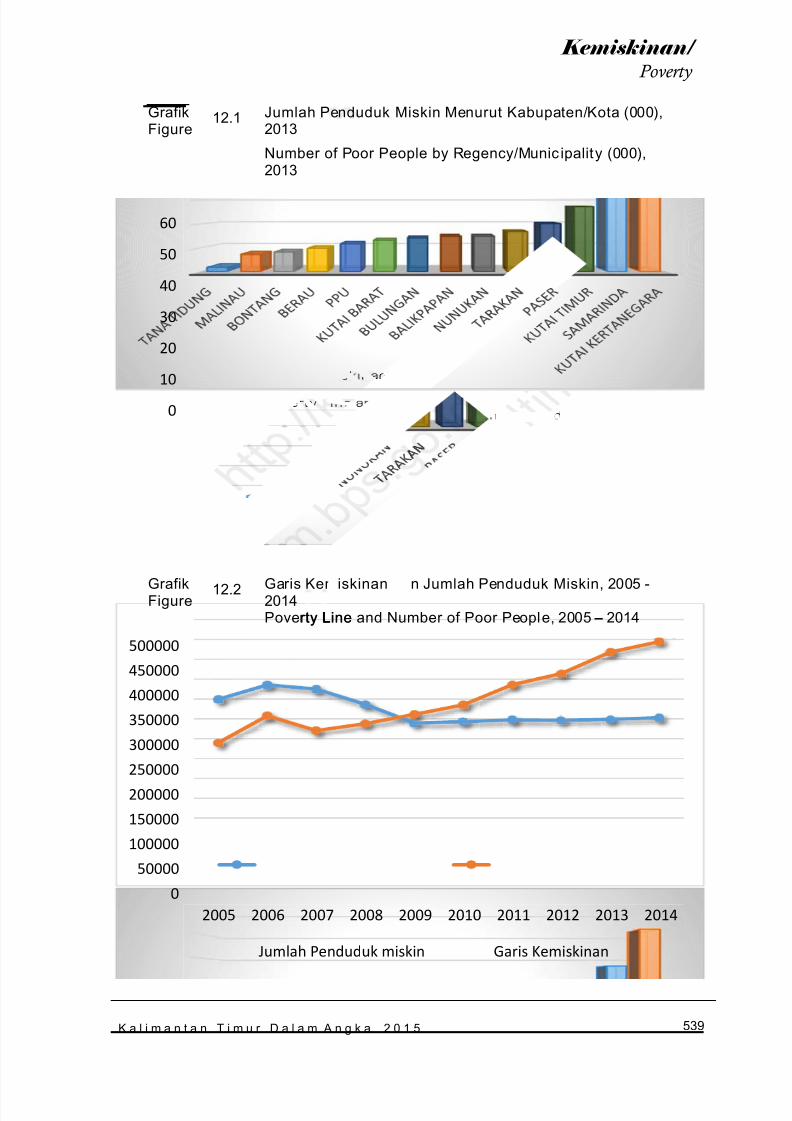
8/20/2019 Kalimantan Timur Dalam Angka Tahun 2015
http://slidepdf.com/reader/full/kalimantan-timur-dalam-angka-tahun-2015 605/623
539
Kemiskinan /
Poverty
K a l i m a n t a n T i m u r D a l a m A n g k a 2 0 1 5
GrafikFigure
12.1 Jumlah Penduduk Miskin Menurut Kabupaten/Kota (000),2013
Number of Poor People by Regency/Munic ipality (000),2013
GrafikFigure
12.2 Garis Kemiskinan dan Jumlah Penduduk Miskin, 2005 -2014Poverty Line and Number of Poor People, 2005 – 2014
010
20
30
40
50
60
0
50000
100000
150000
200000250000
300000
350000
400000
450000
500000
2005 2006 2007 2008 2009 2010 2011 2012 2013 2014
Jumlah Penduduk miskin Garis Kemiskinan
iskinan
rty LineL
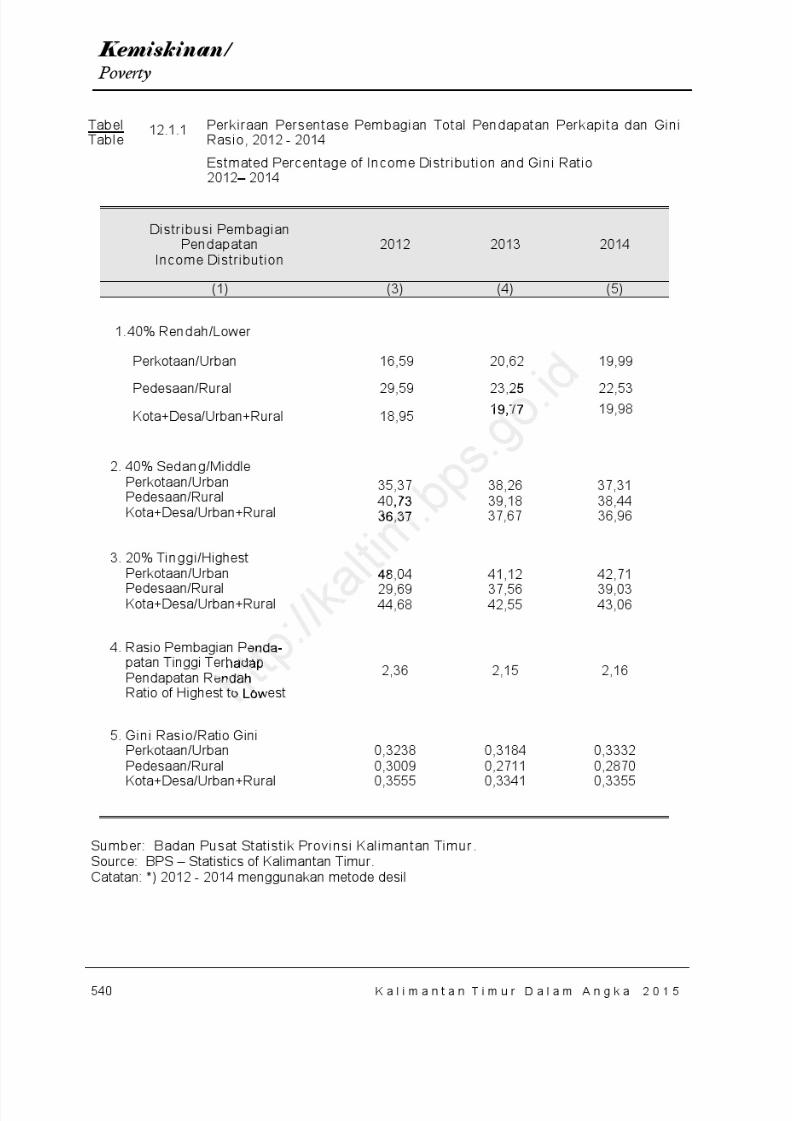
8/20/2019 Kalimantan Timur Dalam Angka Tahun 2015
http://slidepdf.com/reader/full/kalimantan-timur-dalam-angka-tahun-2015 606/623
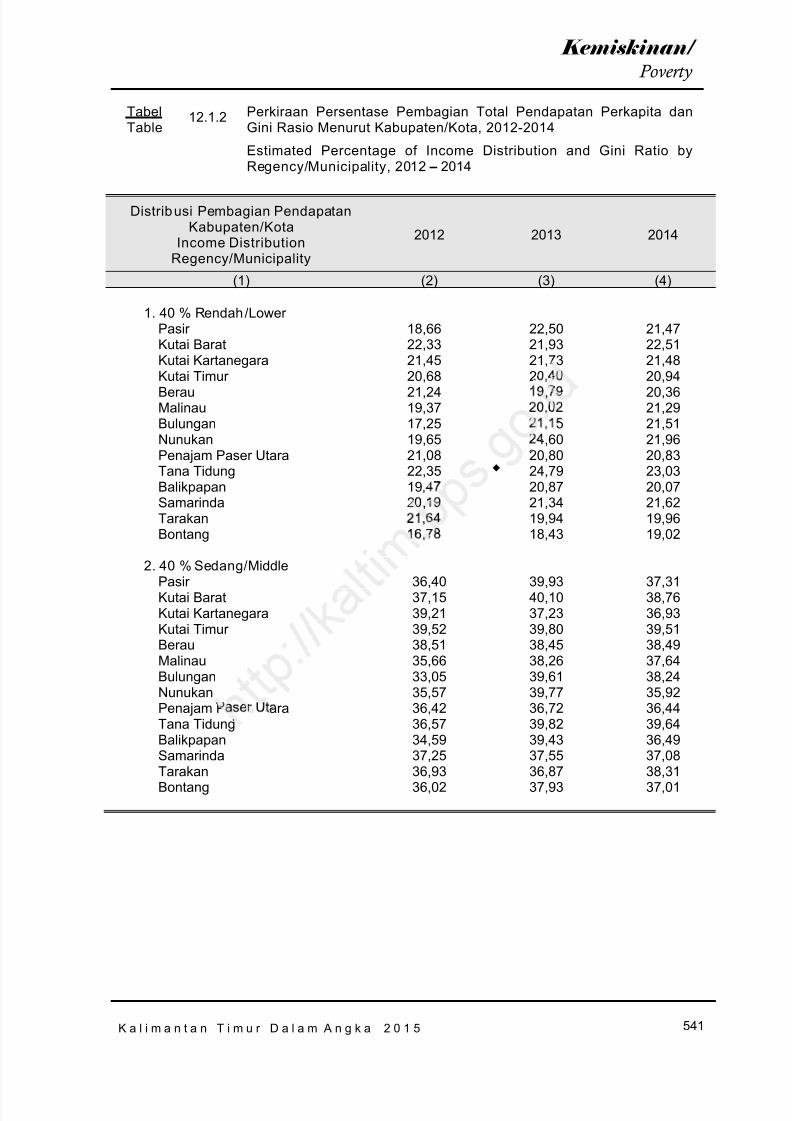
8/20/2019 Kalimantan Timur Dalam Angka Tahun 2015
http://slidepdf.com/reader/full/kalimantan-timur-dalam-angka-tahun-2015 607/623
541
Kemiskinan /
Poverty
K a l i m a n t a n T i m u r D a l a m A n g k a 2 0 1 5
TabelTable
12.1.2 Perkiraan Persentase Pembagian Total Pendapatan Perkapita danGini Rasio Menurut Kabupaten/Kota, 2012-2014
Estimated Percentage of Income Distribution and Gini Ratio byRegency/Municipality, 2012 – 2014
Distribusi Pembagian PendapatanKabupaten/Kota
Income DistributionRegency/Municipality
2012 2013 2014
(1) (2) (3) (4)
1. 40 % Rendah/ Lower Pasir Kutai BaratKutai KartanegaraKutai Timur BerauMalinauBulunganNunukanPenajam Paser UtaraTana TidungBalikpapanSamarindaTarakanBontang
18,6622,3321,4520,6821,2419,3717,2519,6521,0822,3519,4720,1921,6416,78
22,5021,9321,7320,4019,7920,0221,1524,6020,8024,7920,8721,3419,9418,43
21,4722,5121,4820,9420,3621,2921,5121,9620,8323,0320,0721,6219,9619,02
2. 40 % Sedang/ MiddlePasir Kutai BaratKutai KartanegaraKutai Timur BerauMalinauBulunganNunukanPenajam Paser UtaraTana TidungBalikpapanSamarindaTarakanBontang
36,4037,1539,2139,5238,5135,6633,0535,5736,4236,5734,5937,2536,9336,02
39,9340,1037,2339,8038,4538,2639,6139,7736,7239,8239,4337,5536,8737,93
37,3138,7636,9339,5138,4937,6438,2435,9236,4439,6436,4937,0838,3137,01
,
,
.
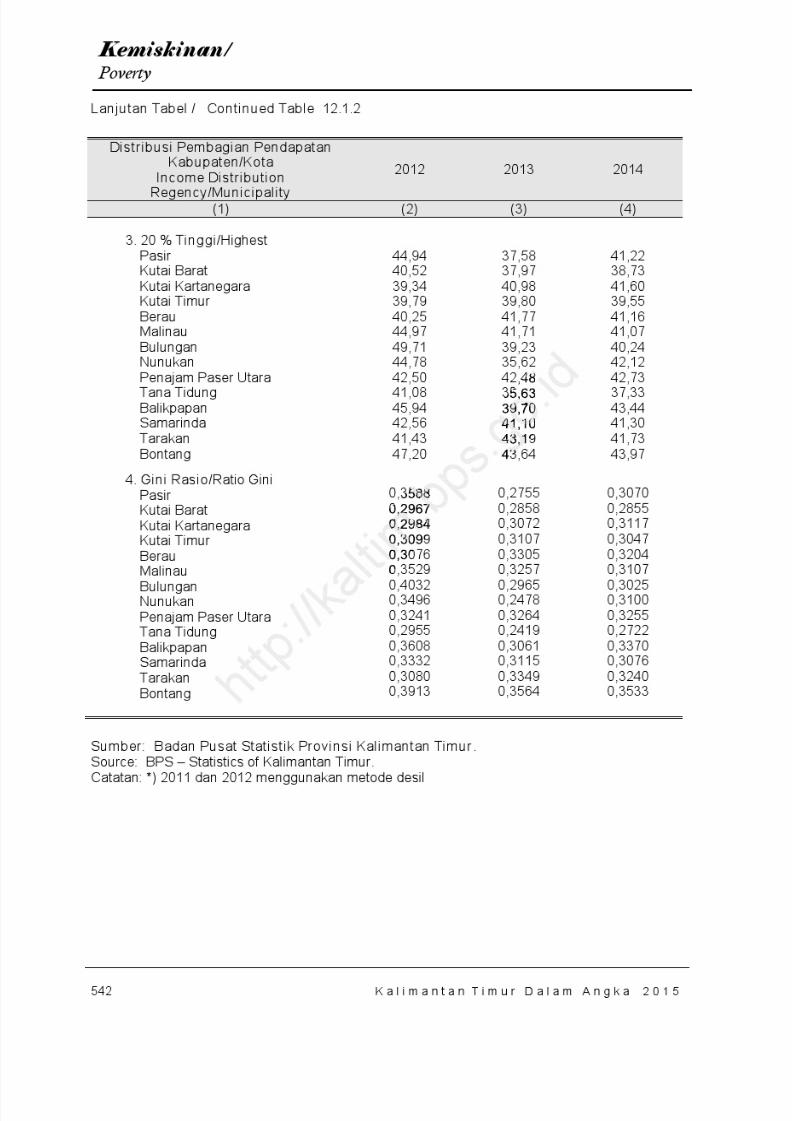
8/20/2019 Kalimantan Timur Dalam Angka Tahun 2015
http://slidepdf.com/reader/full/kalimantan-timur-dalam-angka-tahun-2015 608/623
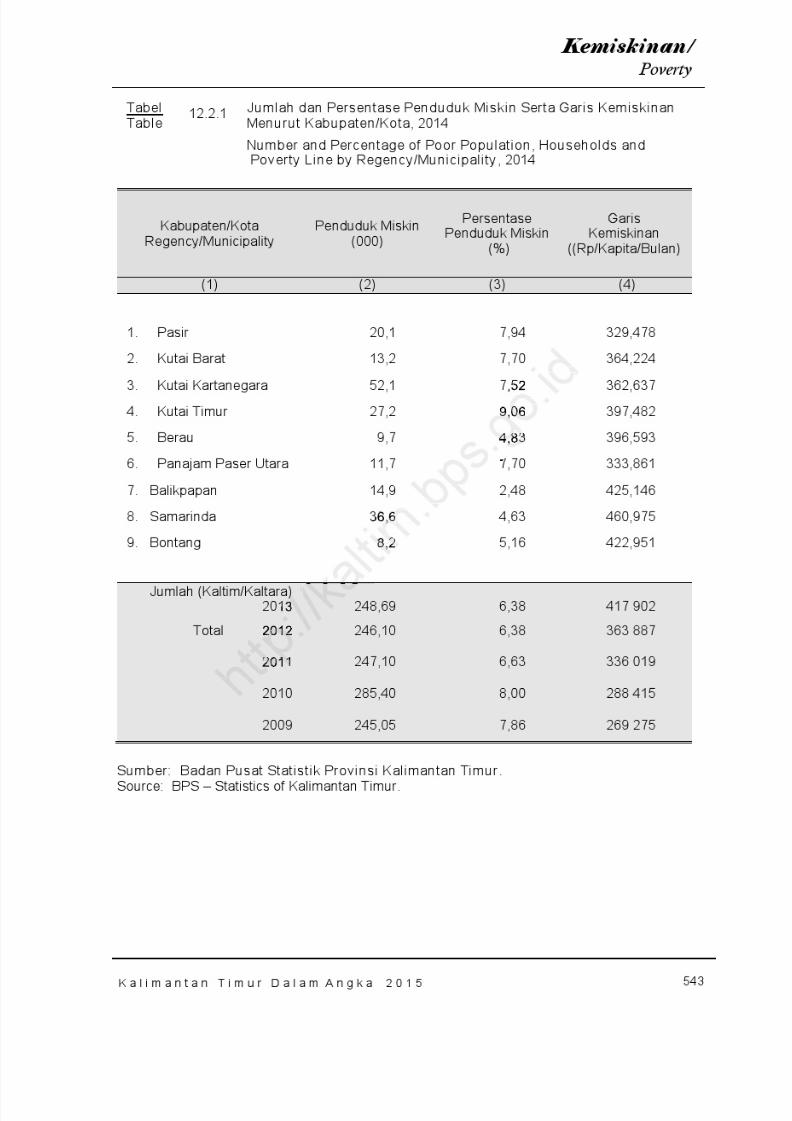
8/20/2019 Kalimantan Timur Dalam Angka Tahun 2015
http://slidepdf.com/reader/full/kalimantan-timur-dalam-angka-tahun-2015 609/623
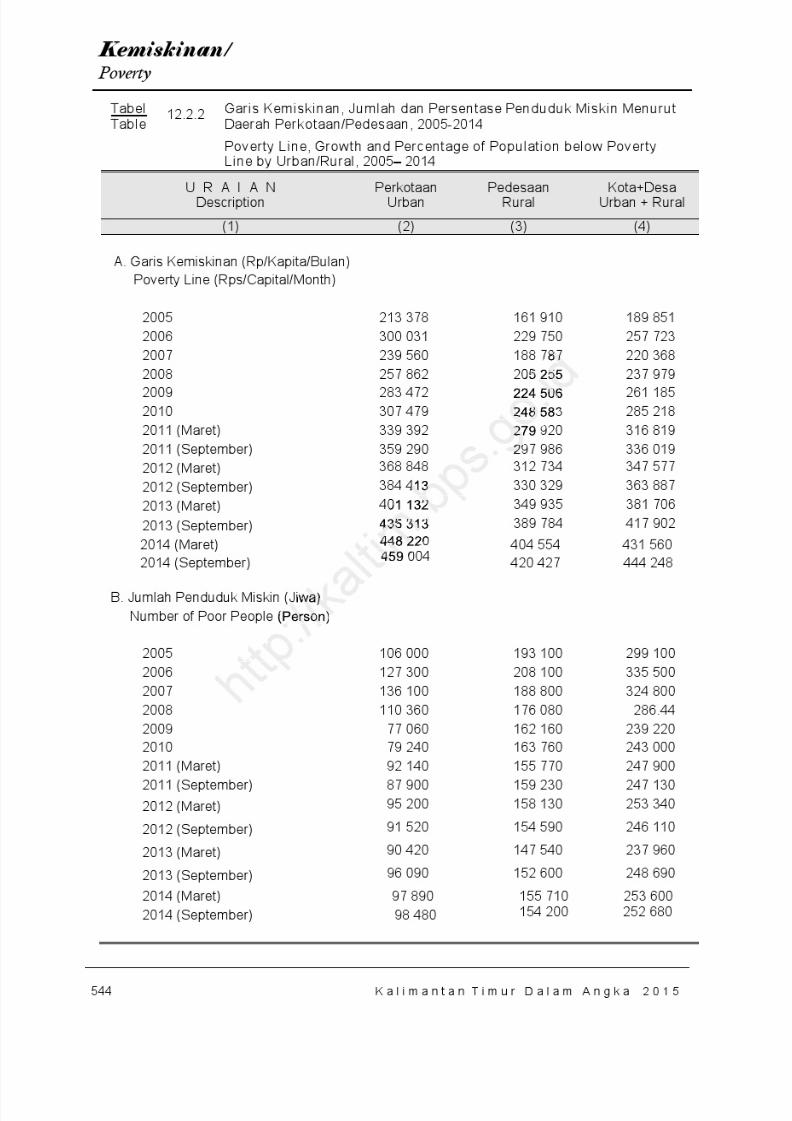
8/20/2019 Kalimantan Timur Dalam Angka Tahun 2015
http://slidepdf.com/reader/full/kalimantan-timur-dalam-angka-tahun-2015 610/623
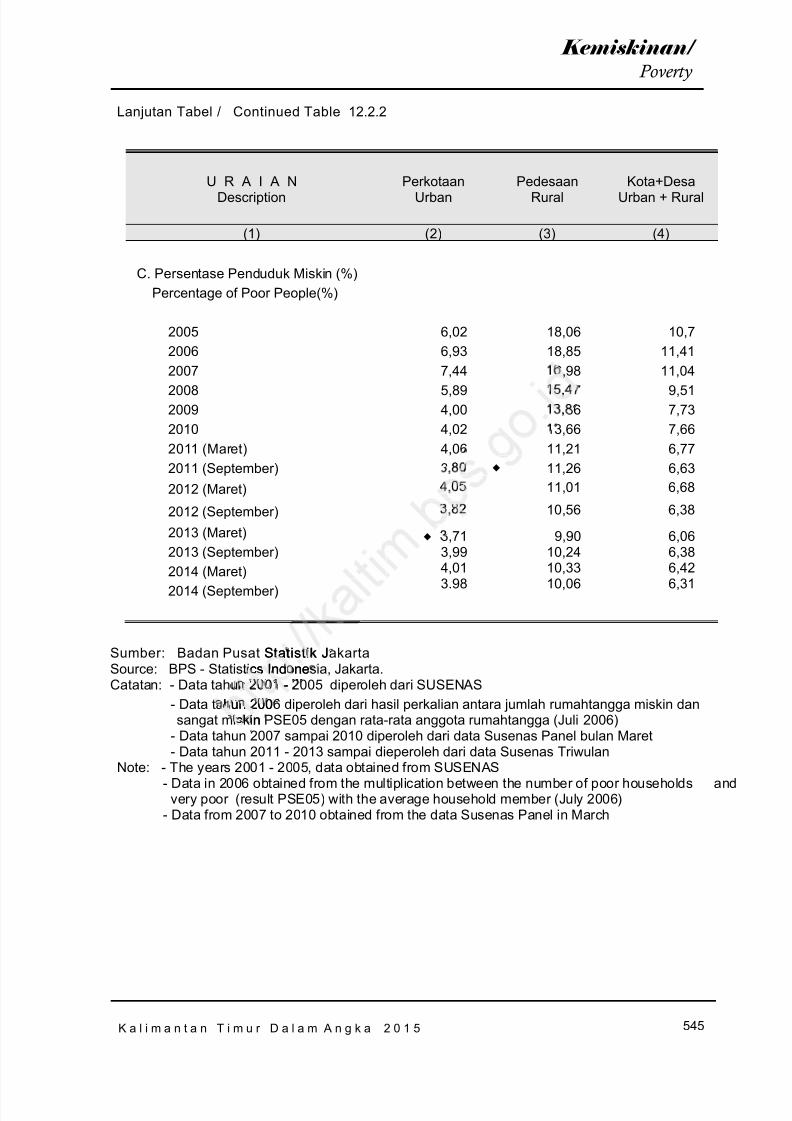
8/20/2019 Kalimantan Timur Dalam Angka Tahun 2015
http://slidepdf.com/reader/full/kalimantan-timur-dalam-angka-tahun-2015 611/623
545
Kemiskinan /
Poverty
K a l i m a n t a n T i m u r D a l a m A n g k a 2 0 1 5
Lanjutan Tabel / Continued Table 12.2.2
U R A I A NDescription
PerkotaanUrban
PedesaanRural
Kota+DesaUrban + Rural
(1) (2) (3) (4)
C. Persentase Penduduk Miskin (%)Percentage of Poor People(%)
2005200620072008200920102011 (Maret)2011 (September)
6,026,937,445,894,004,024,063,80
18,0618,8516,9815,4713,8613,6611,2111,26
10,711,4111,04
9,517,737,666,776,63
2012 (Maret) 4,05 11,01 6,68
2012 (September) 3,82 10,56 6,38
2013 (Maret)2013 (September)
2014 (Maret)2014 (September)
3,713,994,013.98
9,9010,2410,3310,06
6,066,386,426,31
Sumber: Badan Pusat Statistik JakartaSource: BPS - Statistics Indonesia, Jakarta.Catatan: - Data tahun 2001 - 2005 diperoleh dari SUSENAS - Data tahun 2006 diperoleh dari hasil perkalian antara jumlah rumahtangga miskin dan
sangat miskin PSE05 dengan rata-rata anggota rumahtangga (Juli 2006) - Data tahun 2007 sampai 2010 diperoleh dari data Susenas Panel bulan Maret - Data tahun 2011 - 2013 sampai dieperoleh dari data Susenas Triwulan
Note: - The years 2001 - 2005, data obtained from SUSENAS- Data in 2006 obtained from the multiplication between the number of poor households and
very poor (result PSE05) with the average household member (July 2006) - Data from 2007 to 2010 obtained from the data Susenas Panel in March
.
,
.
Statistik Jcs IndoneI
n --hun 200
s n

8/20/2019 Kalimantan Timur Dalam Angka Tahun 2015
http://slidepdf.com/reader/full/kalimantan-timur-dalam-angka-tahun-2015 612/623
h t t p : / / k a l t i m
. b p s . g o . i d
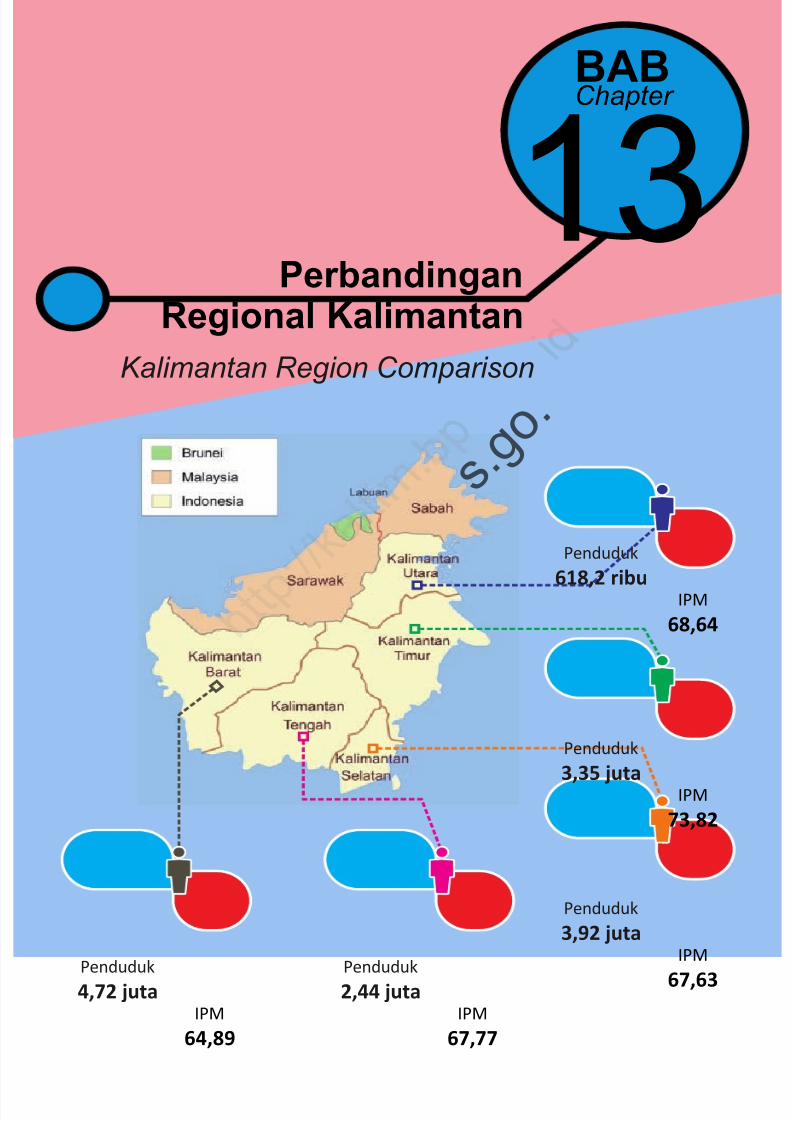
8/20/2019 Kalimantan Timur Dalam Angka Tahun 2015
http://slidepdf.com/reader/full/kalimantan-timur-dalam-angka-tahun-2015 613/623
13PerbandinganRegional Kalimantan
BABChapter
Kalimantan Region Comparison
Penduduk
618,2 ribuIPM
68,64
Penduduk
3,35 jutaIPM
73,82
Penduduk3,92 juta
IPM67,63
Penduduk2,44 juta
IPM67,77
Penduduk4,72 juta
IPM64,89
s . g o .

8/20/2019 Kalimantan Timur Dalam Angka Tahun 2015
http://slidepdf.com/reader/full/kalimantan-timur-dalam-angka-tahun-2015 614/623
h t t p : / / k a l t i m
. b p s . g o . i d
8/20/2019 Kalimantan Timur Dalam Angka Tahun 2015
http://slidepdf.com/reader/full/kalimantan-timur-dalam-angka-tahun-2015 615/623
K a l i m a n t a n T i m u r D a l a m A n g k a 2 0 1 5 549
Perbandingan Regional Kalimantan / Kalimantan Re ion Com arison
Penjelasan Teknis
1. Sensus Penduduk berartiperhitungan jumlah penduduksecara periodik. Data yangdicapai, biasanya bukan sajameliputi jumlah orang, tetapi juga fakta mengenai misalnya jenis kelamin, usia, bahasa, danhal-hal lain yang dianggap perlu. Dalam publikasi ini ditampilkanProyeksi Penduduk hasil sensusPenduduk Kabupaten/ Kotatahun 2012, 2013 dan 2014.
2. Laju Pertumbuhan ProdukDomestik Regional Bruto (PDRB)atas dasar harga konstan
diperoleh dengan menguranginilai pada tahun ke n dengan nilaipada tahun ke (n-1) dibagidengan nilai pada tahun ke (n-1)dikalikan dengan 100 persen.Laju pertumbuhan PDRBmenunjukkan tingkatperkembangan riil dari agregatpendapatan untuk masing-masing tahun dibandingkandengan tahun sebelumnya.
3. Indeks Harga Konsumen (IHK)indeks yang mengukur rata-rataperubahan harga antarwaktudari suatu paket jenis barang dan jasa yang dikonsumsi oleh
penduduk / rumah tangga di
Technical Note
Census means the periodiccalculation of the total population. Data isachieved, typically not onlyinclude the number of people, but also the fact ofgender, age, language, andother matters as may benecessary.
Shown in this publicationthe population censusresults for 2011, 2012 and2010.
1. Growth rate of DomesticRegional Product (GDRP)at constant market placeobtained by subtracting thevalue of GDRP year n withthe value of GDRP year n-1divided by value of GDRPyear n-1 then multiplied by100 percent. The growthrate of GDRP explains theincome growth during thegiven period.
2. Consumer Price Index (CPI)index that measures theaverage change inintertemporal price of a package goodsand services
consumed by residents
sa
. b p s .
an
rangigan nila
-1) ditahun k
an 100tumbuhu
an
own inthe presu2
.
8/20/2019 Kalimantan Timur Dalam Angka Tahun 2015
http://slidepdf.com/reader/full/kalimantan-timur-dalam-angka-tahun-2015 616/623
K a l i m a n t a n T i m u r D a l a m A n g k a 2 0 1 5538
Perbandingan Regional Kalimantan/ Kalimantan Region Comparison
daerah perkotaan dengan dasarsuatu periode tertentu. Dalam publikasi ini untuk tahun2006-2007 menggunakan tahundasar 2000=100 sementarauntuk tahun 2008-2010menggunakan tahun dasar2007=100 itulah sebabnya padatahun 2008 IHK terlihat menurunpadahal sebenarnya tidak.
4. Penduduk Miskin adalahpenduduk yang memiliki rata-rata pengeluaran perkapitaperbulan dibawah gariskemiskinan.
5. Garis Kemiskinan (GK)merupakan penjumlahan dariGaris Kemiskinan Makanan
(GKM) dan Garis Kemiskinan NonMakanan (GKNM).
6. Garis Kemiskinan Makanan(GKM) merupakan nilaipengeluaran kebutuhanminimum makanan yangdisetarakan dengan 2.100kilokalori perkapita perhari.Paket komoditi kebutuhan dasarmakanan diwakili oleh 52 jeniskomoditi (padi - padian, umbi-umbian, ikan, daging, telur dansusu, sayuran, kacang-kacangan,buah-buahan, minyak danlemak, dll)
/households in urban areas onthe basis of certain period.In this publication for the years2006-2007 using the base year2000=100 while for the years2008-2010 using the base year2007=100 that’s why in 2008 theCPI is decreasing when in fact isnot.
3. A person whose expenditure percapita per month is below the poverty line is considered to be poor.
4. Poverty Line is the sum of FoodPoverty Line (FPL) and Non-Food
Poverty Line (NFPL).
5. The food poverty line refers tothe requirement of 2,100 kcal percapita per day. Package of basic needs of foodcommodities representated by52 types of commodities (rice-grains, tubers, fish, meat, eggsand dairy, vegetables, nuts, fruits, oils and fats, etc)
n
Makaakan
aka
ose exr mont
ine isr.
. Po
8/20/2019 Kalimantan Timur Dalam Angka Tahun 2015
http://slidepdf.com/reader/full/kalimantan-timur-dalam-angka-tahun-2015 617/623
K a l i m a n t a n T i m u r D a l a m A n g k a 2 0 1 5 539
Perbandingan Regional Kalimantan / Kalimantan Re ion Com arison
7. Garis Kemiskinan Non Makanan(GKNM) adalah kebutuhanminimum untuk perumahan,sandang, pendidikan dankesehatan. Paket komoditikebutuhan dasar non makanandiwakili oleh 51 jenis komoditi diperkotaan dan 47 jenis komoditidi pedesaan.
7. Non-food poverty line refers tothe daily minimum requirement for household necessities forclothing, education and health.Package of basic needs of non food commoditis represented by51 types of commodities in urbanareas and 47 types ofcommodities in rural areas.
h t t p : / / k a l t i m
. b p s . g o . i d
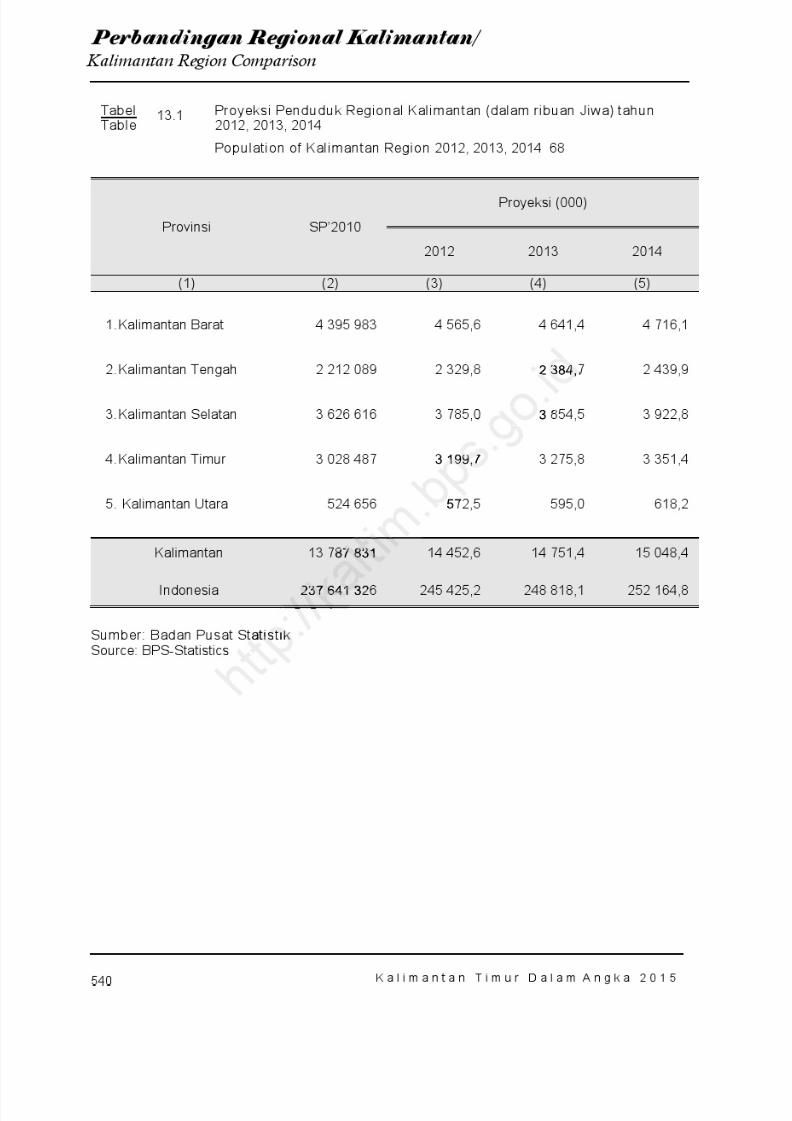
8/20/2019 Kalimantan Timur Dalam Angka Tahun 2015
http://slidepdf.com/reader/full/kalimantan-timur-dalam-angka-tahun-2015 618/623
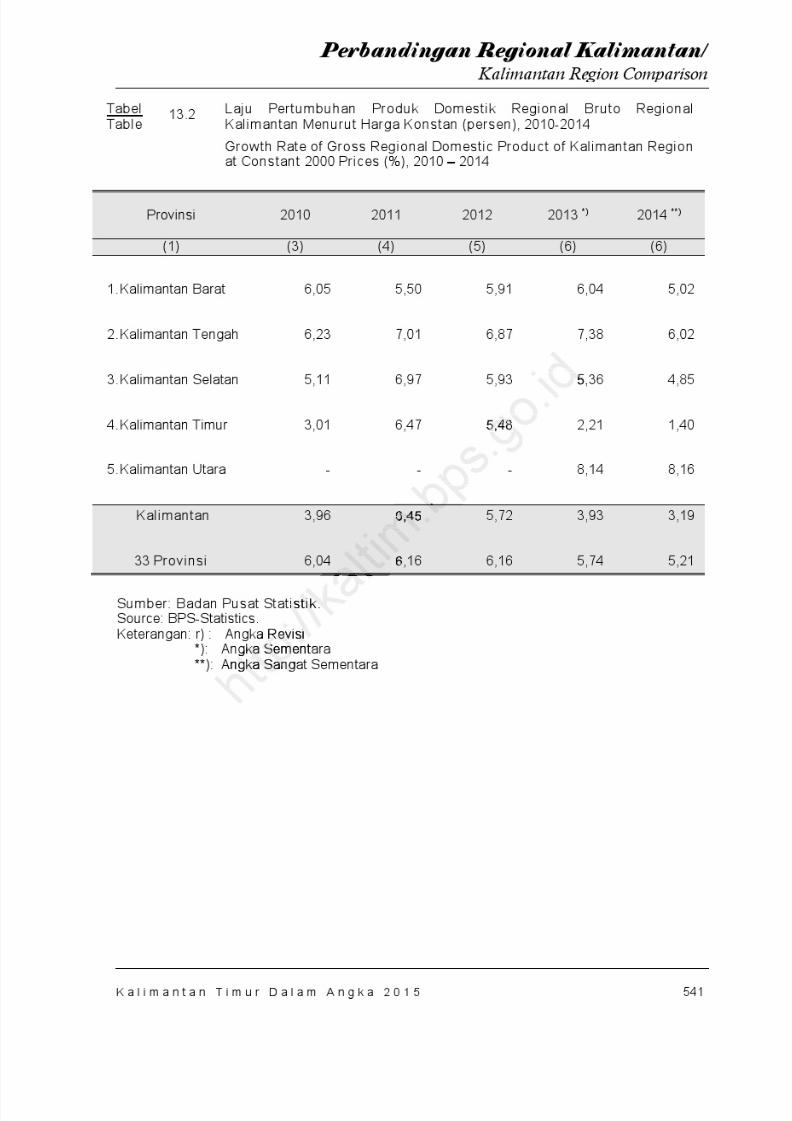
8/20/2019 Kalimantan Timur Dalam Angka Tahun 2015
http://slidepdf.com/reader/full/kalimantan-timur-dalam-angka-tahun-2015 619/623
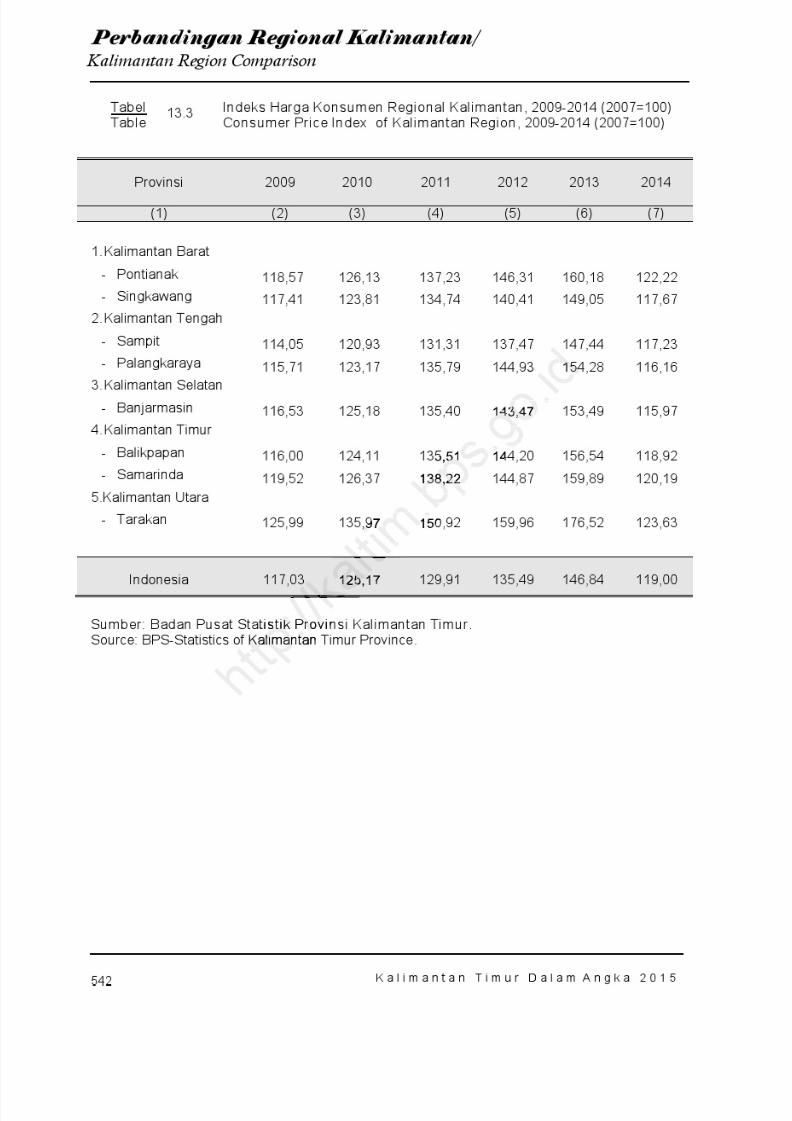
8/20/2019 Kalimantan Timur Dalam Angka Tahun 2015
http://slidepdf.com/reader/full/kalimantan-timur-dalam-angka-tahun-2015 620/623
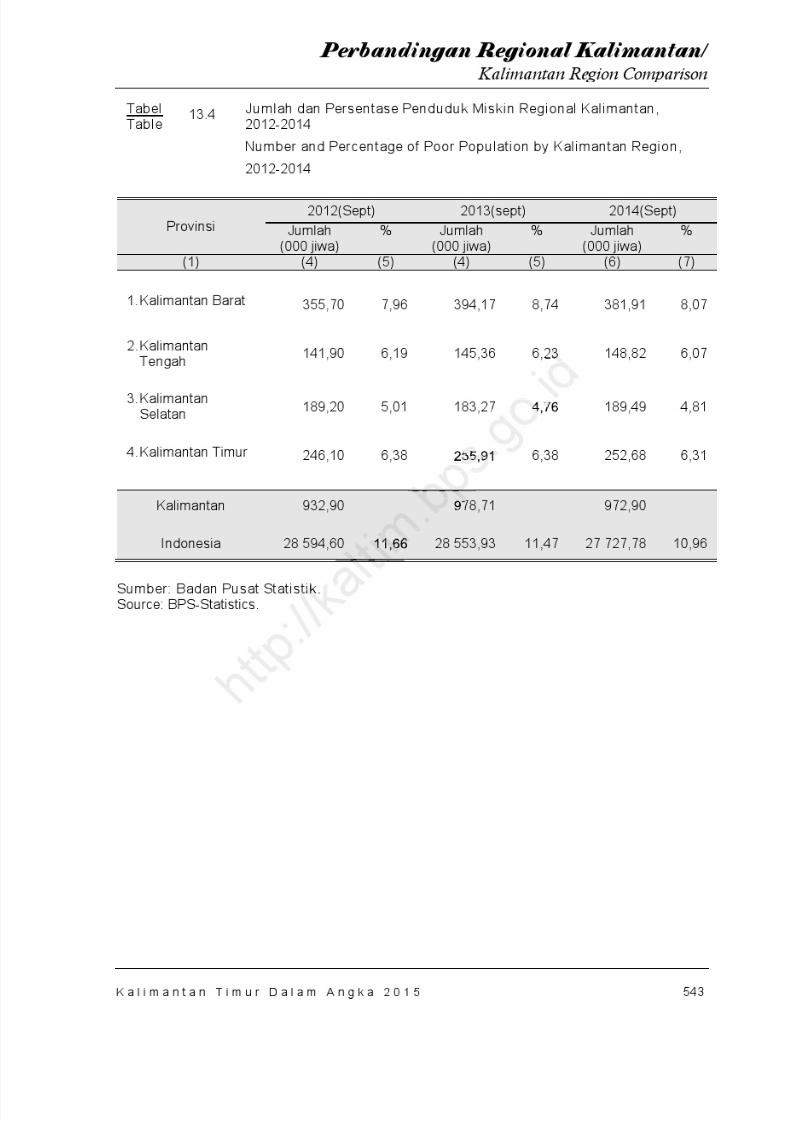
8/20/2019 Kalimantan Timur Dalam Angka Tahun 2015
http://slidepdf.com/reader/full/kalimantan-timur-dalam-angka-tahun-2015 621/623
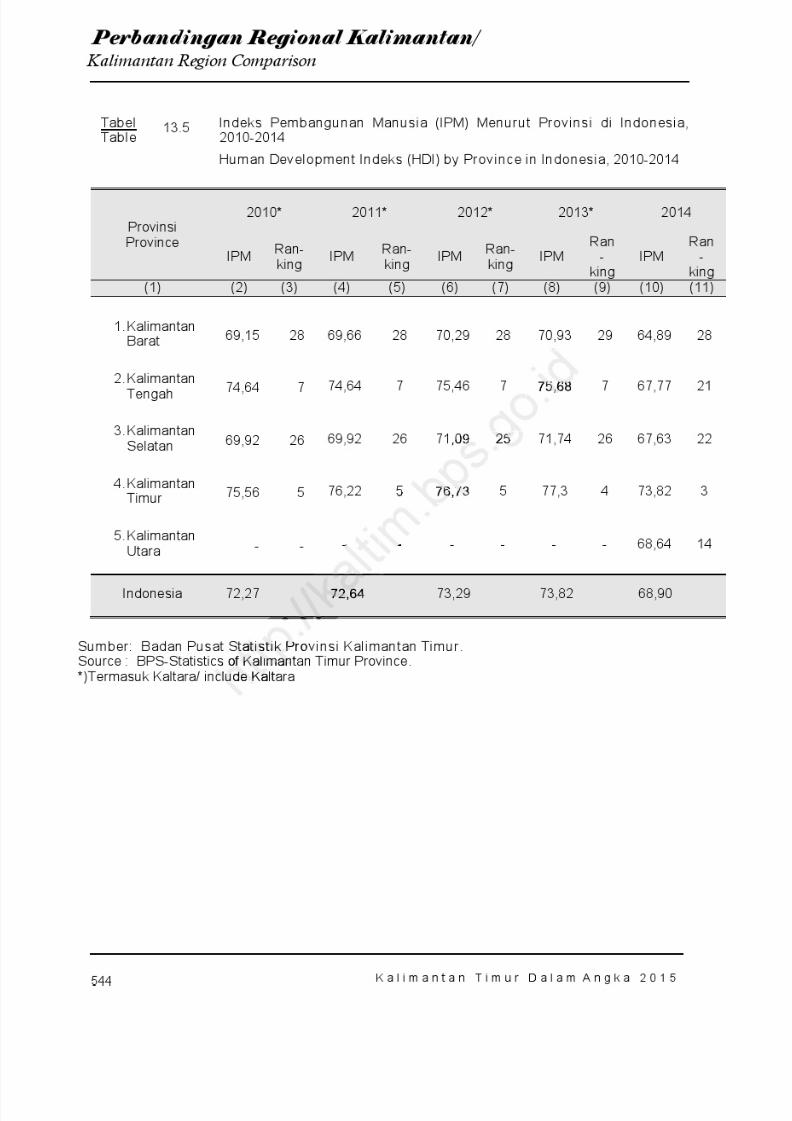
8/20/2019 Kalimantan Timur Dalam Angka Tahun 2015
http://slidepdf.com/reader/full/kalimantan-timur-dalam-angka-tahun-2015 622/623

8/20/2019 Kalimantan Timur Dalam Angka Tahun 2015
http://slidepdf.com/reader/full/kalimantan-timur-dalam-angka-tahun-2015 623/623