Intiland Development, Tbk - idx.co.id · properti berbasis di Indonesia yang bergerak ... ekonomi...
30
Transcript of Intiland Development, Tbk - idx.co.id · properti berbasis di Indonesia yang bergerak ... ekonomi...

Halaman 1 dari 14
Kontak: Equity & Index Valuation Division Phone: (6221) 7884 0200 [email protected]
“Pernyataan disclaimer pada halaman akhir
merupakan bagian yang tidak terpisahkan dari
dokumen ini”
www.PEFINDO Riset dan Konsultasi.com
Intiland Development, Tbk
Laporan Utama
Equity Valuation
8 Juni 2015
Target Harga
Terendah Tertinggi 930 1.130
Properti y
Kinerja Saham
0
100
200
300
400
500
600
700
800
4.400
4.600
4.800
5.000
5.200
5.400
5.600
Apr-14 Jun-14 Aug-14 Oct-14 Dec-14 Feb-15 Apr-15
DILDIHSG
IHSG DILD
Sumber : Bloomberg, PEFINDO Riset dan Konsultasi - Divisi
Valuasi Saham & Indexing
Informasi Saham Rp
Kode Saham DILD
Harga Saham per 5 Juni 2015 605
Harga Tertinggi 52 minggu terakhir 685
Harga Terendah 52 minggu terakhir 434
Kapitalisasi Pasar Tertinggi 52 minggu
(miliar)
7.100
Kapitalisasi Pasar Terendah 52 minggu
(miliar)
4.498
Market Value Added & Market Risk
0
0.2
0.4
0.6
0.8
1
1.2
1.4
1.6
1.8
-100
-50
0
50
100
150
200
250
300
2013 2014
Mar
ket
risk
MV
A
Axis Title
Market value added Market risk
Sumber : Bloomberg, PEFINDO Riset dan Konsultasi - Divisi
Valuasi Saham & Indexing
Pemegang Saham* (%) UBS AG Singapore 22,24
Credit Suisse AG Singapore 19,89
Treasury Stock 0,96
Publik (dibawah 5%) 56,91
Fase pertumbuhan yang sedang naik
PT Intiland Development Tbk (DILD) adalah perusahaan pengembang properti berbasis di Indonesia yang bergerak dalam pengembangan residensial, mixed-use estates dan bangunan residensial high-rise. Didirikan pada tahun 1983, bisnis Perusahaan diklasifikasikan menjadi empat divisi: superblok mixed-use, residensial, kawasan industri dan
investasi properti. Divisi pengembangan real estate terlibat dalam pengembangan residensial (low-rise), antara lain adalah Serenia Hills, Graha Famili dan Talaga Bestari; mixed-use estates, termasuk South Quarter dan Aeropolis, serta bangunan residensial high-rise , termasuk Regatta, Sumatera 36 dan 1Park Avenue. Perusahaan juga memiliki Ngoro Industrial Park, yang terletak di Mojokerto. Proyek-proyek tersebut terutama berlokasi di Jakarta dan Surabaya. Dengan lahan lebih dari 2.000 hektare (ha), kami percaya bahwa DILD memiliki sumber yang cukup untuk pertumbuhan masa depan.
“Pernyataan disclaimer pada halaman
akhir merupakan bagian yang tidak
terpisahkan dari dokumen ini”
www.pefindo-consulting.co.id
Intiland Development, Tbk
8 Juni 2015 Halaman 2 dari 14
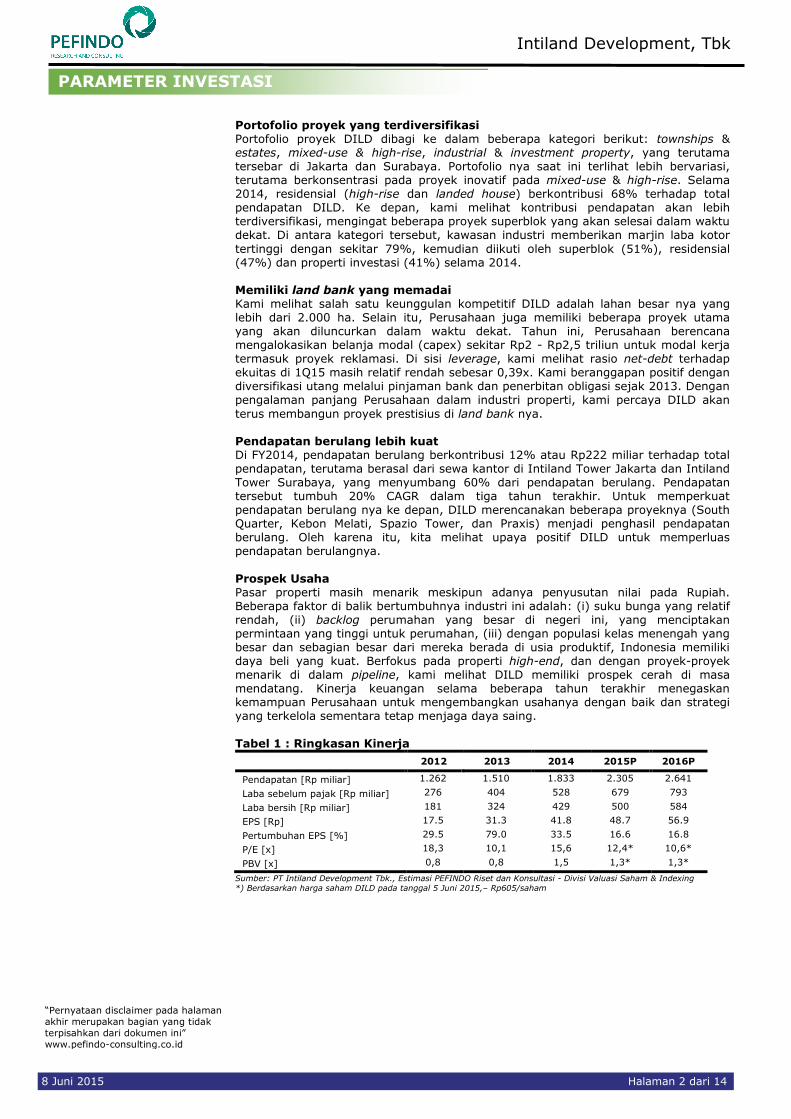
Portofolio proyek yang terdiversifikasi Portofolio proyek DILD dibagi ke dalam beberapa kategori berikut: townships & estates, mixed-use & high-rise, industrial & investment property, yang terutama tersebar di Jakarta dan Surabaya. Portofolio nya saat ini terlihat lebih bervariasi, terutama berkonsentrasi pada proyek inovatif pada mixed-use & high-rise. Selama 2014, residensial (high-rise dan landed house) berkontribusi 68% terhadap total pendapatan DILD. Ke depan, kami melihat kontribusi pendapatan akan lebih terdiversifikasi, mengingat beberapa proyek superblok yang akan selesai dalam waktu dekat. Di antara kategori tersebut, kawasan industri memberikan marjin laba kotor
tertinggi dengan sekitar 79%, kemudian diikuti oleh superblok (51%), residensial (47%) dan properti investasi (41%) selama 2014. Memiliki land bank yang memadai Kami melihat salah satu keunggulan kompetitif DILD adalah lahan besar nya yang lebih dari 2.000 ha. Selain itu, Perusahaan juga memiliki beberapa proyek utama yang akan diluncurkan dalam waktu dekat. Tahun ini, Perusahaan berencana mengalokasikan belanja modal (capex) sekitar Rp2 - Rp2,5 triliun untuk modal kerja termasuk proyek reklamasi. Di sisi leverage, kami melihat rasio net-debt terhadap ekuitas di 1Q15 masih relatif rendah sebesar 0,39x. Kami beranggapan positif dengan diversifikasi utang melalui pinjaman bank dan penerbitan obligasi sejak 2013. Dengan pengalaman panjang Perusahaan dalam industri properti, kami percaya DILD akan
terus membangun proyek prestisius di land bank nya. Pendapatan berulang lebih kuat Di FY2014, pendapatan berulang berkontribusi 12% atau Rp222 miliar terhadap total pendapatan, terutama berasal dari sewa kantor di Intiland Tower Jakarta dan Intiland Tower Surabaya, yang menyumbang 60% dari pendapatan berulang. Pendapatan tersebut tumbuh 20% CAGR dalam tiga tahun terakhir. Untuk memperkuat pendapatan berulang nya ke depan, DILD merencanakan beberapa proyeknya (South Quarter, Kebon Melati, Spazio Tower, dan Praxis) menjadi penghasil pendapatan berulang. Oleh karena itu, kita melihat upaya positif DILD untuk memperluas pendapatan berulangnya.
Prospek Usaha Pasar properti masih menarik meskipun adanya penyusutan nilai pada Rupiah. Beberapa faktor di balik bertumbuhnya industri ini adalah: (i) suku bunga yang relatif rendah, (ii) backlog perumahan yang besar di negeri ini, yang menciptakan permintaan yang tinggi untuk perumahan, (iii) dengan populasi kelas menengah yang besar dan sebagian besar dari mereka berada di usia produktif, Indonesia memiliki daya beli yang kuat. Berfokus pada properti high-end, dan dengan proyek-proyek menarik di dalam pipeline, kami melihat DILD memiliki prospek cerah di masa mendatang. Kinerja keuangan selama beberapa tahun terakhir menegaskan kemampuan Perusahaan untuk mengembangkan usahanya dengan baik dan strategi yang terkelola sementara tetap menjaga daya saing.
Tabel 1 : Ringkasan Kinerja
2012 2013 2014 2015P 2016P
Pendapatan [Rp miliar] 1.262 1.510 1.833 2.305 2.641
Laba sebelum pajak [Rp miliar] 276 404 528 679 793
Laba bersih [Rp miliar] 181 324 429 500 584
EPS [Rp] 17.5 31.3 41.8 48.7 56.9
Pertumbuhan EPS [%] 29.5 79.0 33.5 16.6 16.8
P/E [x] 18,3 10,1 15,6 12,4* 10,6*
PBV [x] 0,8 0,8 1,5 1,3* 1,3*
Sumber: PT Intiland Development Tbk., Estimasi PEFINDO Riset dan Konsultasi - Divisi Valuasi Saham & Indexing
*) Berdasarkan harga saham DILD pada tanggal 5 Juni 2015,– Rp605/saham
PARAMETER INVESTASI ASI

Intiland Development, Tbk
8 Juni 2015 Halaman 3 dari 14
Tantangan ekonomi di 2015 Ketidakpastian masih menimpa ekonomi global setelah krisis keuangan melanda pada tahun 2008. Banyak prediksi yang meleset tentang pemulihan ekonomi. Optimisme dengan bail outs di Eropa berakhir dengan krisis baru. Memasuki tahun 2015, Bank Dunia memperkirakan dengan optimisme yang lebih besar bahwa ekonomi global berada di jalur yang tepat untuk pemulihan. Penurunan harga minyak akan mengurangi tekanan pada negara berkembang non-penghasil minyak. Pemulihan AS ekonomi diharapkan dapat memberikan kontribusi untuk meningkatkan ekspor dunia termasuk ekspor Indonesia.
Untuk Indonesia sendiri, kami melihat tantangan yang dihadapi pembangunan ekonom baik faktor dari eksternal maupun internal. Tantangan yang berasal dari faktor eksternal termasuk penurunan dalam perdagangan global dan perlambatan pemulihan ekonomi global, kenaikan suku bunga di beberapa ekonomi negara maju di waktu yang berbeda, penurunan harga minyak akan mengguncang stabilitas keuangan dari negara-negara penghasil minyak. Sementara faktor internal berasal dari defisit perdagangan disebabkan oleh anjloknya ekspor akibat jatuhnya harga dari komoditas primer, lambatnya kemajuan dalam pengembangan infrastruktur dan menyusutnya nilai Rupiah terhadap dolar AS. Pertumbuhan harga properti residensial melambat
Harga properti residensial meningkat 1,54% (qtq) selama 4Q14, mencerminkan pertumbuhan lebih lambat dibandingkan dengan periode sebelumnya. Harga atas residensial diperkirakan akan tetap di 1Q15, meskipun pada kecepatan yang lebih lambat. Kenaikan harga bahan konstruksi (29,4%), bahan bakar (24,7%) dan upah (21,7%) merupakan faktor yg menggerakkan kenaikan properti residensial.
Secara triwulanan, rumah berukuran besar mencatat pertumbuhan tertinggi dengan
1,68% qtq. Pada tingkat regional, Balikpapan menunjukkan pertumbuhan tertinggi dengan 4,5% qtq, didukung oleh pertumbuhan ekonomi yang kuat dalam industri jasa, perdagangan dan minyak, batubara, dan sektor gas. Pertumbuhan tersebut diikuti oleh Surabaya dengan 3,7% qtq.
Gambar 1: Indeks Harga Properti Residensial, 2009 –
2014
Sumber: Bank Indonesia, PEFINDO Riset dan Konsultasi - Divisi Valuasi Saham & Indexing
Ketatnya regulasi pajak dapat mengguncang industri properti Pemerintah telah merevisi keputusan menteri pada tanggal 30 April yang menurunkan standar untuk "barang super mewah", yang pada gilirannya akan menaikkan pajak pembelian untuk konsumen properti. Peraturan baru tersebut, yang seharusnya akan berlaku pada 30 Mei, membebankan pajak tambahan atas penjualan rumah dengan
harga jual lebih dari Rp5 miliar atau dengan luas bangunan melebihi 400 meter persegi. Ambang batas harga sebelumnya untuk rumah atau apartemen adalah Rp10 miliar. Kami percaya peraturan baru mungkin berpotensi menghambat penjualan properti, terutama untuk segmen menengah dan atas.
MAKROEKONOMI & INFORMASI BISNIS
“Pernyataan disclaimer pada halaman
akhir merupakan bagian yang tidak
terpisahkan dari dokumen ini”
www.pefindo-consulting.co.id
Intiland Development, Tbk
8 Juni 2015 Halaman 4 dari 14
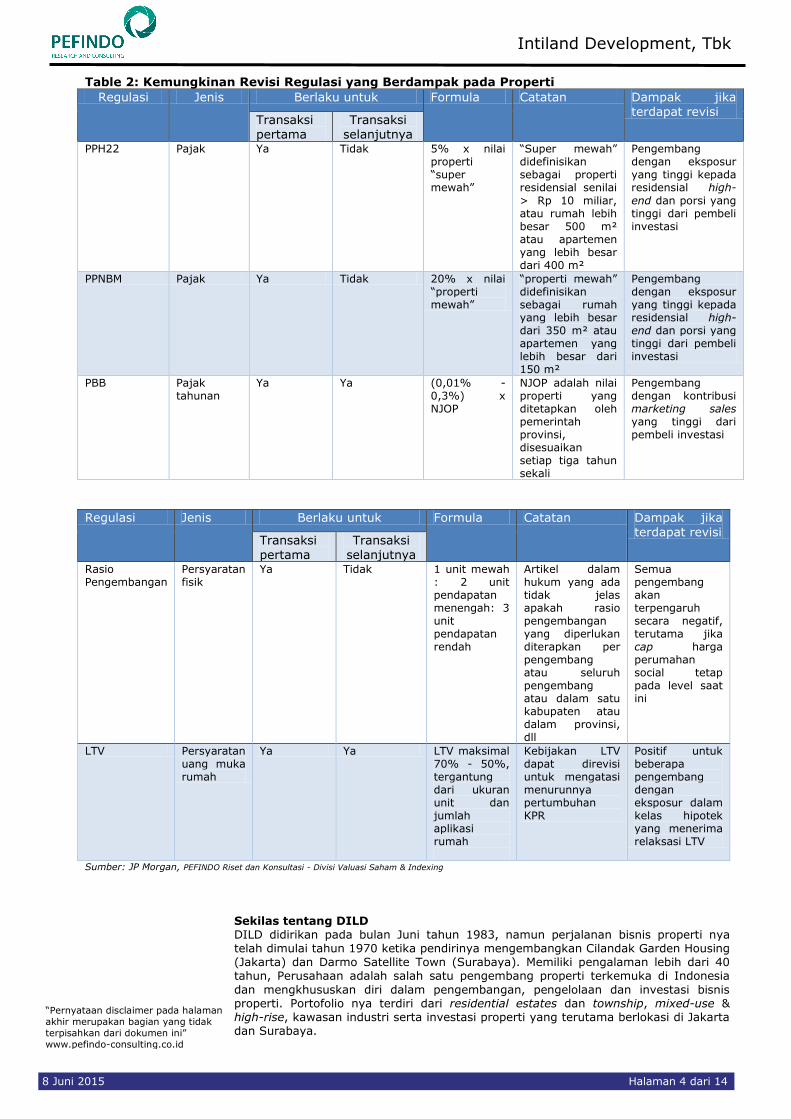
Table 2: Kemungkinan Revisi Regulasi yang Berdampak pada Properti
Regulasi Jenis Berlaku untuk Formula Catatan Dampak jika terdapat revisi
Transaksi pertama
Transaksi selanjutnya
PPH22 Pajak Ya Tidak 5% x nilai properti “super mewah”
“Super mewah” didefinisikan sebagai properti residensial senilai
> Rp 10 miliar, atau rumah lebih besar 500 m² atau apartemen yang lebih besar dari 400 m²
Pengembang dengan eksposur yang tinggi kepada residensial high-
end dan porsi yang tinggi dari pembeli investasi
PPNBM Pajak Ya Tidak 20% x nilai “properti mewah”
“properti mewah” didefinisikan sebagai rumah yang lebih besar dari 350 m² atau apartemen yang lebih besar dari 150 m²
Pengembang dengan eksposur yang tinggi kepada residensial high-end dan porsi yang tinggi dari pembeli investasi
PBB Pajak tahunan
Ya Ya (0,01% - 0,3%) x NJOP
NJOP adalah nilai properti yang ditetapkan oleh pemerintah provinsi, disesuaikan setiap tiga tahun sekali
Pengembang dengan kontribusi marketing sales yang tinggi dari pembeli investasi
Regulasi Jenis Berlaku untuk Formula Catatan Dampak jika terdapat revisi
Transaksi pertama
Transaksi selanjutnya
Rasio Pengembangan
Persyaratan fisik
Ya Tidak 1 unit mewah : 2 unit pendapatan menengah: 3 unit pendapatan rendah
Artikel dalam hukum yang ada tidak jelas apakah rasio pengembangan yang diperlukan diterapkan per pengembang atau seluruh pengembang atau dalam satu kabupaten atau dalam provinsi, dll
Semua pengembang akan terpengaruh secara negatif, terutama jika cap harga perumahan social tetap pada level saat ini
LTV Persyaratan uang muka rumah
Ya Ya LTV maksimal 70% - 50%, tergantung dari ukuran unit dan jumlah aplikasi rumah
Kebijakan LTV dapat direvisi untuk mengatasi menurunnya pertumbuhan KPR
Positif untuk beberapa pengembang dengan eksposur dalam kelas hipotek yang menerima relaksasi LTV
Sumber: JP Morgan, PEFINDO Riset dan Konsultasi - Divisi Valuasi Saham & Indexing
Sekilas tentang DILD DILD didirikan pada bulan Juni tahun 1983, namun perjalanan bisnis properti nya telah dimulai tahun 1970 ketika pendirinya mengembangkan Cilandak Garden Housing (Jakarta) dan Darmo Satellite Town (Surabaya). Memiliki pengalaman lebih dari 40 tahun, Perusahaan adalah salah satu pengembang properti terkemuka di Indonesia
dan mengkhususkan diri dalam pengembangan, pengelolaan dan investasi bisnis properti. Portofolio nya terdiri dari residential estates dan township, mixed-use & high-rise, kawasan industri serta investasi properti yang terutama berlokasi di Jakarta dan Surabaya.
“Pernyataan disclaimer pada halaman
akhir merupakan bagian yang tidak
terpisahkan dari dokumen ini”
www.pefindo-consulting.co.id
Intiland Development, Tbk
8 Juni 2015 Halaman 5 dari 14
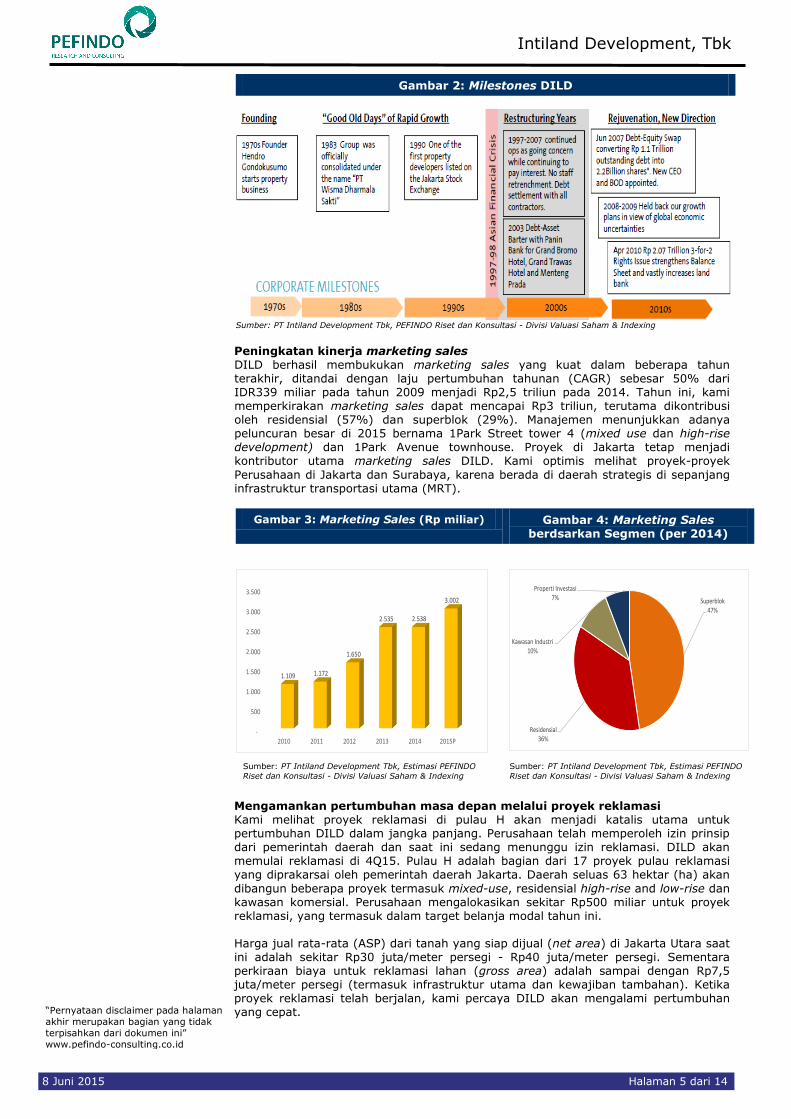
Gambar 2: Milestones DILD
Sumber: PT Intiland Development Tbk, PEFINDO Riset dan Konsultasi - Divisi Valuasi Saham & Indexing
Peningkatan kinerja marketing sales DILD berhasil membukukan marketing sales yang kuat dalam beberapa tahun terakhir, ditandai dengan laju pertumbuhan tahunan (CAGR) sebesar 50% dari IDR339 miliar pada tahun 2009 menjadi Rp2,5 triliun pada 2014. Tahun ini, kami memperkirakan marketing sales dapat mencapai Rp3 triliun, terutama dikontribusi oleh residensial (57%) dan superblok (29%). Manajemen menunjukkan adanya peluncuran besar di 2015 bernama 1Park Street tower 4 (mixed use dan high-rise development) dan 1Park Avenue townhouse. Proyek di Jakarta tetap menjadi kontributor utama marketing sales DILD. Kami optimis melihat proyek-proyek
Perusahaan di Jakarta dan Surabaya, karena berada di daerah strategis di sepanjang infrastruktur transportasi utama (MRT).
Gambar 3: Marketing Sales (Rp miliar) Gambar 4: Marketing Sales berdsarkan Segmen (per 2014)
-
500
1.000
1.500
2.000
2.500
3.000
3.500
2010 2011 2012 2013 2014 2015P
1.109 1.172
1.650
2.535 2.538
3.002
Superblok47%
Residensial36%
Kawasan Industri10%
Properti Investasi7%
Sumber: PT Intiland Development Tbk, Estimasi PEFINDO
Riset dan Konsultasi - Divisi Valuasi Saham & Indexing
Sumber: PT Intiland Development Tbk, Estimasi PEFINDO
Riset dan Konsultasi - Divisi Valuasi Saham & Indexing
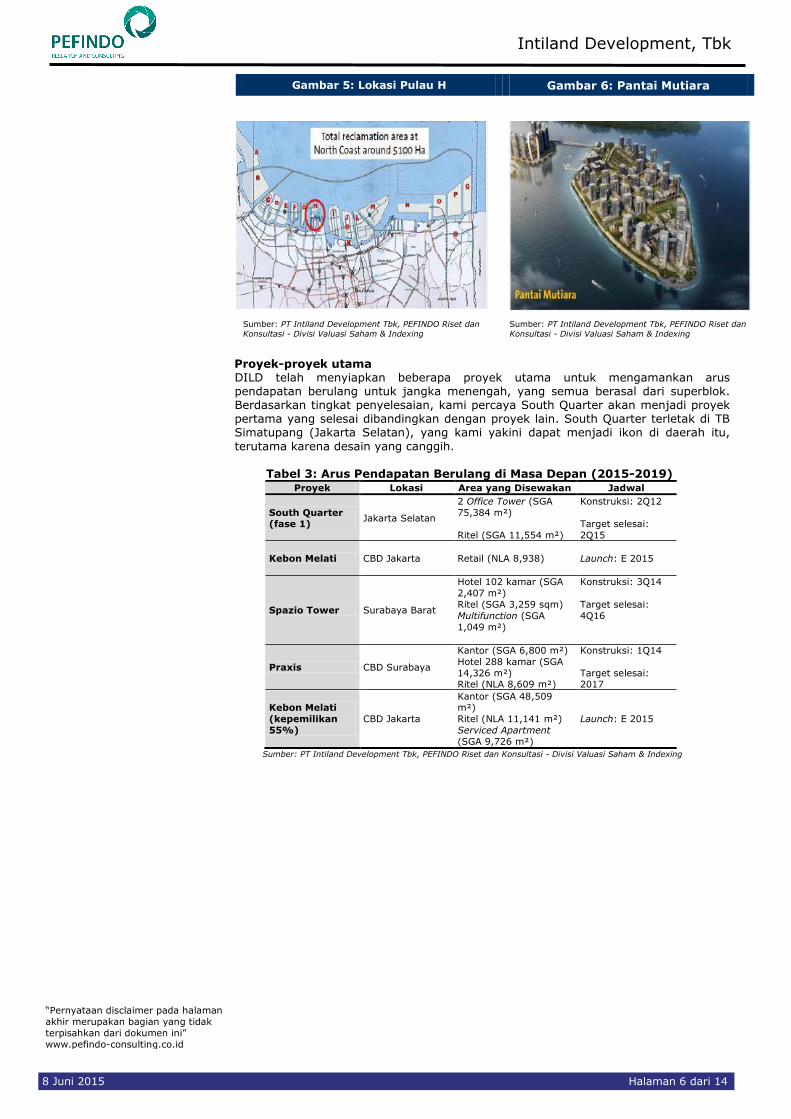
Mengamankan pertumbuhan masa depan melalui proyek reklamasi Kami melihat proyek reklamasi di pulau H akan menjadi katalis utama untuk pertumbuhan DILD dalam jangka panjang. Perusahaan telah memperoleh izin prinsip dari pemerintah daerah dan saat ini sedang menunggu izin reklamasi. DILD akan memulai reklamasi di 4Q15. Pulau H adalah bagian dari 17 proyek pulau reklamasi yang diprakarsai oleh pemerintah daerah Jakarta. Daerah seluas 63 hektar (ha) akan
dibangun beberapa proyek termasuk mixed-use, residensial high-rise and low-rise dan kawasan komersial. Perusahaan mengalokasikan sekitar Rp500 miliar untuk proyek reklamasi, yang termasuk dalam target belanja modal tahun ini. Harga jual rata-rata (ASP) dari tanah yang siap dijual (net area) di Jakarta Utara saat ini adalah sekitar Rp30 juta/meter persegi - Rp40 juta/meter persegi. Sementara perkiraan biaya untuk reklamasi lahan (gross area) adalah sampai dengan Rp7,5 juta/meter persegi (termasuk infrastruktur utama dan kewajiban tambahan). Ketika proyek reklamasi telah berjalan, kami percaya DILD akan mengalami pertumbuhan yang cepat.
“Pernyataan disclaimer pada halaman
akhir merupakan bagian yang tidak
terpisahkan dari dokumen ini”
www.pefindo-consulting.co.id
Intiland Development, Tbk
8 Juni 2015 Halaman 6 dari 14
Gambar 5: Lokasi Pulau H Gambar 6: Pantai Mutiara
Sumber: PT Intiland Development Tbk, PEFINDO Riset dan
Konsultasi - Divisi Valuasi Saham & Indexing
Sumber: PT Intiland Development Tbk, PEFINDO Riset dan
Konsultasi - Divisi Valuasi Saham & Indexing
Proyek-proyek utama DILD telah menyiapkan beberapa proyek utama untuk mengamankan arus pendapatan berulang untuk jangka menengah, yang semua berasal dari superblok. Berdasarkan tingkat penyelesaian, kami percaya South Quarter akan menjadi proyek pertama yang selesai dibandingkan dengan proyek lain. South Quarter terletak di TB Simatupang (Jakarta Selatan), yang kami yakini dapat menjadi ikon di daerah itu,
terutama karena desain yang canggih.
Tabel 3: Arus Pendapatan Berulang di Masa Depan (2015-2019) Proyek Lokasi Area yang Disewakan Jadwal
South Quarter (fase 1)
Jakarta Selatan
2 Office Tower (SGA
75,384 m²)
Ritel (SGA 11,554 m²)
Konstruksi: 2Q12
Target selesai:
2Q15
Kebon Melati CBD Jakarta
Retail (NLA 8,938)
Launch: E 2015
Spazio Tower Surabaya Barat
Hotel 102 kamar (SGA
2,407 m²)
Ritel (SGA 3,259 sqm)
Multifunction (SGA
1,049 m²)
Konstruksi: 3Q14
Target selesai:
4Q16
Praxis CBD Surabaya
Kantor (SGA 6,800 m²)
Hotel 288 kamar (SGA
14,326 m²) Ritel (NLA 8,609 m²)
Konstruksi: 1Q14
Target selesai: 2017
Kebon Melati
(kepemilikan
55%)
CBD Jakarta
Kantor (SGA 48,509 m²)
Ritel (NLA 11,141 m²)
Serviced Apartment
(SGA 9,726 m²)
Launch: E 2015
Sumber: PT Intiland Development Tbk, PEFINDO Riset dan Konsultasi - Divisi Valuasi Saham & Indexing
“Pernyataan disclaimer pada halaman
akhir merupakan bagian yang tidak
terpisahkan dari dokumen ini”
www.pefindo-consulting.co.id
Intiland Development, Tbk
8 Juni 2015 Halaman 7 dari 14
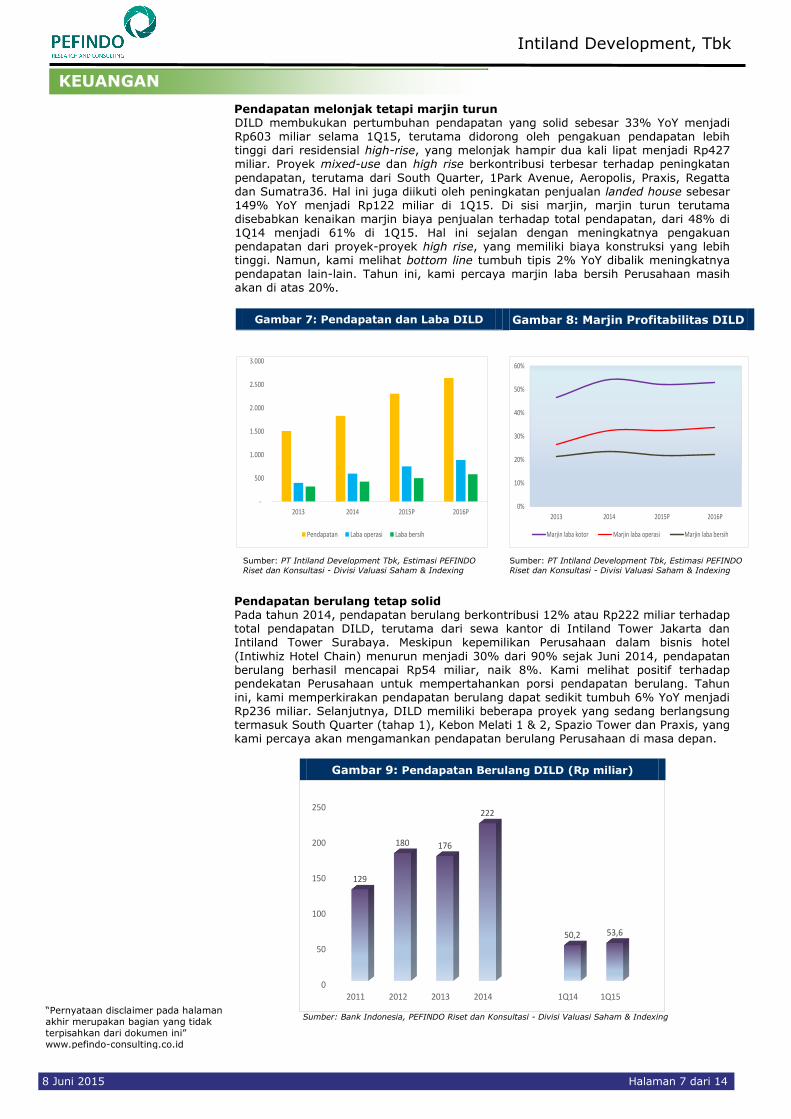
Pendapatan melonjak tetapi marjin turun DILD membukukan pertumbuhan pendapatan yang solid sebesar 33% YoY menjadi Rp603 miliar selama 1Q15, terutama didorong oleh pengakuan pendapatan lebih tinggi dari residensial high-rise, yang melonjak hampir dua kali lipat menjadi Rp427 miliar. Proyek mixed-use dan high rise berkontribusi terbesar terhadap peningkatan
pendapatan, terutama dari South Quarter, 1Park Avenue, Aeropolis, Praxis, Regatta dan Sumatra36. Hal ini juga diikuti oleh peningkatan penjualan landed house sebesar 149% YoY menjadi Rp122 miliar di 1Q15. Di sisi marjin, marjin turun terutama disebabkan kenaikan marjin biaya penjualan terhadap total pendapatan, dari 48% di 1Q14 menjadi 61% di 1Q15. Hal ini sejalan dengan meningkatnya pengakuan pendapatan dari proyek-proyek high rise, yang memiliki biaya konstruksi yang lebih tinggi. Namun, kami melihat bottom line tumbuh tipis 2% YoY dibalik meningkatnya pendapatan lain-lain. Tahun ini, kami percaya marjin laba bersih Perusahaan masih akan di atas 20%.
Gambar 7: Pendapatan dan Laba DILD Gambar 8: Marjin Profitabilitas DILD
-
500
1.000
1.500
2.000
2.500
3.000
2013 2014 2015P 2016P
Pendapatan Laba operasi Laba bersih
0%
10%
20%
30%
40%
50%
60%
2013 2014 2015P 2016P
Marjin laba kotor Marjin laba operasi Marjin laba bersih
Sumber: PT Intiland Development Tbk, Estimasi PEFINDO
Riset dan Konsultasi - Divisi Valuasi Saham & Indexing
Sumber: PT Intiland Development Tbk, Estimasi PEFINDO
Riset dan Konsultasi - Divisi Valuasi Saham & Indexing
Pendapatan berulang tetap solid Pada tahun 2014, pendapatan berulang berkontribusi 12% atau Rp222 miliar terhadap total pendapatan DILD, terutama dari sewa kantor di Intiland Tower Jakarta dan Intiland Tower Surabaya. Meskipun kepemilikan Perusahaan dalam bisnis hotel
(Intiwhiz Hotel Chain) menurun menjadi 30% dari 90% sejak Juni 2014, pendapatan berulang berhasil mencapai Rp54 miliar, naik 8%. Kami melihat positif terhadap pendekatan Perusahaan untuk mempertahankan porsi pendapatan berulang. Tahun ini, kami memperkirakan pendapatan berulang dapat sedikit tumbuh 6% YoY menjadi Rp236 miliar. Selanjutnya, DILD memiliki beberapa proyek yang sedang berlangsung termasuk South Quarter (tahap 1), Kebon Melati 1 & 2, Spazio Tower dan Praxis, yang kami percaya akan mengamankan pendapatan berulang Perusahaan di masa depan.
Gambar 9: Pendapatan Berulang DILD (Rp miliar)
0
50
100
150
200
250
2011 2012 2013 2014 1Q14 1Q15
129
180 176
222
50,2 53,6
Sumber: Bank Indonesia, PEFINDO Riset dan Konsultasi - Divisi Valuasi Saham & Indexing
KEUANGAN
“Pernyataan disclaimer pada halaman
akhir merupakan bagian yang tidak
terpisahkan dari dokumen ini”
www.pefindo-consulting.co.id
Intiland Development, Tbk
8 Juni 2015 Halaman 8 dari 14
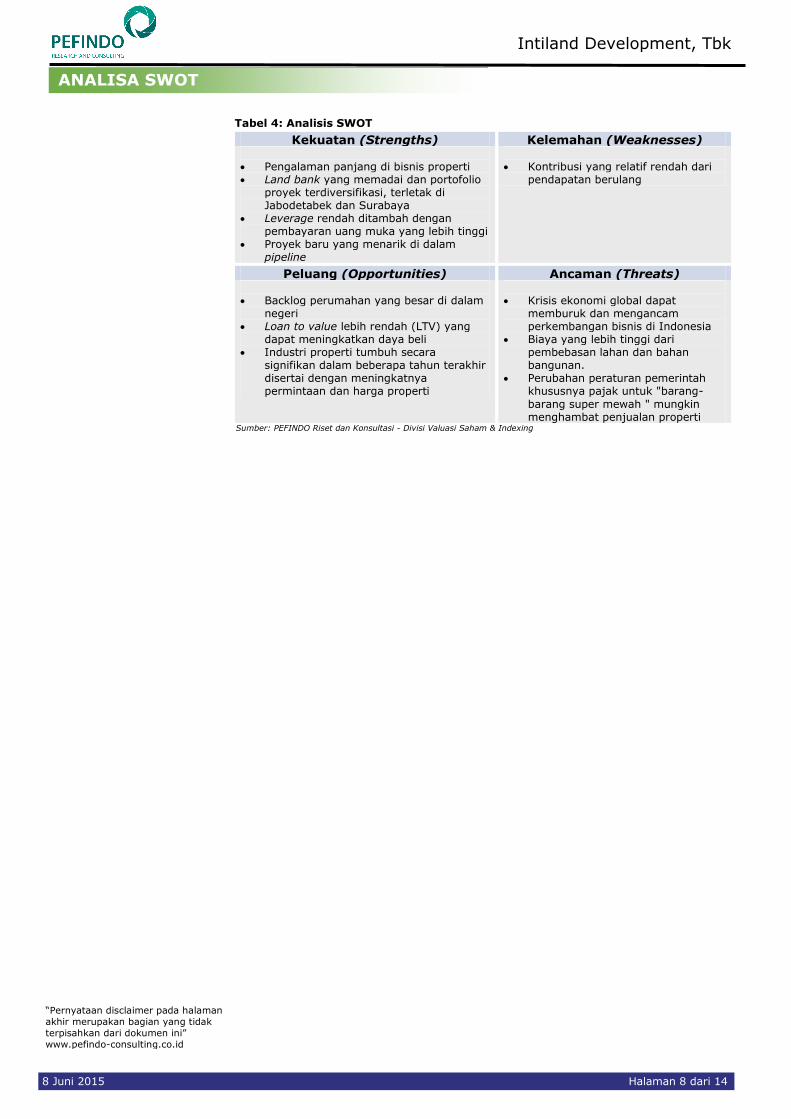
Tabel 4: Analisis SWOT
Kekuatan (Strengths) Kelemahan (Weaknesses)
Pengalaman panjang di bisnis properti Land bank yang memadai dan portofolio
proyek terdiversifikasi, terletak di Jabodetabek dan Surabaya
Leverage rendah ditambah dengan pembayaran uang muka yang lebih tinggi
Proyek baru yang menarik di dalam pipeline
Kontribusi yang relatif rendah dari
pendapatan berulang
Peluang (Opportunities) Ancaman (Threats)
Backlog perumahan yang besar di dalam
negeri Loan to value lebih rendah (LTV) yang
dapat meningkatkan daya beli Industri properti tumbuh secara
signifikan dalam beberapa tahun terakhir disertai dengan meningkatnya permintaan dan harga properti
Krisis ekonomi global dapat
memburuk dan mengancam perkembangan bisnis di Indonesia
Biaya yang lebih tinggi dari pembebasan lahan dan bahan bangunan.
Perubahan peraturan pemerintah khususnya pajak untuk "barang-
barang super mewah " mungkin menghambat penjualan properti
Sumber: PEFINDO Riset dan Konsultasi - Divisi Valuasi Saham & Indexing
ANALISA SWOT
“Pernyataan disclaimer pada halaman
akhir merupakan bagian yang tidak
terpisahkan dari dokumen ini”
www.pefindo-consulting.co.id
Intiland Development, Tbk
8 Juni 2015 Halaman 9 dari 14
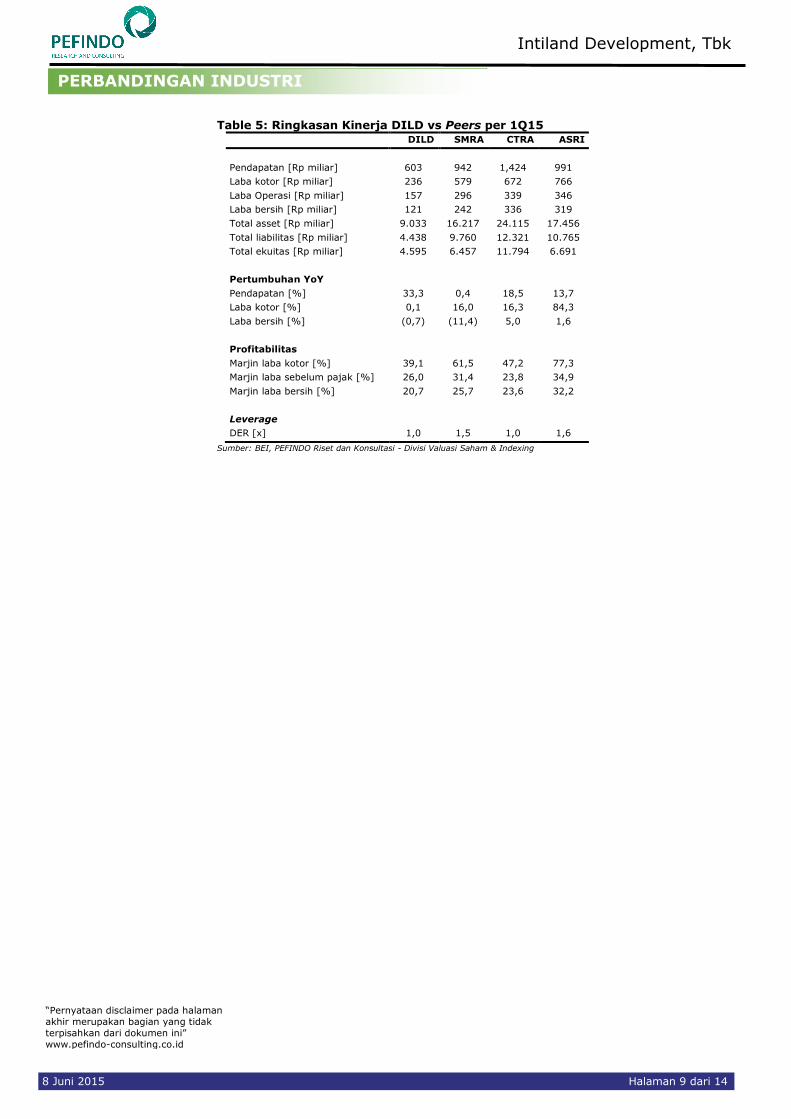
Table 5: Ringkasan Kinerja DILD vs Peers per 1Q15 DILD SMRA CTRA ASRI
Pendapatan [Rp miliar] 603 942 1,424 991
Laba kotor [Rp miliar] 236 579 672 766
Laba Operasi [Rp miliar] 157 296 339 346
Laba bersih [Rp miliar] 121 242 336 319
Total asset [Rp miliar] 9.033 16.217 24.115 17.456
Total liabilitas [Rp miliar] 4.438 9.760 12.321 10.765
Total ekuitas [Rp miliar] 4.595 6.457 11.794 6.691
Pertumbuhan YoY
Pendapatan [%] 33,3 0,4 18,5 13,7
Laba kotor [%] 0,1 16,0 16,3 84,3
Laba bersih [%] (0,7) (11,4) 5,0 1,6
Profitabilitas
Marjin laba kotor [%] 39,1 61,5 47,2 77,3
Marjin laba sebelum pajak [%] 26,0 31,4 23,8 34,9
Marjin laba bersih [%] 20,7 25,7 23,6 32,2
Leverage
DER [x] 1,0 1,5 1,0 1,6
Sumber: BEI, PEFINDO Riset dan Konsultasi - Divisi Valuasi Saham & Indexing
PERBANDINGAN INDUSTRI

“Pernyataan disclaimer pada halaman
akhir merupakan bagian yang tidak
terpisahkan dari dokumen ini”
www.pefindo-consulting.co.id
Intiland Development, Tbk
8 Juni 2015 Halaman 10 dari 14
PENILAIAN
Metodologi Penilaian
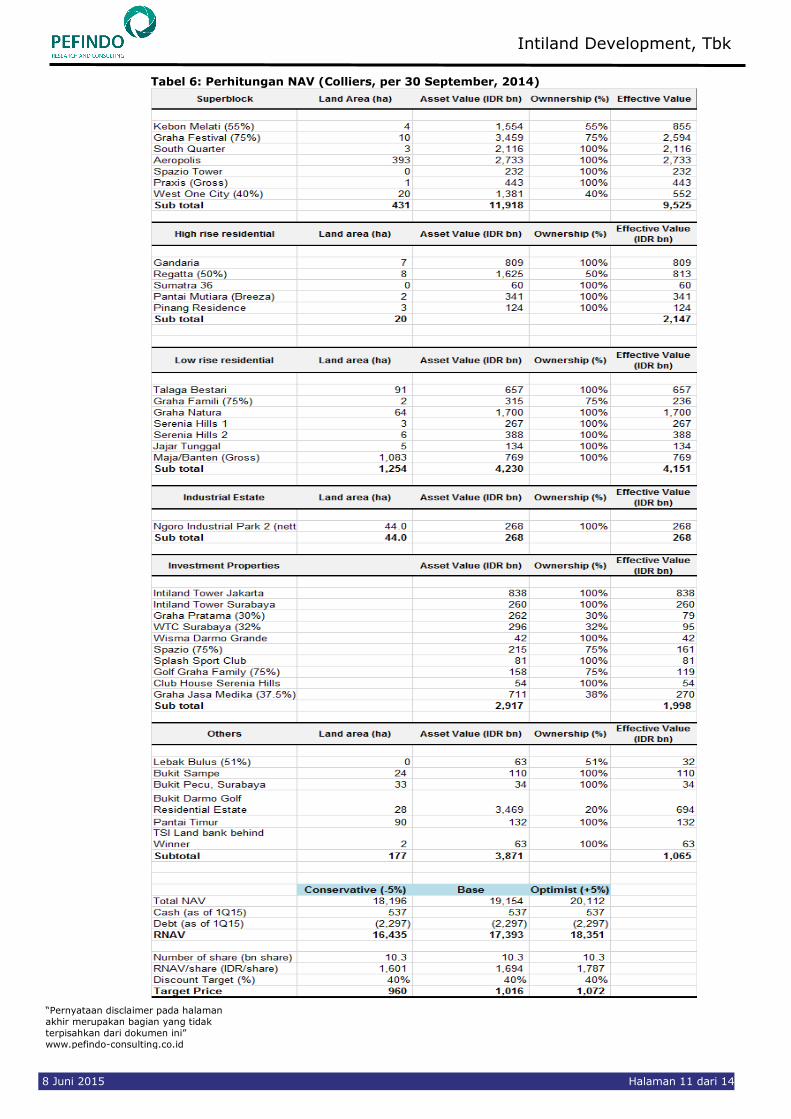
Kami menggunakan metode Net Asset Value (NAV) sebagai pendekatan penilaian utama dengan pertimbangan bahwa pertumbuhan aset merupakan value driver dibandingkan pertumbuhan pendapatan. Selain itu, kami menggunakan Guideline Company Method (GCM) sebagai metode pembanding. Penilaian ini didasarkan pada nilai 100% saham per tanggal 5 Juni 2015, menggunakan laporan keuangan DILD per tanggal 31 Maret 2015, untuk analisa
fundamental kami.
Estimasi Nilai Target harga saham untuk 12 bulan berdasarkan penilaian pada tanggal 5 Juni 2015 adalah sebagai berikut:
Menggunakan metode NAV adalah sebesar Rp960 – Rp1.072 per saham. Menggunakan metode GCM (EV/EBITDA 12,2x and P/BV 2,8X) adalah
sebesar Rp850 – Rp1.265 per saham.
Untuk mendapatkan nilai yang mewakili kedua indikasi nilai tersebut, kami melakukan pembobotan terhadap kedua metode NAV dan GCM sebesar 70%:30%. Berdasarkan hasil perhitungan di atas, target harga saham DILD untuk 12 bulan adalah Rp930 – Rp1.130 per saham.
TARGET HARGA
“Pernyataan disclaimer pada halaman
akhir merupakan bagian yang tidak
terpisahkan dari dokumen ini”
www.pefindo-consulting.co.id
Intiland Development, Tbk
8 Juni 2015 Halaman 11 dari 14
Tabel 6: Perhitungan NAV (Colliers, per 30 September, 2014)
“Pernyataan disclaimer pada halaman
akhir merupakan bagian yang tidak
terpisahkan dari dokumen ini”
www.pefindo-consulting.co.id
Intiland Development, Tbk
8 Juni 2015 Halaman 12 dari 14
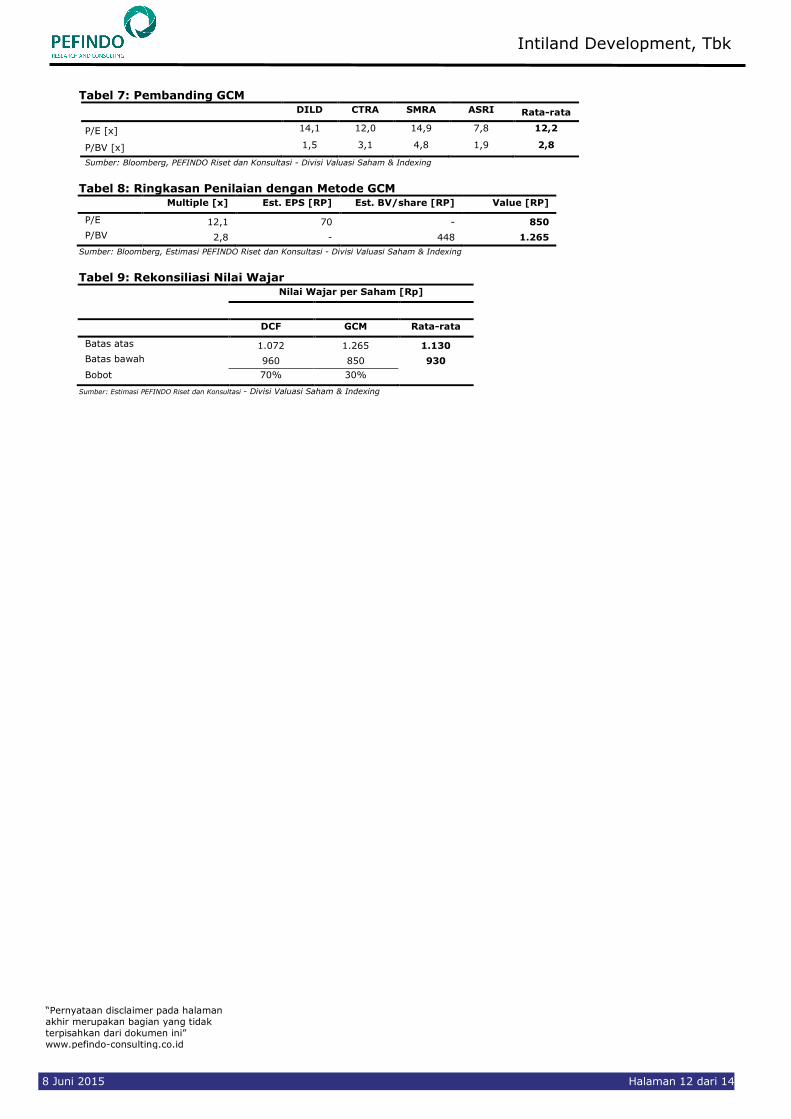
Tabel 7: Pembanding GCM
DILD CTRA SMRA ASRI Rata-rata
P/E [x] 14,1 12,0 14,9 7,8 12,2
P/BV [x] 1,5 3,1 4,8 1,9 2,8
Sumber: Bloomberg, PEFINDO Riset dan Konsultasi - Divisi Valuasi Saham & Indexing
Tabel 8: Ringkasan Penilaian dengan Metode GCM Multiple [x] Est. EPS [RP] Est. BV/share [RP] Value [RP]
P/E 12,1 70 - 850
P/BV 2,8 - 448 1.265
Sumber: Bloomberg, Estimasi PEFINDO Riset dan Konsultasi - Divisi Valuasi Saham & Indexing
Tabel 9: Rekonsiliasi Nilai Wajar Nilai Wajar per Saham [Rp]
DCF GCM Rata-rata
Batas atas 1.072 1.265 1.130
Batas bawah 960 850 930
Bobot 70% 30%
Sumber: Estimasi PEFINDO Riset dan Konsultasi - Divisi Valuasi Saham & Indexing
“Pernyataan disclaimer pada halaman
akhir merupakan bagian yang tidak
terpisahkan dari dokumen ini”
www.pefindo-consulting.co.id
Intiland Development, Tbk
8 Juni 2015 Halaman 13 dari 14
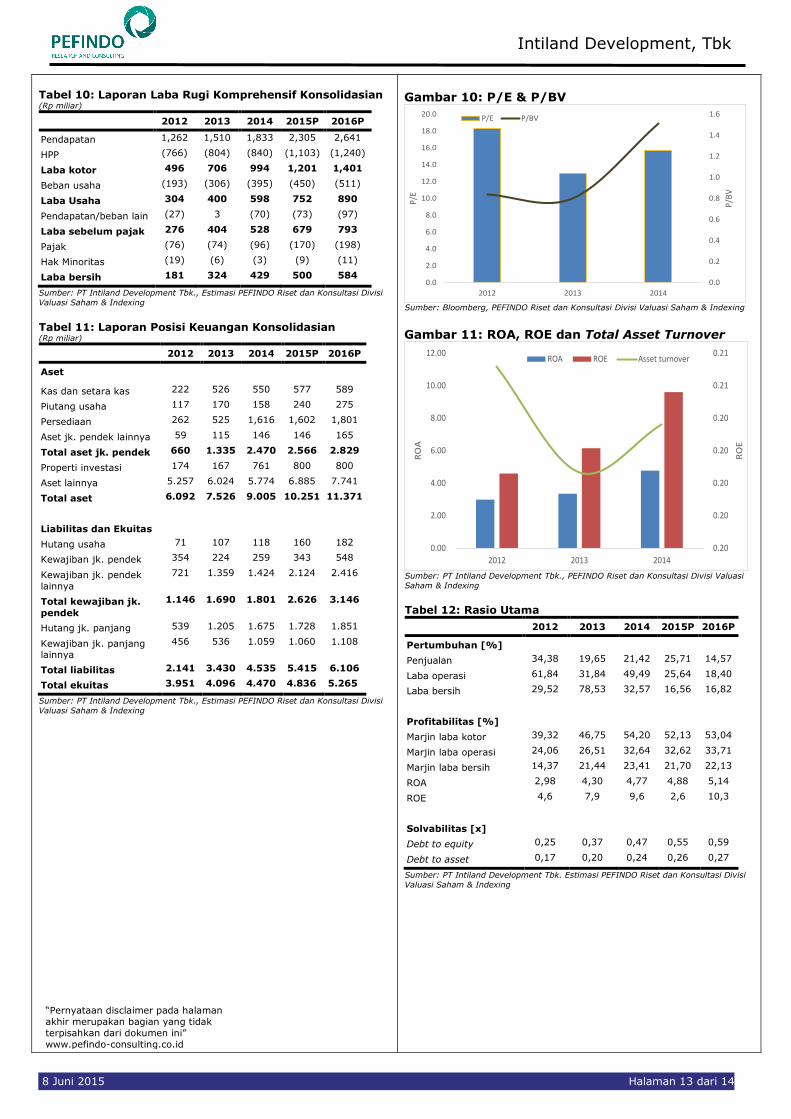
Tabel 10: Laporan Laba Rugi Komprehensif Konsolidasian (Rp miliar)
2012 2013 2014 2015P 2016P
Pendapatan 1,262 1,510 1,833 2,305 2,641
HPP (766) (804) (840) (1,103) (1,240)
Laba kotor 496 706 994 1,201 1,401
Beban usaha (193) (306) (395) (450) (511)
Laba Usaha 304 400 598 752 890
Pendapatan/beban lain (27) 3 (70) (73) (97)
Laba sebelum pajak 276 404 528 679 793
Pajak (76) (74) (96) (170) (198)
Hak Minoritas (19) (6) (3) (9) (11)
Laba bersih 181 324 429 500 584
Sumber: PT Intiland Development Tbk., Estimasi PEFINDO Riset dan Konsultasi Divisi
Valuasi Saham & Indexing
Tabel 11: Laporan Posisi Keuangan Konsolidasian (Rp miliar)
2012 2013 2014 2015P 2016P
Aset
Kas dan setara kas 222 526 550 577 589
Piutang usaha 117 170 158 240 275
Persediaan 262 525 1,616 1,602 1,801
Aset jk. pendek lainnya 59 115 146 146 165
Total aset jk. pendek 660 1.335 2.470 2.566 2.829
Properti investasi 174 167 761 800 800
Aset lainnya 5.257 6.024 5.774 6.885 7.741
Total aset 6.092 7.526 9.005 10.251 11.371
Liabilitas dan Ekuitas
Hutang usaha 71 107 118 160 182
Kewajiban jk. pendek 354 224 259 343 548
Kewajiban jk. pendek
lainnya
721 1.359 1.424 2.124 2.416
Total kewajiban jk.
pendek
1.146 1.690 1.801 2.626 3.146
Hutang jk. panjang 539 1.205 1.675 1.728 1.851
Kewajiban jk. panjang lainnya
456 536 1.059 1.060 1.108
Total liabilitas 2.141 3.430 4.535 5.415 6.106
Total ekuitas 3.951 4.096 4.470 4.836 5.265
Sumber: PT Intiland Development Tbk., Estimasi PEFINDO Riset dan Konsultasi Divisi
Valuasi Saham & Indexing
Gambar 10: P/E & P/BV
0.0
0.2
0.4
0.6
0.8
1.0
1.2
1.4
1.6
0.0
2.0
4.0
6.0
8.0
10.0
12.0
14.0
16.0
18.0
20.0
2012 2013 2014
P/B
V
P/E
P/E P/BV
Sumber: Bloomberg, PEFINDO Riset dan Konsultasi Divisi Valuasi Saham & Indexing
Gambar 11: ROA, ROE dan Total Asset Turnover
0.20
0.20
0.20
0.20
0.20
0.21
0.21
0.00
2.00
4.00
6.00
8.00
10.00
12.00
2012 2013 2014
RO
E
RO
A
ROA ROE Asset turnover
Sumber: PT Intiland Development Tbk., PEFINDO Riset dan Konsultasi Divisi Valuasi
Saham & Indexing
Tabel 12: Rasio Utama
2012 2013 2014 2015P 2016P
Pertumbuhan [%]
Penjualan 34,38 19,65 21,42 25,71 14,57
Laba operasi 61,84 31,84 49,49 25,64 18,40
Laba bersih 29,52 78,53 32,57 16,56 16,82
Profitabilitas [%]
Marjin laba kotor 39,32 46,75 54,20 52,13 53,04
Marjin laba operasi 24,06 26,51 32,64 32,62 33,71
Marjin laba bersih 14,37 21,44 23,41 21,70 22,13
ROA 2,98 4,30 4,77 4,88 5,14
ROE 4,6 7,9 9,6 2,6 10,3
Solvabilitas [x]
Debt to equity 0,25 0,37 0,47 0,55 0,59
Debt to asset 0,17 0,20 0,24 0,26 0,27
Sumber: PT Intiland Development Tbk. Estimasi PEFINDO Riset dan Konsultasi Divisi
Valuasi Saham & Indexing
“Pernyataan disclaimer pada halaman
akhir merupakan bagian yang tidak
terpisahkan dari dokumen ini”
www.pefindo-consulting.co.id
Intiland Development, Tbk
8 Juni 2015 Halaman 14 dari 14
DISCLAIMER
Laporan ini dibuat berdasarkan sumber-sumber yang kami anggap terpercaya dan dapat diandalkan. Namun kami tidak menjamin kelengkapan, keakuratan atau kecukupannya. Dengan demikian kami tidak bertanggung jawab atas segala keputusan investasi yang diambil berdasarkan laporan ini. Adapun asumsi, opini, dan perkiraan merupakan hasil dari pertimbangan internal kami per tanggal penilaian (cut off date), dan kami dapat mengubah pertimbangan diatas sewaktu-waktu tanpa pemberitahuan terlebih dahulu. Kami tidak bertanggung jawab atas kekeliruan atau kelalaian yang terjadi akibat penggunaan laporan ini. Kinerja dimasa lalu tidak selalu dapat dijadikan acuan hasil masa depan. Laporan ini bukan merupakan
rekomendasi penawaran, pembelian atau menahan suatu saham tertentu. Laporan ini mungkin tidak sesuai untuk beberapa investor. Seluruh opini dalam laporan ini telah disampaikan dengan itikad baik, namun sewaktu-waktu dapat berubah tanpa pemberitahuan terlebih dahulu, dan disajikan dengan benar per tanggal diterbitkan laporan ini. Harga, nilai, atau pendapatan dari setiap saham Perseroan yang disajikan dalam laporan ini kemungkinan dapat lebih rendah dari harapan pemodal, dan pemodal juga mungkin mendapatkan pengembalian yang lebih rendah dari nilai investasi yang ditanamkan. Investasi didefinisikan sebagai pendapatan yang kemungkinan besar diterima dimasa depan, namun nilai dari pendapatan yang akan diterima tersebut kemungkinan besar juga akan berfluktuasi. Untuk saham Perseroan yang penyajian laporan keuangannya didenominasi dalam mata uang selain Rupiah, perubahan nilai tukar mata uang tersebut kemungkinan dapat menurunkan nilai, harga, atau pendapatan investasi pemodal. Informasi dalam laporan ini bukan merupakan pertimbangan pajak dalam mengambil suatu keputusan investasi. Target harga saham dalam Laporan ini merupakan nilai fundamental, bukan merupakan Nilai Pasar Wajar, dan bukan merupakan harga acuan transaksi yang diwajibkan oleh peraturan perundang-undangan yang berlaku. Laporan target harga saham yang diterbitkan oleh PT Pefindo Riset Konsultasi (PRK) atau PEFINDO Riset dan Konsultasi bukan merupakan rekomendasi untuk membeli, menjual, atau menahan suatu saham tertentu, dan tidak dapat dianggap sebagai nasehat investasi oleh PRK yang berhubungan dengan cakupan Jasa kepada, atau kaitannya kepada, beberapa pihak, termasuk emiten, penasehat keuangan, pialang saham, investment banks, institusi keuangan dan perantara keuangan, dalam kaitannya menerima imbalan atau keuntungan lainnya dari pihak tersebut. Laporan ini tidak ditujukan untuk pemodal tertentu dan tidak dapat dijadikan bagian dari tujuan investasi terhadap suatu saham dan juga bukan merupakan rekomendasi investasi terhadap suatu saham tertentu atau suatu strategi investasi. Sebelum melakukan tindakan dari hasil laporan ini, pemodal disarankan untuk mempertimbangkan terlebih dahulu kesesuaian situasi dan kondisi dan, jika dibutuhkan, mintalah bantuan penasehat keuangan. PEFINDO memisahkan kegiatan Valuasi Saham dengan kegiatan Pemeringkatan untuk menjaga independensi dan objektivitas dari proses dan produk kegiatan analitis. PEFINDO telah menetapkan kebijakan dan prosedur untuk menjaga kerahasiaan informasi non-publik tertentu yang diterima sehubungan dengan proses analitis. Keseluruhan proses, metodologi dan database yang digunakan dalam penyusunan Laporan Target Harga Referensi Saham ini secara keseluruhan adalah berbeda dengan proses , metodologi dan database yang digunakan PEFINDO dalam melakukan pemeringkatan. Laporan ini dibuat dan disiapkan PRK dengan tujuan untuk meningkatkan transparansi harga saham yang tercatat di Bursa Efek Indonesia (BEI). Laporan ini juga bebas dari pengaruh tekanan atau paksaan dari Bursa maupun Perseroan yang dinilai. PRK akan menerima imbalan dari BEI dan Perseroan yang dinilai untuk 2 (dua) kali pelaporan per tahun. Untuk keterangan lebih lanjut, dapat mengunjungi website kami di http://www.pefindo-consulting.co.id Laporan ini dibuat dan disiapkan oleh PEFINDO Riset dan Konsultasi - Divisi Valuasi Saham dan Indexing. Di Indonesia Laporan ini dipublikasikan pada website kami dan juga pada website Bursa Efek Indonesia.
Page 1 of 14
Contact: Equity & Index Valuation Division Phone: (6221) 7884 0200 [email protected]
“Disclaimer statement in the last page is an
integral part of this report”
www.pefindo-consulting.co.id
Intiland Development, Tbk Primary Report
Equity Valuation
June 8, 2015
Target Price
Low High 930 1,130
Property
Stock Performance
0
100
200
300
400
500
600
700
800
4,400
4,600
4,800
5,000
5,200
5,400
5,600
Apr-14 Jun-14 Aug-14 Oct-14 Dec-14 Feb-15 Apr-15
DILDJCI
JCI DILD
Source: Bloomberg, PEFINDO Research and Consulting Equity
& Index Valuation Division
Stock Information IDR
Ticker code DILD
Market price as of June 5, 2015 605
Market price – 52 week high 685
Market price – 52 week low 434
Market cap – 52 week high (bn) 7,100
Market cap – 52 week low (bn) 4,498
Market Value Added & Market Risk
0
0.2
0.4
0.6
0.8
1
1.2
1.4
1.6
1.8
-100
-50
0
50
100
150
200
250
300
2013 2014
Mar
ket
risk
MV
A
Axis Title
Market value added Market risk
Source: Bloomberg, PEFINDO Research and Consulting Equity
& Index Valuation Division
Shareholders (%)
UBS AG Singapore 22.24
Credit Suisse AG Singapore 19.89
Treasury Stock 0.96
Public (each below 5%) 56.91
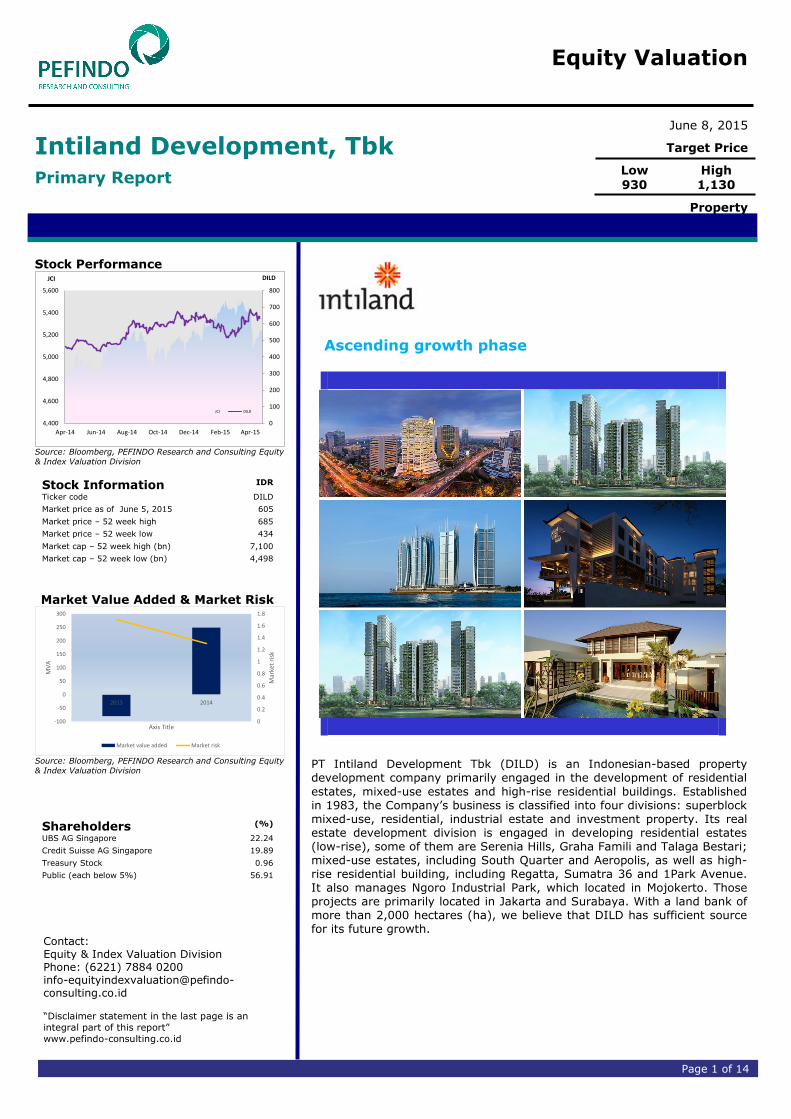
Ascending growth phase
PT Intiland Development Tbk (DILD) is an Indonesian-based property development company primarily engaged in the development of residential
estates, mixed-use estates and high-rise residential buildings. Established in 1983, the Company’s business is classified into four divisions: superblock mixed-use, residential, industrial estate and investment property. Its real estate development division is engaged in developing residential estates (low-rise), some of them are Serenia Hills, Graha Famili and Talaga Bestari; mixed-use estates, including South Quarter and Aeropolis, as well as high-rise residential building, including Regatta, Sumatra 36 and 1Park Avenue. It also manages Ngoro Industrial Park, which located in Mojokerto. Those projects are primarily located in Jakarta and Surabaya. With a land bank of more than 2,000 hectares (ha), we believe that DILD has sufficient source for its future growth.

“Disclaimer statement in the last page
is an integral part of this report”
www.pefindo-consulting.co.id
Intiland Development, Tbk
June 8, 2015 Page 2 of 14
Diversified Project Portfolio
DILD’s project portfolio is diversified into the following categories: townships & estates, mixed-use & high-rise, industrial and investment property, which are mainly spread across Jakarta and Surabaya. Its recent portfolio has been more varied, mainly concentrating on more innovative mixed-use & high-rise projects. During 2014, residential (high-rise and landed house) contribute 68% to DILD’s total revenue. Going forward, we expect the revenue contribution to be more diversify, following several superblock projects which will be completed in the near future. Among those categories, industrial estate offers the highest gross margin with around 79%, then followed by superblock (51%), residential (47%) and investment property (41%) as of 2014. Having sufficient land bank
We are of the view that one of DILD’s competitive advantage is its big land bank which is more than 2,000 ha. Besides, it also has several key projects to be launched in the near future. This year, the Company plans to allocate capital expenditure (capex) of around IDR2 - IDR2.5 tn for working capital including reclamation project. On the leverage side, we view its net-debt to equity ratio in 1Q15 was still relatively low with 0.39x. We like to view its debt diversification through bank loan and bond issuance since 2013. With the Company’s long experience in property industry, we believe DILD will continue to build prestigious projects in its land bank. Stronger recurring income In FY2014, recurring income contributed 12% or IDR222 billion to total revenue,
coming mainly from office rentals at the Intiland Tower Jakarta and Intiland Tower Surabaya, which accounted for 60% of recurring income. It grew at CAGR 20% in the past three years. To strengthen its recurring income onwards, DILD plans for some of its projects (South Quarter, Kebon Melati, Spazio Tower, and Praxis) to be recurring income generators. Therefore, we view positively its efforts to expand its recurring revenue. Business Prospects The property market is still encouraging despite the shrinking value of Rupiah. Several factors behind the growing industry including: (i) relatively low interest rate, (ii) huge housing backlog in the country, which create high demand for residential, (iii) with huge middle class population and most of them are in productive age, Indonesia has
strong purchasing power. Focusing on high-end property, and with new, exciting projects in the pipeline, we view DILD has bright prospects for the future. Its financial performance over recent years confirms the Company’s capability to expand its business in a sound and well-managed strategy while maintaining its competitiveness. Table 1: Performance Summary
2012 2013 2014 2015P 2016P
Revenue [IDR bn] 1,262 1,510 1,833 2,305 2,641
Pre-tax profit [IDR bn] 276 404 528 679 793
Net profit [IDR bn] 181 324 429 500 584
EPS [IDR] 17.5 31.3 41.8 48.7 56.9
EPS growth [%] 29.5 79.0 33.5 16.6 16.8
P/E [x] 18.3 10.1 15.6 12.4* 10.6*
PBV [x] 0.8 0.8 1.5 1.3* 1.3*
Source: PT Intiland Development Tbk, PEFINDO Research and Consulting Equity & Index Valuation Division Estimates * based on share price as of June 5, 2015 – IDR605/share
INVESTMENT PARAMETER
“Disclaimer statement in the last page
is an integral part of this report”
www.pefindo-consulting.co.id
Intiland Development, Tbk
June 8, 2015 Page 3 of 14
Economic challenge in 2015
Uncertainties are still besetting the global economy after the financial crisis struck in 2008. Many predictions turned out to be false about the economic recovery. Optimisms with bail outs in Europe ended with new crisis. Entering 2015, World Bank predicted with greater optimism that the global economy was on the track to recovery. Falling prices of oil would reduce pressure on non-oil producing developing economies. The US economic recovery is expected to contribute to boosting world exports including Indonesia’s export. For Indonesia itself, we view the challenges confronting its economic development are both external and internal factors. Those from external factors including slump in global trade and slowdown in global economic recovery, an increase in interest rates in some advanced economic in different time, oil price fall would jolt financial stability
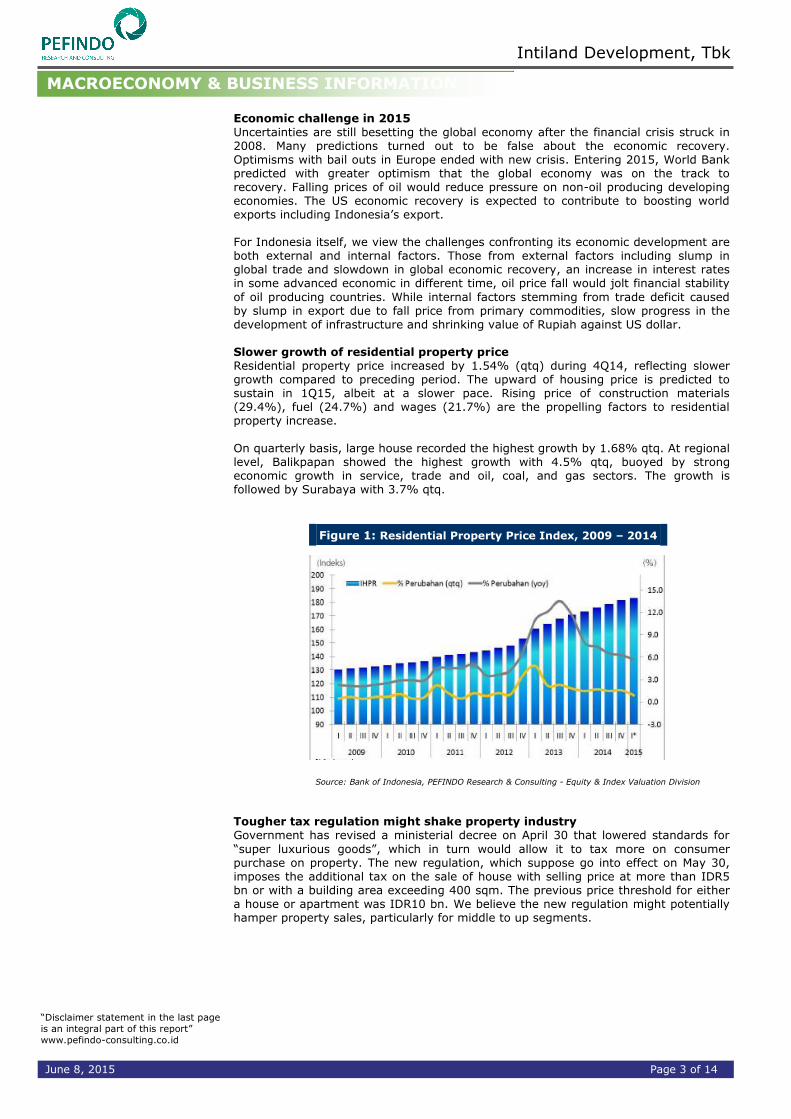
of oil producing countries. While internal factors stemming from trade deficit caused by slump in export due to fall price from primary commodities, slow progress in the development of infrastructure and shrinking value of Rupiah against US dollar. Slower growth of residential property price Residential property price increased by 1.54% (qtq) during 4Q14, reflecting slower growth compared to preceding period. The upward of housing price is predicted to sustain in 1Q15, albeit at a slower pace. Rising price of construction materials (29.4%), fuel (24.7%) and wages (21.7%) are the propelling factors to residential property increase.
On quarterly basis, large house recorded the highest growth by 1.68% qtq. At regional level, Balikpapan showed the highest growth with 4.5% qtq, buoyed by strong economic growth in service, trade and oil, coal, and gas sectors. The growth is followed by Surabaya with 3.7% qtq.
Figure 1: Residential Property Price Index, 2009 – 2014
Source: Bank of Indonesia, PEFINDO Research & Consulting - Equity & Index Valuation Division
Tougher tax regulation might shake property industry Government has revised a ministerial decree on April 30 that lowered standards for
“super luxurious goods”, which in turn would allow it to tax more on consumer purchase on property. The new regulation, which suppose go into effect on May 30, imposes the additional tax on the sale of house with selling price at more than IDR5 bn or with a building area exceeding 400 sqm. The previous price threshold for either a house or apartment was IDR10 bn. We believe the new regulation might potentially hamper property sales, particularly for middle to up segments.
MACROECONOMY & BUSINESS INFORMATION

“Disclaimer statement in the last page
is an integral part of this report”
www.pefindo-consulting.co.id
Intiland Development, Tbk
June 8, 2015 Page 4 of 14
Table 2: Potential Revisions of Current Regulations Affecting Property
Regulation Type Applicable to Formula Note Potential impact
if revised Primary transaction
Secondary transaction
PPH22 Tax Yes No 5% x “super luxury” property value
“Super luxury” currently defined as residential property valued at > IDR10 bio, or houses larger than 500 sqm or apartments larger than 400 sqm
Developers with high exposure to high-end residential and high portion of investment buyers.
PPNBM Tax Yes No 20% x “luxury property” value
“Luxury property” is defined as houses larger than 350 sqm or apartments larger than 150sqm
Developers with high exposure to high-end residential developments and high portion of investment buyers
PBB Annual tax Yes Yes (0.01% - 0.3%) x NJOP
NJOP is the property value set by provincial
government, adjusted once every three years
Developers with high marketing sales contribution
from investment buyers
Regulation Type Applicable to Formula Note Potential impact if
revised Primary transaction
Secondary transaction
Development ratio
Physical requirement
Yes No 1 luxury unit : 2 mid-income units: 3 low-income units
Articles in existing law are unclear on whether the required development ratio is applied
per developer or across developers or within a regency or within province, etc
All developers would be negatively affected, especially if the price cap for social housing
remains at current levels.
LTV Mortgage down-payment requirement
Yes Yes LTV max 70% - 50%, depending on unit size and number of mortgage applications
LTV policy may be revised to counter the declining mortgage growth
Positive for some developers with exposure in classes of mortgage that receive LTV relaxation
Source: JP Morgan, PEFINDO Research & Consulting - Equity & Index Valuation Division
DILD at a Glance DILD was established in June 1983, but its property journey has begun the 1970s when its founder developed Cilandak Garden Housing (Jakarta) and Darmo Satellite
Town (Surabaya). Having more than 40-year experience, the Company is a leading property developer in Indonesia and specializes in development, management and investment of property business. Its portfolio comprises residential estates and townships, mixed-use & high-rise developments, industrial estates as well as investment property that are primarily located in Jakarta and Surabaya.
“Disclaimer statement in the last page
is an integral part of this report”
www.pefindo-consulting.co.id
Intiland Development, Tbk
June 8, 2015 Page 5 of 14
Figure 2: DILD Milestones
Source: PT Intiland Development Tbk, PEFINDO Research and Consulting Equity & Index Valuation Division
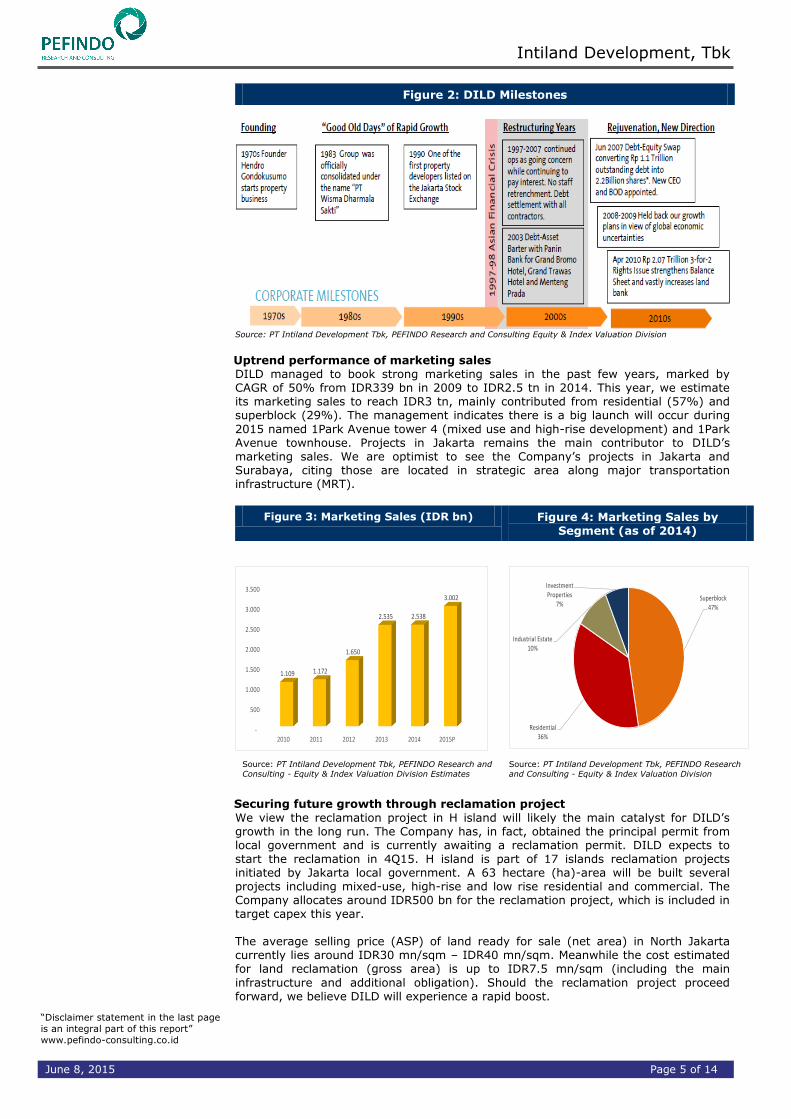
Uptrend performance of marketing sales DILD managed to book strong marketing sales in the past few years, marked by CAGR of 50% from IDR339 bn in 2009 to IDR2.5 tn in 2014. This year, we estimate its marketing sales to reach IDR3 tn, mainly contributed from residential (57%) and superblock (29%). The management indicates there is a big launch will occur during
2015 named 1Park Avenue tower 4 (mixed use and high-rise development) and 1Park Avenue townhouse. Projects in Jakarta remains the main contributor to DILD’s marketing sales. We are optimist to see the Company’s projects in Jakarta and Surabaya, citing those are located in strategic area along major transportation infrastructure (MRT).
Figure 3: Marketing Sales (IDR bn) Figure 4: Marketing Sales by Segment (as of 2014)
-
500
1.000
1.500
2.000
2.500
3.000
3.500
2010 2011 2012 2013 2014 2015P
1.109 1.172
1.650
2.535 2.538
3.002
Superblock47%
Residential36%
Industrial Estate10%
Investment Properties
7%
Source: PT Intiland Development Tbk, PEFINDO Research and
Consulting - Equity & Index Valuation Division Estimates
Source: PT Intiland Development Tbk, PEFINDO Research
and Consulting - Equity & Index Valuation Division
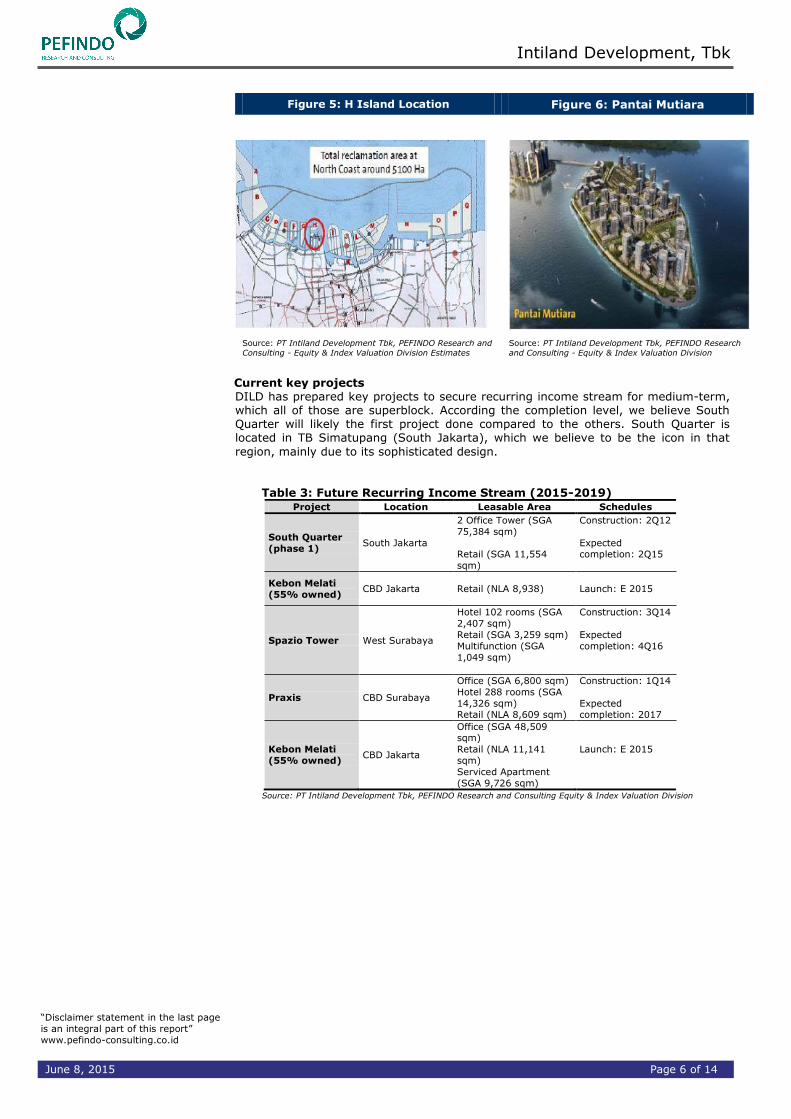
Securing future growth through reclamation project
We view the reclamation project in H island will likely the main catalyst for DILD’s growth in the long run. The Company has, in fact, obtained the principal permit from local government and is currently awaiting a reclamation permit. DILD expects to start the reclamation in 4Q15. H island is part of 17 islands reclamation projects initiated by Jakarta local government. A 63 hectare (ha)-area will be built several projects including mixed-use, high-rise and low rise residential and commercial. The Company allocates around IDR500 bn for the reclamation project, which is included in target capex this year. The average selling price (ASP) of land ready for sale (net area) in North Jakarta currently lies around IDR30 mn/sqm – IDR40 mn/sqm. Meanwhile the cost estimated for land reclamation (gross area) is up to IDR7.5 mn/sqm (including the main
infrastructure and additional obligation). Should the reclamation project proceed forward, we believe DILD will experience a rapid boost.
“Disclaimer statement in the last page
is an integral part of this report”
www.pefindo-consulting.co.id
Intiland Development, Tbk
June 8, 2015 Page 6 of 14
Figure 5: H Island Location Figure 6: Pantai Mutiara
Source: PT Intiland Development Tbk, PEFINDO Research and
Consulting - Equity & Index Valuation Division Estimates
Source: PT Intiland Development Tbk, PEFINDO Research
and Consulting - Equity & Index Valuation Division
Current key projects
DILD has prepared key projects to secure recurring income stream for medium-term, which all of those are superblock. According the completion level, we believe South Quarter will likely the first project done compared to the others. South Quarter is located in TB Simatupang (South Jakarta), which we believe to be the icon in that
region, mainly due to its sophisticated design.
Table 3: Future Recurring Income Stream (2015-2019)
Project Location Leasable Area Schedules
South Quarter
(phase 1) South Jakarta
2 Office Tower (SGA
75,384 sqm)
Retail (SGA 11,554
sqm)
Construction: 2Q12
Expected completion: 2Q15
Kebon Melati
(55% owned) CBD Jakarta
Retail (NLA 8,938)
Launch: E 2015
Spazio Tower West Surabaya
Hotel 102 rooms (SGA
2,407 sqm)
Retail (SGA 3,259 sqm)
Multifunction (SGA
1,049 sqm)
Construction: 3Q14
Expected
completion: 4Q16
Praxis CBD Surabaya
Office (SGA 6,800 sqm)
Hotel 288 rooms (SGA
14,326 sqm) Retail (NLA 8,609 sqm)
Construction: 1Q14
Expected completion: 2017
Kebon Melati
(55% owned) CBD Jakarta
Office (SGA 48,509 sqm)
Retail (NLA 11,141
sqm)
Serviced Apartment
(SGA 9,726 sqm)
Launch: E 2015
Source: PT Intiland Development Tbk, PEFINDO Research and Consulting Equity & Index Valuation Division
“Disclaimer statement in the last page
is an integral part of this report”
www.pefindo-consulting.co.id
Intiland Development, Tbk
June 8, 2015 Page 7 of 14
Soaring revenue but margin squeezed
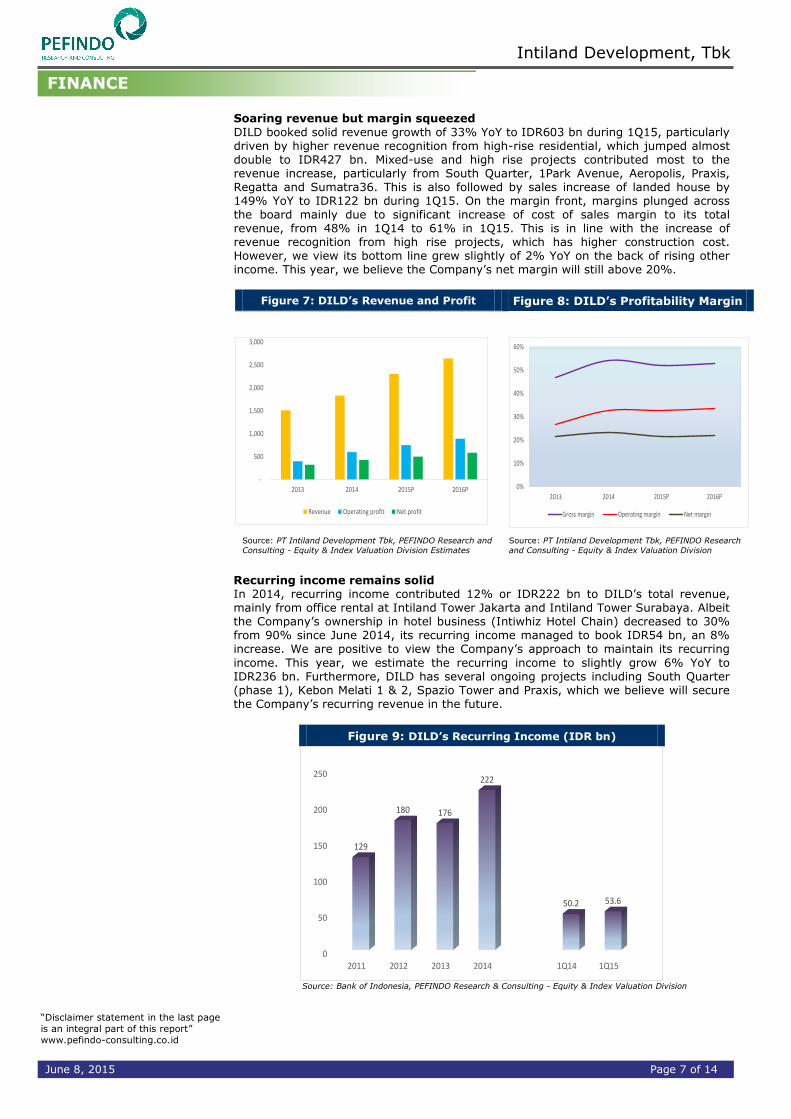
DILD booked solid revenue growth of 33% YoY to IDR603 bn during 1Q15, particularly driven by higher revenue recognition from high-rise residential, which jumped almost double to IDR427 bn. Mixed-use and high rise projects contributed most to the revenue increase, particularly from South Quarter, 1Park Avenue, Aeropolis, Praxis, Regatta and Sumatra36. This is also followed by sales increase of landed house by 149% YoY to IDR122 bn during 1Q15. On the margin front, margins plunged across the board mainly due to significant increase of cost of sales margin to its total revenue, from 48% in 1Q14 to 61% in 1Q15. This is in line with the increase of revenue recognition from high rise projects, which has higher construction cost. However, we view its bottom line grew slightly of 2% YoY on the back of rising other income. This year, we believe the Company’s net margin will still above 20%.
Figure 7: DILD’s Revenue and Profit Figure 8: DILD’s Profitability Margin
-
500
1,000
1,500
2,000
2,500
3,000
2013 2014 2015P 2016P
Revenue Operating profit Net profit
0%
10%
20%
30%
40%
50%
60%
2013 2014 2015P 2016P
Gross margin Operating margin Net margin
Source: PT Intiland Development Tbk, PEFINDO Research and
Consulting - Equity & Index Valuation Division Estimates
Source: PT Intiland Development Tbk, PEFINDO Research
and Consulting - Equity & Index Valuation Division
Recurring income remains solid In 2014, recurring income contributed 12% or IDR222 bn to DILD’s total revenue, mainly from office rental at Intiland Tower Jakarta and Intiland Tower Surabaya. Albeit the Company’s ownership in hotel business (Intiwhiz Hotel Chain) decreased to 30% from 90% since June 2014, its recurring income managed to book IDR54 bn, an 8% increase. We are positive to view the Company’s approach to maintain its recurring
income. This year, we estimate the recurring income to slightly grow 6% YoY to IDR236 bn. Furthermore, DILD has several ongoing projects including South Quarter (phase 1), Kebon Melati 1 & 2, Spazio Tower and Praxis, which we believe will secure the Company’s recurring revenue in the future.
Figure 9: DILD’s Recurring Income (IDR bn)
0
50
100
150
200
250
2011 2012 2013 2014 1Q14 1Q15
129
180 176
222
50.2 53.6
Source: Bank of Indonesia, PEFINDO Research & Consulting - Equity & Index Valuation Division
FINANCE
“Disclaimer statement in the last page
is an integral part of this report”
www.pefindo-consulting.co.id
Intiland Development, Tbk
June 8, 2015 Page 8 of 14
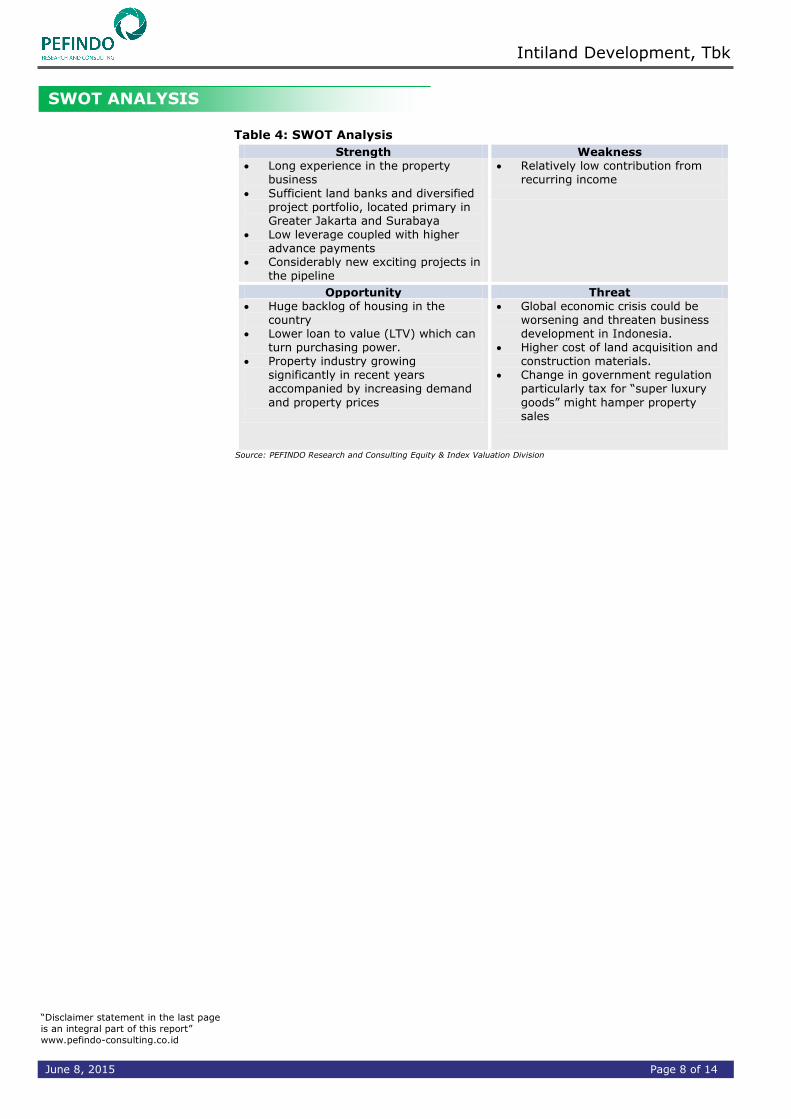
Table 4: SWOT Analysis
Strength Weakness Long experience in the property
business
Sufficient land banks and diversified project portfolio, located primary in Greater Jakarta and Surabaya
Low leverage coupled with higher advance payments
Considerably new exciting projects in the pipeline
Relatively low contribution from recurring income
Opportunity Threat Huge backlog of housing in the
country Lower loan to value (LTV) which can
turn purchasing power. Property industry growing
significantly in recent years accompanied by increasing demand
and property prices
Global economic crisis could be worsening and threaten business development in Indonesia.
Higher cost of land acquisition and construction materials.
Change in government regulation particularly tax for “super luxury
goods” might hamper property sales
Source: PEFINDO Research and Consulting Equity & Index Valuation Division
SWOT ANALYSIS
“Disclaimer statement in the last page
is an integral part of this report”
www.pefindo-consulting.co.id
Intiland Development, Tbk
June 8, 2015 Page 9 of 14
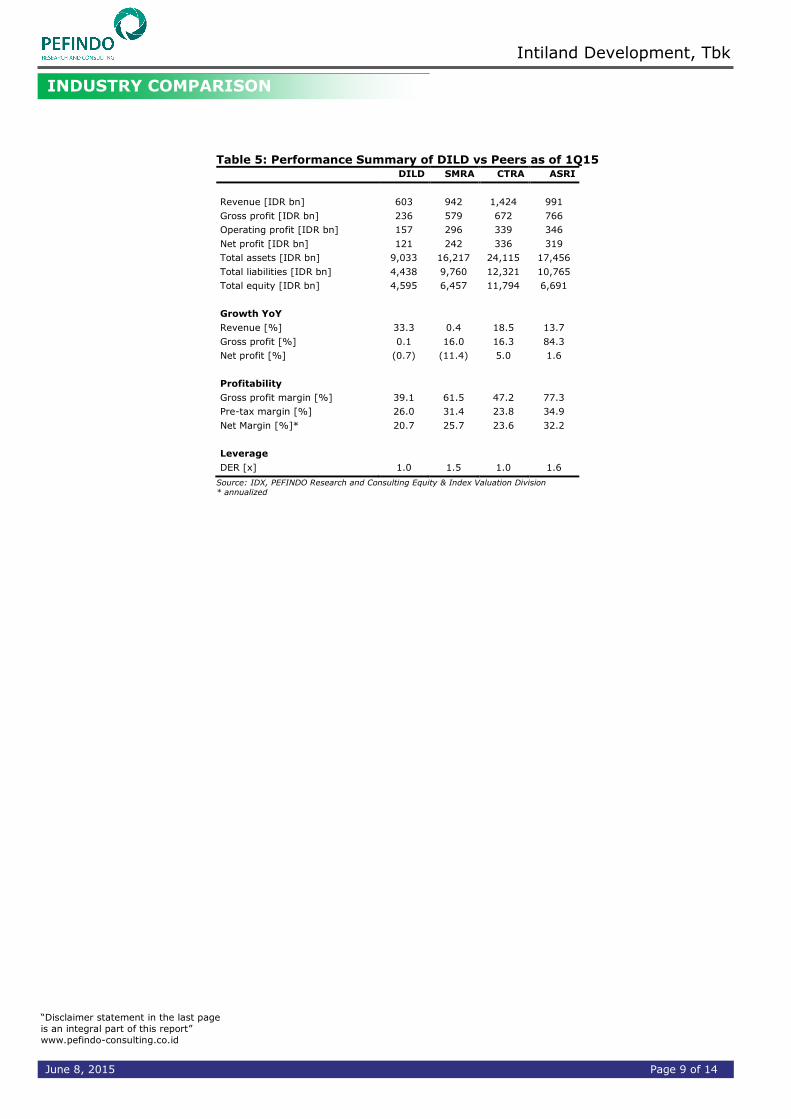
Table 5: Performance Summary of DILD vs Peers as of 1Q15 DILD SMRA CTRA ASRI
Revenue [IDR bn] 603 942 1,424 991
Gross profit [IDR bn] 236 579 672 766
Operating profit [IDR bn] 157 296 339 346
Net profit [IDR bn] 121 242 336 319
Total assets [IDR bn] 9,033 16,217 24,115 17,456
Total liabilities [IDR bn] 4,438 9,760 12,321 10,765
Total equity [IDR bn] 4,595 6,457 11,794 6,691
Growth YoY
Revenue [%] 33.3 0.4 18.5 13.7
Gross profit [%] 0.1 16.0 16.3 84.3
Net profit [%] (0.7) (11.4) 5.0 1.6
Profitability
Gross profit margin [%] 39.1 61.5 47.2 77.3
Pre-tax margin [%] 26.0 31.4 23.8 34.9
Net Margin [%]* 20.7 25.7 23.6 32.2
Leverage
DER [x] 1.0 1.5 1.0 1.6
Source: IDX, PEFINDO Research and Consulting Equity & Index Valuation Division * annualized
INDUSTRY COMPARISON
“Disclaimer statement in the last page
is an integral part of this report”
www.pefindo-consulting.co.id
Intiland Development, Tbk
June 8, 2015 Page 10 of 14
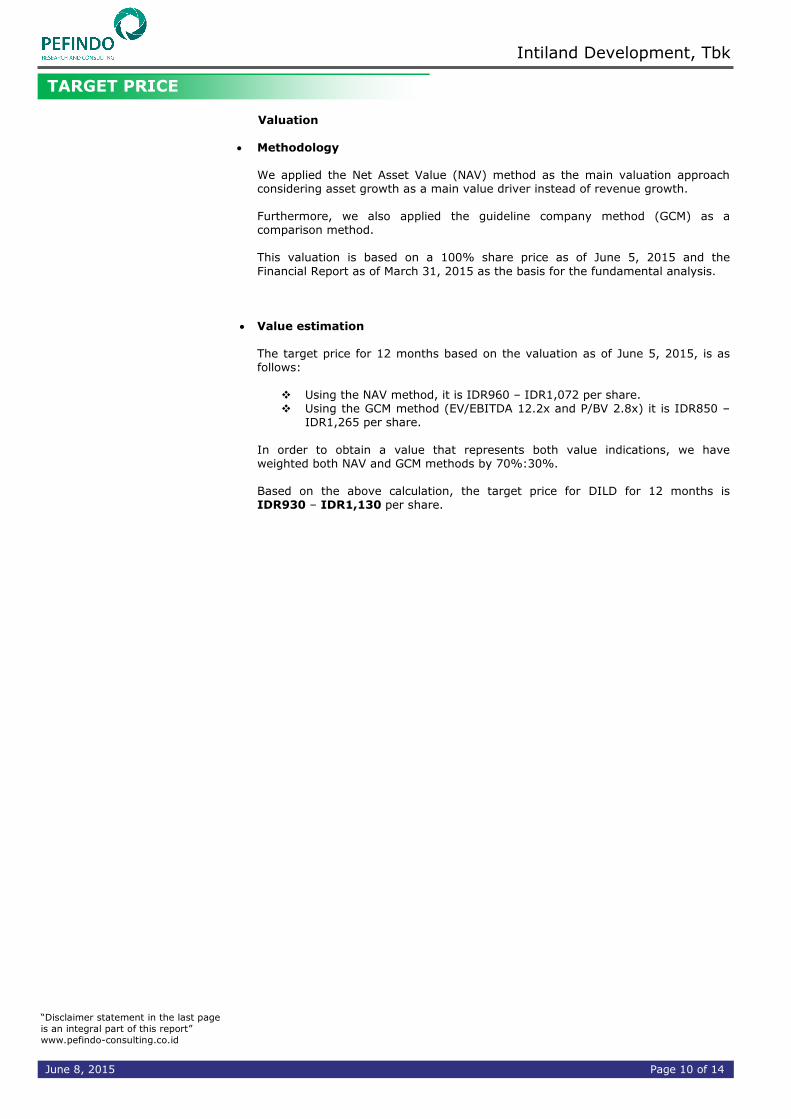
Valuation
Methodology We applied the Net Asset Value (NAV) method as the main valuation approach considering asset growth as a main value driver instead of revenue growth. Furthermore, we also applied the guideline company method (GCM) as a comparison method. This valuation is based on a 100% share price as of June 5, 2015 and the
Financial Report as of March 31, 2015 as the basis for the fundamental analysis.
Value estimation
The target price for 12 months based on the valuation as of June 5, 2015, is as follows:
Using the NAV method, it is IDR960 – IDR1,072 per share. Using the GCM method (EV/EBITDA 12.2x and P/BV 2.8x) it is IDR850 –
IDR1,265 per share.
In order to obtain a value that represents both value indications, we have weighted both NAV and GCM methods by 70%:30%. Based on the above calculation, the target price for DILD for 12 months is IDR930 – IDR1,130 per share.
TARGET PRICE
“Disclaimer statement in the last page
is an integral part of this report”
www.pefindo-consulting.co.id
Intiland Development, Tbk
June 8, 2015 Page 11 of 14
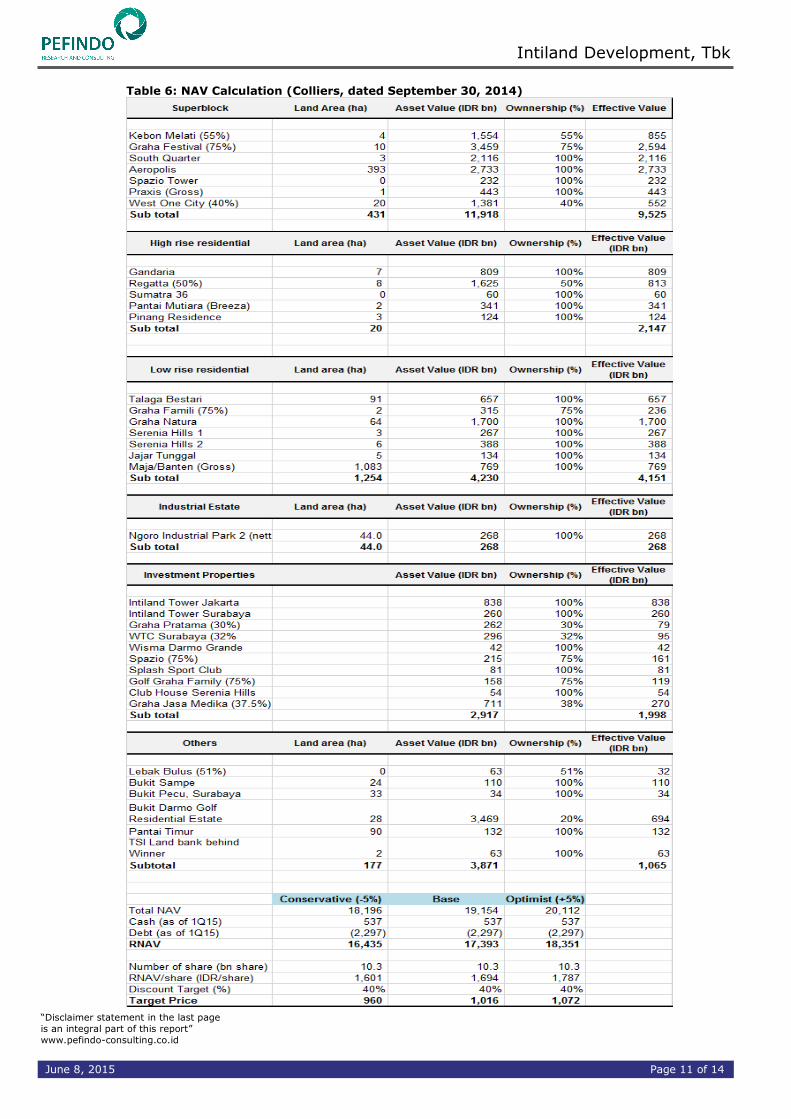
Table 6: NAV Calculation (Colliers, dated September 30, 2014)
“Disclaimer statement in the last page
is an integral part of this report”
www.pefindo-consulting.co.id
Intiland Development, Tbk
June 8, 2015 Page 12 of 14
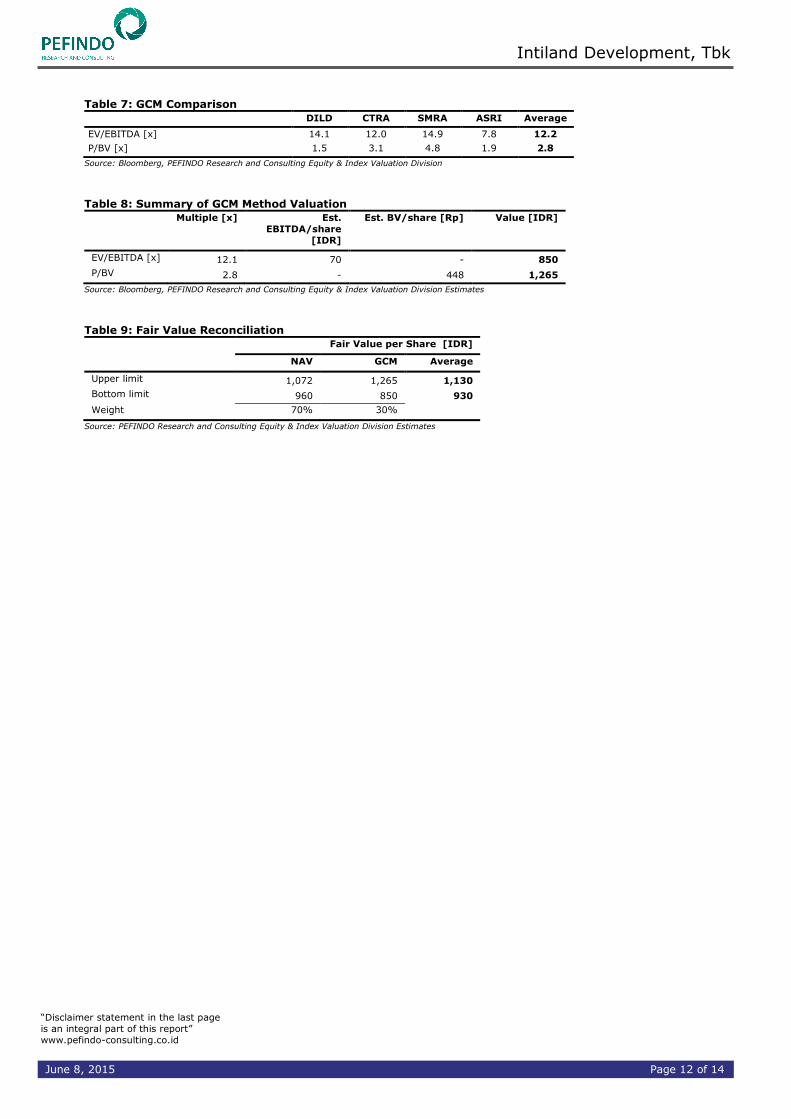
Table 7: GCM Comparison
DILD CTRA SMRA ASRI Average
EV/EBITDA [x] 14.1 12.0 14.9 7.8 12.2
P/BV [x] 1.5 3.1 4.8 1.9 2.8
Source: Bloomberg, PEFINDO Research and Consulting Equity & Index Valuation Division Table 8: Summary of GCM Method Valuation
Multiple [x] Est.
EBITDA/share
[IDR]
Est. BV/share [Rp] Value [IDR]
EV/EBITDA [x] 12.1 70 - 850
P/BV 2.8 - 448 1,265
Source: Bloomberg, PEFINDO Research and Consulting Equity & Index Valuation Division Estimates
Table 9: Fair Value Reconciliation
Fair Value per Share [IDR]
NAV GCM Average
Upper limit 1,072 1,265 1,130
Bottom limit 960 850 930
Weight 70% 30%
Source: PEFINDO Research and Consulting Equity & Index Valuation Division Estimates
“Disclaimer statement in the last page
is an integral part of this report”
www.pefindo-consulting.co.id
Intiland Development, Tbk
June 8, 2015 Page 13 of 14
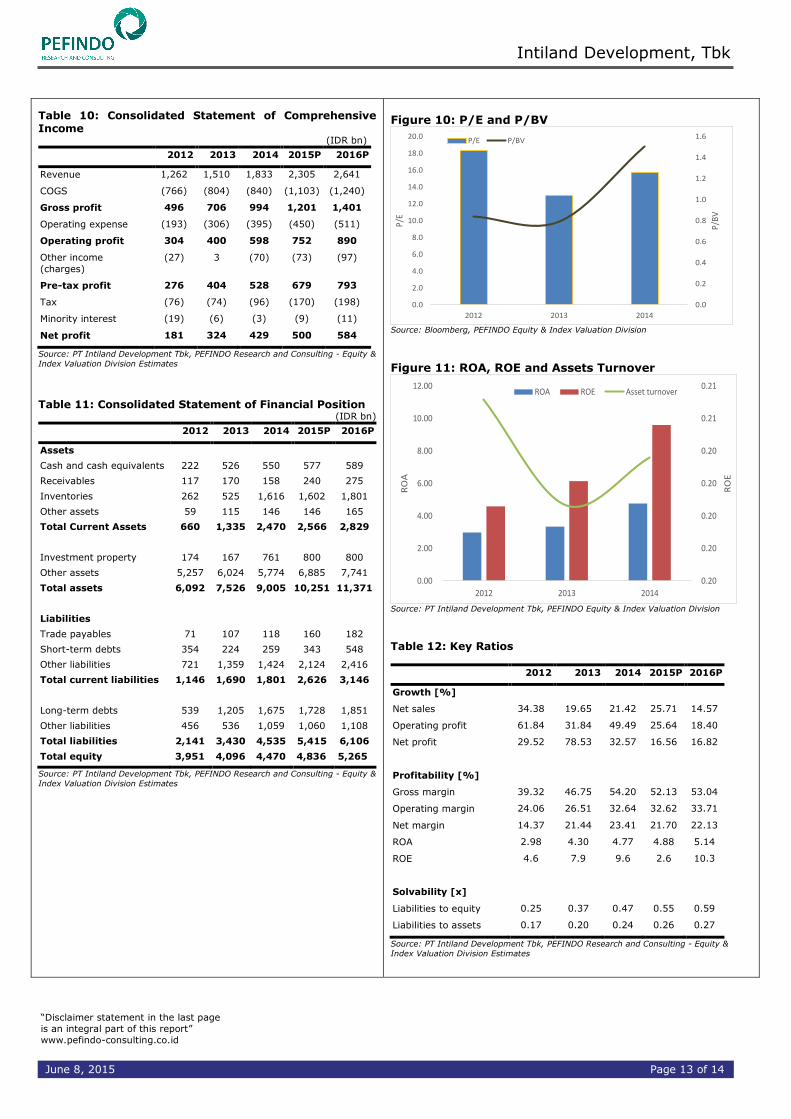
Table 10: Consolidated Statement of Comprehensive Income
(IDR bn)
2012 2013 2014 2015P 2016P
Revenue 1,262 1,510 1,833 2,305 2,641
COGS (766) (804) (840) (1,103) (1,240)
Gross profit 496 706 994 1,201 1,401
Operating expense (193) (306) (395) (450) (511)
Operating profit 304 400 598 752 890
Other income
(charges)
(27) 3 (70) (73) (97)
Pre-tax profit 276 404 528 679 793
Tax (76) (74) (96) (170) (198)
Minority interest (19) (6) (3) (9) (11)
Net profit 181 324 429 500 584
Source: PT Intiland Development Tbk, PEFINDO Research and Consulting - Equity &
Index Valuation Division Estimates Table 11: Consolidated Statement of Financial Position
(IDR bn)
2012 2013 2014 2015P 2016P
Assets
Cash and cash equivalents 222 526 550 577 589
Receivables 117 170 158 240 275
Inventories 262 525 1,616 1,602 1,801
Other assets 59 115 146 146 165
Total Current Assets 660 1,335 2,470 2,566 2,829
Investment property 174 167 761 800 800
Other assets 5,257 6,024 5,774 6,885 7,741
Total assets 6,092 7,526 9,005 10,251 11,371
Liabilities
Trade payables 71 107 118 160 182
Short-term debts 354 224 259 343 548
Other liabilities 721 1,359 1,424 2,124 2,416
Total current liabilities 1,146 1,690 1,801 2,626 3,146
Long-term debts 539 1,205 1,675 1,728 1,851
Other liabilities 456 536 1,059 1,060 1,108
Total liabilities 2,141 3,430 4,535 5,415 6,106
Total equity 3,951 4,096 4,470 4,836 5,265
Source: PT Intiland Development Tbk, PEFINDO Research and Consulting - Equity &
Index Valuation Division Estimates
Figure 10: P/E and P/BV
0.0
0.2
0.4
0.6
0.8
1.0
1.2
1.4
1.6
0.0
2.0
4.0
6.0
8.0
10.0
12.0
14.0
16.0
18.0
20.0
2012 2013 2014
P/B
V
P/E
P/E P/BV
Source: Bloomberg, PEFINDO Equity & Index Valuation Division
Figure 11: ROA, ROE and Assets Turnover
0.20
0.20
0.20
0.20
0.20
0.21
0.21
0.00
2.00
4.00
6.00
8.00
10.00
12.00
2012 2013 2014
RO
E
RO
AROA ROE Asset turnover
Source: PT Intiland Development Tbk, PEFINDO Equity & Index Valuation Division
Table 12: Key Ratios
2012 2013 2014 2015P 2016P
Growth [%]
Net sales 34.38 19.65 21.42 25.71 14.57
Operating profit 61.84 31.84 49.49 25.64 18.40
Net profit 29.52 78.53 32.57 16.56 16.82
Profitability [%]
Gross margin 39.32 46.75 54.20 52.13 53.04
Operating margin 24.06 26.51 32.64 32.62 33.71
Net margin 14.37 21.44 23.41 21.70 22.13
ROA 2.98 4.30 4.77 4.88 5.14
ROE 4.6 7.9 9.6 2.6 10.3
Solvability [x]
Liabilities to equity 0.25 0.37 0.47 0.55 0.59
Liabilities to assets 0.17 0.20 0.24 0.26 0.27
Source: PT Intiland Development Tbk, PEFINDO Research and Consulting - Equity &
Index Valuation Division Estimates

“Disclaimer statement in the last page
is an integral part of this report”
www.pefindo-consulting.co.id
Intiland Development, Tbk
June 8, 2015 Page 14 of 14
DISCLAIMER
This report was prepared based on trusted and reliable sources. Nevertheless, we do not guarantee its completeness, accuracy and adequacy. Therefore, we are not responsible for any investment decisions made based on this report. All assumptions, opinions and predictions were solely our interna l judgments as of the reporting date, and those judgments are subject to change without further notice. We are not responsible for any mistakes or negligence that occurs by using this report. Recent performance cannot always be used as a reference for future outcome. This report does not offer a recommendation to purchase or hold particular shares. This report might not be suitable for some investors. All opinions in this report have been presented fairly as of the issuing date with good intentions; however, they could change at any time without further notice. The price, value or income of each share of the Company stated in this report might be lower than investor expectations, and investors may obtain returns lower than the invested amount. Investment is defined as the probable income that will be received in the future; nonetheless such returns may fluctuate. As for companies whose shares are denominated in a currency other than Rupiah, foreign exchange fluctuation may reduce their share value, price or the returns for investors. This report does not contain any information for tax considerations in investment decision-making. The share price target in this report is a fundamental value, not a fair market value or a transaction price reference required by regulations. The share price target report issued by the PT PEFINDO Riset Konsultasi (“PRK”) or “PEFINDO Research and Consulting” is not a recommendation to buy, sell or hold particular shares. It should not be considered as investment advice from the PRK and its scope of service to some parties, including listed companies, financial advisors, brokers, investment banks, financial institutions and intermediaries, does not correlate with receiving rewards or any other benefits from such parties. This report is not intended for any particular investor and cannot be used as part of an objective investment analysis of particular shares, an investment recommendation, or an investment strategy. We strongly recommend investors to consider the suitability of the situation and conditions before making a decision in relation with the figures in this report. If necessary, consult with your financial advisor. PEFINDO keeps the activities of the Equity Valuation Division separate from its Ratings Division to preserve the independence and objectivity of its analytical processes and products. PEFINDO has established policies and procedures to maintain the confidentiality of non-public information received in connection with each analytical process. The entire process, methodology and the database used in the preparation of the Reference Share Price Target Report as a whole are different from the processes, methodologies and databases used by PEFINDO in issuing ratings. This report was prepared and composed by PRK with the objective of enhancing the transparency of share prices of listed companies in the Indonesia Stock Exchange (IDX). This report is also free of influence from
any other party, including pressure or force either from IDX or the listed company reviewed. PRK earns a reward from IDX and the reviewed company for issuing this report twice a year. For further information, please visit our website at http://www.pefindo-consulting.co.id This report was prepared and composed by the PEFINDO Research & Consult ing - Equity & Index Valuation Division. In Indonesia, this report is published in our website and in the IDX website.