Flowchart examples
59
Flowchart
-
Upload
ganang-wibisono -
Category
Internet
-
view
281 -
download
3
Transcript of Flowchart examples
Flowchart
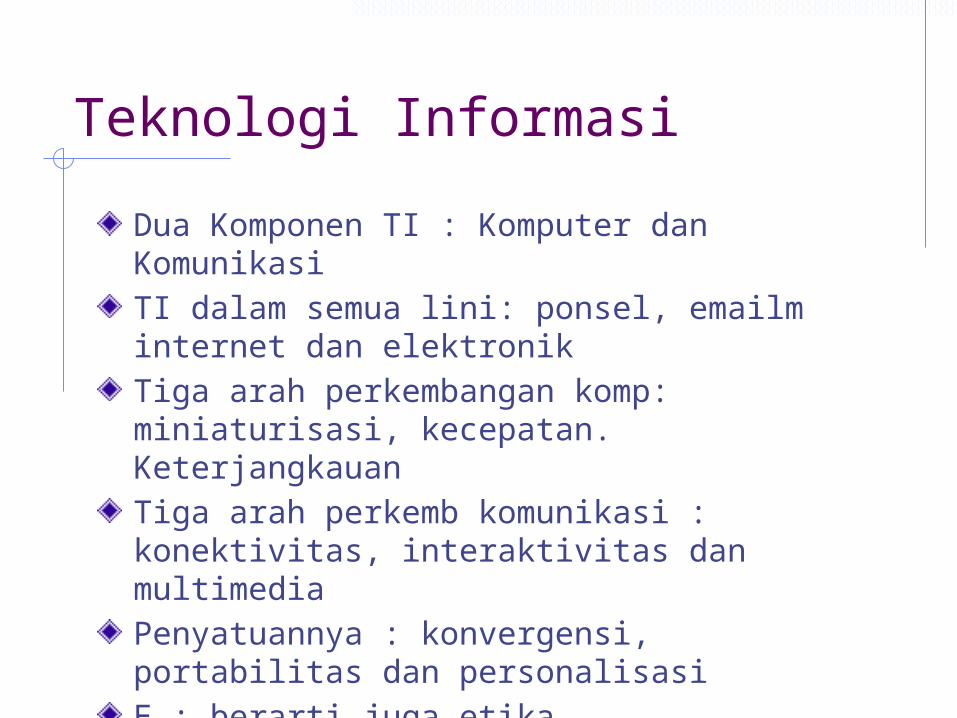
Teknologi Informasi
Dua Komponen TI : Komputer dan KomunikasiTI dalam semua lini: ponsel, emailm internet dan elektronikTiga arah perkembangan komp: miniaturisasi, kecepatan. KeterjangkauanTiga arah perkemb komunikasi : konektivitas, interaktivitas dan multimediaPenyatuannya : konvergensi, portabilitas dan personalisasiE : berarti juga etika
Database dan Sistem Informasi
Sistem Manajemen DatabaseBasis Data Spasial
Aplikasi
Remote SensingGISPemodelan Numerikdll
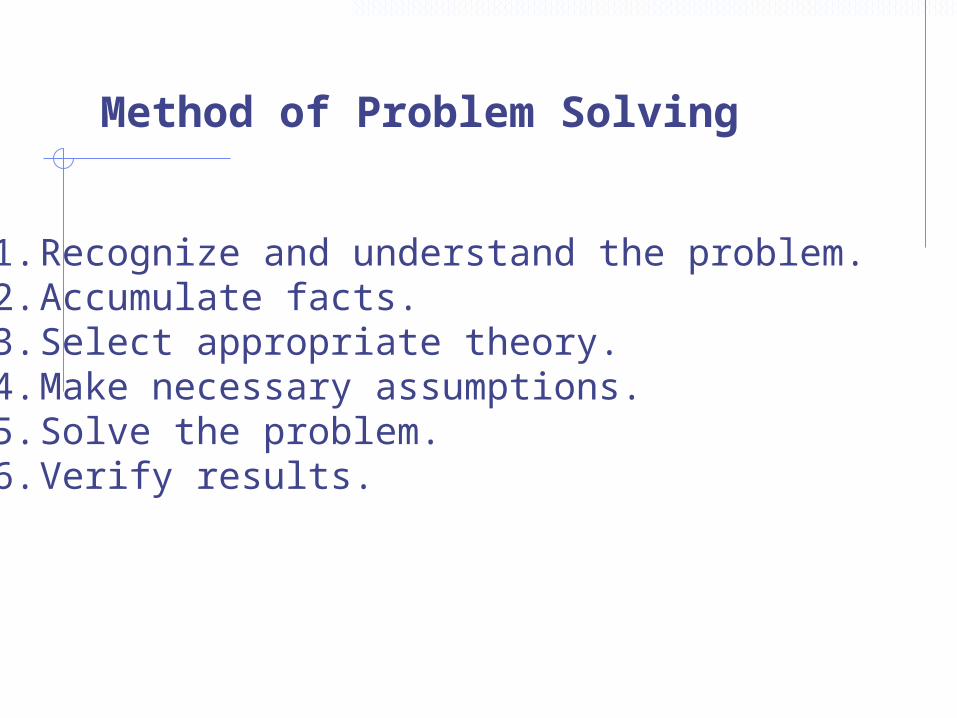
Method of Problem Solving
1. Recognize and understand the problem. 2. Accumulate facts. 3. Select appropriate theory. 4. Make necessary assumptions. 5. Solve the problem. 6. Verify results.
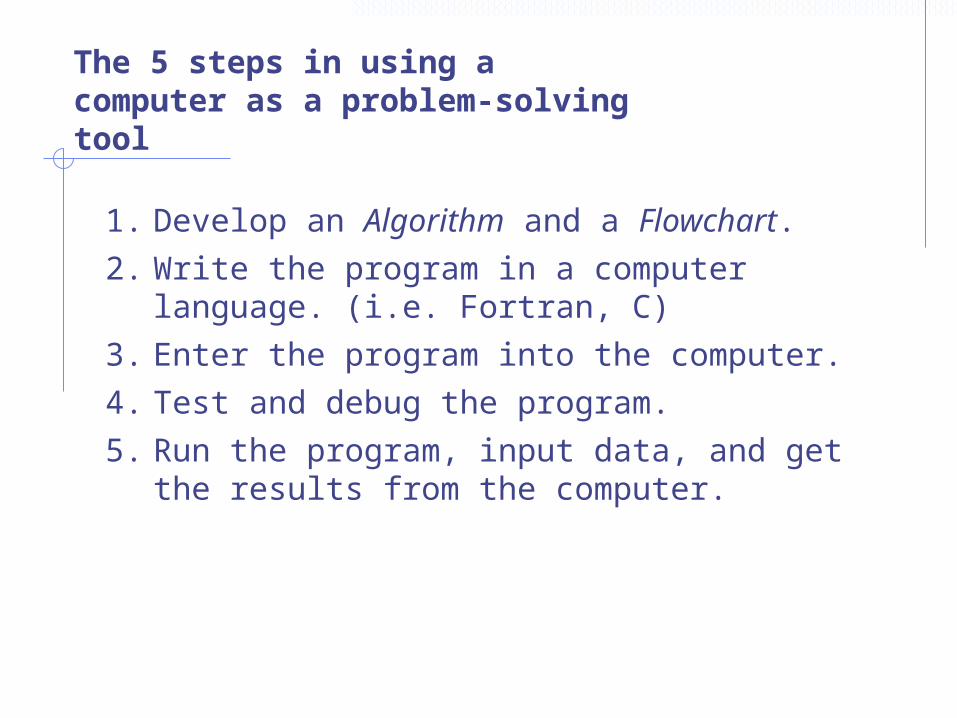
The 5 steps in using a computer as a problem-solving tool
1. Develop an Algorithm and a Flowchart.
2. Write the program in a computer language. (i.e. Fortran, C)
3. Enter the program into the computer.
4. Test and debug the program.
5. Run the program, input data, and get the results from the computer.
Definition of Algorithm and Flowchart
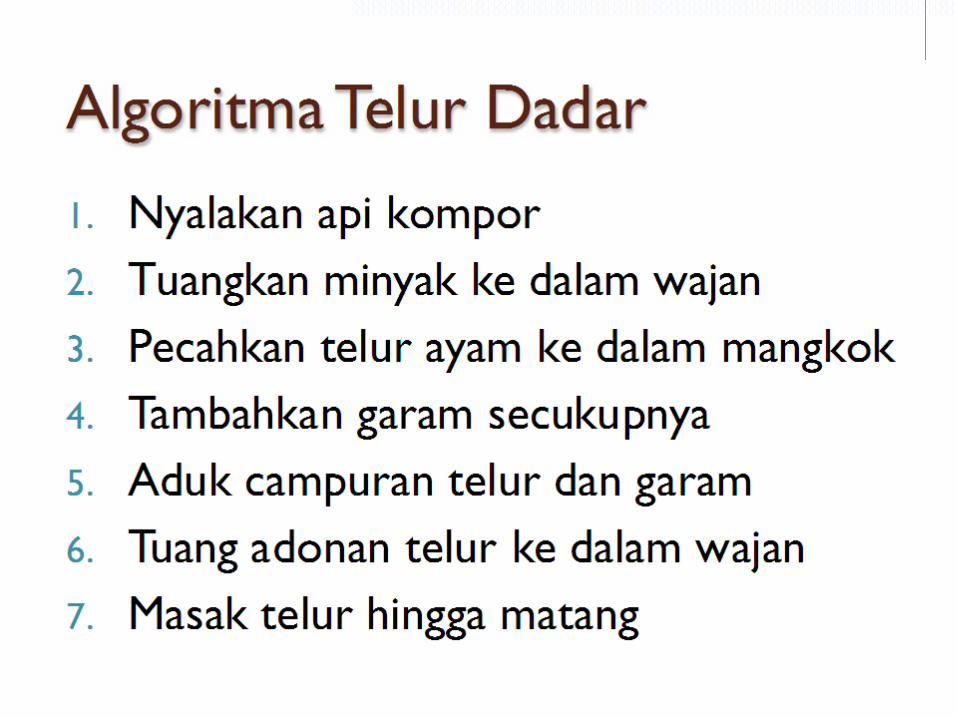
1. An Algorithm is just a detailed sequence of simple steps that are needed to solve a problem.
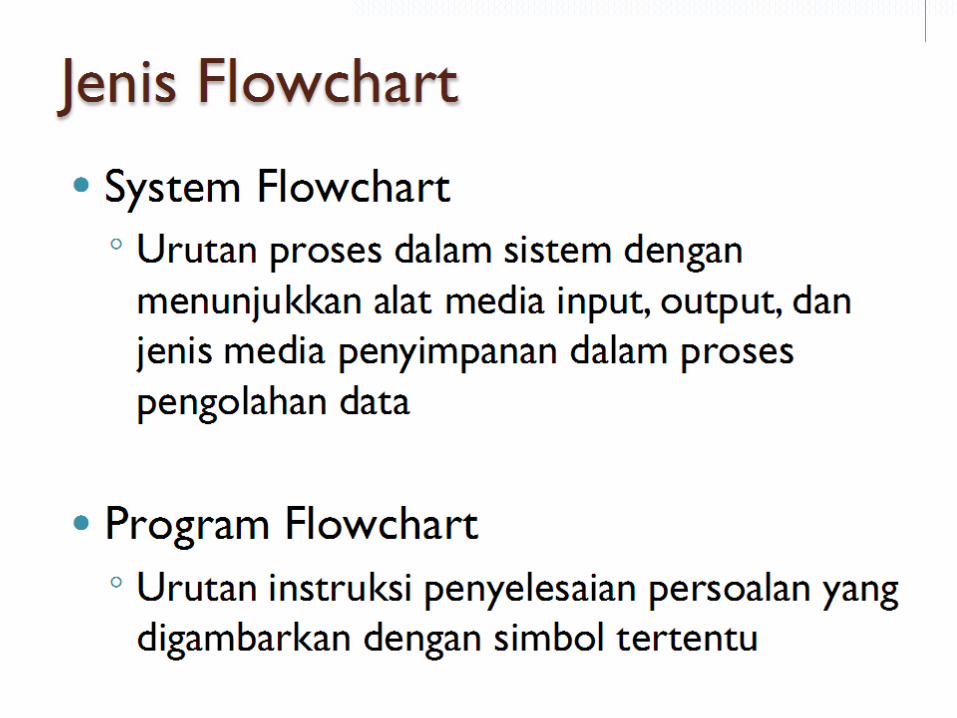
2. A Flowchart is a graphical representation of an algorithm.
A flow chart, or flow diagram, is a graphical representation of a process or system that details the sequencing of steps required to create output. A typical flow chart uses a set of basic symbols to represent various functions, and shows the sequence and interconnection of functions with lines and arrows.
A flowchart is a diagrammatic representation that illustrates the sequence of operations to be performed to get the solution of a problem. Flowcharts are generally drawn in the early stages of formulating computer solutions. Flowcharts facilitate communication between programmers and business people. These flowcharts play a vital role in the programming of a problem and are quite helpful in understanding the logic of complicated and lengthy problems. Once the flowchart is drawn, it becomes easy to write the program in any high level language. Often we see how flowcharts are helpful in explaining the program to others.
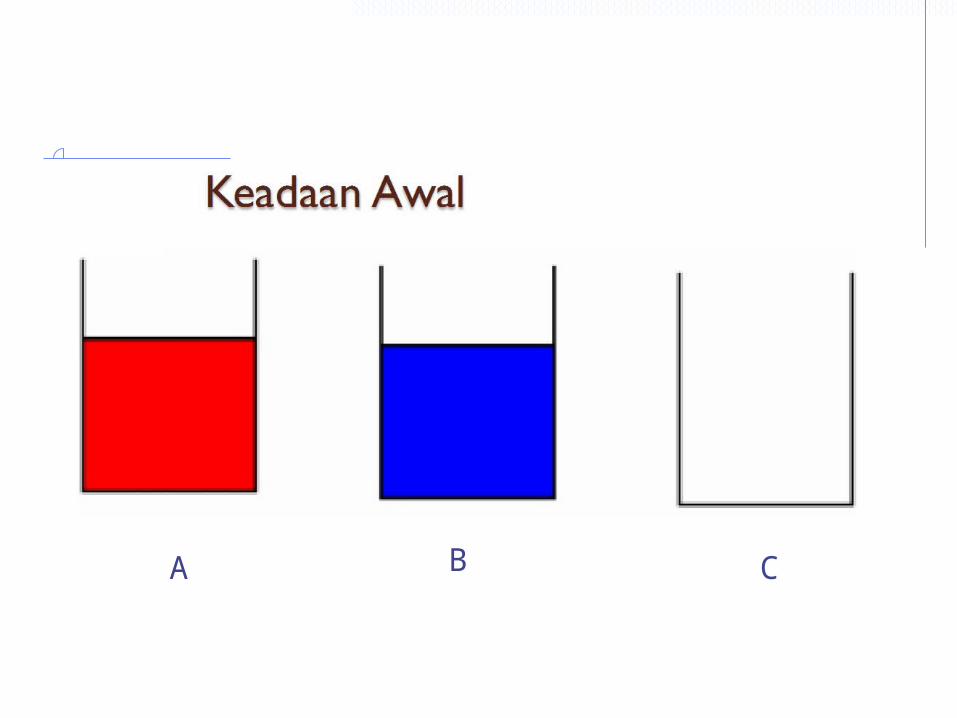
A B C
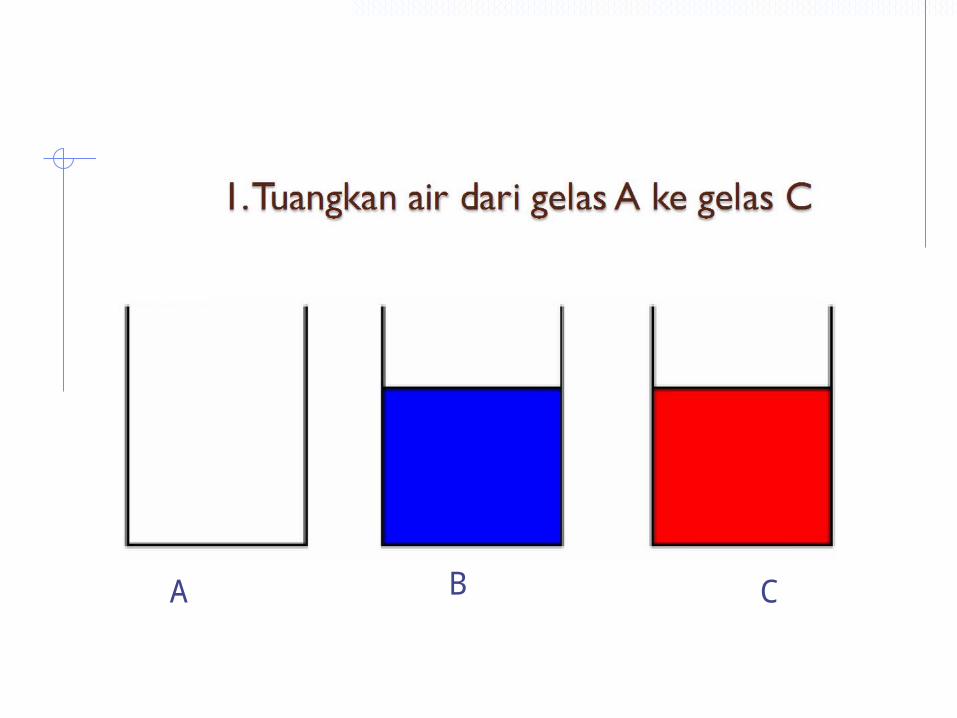
A B C
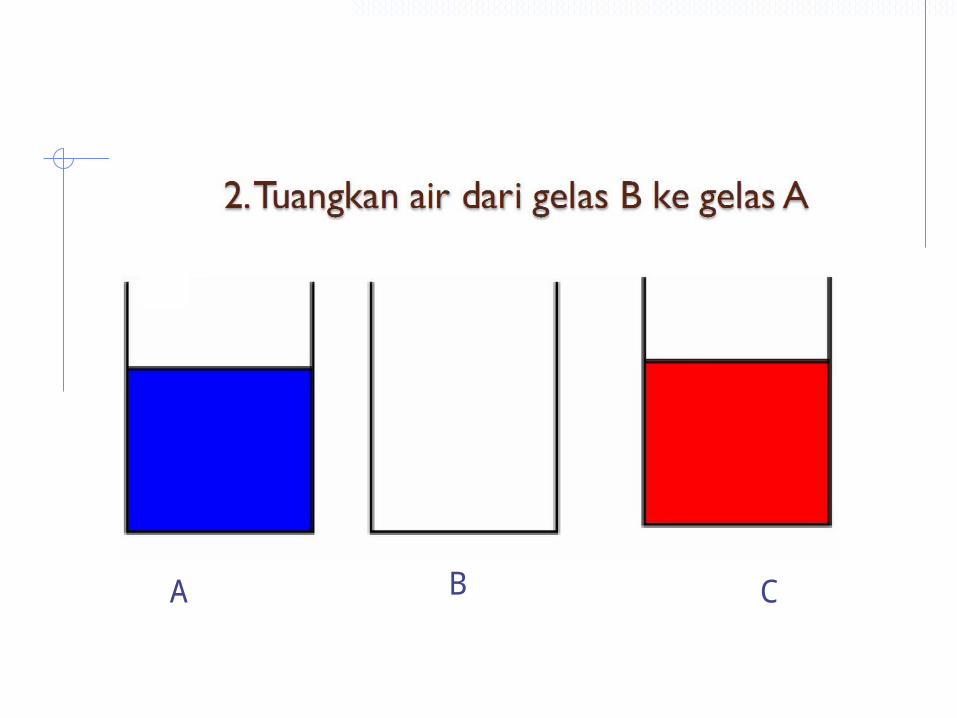
A B C
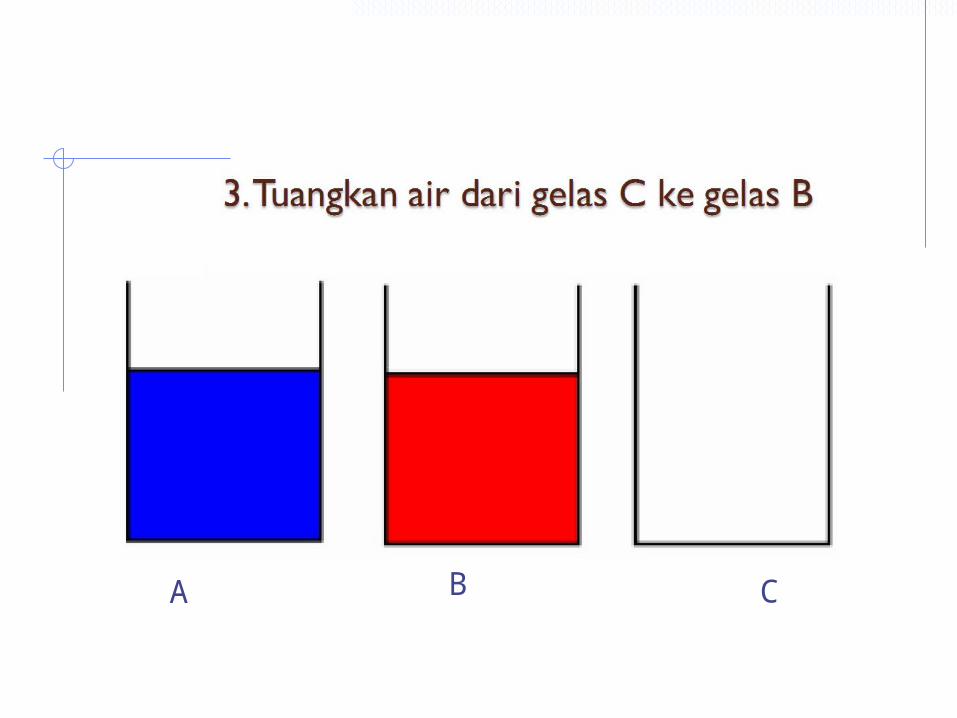
A B C
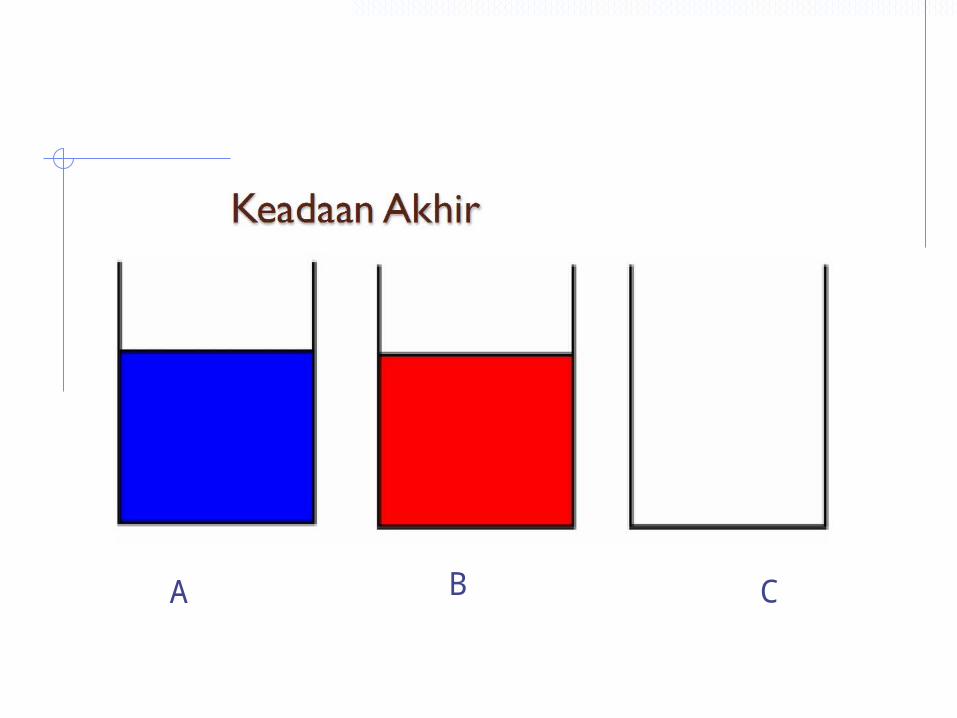
A B C
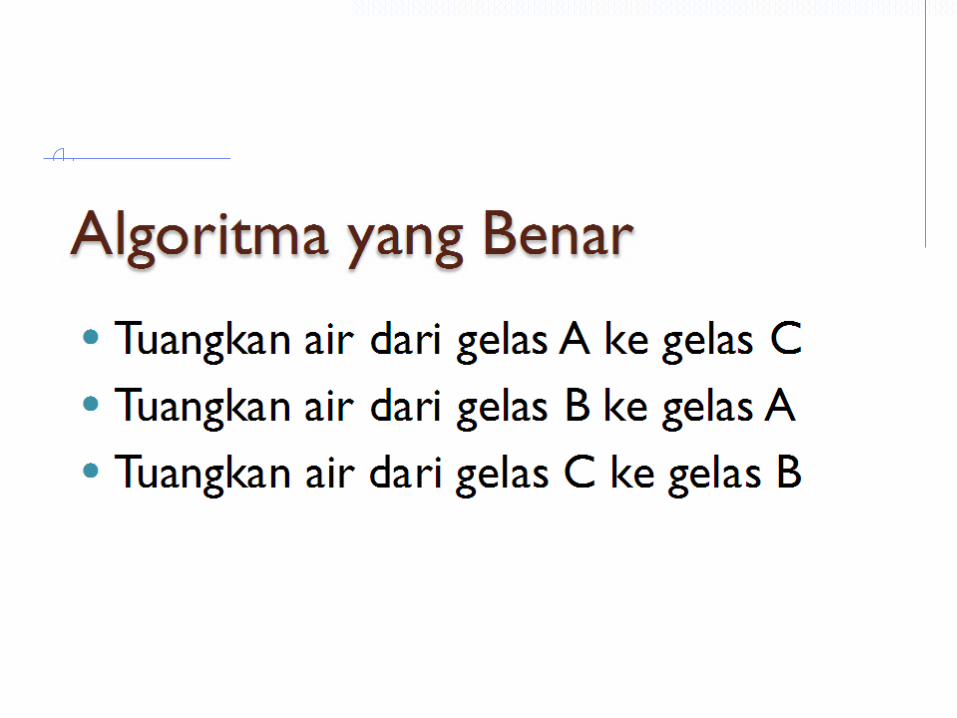
JAWABAN
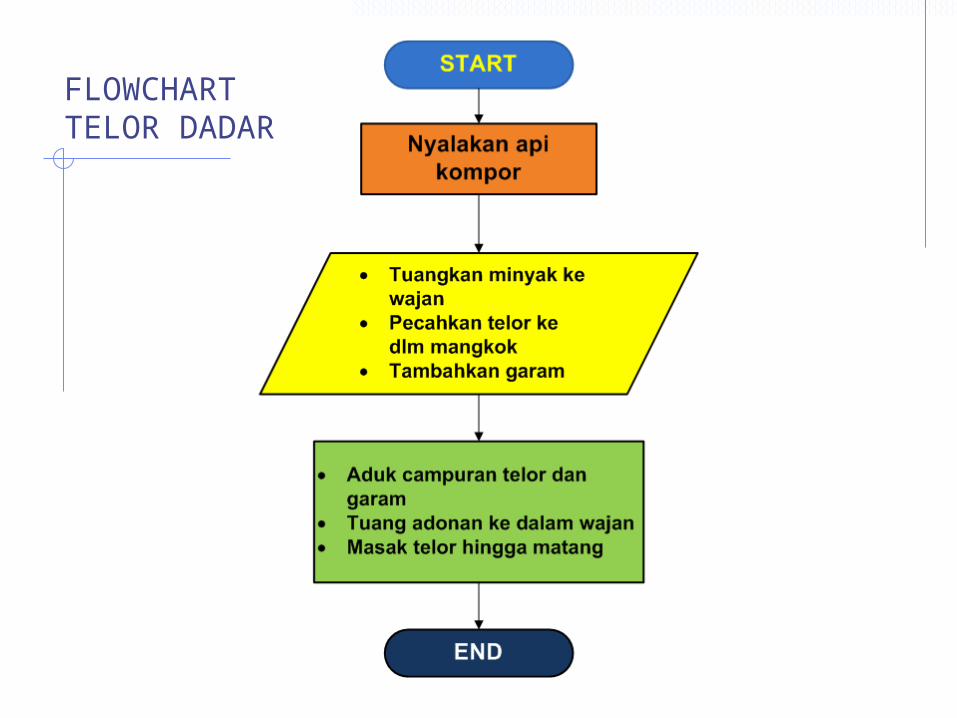
FLOWCHARTTELOR DADAR
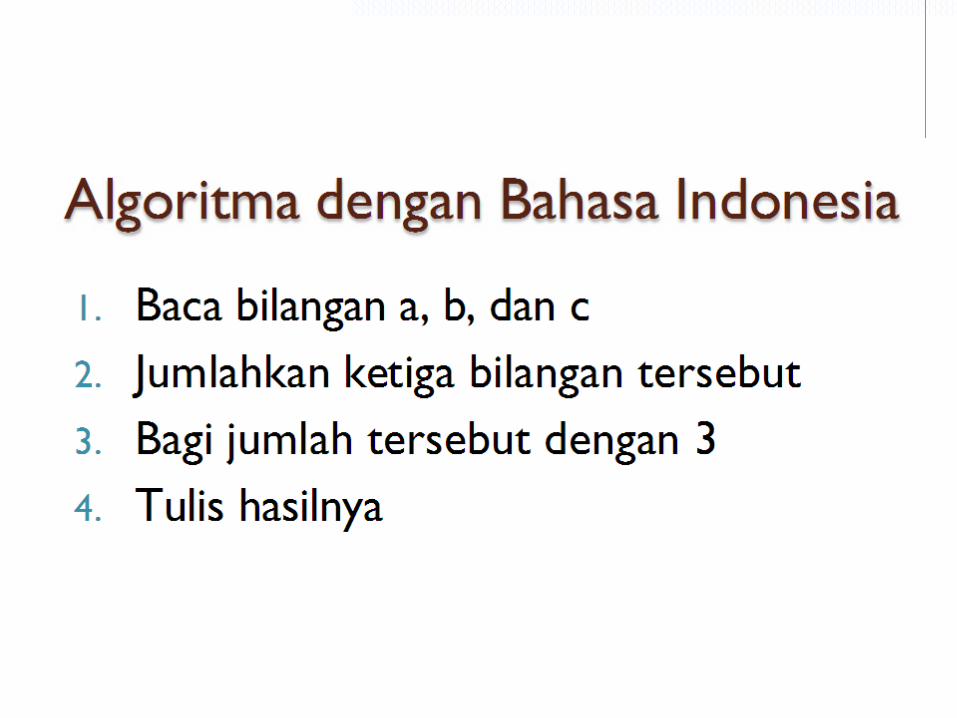
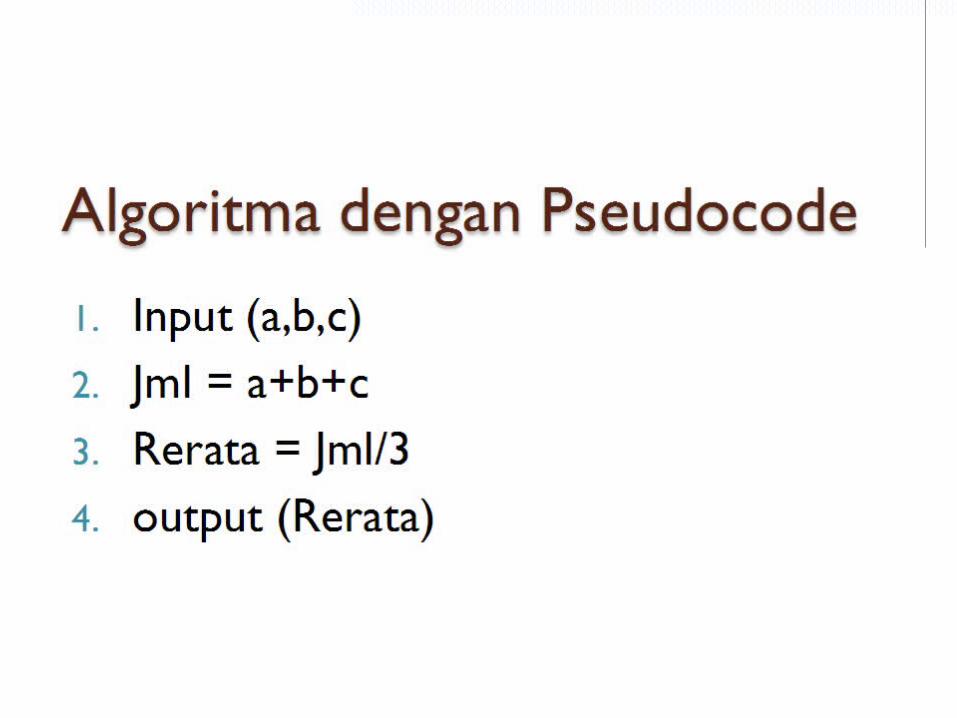
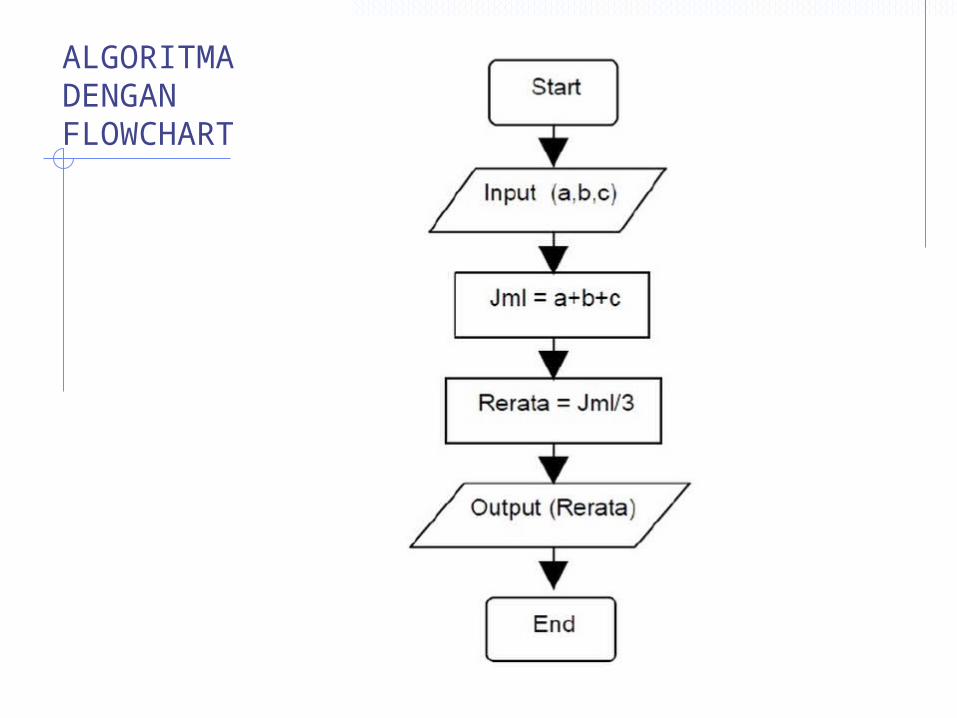
ALGORITMA DENGAN FLOWCHART
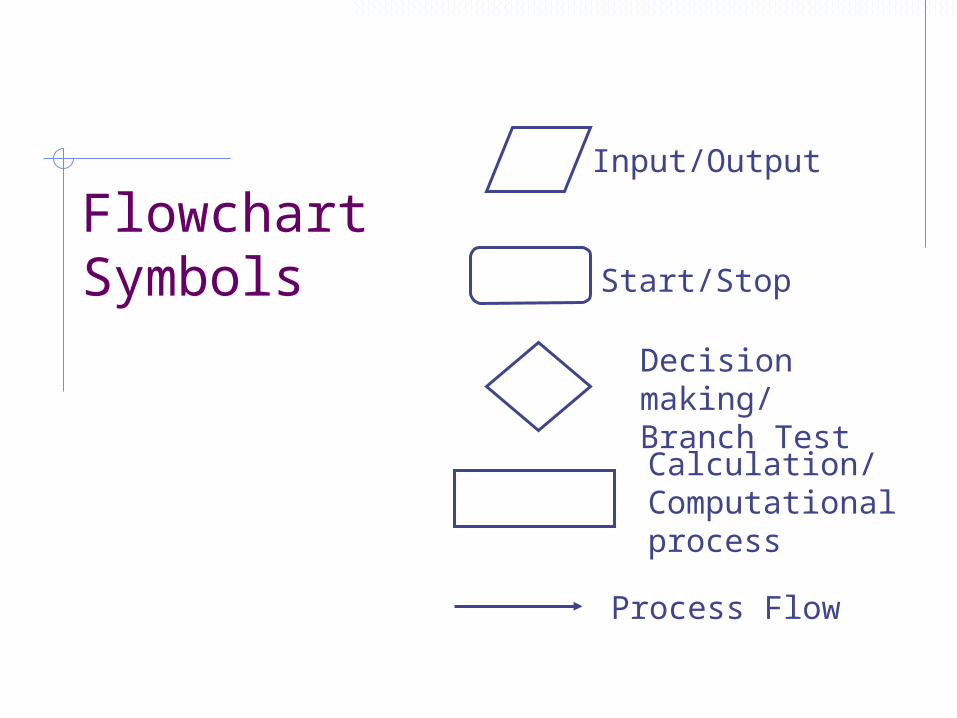
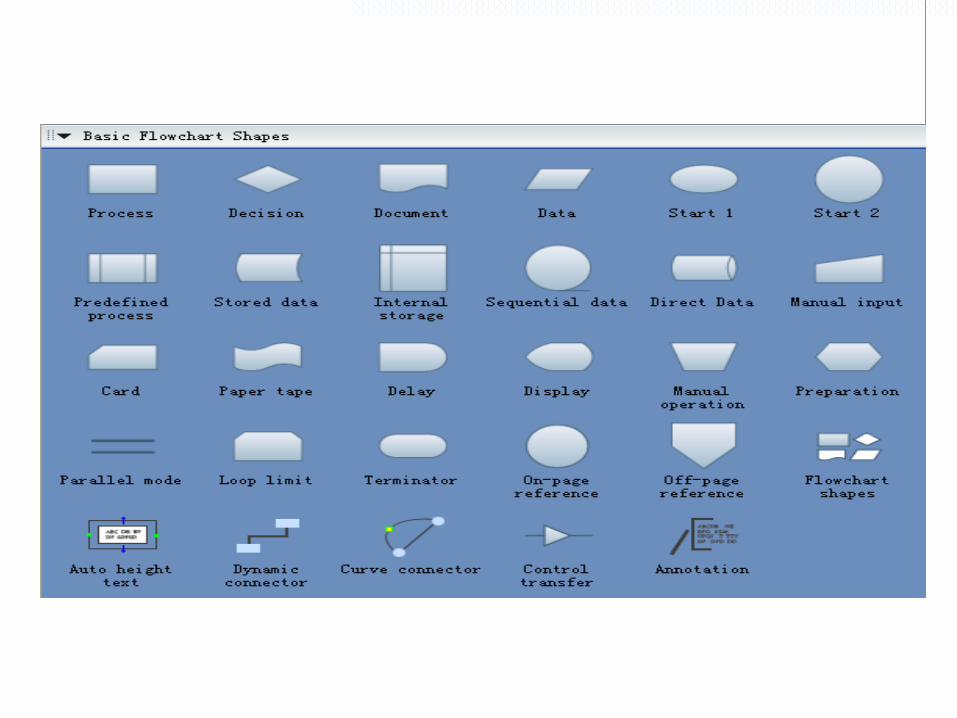
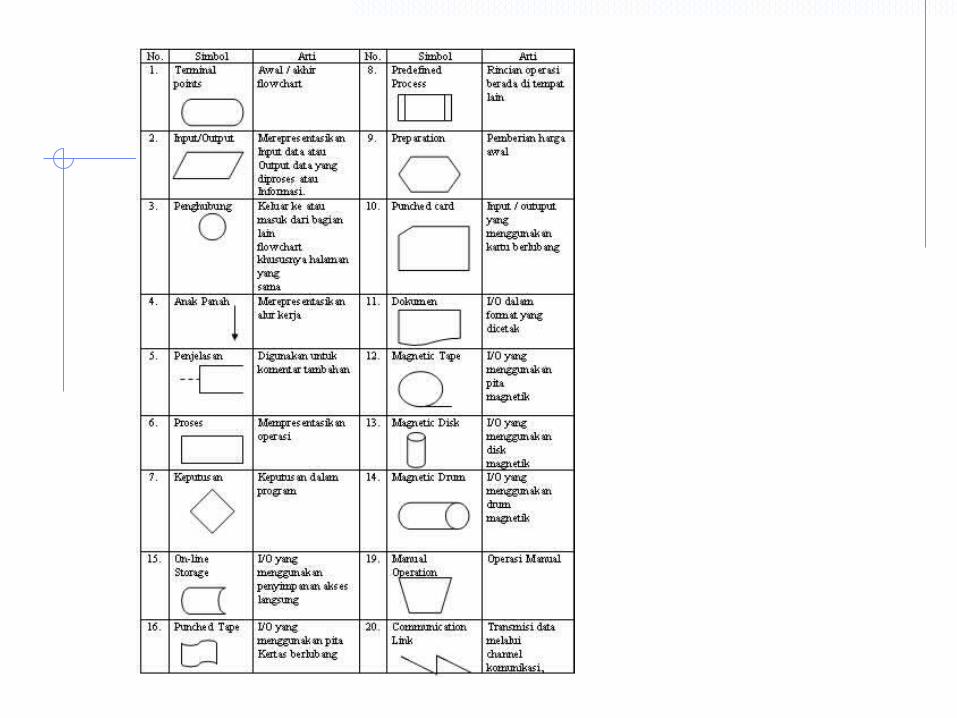
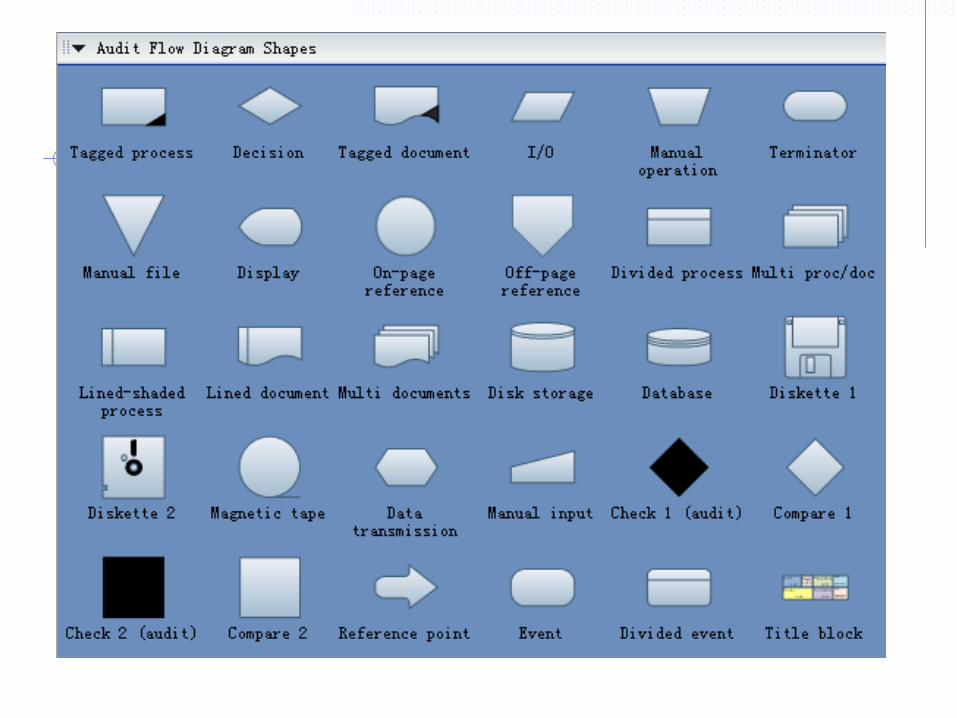
Flowchart Symbols
Input/Output
Start/Stop
Decision making/ Branch Test
Calculation/ Computational process
Process Flow

Connector or joining of two parts of program
Magnetic Tape
Magnetic Disk
Off-page connector
Flow line
Display
Annotation
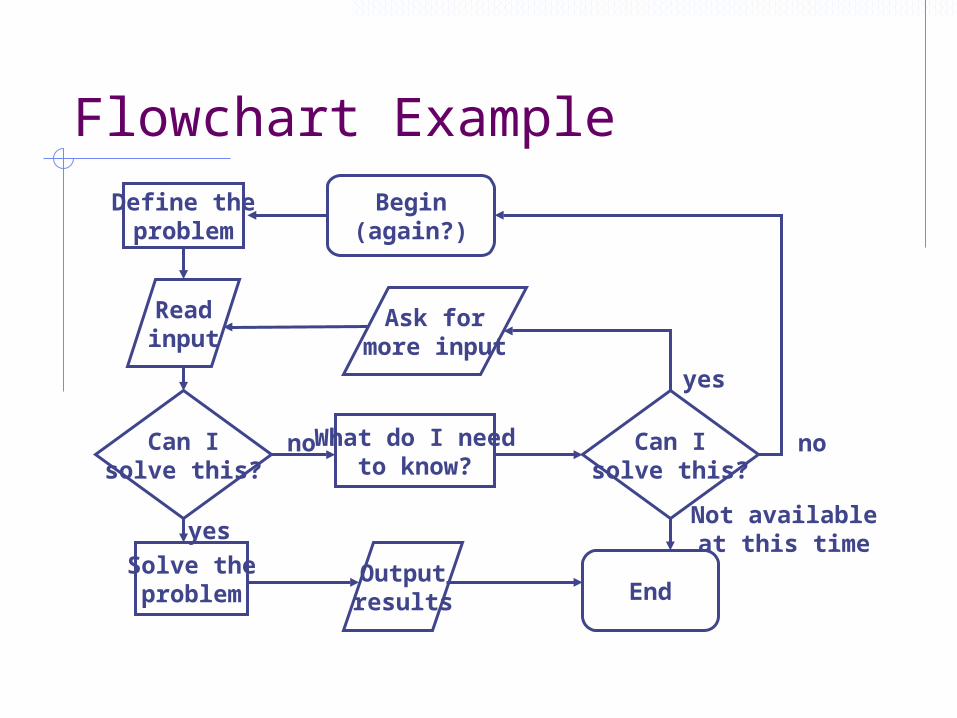
Flowchart ExampleDefine theproblem
Readinput
Solve theproblem
Can Isolve this?
Outputresults
What do I needto know?
Ask formore input
Can Isolve this?
yes
no
Not availableat this time
yes
no
Begin(again?)
End
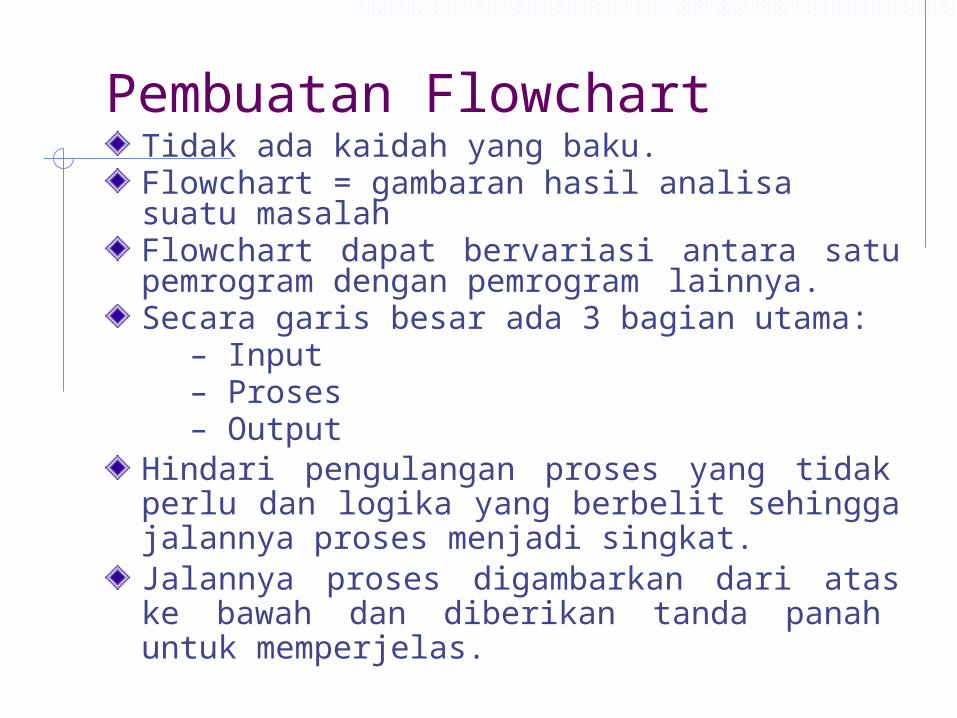
Pembuatan FlowchartTidak ada kaidah yang baku.Flowchart = gambaran hasil analisa suatu masalah Flowchart dapat bervariasi antara satu pemrogram dengan pemrogram lainnya.Secara garis besar ada 3 bagian utama:
– Input– Proses– Output
Hindari pengulangan proses yang tidak perlu dan logika yang berbelit sehingga jalannya proses menjadi singkat.Jalannya proses digambarkan dari atas ke bawah dan diberikan tanda panah untuk memperjelas.
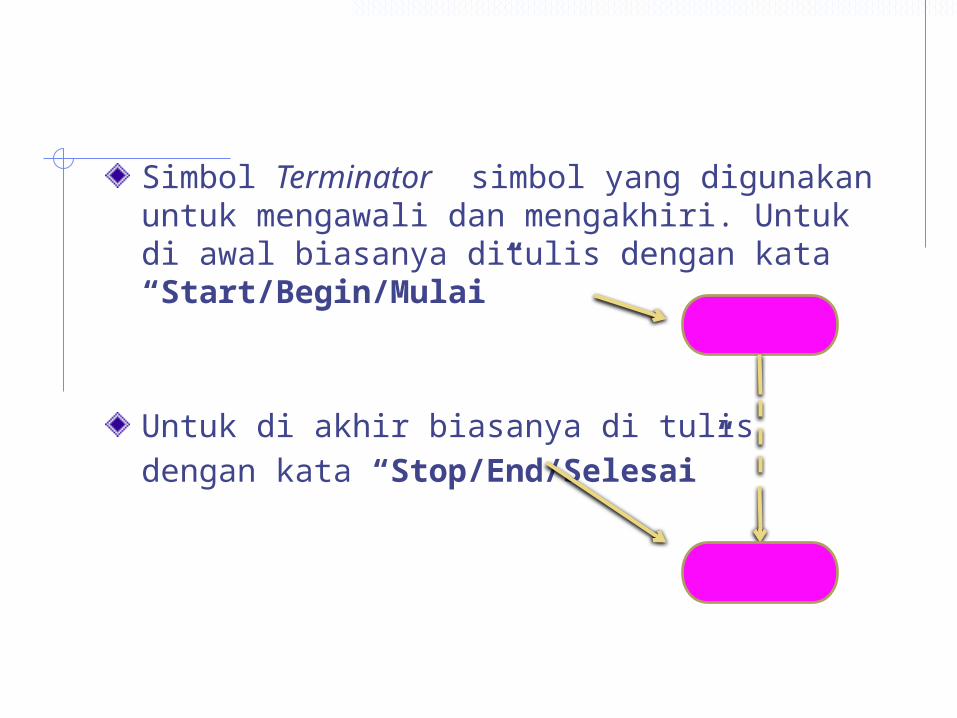
Simbol Terminator simbol yang digunakan untuk mengawali dan mengakhiri. Untuk di awal biasanya ditulis dengan kata “Start/Begin/Mulai”
Untuk di akhir biasanya di tulisdengan kata “Stop/End/Selesai”
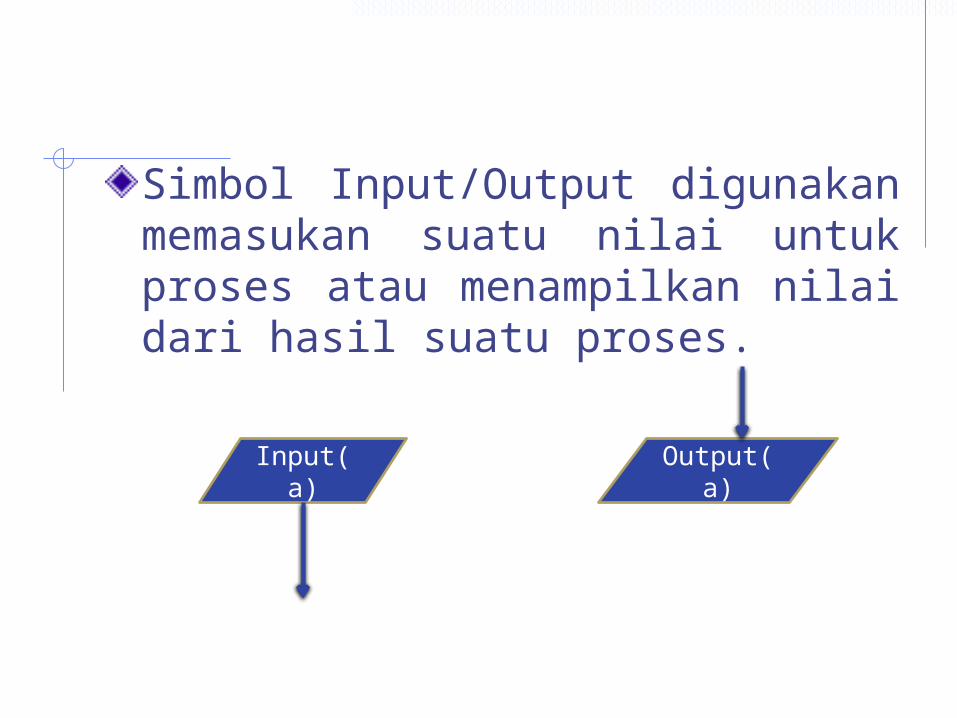
Simbol Input/Output digunakan memasukan suatu nilai untuk proses atau menampilkan nilai dari hasil suatu proses.
Input(a)
Output(a)
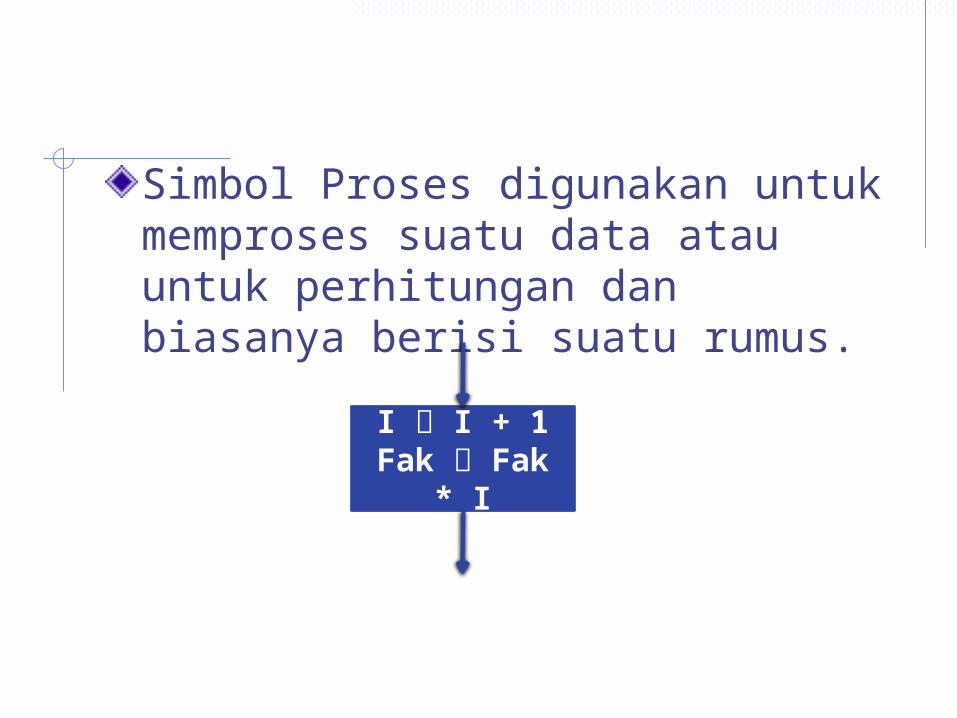
Simbol Proses digunakan untuk memproses suatu data atau untuk perhitungan dan biasanya berisi suatu rumus.
I I + 1Fak Fak *
I
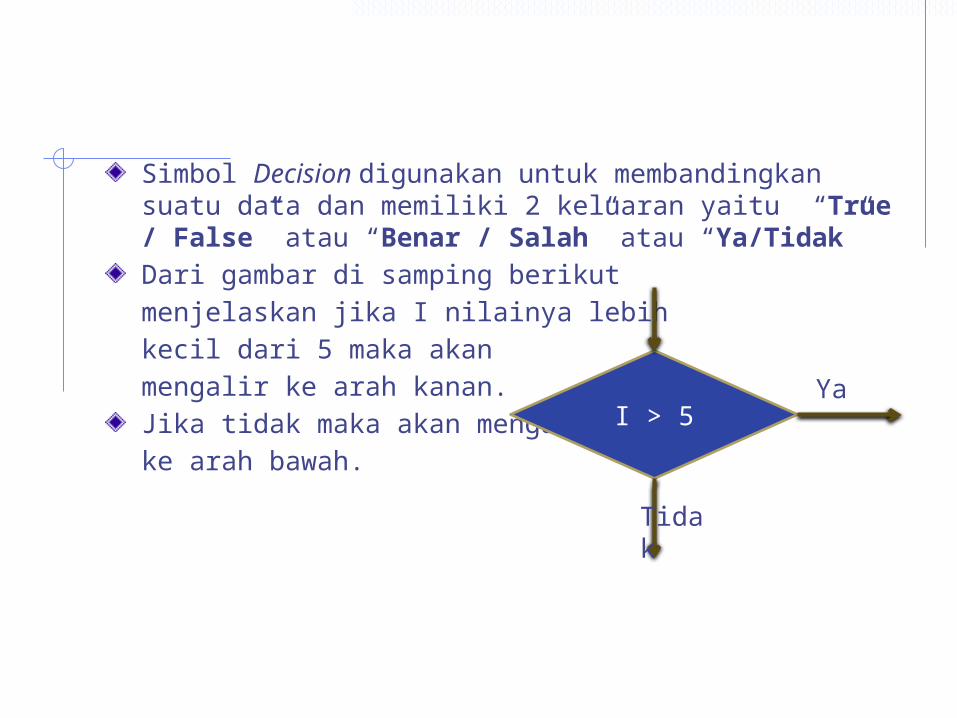
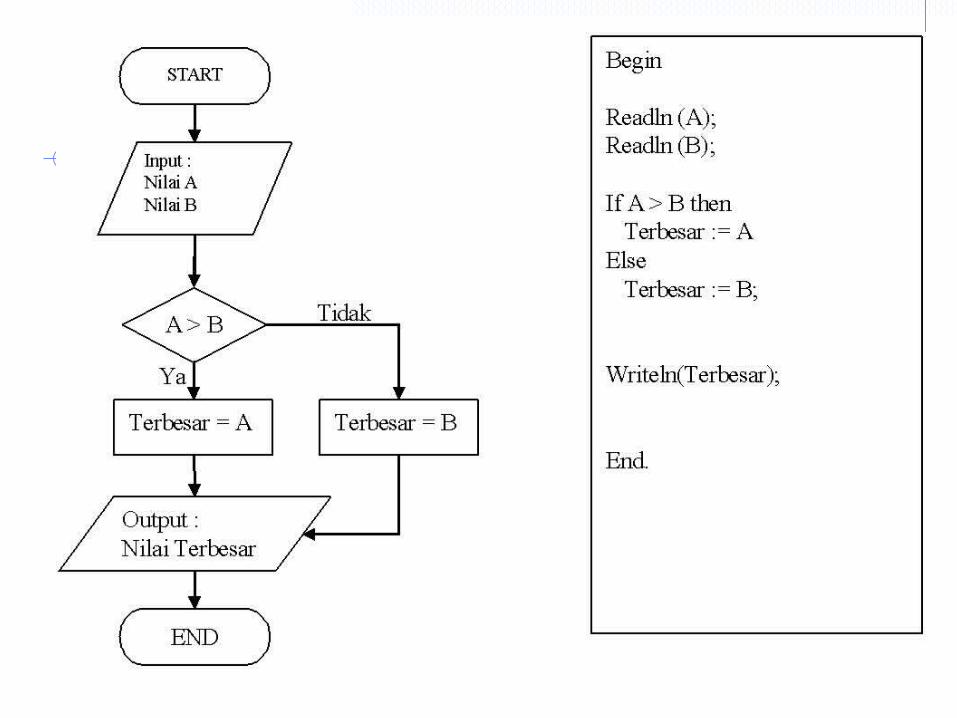
Simbol Decision digunakan untuk membandingkan suatu data dan memiliki 2 keluaran yaitu “True / False” atau “Benar / Salah” atau “Ya/Tidak”Dari gambar di samping berikutmenjelaskan jika I nilainya lebihkecil dari 5 maka akanmengalir ke arah kanan.Jika tidak maka akan mengalirke arah bawah.
I > 5Ya
Tidak
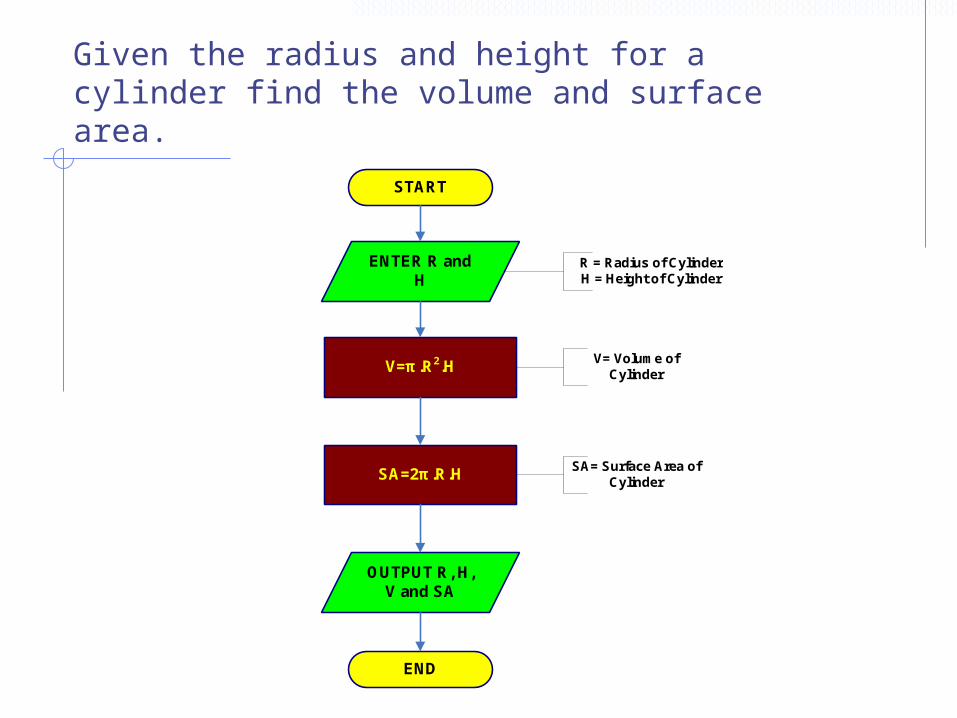
Given the radius and height for a cylinder find the volume and surface area.
START
ENTER R and H
R = Radius of CylinderH = Height of Cylinder
V=π.R2.H V= Volume of Cylinder
SA=2π.R.H SA= Surface Area of Cylinder
OUTPUT R, H, V and SA
END
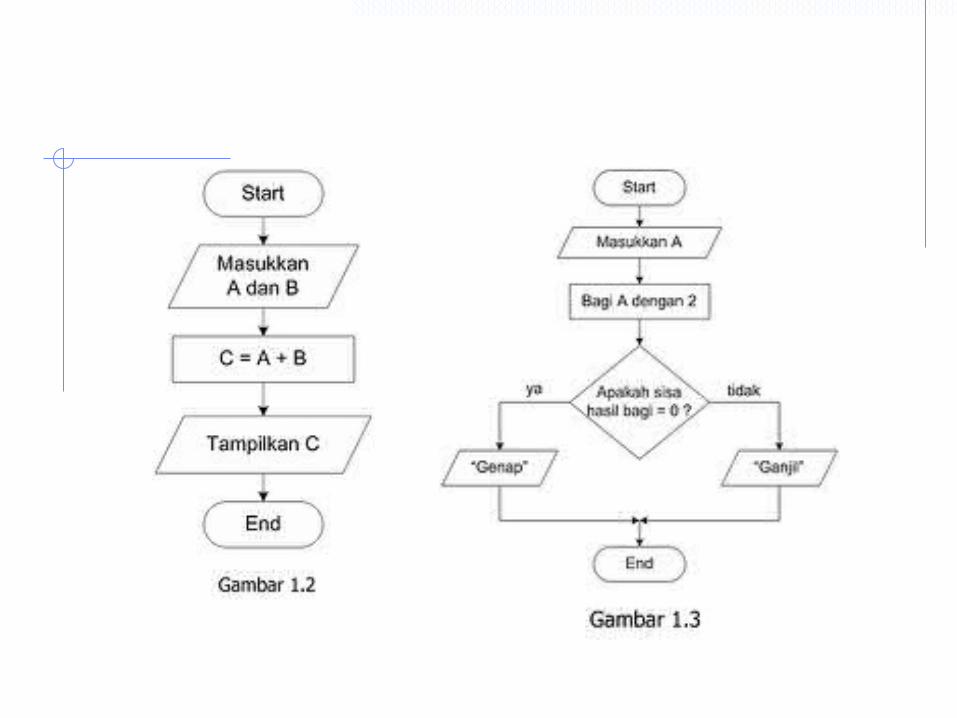
Example
Sketch a simple flowchart that will find the sum of two number and their difference.
Example
Sketch a flowchart that will computer the factorial of a number.
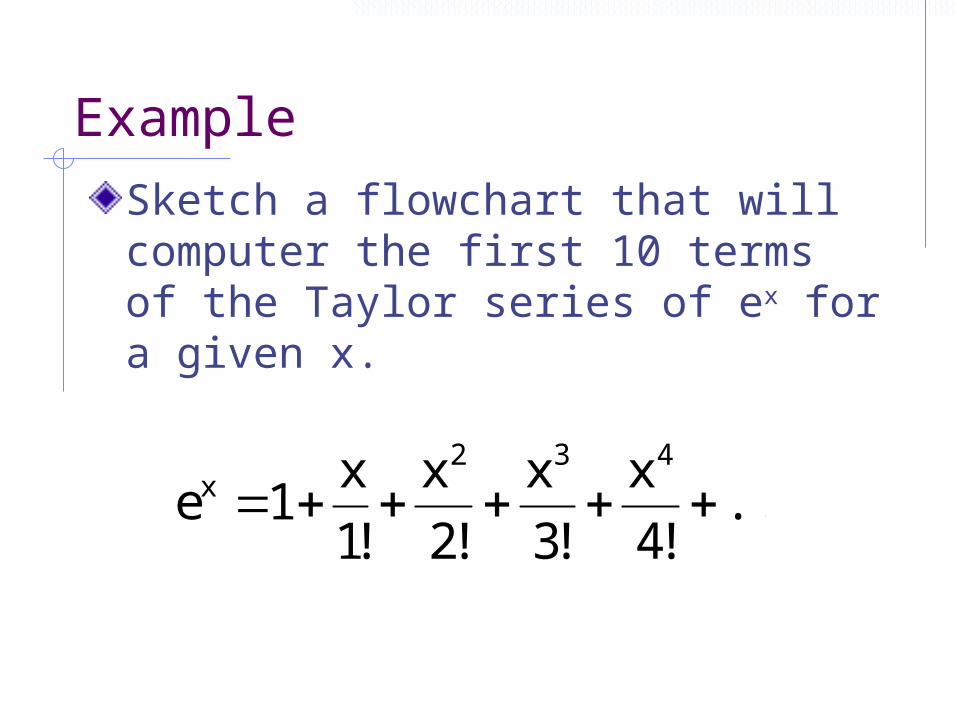
Example
Sketch a flowchart that will computer the first 10 terms of the Taylor series of ex for a given x.
...!4
x
!3
x
!2
x
!1
x1e
432x
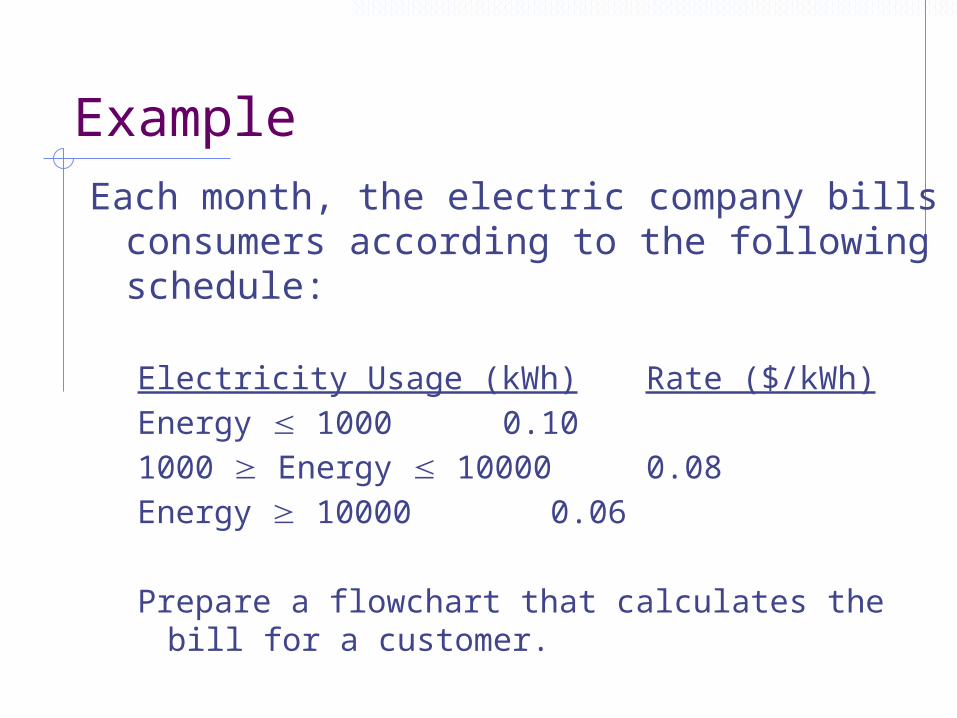
ExampleEach month, the electric company bills
consumers according to the following schedule:
Electricity Usage (kWh) Rate ($/kWh)Energy 1000 0.101000 Energy 10000 0.08Energy 10000 0.06
Prepare a flowchart that calculates the bill for a customer.
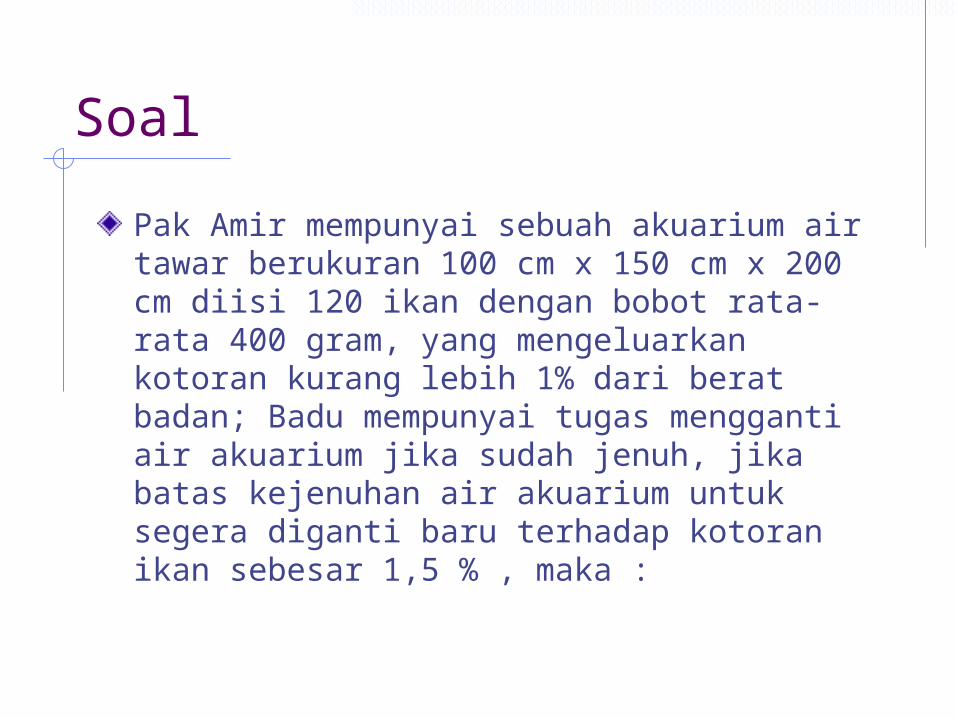
Soal
Pak Amir mempunyai sebuah akuarium air tawar berukuran 100 cm x 150 cm x 200 cm diisi 120 ikan dengan bobot rata-rata 400 gram, yang mengeluarkan kotoran kurang lebih 1% dari berat badan; Badu mempunyai tugas mengganti air akuarium jika sudah jenuh, jika batas kejenuhan air akuarium untuk segera diganti baru terhadap kotoran ikan sebesar 1,5 % , maka :
Pertanyaan :
Dimana rumah pak Amir ?Ada hubungan apa antara pak Amir dan Badu?Berapa hari sekali air akuarium harus diganti?Buat algoritma dan flowchart