DKI JAKARTA Province eng - humanitarianresponse.info · Jakarta) and one Administrative Regency...
2
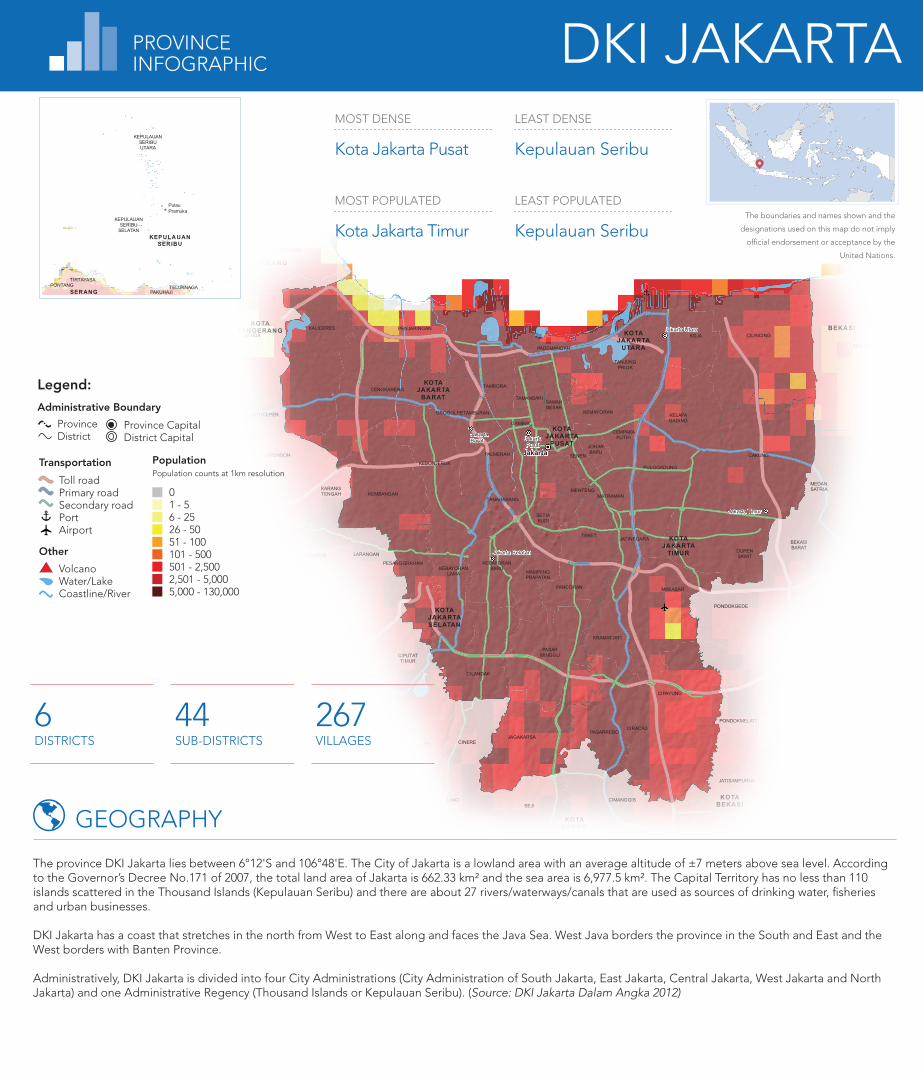
KOTA JAKARTA SELATAN KOTA JAKARTA TIMUR KOTA JAKARTA PUSAT KOTA JAKARTA BARAT KOTA JAKARTA UTARA BOGOR BEKASI KOTA BEKASI KOTA DEPOK TANGERANG KOTA TANGERANG KOTA TANGERANG SELATAN JAGAKARSA PASAR MINGGU CILANDAK PESANGGRAHAN KEBAYORAN LAMA KEBAYORAN BARU MAMPANG PRAPATAN PANCORAN TEBET SETIA BUDI PASARREBO CIRACAS CIPAYUNG MAKASAR KRAMATJATI JATINEGARA DUREN SAWIT CAKUNG PULOGADUNG MATRAMAN TANAHABANG MENTENG SENEN JOHAR BARU CEMPAKA PUTIH KEMAYORAN SAWAH BESAR GAMBIR KEMBANGAN KEBONJERUK PALMERAH GROGOLPETAMBURAN TAMBORA TAMANSARI CENGKARENG KALIDERES PENJARINGAN PADEMANGAN TANJUNG PRIOK KOJA KELAPA GADING CILINCING CILEUNGSI GUNUNG PUTRI GUNUNG SINDUR SETU BABELAN TARUMAJAYA MUARA GEMBONG PONDOKGEDE JATISAMPURNA PONDOKMELATI JATIASIH BANTARGEBANG MUSTIKAJAYA BEKASI TIMUR RAWALUMBU BEKASI SELATAN BEKASI BARAT MEDAN SATRIA BEKASI UTARA SAWANGAN BOJONGSARI PANCORAN MAS SUKMA JAYA CILODONG CIMANGGIS TAPOS BEJI LIMO CINERE PAGEDANGAN CISAUK TELUKNAGA KOSAMBI CILEDUG LARANGAN KARANG TENGAH CIPONDOH PINANG TANGERANG BATUCEPER BENDA SETU SERPONG PAMULANG CIPUTAT CIPUTAT TIMUR PONDOK AREN SERPONG UTARA Ciputat Jakarta Pusat Jakarta Barat Jakarta Selatan Jakarta Timur Jakarta Utara Bekasi Depok Jakarta KEPULAUAN SERIBU SERANG TA KEPULAUAN SERIBU SELATAN KEPULAUAN SERIBU UTARA PAKUHAJI TELUKNAGA PONTANG TIRTAYASA Pulau Pramuka 0 1 - 5 6 - 25 26 - 50 51 - 100 101 - 500 501 - 2,500 2,501 - 5,000 5,000 - 130,000 Population Population counts at 1km resolution Transportation Toll road Primary road Secondary road Port Airport Province Capital District Capital Other Volcano Water/Lake Coastline/River Administrative Boundary Legend: Province District LEAST POPULATED Kepulauan Seribu MOST DENSE Kota Jakarta Pusat MOST POPULATED Kota Jakarta Timur LEAST DENSE Kepulauan Seribu 6 DISTRICTS 44 SUB-DISTRICTS 267 VILLAGES The province DKI Jakarta lies between 6°12'S and 106°48'E. The City of Jakarta is a lowland area with an average altitude of ±7 meters above sea level. According to the Governor’s Decree No.171 of 2007, the total land area of Jakarta is 662.33 km² and the sea area is 6,977.5 km². The Capital Territory has no less than 110 islands scattered in the Thousand Islands (Kepulauan Seribu) and there are about 27 rivers/waterways/canals that are used as sources of drinking water, fisheries and urban businesses. DKI Jakarta has a coast that stretches in the north from West to East along and faces the Java Sea. West Java borders the province in the South and East and the West borders with Banten Province. Administratively, DKI Jakarta is divided into four City Administrations (City Administration of South Jakarta, East Jakarta, Central Jakarta, West Jakarta and North Jakarta) and one Administrative Regency (Thousand Islands or Kepulauan Seribu). (Source: DKI Jakarta Dalam Angka 2012) GEOGRAPHY The boundaries and names shown and the designations used on this map do not imply official endorsement or acceptance by the United Nations. PROVINCE INFOGRAPHIC DKI JAKARTA
-
Upload
dangnguyet -
Category
Documents
-
view
220 -
download
0
Transcript of DKI JAKARTA Province eng - humanitarianresponse.info · Jakarta) and one Administrative Regency...
KOTAJAKARTASELATAN
KOTAJAKARTA
TIMUR
KOTAJAKARTA
PUSAT
KOTAJAKARTA
BARAT
KOTAJAKARTA
UTARA
BOGOR
BEKA SI
KOTABEKA SI
KOTADEP OK
TANGERANG
KOTATANGERANG
KOTATANGERANG
SELATAN
JAGAKARSA
PASARMINGGU
CILANDAK
PESANGGRAHANKEBAYORAN
LAMA
KEBAYORANBARU
MAMPANGPRAPATAN
PANCORAN
TEBET
SETIABUDI
PASARREBOCIRACAS
CIPAYUNG
MAKASAR
KRAMATJATI
JATINEGARA
DURENSAWIT
CAKUNG
PULOGADUNG
MATRAMANTANAHABANG
MENTENG
SENEN
JOHARBARU
CEMPAKAPUTIH
KEMAYORAN
SAWAHBESAR
GAMBIR
KEMBANGAN
KEBONJERUK
PALMERAH
GROGOLPETAMBURAN
TAMBORA
TAMANSARI
CENGKARENG
KALIDERES PENJARINGAN
PADEMANGAN
TANJUNGPRIOK
KOJA
KELAPAGADING
CILINCING
CILEUNGSI
GUNUNGPUTRI
GUNUNGSINDUR
SETU
BABELAN
TARUMAJAYA
MUARAGEMBONG
PONDOKGEDE
JATISAMPURNA
PONDOKMELATI
JATIASIH
BANTARGEBANG
MUSTIKAJAYA
BEKASITIMUR
RAWALUMBU
BEKASISELATAN
BEKASIBARAT
MEDANSATRIA
BEKASIUTARA
SAWANGAN
BOJONGSARI
PANCORANMAS
SUKMAJAYA CILODONG
CIMANGGIS
TAPOS
BEJILIMO
CINERE
PAGEDANGAN
CISAUK
TELUKNAGA
KOSAMBI
CILEDUG LARANGAN
KARANGTENGAH
CIPONDOH
PINANG
TANGERANG
BATUCEPER
BENDA
SETU
SERPONG
PAMULANG
CIPUTAT
CIPUTATTIMUR
PONDOKAREN
SERPONGUTARA
Ciputat
JakartaPusat
JakartaBarat
Jakarta Selatan
Jakarta Timur
Jakarta Utara
Bekasi
Depok
Jakarta
LAMP UNGTIMU R
KEP ULA UANSERIBU
KARAWANG
BEKA SI
TANGERANG
SERANGKOTA
SERANG
PULAU
KEPULAUANSERIBU
SELATAN
KEPULAUANSERIBUUTARA
PAKISJAYA
BABELANTARUMAJAYA SUKAWANGI
MUARAGEMBONG
GUNUNGKALER
MEKARBARU
KEMIRISUKADIRI
RAJEG
PAKUHAJITELUKNAGA
KOSAMBI
KRAGILANCIRUAS
PONTANG
CARENANG
TIRTAYASA
SERANG
PulauPramuka
01 - 56 - 2526 - 5051 - 100101 - 500501 - 2,5002,501 - 5,0005,000 - 130,000
PopulationPopulation counts at 1km resolution
Transportation
Toll roadPrimary roadSecondary roadPortAirport
Province CapitalDistrict Capital
Other
VolcanoWater/LakeCoastline/River
Administrative Boundary
Legend:
ProvinceDistrict
LEAST POPULATED
Kepulauan Seribu
MOST DENSE
Kota Jakarta Pusat
MOST POPULATED
Kota Jakarta Timur
LEAST DENSE
Kepulauan Seribu
6DISTRICTS
44SUB-DISTRICTS
267VILLAGES
The province DKI Jakarta lies between 6°12'S and 106°48'E. The City of Jakarta is a lowland area with an average altitude of ±7 meters above sea level. According to the Governor’s Decree No.171 of 2007, the total land area of Jakarta is 662.33 km² and the sea area is 6,977.5 km². The Capital Territory has no less than 110 islands scattered in the Thousand Islands (Kepulauan Seribu) and there are about 27 rivers/waterways/canals that are used as sources of drinking water, fisheries and urban businesses.
DKI Jakarta has a coast that stretches in the north from West to East along and faces the Java Sea. West Java borders the province in the South and East and the West borders with Banten Province.
Administratively, DKI Jakarta is divided into four City Administrations (City Administration of South Jakarta, East Jakarta, Central Jakarta, West Jakarta and North Jakarta) and one Administrative Regency (Thousand Islands or Kepulauan Seribu). (Source: DKI Jakarta Dalam Angka 2012)
GEOGRAPHY
The boundaries and names shown and the
designations used on this map do not imply
official endorsement or acceptance by the
United Nations.
PROVINCEINFOGRAPHIC DKI JAKARTA
POPULATION
24
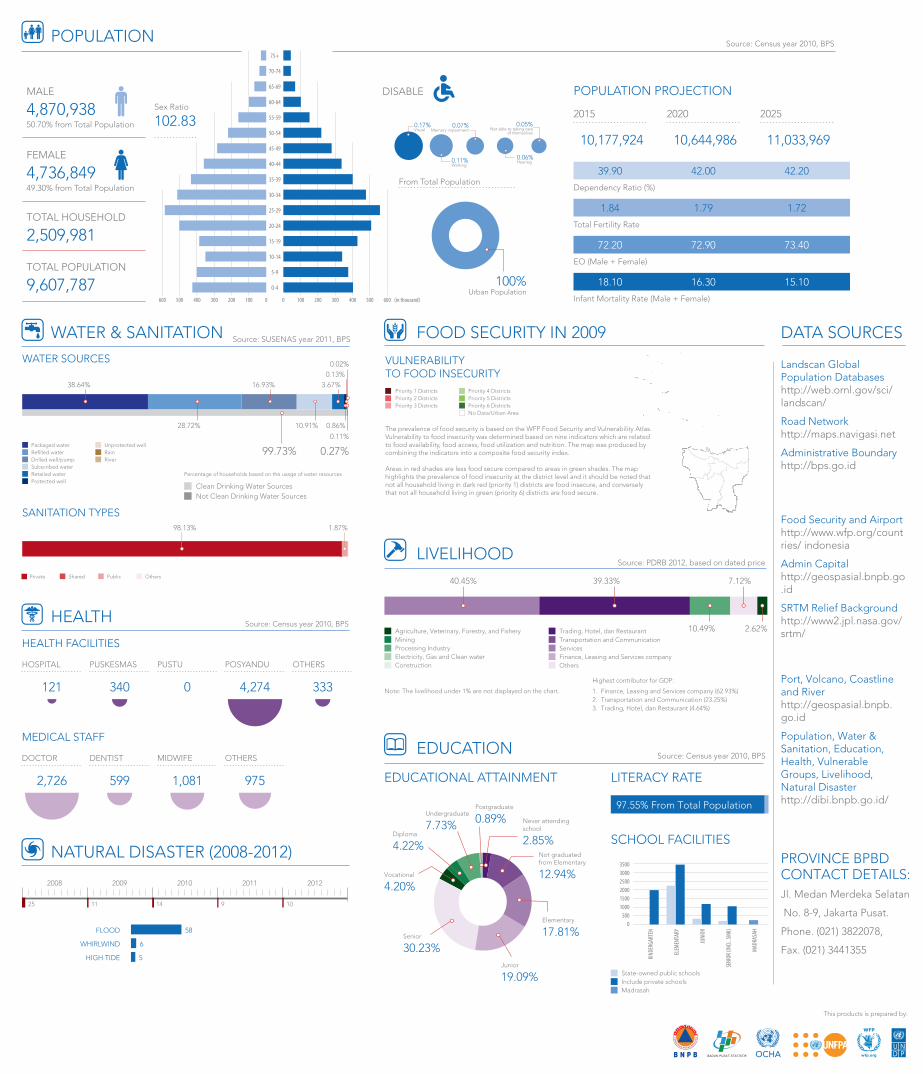
TOTAL HOUSEHOLD
2,509,981
TOTAL POPULATION
9,607,787
MALE
4,870,93850.70% from Total Population
Sex Ratio
102.83
FEMALE
4,736,84949.30% from Total Population
0-4
5-9
10-14
15-19
20-24
25-29
30-34
35-39
40-44
45-49
50-54
55-59
60-64
65-69
70-74
75+
0 100 200 300 400 500 600 (in thousand)0100200300400500600
DISABLE
0.17%Visual
0.11%Walking
0.07%Memory impairment
0.06%Hearing
0.05%Not able to taking care
of themselves
2015
10,177,924
2020
10,644,986
2025
11,033,969
POPULATION PROJECTION
Total Fertility Rate
Infant Mortality Rate (Male + Female)
Dependency Ratio (%)
EO (Male + Female)
39.90
1.84
72.20
18.10
42.20
1.72
73.40
15.10
42.00
1.79
72.90
16.30100%Urban Population
From Total Population
WATER & SANITATION
Private Public OthersShared
HEALTH
HEALTH FACILITIES
MEDICAL STAFF
2,726 599 9751,081
DENTIST MIDWIFEDOCTOR OTHERS
PUSKESMAS PUSTUHOSPITAL POSYANDU OTHERS
340 0121 4,274 333
SANITATION TYPES
99.73% 0.27%
38.64% 16.93%
0.86%
3.67%0.13%
0.02%
28.72% 10.91%
0.11%
WATER SOURCES
Drilled well/pump
Packaged water Unprotected well
RiverRain
Subscribed water
Refilled water
Retailed waterProtected well
Clean Drinking Water Sources Not Clean Drinking Water Sources
Percentage of households based on the usage of water resources
98.13% 1.87%
NATURAL DISASTER (2008-2012)
2008 2009 2010 2011 2012
6WHIRLWIND
5
58FLOOD
109141125
HIGH TIDE
Priority 1 DistrictsPriority 2 DistrictsPriority 3 Districts
Priority 4 DistrictsPriority 5 DistrictsPriority 6 DistrictsNo Data/Urban Area
The prevalence of food security is based on the WFP Food Security and Vulnerability Atlas. Vulnerability to food insecurity was determined based on nine indicators which are related to food availability, food access, food utilization and nutrition. The map was produced by combining the indicators into a composite food security index. Areas in red shades are less food secure compared to areas in green shades. The map highlights the prevalence of food insecurity at the district level and it should be noted that not all household living in dark red (priority 1) districts are food insecure, and conversely that not all household living in green (priority 6) districts are food secure.
VULNERABILITYTO FOOD INSECURITY
Highest contributor for GDP:
1. Finance, Leasing and Services company (62.93%)2. Transportation and Communication (23.25%)3. Trading, Hotel, dan Restaurant (4.64%)
ServicesFinance, Leasing and Services companyOthers
Transportation and CommunicationTrading, Hotel, dan Restaurant
Processing IndustryElectricity, Gas and Clean waterConstruction
MiningAgriculture, Veterinary, Forestry, and Fishery
7.12%39.33%40.45%
Note: The livelihood under 1% are not displayed on the chart.
2.62%10.49%
FOOD SECURITY IN 2009
LIVELIHOOD
EDUCATION
EDUCATIONAL ATTAINMENT LITERACY RATE
State-owned public schoolsInclude private schoolsMadrasah
Senior
30.23%
Vocational
4.20%
Not graduatedfrom Elementary
12.94%
Elementary
17.81%
Junior
19.09%
Diploma
4.22%
Undergraduate
7.73%
Postgraduate
0.89% Never attendingschool
2.85%
KIND
ERGA
RTEN
ELEM
ENTA
RY
JUNI
OR
SENI
OR (I
NCL.
SMK)
MAD
RASA
H
SCHOOL FACILITIES
0500
100015002000250030003500
97.55% From Total Population
Source: SUSENAS year 2011, BPS
Source: Census year 2010, BPS
Source: Census year 2010, BPS
Source: PDRB 2012, based on dated price
Source: Census year 2010, BPS
DATA SOURCES
PROVINCE BPBD CONTACT DETAILS: Jl. Medan Merdeka Selatan
No. 8-9, Jakarta Pusat.
Phone. (021) 3822078,
Fax. (021) 3441355
Landscan Global Population Databaseshttp://web.ornl.gov/sci/ landscan/
Road Networkhttp://maps.navigasi.net
Administrative Boundaryhttp://bps.go.id
Food Security and Airporthttp://www.wfp.org/countries/ indonesia
Admin Capitalhttp://geospasial.bnpb.go.id
SRTM Relief Backgroundhttp://www2.jpl.nasa.gov/srtm/
Port, Volcano, Coastline and Riverhttp://geospasial.bnpb.go.id
Population, Water & Sanitation, Education, Health, Vulnerable Groups, Livelihood, Natural Disasterhttp://dibi.bnpb.go.id/
This products is prepared by: