
BAB V PENUTUP 5.1. Kesimpulan -...
30
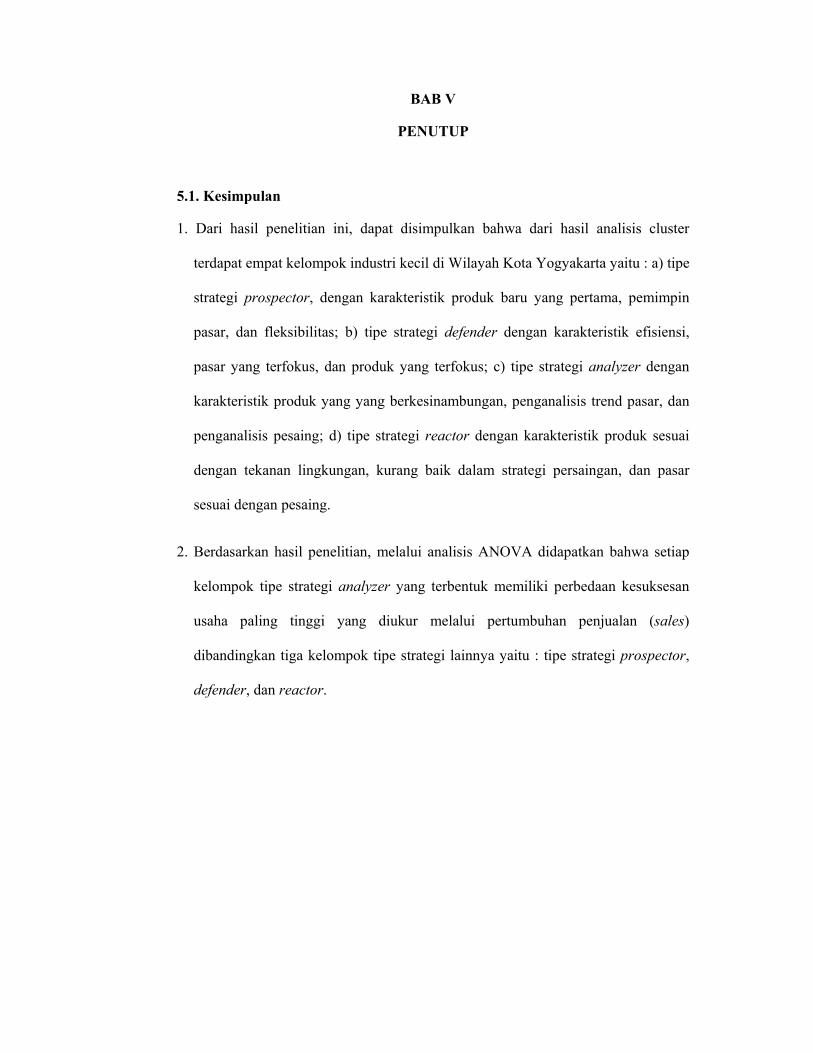
BAB V PENUTUP 5.1. Kesimpulan 1. Dari hasil penelitian ini, dapat disimpulkan bahwa dari hasil analisis cluster terdapat empat kelompok industri kecil di Wilayah Kota Yogyakarta yaitu : a) tipe strategi prospector, dengan karakteristik produk baru yang pertama, pemimpin pasar, dan fleksibilitas; b) tipe strategi defender dengan karakteristik efisiensi, pasar yang terfokus, dan produk yang terfokus; c) tipe strategi analyzer dengan karakteristik produk yang yang berkesinambungan, penganalisis trend pasar, dan penganalisis pesaing; d) tipe strategi reactor dengan karakteristik produk sesuai dengan tekanan lingkungan, kurang baik dalam strategi persaingan, dan pasar sesuai dengan pesaing. 2. Berdasarkan hasil penelitian, melalui analisis ANOVA didapatkan bahwa setiap kelompok tipe strategi analyzer yang terbentuk memiliki perbedaan kesuksesan usaha paling tinggi yang diukur melalui pertumbuhan penjualan (sales) dibandingkan tiga kelompok tipe strategi lainnya yaitu : tipe strategi prospector, defender, dan reactor.
Transcript of BAB V PENUTUP 5.1. Kesimpulan -...
BAB V
PENUTUP
5.1. Kesimpulan
1. Dari hasil penelitian ini, dapat disimpulkan bahwa dari hasil analisis cluster
terdapat empat kelompok industri kecil di Wilayah Kota Yogyakarta yaitu : a) tipe
strategi prospector, dengan karakteristik produk baru yang pertama, pemimpin
pasar, dan fleksibilitas; b) tipe strategi defender dengan karakteristik efisiensi,
pasar yang terfokus, dan produk yang terfokus; c) tipe strategi analyzer dengan
karakteristik produk yang yang berkesinambungan, penganalisis trend pasar, dan
penganalisis pesaing; d) tipe strategi reactor dengan karakteristik produk sesuai
dengan tekanan lingkungan, kurang baik dalam strategi persaingan, dan pasar
sesuai dengan pesaing.
2. Berdasarkan hasil penelitian, melalui analisis ANOVA didapatkan bahwa setiap
kelompok tipe strategi analyzer yang terbentuk memiliki perbedaan kesuksesan
usaha paling tinggi yang diukur melalui pertumbuhan penjualan (sales)
dibandingkan tiga kelompok tipe strategi lainnya yaitu : tipe strategi prospector,
defender, dan reactor.

97
5.2. Keterbatasan Penelitian
Beberapa keterbatasan yang dialami peneliti dalam penelitian ini,
selain keterbatasan waktu dan biaya adalah :
1. Situasi responden pada saat pengisian kuesioner yang tidak dapat diduga,
dimana pada saat pengisian kuesioner tersebut responden pada kondisi
senang atau tidak dalam menjawab kuesioner. Hal ini karena pada saat
penelitian ini dilakukan banyak responden yang sedang sibuk beraktivitas.
2. Keterbatasan peneliti dalam mengontrol setiap responden menunjukkan
keinginannya untuk mendapatkan penjelasan secara rinci menyangkut
beberapa item pertanyaan dalam kuesioner. Namun karena situasi dan
kondisi, peneliti tidak dapat secara maksimal memberikan penjelasan
sebagaimana yang diharapkan.
3. Responden tidak mengembalikan kuesioner atau kuesioner dianggap gugur
karena jawaban tidak lengkap sehingga peneliti harus mencari responden
pengganti untuk memperoleh sampel yang diharapkan.
4. Variasi yang dipakai dalam penelitian ini hanya tipe stategi dari sudut
pandang Tipologi Miles dan Snow dan pengukuran kesuksesan usaha dengan
indikator ketahanan usaha (survival), pertumbuhan tenaga kerja
(employement), dan pertumbuhan penjualan (sales).
5.3. Saran
98
Menanggapi pada keterbatasan yang dihadapi pada penelitian ini,
maka dapat disarankan bagi peneliti selanjutnya yang akan meneliti
permasalahan industry kecil kiranya memperhatikan hal-hal sebagai berikut :
1. Peneliti berikutnya sebaiknya lebih memahami psikologis pengusaha industri
kecil (responden), karenaberdasarkan pengalaman banyak dari mereka yang
memiliki aktivitas yang tinggi, sehingga dapat mempengaruhi akurasi mereka
dalam pengisian jawaban kuesioner.
2. Diharapkan peneliti berikutnya mampu untuk memilah-milah industri kecil
sehingga dapat diketahui mana industri kecil yang atas, menengah, atau
bawah.
3. Peneliti selanjutnya dapat menggunakan variabel tipologi strategi dan
indikator kaesuksesan usaha lainnya yang relevan atau memodifikasikannya
dengan variabel yang dipakai dalam penelitian ini sehingga memperkaya
hasil temuan tentang tipe strategi dan kesuksesan industri kecil.
DAFTAR PUSTAKA
Boedijoewono, Noegroho, 2001. Pengantar Statistik Ekonomi dan
Perusahaan. jilid 2. Unit Penerbit dan Percetakan AMP YKPN,
Yogyakarta. (edisi revisi)
Darmawan, I Putu Sugi, 2004. Analisis Tipe Strategi Industri Kecil dan
Menengah di Kewasan Sarbagita, Bali. www.damandiri.com
David, Fred R, 2006. Manajemen Strategis. (konsep) edisi 10, Penerbit
Salemba Empat, Jakarta, Indonesia (edisi Indonesia).
Dess, Gregory G. G.T.Lumpkin. and Alan B Eisner, 2006. Strategic
Management Text and Chases 2nd. McGraw-Hill, New York
Glueck, William F dan Lawrence R. Jauch, 1989. Manajemen Strategis dan
Kebijakan Perusahaan, edisi kedua. Penerbit Erlangga, Jakarta,
Indonesia (edisi Indonesia)
Haryanti, Sri. 2007. Sepuluh Formulasi Strategi untuk Mempertinggi
Kesempatan Sukses Usaha Kecil.
http://www.wirausaha.com/bisnis/manajemen/10_formulasi_strategi_un
tuk_mempertinggi_kesempatan_sukses_usaha.html pada tanggal 11
November 2008
http://organisasi.org/pengertian_definisi_dari_manajemen pada tanggal 30
Oktober 2008
http://id.wikipedia.org/wiki/Pengusaha pada tanggal 6 November 2008.
Kuncoro, M. (2003). Metode Riset untuk Bisnis dan Ekonomi. Yogyakarta :
FE UGM Yk
Muhandri, Tjahja, 2002. Strategi Penciptaan Wirausaha (Pegusaha) Kecil
Menengah yang Tangguh. http://tumoutou.net/702_05123/tjahja_m.htm
pada tanggal 6 November 2008
Padli, 2000. “Analisis Hubungan Penggunaan Strategi dan Kinerja
Organisasi pada Perguruan Tinggi Swasta (PTS) di Kota Makasar”
Pearce, John A dan Richard B. Robinson Jr. 2008. Manajemen Strategis,
Formulasi, Implementasi, dan Pengendalian. Buku 1 edisi 10, penerbit
Salemba Empat, Jakarta, Indonesia, (edisi Indonesia)
Porter, Michael. E,1992 Competitive Advantage : Creating and Sustaining
Superior Performance, (edisi Indonesia)
Santosa, Dr Purbayu Budi Ms dan Ashari SE AKT. 2005. Analisis Statistik
dengan Mecrosoft Excel dan SPSS. Penerbit Andi. Yogyakarta.
Indonesia.
Santosa, Purbayu Budi dan Muliawan Hamdani, 2007. Statistika Deskriptif
dalam Bidang Ekonomi dan Niaga. Penerbit Erlangga, Jakarta,
Indonesia
Sarwono, Jonathan, Strategi Pengumpulan Data Primer Secara Online.
http://www.geocities.com/jsarwono_bbrc/ai/data_primer.pdf. Pada
tanggal 1 Desember 2008
Soewandi, Rini M. Sumarno, 2002. Rencana Induk Pengembangan Industri
Kecil Menengah 2002-2004.
http://www.depperin.go.id/Ind/Publikasi/buku_brosur/RI-
PIKM_buku1.pdf pada tanggal 15 Oktober 2008
Sule, Ernie Tisnawati, 2008. Kewirausahaan.
http://www.fe.unpad.ac.id/elearning_fe/dosen/ernie/pengantar_bisnis/
KEWIRAUSAHAAN.ppt pada tanggal 15 Oktober 2008
Suliyanto, 2005. Analisis Data Dalam Aplikasi Pemasaran. Penerbit Ghalia
Indonesia Anggota IKAPI, Bogor, Indonesia.
Sutrisno, Joko, 2003. Pengembangan Pendidikan Berwawasan
Kewirausahaan Sejak Usia Dini.
http://tumoutou.net/702_07134/joko_sutrisno.pdf. Pada tanggal 6
November 2008
Triyuliana, Agnes Heni (editor), 2007. Pengolahan Data Statistik dengan
SPSS 15.0. Penerbit Andi dan Wahana Komputer. Semarang.
Indonesia
Uji Validitas dan Uji Reliabilitas. http://one.indoskripsi.com/judul-skripsi-
tugas-makalah/manajemen-keuangan/uji-validitas-dan-uji-
reliabilitas pada tanggal 15 Desember 2008
Wasito, Drs Hermawan (et all, 2006). Pengantar Metodologi Penelitian. Pusat
Penelitian Unika Atma Jaya. Jakarta 10001
Waskito, Jati, 2004 “Implementasi Strategi Generik Porter Pada Industri Kecil
Tekstil dan Pakaian Jadi Surakarta”, Empiris Vol 17 No 2, Hal 212

Output Validitas dan Reliabilitas X1.1 Correlations
Correlations
1 .884** .639** .647** .909**.000 .000 .000 .000
98 98 98 98 98.884** 1 .617** .629** .900**.000 .000 .000 .000
98 98 98 98 98.639** .617** 1 .788** .851**.000 .000 .000 .000
98 98 98 98 98.647** .629** .788** 1 .860**.000 .000 .000 .000
98 98 98 98 98.909** .900** .851** .860** 1.000 .000 .000 .000
98 98 98 98 98
Pearson CorrelationSig. (2-tailed)NPearson CorrelationSig. (2-tailed)NPearson CorrelationSig. (2-tailed)NPearson CorrelationSig. (2-tailed)NPearson CorrelationSig. (2-tailed)N
ITEM1
ITEM2
ITEM3
ITEM4
TOTAL
ITEM1 ITEM2 ITEM3 ITEM4 TOTAL
Correlation is significant at the 0.01 level (2-tailed).**.
Reliability
Warnings
The space saver method is used. That is, the covariance matrix is not calculated orused in the analysis.
Case Processing Summary
98 100.00 .0
98 100.0
ValidExcludeda
Total
CasesN %
Listwise deletion based on allvariables in the procedure.
a.
Reliability Statistics
.837 5
Cronbach'sAlpha N of Items

Item-Total Statistics
17.7041 46.499 .878 .78618.1327 46.116 .863 .78517.7551 49.259 .809 .80817.9082 48.497 .818 .80310.2143 15.448 1.000 .903
ITEM1ITEM2ITEM3ITEM4TOTAL
Scale Mean ifItem Deleted
ScaleVariance if
Item Deleted
CorrectedItem-TotalCorrelation
Cronbach'sAlpha if Item
Deleted
Scale Statistics
20.4286 61.794 7.86090 5Mean Variance Std. Deviation N of Items

Output Validitas dan Reliabilitas X1.2
Correlations
Correlations
1 .856** .822** .764** .915**.000 .000 .000 .000
98 98 98 98 98.856** 1 .928** .867** .965**.000 .000 .000 .000
98 98 98 98 98.822** .928** 1 .897** .966**.000 .000 .000 .000
98 98 98 98 98.764** .867** .897** 1 .932**.000 .000 .000 .000
98 98 98 98 98.915** .965** .966** .932** 1.000 .000 .000 .000
98 98 98 98 98
Pearson CorrelationSig. (2-tailed)NPearson CorrelationSig. (2-tailed)NPearson CorrelationSig. (2-tailed)NPearson CorrelationSig. (2-tailed)NPearson CorrelationSig. (2-tailed)N
ITEM1
ITEM2
ITEM3
ITEM4
TOTAL
ITEM1 ITEM2 ITEM3 ITEM4 TOTAL
Correlation is significant at the 0.01 level (2-tailed).**.
Reliability
Warnings
The space saver method is used. That is, the covariance matrix is not calculated orused in the analysis.
Case Processing Summary
98 100.00 .0
98 100.0
ValidExcludeda
Total
CasesN %
Listwise deletion based on allvariables in the procedure.
a.
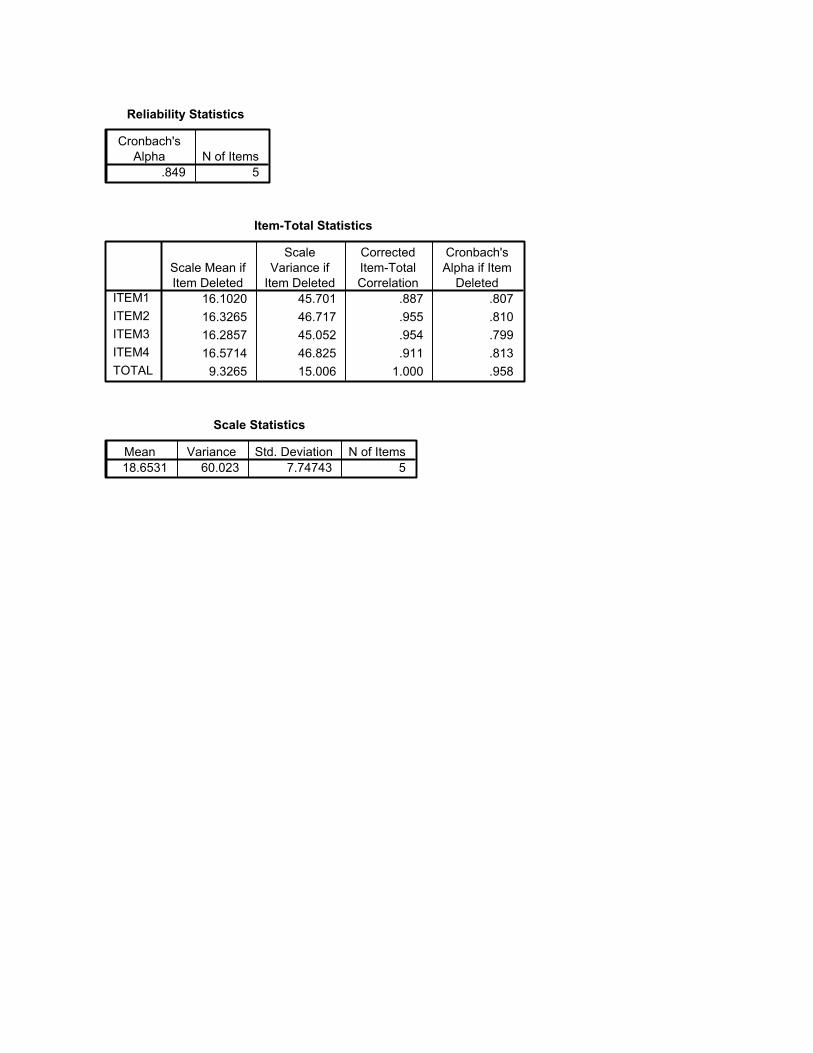
Reliability Statistics
.849 5
Cronbach'sAlpha N of Items
Item-Total Statistics
16.1020 45.701 .887 .80716.3265 46.717 .955 .81016.2857 45.052 .954 .79916.5714 46.825 .911 .813
9.3265 15.006 1.000 .958
ITEM1ITEM2ITEM3ITEM4TOTAL
Scale Mean ifItem Deleted
ScaleVariance if
Item Deleted
CorrectedItem-TotalCorrelation
Cronbach'sAlpha if Item
Deleted
Scale Statistics
18.6531 60.023 7.74743 5Mean Variance Std. Deviation N of Items
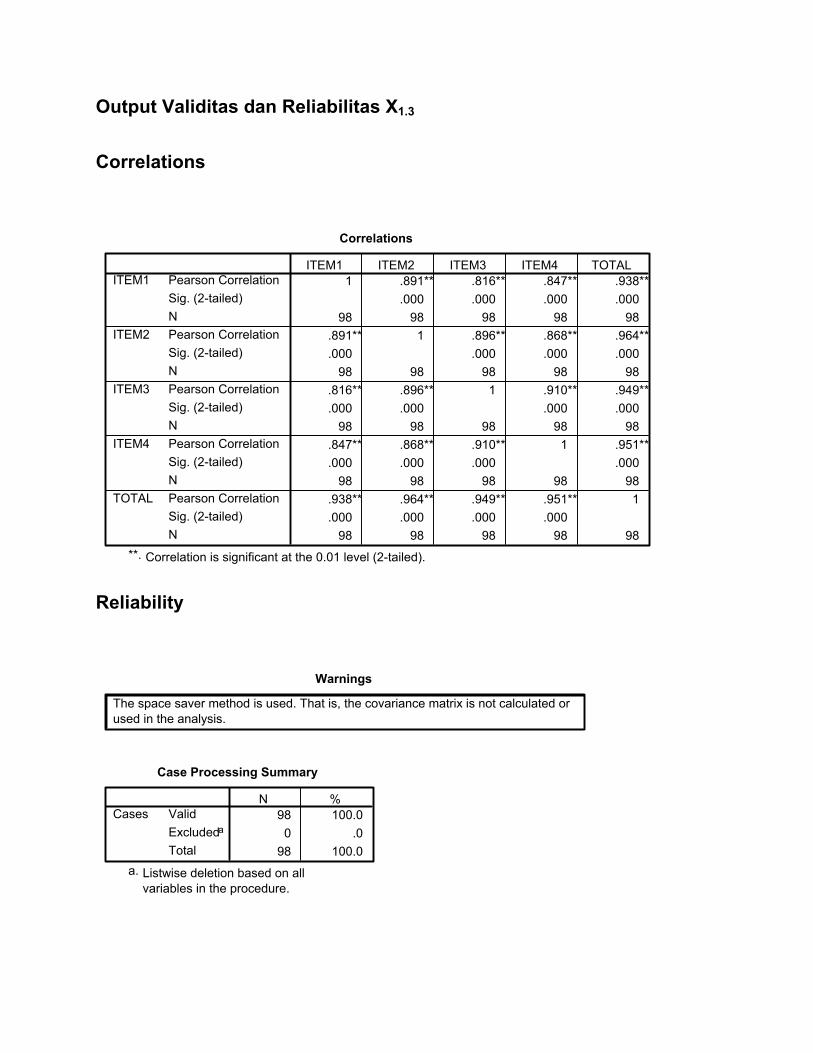
Output Validitas dan Reliabilitas X1.3
Correlations
Correlations
1 .891** .816** .847** .938**.000 .000 .000 .000
98 98 98 98 98.891** 1 .896** .868** .964**.000 .000 .000 .000
98 98 98 98 98.816** .896** 1 .910** .949**.000 .000 .000 .000
98 98 98 98 98.847** .868** .910** 1 .951**.000 .000 .000 .000
98 98 98 98 98.938** .964** .949** .951** 1.000 .000 .000 .000
98 98 98 98 98
Pearson CorrelationSig. (2-tailed)NPearson CorrelationSig. (2-tailed)NPearson CorrelationSig. (2-tailed)NPearson CorrelationSig. (2-tailed)NPearson CorrelationSig. (2-tailed)N
ITEM1
ITEM2
ITEM3
ITEM4
TOTAL
ITEM1 ITEM2 ITEM3 ITEM4 TOTAL
Correlation is significant at the 0.01 level (2-tailed).**.
Reliability
Warnings
The space saver method is used. That is, the covariance matrix is not calculated orused in the analysis.
Case Processing Summary
98 100.00 .0
98 100.0
ValidExcludeda
Total
CasesN %
Listwise deletion based on allvariables in the procedure.
a.

Reliability Statistics
.851 5
Cronbach'sAlpha N of Items
Item-Total Statistics
17.6633 55.009 .918 .80718.0918 53.837 .951 .79817.7347 56.712 .935 .81617.8673 56.116 .936 .81210.1939 18.055 1.000 .963
ITEM1ITEM2ITEM3ITEM4TOTAL
Scale Mean ifItem Deleted
ScaleVariance if
Item Deleted
CorrectedItem-TotalCorrelation
Cronbach'sAlpha if Item
Deleted
Scale Statistics
20.3878 72.219 8.49819 5Mean Variance Std. Deviation N of Items

Output Validitas dan Reliabilitas X2.1
Correlations
Correlations
1 .904** .869** .671** .920**.000 .000 .000 .000
98 98 98 98 98.904** 1 .911** .761** .958**.000 .000 .000 .000
98 98 98 98 98.869** .911** 1 .835** .970**.000 .000 .000 .000
98 98 98 98 98.671** .761** .835** 1 .882**.000 .000 .000 .000
98 98 98 98 98.920** .958** .970** .882** 1.000 .000 .000 .000
98 98 98 98 98
Pearson CorrelationSig. (2-tailed)NPearson CorrelationSig. (2-tailed)NPearson CorrelationSig. (2-tailed)NPearson CorrelationSig. (2-tailed)NPearson CorrelationSig. (2-tailed)N
ITEM1
ITEM2
ITEM3
ITEM4
TOTAL
ITEM1 ITEM2 ITEM3 ITEM4 TOTAL
Correlation is significant at the 0.01 level (2-tailed).**.
Reliability
Warnings
The space saver method is used. That is, the covariance matrix is not calculated orused in the analysis.
Case Processing Summary
98 100.00 .0
98 100.0
ValidExcludeda
Total
CasesN %
Listwise deletion based on allvariables in the procedure.
a.
Reliability Statistics
.847 5
Cronbach'sAlpha N of Items

Item-Total Statistics
20.4286 60.474 .896 .81220.3265 58.882 .944 .80120.6633 58.720 .960 .79920.5816 59.586 .843 .81011.7143 19.340 1.000 .949
ITEM1ITEM2ITEM3ITEM4TOTAL
Scale Mean ifItem Deleted
ScaleVariance if
Item Deleted
CorrectedItem-TotalCorrelation
Cronbach'sAlpha if Item
Deleted
Scale Statistics
23.4286 77.361 8.79550 5Mean Variance Std. Deviation N of Items

Output Validitas dan Reliabilitas X2.2
Correlations
Correlations
1 .771** .635** .593** .828**.000 .000 .000 .000
98 98 98 98 98.771** 1 .804** .779** .934**.000 .000 .000 .000
98 98 98 98 98.635** .804** 1 .841** .913**.000 .000 .000 .000
98 98 98 98 98.593** .779** .841** 1 .907**.000 .000 .000 .000
98 98 98 98 98.828** .934** .913** .907** 1.000 .000 .000 .000
98 98 98 98 98
Pearson CorrelationSig. (2-tailed)NPearson CorrelationSig. (2-tailed)NPearson CorrelationSig. (2-tailed)NPearson CorrelationSig. (2-tailed)NPearson CorrelationSig. (2-tailed)N
ITEM1
ITEM2
ITEM3
ITEM4
TOTAL
ITEM1 ITEM2 ITEM3 ITEM4 TOTAL
Correlation is significant at the 0.01 level (2-tailed).**.
Reliability
Warnings
The space saver method is used. That is, the covariance matrix is not calculated orused in the analysis.
Case Processing Summary
98 100.00 .0
98 100.0
ValidExcludeda
Total
CasesN %
Listwise deletion based on allvariables in the procedure.
a.
Reliability Statistics
.839 5
Cronbach'sAlpha N of Items

Item-Total Statistics
19.2041 49.752 .779 .81418.6837 47.517 .912 .79219.2857 49.052 .888 .80319.1122 45.503 .871 .78210.8980 15.577 1.000 .914
ITEM1ITEM2ITEM3ITEM4TOTAL
Scale Mean ifItem Deleted
ScaleVariance if
Item Deleted
CorrectedItem-TotalCorrelation
Cronbach'sAlpha if Item
Deleted
Scale Statistics
21.7959 62.308 7.89357 5Mean Variance Std. Deviation N of Items

Output Validitas dan Reliabilitas X2.3
Correlations
Correlations
1 .816** .557** .405** .817**.000 .000 .000 .000
98 98 98 98 98.816** 1 .766** .578** .931**.000 .000 .000 .000
98 98 98 98 98.557** .766** 1 .699** .886**.000 .000 .000 .000
98 98 98 98 98.405** .578** .699** 1 .777**.000 .000 .000 .000
98 98 98 98 98.817** .931** .886** .777** 1.000 .000 .000 .000
98 98 98 98 98
Pearson CorrelationSig. (2-tailed)NPearson CorrelationSig. (2-tailed)NPearson CorrelationSig. (2-tailed)NPearson CorrelationSig. (2-tailed)NPearson CorrelationSig. (2-tailed)N
ITEM1
ITEM2
ITEM3
ITEM4
TOTAL
ITEM1 ITEM2 ITEM3 ITEM4 TOTAL
Correlation is significant at the 0.01 level (2-tailed).**.
Reliability
Warnings
The space saver method is used. That is, the covariance matrix is not calculated orused in the analysis.
Case Processing Summary
98 100.00 .0
98 100.0
ValidExcludeda
Total
CasesN %
Listwise deletion based on allvariables in the procedure.
a.
Reliability Statistics
.831 5
Cronbach'sAlpha N of Items

Item-Total Statistics
19.3673 44.482 .760 .79919.3469 41.487 .905 .76819.2347 42.924 .847 .78319.1224 45.552 .713 .80911.0102 14.134 1.000 .877
ITEM1ITEM2ITEM3ITEM4TOTAL
Scale Mean ifItem Deleted
ScaleVariance if
Item Deleted
CorrectedItem-TotalCorrelation
Cronbach'sAlpha if Item
Deleted
Scale Statistics
22.0204 56.536 7.51902 5Mean Variance Std. Deviation N of Items
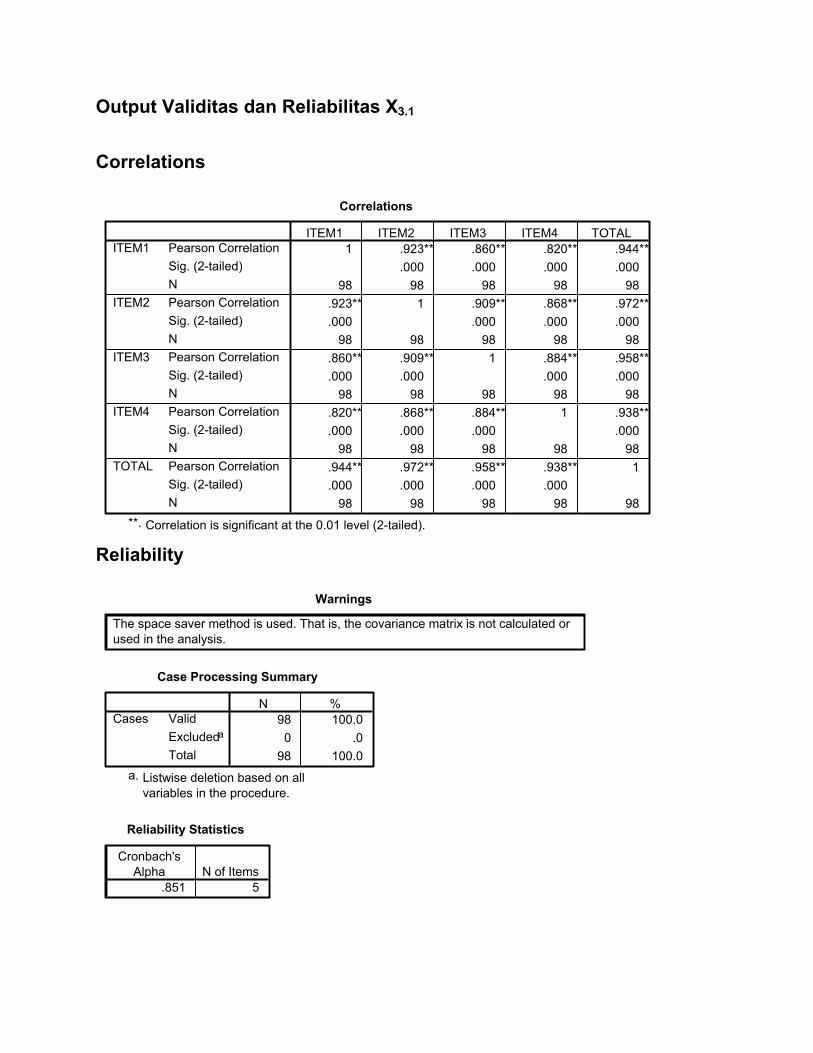
Output Validitas dan Reliabilitas X3.1
Correlations
Correlations
1 .923** .860** .820** .944**.000 .000 .000 .000
98 98 98 98 98.923** 1 .909** .868** .972**.000 .000 .000 .000
98 98 98 98 98.860** .909** 1 .884** .958**.000 .000 .000 .000
98 98 98 98 98.820** .868** .884** 1 .938**.000 .000 .000 .000
98 98 98 98 98.944** .972** .958** .938** 1.000 .000 .000 .000
98 98 98 98 98
Pearson CorrelationSig. (2-tailed)NPearson CorrelationSig. (2-tailed)NPearson CorrelationSig. (2-tailed)NPearson CorrelationSig. (2-tailed)NPearson CorrelationSig. (2-tailed)N
ITEM1
ITEM2
ITEM3
ITEM4
TOTAL
ITEM1 ITEM2 ITEM3 ITEM4 TOTAL
Correlation is significant at the 0.01 level (2-tailed).**.
Reliability
Warnings
The space saver method is used. That is, the covariance matrix is not calculated orused in the analysis.
Case Processing Summary
98 100.00 .0
98 100.0
ValidExcludeda
Total
CasesN %
Listwise deletion based on allvariables in the procedure.
a.
Reliability Statistics
.851 5
Cronbach'sAlpha N of Items

Item-Total Statistics
21.7857 49.985 .928 .81421.9286 48.046 .962 .80021.8980 49.660 .945 .81121.7449 49.285 .918 .81012.4796 16.046 1.000 .966
ITEM1ITEM2ITEM3ITEM4TOTAL
Scale Mean ifItem Deleted
ScaleVariance if
Item Deleted
CorrectedItem-TotalCorrelation
Cronbach'sAlpha if Item
Deleted
Scale Statistics
24.9592 64.184 8.01148 5Mean Variance Std. Deviation N of Items

Output Validitas dan Reliabilitas X3.2
Correlations
Correlations
1 .885** .771** .732** .887**.000 .000 .000 .000
98 98 98 98 98.885** 1 .918** .845** .967**.000 .000 .000 .000
98 98 98 98 98.771** .918** 1 .914** .965**.000 .000 .000 .000
98 98 98 98 98.732** .845** .914** 1 .937**.000 .000 .000 .000
98 98 98 98 98.887** .967** .965** .937** 1.000 .000 .000 .000
98 98 98 98 98
Pearson CorrelationSig. (2-tailed)NPearson CorrelationSig. (2-tailed)NPearson CorrelationSig. (2-tailed)NPearson CorrelationSig. (2-tailed)NPearson CorrelationSig. (2-tailed)N
ITEM1
ITEM2
ITEM3
ITEM4
TOTAL
ITEM1 ITEM2 ITEM3 ITEM4 TOTAL
Correlation is significant at the 0.01 level (2-tailed).**.
Reliability
Warnings
The space saver method is used. That is, the covariance matrix is not calculated orused in the analysis.
Case Processing Summary
98 100.00 .0
98 100.0
ValidExcludeda
Total
CasesN %
Listwise deletion based on allvariables in the procedure.
a.
Reliability Statistics
.848 5
Cronbach'sAlpha N of Items
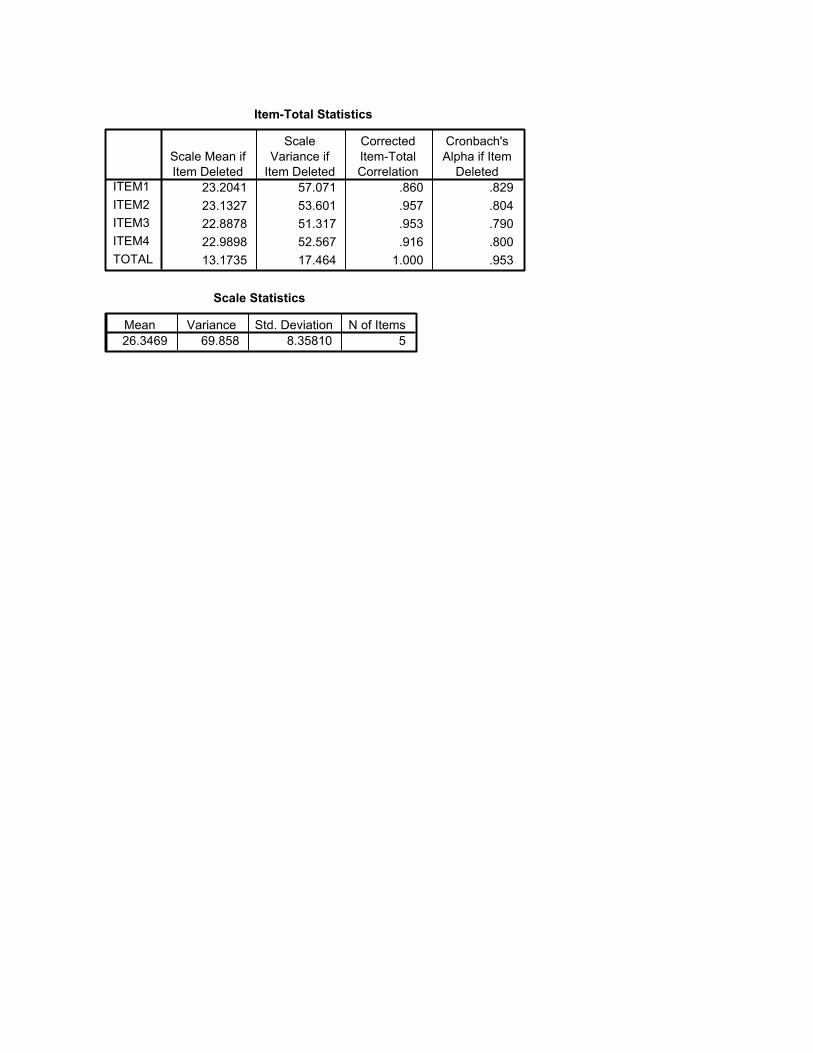
Item-Total Statistics
23.2041 57.071 .860 .82923.1327 53.601 .957 .80422.8878 51.317 .953 .79022.9898 52.567 .916 .80013.1735 17.464 1.000 .953
ITEM1ITEM2ITEM3ITEM4TOTAL
Scale Mean ifItem Deleted
ScaleVariance if
Item Deleted
CorrectedItem-TotalCorrelation
Cronbach'sAlpha if Item
Deleted
Scale Statistics
26.3469 69.858 8.35810 5Mean Variance Std. Deviation N of Items

Output Validitas dan Reliabilitas X3.3
Correlations
Correlations
1 .864** .768** .684** .916**.000 .000 .000 .000
98 98 98 98 98.864** 1 .838** .754** .948**.000 .000 .000 .000
98 98 98 98 98.768** .838** 1 .791** .925**.000 .000 .000 .000
98 98 98 98 98.684** .754** .791** 1 .869**.000 .000 .000 .000
98 98 98 98 98.916** .948** .925** .869** 1.000 .000 .000 .000
98 98 98 98 98
Pearson CorrelationSig. (2-tailed)NPearson CorrelationSig. (2-tailed)NPearson CorrelationSig. (2-tailed)NPearson CorrelationSig. (2-tailed)NPearson CorrelationSig. (2-tailed)N
ITEM1
ITEM2
ITEM3
ITEM4
TOTAL
ITEM1 ITEM2 ITEM3 ITEM4 TOTAL
Correlation is significant at the 0.01 level (2-tailed).**.
Reliability
Warnings
The space saver method is used. That is, the covariance matrix is not calculated orused in the analysis.
Case Processing Summary
98 100.00 .0
98 100.0
ValidExcludeda
Total
CasesN %
Listwise deletion based on allvariables in the procedure.
a.
Reliability Statistics
.844 5
Cronbach'sAlpha N of Items

Item-Total Statistics
22.1122 40.183 .885 .79322.5000 40.603 .930 .79222.0306 41.638 .901 .80222.0714 43.634 .835 .82012.6735 13.501 1.000 .933
ITEM1ITEM2ITEM3ITEM4TOTAL
Scale Mean ifItem Deleted
ScaleVariance if
Item Deleted
CorrectedItem-TotalCorrelation
Cronbach'sAlpha if Item
Deleted
Scale Statistics
25.3469 54.002 7.34861 5Mean Variance Std. Deviation N of Items

Output Validitas dan Reliabilitas X4.1
Correlations
Correlations
1 .820** .694** .704** .908**.000 .000 .000 .000
98 98 98 98 98.820** 1 .782** .628** .914**.000 .000 .000 .000
98 98 98 98 98.694** .782** 1 .708** .891**.000 .000 .000 .000
98 98 98 98 98.704** .628** .708** 1 .846**.000 .000 .000 .000
98 98 98 98 98.908** .914** .891** .846** 1.000 .000 .000 .000
98 98 98 98 98
Pearson CorrelationSig. (2-tailed)NPearson CorrelationSig. (2-tailed)NPearson CorrelationSig. (2-tailed)NPearson CorrelationSig. (2-tailed)NPearson CorrelationSig. (2-tailed)N
ITEM1
ITEM2
ITEM3
ITEM4
TOTAL
ITEM1 ITEM2 ITEM3 ITEM4 TOTAL
Correlation is significant at the 0.01 level (2-tailed).**.
Reliability
Warnings
The space saver method is used. That is, the covariance matrix is not calculated orused in the analysis.
Case Processing Summary
98 100.00 .0
98 100.0
ValidExcludeda
Total
CasesN %
Listwise deletion based on allvariables in the procedure.
a.
Reliability Statistics
.839 5
Cronbach'sAlpha N of Items

Item-Total Statistics
16.1633 22.179 .877 .79216.3776 21.846 .883 .78715.9592 22.802 .858 .80115.6429 23.242 .802 .810
9.1633 7.313 1.000 .912
ITEM1ITEM2ITEM3ITEM4TOTAL
Scale Mean ifItem Deleted
ScaleVariance if
Item Deleted
CorrectedItem-TotalCorrelation
Cronbach'sAlpha if Item
Deleted
Scale Statistics
18.3265 29.253 5.40861 5Mean Variance Std. Deviation N of Items

Output Validitas dan Reliabilitas X4.2
Correlations
Correlations
1 .882** .675** .716** .889**.000 .000 .000 .000
98 98 98 98 98.882** 1 .758** .753** .924**.000 .000 .000 .000
98 98 98 98 98.675** .758** 1 .831** .904**.000 .000 .000 .000
98 98 98 98 98.716** .753** .831** 1 .919**.000 .000 .000 .000
98 98 98 98 98.889** .924** .904** .919** 1.000 .000 .000 .000
98 98 98 98 98
Pearson CorrelationSig. (2-tailed)NPearson CorrelationSig. (2-tailed)NPearson CorrelationSig. (2-tailed)NPearson CorrelationSig. (2-tailed)NPearson CorrelationSig. (2-tailed)N
ITEM1
ITEM2
ITEM3
ITEM4
TOTAL
ITEM1 ITEM2 ITEM3 ITEM4 TOTAL
Correlation is significant at the 0.01 level (2-tailed).**.
Reliability
Warnings
The space saver method is used. That is, the covariance matrix is not calculated orused in the analysis.
Case Processing Summary
98 100.00 .0
98 100.0
ValidExcludeda
Total
CasesN %
Listwise deletion based on allvariables in the procedure.
a.
Reliability Statistics
.842 5
Cronbach'sAlpha N of Items

Item-Total Statistics
14.8163 26.151 .857 .81114.8571 25.876 .902 .80515.3980 25.211 .872 .79915.5000 24.273 .887 .787
8.6531 8.250 1.000 .926
ITEM1ITEM2ITEM3ITEM4TOTAL
Scale Mean ifItem Deleted
ScaleVariance if
Item Deleted
CorrectedItem-TotalCorrelation
Cronbach'sAlpha if Item
Deleted
Scale Statistics
17.3061 32.998 5.74440 5Mean Variance Std. Deviation N of Items

Output Validitas dan Reliabilitas X4.3
Correlations
Correlations
1 .786** .647** .667** .861**.000 .000 .000 .000
98 98 98 98 98.786** 1 .854** .783** .958**.000 .000 .000 .000
98 98 98 98 98.647** .854** 1 .743** .908**.000 .000 .000 .000
98 98 98 98 98.667** .783** .743** 1 .871**.000 .000 .000 .000
98 98 98 98 98.861** .958** .908** .871** 1.000 .000 .000 .000
98 98 98 98 98
Pearson CorrelationSig. (2-tailed)NPearson CorrelationSig. (2-tailed)NPearson CorrelationSig. (2-tailed)NPearson CorrelationSig. (2-tailed)NPearson CorrelationSig. (2-tailed)N
ITEM1
ITEM2
ITEM3
ITEM4
TOTAL
ITEM1 ITEM2 ITEM3 ITEM4 TOTAL
Correlation is significant at the 0.01 level (2-tailed).**.
Reliability
Warnings
The space saver method is used. That is, the covariance matrix is not calculated orused in the analysis.
Case Processing Summary
98 100.00 .0
98 100.0
ValidExcludeda
Total
CasesN %
Listwise deletion based on allvariables in the procedure.
a.
Reliability Statistics
.840 5
Cronbach'sAlpha N of Items

Item-Total Statistics
15.1122 26.018 .819 .80715.5714 23.753 .941 .77115.3469 25.033 .875 .79214.9694 27.246 .840 .820
8.7143 8.289 1.000 .917
ITEM1ITEM2ITEM3ITEM4TOTAL
Scale Mean ifItem Deleted
ScaleVariance if
Item Deleted
CorrectedItem-TotalCorrelation
Cronbach'sAlpha if Item
Deleted
Scale Statistics
17.4286 33.155 5.75801 5Mean Variance Std. Deviation N of Items