i Pengaruh work stressor pada perilaku cyberloafing karyawan ...
Jurnal Penelitian Ilmu Manajemen (JPIM)
https://jurnalekonomi.unisla.ac.id/index.php/jpim
e-ISSN 2621-881X
p-ISSN 2502-3780
Volume .6 No 2, Juni. 2021 162
http://dx.doi.org/10.30736%2Fjpim.v1i2.28
APAKAH CYBERLOAFING MEMPENGARUHI KINERJA DOSEN DI INDONESIA?
(DOES CYBERLOAFING AFFECT THE PERFORMANCE OF LECTURERS IN INDONESIA?)
Romi Ilham1, Achmad Saiful Ulum
2, Cantika Sari Siregar
3
1Program Studi Akuntansi, Universitas Hayam Wuruk Perbanas,
[email protected] 2 Program Studi Manajemen, Universitas Hayam Wuruk Perbanas,
[email protected] 3 Program Studi Akuntansi, Universitas Negeri Surabaya,
Info Artikel Abstrak
Diterima 25 Mei 2021 Teknologi internet saat ini sudah dirasakan oleh berbagai
pihak, seperti maraknya media sosial, youtube dan instant
messenger. Hal tersebut berdampak pada perilaku kerja dosen
yang inovatif. Kementerian Riset, Teknologi, dan Pendidikan
Tinggi di Indonesia melalui penerapan Indeks Sains dan
Teknologi (SINTA) mencatat hanya 1.551 dari 4.200 guru
besar dan 2.517 dari 17.133 Guru Besar Madya yang lulus
persyaratan publikasi. Oleh karena itu penelitian ini sangat
penting dilakukan untuk mengetahui pengaruh cyberloafing
terhadap perilaku innovative works behaviour (IWB) dan
bagaimana pengaruh terhadap kinerjanya. Jenis penelitian ini
menggunakan pendekatan kuantitatif melalui metode survei,
dengan jumlah sampel 230 responden dosen dan analisis
menggunakan algoritma SEM-PLS. Hasil penelitian ini
menjelaskan bahwa cyberloafing secara positif memoderasi
IWB terhadap kinerja penelitian dosen, sehingga dapat
disimpulkan bahwa penggunaan internet yang salah
berdampak pada rendahnya penelitian dosen.
Direvisi 18 Juni 2021
Dipubikasi 25 Juni 2021
Kata Kunci:
Cyberloafing, innovative
works behavior, lecturer
performance
Keywords :
Cyberloafing, innovative
works behavior, lecturer
performance
Abstract
Nowadays, various parties have felt internet technology, such
as the rise of social media, youtube, and instant messenger. It
has an impact on the work behavior of innovative lecturers.
The Ministry of Research, Technology and Higher Education
in Indonesia, through the Science and Technology Index
(SINTA) application, recorded only 1,551 of 4,200 professors
and 2,517 of the 17,133 Associate professors who passed the
publication requirements. Therefore this research is
fundamental to find out the influence of cyberloafing on the
Jurnal Penelitian Ilmu Manajemen (JPIM)
https://jurnalekonomi.unisla.ac.id/index.php/jpim
e-ISSN 2621-881X
Romi Ilham1, Achmad Saiful Ulum2, et al p-ISSN 2502-3780
Volume .6 No 2,Juni. 2021 163
http://dx.doi.org/10.30736%2Fjpim.v1i2.28
behavior of innovative works behavior (IWB) and how it
affects their performance. This type of research uses a
quantitative approach through survey methods. The study
population is accounting lecturers with a total sample of 230
respondents and analysis using the SEM-PLS algorithm. This
study explains that cyberloafing positively moderates
innovative works behaviour towards lecturers 'research
performance, so it can be concluded that incorrect internet
use impacts the lecturers' low research.
INTRODUCTION
Innovations for organizational effectiveness and performance are widely recognized by
some scholars (Rapp et al., 2015). Many studies have identified employees as essential
sources of innovation and essential elements that reduce innovative work behavior (Patterson,
Fiona., Kerrin, Maire, Gatto-Roissard, 2009; Prieto & Pérez-Santana, 2014). Innovative
Work Behavior (IWB) refers to an intentional generation, the introduction, and application of
new ideas at work, in groups, or individuals in an organization to improve performance
(Yogun, 2015). The IWB starts with each employee recognizing the problem, followed by
seeking support and galvanizing efforts from coworkers for the proposed idea, which will
produce a prototype or model of mass-produced propagable innovation for organizational
improvement (House & Robert J., 1976). De Spiegelaere, Van Gyes, De Witte, Niesen, &
Van Hootegem (2014) argues that IWB is different from employee creativity because
creativity focuses exclusively on idea generation, while IWB combines all employee
behaviors associated with various phases of the innovation process. Sutanto (2017) argues
that innovative behavior is important in the relationship of lecturers with a rapidly changing
society and consists of new technologies that appear in the latest discoveries about teaching
and research. The internet serves as an important gateway for creating and sharing
information in Indonesia's vast geographical area, a country estimated to have 250 million
inhabitants (NPC,2018). From this population, 93 million are internet users (Internet World
Stats., 2017). Lim (2002) averaged that over the past decade, perhaps the internet was the
only technology that dramatically impacted human life and offered a platform to improve
employee performance. Almost all lecturers at universities have personal computers or
smartphones that they use inside and outside working hours. The act of using a computer to
explore the internet for individual needs while on duty is called cyberloafing (Cox, Brammer,
& Millington, 2004; Mastrangelo, Everton, & Jolton, 2006; Vivien K. G. Lim, 2002).
Although, spontaneously acknowledging that too much cyberloafing will harm employee
Jurnal Penelitian Ilmu Manajemen (JPIM)
https://jurnalekonomi.unisla.ac.id/index.php/jpim
e-ISSN 2621-881X Romi Ilham1, Achmad Saiful Ulum2, et al p-ISSN 2502-3780
164 Volume 6. No 2,Juni. 2021
http://dx.doi.org/10.30736%2Fjpim.v1i2.28
productivity by spending time should be used for organizational assignments (Lynn et al.,
2015). In this study, many researchers argue that moderate cyberloafing can moderate the
relationship between innovative work behavior and lecturer work performance; because
excessive internet usage in a reasonable time can make a big profit (Lynn et al., 2015). From
the existing literature, some affordable cyberloafing activities tend to increase employees'
innovative behavior
For example, four capacities differ from cyberloafing that employees can do according
to Li & Chung (2006), which consists of social capability that supports internet use.
Information capacity is directly related to employees 'innovative work practices because they
may play an important role in securing' new talents and adopting new ways or strategies
(Yogun, 2015). According to the Indonesian Lecturers Association Report, most lecturers in
Indonesia have not carried out their main tasks properly.
(2014) argue that several studies empirically examine the relationship
between IWB and lecturer performance. Empirical studies in this field are critical
because IWB can affect their individual performance and overall performance
(Leong & Rasli, 2014). There is also a lack of adequate studies in management
literature about the positive effects of cyberloafing (Yogun, 2015). Most studies
have focused mainly on the private sector, although more and more information and
communication technology has been incorporated into the teaching profession. In
addition, the phenomenon of cyberloafing is an unexplored research area in
Indonesia. The proper understanding of cyberloafing and IWB, because it is related
to the performance of lecturers in educational institutions located in East Java, will
significantly help these institutions. Finally, Thurlings, Evers, & Vermeulen (2015)
argue that future researchers can expand existing knowledge about IWB activities
and teachers by including intervention variables to explore more relationships
between direct effects.
LITERATURE REVIEW
Lecturer's Job Performance
Innovations at tertiary institutions throughout the world bring more
comprehensive access and equal education opportunities. Therefore, anything that
Jurnal Penelitian Ilmu Manajemen (JPIM)
https://jurnalekonomi.unisla.ac.id/index.php/jpim
e-ISSN 2621-881X
Romi Ilham1, Achmad Saiful Ulum2, et al p-ISSN 2502-3780
Volume .6 No 2,Juni. 2021 165
http://dx.doi.org/10.30736%2Fjpim.v1i2.28
will improve the performance of lecturers in these institutions needs to be handled
properly. General practice across the tertiary education sector is the
conceptualization of the work of lecturers to cover three main segments, namely
research, teaching, and service (Adeosun et al., 2009; Gaus & Hall, 2016). Effective
academic staff work performance can lead to the actualization of three performance
parameters (Abdulsalam & Abubakar Mawoli, 2012). In teaching, lecturers are
expected to innovate in teaching material to several students every semester
continuously.
Sampson, Driscoll, Foulk, & Carroll (2010) agree that superior performance
in teaching will lead to growth, facilitating mastery of skill acquisition by students
and entrepreneurship development. Lecturers always learn new knowledge to keep
up with the latest events in the knowledge base so that they are up-to-date and
innovative (Tamunosiki-amadi & Dede, 2015). In addition, research is another
benchmark used to measure the performance of lecturers in universities.
Extraordinary research output from lecturers broadens the boundaries of social,
economic, scientific, and technological knowledge and advances that impact poverty
reduction, precisely in developing countries such as Indonesia (Abdulsalam &
Abubakar Mawoli, 2012). (2014) argue that lecturers with active innovation in
research have stronger loyalty and loyalty in their field of study, leading to
improved organizational performance.
Guiding and fostering student activities is a manifestation of service (Elfindri
et al., 2015). Lecturers are expected to overcome various needs of students using
new strategies with innovation in teaching (Balkar, 2015). Lecturers also struggle
with the content of lessons that can stimulate students to be innovative (Su & Wood,
2012). Ebele (2014) said that being creative in teaching is needed in teaching and
learning demanding innovative pedagogy. In Indonesia, according to
RISTEKDIKTI, lecturer performance can be measured through the main elements
consisting of education, research and community service, and supporting elements
(Dikti, 2014).
Jurnal Penelitian Ilmu Manajemen (JPIM)
https://jurnalekonomi.unisla.ac.id/index.php/jpim
e-ISSN 2621-881X Romi Ilham1, Achmad Saiful Ulum2, et al p-ISSN 2502-3780
166 Volume 6. No 2,Juni. 2021
http://dx.doi.org/10.30736%2Fjpim.v1i2.28
Innovative Work Behavior (IWB)
Innovative Work Behavior (IWB) refers to an intentional generation, the
introduction, and application of new ideas at work, in groups, or within
organizations to improve performance (Fairness et al., 2015). The behavior of
innovation in the workplace is the central pillar for high-performance organizations
(Prieto & Pérez-Santana, 2014).
Some experts have emphasized the importance of innovative work behavior in
promoting performance improvement for sustainable organizations (Mura et al.,
2012). The introduction of new and valuable ideas does not have a linear
relationship (Leong & Rasli, 2014). And thus, IWB is considered a multi-stage
process consisting of idea generation, coalition development, and implementation
(MacKenzie et al., 2005). Professional lecturers must innovate, contribute beyond
their job requirements and facilitate continuous innovation collaboration (Parker et
al., 2006).
Several studies show that IWB has a positive effect on employee performance
from different dimensions. X. Li & Zheng (2014) stated that innovative behavior
consisting of organizational commitment and psychological capital included
improving the performance of lecturers. Leong & Rasli (2014) conducted research
that employees in cross-functional and responsibility capacities showed a higher
tendency towards performance compared to departments that were only related to R
& D. Renkema, & Janssen (2017) found that three IWB attributes influenced the
positive performance results expected by the organization. Hope outcomes, such as
moderate psychological processes, are shaped by environmental and individual
differences, which consist of perceived organizational support for innovation. Thus,
we can safely hypothesize that:
H1: Innovative Work Behavior affects the teaching performance of lecturers
Jurnal Penelitian Ilmu Manajemen (JPIM)
https://jurnalekonomi.unisla.ac.id/index.php/jpim
e-ISSN 2621-881X
Romi Ilham1, Achmad Saiful Ulum2, et al p-ISSN 2502-3780
Volume .6 No 2,Juni. 2021 167
http://dx.doi.org/10.30736%2Fjpim.v1i2.28
H2: Innovative Work Behavior affects the research performance of lecturers
H3: Innovative Work Behavior affects the lecturer community performance
H4: Innovative Work Behavior affects the supporting elements of lecturers
Cyberloafing as a Moderating Variable
In this era of continuous connectivity to the web, employees can use the
internet for personal needs in the workplace to be counterproductive and damage
their performance (Hartijasti, 2015). (2015) asserts that employees involved in
cyberloafing tend to waste time and reduce the time spent doing their main tasks and
reduce their effectiveness.
For example, Griffin (2008) argues that 59% of internet use by employees in
the workplace is not related to work problems. However, all anecdotal evidence
portrays the internet as a double-edged sword that organizations should deploy to
employees with few restrictions (Vivien K. G. Lim, 2002). It is consistent with
many motivational theories that support predictions that internet use when work
positively affects their performance (Lynn et al., 2015). Anandarajan & Simmers
(2005) agree that, aside from the internet as an efficient tool, the internet also
provides addictive entertainment and games. However, some internet users feel that
activities such as searching for football scores on the internet, viewing youtube,
playing social media, or sending e-mail/messages to friends only take a few seconds
and should not cause problems in the larger scheme (Vivien K. G. Lim, 2002). In
addition, cyberloafing can serve as a palliative strategy to deal with unpleasant
workplace experiences such as stress (Anandarajan & Simmers, 2005; Oravec,
2002). At present, this activity is considered necessary because for hours at work,
and tend to experience unpleasant work experiences such as stress and fatigue
(Hartijasti, 2015).
Cyberloafing should be positively related to IWB because of search and self-
development related to cyberloafing activities (Palladan, 2018) and on many IWB
scales scientifically valid (Fairness et al., 2015). Yogun (2015) also found from his
Jurnal Penelitian Ilmu Manajemen (JPIM)
https://jurnalekonomi.unisla.ac.id/index.php/jpim
e-ISSN 2621-881X Romi Ilham1, Achmad Saiful Ulum2, et al p-ISSN 2502-3780
168 Volume 6. No 2,Juni. 2021
http://dx.doi.org/10.30736%2Fjpim.v1i2.28
research that similar IWB steps were both located on the scale of cyberloafing, such
as wandering, self-improvement, and seeking to acquire new skills. IWB that
happens every day at work, is very important for the survival and performance of the
organization (Oldham & Cummings, 2007). Therefore, we can hypothesize that:
H5: Cyberloafing moderates the effect of Innovative Work Behavior on teaching
performance
H6: Cyberloafing moderates the effect of Innovative Work Behavior on research
performance
H7: Cyberloafing moderates the effect of Innovative Work Behavior on community
performance.
H8: Cyberloafing moderates the influence of Innovative Work Behavior on
supporting elements.
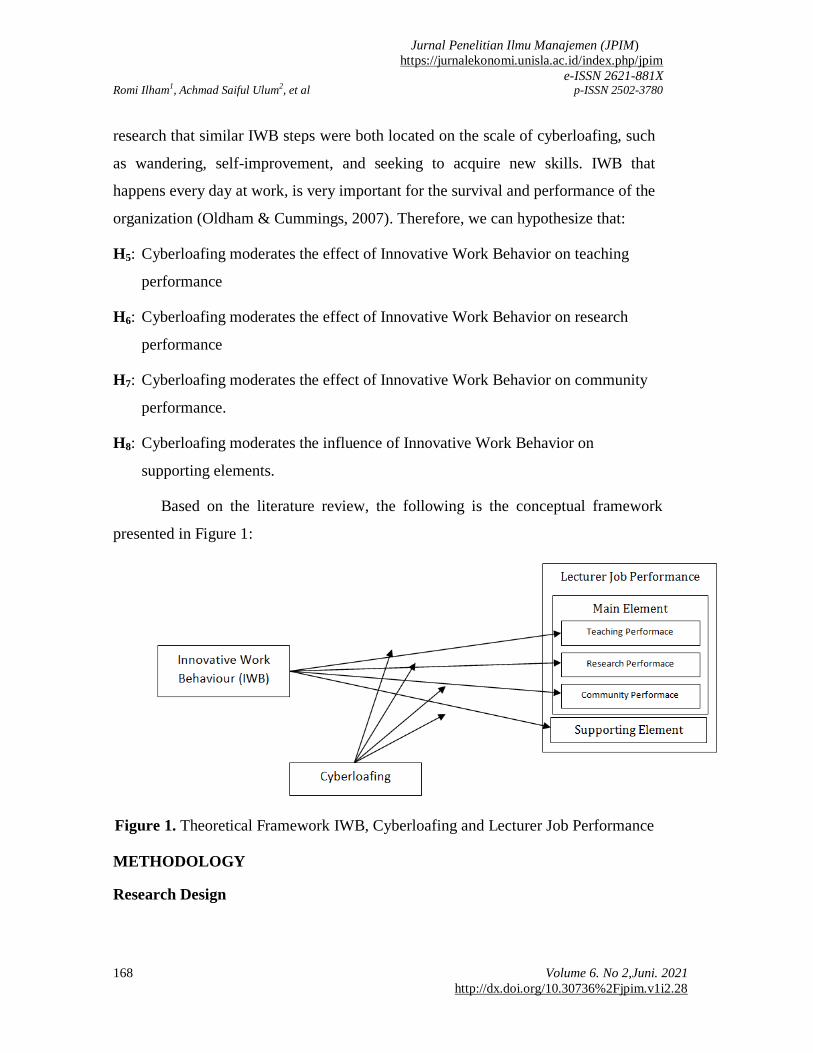
Based on the literature review, the following is the conceptual framework
presented in Figure 1:
Figure 1. Theoretical Framework IWB, Cyberloafing and Lecturer Job Performance
METHODOLOGY
Research Design

Jurnal Penelitian Ilmu Manajemen (JPIM)
https://jurnalekonomi.unisla.ac.id/index.php/jpim
e-ISSN 2621-881X
Romi Ilham1, Achmad Saiful Ulum2, et al p-ISSN 2502-3780
Volume .6 No 2,Juni. 2021 169
http://dx.doi.org/10.30736%2Fjpim.v1i2.28
The design of this study is testing hypotheses with survey methods through a
questionnaire by giving questions to respondents, namely lecturers majoring in
accounting who use smartphones and have social media accounts and online store
accounts in Indonesia. The primary data obtained will then be processed to test the
hypothesis.
Population and Sample
The population comprises objects/subjects with certain quantities and
characteristics determined by the researcher to be studied and then conclude (Azwar,
2005). Based on the rules according to Roscoe (1975), the minimum number of
samples in this study are:
Minimum number of samples
= number of instruments x 10
= 23 x 10 = 230
This study expects questionnaires to return as many as 230 questionnaires to
continue in the data processing stage. Based on that consideration, the researchers
took a sample of 300 samples to anticipate the delay in response from social media
users who filled out the questionnaire. The analysis technique used in this study is to
use Partial Least Square (PLS). Partial Least Square is an indeterminacy factor that
is a powerful analytical method because it can be applied to all data scales, does not
require many assumptions, and sample size does not have to be significant. Besides
being used to confirm the theory, PLS can also be used to build relationships that do
not have a terrorist foundation or to test propositions. The PLS approach is
distribution-free (does not assume certain distributed data, nominal, category,
ordinal interval, and ratio). PLS can confirm the theory and explain whether or not
there is a relationship between latent variables. The algorithm in PLS uses series
ordinary least square.
Jurnal Penelitian Ilmu Manajemen (JPIM)
https://jurnalekonomi.unisla.ac.id/index.php/jpim
e-ISSN 2621-881X Romi Ilham1, Achmad Saiful Ulum2, et al p-ISSN 2502-3780
170 Volume 6. No 2,Juni. 2021
http://dx.doi.org/10.30736%2Fjpim.v1i2.28
RESULTS AND DISCUSSION
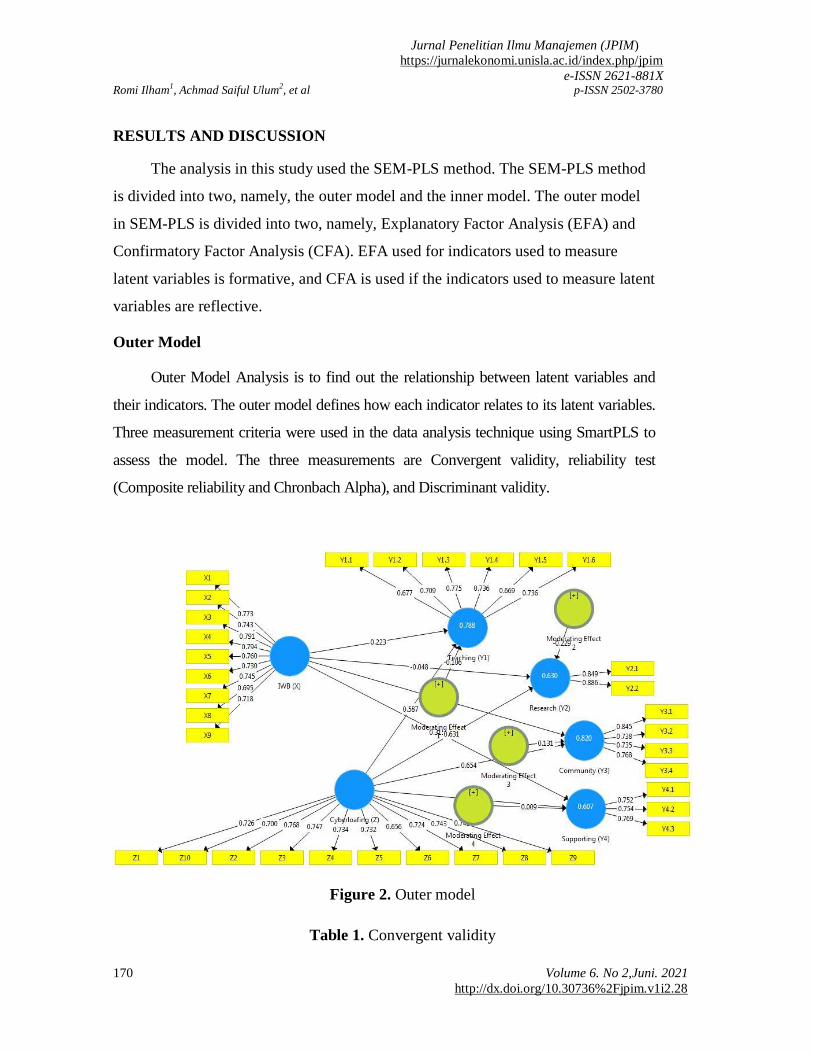
The analysis in this study used the SEM-PLS method. The SEM-PLS method
is divided into two, namely, the outer model and the inner model. The outer model
in SEM-PLS is divided into two, namely, Explanatory Factor Analysis (EFA) and
Confirmatory Factor Analysis (CFA). EFA used for indicators used to measure
latent variables is formative, and CFA is used if the indicators used to measure latent
variables are reflective.
Outer Model
Outer Model Analysis is to find out the relationship between latent variables and
their indicators. The outer model defines how each indicator relates to its latent variables.
Three measurement criteria were used in the data analysis technique using SmartPLS to
assess the model. The three measurements are Convergent validity, reliability test
(Composite reliability and Chronbach Alpha), and Discriminant validity.
Figure 2. Outer model
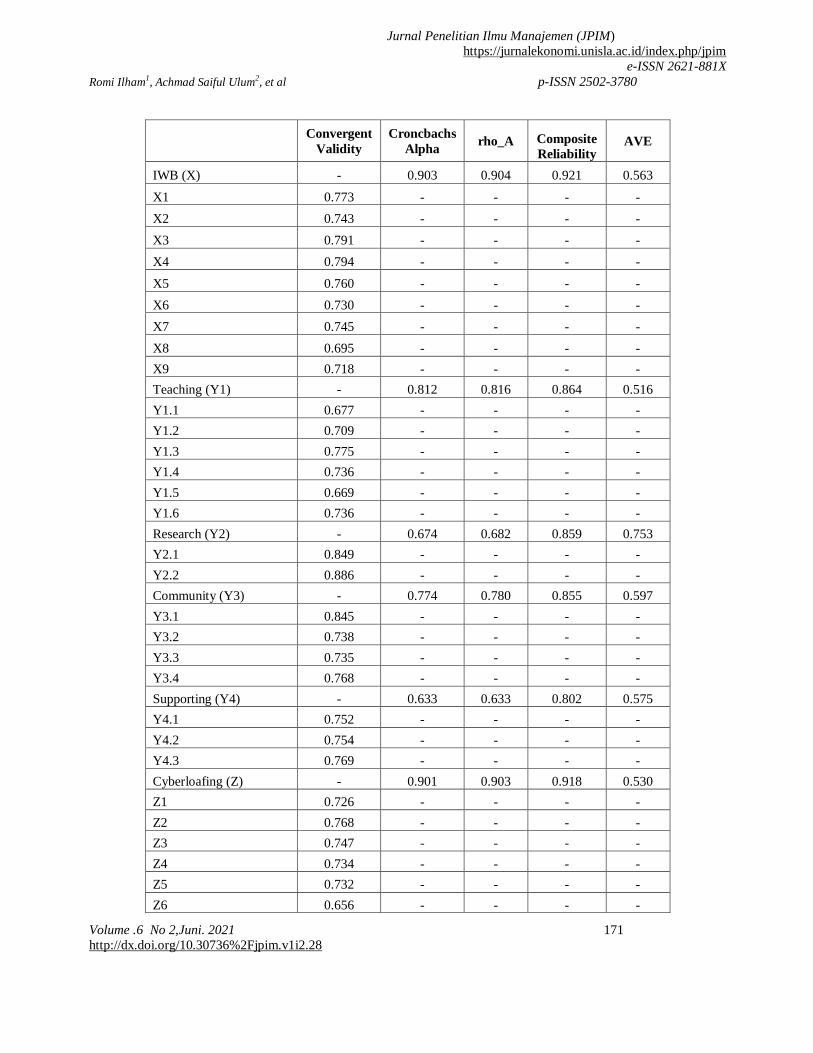
Table 1. Convergent validity
Jurnal Penelitian Ilmu Manajemen (JPIM)
https://jurnalekonomi.unisla.ac.id/index.php/jpim
e-ISSN 2621-881X
Romi Ilham1, Achmad Saiful Ulum2, et al p-ISSN 2502-3780
Volume .6 No 2,Juni. 2021 171
http://dx.doi.org/10.30736%2Fjpim.v1i2.28
Convergent
Validity
Croncbachs
Alpha rho_A Composite
Reliability AVE
IWB (X) - 0.903 0.904 0.921 0.563
X1 0.773 - - - -
X2 0.743 - - - -
X3 0.791 - - - -
X4 0.794 - - - -
X5 0.760 - - - -
X6 0.730 - - - -
X7 0.745 - - - -
X8 0.695 - - - -
X9 0.718 - - - -
Teaching (Y1) - 0.812 0.816 0.864 0.516
Y1.1 0.677 - - - -
Y1.2 0.709 - - - -
Y1.3 0.775 - - - -
Y1.4 0.736 - - - -
Y1.5 0.669 - - - -
Y1.6 0.736 - - - -
Research (Y2) - 0.674 0.682 0.859 0.753
Y2.1 0.849 - - - -
Y2.2 0.886 - - - -
Community (Y3) - 0.774 0.780 0.855 0.597
Y3.1 0.845 - - - -
Y3.2 0.738 - - - -
Y3.3 0.735 - - - -
Y3.4 0.768 - - - -
Supporting (Y4) - 0.633 0.633 0.802 0.575
Y4.1 0.752 - - - -
Y4.2 0.754 - - - -
Y4.3 0.769 - - - -
Cyberloafing (Z) - 0.901 0.903 0.918 0.530
Z1 0.726 - - - -
Z2 0.768 - - - -
Z3 0.747 - - - -
Z4 0.734 - - - -
Z5 0.732 - - - -
Z6 0.656 - - - -

Jurnal Penelitian Ilmu Manajemen (JPIM)
https://jurnalekonomi.unisla.ac.id/index.php/jpim
e-ISSN 2621-881X Romi Ilham1, Achmad Saiful Ulum2, et al p-ISSN 2502-3780
172 Volume 6. No 2,Juni. 2021
http://dx.doi.org/10.30736%2Fjpim.v1i2.28
Z7 0.724 - - - -
Z8 0.743 - - - -
Z9 0.742 - - - -
Z10 0.700 - - - -
Moderating Effect 1 - 1.000 1.000 1.000 1.000
Moderating Effect 2 - 1.000 1.000 1.000 1.000
Moderating Effect 3 - 1.000 1.000 1.000 1.000
Moderating Effect 4 - 1.000 1.000 1.000 1.000 Source: own calculation
Table 1 shows the estimated results of outer loading test calculations using SmartPLS. From the
output, it can be seen that all loading factor values are above 0.5. With this, the items are valid. A reliability
test is a tool to measure a questionnaire which is an indicator of variables or constants. A measuring
instrument or instrument in the form of a questionnaire is said to provide stable or constant measurement
results if the measuring device is reliable or reliable. The reliability of the research instruments in this study
was tested using composite reliability and Cronbach's coefficient alpha. A construct is reliable if the
composite reliability value and Cronbach alpha are above 0.70 (Nunnaly, 1996 in Ghozali, 2011: 43).
Whereas according to Widarjono (2015: 278), the instrument is reliable if the value of Composite reliability
is 6 0.6 for exploration studies and Cronbach alpha ≥ 0.6 for exploration research. The following are the
data analysis results from the composite reliability test and Cronbach alpha (Table 1). The test results based
on table 1 indicate that composite reliability and Cronbach alpha show good values, namely the value of
each variable above the minimum value of 0.60. This shows the consistency and stability of the instruments
used high. In other words, all the constructs or variables of this research have become fit measuring
instruments, and all questions used to measure each construct have good reliability.
The value of AVE (Average Variance Extracted) is used to determine the value of the
validity of a construct. The AVE criteria for a valid variable must be above 0.50 (Haryono, 2017).
The output of SmartPLS can be seen in the result above (see in the Average Variance Extracted
(AVE) column. From the output, all variables have AVE values more than 0.5, so that the variable
has good validity. Discriminant Validity shows that latent constructs predict whether the value of
the construct is better than the value of other constructs by looking at the construct correlation
value on cross loadings. Look at the value of Cross loading - Discriminant validity can be
measured by looking at the value of Cross loading. Suppose all indicators have a greater

Jurnal Penelitian Ilmu Manajemen (JPIM)
https://jurnalekonomi.unisla.ac.id/index.php/jpim
e-ISSN 2621-881X
Romi Ilham1, Achmad Saiful Ulum2, et al p-ISSN 2502-3780
Volume .6 No 2,Juni. 2021 173
http://dx.doi.org/10.30736%2Fjpim.v1i2.28
correlation coefficient with each construct compared to the indicative correlation coefficient on
the construct block in the other column. In that case, it is concluded that each indicator in the
block is a constructor in that column. (Haryono, 2017).
Table 2. Cross Loadings Value
Teaching
(Y1)
Community
(Y3)
Cyberloafing
(Z)
IWB
(X)
Mod
Eff 1
Mod
Eff 2
Mod
Eff 3
Mod
Eff 4
Research
(Y2)
Supporting
(Y4)
IWB (X) *
Cyberloafing (Z) -0,793 -0,75 -0,849 -0,841 1000 1000 1000 1000 -0,728 -0,673
IWB (X) *
Cyberloafing (Z) -0,793 -0,75 -0,849 -0,841 1000 1000 1000 1000 -0,728 -0,673
IWB (X) *
Cyberloafing (Z) -0,793 -0,75 -0,849 -0,841 1000 1000 1000 1000 -0,728 -0,673
X1 0,655 0,666 0,714 0,773 -0,651 -0,651 -0,651 -0,651 0,558 0,621
X2 0,571 0,649 0,658 0,743 -0,586 -0,586 -0,586 -0,586 0,561 0,57
X3 0,696 0,737 0,719 0,791 -0,69 -0,69 -0,69 -0,69 0,631 0,545
X4 0,632 0,672 0,718 0,794 -0,632 -0,632 -0,632 -0,632 0,504 0,59
X5 0,657 0,609 0,648 0,76 -0,589 -0,589 -0,589 -0,589 0,463 0,594
X6 0,644 0,636 0,689 0,73 -0,666 -0,666 -0,666 -0,666 0,516 0,589
X7 0,563 0,642 0,665 0,745 -0,636 -0,636 -0,636 -0,636 0,501 0,549
X8 0,682 0,618 0,643 0,695 -0,625 -0,625 -0,625 -0,625 0,606 0,549
X9 0,563 0,607 0,618 0,718 -0,594 -0,594 -0,594 -0,594 0,472 0,444
Y1.1 0,677 0,519 0,576 0,622 -0,584 -0,584 -0,584 -0,584 0,445 0,462
Y1.2 0,709 0,625 0,633 0,583 -0,599 -0,599 -0,599 -0,599 0,511 0,348
Y1.3 0,775 0,678 0,724 0,66 -0,581 -0,581 -0,581 -0,581 0,585 0,663
Y1.4 0,736 0,509 0,579 0,584 -0,574 -0,574 -0,574 -0,574 0,531 0,484
Y1.5 0,669 0,585 0,574 0,533 -0,515 -0,515 -0,515 -0,515 0,561 0,494
Y1.6 0,736 0,585 0,68 0,634 -0,564 -0,564 -0,564 -0,564 0,518 0,525
Y2.1 0,585 0,609 0,634 0,596 -0,602 -0,602 -0,602 -0,602 0,849 0,488
Y2.2 0,681 0,701 0,725 0,644 -0,659 -0,659 -0,659 -0,659 0,886 0,698
Y3.1 0,722 0,845 0,753 0,762 -0,637 -0,637 -0,637 -0,637 0,665 0,684
Y3.2 0,582 0,738 0,658 0,655 -0,598 -0,598 -0,598 -0,598 0,558 0,531
Y3.3 0,617 0,735 0,672 0,59 -0,51 -0,51 -0,51 -0,51 0,514 0,574
Y3.4 0,591 0,768 0,668 0,66 -0,567 -0,567 -0,567 -0,567 0,594 0,463
Y4.1 0,582 0,593 0,638 0,627 -0,577 -0,577 -0,577 -0,577 0,546 0,752
Y4.2 0,505 0,473 0,522 0,534 -0,438 -0,438 -0,438 -0,438 0,496 0,754
Y4.3 0,488 0,59 0,573 0,534 -0,503 -0,503 -0,503 -0,503 0,524 0,769
Z1 0,661 0,696 0,726 0,686 -0,702 -0,702 -0,702 -0,702 0,665 0,668
Z10 0,618 0,656 0,7 0,628 -0,616 -0,616 -0,616 -0,616 0,641 0,518
Z2 0,718 0,643 0,768 0,721 -0,66 -0,66 -0,66 -0,66 0,588 0,621
Jurnal Penelitian Ilmu Manajemen (JPIM)
https://jurnalekonomi.unisla.ac.id/index.php/jpim
e-ISSN 2621-881X Romi Ilham1, Achmad Saiful Ulum2, et al p-ISSN 2502-3780
174 Volume 6. No 2,Juni. 2021
http://dx.doi.org/10.30736%2Fjpim.v1i2.28
Z3 0,643 0,692 0,747 0,689 -0,609 -0,609 -0,609 -0,609 0,565 0,555
Z4 0,622 0,65 0,734 0,656 -0,626 -0,626 -0,626 -0,626 0,606 0,558
Z5 0,605 0,602 0,732 0,639 -0,591 -0,591 -0,591 -0,591 0,471 0,524
Z6 0,544 0,59 0,656 0,565 -0,57 -0,57 -0,57 -0,57 0,502 0,51
Z7 0,645 0,643 0,724 0,613 -0,537 -0,537 -0,537 -0,537 0,485 0,489
Z8 0,703 0,683 0,743 0,677 -0,657 -0,657 -0,657 -0,657 0,622 0,581
Z9 0,614 0,625 0,742 0,662 -0,59 -0,59 -0,59 -0,59 0,533 0,532
Source: own calculation
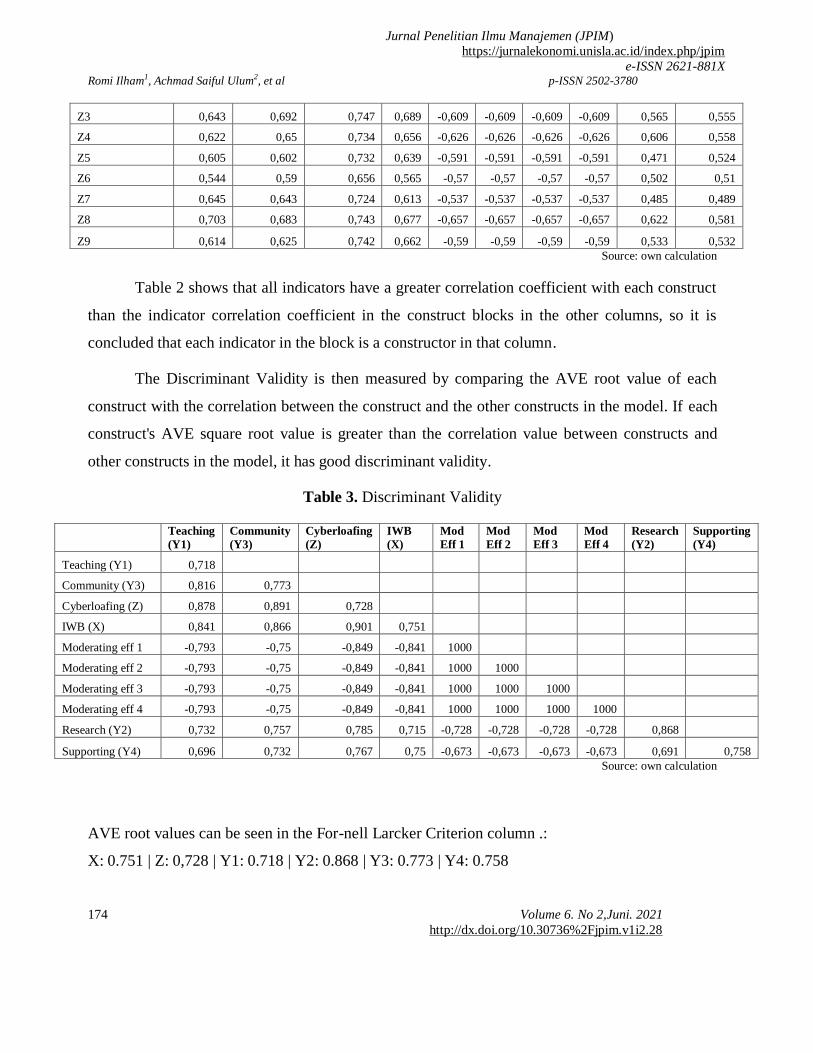
Table 2 shows that all indicators have a greater correlation coefficient with each construct
than the indicator correlation coefficient in the construct blocks in the other columns, so it is
concluded that each indicator in the block is a constructor in that column.
The Discriminant Validity is then measured by comparing the AVE root value of each
construct with the correlation between the construct and the other constructs in the model. If each
construct's AVE square root value is greater than the correlation value between constructs and
other constructs in the model, it has good discriminant validity.
Table 3. Discriminant Validity
Teaching
(Y1)
Community
(Y3)
Cyberloafing
(Z)
IWB
(X)
Mod
Eff 1
Mod
Eff 2
Mod
Eff 3
Mod
Eff 4
Research
(Y2)
Supporting
(Y4)
Teaching (Y1) 0,718
Community (Y3) 0,816 0,773
Cyberloafing (Z) 0,878 0,891 0,728
IWB (X) 0,841 0,866 0,901 0,751
Moderating eff 1 -0,793 -0,75 -0,849 -0,841 1000
Moderating eff 2 -0,793 -0,75 -0,849 -0,841 1000 1000
Moderating eff 3 -0,793 -0,75 -0,849 -0,841 1000 1000 1000
Moderating eff 4 -0,793 -0,75 -0,849 -0,841 1000 1000 1000 1000
Research (Y2) 0,732 0,757 0,785 0,715 -0,728 -0,728 -0,728 -0,728 0,868
Supporting (Y4) 0,696 0,732 0,767 0,75 -0,673 -0,673 -0,673 -0,673 0,691 0,758
Source: own calculation
AVE root values can be seen in the For-nell Larcker Criterion column .:
X: 0.751 | Z: 0,728 | Y1: 0.718 | Y2: 0.868 | Y3: 0.773 | Y4: 0.758

Jurnal Penelitian Ilmu Manajemen (JPIM)
https://jurnalekonomi.unisla.ac.id/index.php/jpim
e-ISSN 2621-881X
Romi Ilham1, Achmad Saiful Ulum2, et al p-ISSN 2502-3780
Volume .6 No 2,Juni. 2021 175
http://dx.doi.org/10.30736%2Fjpim.v1i2.28
Based on the above results, it can be seen that the AVE root value of each construct is
higher, and there is a lower correlation value between the construct and other constructs in the
model. The AVE root construct of variable X is 0.751, there is a higher one, and there is a lower
one than the correlation between construct X and other constructs (0.841, 0.866, 0.901, 0.715, and
0.750). Likewise, with different variables there are also higher AVE root values and lower ones.
With this, it can be said that according to the test with the root AVE, the model does not have
good discriminant validity
Because based on the test Discriminant validity using the value of Cross loading has
shown good results, and the effects of validity tests have obtained decent items, the AVE test has
also been fulfilled, and the reliability test has shown satisfactory results, then SEM PLS analysis
is still feasible to continue.
Inner Model
After the Confirmatory Factor Analysis is carried out and the indicators can measure the
latent variables well, then the inner model is analyzed. Inner model analysis determines the
relationship between latent variables and concludes the research hypothesis is accepted or
rejected. Hypothesis testing criteria are, if the value of t-statistics> 1.96 assuming alpha (fault
tolerance 5%), it can be concluded that the relationship of the two latent variables is significant
(hypothesis accepted) and vice versa. The results of the inner model analysis for between latent
variables are presented in the Table 4:
Table 4. RSquare
R Square R Square Adjusted
Teaching (Y1) 0,788 0,781
Community (Y3) 0,82 0,814
Research (Y2) 0,63 0,618
supporting (y4) 0,607 0,594 Source: own calculation
R-square variable Y1 is 0.788. It means that the construct variability Y1 can be explained
by the variability of constructs of variables X and Z of 78.8%. In contrast, the remainder is
explained by other variables outside the model studied.
Jurnal Penelitian Ilmu Manajemen (JPIM)
https://jurnalekonomi.unisla.ac.id/index.php/jpim
e-ISSN 2621-881X Romi Ilham1, Achmad Saiful Ulum2, et al p-ISSN 2502-3780
176 Volume 6. No 2,Juni. 2021
http://dx.doi.org/10.30736%2Fjpim.v1i2.28
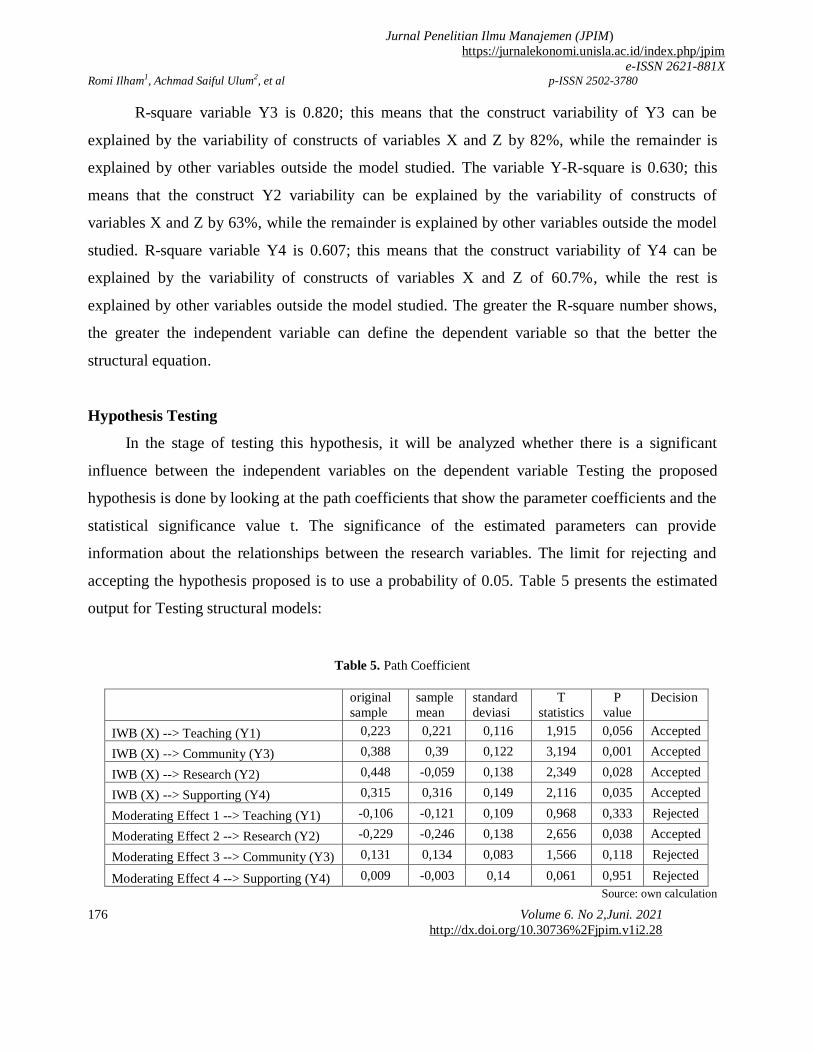
R-square variable Y3 is 0.820; this means that the construct variability of Y3 can be
explained by the variability of constructs of variables X and Z by 82%, while the remainder is
explained by other variables outside the model studied. The variable Y-R-square is 0.630; this
means that the construct Y2 variability can be explained by the variability of constructs of
variables X and Z by 63%, while the remainder is explained by other variables outside the model
studied. R-square variable Y4 is 0.607; this means that the construct variability of Y4 can be
explained by the variability of constructs of variables X and Z of 60.7%, while the rest is
explained by other variables outside the model studied. The greater the R-square number shows,
the greater the independent variable can define the dependent variable so that the better the
structural equation.
Hypothesis Testing
In the stage of testing this hypothesis, it will be analyzed whether there is a significant
influence between the independent variables on the dependent variable Testing the proposed
hypothesis is done by looking at the path coefficients that show the parameter coefficients and the
statistical significance value t. The significance of the estimated parameters can provide
information about the relationships between the research variables. The limit for rejecting and
accepting the hypothesis proposed is to use a probability of 0.05. Table 5 presents the estimated
output for Testing structural models:
Table 5. Path Coefficient
original
sample
sample
mean
standard
deviasi
T
statistics
P
value
Decision
IWB (X) --> Teaching (Y1) 0,223 0,221 0,116 1,915 0,056 Accepted
IWB (X) --> Community (Y3) 0,388 0,39 0,122 3,194 0,001 Accepted
IWB (X) --> Research (Y2) 0,448 -0,059 0,138 2,349 0,028 Accepted
IWB (X) --> Supporting (Y4) 0,315 0,316 0,149 2,116 0,035 Accepted
Moderating Effect 1 --> Teaching (Y1) -0,106 -0,121 0,109 0,968 0,333 Rejected
Moderating Effect 2 --> Research (Y2) -0,229 -0,246 0,138 2,656 0,038 Accepted
Moderating Effect 3 --> Community (Y3) 0,131 0,134 0,083 1,566 0,118 Rejected
Moderating Effect 4 --> Supporting (Y4) 0,009 -0,003 0,14 0,061 0,951 Rejected
Source: own calculation
Jurnal Penelitian Ilmu Manajemen (JPIM)
https://jurnalekonomi.unisla.ac.id/index.php/jpim
e-ISSN 2621-881X
Romi Ilham1, Achmad Saiful Ulum2, et al p-ISSN 2502-3780
Volume 6.. No 2, Juni 2021 177
http://dx.doi.org/10.30736%2Fjpim.v1i2.28
The Effect of Innovative Work Behavior on Job Lecturer's Performance
Hypothesis 1 is accepted. The result of this research is consistent with
(Palladan, 2018), which states that transferring knowledge to each individual is
different, so the instructor is required to innovate in teaching. The study by Zhu,
Wang, Cai, & Engels (2013) states that there are six innovative teachings, first,
innovative thoughts in education; second, innovative use of teaching content;
third, innovative teaching methods and teaching strategies; fourth, innovative of
teaching resources, five, innovative evaluation and the last is supporting teaching
environment.
Hypothesis 2 is accepted. Based on Table 5, the result of this research is
consistent with Onwubiko (2012), Varao-Sousa & Kingstone (2015) and Rezaei,
(2013), which state that the use of technology systems has an impact on the
quality of accounting information, current technology systems have opened
insights and improved knowledge for lecturers, wise use can improve the
scientific and quality of research in accounting lecturers.
Hypothesis 3 is accepted. The result of this research is in line with
Palladan (2018), which states this is not surprising because the IWB of lectures
is closely related to community service performance. Keerberg, Kiisla, &
MMeltsemees, (2013) argued that lecturers in tertiary institutions are expected to
support socio-cultural and technological developments in their community, thus
contributing to the social cohesion and sustainable development for their
institutions hosting community.
Hypothesis 4 is accepted. General Chair of the Association of Indonesian
Private Universities (APTISI) Edy Suandi Hamid, lecturers are the most
important element for universities in shaping quality human resources (HR).
Therefore, in evaluating credit numbers for increasing lecturer positions,
supporting elements are included; this is to implement innovations from lecturers
in organizing (Dikti, 2014).
Hypothesis 5 is rejected. This research is in line with Sampson, Driscoll,
Foulk, & Carroll, (2010), which argue that with the development of technology,
innovation is needed in teaching accounting science to be more easily
understood. Roebuck, Siha, & Bell (2013) use social media to increase
Jurnal Penelitian Ilmu Manajemen (JPIM)
https://jurnalekonomi.unisla.ac.id/index.php/jpim
e-ISSN 2621-881X
Romi Ilham1, Achmad Saiful Ulum2, et al p-ISSN 2502-3780
Volume .. No…, ……... 2019 http://dx.doi.org/10.30736%2Fjpim.v1i2.28
178 Volume 6 No 2, Juni 2021
http://dx.doi.org/10.30736%2Fjpim.v1i2.28
innovation in teaching, teaching using mobile devices is like discussing in e-
learning forums.
Hypothesis 6 is accepted. Rahayuningsih (2017), in his research, stated
that the lecturer is an expert in his field, has a high commitment and calling.
Cyberloafing behavior can affect commitment in work, thereby reducing the
productivity of accounting lecturers in conducting research (Rahayuningsih,
2017).
Hypothesis 7 and 8 are rejected. Based on the results of this study, in tune
with the research from Page (2015) and Ozler & Polat (2012), which states that
cyberloafing does not moderate the behavior of lecturers, especially community
service and supporting activities; this is possible because community service
activities are activities that require direct interaction with the community.
CONCLUSION AND SUGGESTION
This study describes the impact of cyberloafing activities on the
performance of tri dharma accounting lecturers in East Java. Data from the
Ministry of Research, Technology and Higher Education in Indonesia through
the Science and Technology Index (SINTA) application recorded only 1,551 of
4,200 professors and 2,517 of the 17,133 Associate professors who passed the
publication requirements. Based on the findings, the study concluded that
cyberloafing significantly moderates innovative work behavior towards the
performance of lecturers in the field of research. Therefore, the importance of
university leaders and the environment to motivate extrinsically and be able to
use the internet more wisely and make better use of internet technology.
REFERENCE
Abdulsalam, D., & Abubakar Mawoli, M. (2012). Motivation and Job
Performance of Academic Staff of State Universities in Nigeria: The Case
of Ibrahim Badamasi Babangida University, Lapai, Niger State.
International Journal of Business and Management, 7(14), 142–148.
Adeosun, O., Oni, A., Oladipo, A., Onuoha, S., & Yakassai, M. (2009). Teacher
Training Quality and Effectiveness in the Context of Basic Education : An
Examination of Primary Education Studies ( PES ) Programme in Two
Colleges of Education in Nigeria. 12(1), 107–125.
Anandarajan, M., & Simmers, C. a. (2005). Developing human capital through
personal web use in the workplace: Mapping employee perceptions.
Communications of the Association for Information Systems, 15, 776–791.
Jurnal Penelitian Ilmu Manajemen (JPIM)
https://jurnalekonomi.unisla.ac.id/index.php/jpim
e-ISSN 2621-881X
Romi Ilham1, Achmad Saiful Ulum2, et al p-ISSN 2502-3780
Volume .6 No 2, Juni 2021 179 http://dx.doi.org/10.30736%2Fjpim.v1i2.28
Balkar, B. (2015). The Relationships between Organizational Climate, Innovative
Behavior and Job Performance of Teachers. International Online Journal of
Educational Sciences, 7(2), 81–92.
Bos-Nehles, A., Renkema, M., & Janssen, M. (2017). HRM and innovative work
behaviour: a systematic literature review. Personnel Review, 46(7), 1228–
1253.
Cox, P., Brammer, S. B., & Millington, A. (2004). An Empirical Examination of
Institutional Investor Preferences for Corporate Social Performance. Journal
of Business Ethics, 52(1), 27–43.
De Spiegelaere, S., Van Gyes, G., De Witte, H., Niesen, W., & Van Hootegem, G.
(2014). On the relation of job insecurity, job autonomy, innovative work
behaviour and the mediating effect of work engagement. Creativity and
Innovation Management, 23(3), 318–330.
Dikti, D. (2014). Pedoman Operasional Penilaian Angka Kredit Kenaikan Pangkat
/Jabatan Akademik Dosen. In Ditjen DIKTI Kemdikbud.
Ebele, O. (Ph. D. (2014). Awareness , Competencies and Use of Social Media in
Teaching by Lecturers in Higher Institutions In South – East Of Nigeria.
6(36), 149–155.
Elfindri, E., Rustad, S., Nizam, & Dahrulsyah. (2015). Lecturer Performances in
Indonesia Higher Education System. IJAEDU- International E-Journal of
Advances in Education, 1(1), 26. https://doi.org/10.18768/ijaedu.09134
Fairness, H., Make, P., Behavior, I., Author, L. S., Source, O. J., Issue, S., Bright,
T., Sides, D., Innovation, G., & Url, W. S. (2015). How fairness perceptions
make innovative behavior more or less stressful. 25(2), 201–215.
Gaus, N., & Hall, D. (2016). Performance Indicators in Indonesian Universities:
The Perception of Academics. Higher Education Quarterly, 70(2), 127–144.
https://doi.org/10.1111/hequ.12085
Griffin, R. W. (2008). Principles Of Management (1st ed.). McGraw-Hill/Irwin;
1st edition (2008).
Hartijasti, Y. (2015). Motivation of Cyberloafers in the Workplace Across
Generations in Indonesia. International Journal of Cyber Society and
Education, 8(1), 49–58. https://doi.org/10.7903/ijcse.1360
House, A. C., & Robert J., F. (1976). Managerial process and organizational
behavior. Scott, Foresman.
Keerberg, A., Kiisla, A., & MMeltsemees, S. (2013). University Implementing Its
Community Service Role Through Curriculum Development in a Regional
College. SSRN Electronic Journal, 32–57.
Leong, C. T., & Rasli, A. (2014). The Relationship between Innovative Work
Behavior on Work Role Performance: An Empirical Study. Procedia -
Social and Behavioral Sciences, 129, 592–600.
Li, S. M., & Chung, T. M. (2006). Internet function and Internet addictive
behavior. Computers in Human Behavior, 22(6), 1067–1071.
Li, X., & Zheng, Y. (2014). The Influential Factors of Employees’ Innovative
Behavior and the Management Advices. Journal of Service Science and
Management, 07(06), 446–450.
Lynn, B., Coker, S., & Coker, B. L. S. (2015). Freedom to Surf : The Positive
Effects of Workplace Internet Leisure Browsing Freedom to surf : the
positive effects of workplace Internet leisure browsing. November, 238–247.
MacKenzie, S. B., Podsakoff, P. M., & Jarvis, C. B. (2005). The problem of
Jurnal Penelitian Ilmu Manajemen (JPIM)
https://jurnalekonomi.unisla.ac.id/index.php/jpim
e-ISSN 2621-881X
Romi Ilham1, Achmad Saiful Ulum2, et al p-ISSN 2502-3780
Volume .. No…, ……... 2019 http://dx.doi.org/10.30736%2Fjpim.v1i2.28
180 Volume 6 No 2, Juni 2021
http://dx.doi.org/10.30736%2Fjpim.v1i2.28
measurement model misspecification in behavioral and organizational
research and some recommended solutions. Journal of Applied Psychology,
90(4), 710–730.
Mastrangelo, P. M., Everton, W., & Jolton, J. A. (2006). Personal Use of Work
Computers: Distraction versus Destruction. CyberPsychology & Behavior,
9(6), 730–741.
Mura, M., Lettieri, E., Spiller, N., & Radaelli, G. (2012). Intellectual capital and
innovative work behaviour: Opening the black box. International Journal of
Engineering Business Management, 4(1), 1–10.
Oldham, G. R., & Cummings, A. (2007). Employee Creativity : personal and
contextual factors at work employee creativity : personal and contextual
factors a t work. 39(3), 607–634.
Onwubiko. (2012). Impact of the Internet on Research Effort of Academics at
Abia State University, Uturu, (ABSU). Library Philosophy & Practice,
December, 1–17.
Oravec, J. A. (2002). Constructive approaches to internet recreation in the
workplace. Communications of the ACM, 45(1).
Ozler, D. E., & Polat, G. (2012). Cyberloafing phenomenon in organizations:
determinants and impacts. International Journal of EBusiness and
EGovernment Studies, 4(2), 1–15.
Page, D. (2015). Teachers’ personal web use at work. Behaviour and Information
Technology, 34(5), 443–453.
Palladan, A. A. (2018). Moderating Effects of Cyberloafing Activity on Innovative
Work Behaviour and Lecturers Job Performance. 2(1), 1–22.
Parker, S. K., Williams, H. M., & Turner, N. (2006). Modeling the antecedents of
proactive behavior at work. Journal of Applied Psychology, 91(3), 636–652.
Patterson, Fiona., Kerrin, Maire, Gatto-Roissard, G. (2009). Characteristics &
Behaviours of Innovative People in Organisations: Literature review A
paper prepared for NESTA Policy and Research Unit (NPRU). May, 1–63.
Prieto, I. M., & Pérez-Santana, M. P. (2014). Managing innovative work
behavior: The role of human resource practices. Personnel Review, 43(2),
184–208.
Rahayuningsih, T. (2017). Perilaku cyberloafing ditinjau dari kecerdasan
adversitas dan komitmen kerja. 1(1), 49–53.
Rapp, A., Baker, T. L., Bachrach, D. G., Ogilvie, J., & Beitelspacher, L. S.
(2015). Perceived customer showrooming behavior and the effect on retail
salesperson self-efficacy and performance. Journal of Retailing, 91(2), 358–
369.
Rezaei, N. (2013). The Effect of Information Technology Systems on the
Accounting Information Quality. 2(2), 41–49.
Roebuck, D. B., Siha, S., & Bell, R. L. (2013). Faculty usage of social sedia and
mobile devices: analysis of advantages and concerns. Interdisciplinary
Journal of E-Learning and Learning Objects, 9, 171–192.
Sampson, J. P., Driscoll, M. P., Foulk, D. F., & Carroll, P. S. (2010). Successful
Faculty Performance in Teaching, Research and Original Creative Work,
and Service. 850, 1–17.
Su, F., & Wood, M. (2012). What makes a good university lecturer? Students’
perceptions of teaching excellence. Journal of Applied Research in Higher
Jurnal Penelitian Ilmu Manajemen (JPIM)
https://jurnalekonomi.unisla.ac.id/index.php/jpim
e-ISSN 2621-881X
Romi Ilham1, Achmad Saiful Ulum2, et al p-ISSN 2502-3780
Volume .6 No 2, Juni 2021 181 http://dx.doi.org/10.30736%2Fjpim.v1i2.28
Education, 4(2), 142–155.
Sutanto, E. M. (2017). The influence of organizational learning capability and
organizational creativity on organizational innovation of Universities in East
Java, Indonesia. Asia Pacific Management Review, 22(3), 128–135.
Tamunosiki-amadi, J. O., & Dede, T. (2015). Self Determination and Employee
Innovative Behaviour in the Nigerian Telecommunication Industry. 7(35),
97–105.
Thurlings, M., Evers, A. T., & Vermeulen, M. (2015). Toward a Model of
Explaining Teachers’ Innovative Behavior: A Literature Review. Review of
Educational Research, 85(3), 430–471.
Varao-Sousa, T. L., & Kingstone, A. (2015). Memory for Lectures: How Lecture
Format Impacts the Learning Experience. PLOS ONE, 10(11), e0141587.
Vivien K. G. Lim. (2002). The IT way of loafing on the job : cyberloafing ,
neutralizing and organizational justice. Journal of Organizational Behavior,
23(May), 675–694.
Yogun, A. (2015). Cyberloafing and Innovative Work Behavior Among Banking
Sector Employees. International Journal of Business and Management
Review, 3(10), 61–71.
Zhu, C., Wang, D., Cai, Y., & Engels, N. (2013). What core competencies are
related to teachers’ innovative teaching? Asia-Pacific Journal of Teacher
Education, 41(1), 9–27.
.
Copyright © 2022 FDOKUMEN