eprints.undip.ac.ideprints.undip.ac.id/63417/3/Hersugondo_Disertasi_Terbuka... · Web viewAnalisis...
169
EFEKTIFITAS INVESTASI BERKOMITMEN PADA HUMAN CAPITAL DEVELOPMENT DALAM PERSPEKTIF GOOD CORPORATE GOVERNANCE DALAM MENENTUKAN KINERJA DAN NILAI PERUSAHAAN PADA PERUSAHAAN YANG TERDAFTAR DI BURSA EFEK INDONESIA DISERTASI Hersugondo NIM 12020113510027 i
-
Upload
nguyenhuong -
Category
Documents
-
view
224 -
download
0
Transcript of eprints.undip.ac.ideprints.undip.ac.id/63417/3/Hersugondo_Disertasi_Terbuka... · Web viewAnalisis...
EFEKTIFITAS INVESTASI BERKOMITMEN PADA HUMAN CAPITAL DEVELOPMENT
DALAM PERSPEKTIF GOOD CORPORATE GOVERNANCE DALAM MENENTUKAN
KINERJA DAN NILAI PERUSAHAAN PADA PERUSAHAAN YANG TERDAFTAR
DI BURSA EFEK INDONESIA
DISERTASI
HersugondoNIM 12020113510027
PROGRAM DOKTOR (S3) ILMU EKONOMIUNIVERSITAS DIPONEGORO
SEMARANGJanuari, 2018
i
Disertasi
EFEKTIFITAS INVESTASI BERKOMITMEN PADA HUMAN CAPITAL DEVELOPMENT DALAM
PERSPEKTIF GOOD CORPORATE GOVERNANCE DALAM MENENTUKAN KINERJA DAN NILAI
PERUSAHAAN PADA PERUSAHAAN YANG TERDAFTAR DI BURSA EFEK INDONESIA
Oleh:Nama : Hersugondo
NIM : 12020113510027
Telah Disetujui Untuk Dipertahankan dihadapan Sidang Terbuka Ujian Promosi Doktor Ilmu Ekonomi Bidang Manajemen Keuangan Pada Program Doktor Ilmu Ekonomi Universitas Diponegoro Semarang
Semarang, Januari 2018
Promotor Ko-Promotor
(Prof. Dr. H. Sugeng Wahyudi, MM.) (Dr. Harjum Muharam, ME.)
ii

PERNYATAAN KEASLIAN DISERTASI
Dengan ini, saya yang bertanda tangan dibawah ini:
Nama : Hersugondo
NIM : 12020113510027
menyatakan bahwa disertasi saya yang berjudul:
”EFEKTIFITAS INVESTASI BERKOMITMEN PADA HUMAN CAPITAL DEVELOPMENT DALAM PERSPEKTIF GOOD CORPORATE GOVERNANCE DALAM MENENTUKAN KINERJA DAN NILAI PERUSAHAAN PADA PERUSAHAAN YANG TERDAFTAR DI BURSA EFEK INDONESIA”,
adalah karya saya dan disertasi ini belum pernah digunakan untuk mendapatkan
gelar keilmuan dimanapun.
Karya ilmiah ini sepenuhnya hasil karya dan milik saya, semua
informasi yang berasal dari penulis lain telah diberi penghargaan dengan
mengutip sumbernya. Oleh karena itu, semua tulisan dalam disertasi ini menjadi
tanggung jawab saya sebagai penulis.
Kemudian apabila didapati unsur plagiasi, maka saya akan
berpertanggungjawab sesuai dengan ketentuan yang berlaku.
Penulis,
Hersugondo
iii
ABSTRAK
Penelitian ini bertujuan untuk menjembatani gap kesimpulan yang berbeda antara pengaruh corpotare governance terhadap nilai perusahaan dengan konsep baru sebagai variabel intervening Efektivitas Investasi Berkomitmen pada Sumber Daya Manusia (Investment Efectiveness Committed to Human Capital Development/IEHCD) yang dikembangkan dengan mensintesakan antara Agency Theory dan Resourses Base Theory. Penelitian ini menggunakan data sekunder dengan populasi pada perusahaan yang terdaftar di BEI Tahun 2013-2015, Sampel penelitian ini adalah 57 perusahaan yang terdaftar di BEI tahun 2013-2015. Data diperoleh dengan memanfaatkan An nu al Re po rt periode 2013-2015. Alat analisis yang digunakan dalam penelitian ini adalah dengan menggunakan SmartPLS. Penelitian ini menghasilkan simpulan, yaitu pertama variabel K epe m ilik an In st itu si, Ke pe m ilik an as in g berpengaruh positif dan signifikan (α 0.05) terhadap Nilai Perusahaan sedangkan variabel Proporsi Kepemilikan Manajemen memiliki koefisien regresi yang positif tetapi tidak signifikan. Kedua, IEHCD mampu memediasi pengaruh antara proporsi kepemilikan manajemen terhadap nilai perusahaan. Ketiga, IEHCD mampu memediasi pengaruh antara proporsi kepemilikan asing terhadap nilai perusahaan. dan Keempat, IEHCD mampu memediasi pengaruh antara Proporsi Kepemilikan institusi terhadap nilai perusahaan.
Kata kunci: Corpotare Governance, Investment Efectiveness Comitted to Human Capital Development (IEHCD), Nilai Perusahaan.
iv

ABSTRACT
The aim of the study was to bridge the gap of different conclusions between the effect of corporate governance on corporate value and new concept as the intervening variable. The Investment Effectiveness Committed to Human Capital Development (IEHCD) was developed by synthesizing Agency Theory and Resource Base Theory. The study used secondary data with the population of the companies listed on the Stock Exchange in 2013-2015. The research samples were 57 companies listed in the Stock Exchange in 2013-2015. The data were obtained by using the Annual Report of the period of 2013-2015. The analytical tool used in this research was SmartPLS. The research resulted in the conclusions: first, the variables of Institutional ownership and foreign ownership have positive and significant effect (α 0.05) on Corporate Value, and the variable of Management Ownership Proportion has positive insignificant regression coefficients. Second, IEHCD was capable of mediating the effect between the proportions of management ownership on company value. Third, IEHCD was capable of mediating the effect between the proportion of foreign ownership on corporate value. Fourth, IEHCD was capable of mediating the effect between the proportion of institutional ownership on corporate value.
Keywords: Corporate Governance, Investment Effectiveness Committed to Human Capital Development (IEHCD), Corporate Value.
v
RINGKASAN
Kemakmuran pemegang saham yang merupakan tujuan utama perusahaan, untuk mencapai tujuan tersebut maka fungsi-fungsi manajemen harus dilaksanakan dengan hati-hati dan akurat, mengingat setiap keputusan majemen yang diambil akan mempengaruhi keputusan keuangan yang lain yang berdampak terhadap nilai perusahaan. Dalam praktek pengelolaan perusahaan modern, terjadi pemisahan antara pemilik dan pengelola, dimana pemilik perusahaan tidak lagi sebagai fihak yang dapat mengendalikan jalannya operasional perusahaan secara langsung, tetapi pengelolaan perusahaan diserahkan pada manajer profesional (Agency Theory) yang dalam prakteknya selalu muncul masalah keagenan (agency problem), untuk itu perlu mekanisme Good Corporate governance.
Kajian ini berangkat dari perbedaan-perbedaan kesimpulan hasil kajian empirik tentang corporate governance terutama yang menyangkut struktur kepemilikan pengaruhnya terhadap nilai perusahaan. Kemudian diajukan masalah penelitian dalam disertasi ini adalah: “Bagaimana mengembangkan model teoritikal untuk mengisi gap pengaruh corporate governance terhadap nilai perusahaan?”. Permasalahan penelitian yang diajukan adalah bagaimana pengaruh proporsi kepemilikan manajemen (Mgt_Own), proporsi kepemilikan institusi (Inst_Own), proporsi kepemilikan asing (Forg_Own), terhadap kinerja perusahaan (CorPerfm) dan nilai perusahaan (CorValue), efektivitas investasi berkomitmen pada sumber daya manusia. Bagaimana pengaruh Efektivitas Investasi Berkomitmen pada Sumber Daya Manusia (Investment Efectiveness Committed to Human Capital Development/IEHCD) terhadap kinerja perusahaan dan nilai perusahaan dan apakah IEHCD merupakan variabel intervening yang memediasi pengaruh faktor tata kelola terhadap kinerja perusahaan dan nilai perusahaan.
Teori dasar yang digunakan dalam penelitian ini adalah Agency Theory dan Resources-Based Theory yang disintesakan menjadi konsep baru yaitu Efektivitas Investasi Berkomitmen pada Sumber Daya Manusia (Investment Efectiveness Committed to Human Capital Development/IEHCD). Theory Agency mengambarkan hubungan antara pemegang saham dengan pengelola perusahaan. Prinsip dari teori keagenan adalah mengkaitkan hubungan antara fihak yang memberi pekerjaan dalam hal ini adalah pemegang saham kepada manajer profesional yang diberi kewenangan untuk mengelola perusahaan agar dalam penelolaan perusahaan mampu meningkatkan kemakmuran pemegang saham. Sementara Resources Based Theory membahas mengenai bagaimana sumber daya yang dimiliki perusahaan dan bagaimana perusahaan tersebut dapat mengolah dan memanfaatkan sumber daya yang dimilikinya. Kemampuan perusahaan dalam mengelola sumber dayanya dengan baik dapat menciptakan keunggulan kompetitif sehingga dapat menciptakan nilai bagi perusahaan. Dari kedua teori tersebut kemudian diderivasi menjadi konsep baru Efekktivitas Investasi Berkomitmen pada Pengembangan SDM/Investment Efectiveness Committed to Human Capital Development (EIHCD). Investment Efectiveness Committed to Human Capital Development (EIHCD) adalah maksimalisasi
vi
keuntungan perusahaan dengan memadukan investasi pada asset yang mendatangkan keuntungan yang dibarengi investasi pada sumber daya manusia (Human Capital Development). Masalah penelitiannya adalah apakah EIHCD mampu memediasi pengaruh struktur kepemilikan dalam tata kelola perusahaan yang baik (good corporate governance) terhadap kinerja perusahaan dan meningkatkan nilai perusahaan, yang dimaksudkan untuk mengisi gap penelitian antara tata kelola perusahaan terhadap nilai perusahaan.
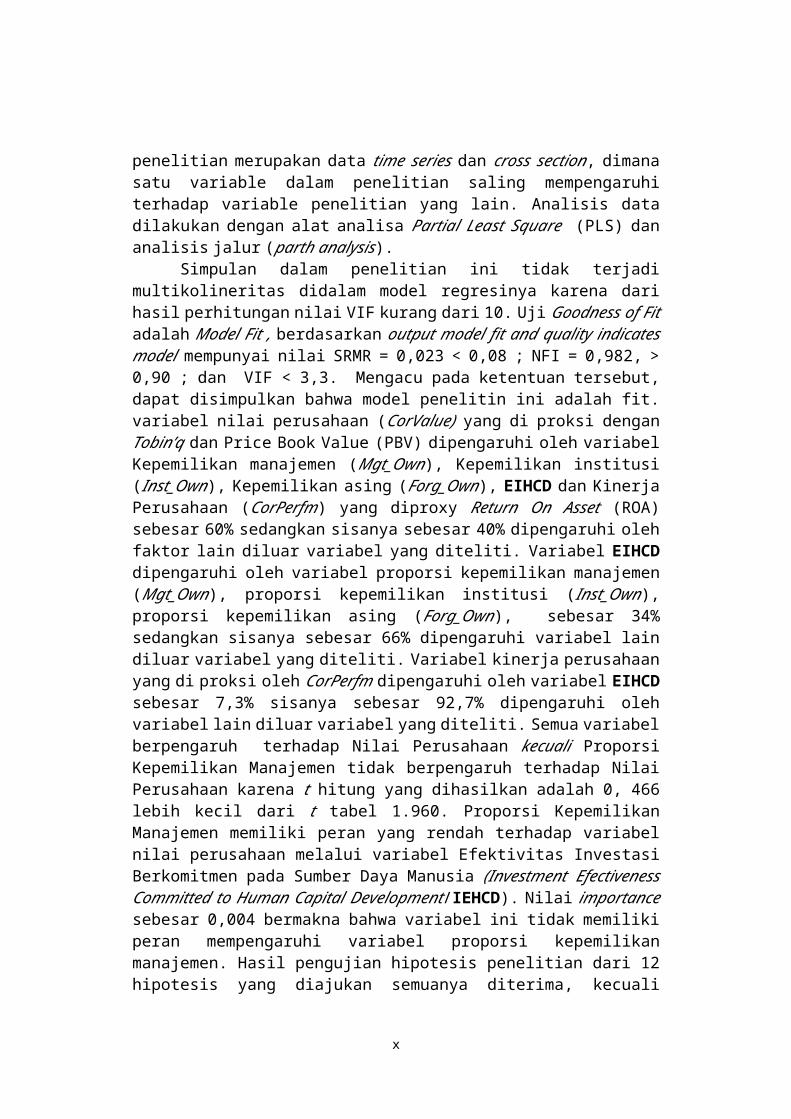
Jenis dan sumber data sekunder yaitu data yang bersumber dari sumber eksternal. Objek pada penelitian adalah perusahaan yang go public yang terdaftar di BEI. Populasi dalam penelitian ini adalah perusahaan yang terdaftar di Bursa Efek Indonesia selama tiga tahun sebanyak 530 perusahaan per tahun, yaitu tahun 2013 sampai dengan 2015 yang dipublikasikan oleh dalam Annual Report. Dengan purposive sampling didapat sampel sebanyak 57 perusahaan setiap tahun dengan. Variabel-variabel penelitian merupakan data time series dan cross section, dimana satu variable dalam penelitian saling mempengaruhi terhadap variable penelitian yang lain. Analisis data dilakukan dengan alat analisa Partial Least Square (PLS) dan analisis jalur (parth analysis).
Simpulan dalam penelitian ini tidak terjadi multikolineritas didalam model regresinya karena dari hasil perhitungan nilai VIF kurang dari 10. Uji Goodness of Fit adalah Model Fit , berdasarkan output model fit and quality indicates model mempunyai nilai SRMR = 0,023 < 0,08 ; NFI = 0,982, > 0,90 ; dan VIF < 3,3. Mengacu pada ketentuan tersebut, dapat disimpulkan bahwa model penelitin ini adalah fit. variabel nilai perusahaan (CorValue) yang di proksi dengan Tobin’q dan Price Book Value (PBV) dipengaruhi oleh variabel Kepemilikan manajemen (Mgt_Own), Kepemilikan institusi (Inst_Own), Kepemilikan asing (Forg_Own), EIHCD dan Kinerja Perusahaan (CorPerfm) yang diproxy Return On Asset (ROA) sebesar 60% sedangkan sisanya sebesar 40% dipengaruhi oleh faktor lain diluar variabel yang diteliti. Variabel EIHCD dipengaruhi oleh variabel proporsi kepemilikan manajemen (Mgt_Own), proporsi kepemilikan institusi (Inst_Own), proporsi kepemilikan asing (Forg_Own), sebesar 34% sedangkan sisanya sebesar 66% dipengaruhi variabel lain diluar variabel yang diteliti. Variabel kinerja perusahaan yang di proksi oleh CorPerfm dipengaruhi oleh variabel EIHCD sebesar 7,3% sisanya sebesar 92,7% dipengaruhi oleh variabel lain diluar variabel yang diteliti. Semua variabel berpengaruh terhadap Nilai Perusahaan kecuali Proporsi Kepemilikan Manajemen tidak berpengaruh terhadap Nilai Perusahaan karena t hitung yang dihasilkan adalah 0, 466 lebih kecil dari t tabel 1.960. Proporsi Kepemilikan Manajemen memiliki peran yang rendah terhadap variabel nilai perusahaan melalui variabel Efektivitas Investasi Berkomitmen pada Sumber Daya Manusia (Investment Efectiveness Committed to Human Capital Development/IEHCD). Nilai importance sebesar 0,004 bermakna bahwa variabel ini tidak memiliki peran mempengaruhi variabel proporsi kepemilikan manajemen. Hasil pengujian hipotesis penelitian dari 12 hipotesis yang diajukan semuanya diterima, kecuali Proporsi Kepemilikan Manajemen terhadap Investment Efectiveness Committed to Human Capital Development (EIHCD).
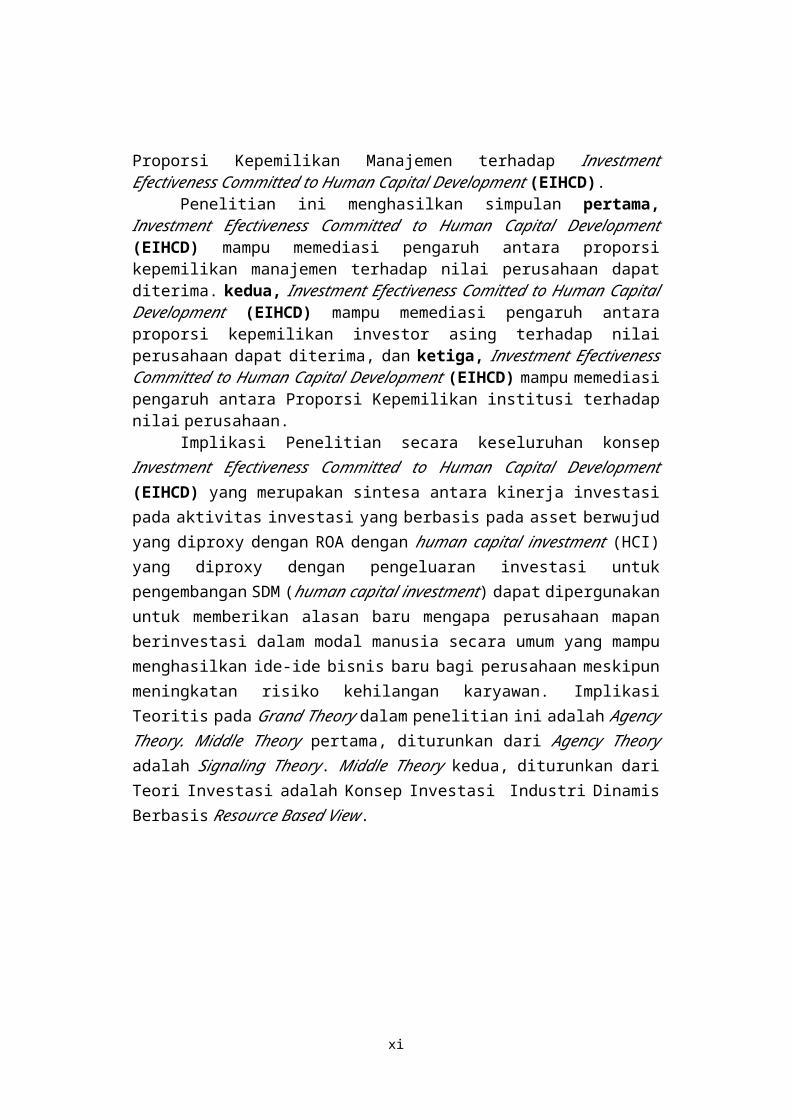
Penelitian ini menghasilkan simpulan pertama, Investment Efectiveness Committed to Human Capital Development (EIHCD) mampu memediasi
vii

pengaruh antara proporsi kepemilikan manajemen terhadap nilai perusahaan dapat diterima. kedua, Investment Efectiveness Comitted to Human Capital Development (EIHCD) mampu memediasi pengaruh antara proporsi kepemilikan investor asing terhadap nilai perusahaan dapat diterima, dan ketiga, Investment Efectiveness Committed to Human Capital Development (EIHCD) mampu memediasi pengaruh antara Proporsi Kepemilikan institusi terhadap nilai perusahaan.
Implikasi Penelitian secara keseluruhan konsep Investment Efectiveness Committed to Human Capital Development (EIHCD) yang merupakan sintesa antara kinerja investasi pada aktivitas investasi yang berbasis pada asset berwujud yang diproxy dengan ROA dengan human capital investment (HCI) yang diproxy dengan pengeluaran investasi untuk pengembangan SDM (human capital investment) dapat dipergunakan untuk memberikan alasan baru mengapa perusahaan mapan berinvestasi dalam modal manusia secara umum yang mampu menghasilkan ide-ide bisnis baru bagi perusahaan meskipun meningkatan risiko kehilangan karyawan. Implikasi Teoritis pada Grand Theory dalam penelitian ini adalah Agency Theory. Middle Theory pertama, diturunkan dari Agency Theory adalah Signaling Theory. Middle Theory kedua, diturunkan dari Teori Investasi adalah Konsep Investasi Industri Dinamis Berbasis Resource Based View.
viii
EXECUTIVE SUMMARY
Prosperity of shareholders is company’s main objectives. To achieve the goal, management functions must be carried out carefully and accurately since every management decision made will affect other financial decisions that affect corporate value. In the practice of modern company management, there is a separation between owners and managers in which company owner is no longer as the party who can control the company's operations directly, but the company management is handed over to professional managers (Agency Theory) which in practice always causes the problem of agency (agency problems). Therefore, it requires the mechanism for Good Corporate Governance.
The study started from the differences of empirical study conclusions on corporate governance, particularly with respect to the ownership structure and its effect on company value. Then, the study problem in this dissertation was: "How to develop a theoretical model to fill the gap of the effect of corporate governance on company value?" The proposed research was how the effects of the proportion of management ownership (Mgt_Own), the proportion of institutional ownership (Inst_Own), the proportion of foreign ownership (Forg_Own), corporate performance (CorPerfm) and corporate value (CorValue), and the investment effectiveness committed to human capital development. How the effect of the Investment Effectiveness Committed to Human Capital Development (IEHCD) on corporate performance and corporate value, and whether the IEHCD is the intervening variable that mediated the effect of governance on corporate performance and corporate value.
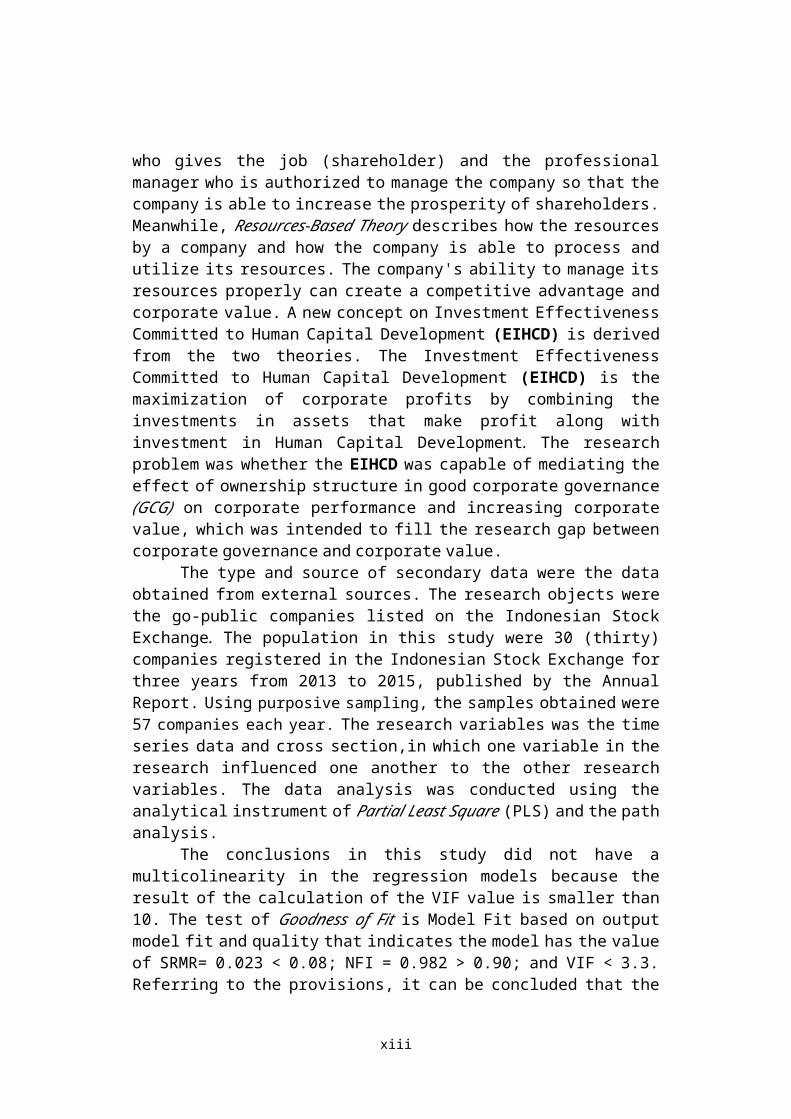
The basic theories used in this research were Agency Theory and Resource-Based Theory synthesized into a new concept of Investment Effectiveness Committed to Human Capital Development (IEHCD). Agency Theory describes the relationship between shareholders and corporate managers. The principle of agency theory is to link the relationship between the party who gives the job (shareholder) and the professional manager who is authorized to manage the company so that the company is able to increase the prosperity of shareholders. Meanwhile, Resources-Based Theory describes how the resources by a company and how the company is able to process and utilize its resources. The company's ability to manage its resources properly can create a competitive advantage and corporate value. A new concept on Investment Effectiveness Committed to Human Capital Development (EIHCD) is derived from the two theories. The Investment Effectiveness Committed to Human Capital Development (EIHCD) is the maximization of corporate profits by combining the investments in assets that make profit along with investment in Human Capital Development. The research problem was whether the EIHCD was capable of mediating the effect of ownership structure in good corporate governance (GCG) on corporate performance and increasing corporate value, which was intended to fill the research gap between corporate governance and corporate value.
The type and source of secondary data were the data obtained from external sources. The research objects were the go-public companies listed on the
ix
Indonesian Stock Exchange. The population in this study were 30 (thirty) companies registered in the Indonesian Stock Exchange for three years from 2013 to 2015, published by the Annual Report. Using purposive sampling, the samples obtained were 57 companies each year. The research variables was the time series data and cross section,in which one variable in the research influenced one another to the other research variables. The data analysis was conducted using the analytical instrument of Partial Least Square (PLS) and the path analysis.
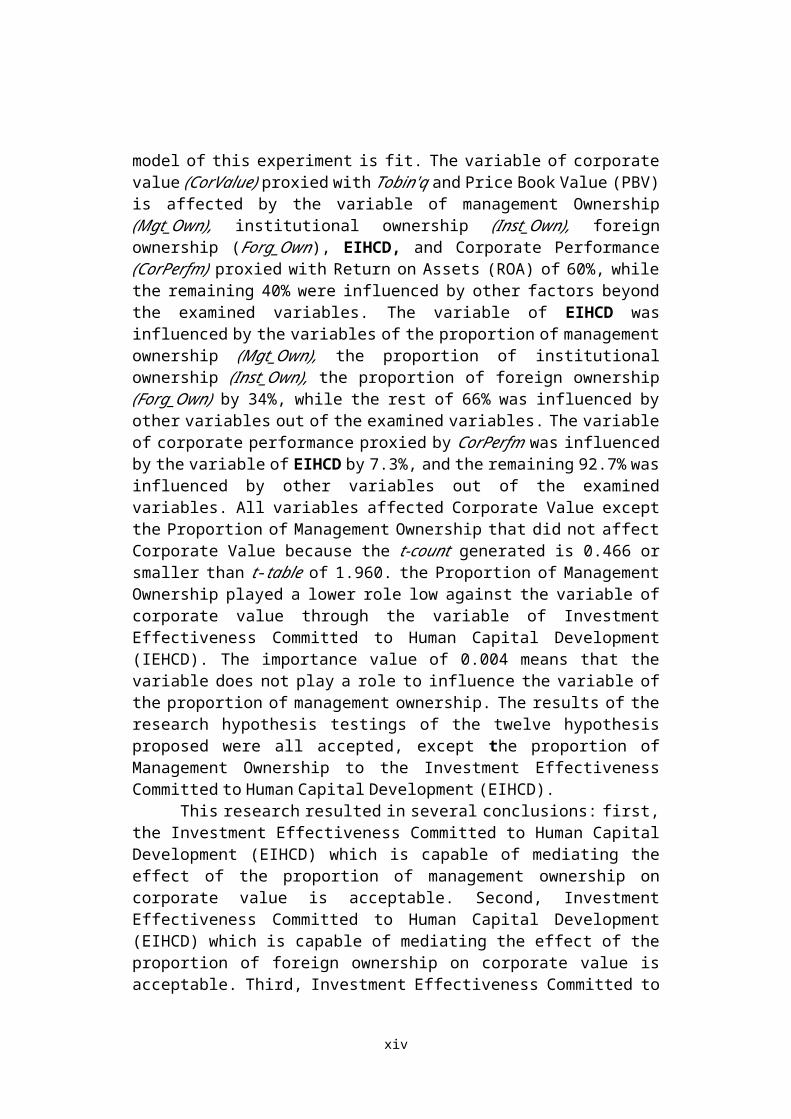
The conclusions in this study did not have a multicolinearity in the regression models because the result of the calculation of the VIF value is smaller than 10. The test of Goodness of Fit is Model Fit based on output model fit and quality that indicates the model has the value of SRMR= 0.023 < 0.08; NFI = 0.982 > 0.90; and VIF < 3.3. Referring to the provisions, it can be concluded that the model of this experiment is fit. The variable of corporate value (CorValue) proxied with Tobin'q and Price Book Value (PBV) is affected by the variable of management Ownership (Mgt_Own), institutional ownership (Inst_Own), foreign ownership (Forg_Own), EIHCD, and Corporate Performance (CorPerfm) proxied with Return on Assets (ROA) of 60%, while the remaining 40% were influenced by other factors beyond the examined variables. The variable of EIHCD was influenced by the variables of the proportion of management ownership (Mgt_Own), the proportion of institutional ownership (Inst_Own), the proportion of foreign ownership (Forg_Own) by 34%, while the rest of 66% was influenced by other variables out of the examined variables. The variable of corporate performance proxied by CorPerfm was influenced by the variable of EIHCD by 7.3%, and the remaining 92.7% was influenced by other variables out of the examined variables. All variables affected Corporate Value except the Proportion of Management Ownership that did not affect Corporate Value because the t-count generated is 0.466 or smaller than t-table of 1.960. the Proportion of Management Ownership played a lower role low against the variable of corporate value through the variable of Investment Effectiveness Committed to Human Capital Development (IEHCD). The importance value of 0.004 means that the variable does not play a role to influence the variable of the proportion of management ownership. The results of the research hypothesis testings of the twelve hypothesis proposed were all accepted, except the proportion of Management Ownership to the Investment Effectiveness Committed to Human Capital Development (EIHCD).
This research resulted in several conclusions: first, the Investment Effectiveness Committed to Human Capital Development (EIHCD) which is capable of mediating the effect of the proportion of management ownership on corporate value is acceptable. Second, Investment Effectiveness Committed to Human Capital Development (EIHCD) which is capable of mediating the effect of the proportion of foreign ownership on corporate value is acceptable. Third, Investment Effectiveness Committed to Human Capital Development (EIHCD) is capable of mediating the effect of the proportion of institutional ownership on corporate value.
The research implications, as a whole, show that the concept of the Investment Effectiveness Committed to Human Capital Development (EIHCD)
x
which is a synthesis between the performance of investments in investment activities based on tangible assets proxied with ROA and the human capital investment (HCI) proxied with the investment expenditures for human capital investment can be used to provide a new reason why well- established companies invest in human capital in general is capable of generating new business ideas for the companies despite the increased risk of losing employees. The theoretical implication on the Grand Theory in this study is the Agency Theory. The first middle theory derived from Agency Theory is Signaling Theory and Peking Order Theory. The second middle theory derived from Investment Theory is the concept of Dynamic Industrial Investment based on Resource Based View.
xi
MOTO
"Sesungguhnya jika kamu bersyukur, pasti Kami akan menambah (ni'mat) kepadamu, dan jika kamu mengingkari (ni'mat-Ku), maka sesungguhnya azab-Ku sangat pedih". (QS: Ibrahim:7)
“Sebaik-baik Manusia Adalah Yang Paling Bermanfaat Bagi Orang Lain” (Al-Amin).
Anda tak akan bisa menghukum orang yang ikhlas. Karena apapun hukuman yang anda berikan, tak akan membuatnya tersiksa. Tapi justru akan membuatnya semakin bersyukur. (Orang Bijak)
Sahabat seperti hal dengan bintang, tak selalu nampak tapi selalu ada dihati, Sahabat akan selalu menghampiri ketika seluruh dunia menjauh, Persahabatan itu seperti tangan dengan mata, Ketika tangan terluka, mata menangis, Ketika mata menangis, tangan menghapusnya. Bahkan ketika kau akan menangis, sahabat melakukan sesuatu yang menjadi kau tersenyum (Orang Bijak)
Pandanglah sesuatu dari kacamata orang lain. Apabila hal itu menyakitkan hatimu, maka mungkin hal itu menyakitkan hati orang lain. (Orang Bijak)
xii
PERSEMBAHAN:
Karya Ilmiah ini saya persembahkan pada istri dan anak-anaku yang tercinta dan dunia untuk kemajuan ilmu pengetahuan
xiii
KATA PENGANTAR
Puji syukur ke hadirat Allah SWT yang telah melimpahkan banyak
kenikmatan, rahmat dan hidayah-Nya, sehingga penyusunan disertasi ini dapat
diselesaikan. Disertasi ini dapat saya selesaikan tidak lepas dari bantuan banyak
pihak, untuk itu saya mengucapkan banyak terima kasih dan penghargaan kepada:
1. Prof. Dr. Yos Johan Utama, M.Hum. selaku Rektor dan para wakil
Rektor dilingkungan Universitas Diponegoro, yang telah memberikan
kesempatan dan fasilitas kami untuk melakukan studi lanjut.
2. Dr. Suharnomo, M.Si. selaku dekan beserta para wakil dekan di
Fakultas Ekonomika dan Bisnis, Prof. Dr. Imam Ghozali, Akt. M.Com.
dan Prof. Waridin, Ph.D., selaku Ketua dan sekretaris Program Studi
Doktor Ilmu Ekonomi Universitas Diponegoro beserta seluruh Staf
Administrasi (mba Lina, mas Jo, dll.), yang telah dan selalu memberikan
pelayanan yang tulus dan prima selama saya menempuh tugas belajar.
3. Prof. Dr. H. Sugeng Wahyudi, MM., yang saya hormati dan saya
banggakan selaku promotor yang dengan kesabarannya telah meluangkan
waktu membimbing dan sekaligus keteladanannya serta memberi
kesempatan untuk belajar dalam riset, pengabdian masyarakat, konferensi
dan publikasi bahkan menulis buku. Dr. Harjum Muharam, ME., selaku
co-promotor yang dengan kesabarannya telah meluangkan waktu
membimbing dan keteladanannya.
xiv
4. Dosen-dosen Penguji antara lain Dr. Sugiono, MSIE, Dr. Irene D.P. ME.,
Dr. HM Chabahib, M.Si. Dr. Wisnu Mawardi, MM., Dr. Mutamimah,
M.Si., terima kasih masukan-masukan yang berharga yang telah mengisi
kekurangan-kekurangan dalam saya menulis disertasi ini.
5. Dosen-dosen Program Studi Doktor Ilmu Ekonomi Prof. Augusty T.
Ferdinand, Prof. Miyasto, Dr. Akhyar, Dr. Toto Susilo, yang telah
memberikan saya kesempatan untuk belajar dan menimba ilmu.
6. Kementerian Riset, Tekhnologi dan Pendidikan Tinggi, yang telah
memberikan Beasiswa Pascasarjana Dalam Negeri (BPDN), dan
Koordinator Kopertis Wilayah VI Jawa Tengah yang telah memberikan
penugasan kepada saya untuk mengikuti studi lanjut sehingga dapat
membantu dan melancarkan saya dalam menempuh tugas belajar.
7. Rektor Unisbank, Ketua YPPMI, Dekan, Sekretaris Fakultas, Ketua
Program Studi dan para tenaga kependidikan di lingkungan Fakultas
Ekonomika dan Bisnis Universitas Stikubank, terima kasih untuk
semuanya yang telah diberikan khususnya security kampus Kendeng
yang menemani saat-saat harus lembur hingga larut malam bahkan fajar.
8. Prof. Dr. Ibnu Khajar, Prof. Y. Sutomo, MM., Prof. Eric Santoso,
MBA., Dr. Bambang Sudiyatno, Dr. Alimudin, Dr. Agung Nusantara,
Dr. Herry Subagyo, Dr. Sih Darmi Astuti, Dr. Endang Tjahtjaningsih, Dr.
Basukianto, Dr. Bambang Suko, Dr. M. Fauzan, Dr. Tristiana, Dr. Euis
Soliha, Dr. Agus Budi, Dr. Cecilia Sri Mindarti, Dr. J. Widiyatmoko,
Dr. GN. Masdjojo, Dr. Sri Nawatmi, Dr. Elen P., Jaeni, MSi, Andi
xv

Kartika, MM., Marlien, MM., Mulyo Budi, MM., Dr. Isnowati, Askar
Yunianto, MSi., Sri Sudarsi, MSi., Ali Maskur, M.Kom., Pancawati H.
MSi., Alfasadun, MM. dan teman-teman lain di FEB Unisbank yang
tidak bisa disebut satu persatu, terima kasih untuk dukungan dan
motivasinya selama saya menempuh studi.
9. Rekan-rekan Program Studi Doktor Ilmu Ekonomi Universitas
Diponegoro Semarang, Dr. Eka Handriani, Dr. Robiyanto, Rio Dhani
Laksana, M.Sc. Siti Puryandani, Hartati Hadadi, Tony Heryana, Dian
Purna, Dr. Bertha, Dr. Nuryakin, Dr. Hendar, Dr. Gita, Dr. Ida, pa
Marno, mas Anta, mas Agus Prie, mas Prio, bu Lita, bu Ika, atas
dorongan motivasi dan solidaritas selama dalam menempuh studi di S3.
Mba Eka, Pa Roby, Mas Rio, bro Yon, gus Ipul, pa Riskin, dan Ounty
yang bersama-sama belajar di “Riset Center”, ayo lanjutkan.
10. Ayahanda Bapak H. Dasmad (almarhum) yang ingin
menyaksikan promosi har i ini , tapi sang Khal ik lebih
mencinta i , dan Ibunda Hj. Tarinah, yang telah mengasuh,
membesarkan, dan mendoakan serta dengan perjuangannya yang penuh
kesabaran, kasih sayang, keteladanan, dan pengorbanan yang tak
terhitung nilainya, mudah-mudahan sehat selalu dan mudah-mudahan
bisa menjadi waladun sholihan.
11. Istriku tercinta, Dr. Hermin Pancasakti Kusumaningrum, M.Si. dan
anak-anakku t e r s ayang , Hererapratita Aysha Hapsari (Rera),
Hertantya Muhamad Aulyasaktya (Anto) dan Heradita Kaniaazzahra
xvi

Doktorasaintifika (Kania), yang selalu mendorong, mendoakan dan
memotivasi agar saya dapat menyelesaikan studi, dan selalu tanya
“kapan papa selesai kuliahnya”, terjawab sudah pertanyaannya dan baru
sekarang menjawabnya.
12. Kakak-kakaku, H. Hendro Puspito, SH., MH. dan Hj. Eko Nurhayati,
SH., Prof. Dr. Ir. H.M. Zainuri, DEA dan Hj. Ir. Hj. Hadi Endrawati,
DESU., Drs. H. Dwi Husodo Sapto Hariadi, MM. dan Dra. Hj. Hernanik
Narimaningsih, Adik-adikku: Puji Hartono, AMd. dan Rihanah, Arif
Setiadi, SE., Akt., MSi. dan Lilis Anisah, SSt., MSi., Sri Hastuti, AMd.
dan Targono, SH. Ponakan-ponakanku: Andika Satya Pratama, SH.,
Reza, S.Sos., Aula ST., dr. Rifa, dr. Fully, dr. Rona, Fira, Lala, Afip,
Yoga, Anggie, Yusuf, Ais, Habibie, Nesya, Aira, Deren dan Bagas,
terimakasih atas dorongan dan motivasinya.
13. Berbagai Pihak yang tidak dapat saya sebutkan, yang telah membantu
saya dalam menyusun dan menyelesaikan disertasi.
Dengan penuh kesadaran penulis merasa bahwa disertasi ini masih banyak
kekurangannya dan ketidaksempunaan, sehingga masih membutuhkan masukan,
kritik dan saran untuk penyempurnaan tulisan ini. Oleh karena itu, bagi
bapak/ibu/sdr yang berminat membaca, saya mohon untuk memberikan saran dan
kritik demi penyempurnaan disertasi ini.
Semarang, Januari 2018Penyusun,
Hersugondo
xvii

DAFTAR ISI
halamanHalaman Sampul Depan.......................................................................................... i
Halaman persetujuan .............................................................................................. ii
Pernyataan keaslian disertasi................................................................................... iii
Abstrak.................................................................................................................... iv
Abstract................................................................................................................... v
Ringkasan................................................................................................................ vi
Executive Summary................................................................................................ ix
Motto ...................................................................................................................... xii
Persembahan ........................................................................................................... xii
Kata Pengantar........................................................................................................ xiv
Daftar Tabel............................................................................................................. xxv
Daftar Gambar......................................................................................................... xxvii
BAB
I P E N D A H U L U A N.............................................................................. 1
1.1. Latar Belakang Penelitian.................................................................. 1
1.2. Penelitian Terdahulu dan Research Gaps.......................................... 10
1.2.1. Research Gap1: Kepemilikan Manajemen dan Nilai
Perusahaan........................................................................... 21
1.2.2. Research Gap2: Kepemilikan Investor Institusional dan
Nilai Perusahaan.................................................................. 28
1.2.3. Research Gap 3: Kepemilikan Asing dan Nilai
Perusahaan .......................................................................... 30
1.3. Fenomena Bisnis, Tata Kelola Perusahaa dan Human Capital
Investment.......................................................................................... 36
1.4. Masalah Penelitian............................................................................. 49
1.5. Perumusan Masalah........................................................................... 49
1.6. Tujuan Penelitian............................................................................... 50
1.7. Manfaat Penelitian............................................................................. 51
xviii

1.7.1. Manfaat Teoritis .................................................................. 51
1.7.2. Manfaat Praktis.................................................................... 51
1.8. Orisinilitas ......................................................................................... 52
II TELAAH PUSTAKA DAN PENGEMBANGAN MODEL 53
2.1. Telaah Pustaka .................................................................................. 53
2.1.1. Agency Theory (Teori Keagenan)........................................ 53
2.1.2. Resources Based Theory (RBT) .......................................... 58
2.1.3. Market Based Theory (MBT) .............................................. 66
2.1.4. Signaling Theory (Teori Pensinyalan) ................................ 68
2.1.5. Struktur Kepemilikan (ownership structure) ...................... 71
2.1.5.1. Kepemilikan Manajemen (Manajerial Ownership) 72
2.1.5.2.Kepemilikan Saham Institusi (Institution
Ownership) ............................................................ 74
2.1.5.3. Kepemilikan InsvestorAsing (foreign Ownership) 79
2.1.6. Kinerja Perusahaan (Corporate Performance) ................... 81
2.1.7. Tata Kelola Perusahaan (Corporate Governance)............... 83
2.1.7.1. Definisi Tata Kelola Perusahaan............................. 96
2.1.7.2. Tujuan Tata Kelola Perusahaan.............................. 99
2.1.7.3. Mekanisme Tata Kelola Perusahaan....................... 102
2.1.8. Nilai Perusahaan (Firm Value) ........................................... 105
2.2. Pengembangan Proposisi................................................................... 110
2.2.1. Teori Agensi dan Kebijakan Investasi................................. 110
2.2.2. Sintesis Agency Theory dan Resources Based Theory.......... 127
2.2.3. Efektifitas Investasi Berkomitmen pada Human Capital
Development........................................................................ 130
2.2.4. Indikator Efektifitas Investasi Berkomitmen pada Human
Capital Development .......................................................... 133
xix
2.2.4.1. Kinerja Perusahaan (Corporate Financial
Performance) ......................................................... 134
2.2.4.2. Kinerja Human Capital Investment....................... 138
2.2.5. State of the Art Proposisi Efektifitas Investasi
Berkomitmen pada Pengembangan SDM (Investment
Efectiveness Comitted to Human Capital
Development(IECHCD)....................................................... 140
2.2.6. Proposisi Efektifitas Investasi Berkomitmen pada
Pengembangan SDM (InvestmentEfectiveness Comitted to
Human Capital Development/ IECHCD) ........................... 148
2.3. Model Teoritikal Dasar (Grand Theoritical Model) ......................... 149
2.4. Pengembangan Hipotesa.................................................................... 158
2.4.1. Pengaruh Kepemilikan Manajerial Terhadap Kinerja dan
Nilai Perusahaan.................................................................. 158
2.4.2. Pengaruh kepemilikan Institusi Terhadap Kinerja dan
Nilai Perusahaan.................................................................. 164
2.4.3. Pengaruh Kepemilikan Investor Asing Terhadap Kinerja
dan Nilai Perusahaan............................................................ 170
2.4.4. Pengaruh Kepemilikan Manajerial Terhadap Investment
Efectiveness Committed to Human Capital Development... 177
2.4.5. Pengaruh Kepemilikan Institusi Terhadap Investment
Efectiveness Committed to Human Capital Development... 183
2.4.6. Pengaruh Kepemilikan Investor Asing Terhadap
Investment Efectiveness Committed to Human Capital
Development ....................................................................... 188
2.4.7. Pengaruh Investment Efectiveness Committed to Human
Capital Development Terhadap Kinerja dan Nilai
Perusahaan .......................................................................... 194
2.4.8. Investment Efectiveness Committed to Human Capital
Development Memediasi Pengaruh Kepemilikan
Manajemen terhadap Nilai perusahaan............................... 205
xx
2.4.9. Investment Efectiveness Committed to Human Capital
Development Memediasi Pengaruh Kepemilikan Institusi
terhadap Nilai perusahaan........................................................ 212
2.4.10 Investment Efectiveness Committed to Human Capital
Development Memediasi Pengaruh Kepemilikan Investor
Asing terhadap Nilai perusahaan............................................ 218
III MOTODE PENELITIAN ................................................................................ 226
3.1. Desain Penelitian....................................................................................... 226
3.2. Obyek Penelitian....................................................................................... 228
3.3. Jenis Data dan Sumber Data.................................................................... 228
3.4. Populasi dan Sampel................................................................................. 229
3.5. Difinisi Konsep Variabel Penelitian....................................................... 229
3.5.1. Nilai Perusahaan (Firm Value) ............................................... 230
3.5.2. Kinerja Keuangan Perusahaan (Corporate Financial
Performance) ............................................................................. 231
3.5.3. Tata Kelola Perusahaan (Corporate Governance) ............... 232
3.5.3.1.Proporsi Kepemilikan Manajerial (Managerial
Ownership ) ................................................................. 232
3.5.3.2.Proporsi Kepemilikan Institusi (Institutional
Investor) ........................................................................ 237
3.5.3.3. Proporsi kepemilikan institusi asing......................... 244
3.6. Definisi Operasional dan Pengukuran Variabel.................................... 247
3.6.1. Definisi Operasional.................................................................. 247
3.6.1.1. Nilai Perusahaan......................................................... 247
3.6.1.2. Kinerja Perusahaan (Corporate Performance)....... 248
3.6.1.3. Tata Kelola Perusahaan (Corporate Governance). 249
3.6.1.4. Efektifitas Investasi Berbasis pada Human
Capital (EICHCD)................................................. 250
3.6.2. Pengukuran Variabel................................................................. 252
3.7. Teknik Analisis.......................................................................................... 254
xxi
3.7.1. Analisis Jalur (Path Analysis).................................................. 254
3.7.2. Analisis Model Dengan PLS.................................................... 258
IV ANALISIS DATA DAN PEMBAHASAN...................................................... 260
4.1. Pengantar.................................................................................................... 260
4.2 Analisis Deskriptif.................................................................................... 260
4.3. Pengujian Asumsi Model Penelitian Empiris........................................ 264
4.3.1. Uji Multikolineritas...................................................................... 264
4.3.2. Uji Goodness of Fit Model Penelitian Empiris........................ 265
4.4. Pengujian dengan SmartPLS 4.0............................................................. 266
4.4.1. Pengujian Full Model................................................................... 266
4.4.2. Hasil Estimasi Model................................................................... 270
4.4.3. Pengujian Model Mediasi............................................................ 278
4.4.3.1. Hasil Pengujian Model Mediasi dengan
Importance–Performance Map Analysis (IPMA)
for construct.................................................................... 280
4.4.4. Pengujian Hipotesis...................................................................... 282
4.4.4.1. Pengujian pengaruh struktur dan mekanisme
Corporate Governance terhadap nilai perusahaan.. 283
4.4.4.2. Pengujian pengaruh mediasi Investment
Efectiveness Committed to Human Capital
Development atas struktur dan mekanisme
Corporate Governance terhadap nilai perusahaan.. 286
V PEMBAHASAN HASIL PENELITIAN......................................................... 289
5.1. Pengantar.................................................................................................... 289
5.2. Pembahasan................................................................................................ 290
5.3. Pengujian pengaruh mekanisme Corporate Governance terhadap
nilai perusahaan................................................................................. 291
5.3.1. Pembahasan Hasil Pengujian Hipotesis 1................................. 292
xxii
5.3.2. Pembahasan Hasil Pengujian Hipotesis 2................................. 295
5.3.3. Pembahasan Hasil Pengujian Hipotesis 3................................. 295
5.3.4. Pembahasan Hasil Pengujian Hipotesis 4................................. 296
5.3.5. Pembahasan Hasil Pengujian Hipotesis 5................................. 299
5.3.6. Pembahasan Hasil Pengujian Hipotesis 6................................. 301
5.3.7. Pembahasan Hasil Pengujian Hipotesis 7................................. 303
5.3.8. Pembahasan Hasil Pengujian Hipotesis 8................................. 304
5.3.9. Pembahasan Hasil Pengujian Hipotesis 9................................. 306
5.3.10 Pembahasan Hasil Pengujian Hipotesis 10............................... 307
5.3.11 Pembahasan Hasil Pengujian Hipotesis 11............................... 311
5.3.12 Pembahasan Hasil Pengujian Hipotesis 12............................... 313
VI KESIMPULAN,IMPLIKASI DAN KETERBATASAN PENELITIAN 317
6.1. Pengantar....................................................................................................... 317
6.2. Kesimpulan Hasil Pengujian Hipotesis................................................ 318
6.2.1. Hubungan Kausalitas struktur corporate governance dengan
Nilai Perusahaan.............................................................................. 322
6.2.2. Hubungan struktur Corporate Governance dengan Investment
Efectiveness Committed to Human Capital Development......... 325
6.3. Kesimpulan dari permasalahan penelitian............................................ 331
6.3.1. Alternatif Pertama..................................................................... 331
6.3.2. Alternatif Kedua........................................................................ 332
6.3.3. Alternatif Ketiga....................................................................... 333
6.4. Temuan penelitian................................................................................ 335
6.4.1. Proporsi Kepemilikan Institusi→ nilai perusahaan.................... 335
6.4.2. Proporsi kepemilikan institusi asing→ nilai perusahaan........... 337
6.4.3. Proporsi Kepemilikan Manajerial→ Investment Efectiveness
Committed to Human Capital Development.............................. 338
6.4.4. Proporsi Kepemilikan Institusi→ Investment Efectiveness
Committed to Human Capital Development.............................. 340
6.4.5. Proporsi kepemilikan institusi asing→ Investment
xxiii
Efectiveness Committed to Human Capital Development......... 341
6.4.6. Investment Efectiveness Committed to Human Capital
Development → kinerja perusahaan......................................... 342
6.4.7. Investment Efectiveness Committed to Human Capital
Development → nilai perusahaan............................................. 343
6.4.8. Kinerja perusahaan → nilai perusahaan.................................... 345
6.4.9. Investment Efectiveness Committed to Human Capital
Development →Proporsi Kepemilikan Investor Asing →nilai
perusahaan.................................................................................. 347
6.5. Implikasi penelitian.............................................................................. 347
6.5.1. Implikasi Teoritis...................................................................... 350
6.5.2. Implikasi Manajerial................................................................. 361
6.5.3. Implikasi Praktis bagi Investor................................................. 372
6.5.4. Implikasi bagi Pemerintah........................................................ 377
6.5.5. Keterbatasan Penelitian dan Agenda Penelitian Mendatang..... 379
DAFTAR PUSTAKA............................................................................................ 383
LAMPIRAN-LAMPIRAN
xxiv
DAFTAR TABEL
Tabel. 1.1.
Tabel. 1.2.
Tabel. 2.1.
Research Gap antara Corporate Governance dengan Nilai
Perusahaan...............................................................................
Data Rata-Rata Struktur Kepemilikan dan Nilai Perusahaan
dari Tahun 2013-2015...................................................................
Tinjauan Teori Keagenan.............................................................
34
4
5
56
Tabel. 2.2. St State of the Art Investment Efectiveness Committed to Human
Capital Development (EIBHC)................................................ 141
Tabel. 2.3. Ringkasan Kajian Empirik Pengaruh Proporsi Kepemilikan
Manajemen Terhadap Kinerjadan Nilai Perusahaan................ 160
Tabel. 2.4. Ringkasan Kajian Empirik Pengaruh Proporsi Kepemilikan
Institusi Terhadap KinerjadanNilai Perusahaan....................... 167
Tabel. 2.5. Ringkasan Kajian Empirik Pengaruh Proporsi Kepemilikan
Investor Asing Terhadap Kinerja dan Nilai Perusahaan.......... 172
Tabel. 2.6. Ringkasan Kajian Empirik Pengaruh Proporsi Kepemilikan
Manajemen Terhadap Investment Efectiveness Committed to
Human Capital Development................................................... 178
Tabel. 2.7. Ringkasan Kajian Empirik Pengaruh Proporsi Kepemilikan
Institusi Terhadap Investment Efectiveness Committed to
Human Capital Development................................................... 184
Tabel. 2.8. Ringkasan Kajian Empirik Pengaruh Proporsi Kepemilikan
Asing Terhadap Investment Efectiveness Committed to
Human Capital Development................................................... 190
Tabel. 2.9. Ringkasan Kajian Empirik Pengaruh Investment Efectiveness
Committed to Human Capital Development Terhadap
Kinerja dan Nilai Perusahaan................................................... 201
xxv

Tabel.2.10
.
Ringkasan Kajian Empirik Investment Efectiveness
Committed to Human Capital Development Memediasi
Pengaruh Kepemilikan Manajemen terhadap Nilai
perusahaan............................................................................... 206
Tabel
2.11.
Ringkasan Kajian Empirik Investment Efectiveness
Committed to Human Capital Development Memediasi
Pengaruh Kepemilikan Institusi terhadap Nilai perusahaan.... 214
Tabel
2.12.
Ringkasan Kajian Empirik Investment Efectiveness
Committed to Human Capital Development Memediasi
Pengaruh Kepemilikan Investor Asing terhadap Nilai
perusahaan............................................................................... 219
Tabel 3.1. Pengukuran Variabel Penelitian............................................... 252
Tabel 4.1. Data Nama Perusahaan Objek Penelitian................................ 261
Tabel 4.2 . Statistik Deskriptif Data Penelitian Tahun 2012 – 2015......... 262
Tabel 4.3. Quality Criteria : Collinearity Statistic................................... 265
Tabel 4.4. Quality Criteria : Model Fit Summary.................................... 266
Tabel 4.5. Model Fit and Quality Indicates, Path Coefisiens dan ρ-
Value, Indirect Effect, Total Effect, Effect Size – Full Model.. 268
Tabel 4.6. R squared, Q squared dan full collinearity VIF...................... 269
Tabel 4.7 Final Result – Path Coefficient (Direct Effect) ....................... 273
Tabel 4.8 Pengaruh Langsung Proporsi Kepemilikan Investor Asing,
Proporsi Kepemilikan Manajemen, Proporsi Kepemilikan
institusi, Investment Efectiveness Committed to Human
Capital Development, Kinerja Perusahaan dan Nilai
Perusahaan............................................................................... 278
Tabel 4.9 Hasil Pengujian pengaruh tidak langsung................................ 279
Tabel 4.10 Importance–Performance Map Analysis (IPMA) for
construct................................................................................... 281
Tabel 4.11
Tabel 5.1
Hasil pengujian hipotesis penelitian........................................
Ringkasan hasil pengujian Hipotesis Penelitian......................
288
291
xxvi
Tabel 6.1. Temuan Hasil Penelitian dan Implikasi Teoritis...................... 353
DAFTAR GAMBAR
Gambar. 1.1. Proporsi Tangible dan Intangable Asset dalam Perusahaan.. 39
Gambar: 2.1. Mapping Human Capital Dalam Modal Perusahaan............. 123
Gambar 2.2. Proporsi Peran Asset tidak Berwujud (intangible asset) ...... 125
Gambar 2.3. Model Piktografis Proposisi.................................................. 132
Gambar.2.4. Diagram State of the Art Investment Efectiveness
Committed to Human Capital Development (EIBHC) ......... 147
Gambar 2.5. Model Teoritikal Dasar.......................................................... 153
Gambar 2.6. Model Penelitian Empirik...................................................... 225
Gambar 3.1. Analisis Jalur (Path Analysis)............................................... 255
Gambar 4.1 Output SmartPLS - Full Model.............................................. 271
Gambar 5.1. Sistematika Bab V................................................................. 289
Gambar 5.2. Pergerakan Peran Proporsi Kepemilikan Manajerial
(Manajerial Ownership) dan Nilai Perusahaan.................... 294
Gambar 5.3. Pergerakan Peran Proporsi Kepemilikan Manajerial
(Manajerial Ownership) dan Investment Efectiveness
Committed to Human Capital Development.......................... 298
Gambar 6.1. Sistematika Bab VI................................................................ 317
Gambar 6.2. Alternatif 1 Struktur Corporate Governance Terhadap
Nilai Perusahaan.................................................................... 332
Gambar 6.3.
Gambar 6.4.
Alternatif 2 struktur corporate governance terhadap
Investment Efectiveness Committed to Human Capital
Development .........................................................................
Struktur corporate governance Dimediasi Oleh Investment
EfectivenessCommitted to Human Capital Development
Terhadap Nilai Perusahaan....................................................
333
334
xxvii
DAFTAR PUSTAKA
Abdullah, L., Jaafar, S., and Taib, I. (2013). Ranking of Human Capital Indicators using Analytic Hierarchy Process. Procedia-Social and Behavioral Sciences, 107(2013), 22-28.
Abe, M. and Hoshi, T. (2004). Corporate Finance and Human Resource Management RIETI RIETI Discussion Paper Series 04-E-027
ADB. (2010). Operations Manual Bank Policies (BP). 2010.
Agbloyor, E. K., Abor, J., Adjasi, C. K. D., & Yawson, A. (2013). Exploring the causality links between financial markets and foreign direct investment in Africa. Research in International Business and Finance, 28, 118-134.
Aggarwal, A., and C. R. Knoeber. (1996). Firm Performance and Mecanisms to control Agency Problem Between Managers and Shareholders. Journal of Financial and Quantitative Analisys 31 (3):377-397.
Aggrawal, A., and G. N. Mandelker. (1990). Large Shareholders and The Monitoring of Managers: The Case of Antitakeover Charter Amendment. Journal of Financial and Quantitative Analysis 25:143-161.
Aggarwala, T. (2003). Innovative human resource practices and organizational commitment: An empirical investigation. International Journal of Human Resource Management, 14(2), 175–197.
Aghion, P., Van Reenen, J., and Zingales, L. (2013). Innovation and institutional ownership. The American Economic Review, 103(1), 277-304.
Ahesha, P. and Sujani, T. (2012). Impact of Human Capital Investment on Firm Financial Performances: An Empirical Study of Companies in Sri Lanka. DOI: 10.7763/IPEDR. 2012. V54. 3
Ahmad, Z., Abdullah, N. M. H., and Roslan, S. (2012). Capital structure effect on firms perfor
mance: Focusing on consumers and industrials sectors on Malaysian firms. International Review of Business Research Papers, 8(5), 137-155.
Ahn, S., Denis, D. J., and Denis, D. K. (2006). Leverage and investment in diversified firms. Journal of financial Economics, 79(2), 317-337.
xxviii
Alessandri, T. M., and Seth, A. (2014). The effects of managerial ownership on international and business diversification: Balancing incentives and risks. Strategic Management Journal, 35(13), 2064-2075.
Al Farooque, O., Tony van Zijl., Dunstan, K., and Karim, W, (2005), University of Auck-land Business School (Tamaki Division), Private Bag 92019, Auckland, New Zealand, Email: [email protected]., School of Accounting and Commercial Law, Victoria University of Wellington, PO Box 600, Welington New Zealand, http://www.accounting-research.org.nz, A Simultaneous Equations Approach to Analysing the Relationship Between Ownership Structure and Performance in Bangladesh.
Ali, S. M., Salleh, N. M., and Hassan, M. S. (2010). Ownership structure and earnings management in Malaysian listed companies: the size effect. Asian Journal of Business and Accounting, (2),1-10.
Al-Malkawi, H.-A. N., and Rekha. (2012). Internal Mechanisms of Corporate Governance and Firm Performance: A Review of Theory and Empirical Evidence. Journal of Modern Accounting and Auditing 8 (4):549-568.
Al-Najjar. D. (2015). The Effect of Institutional Ownership on Firm Performance: Evidence from Jordanian Listed Firms. International Journal of Economics and Finance; Vol. 7, No. 12.
Al‐Najjar, B., and Anfimiadou, A. (2012). Environmental policies and firm value. Business Strategy and the Environment, 21(1), 49-59.
Alves, C., and Mendes, V. (2004). Corporate governance policy and company performance: the Portuguese case. Corporate Governance: An International Review, 12(3), 290-301.
Amihud, Y., and B. Lev. (1981). Risk Reduction as Managerial Motive for Conglomerate Mergers. Bell Journal of Economics 12:605-617.
Armstrong, M. (2006). A Handbook of Human Resource Management Practice (10 ed.). London: Kogan Page.
Andras, T. L. and Srinivasan, S. S. (2003). Advertising Intensity and R&D Intensity: Differences across Industries and Their Impact on Firm's Performance. International Journal of Business and Economics, 2(2), 167-176.
xxix
An, H., and Zhang, T. (2013). Stock price synchronicity, crash risk, and institutional investors. Journal of Corporate Finance, 21, 1-15.
Anuchitworawong, C. (2004). Ownership-based Incentive, Internal Corporate Risk and Firm Performance. Dissertation, Institute of Economics Reseach, Hitotsubhasi University.
Apreda, R.. (2011). Corporate Governance And Intellectual Capital. University Del Cema. MCMLXXVIII.
Arslan-Ayaydin, Ö., Florackis, C., and Ozkan, A. (2014). Financial Flexibility, Corporate Investment and Performance: Evidence From Financial Crises. Review of Quantitative Finance and Accounting, 42(2), 211-250.
Arthur, J. B. (1994). Effects of Human Resource Systems on Manufacturing Performance and Turn Over. Academy of Management journal, 37(3), 670-687.
Ashour, A., and Bontis, N. (2007). Human capital and organizational performance: a study of Egyptian software companies. Management Decision, 45(4), 789-801.
Asiedu, E., and Esfahani, H. S. (2001). Ownership Structure in Foreign Direct Investment Projects. The Review of Economics and Statistics, 83(4), 647-662.
Asker, J., Farre-Mensa, J., and Ljungqvist, A. (2014). Corporate Investment and Stock Market Listing: A Puzzle?. The Review of Financial Studies, 28(2), 342-390.
Astuti, P.D. (2005). “Hubungan Intellectual Capital dan Business Performance.” Jurnal MAKSI. Vol 5, 34-58.
Attig, N., Cleary, S., El Ghoul, S., and Guedhami, O. (2013). Institutional investment horizons and the cost of equity capital. Financial Management, 42(2), 441-477.
Aukiyah, R., and A. Hamzah. (2006). Anallisa Karakteristik Perusahaan, Industri dan Ekonomi Makro Terhadap Return dan Beta Saham Syariah di BEJ. Paper read at Simposium Nasioanal Akuntansi 9 at Padang.
Bahjat, s. and Black B. (1999) The Uncertain Relation between Board Composition and Firm Performance. Business Law, 54, 921-963. Bhagat,
xxx
S., and B. Black.(2002) The non-correlation between board independence and long-term firm performance. Journal of Corporation Law 27 (Winter): 231-274.
Baker, H., and Powell, G. E. (2012). Dividend policy in Indonesia: survey evidence from executives. Journal of Asia Business Studies, 6(1), 79-92.
Bae, J., and Lawler, J. J. (2000). Organizational and HRM strategies in Korea: Impact on firm performance in an emerging economy. Academy of management journal, 43(3), 502-517.
Baños-Caballero, S., García-Teruel, P. J., and Martínez-Solano, P. (2014). Working capital management, corporate performance, and financial constraints. Journal of Business Research, 67(3), 332-338.
Barbosa, N., and H. Louri. (2005). Corporate Performance: Does Ownership Matter? A Comparison of Foreign and Domestic Owned Firm in Greece and Portugal. Review of Industrial Organization 27:73-102.
Barclay, M. J., and C. G. Holderness. (1992). The Law and Large-block Trades. Journal of Law and Economics 35:265-294
Barney, J.B. (1991). Firm Resources and Sustained Competitive Advantage. Journal of Management. Pp 99-120.
Bartel, Ann. (1994). Productivity Gains from the Implementation of Employee Training Programs. Industrial Relations. 33(4): 411-425.
Bartram, S. M., Griffin, J. M., Lim, T. H., and Ng, D. T. (2015). How important are foreign ownership linkages for international stock returns?. The Review of Financial Studies, 28(11), 3036-3072.
Bassi, L., Harrison, P., Ludwig, J., and McMurrer, D. (2004). The impact of US Firms’ investments in human capital on stock prices. unpublished, June.
Bassi, L., Harrison, P., Jens L.ig, and McMurrer, D. (2001). Human Capital Investments and Firm Performance. (www.bassi-investments.com/ downloads/Research Paper_June2001_.pdf).
Bassi, L., and McMurrer, D. (2006). Human capital and organizational performance: Next generation metrics as a catalyst for change. McBassi & Company white paper available online at www. McBassi. com.
xxxi
Bathala, C., and R. Rao. (1995). The Determinant of Board Composition: An Agency Yheory Perspective. Managerial and Decision Economics 5 (16):59-69.
Batten, J. A., and Vo, X. V. (2015). Foreign ownership in emerging stock markets. Journal of Multinational Financial Management, 32, 15-24.
Beasly, M. S. (1996). An Empirical Anaysis of The relation Between the Board of Directors Composition and Financial Statement Fraud. The Accounting Review 71.
Becker, B., Bergstresser, D., and Subramanian, G. (2013). Does shareholder proxy access improvefirm value? evidence from the business roundtable’s challenge. The Journal of Law and Economics, 56(1), 127-160..
Belden, T. Fister, and B. Knapp. (2005). Dividends and Directors : Do Outsiders Reduce Agency Cost? Business and Society Review 102 (2):171-180.
Belkhir, M. (2005). Board Structure, Ownership structure, and Firm performance: Evidence from Banking:http://www.uniy-orleans.fr/deg/GD Recomofi/Activ/belkhir_ strasbg05.pdf.
Bergstrom, C. and K. Rydqvist. (1990. The Determinants of Corporate Ownership, Journal of Banking and Finance. 14: 237–262.
Bena, J., and Hanousek. (2008). Rent Extraction by Large Shareholders: Evidence Using Dividend Policy in the Czech Republic. Journal of Economics and Finance 58 (3-4):106-130.
Bevan. A.A., and J. Danbolt. (2002). Capital structure and its determinants in the UK – a decompositional analysis. Applied Financial Economics, 12 pp.159-170
Bhagat, S., and B. Black.(2001) The non-correlation between board independence and long-term firm performance. Journal of Corporation Law 27 (Winter): 231-274.
Bhagat, S., Black, B., and Blair, M. (2004). Relational Investing And Firm Performance. Journal of Financial Research, 27(1), 1-30.
xxxii
Black, B., and Kim, W. (2012). The Effect Of Board Structure On Firm Value: A Multiple Identification Strategies Approach Using Korean Data. Journal of Financial Economics, 104(1), 203-226.
Black, F., and Scholes, M. (1974). The effects of dividend yield and dividend policy on common stock prices and returns. Journal of financial economics, 1(1), 1-22.
Black, Sandra, and Lisa Lynch. (1996). Human-Capital Investments and Productivity. American Economic Review. 86(2): 263-267.
Black, B., and Kim, W. (2012). The Effect Of Board Structure On Firm Value: A Multiple Identification Strategies Approach Using Korean Data. Journal of Financial Economics, 104(1), 203-226.
Blundell, R., (1999). Human Capital Investment: The Returns from Education and Training to the Individual, the Firm, and the Economy, Fiscal Studies (1999) vol 20.
Bodie, Z., Kane, A., and Marcus, A. J. (2014). Investments, 10e. McGraw-Hill Education.
Bolton, P., Chen, H., & Wang, N. (2013). Market Timing, Investment, And Risk Management. Journal of Financial Economics, 109(1), 40-62.
Bontis, N, Wiliam Chua Chong Keow dan Stanley Richardson. (2000). Intellectual Capital and Business Performance in Malaysian Industries. Journal of Intellectual Capital. Vol 1, No. 1, 85-100.
Bontis, and Fitz-Enz. (2002). Intellectual Capital ROI: A Casual Map of Human Capital Antecedents and Consequents. Journal of Intellectual Capital, 3(3), 223-247.
Bontis, N., & Fitz-Enz, J. (2002). Intellectual Capital ROI: A Causal Map of Human Capital Antecedents and Consequents. Journal of Intellectual capital, 3(3), 223-247.
Bosma, N., Praag, M. V., Thurik, R., & Wit, G. (2004). The Value of Human and Social Capital Investments for the Business Performance of Startups. SmallBusiness Economic, 23, 227-236.
xxxiii
Bos. S., Pendleton.,A and Tom, S. (2011). Governance Thresholds, Managerial Ownership and Corporate Performance: Evidence from the U.K. Working Paper No. 58 ISSN Number: 1743-4041
Boubakri, N. (2006). The Impact of Internal and External Governance on The Agency Cost of Debt: International Evidence URL: http://132.203.59.36/CIRPEE/conf-cirpee/JourneesCIRPEE29-30Sept06/
Boubakri, N., Cosset, J. C., and Saffar, W. (2013). The Role of State and Foreign Owners in Corporate Risk-Taking: Evidence From Privatization. Journal of FinancialEconomics, 108(3), 641-658.
Brealey, R. A., S. C. Myers, and A. J. Marcus. (2008). Dasar-Dasar Manajemen Keuangan Perusahaan. Jakarta: Erlangga.
Brennan, M. J. (1970). Taxes, market valuation and corporate financial policy. National tax journal, 23(4), 417-427.
Brickly, J. A., and C. M. James. (1987). The Takeover Market Corporate Board Composition, and Ownership Structure: The Case of Banking. Journal of Law and Economics 30.
Brigham, E.F. and Daves, P.R. (2007). Intermediate Financial Management. Ninth Edition, Thomson/South-Western.
Brigham, E. F., and J. F. Houston. (2007). Essentials of Financial Management . Singapore: Cengage Learning.
Brigham. E.F., Ehrhardt. M. C. (2014). Financial Management – Theory & Practice – 14th Edition. Publisher: South-Western.
Broussard, J. P., S. A. Buchenroth, and E. A. Filotte. (2004). CEO Incentive, Cash Flow and Investment. Financial Management:51-70.
Brown, L. D., and Caylor, M. L. (2004). Corporate governance and firm performance.
Buck, T., Filatotchev, I., Demina, N., and Wright, M. (2003). Insider Ownership, Human Resource Strategies and Performance in a Transition Economy. Journal of International Business Studies, 34(6), 530-549.
Bushee, B. J., Carter, M. E., and Gerakos, J. (2013). Institutional Investor Preferences For Corporate Governance Mechanisms. Journal of Management Accounting Research, 26(2), 123-149.
xxxiv
Buckley, P. J., and Casson, M. (2016). The Future of The Multinational Enterprise. Springer.
Cadbury, c. (1992). Report of The Committee on The Financial Aspeccts of Corporate Governance. London.
Cai, F., and Ghosh, A. (2003). Tests of Capital Structure Theory: A Binomial Approach. The Journal of Business and Economic Studies, 9(2), 20.
Callen, J. L., and Fang, X. (2013). Institutional Investor Stability and Crash Risk: Monitoring Versus Short-Termism?. Journal of Banking & Finance, 37(8), 3047-3063.
Card, David. (1999. The Causal Effects of Education on Earnings. In Orley Ashenfelter and David
Chan, S. H., Martin, J. D., and Kensinger, J. W. (1990). Corporate Research and Development Expen Ditures and Share Value. Journal of Financial Economics, 26(2), 255-276.
Che Haat, M., Abdul Rahman, R., and Mahenthiran, S. (2008). Corporate Governance, Transparency and Performance of Malaysian Companies. Managerial Auditing Journal, 23(8), 744-778.
Chen, C. J., and Yu, C. M. J. (2012). Managerial Ownership, Diversification, And Firm Performance: Evidence From An Emerging Market. International Business Review, 21(3), 518-534.
Chen. Carl.R, Weiyu Guo, and Vivek Mande, (2006). Corporate Value, Managerial Stockholdings and Investment of Japanese Firms. Journal of International Financial Management and Accounting, 17(1): 29-51.
Chen, C. R., and Steiner, T. L. (1999). Managerial Ownership And Agency Conflicts: A Nonlinear Simultaneous Equation Analysis Of Managerial Ownership, Risk Taking, Debt Policy, And Dividend Policy. Financial Review, 34(1), 119-136.
Chen, C. R., Guo, W., and Mande, V. (2006). Corporate Value, Managerial Stockholdings And Investments Of Japanese Firms. Journal of International Financial Management & Accounting, 17(1), 29-51.
xxxv
Chen, J., and Strange, R. (2006). The Determinants Of Capital Structure: Evidence From Chinese Listed Companies. Economic Change and Restructuring, 38(1), 11-35.
Chen. C.R. and Steiner T.L. (2000)Tobin’s Q, Managerial Ownership, and Analyst Coverage A Nonlinear Simultaneous Equations Model. Journal of Economics and Business 2000; 52:365–382
Chemmanur, T. J., Loutskina, E., and Tian, X. (2014). Corporate Venture Capital, Value Creation, and Innovation. The Review of Financial Studies, 27(8), 2434-2473.
Chen, C. J., and Yu, C. M. J. (2012). Managerial Ownership, Diversification, and Firm Performance: Evidence From an Emerging Market. International Business Review, 21(3), 518-534.
Chen, Z., Du, J., Li, D., and Ouyang, R. (2013). Does Foreign Institutional Ownership Increase Return Volatility? Evidence from China. Journal of Banking & Finance, 37(2), 660-669.
Cho, M.H. (1998): Ownership Structure, Investment, and The Corporate Value: An Empirical Analysis, Journal of Financial Economics, 47(1), 103–121.
Cho, G., and Kim, D. K. (2007). Efficiency Analysis and Ranking Of Major Container Ports in Northeast Asia: An Application of Data Envelopment Analysis. International Review of Business Research Papers, 3(2), 486-503.
Christensen, C. M. (2013). The Innovator's Dilemma: When New Technologies Cause Great Firms to Fail. Harvard Business Review Press.
Chtouron, S. M., J. Bedard, and L. Courteau. (2001). Corporate Governance and Earning Management. Working Paper. The Social Sciences and Humannities Reseach Council of Canada.
Chung, M. F., and J.-b. Kim. (2005). FCF Agency Costs, Earning Management, and Investor Monitoring. Corporate Ownership & Control 2 (4):51-61.
Claessens, A. A., and J. L. Zimmerman. (2000). Expropriation of Minority Shareholders: Evidance from East Asia. Policy Reseach Working Paper The Word Bank 2008.
xxxvi
Claessens, S., and Yurtoglu, B. B. (2013). Corporate Governance In Emerging Markets: A Survey. Emerging markets review, 15, 1-33.
Claude, E., H. C. R., and V. T. E. (1996). Political Risk, Economic Risk, and Financial Risk Finacial Analysis Journal Nov-Dec:29-46.
Clay Dibrell, C., and Miller, T. R. (2002). Organization Design: The Continuing Influence of Information Technology. Management Decision, 40(6), 620-627.
Coles, J.L., Daniel, N.D., and Neveen, L. (2004). Departement of Finance W.P. Carey Scholl of Business Arizona State University, Email: [email protected], Departement of Fianance Robinson College of Business Georgia State University, email: [email protected], and Email: [email protected], Managerial Incentives and Risk Taking.
Coles, J. L., Lemmon, M. L., and Meschke, J. F. (2012). Structural Models and Endogeneity in Corporate Finance: The Link Between Managerial Ownership and Corporate Performance. Journal of Financial Economics, 103(1), 149-168.
Colombo, M. G., Croce, A., and Murtinu, S. (2014). Ownership Structure, Horizontal Agency Costs and The Performance of High-Tech Entrepreneurial Firms. Small Business Economics, 42(2), 265-282.
Corbetta, G., and Salvato, C. (2004). Self‐serving or Self‐actualizing? Models of Man and Agency Costs In Different Types Of Family Firms: A Commentary On “Comparing The Agency Costs Of Family and Non‐Family Firms: Conceptual Issues and Exploratory Evidence. Entrepreneurship Theory and Practice, 28(4), 355-362.
Copeland T.E., Weston J. F. and Shastri. K. (2014). Financial Theory and Corporate Policy. Pearson New International Edition.
Cronqvist, H., and Nilsoson, M. (2003). Agency Costs of Controlling Minority Shareholders, Journal of Financial and Quantitative Analysis, 38(4): 695-714.
Cubbin, J and Leech, D. (1983). The Effect of Shareholding Dispersion on the Degree of Control in British Companies: Theory and Measurement. The Economic Journal, 93: 351-369.
xxxvii
Cui, L., Meyer, K. E., and Hu, H. W. (2014). What Drives Firms’ Intent to Seek Strategic Assets by Foreign Direct Investment? A Study of Emerging Economy Firms. Journal of World Business, 49(4), 488-501.
Cull, R., Li, W., Sun, B., and Xu, L. C. (2015). Government Connections and Financial Constraints: Evidence From A Large Representative Sample of Chinese Firms. Journal of Corporate Finance, 32, 271-294.
Cunat, V., M., and M. Guadalupe (2012). The vote is cast: the effect of corporate governance on shareholder value, The journal of finance, 67(5), 1943–1977.
Dallas, George. (2004). Governance and Risk. Analitytical Hand books for Investors, Managers, Directors and Stakeholders. New York: McGraw Hill.
Dalton, D. R., Daily, C. M., Johnson, J. L., & Ellstrand, A. E. (1998). Number of Directors and Financial Performance: A Meta-Analysis. Academy of Management journal, 42(6), 674-686.
Dam, L., and Scholtens, B. (2013). Ownership Concentration and CSR Policy of European Multinational Enterprises. Journal of Business Ethics, 118(1), 117-126.
Damodaran, Aswath. (2012). Investment Valuation. New Jersey : John Wiley &Sons.
Darmawati, Deni, R.G. Rahayu and Khomsiyah. (2004), Hubungan Corporate Governance dan Kinerja Perusahaan, Simposium Nasonal Akuntansi VII Denpasar Bali.
David E. Guest, (1997). Human Resource Management and Performance: a Review and Research Agenda, The International Journl of Human Resource Management.
David, F. R. (2003). Strategic Management: Concept. edited by N. Edition. New Jersey 07458.: Prentice Hall Upper Saddle River.
Delaney, J. T., and Huselid, M. A. (1996). The Impact of Human Resource Management Practices on Perceptions of Organizational Performance. Academy of Management Journal, 39(4), 949–969.
De Miguel. A., J.Pindando and C. de la Torre. (2004). Ownership Structure and Firm Value: New Evidence from Spain. Strategic Management Journal. 25(12): 1119-207.
xxxviii
Demsetz, H., and K. Lehn. (1985). The Stucture of Corporate Ownership: Causes and Consequencies. Journal Political Economy:1155-1177.
Demsetz, H., and B. Villalonga. (2001). Ownership Structure and Corporate Performance. Journal of Corporate Finance 7:209-233.
Denis, D. J., D. K. Denis, and A. Sarin. (1997). Agency Problem, Equity Ownership Structure on Corporate Diversification Strategies. Strategic Management Journal 20:1071-1076.
Denis, D. K., and J. J. McCornell. (2003). International Corporate Governace”. Journal of Financial and Quantitative Analysis 38:1-36.
Dinga, A.K., Dixon,R and Stratling R, (2009). Ownership Structure and Firm Performance in the UK: Evidence from the Agency Perspective. Working Paper, Durham Business School, University of Durham.
Drakos, A. A. and Bekiris, F. V. (2010). Corporate Performance, Managerial Ownership and Endogeneity: A Simultaneous Equations Analysis for the Athens Stock Exchange. Research in International Business and Finance, 24(1), 24-38.
Dogan, Ergun and Russeli Smyth. (2002). Board Remuneration, Company Performance and Ownership Concentration: Evidance from Publicy Listed Malaysian Companies. ASEAN Economics Bulletin. 19(9):319-347
Dooley, M. P. (2000). A Model of Crises in Emerging Markets. The Economic Journal, 110 (460), 256-272.
Dornbusch, R., S. Fischer, and R. Startz. (2001). Macroeconomics. 8 ed. New York: McGraw-Hill.
Driffield, N., Mahambare, V., and Pal, S. (2007). How Does Ownership Structure Affect Capital Structure And Firm Value? Recent Evidence From East Asia. Economics of Transition, 15(3), 535-573.
Dulewicz, V., and Herbert, P. (2004). Does the Composition and Practice of Boards of Directors Bearany Relationship to The Performance of Their Companies?. Corporate Governance: An International Review, 12(3), 263-280.
xxxix
Dutta, S., and Jog, V. (2004). The Long-Term Performance of Acquiring Firms: A Re-Examination of An Anomaly. Journal of Banking & Finance, 33(8), 1400-1412.
Easterbrook, F. H. (1984). Two Agency-Cost Explanations of Dividends. American Economic Review 74:650-659.
Eisenhardt, K. M. (1985). Control: Organizational and Economic Approaches. Management Science 31 (2):134-149.
__________________ (1989), “Agency Theory: An Assessment and Review”. Academy of Management Journal, 14: 57-74.
Elloumi, F., and J.-P. Gueye. (2001). Financial Distress and Corporate Governance: An Empirical Analysis. Corporate Governance 1 (1):15-23.
Elsevier Choi, J. J., S. W. Park, and S. Sean. (2007). The Value of Outside Director: Evidance from Corporate Governance Reform in Korea. Journal of Financial and Quantitative Analysis 42 (2):941-962.
Fama, E. F. (1980). Agency Problems and Theory of The Firm. Journal of Political Economy 88 (21):288-307.
Fama, E. F., and K. R. French. (2001). Disapearing Dividends: Changing Firm Characteristics or Lower Propensity yo Pay? Journal of Financial Economics 60 (1):3- 44.
Fama, E. F., and M. C. Jensen. (1983). Separation of Ownership and Control. Journal of Law and Economics 26 327-349.
Fang, V. W., Maffett, M., and Zhang, B. (2015). Foreign Institutional Ownership and The Global Convergence of Financial Reporting Practices. Journal of Accounting Research, 53(3), 593-631.
Farrar, D. E., Farrar, D. F., and Selwyn, L. L. (1967). Taxes, Corporate Financial Policy and Return to Investors. National Tax Journal, 20(4), 444-454.
Filatotchev, I. (2006). Effects of Executive Gharacteristics and Venture Gapital Involvement on Board Gomposition and Share Ownership in IPO Firms. British foumal of Management 17: 75-92.
xl
Fisher, M. (1994). Accountancy for The 90’s: The Role of Audit Committee. The Malaysia Accountant:18-21.
Fleisher, B., Li, H., and Zhao, M. Q. (2010). Human capital, economic growth, and regional inequality in China. Journal of Development Economics, 92(2), 215-231.
Francis, J. C. (1988). Management Investment. Second ed. Singapore: McGraw-Hill International Editions Financial Series.
Giroud, X., and H. M. Mueller (2011): Corporate governance, product market competition, and equity prices, The Journal of Finance, 66(2), 563–600.
Garay, U., and González, M. (2008). Corporate Governance and Firm Value: The Case of Venezuela. Corporate Governance: An International Review, 16(3), 194-209.
Gary, R., dan Shiguang, M., (2011). Managerial Ownership, Capital Structure and Firm Value: Evidence From China’s Civilian-Run Firms, Australian Accounting Business and Finance Journal, 5 (3).
Garvey, G. T., and A. Mawani. (2005). Risk Taking Incentive of Executive Stock Option and The Asset subtitution Problem. Accounting and Finance:3-23.
Garza-Gil, M. D., Varela-Lafuente, M. M., Caballero-Miguez, G., and Álvarez-Díaz, M. (2011). Analysing the Profitability of the Spanish Fleet After the Anchovy Moratorium Using Boot Strap Techniques. Ecological Economics, 70(6), 1154-1161.
Greenaway, D., Guariglia, A., and Yu, Z. (2014). The More The Better? Foreign Ownership and Corporate Performance in China. The European Journal of Finance, 20(7-9), 681-702.
Giannetti, M. (2003). Do Better Institutions Mitigate Agency Problem? Evidence from Corporate Finance Choices. Journal of Finance And Quantitative Analysis 38 (1):185-212.
Ghazali, I. (2006). Structural Equation Modelling: Metode Alternatif dengan Partial Least Square. Badan Penerbit Universitas Diponegoro. Semarang
Ghozali, I. (2011). Aplikasi Analisis Multivariate dengan Program IBM SPSS 19. BP Undip. Semarang.
Ghozali, I and Irwansyah. (2002). Analisis Pengaruh Kinerja Keuangan Perusahaan dengan alat ukur EVA, MVA dan ROA Terhadap Return Saham
xli
pada Perusahaan Manufaktur di BEJ. Jurnal Penelitiam Akuntansi-Bisnis dan Manajemen. 9 (1):18-33
Ghazali, I. and Latan, H. (2012). Partial Least Squares: Konsep, Tehnik dan Aplikasi Menggunakan Program SmartPLS 3.0 Untuk Penelitian Empiris. Badan Penerbit Universitas Diponegoro. Semarang
Girma, S., Görg, H., and Pisu, M. (2008). Exporting, Linkages and Productivity Spillovers From Foreign Direct Investment. Canadian Journal of Economics/Revue Canadienne D'économique, 41(1), 320-340.
Goodstein, J., K. Gautam, and W. Boeker. (1994). The Effects of Board Size and Disersity on Strategic Change. Strategic Management Journal 15:241-250.
Grossman, S., and O. Hart. (1980). Takeover Bids, the Free Rider Problem and the Theory of the Corporation. Bell Journal of Economis:42-64.
Gomez‐Mejia, L. R., Campbell, J. T., Martin, G., Hoskisson, R. E., Makri, M., and Sirmon, D. G. (2014). Socioemotional Wealth as a Mixed Gamble: Revisiting Family Firm R&D Investments With the Behavioral Agency Model. Entrepreneurship Theory and Practice, 38(6), 1351-1374.
Goyal, P., Rahman, Z., and Kazmi, A. A. (2013). Corporate Sustainability Performance and Firm Performance Research: Literature Review and Future Research Agenda. Management Decision, 51(2), 361-379.
Grant, R.M. (1991). The Resources Base Theory of Competitive Advantage: Implications for Strategy Formulation. Calicornia Management Review. Vol. 33 (3). Pp. 114-135.
Griliches, Zvi. (1998). R&D and Productivity: The Econometric Evidence. Chicago: University of Chicago Press.
Gujarati, Damodar, N. (2003). Basic Econometrics. Fourth Edisition. International Edition. Mcgraw-Hill. London.
Gunarsih, Tri. (2002). Struktur Corporate Governance dan Kinerja Perusahaan: Pengaruh Struktur Kepemilikan dan Strategi Diversifikasi Terhadap Kinerja Perusahaan. Disertasi, UGM Yogyakarta.
Hackel, K.S. and Livnat, J. (1996). Cash Flow and Security Analysis 2nd Edition. Irwin_McGraw-Hill.
xlii
Haddad, M., and A. Horrison. (1993). Are There Positive Spillovers from Direct Foreign Invbestment?: Evidence from Panel Data for Morocco. Journal of Development Economics 42 (1):71-74.
Hair, J. F., Jr., R. E. Anderson, R. L. Tatham and W. C. Black (1995) Multivariate Data Analysis with Readings, Englewood Cliffs, NJ: Prentice Hall.
Hale, G., and Long, C. (2011). Are There Productivity Spillovers From Foreign Direct Investment in China?. Pacific Economic Review, 16(2), 135-153.
Halim, A., and Sarwoko ( 2013), Manajemen Keuangan. Yogyakarta: BPFE Yogyakarta.
Hambrick, D. C., and Mason, P. A. (1984). Upper Echelons: The Organization as A Reflection of Its Top Managers. Academy of Management Review, 9, 193-206.
Handley, K., and Limao, N. (2015). Trade and investment under policy uncertainty: theory and firm evidence. American Economic Journal: Economic Policy, 7(4), 189-222.
Hansson, B. M. (1997). Personnel Investments and Abnormal Return: Knowledge Based Firms and Human Resource Accounting. Journal of Human Resource Costing and Accounting. Stockholm: PEI – Personnel Economics Institute, , Vol. 2, No 2, p. 9-29.
Hansson, Bo. (2001). “Marketable Human Capital Investments: An Empirical Study of Employer-Sponsored Training.” Stockholm: School of Business. Working paper.
Hansson, Bo, Ulf Johanson, and Karl-Heinz Leitner. (2003). “The Impact of Human Capital and Human Capital Investments on Company Performance: Evidence From Literature and European Survey Results.” Working paper.
Hansson, B. (2007). Company-Based Determinants of Training And The Impact Of Training On Company Performance: Results From An International HRM Survey. Personnel review, 36(2), 311-331
Hansson, B. (2004). Human Capital And Stock Returns: Is The Value Premium an Approximation For Return on Human Capital?. Journal of Business Finance & Accounting, 31(3‐4), 333-358.
xliii
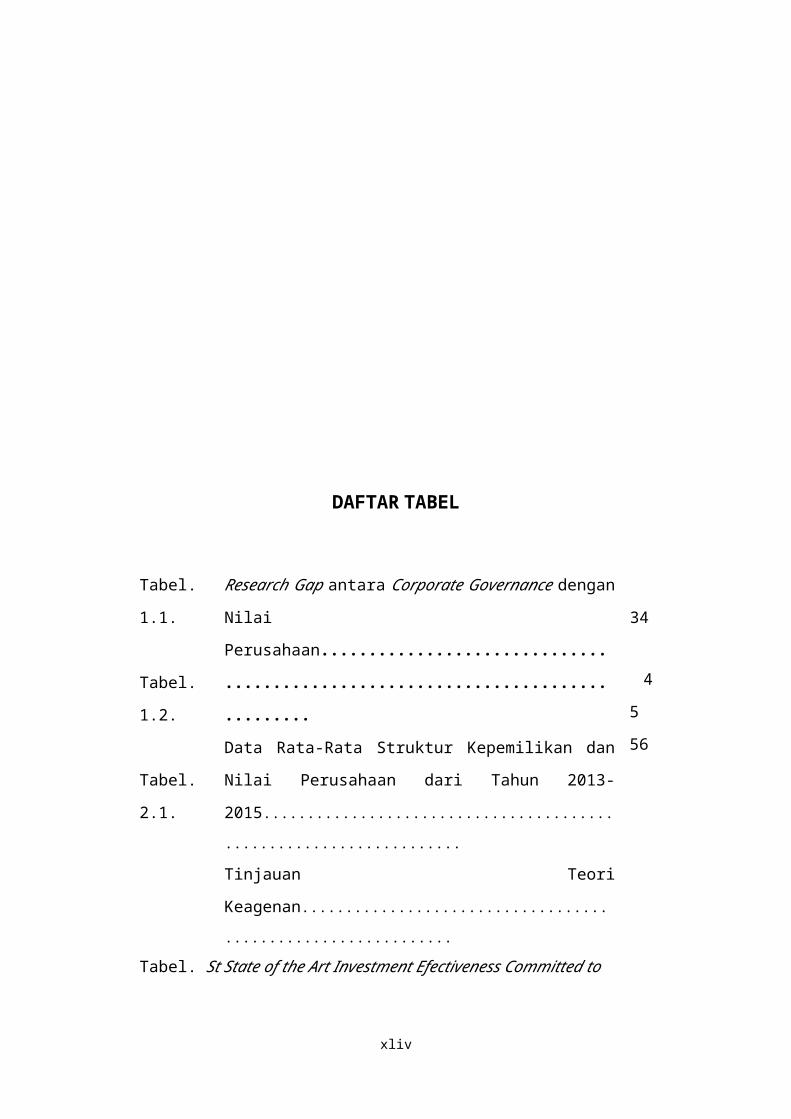
Harford, J., Mansi, S. A., and Maxwell, W. F. (2012). Corporate Governance and Firm Cash Holdings in the US. In Corporate governance (pp. 107-138). Springer Berlin Heidelberg.
Harris, M., and A. Raviv. (1991). Theory of Capital Structure. The Journal of Finance 46:297-355.
Harrison, J. S., and Wicks, A. C. (2013). Stakeholder Theory, Value, and Firm Performance. Business Ethics Quarterly, 23(1), 97-124.
Hartono, J. and Chendrawati. (1999). ROA and EVA: A Comparative Empirical Study. Gadjah Mada Internationala Journal of Business. 1(1):45-54
Hartzell, J. C., and L. T. Starks (2003): Institutional investors and executive compensation, The Journal of Finance, 58(6), 2351–2374.
Haskel, J. E., Pereira, S. C., and Slaughter, M. J. (2007). Does Inward Foreign Direct Investment Boost The Productivity of Domestic Firms?. The Review of Economics and Statistics, 89(3), 482-496.
Hatch, N. W. and J. H. Dyer. (2004). "Human Capital and Learning As a Source of Sustainahle Competitive Advantage." Strategic Management Joumal 25: 1155-1179.
Haugen, and L. Senbet. (1981). Resolving the Agency Problems of External Capital Trough Stock Options. Journal of Finance:629-647.
Hendricks, J. A. (1976). The Impact of Human Resource Accounting Information on Stock Investment Decisions: An empirical study. The accounting review, 51(2), 292-305.
Hermalin, B. E., and Weisbach, M. S. (2010). The Role of Board of Directors in Corporate Governance: A Conceptual Framework and Survey. Journal of Economic Literature,48(1), 58-107.
Herwidayatmo. (2000). Implementasi Corporate Governance Untuk Perusahaan Publik Indonesia. Usahawa 10 (29):25-32.
Hofer, C.W. and Saandberg, W.R. (1978). Inproving New Ventura Perormance: Some Guidelines for Success. American Journal of Small Business. Vol. 12(1). Pp. 11-25.
xliv
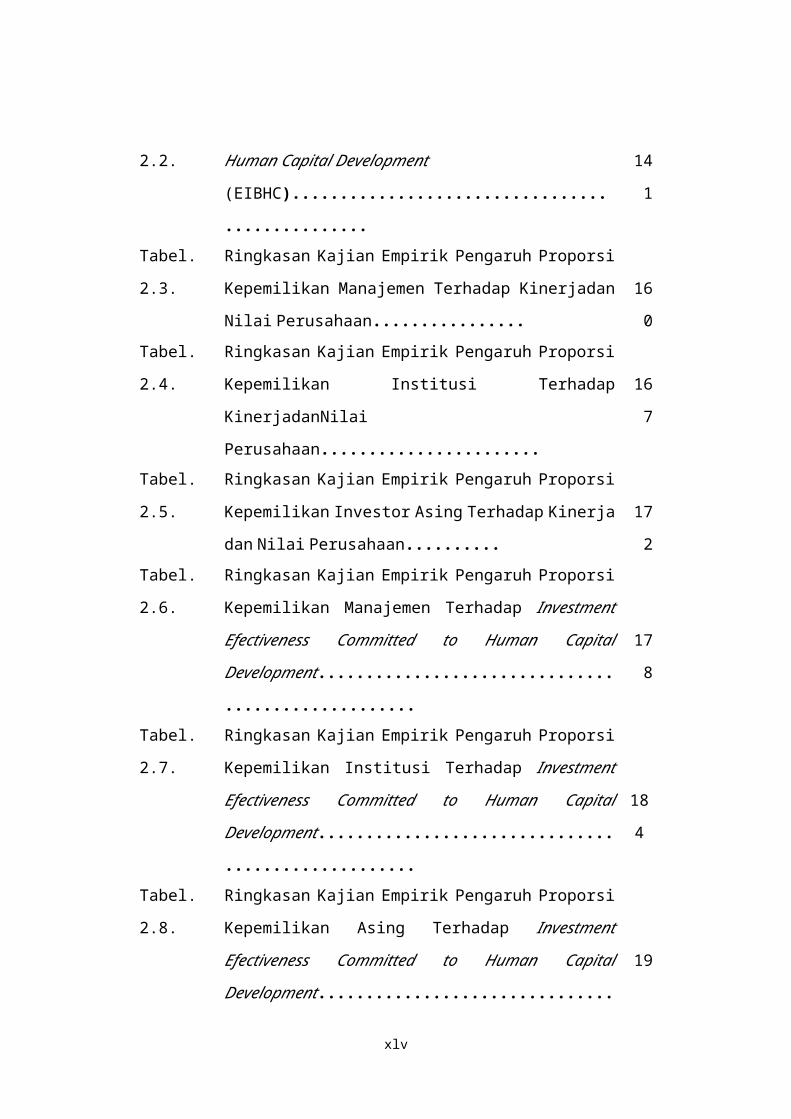
Holmes Jr, R. M., Miller, T., Hitt, M. A., and Salmador, M. P. (2013). The Interrelationships Among Informal Institutions, Formal Institutions, and Inward Foreign Direct Investment. Journal of Management, 39(2), 531-566.
Hoshi, T. (2007). Corporate Governance in Japan: Institutional Change and Organizational Diversity. Oxford, UK: Oxford Univers ity Press, pp.257 -281. August 2007.
Hoskisson, R. E., Wright, M., Filatotchev, I., and Peng, M. W. (2013). Emerging Multinationals From Mid‐Range Economies: The Influence of Institutions and Factor Markets. Journal of Management Studies, 50(7), 1295-1321.
Hsu, I. C., Lin, C. Y. Y., Lawler, J. J., and Wu, S. H. (2007). Toward a Model Of Organizational Human Capital Development: Preliminary Evidence From Taiwan. Asia Pacific Business Review, 13(2), 251-275.
Hu, A., and P. Kumar. (2004). Managerial Entrenchment and Payout Policy. Journal of Financial and Quantitative Analysis 39 (4):759-790.
Huang, R. D., and Shiu, C. Y. (2009). Local Effects of Foreign Ownership in an Emerging Financial Market: Evidence From Qualified Foreign Institutional Investors in Taiwan. Financial Management, 38(3), 567-602.
Hubert, Ooghe and Tine De Langhe. (2002). The Anglo-American Versus the Continental-European Corporate Governance Model: Empirical Evidence of Board Composition in Belgium. European Business Review, 14(6):437-449.
Hu, H. W., and Cui, L. (2014). Outward Foreign Direct Investment of Publicly Listed Firms From China: A Corporate Governance Perspective. International Business Review, 23(4), 750-760.
Hulland, J., Chow, Y. H., Lam, S (1996). “Use of Casual Models and Marketing Research : A review. International Journal of Research in Marketing, 13 pp. 181-197
Hung, K. P., and Chou, C. (2013). The Impact of Open Innovation on Firm Performance: The Moderating Effects of Internal R&D and Environmental Turbulence. Technovation, 33(10), 368-380.
Huselid, Mark. A, (1995). The Impact of Human Resource Management Practice on Turn Over, Productivity, and Corporate Financial Performance, Academy of Management Journal vol.38 No.3, 635-672.
xlv
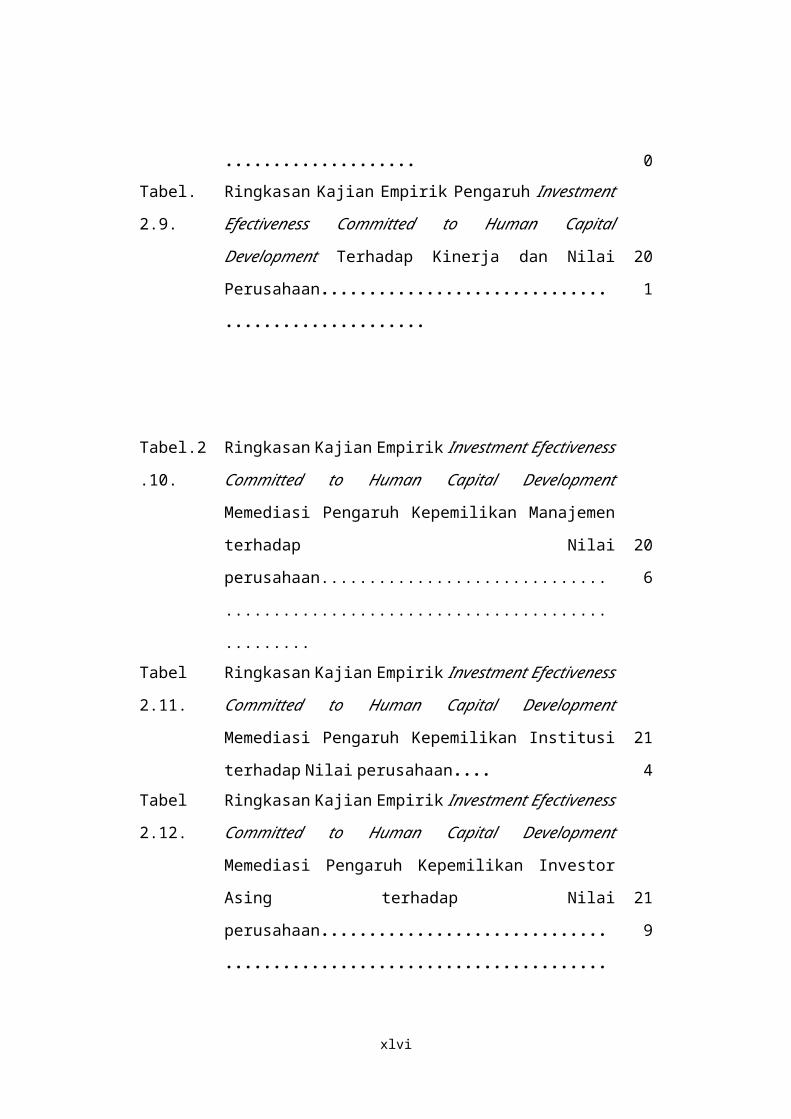
Iturriaga, F. J. L. and Sanz, J.A.R. (2001). Ownership Structure, Corporate Value and Firm Investment: A Spanish Firms Simultaneous Equations Analysis. Journal of Management and Governance, 5: 179–204.
Jackling, B. and Johl, S. (2009). Board Structure and Firm Performance: Evidence from India's Top Companies. Corporate Governance: An International Review, 17(4), 492-509.
Javed, A. Y., and R. Iqbal. (2007). The Relationship Between Corporate Governance Indicators and Firm Value: A Case Study of Karachi Stock Exchange. Working Paper-Pakistan Institute of Development Economics Islamabad:1-22.
Jennings, M. K., and Stoker, L. (2002). Generational Change, Life Cycle Processes, and Social Capital. In Workshop ‘Citizenship on Trial: Interdisciplinary Perspectives on the Political Socialisation of Adolescents’, McGill University, Montreal (pp. 21-22).
Jensen, M. C. (1986). Agency Costs of Free Cash Flow, Corporate Finance, and Takeovers. American Economic Review 76 (2):323-330.
___________(1993). The Modern Industrial Revolution, Exit, and thr Failure of Internal Control System. Journal of Finance 48:225=264.
Jensen, M. C., and W. H. Mecking. (1976). Theory of The Firm: Managerial Behavior, Agency Cost and Ownership Structure. Journal of Financial Economics 3.
Jensen, M. C., and K. J. Murphy. (1990). Performance Pay and Top-Management Incentives. Journal of Political Economy 98:225-264.
Jensen, Gerald R., Donald P Solberg, and Thomas S Zorn. (1992). Simulataneous Determination of Insider Ownership, Debt, dan Deviden Policies. Journal of Financial and Quantitative Analysis. 27(2):247-264
Jones, J. (1991). Earning Management During Import Relief Investigation. Journal of Accounting Research 29 (2):193-228.
Joshi, A., and Hanssens, D. M. (2010). The Direct and Indirect Effects of Advertising Spending on Firm Value. Journal of Marketing, 74(1), 20-33.
xlvi
Juniarti and Sentosa, A.A. (2009). Pengaruh Good Corporate Governance, Voluntary Disclosure terhadap Biaya Hutang (Cost of Debt). Jurnal Akuntansi dan Keuangan. 11(1):1-9
Kabajeh. M. A., AL Nu’aimat, S.M.and Dahmash, F.N. (2012). The Relationship between the ROA, ROE and ROI Ratios with Jordanian Insurance Public Companies Market Share Prices. International Journal of Humanities and Social Science. Vol. 2 No. 11;June.
Kaen, F. R. (2003). A Blueprint for Coprporate Governance: Strategy Accountability, and the Preservation of Shareholder Value. American Management Association.
Kargar, E.F. and Ahmadi, G.R. (2013). The Relationship between Free Cash Flows and Agency Costs Levels: Evidence from Teheran Stock Exchange. Research Journal of Finance and Accounting . Vol.4, No.14, 2013
Kasmir. 2012. Analisis Laporan Keuangan, PT. Raja Grafindo Persada, Jakarta.
Kent Baker, H., and Powell, G. E. (2012). Dividend Policy in Indonesia: Survey Evidence From Executives. Journal of Asia Business Studies, 6(1), 79-92.
Keown, A. J., D. F. Scott, J. W. P. Martin, and J. D. (2005). Financial Management,. 10 vols. New Jer: Prentice-Hall Inc.
Khana, T., and K. Palepu. (2000). Concentrated Corporate Ownership, edited by R. K. Morck.
Khan, W. A., and Vieito, J. P. (2013). CEO Gender And Firm Performance. Journal of Economics and Business, 67, 55-66.
Khouri, R. A., A. Magableh, and H. M. A. ”. (2004). Foreign Ownership and Firm Valuation: An Empirical Investigation. Finance India 18 (2):779-199.
Kim, E. H., and Y. lu (2011). CEO ownership, external governance, and risk-taking, Journal of Financial Economics, 102(2), 272–292.
Klein, A. (2002). Audit Committee, Board of Director Characteristics, and Earnings Management. Journal of accounting and economics, 33(3), 375-400.
KNKG. (2006). Pedoman Good Corporate Governance Indonesia.
xlvii
Koh, P. S., Qian, C., and Wang, H. (2014). Firm Litigation Risk and the Insurance Value of Corporate Social Performance. Strategic Management Journal, 35(10), 1464-1482.
Kole, S. (1996). Managerial ownership and firm performance: incentives or rewards?, Advances in Financial Economics, 2.
Kumar, P., and Zattoni, A. (2014). Ownership, Managerial Entrenchment, and Corporate Performance. Corporate Governance: An International Review, 22(1), 1-3.
Kusuma, H., and E. Susanto. (2004). Efektifitas Mekanisme Bonding: Kasus Perusahaan-Perusahaan yang Dikontrol Komisaris Independen. Jurnal Akuntansi dan Auditing Indonesia 8 (1):23-41.
Kym, H. G., and Moon, Y. J. (2006). A Model for the Value of Intellectual Capital. Canadian Journal of Administrative Sciences, 23(3), 253-269.
La Porta, Rafael, F. Lpoez-De-Silanes, and A. Shleifer, (1999. Corporate Ownership Around the World. Journal of Finance. 54(2): 471-517.
Lee, R. (2008). Networks, Communication and Learning During Business Start-Up: The Creation of Cognitive Social Capital. International Small Business Journal, 26(5), 559-594.
Lee, T.-S., and Y.-H. Yeh. (2004). Corporate Govenance and Fiancial Distress: Evidance from Taiwan. Corporate Govenance: An International Review 12 (3):378-388.
Leech, D., and J. Leahy. (1991). Ownership Structure, Control Type Classifisications and the Performance of Large British Companies. The Economics Journal 101:1418-1437.
Leland, H.E. and D.H. Pyle. (1977), Informational Asymmetries, Financial Structure and Financial Intermediation, Journal of Finance. 32(2): 371–387.
Lepak, David P, (1999). The Human Resource Architecture, Toward a Theory of Human Capital Allocation and Development , Academic of Management Review, Vol.24 No.1 Pg.36-38.
Liangliang, H., Kai, L., and Li, S. (2006). Managerial Ownership and Firm Value: Empirical Evi-dence Based on the Convergence of Interest Effects and the Entrenchment Effects [J]. Nankai Business Review, 4, 006.
xlviii
Lilienfeld‐Toal, U. V., and Ruenzi, S. (2014). CEO Ownership, Stock Market Performance, and Managerial Discretion. The Journal of Finance, 69(3), 1013-1050.
Lin, C., Ma, Y., Malatesta, P., and Xuan, Y. (2011). Ownership Structure and the Cost of corporate borrowing. Journal of Financial Economics, 100(1), 1-23.
Lins, K. V. (2003). Equity Ownership and Firm Value in Emerging Markets. Journal of Financial and Quantitative Analysis 38:159-235.
Lins, K. V., and F. E. Warnock. (2004). Corovernance and Shareholder Base. In Intrnational Finance. Discussion Papers.
Lin, S. Y. (1996) Financial Institutions Investment in Malaysian Bonds: Demands, Opportunities and Key Issues. Presentation Paper of the Conference on Ringgit Bond Market Trust: Institutional Investors’ Role and Perspectives, 1 October 1996, Kuala Lumpur.
Liu, C., Uchida, K., and Yang, Y. (2012). Corporate Governance and Firm Value During the Global Financial Crisis: Evidence from China. International Review of Financial Analysis,21, 70-80.
Lloyd, W. P., Modani, N. K., and Hand, J. H. (1987). The Effect of the Degree of Ownership Control on Firm Diversification, Market Value, and Merger Activity. Journal of Business Research, 15(4): 303-312. http://dx.doi.org/10.1016/0148-2963(87)90002-6
Loderer, C., and Martin, K. (1997). Executive Stock Ownership and Performance Tracking Faint Traces. Journal of Financial Economics, 45(2), 223-255.
Lyau, Nyan-Myau, and David Pucel. (1995). “Economic Return on Training Investment at the Organizational Level.” Performance Improvement Quarterly 8(3).
Luckerath-Rovers, M. (2013). Women on Boards and Firm Performance. Journal of Management & Governance, 17(2), 491-509.
Lumpkin, G. G. and Dess, G. T. (2005). The Role of Entrepreneurial Orientation in Stimulating Effective Corporate Entrepreneurship. Academy of Management Executive, 19(1), 147–156.
xlix
Lundstrum, Leonard. L. (2009). Entrenched Management, Capital Structure Changes and Firm Value. Journal Economoc Finance, 33:161–175.
Madura, J. (2001). Introduction to Business. Second ed. Singapore: South-Western College Publising.
Mahawartha, P. A., and J. Hartono. (2002). Uji Teori Keagenan dalam Hubungan Interdependensi antara Kebijakan Utang dengan Kebijakan Dividen. Simposium Nasional Akuntansi. Universitas Diponegoro Semarang.
Maimunah, I. and Lawrence, A. (2008). Workforce Diversity: A Human Resource Development Perspective Towards Organizational Performance. European Journal of Social Sciences. 6(2), 244-25
Makhija, A. K., and M. Spiro. (2000). Owership Structure as a Determinant of Firm Value: Evidance from Newly Privatized Czech Firm. The Financial Review 41:1-32.
Makkonen, H., Pohjola, M., Olkkonen, R., and Koponen, A. (2014). Dynamic Capabilities and Firm Performance in a Financial Crisis. Journal of Business Research, 67(1), 2707-2719.
Mandaci,P.E and Gumus, G.K, (2010). Ownership Concentration, Managerial Ownership and Firm Performance: Evidence from Turkey. South East European Journal of Economics & Business (1840118X), pp.57-66.
Mankiw, N. G. (2007). Macroeconomics. 6th ed. New York: Worth Publishers.
Mankiw, N. G. (2015). Principles of Economics (7 ed.). Singapore: CENGAGE Learning.
Marchica, M. T., and Mura, R. (2010). Financial Flexibility, Investment ability, and Firm Value: Evidence From Firms with Spare Debt Capacity. Financial management, 39(4), 1339-1365.
Mao, C. X. (2003). Interaction of Debt Agency Problems and Optimal Capital Structure: Theory and evidence. Journal of Financial and quantitative Analysis, 38(2), 399-423.
Masulis, R. W., Wang, C., and Xie, F. (2012). Globalizing the Boardroom—The Effects of Foreign Directors on Corporate Governance and Firm Performance. Journal of Accounting and Economics, 53(3), 527-554.
Masulis, R. (1988). The Debt/Equity Choice: Ballinger Publishing Company.
l
Mann, S. V., and Sicherman, N. W. (1991). The Agency Costs of Free Cash Flow: Acquisition Activity and Equity Issues. Journal of Business, 213-227.
Marrakchi Chtourou, S., Bedard, J., & Courteau, L. (2001). Corporate Governance and Earnings Management.
Margaritis, D. and Psillaki, M. (2010). Capital Structure, Equity Ownership and Firm Performance. Journal of Banking & Finance, 34(3), 621-632
Marimuthu. M., Arokiasamy, L., Ismail, M., (2009). Human Capital Development and its Impact on Firm Performance : Evidence From Developmental Ecomonics, Journal of International Social Research Vol 2/8 Summer 2009.
Mayo, A. (2000). The Role of Employee Development in the Growth of Intellectual Capital. Personel Review, 29(4), 521-533.
McConnell, J. J., and Muscarella, C. J. (1985). Corporate Capital Expenditure Decisions and the Market Value of the Firm. Journal of financial economics, 14(3), 399-422.
McCahery, J. A., Sautner, Z., and Starks, L. T. (2016). Behind the Scenes: The Corporate Governance Preferences of Institutional Investors. The Journal of Finance, 71(6), 2905-2932.
McEachern, W. A. (2001). Economics: A Contemporary Introduction. South-Westrn College Publishing.
Megginson, W. (1997). Corporate Finance Theory: Addison Wesley Educational Publisher.
Mendelson, E. (1997). Introduction to Mathematical Logic, Fourt Edition, Chapman & Hall.
Miller, M. H. (1977). Debt and taxes. The Journal of Finance, 32(2), 261-275.
Miller. M. and MM. Holes. (1982). Executive Compensatmn, Taxes and Incentives. in: W.F. Sharpe and C.M. Cootner. eds.. Financial economics: Essays in honor of Paul Cootner (Prentice-Hall. Engleuood Cliffs. NJ).
Mitton. (2002). A Cross Firm Analisys of The Impact of Corporate Governance on The East Asian Finacial Crisis. Journal of Financial Economics:1-31.
li
Moldigliani, F., and M. Miller. (1963). Corporate Income Taxes and The Cost of Capital: A Correction. American Economic Review 53:433-443.
Morck, R., A. Shleifer, and R. W. Vinshy. (1988). Management Ownership and Market Valuation An Empirical Analysis. Jornal of Fianacial Economics 20:293-315.
Morgan, G., and Thomas, S. (1998). Taxes, Dividend Yields and Returns in the UK Equity Market. Journal of Banking & Finance, 22(4), 405-423.
M., Seng, D., and Whiting, R. H. (2010). Intellectual Capital and Firm Performance in Australia. Working paper series no 12. Department of Accountancy and Business Law, University of Otago.
Muhammad, N. M. N. and Ismail, M. K. A. (2009). Intellectual Capital Efficiency and Firm's Performance: Study on Malaysian Financial Sectors. International Journalof Economics and Finance, 1(2), 206-212.
Mura, R. (2007). Firm Performance: Do Non-Executive Directors Have Minds of their Own? Evidence from UK Panei Data. Financial Management. Autumn 2007, p. 81 -112
Murni, Y. (2015). The influence of managerial ownership,institutional ownership and voluntarydisclosure on financial performance and its implication on The corporate value. International Journal of Business and Management Invention .Vol. 4 Issue 5.P-52-64.
Muttakhidah. R.I. (2015). Logika Matematika, Dialektika Dan Teknik Pengambilan Simpulan. Jurnal Inovasi Pendidikan Dan Pembelajaran Matematika. Volume 1, Nomor 1.
Myers, S. C. (1976). Determinants of Corporate Borrowing. Journal of financial economics, 5(2), 147-175.
Myers, S. C. (1984). The Capital Structure Puzzle. The Journal of Finance, 39(3), 574-592.
Myers, S. C., and Majluf, N. S. (1984). Corporate Financing and Investment Decisions when Firms Have Information That Investors Do Not Have. Journal of Financial Economics, 13(2), 187-221.
lii
Nalbantian, H. R. and Szostak, A. (2004). How Fleet Bank Fought Employee Flight. Harvard Business Review, 116-125.
Nieuwerburgh, S., F. Buelens, and L. Cuyvers. (2005). Stock Market Development and Economic Growth in Belgium. In Working Paper. New York: New York University Stern School of Business Suite 9-120, 44 West Fourth Street New York. NY 10012 and University of Antwerp.
Nikolov, B., and Whited, T. M. (2014). Agency Conflicts and Cash: Estimates From a Dynamic Model. The Journal of Finance, 69(5), 1883-1921.
Nini, G., Smith, D. C., and Sufi, A. (2012). Creditor Control Rights, Corporate Governance, and Firm Value. The Review of Financial Studies, 25(6), 1713-1761.
Noe, R. A., Hollenbeck, J. R., Gerhart, B., and Wright, P. M. (2003). Human Resource Management: Gaining a Competitive Advantage (4th ed.). Boston: McGraw-Hill.
Noe, R. A., Colquitt, J. A., Simmering, M. J., and Alvarez, S. A. (2003). Developing Intellectual and Social Capital. The Organizational Frontiers Series, 209.
Noe, T. H., Rebello, M. J., and Wang, J. (2003). Corporate Financing: An Artificial Agent‐Based Analysis. The Journal of Finance, 58(3), 943-973.
Nurhan, A., M. Saim, and A. Yalama. (2007). Foreign Ownership and Firm Performance from Turkey. International Research Journal of Financial and Economics 11:103-111.
OECD. (1988). Corporate Governance: Improving Competitiveness and Acces to Control in Global Market OECD Report.
OECD. (1999). Human Capital Investment: An International Comparison. Paris.
OECD (2012), Survei OECD Perekonomian Indonesia September 2012
OECD (2015), Principles of Corporate Governance, OECD Publishing, Paris. http://dx.doi.org/10.1787/9789264236882-en
Ojo, O. D. (2010). Open and Distance Learning as a Strategy for Human Capital Development: Issues and Challenges. Malaysian Journal of Distance Education, 12(2), 53-59.
liii
Ongore, V. O., and Kusa, G. B. (2013). Determinants of Financial Performance of Commercial Banks in Kenya. International Journal of Economics and Financial Issues, 3(1), 237.
OpenStax College. (2014). Principles of Macroeconomics.Taxas: OpenStax College.
Pan, Y., Teng, L., Supapol, A. B., Lu, X., Huang, D., and Wang, Z. (2014). Firms’ FDI ownership: The Influence of Government Ownership and Legislative Connections. Journal of International Business Studies, 45(8), 1029-1043.
Pao, H. T., and Yao, Yu Chih. (2005). Comparison of Linear and Nonlinear Models for Panel Data Forecasting: Debt Policy in Taiwan. Review of Pacific Basin Financial Markets and Policies, 8(3), pp.525–541.
Pathan, S., and Faff, R. (2013). Does Board Structure in Banks Really Affect Their Performance?. Journal of Banking & Finance, 37(5), 1573-1589.
Patel, P. C., and Chrisman, J. J. (2014). Risk Abatement as a Strategy for R&D Investments in Family Firms. Strategic Management Journal, 35(4), 617-627.
Pawlina, G., and Renneboog, L. (2005). Is Investment-Cash Flow Sensitivity Caused by Agency Costs or Asymmetric Information? Evidence from the UK. European Financial Management, 11(4), pp.483–513.
Peasnell, K. V., Pope, P. F., and Young, S. (2001). The Characteristics of Firms Subject to Adverserulings by the Financial Reporting Review Panel. Accounting and Business Research, 31 (4), 291-311.
Penrose, E. T. (1951). The Economics of the International Patent System, Baltimore, The Johns Hopkins Press.
Penrose. (1959). Profit Sharing Between Producing Countries and Oil Companies in the Medlleeast. Economic Journal, 69, pp.238–254.
Penrose, E.T. (1959). Theory of Goeth of the Firm. New York, NY: Wiley
Peter, K. S., Svejnar, J., and Terrell, K. (2012). Foreign Investment, Corporate Ownership, and Development: Are Firms in Emerging Markets Catching Up
liv
To the World Standard?. Review of Economics and Statistics, 94(4), 981-999.
Pettit, R. R., and Westerfield, R. (1974). Using the capital Asset Pricing Model and the Market Model to Predict Security Returns. Journal of Financial and Quantitative Analysis, 9(4), 579-605.
Pindado, J., and De La Torre, C. (2011). Capital structure: New Evidence From the Ownership Structure. International Review of Finance, 11(2), 213-226.
Porta, R. L., F. L. d. Silanes, A. Shleifer, and R. Vishny. (1999). Corporate Governance Around The World. Journal of Finance 52 (2):417-517.
Pulic, A. (1998). “Measuring the Performance of Intellectual Potential in Knowledge Economy”. Paper presented at the 2nd McMaster Word Congress on Measuring and Managing Intellectual Capital by the Austrian Team for Intellectual Potential.
Rachmawati, A., and H. Triatmoko. (2007). Analisis Faktor-faktor yang Mempengaruhi Kualitas Laba dan Nilai Perusahaan. Paper read at SNA 10, at Makasar.
Rajan, R., and L. Zingales. (1998). Power in a Theory of the Firm. Quarterly Journal of Economics CXIII, pp.387–432.
Ramani, G., and Kumar, V. (2008). Interaction Orientation and Firm Performance. Journal of marketing, 72(1), 27-45.
Ramasamy, B., Yeung, M., and Laforet, S. (2012). China's Outward Foreign Direct Investment: Location Choice and Firm Ownership. Journal of world business, 47(1), 17-25.
Rao, S. M. (1996). The Effect of Published Reports of Environmental Pollution on Stock Prices. Journal of Financial and Strategic Decisions, 9(1), 25-32.
Rastogi, P.N. (2002). Sustaining Enterprise Competitiveness is Human Capital the Answer. Human System Management. 19(3), 193-203.
Reddy, K., Locke, S., Scrimgeour, and Frank. (2010). The Efficacy of Principle-Based Corporate Governance Practices and firm financial Performance an Empirical Investigation. International Journal of Managerial Finance 6 (3):190-219.
lv
Riahi‐Belkaoui, A. (1999). Productivity, Profitability, and Firm Value. Journal of International Financial Management & Accounting, 10(3), 188-201.
Ritter. (2004). Economic Growth and Equity Return. University of Florida Gainessville FL 32611-7168.
Riyanto, Bambang. (2010). Dasar-Dasar Pembelanjaan Perusahaan, Edisi Keempat, Cetakan ke sepuluh, Penerbit BPFE, Yogyakarta.
Roberts, D.J., and Steen, V.E. (2000). Shareholder Interests, Human Capital Investment and Corporate Governance. April 30, 2000. Stanford GSB Working Paper No. 1631
Roos, J., Goran R, Nocola C. D., and Leif E. (1997), Intellectual Capital Navigating The New Business Landscape, London; MacMillan Press Ltd.
Ross, S. A. (1977). The Determination of Financial Structure: The Incentive-Signalling Approach. The bell journal of economics, 23-40.
Rouf, A., and Harun, A. A. (2011). Ownership Structure and Voluntary Disclosure in Annual Reports of Bangladesh. Pakistan Journal of Commerce & Social Sciences, 5(1).
Rozeff, M. S. (1982). Growth, Beta and Agency Costs as Determinants of Dividend Payout Ratios. Journal of financial Research, 5(3), 249-259.
Rupert, Booth. (1998). The Measurement of Intellectual Capital, Management Accounting. (Nov), Vol. 76, page 26-28
Rustiarini, N. W. (2011). Pengaruh Struktur Kepemilikan Saham pada Pengungkapan Corporate Social Responsibility. Jurnal Ilmiah Akuntansi dan Bisnis, 6(1).
Ryu, K., and Yoo, J. (2011). Relationship Between Management Ownership and Firm Value Among the Business Group Affiliated Firms in Korea. Journal of Comparative Economics, 39(4), 557-576.
Sawalu, R. O., A. T. Olufemi, and Y. D. Olalekan. (2012). Financial Policy and Corporate Performance: An Empirical Analysis of Nigerian Listed Companies. International Journal of Economics and Finance 4 (4):175-181.
lvi
Sawarjuwono, T. and Agustine, P.K. (2003). Intellectual Capital: Perlakuan, Pengukuran dan Pelaporan . Jurnal Akuntansi dan Keuangan. Vol 5, No. 1, 31-51.
Sawir, A. (2005). Analisis Kinerja Keuangan dan Perencanaan Keuangan Perusahaan. PT Gramedia Pustaka, Jakarta.
Sayilgan, G., Karabacak, H., and Küçükkocaoğlu, G. (2006). The Firm-Specific Determinants of Corporate Capital Structure: Evidence from Turkish Panel Data. Investment Management and Financial Innovations, 3(3), 125-139.
Schultz, T.W. (1993). The Economic Importance of Human Capital in Modernization. Education Economics, 1(1), 13-19.
Schnieders, S., Vergauwen, P., & Bollen, L. (2005). Linking IC and Intellectual Property to Company Performance. Management Decision, 43(9), 1161-1185.
Scott, W R. (2000). Financial Accounting Theory. Hall Inc,2nd Edition.
Selarka, E. (2005). Ownership Consentration and Firm Value, A Study From The India Corporate Sector. Emerging Market Finance and Trade 41 (6):83-108.
Selvarajan, T. T., Ramamoorthy, N., Flood, P. C., Guthrie, J. P., MacCurtain, S., & Liu, W. (2007). The Role of Human Capital Philosophy in Promoting Firm Innovativeness and Performance: Test of a Causal Model. International Journal of Human Resource Management, 18(8), 1456-1470.
Servaes, H., and Tamayo, A. (2013). The Impact of Corporate Social Responsibility on Firm Value: The Role of Customer Awareness. Management Science, 59(5), 1045-1061
Sevilir, M. (2010). Human Capital Investment, New Firm Creation and Venture Capital. Journal of Financial Intermediation, 19(4), 483-508.
Sharabati, A. A., Jawad, S. N. and Bontis, N.(2010). Intellectual capital and business performance in the pharmaceutical sector of Jordan. Management Decision Vol. 48 No. 1, pp. 105-131
Shiader, R. and D. S. Siegel. (2007). Assessing die Relationship between Human Capital and Firm Performance: Evidence from Technology-Based New Ventures. Entrepreneurship Theoiy and Practice 31: 893-9
lvii
Shin, G. H. (2008). The Profitability of Asset Sales as An Explanation of Asset Divestitures. Pacific Basin Finance Journal, 16(5), 555-571.
Shin, H. H., and R. M. Stulz. (2000). Firm Value, Risk, and Growth Opportunities. 1050 Massachusetts Avenue Cambridge, MA 02138: National Bureau of Economic Research : http://www.nber.org/-papers/w2808.
Shroff, N., Verdi, R. S., and Yu, G. (2013). Information Environment and The Investment Decisions of Multinational Corporations. The Accounting Review, 89(2), 759-790.
Shleifer, A., and R. W. Vishny. (1986). Large Shareholders and Corporate Control. Journal of Political Economy 94:461-488.
Shleifer, A., and R. W. Vishny. (1997). A Survey of Corporate Governance. Journal of Finance. 52:737-783.
Shleifer, A., and Vishny, R. W. (1986). Large Shareholders and Corporate Control. Journal of Political Economy, 94(3, Part 1), 461-488.
Shroff, N., Verdi, R. S., and Yu, G. (2013). Information Environment and the Investment Decisions of Multinational Corporations. The Accounting Review, 89(2), 759-790.
Simoneti, M., Damijan,J.P., and Gregoric, A. (2004). Does Ownership pay? The Efficiency of Managerial Ownership in Slovenian Post-Privatization Period. ECGI - Finance Working Paper. No. 38/2004.
Sircar, S., Turnbow, J. L., & Bordoloi, B. (2000). A Framework for Assessing The Relationship Between Information Technology Investments and Firm Performance. Journal of Management Information Systems, 16(4), 69-97.
Siti Zubaudah, 2004. Analisis Pengaruh Tingkat Inflasi, Perubahan Nilai Kurs Terhadap Beta Saham Syariah pada perusahaan yang Terdaftar di Jakarta Islamc Index (JII), UMM, Magelang.
Sheng, S., Zhou, K. Z., and Li, J. J. (2011). The Effects of Business and Political Ties on Firm Performance: Evidence from China. Journal of Marketing, 75(1), 1-15.
lviii
Slovin, M. B., and M. E. Sushka. (1993). Ownership Concentration, Corporate Control Activity, and Firm Value: Evidance from the Death of Side blockholders. The Journal of Finance 48 (4):1293-1321.
Smith, Adam. 1776 (1981). An Inquiry into the Nature and Causes of the Wealth of Nations, Volumes I and II. R. H. Campbell and A. S. Skinner, eds. Liberty Fund: Indianopolis.
Smith, C.W.Jr. and J. Warner. (1979). "On Financial Contracting: An Analysis of Bond Covenants." Journal of Financial Economics , pp. 117-161.
Smith Jr, C. W., and Watts, R. L. (1992). The Investment Opportunity Set and Corporate Financing, Dividend, and Compensation Policies. Journal of Financial Economics, 32(3), 263-292.
Smith, P. (1996). Executing Executions: Aesthetics, Identity, and the Problematic Narratives of Capital Punishment Ritual. Theory and Society, 25(2), 235-261.
Snell, Scott A and Dean, James W.,(1992). Integrated Manufacturing and Human Resource Management : A Human Capital Perspective. The Academy of Management Journal Vol.35. No.3 pp.467-504.
Snell, S.A., Lepak, D.P. and Youndt, M.A., (1999). Managing the Architecture of Intellectual Capital: Implications for Strategic Human Resource Management. In G.R. Ferris (ed.), Research in Personnel and Human Resources Management, Special Supplement, JAI Press, 175-193.
Spence, Michael. (1976). “Competition in Salaries, Credentials, and Signaling Prerequisites for Jobs.” Quarterly Journal of Economics. 90(1): 51-74.
Spender, J. C. (1996). "Making Knowledge the Basis of a Dynamic Theory of the Firm. Strategic Management Journal 17: 45-62
Streukens, S. , Wetzels, M. , Daryanto, A. and de Ruyter, K (2010), “Analyzing factorial data using PLS: application in an online complaining context”, in Esposito Vinzi, V. , Chin, W.W. , Henseler, J. and Wang, H. (Eds), Handbook of Partial Least Squares: Concepts, Methods and Applications , Springer, Heidelberg, Dordrecht, London and New York, NY, pp. 567-587
Syakroza, A. (2003). Teori Corporate Governance. Usahawan 8.
lix
Sudjono. (2002). Analisis Keseimbangan dan Hubungan Simultan Antara Varibel Ekonomi Makro Terhadap Indeks Harga Saham di BEJ dengan Metode VAR (Vector Autoregression) dan ECM (Eror Correction Model). Jurnal Riset Ekonomi dan Manajemen 3:81-97.
Sugeng, B. (2009). Pengaruh Struktur Kepemilikan dan Struktur Modal Terhadap Kebijakan Inisiasi Dividen di Indonesia. Jurnal Ekonomi Bisnis, 14(1), 37-48.
Sundaramurthy, C., and Lewis, M. (2003). Control and Collaboration: Paradoxes of Governance. Academy of management review, 28(3), 397-415.
Supanvanij, J., and Strauss, J. (2006). The Effects of Management Compensation on Firm Hedging: Does SFAS 133 Matter? Journal of Multinational Financial Management, 16(5), 475-493.
Suranta, E. and Pratana P.M. (2004). “Income Smoothing, Tobin’s Q, Agency Problems dan Kinerja Perusahaan”. Makalah Disampaikan dalam Simposium Nasional Akuntansi VII. Bali, 2 – 3 Desember.
Surroca, J., Tribo, J. A. and Waddock, S. (2010). Corporate Responsibility and Financial Performance: The Role of Intangible Resources. Strategic Management Journal, 31, 1-28.
Susanto. A.B. (2007). A Strategic Management Approach, CSR. Jakarta:The Jakarta Consulting Group.
Tambe, P. (2014). Big Data Investment, Skills, and Firm Value. Management Science, 60(6), 1452-1469.
Tandelilin., E. (1997). Determinant of Systemic Risk: The Experience of Some Indonesian Common Stock. Kelola. Gadjah Mada University Business Review 6 (6).
Teece, D. J. (2014). The Foundations of Enterprise Performance: Dynamic and Ordinary Capabilities in an (Economic) Theory of Firms. The Academy of Management Perspectives, 28(4), 328-352.
Thomas H, B., P. Bromiley, and M. Hendrickx. (2000). The Free Cash Flow Hypothesis for Sales Growth and Firm Performance. Strategic Management Journal 21 (4):455-472.
lx
Thomsen, S., Pedersen, T., and Kvist, H. K. (2006). Blockholder ownership: Effects on Firm Value in Market and Control Based Governance Systems. Journal of Corporate finance, 12(2), 246-269.
Titman, S., and Wessels, R. (1988). The Determinants of Capital Structure Choice. Journal of Finance, XLIII(1), pp.1–19.
Tong, G., and Green, C. J. (2005). Pecking Order or Trade-off Hypothesis? Evidence on the Capital Structure of Chinese companies. Applied Economics, 37(19), 2179-2189.
Uchida, K. (2006). Costs of Debt and the Relationship Between Firm Performance and Managerial Ownership: Evidence from Japan, Faculty of Economics and Business Administration,, University of Kitakyushu, Kitagata, Kokuraminamiku, Kitakyushu 802-8577 JAPAN, E-mail address: [email protected] jp.
Ukenna S., Ijeoma N., Anionwu C. and Olise M. C., (2010). Effect of Investment in Human Capital Development on Organizational Performance: Empirical Examination of the Perception of Small Business Owners in Nigeria. European Journal of Economics, Finance and Administrative Sciences, 26, 93-107.
UNITED NATIONS, (2010) Corporate Governance in the Wake of the Financial Crisis.New York and Geneva, 2010.
Utama, S. (2006). Audit Committee Composition Composition, Control of Mayority Shareholders and Their Impact on Audit Committee Effectiveness: Indonesia Evidance. Jurnal Riset Akuntansi Indonesia 9 (1).
Utama, S., & Santosa, A. Y. B. (1998). Kaitan antara Rasio Price/Book Value dan Imbal Hasil Saham pada Bursa Efek Jakarta. Jurnal Riset Akuntansi Indonesia, 1(1), pp.27–140.
Van Der Heijden, H., and Garn, W. (2013). Profitability in the Car Industry: New Measures for Estimating Targets and Target Directions. European Journal of Operational Research, 225(3), pp.420–428.
Van Triest, S. (2005). Customer Size and Customer Profitability in Non-Contractual Relationships. Journal of Business & Industrial Marketing, 20(3), 148-155.
lxi
Velnampy, T. (2013). Corporate Governance and Firm Performance: A Study of Sri Lankan Manufacturing Companies. Journal of Economics and Sustainable Development Vol. 4 (3), 228-235.
Villaonga, B., and R. Amit. (2006). How do Family Ownership, Control, Management, Affect Firn Value?. Journal of Accaouting and Economics 80:385-417.
Vintila, G., and S. C. Gherghina. (2012). An Empirical Examination of the Relationship between Corporate Governance Ratings and Listed Companies’ Performance. International Journal of Business and Management. 7 (22).
Vo, D. H., and Nguyen, V. T. Y. (2014). Managerial Ownership, Leverage and Dividend Policies: Empirical Evidence From Vietnam’s Listed Firms. International Journal of Economics and Finance, 6(5), 274.
Waddock, S. and Graves, S. (1997). Quality of Management and Quality of Stakeholder Relations. Business and Society Review, 36: 250-279.
Wahba, H. (2014). Capital Structure, Managerial Ownership and Firm Performance: Evidence From Egypt. Journal of Management & Governance, 18(4), 1041-1061.
Wang, Zong-Jun and Deng, Xiao-Lan. (2006). Corporate Governance and Financial Distress Evidance from China Listed Companies. The Chinese Economy. 39(5):5-27.
Wang, D. (2006). Founding Family Ownership and Earning Quality. Journal of Accounting Research.
Weisbach, M. S. (1988). Outside Directors and CEO Turnover. Journal of Financial Economics.
Welch, Ivo (2009). Corporate Finance : An Introduction. Pearson Education Prentice Hall.
Weston, J. F., and T. E. Coupland. (1992). Manajemen Keuangan. 8 ed. Jakarta: Binarupa Aksara.
World Economic Forum, (2013). The Global Competitiveness Report (2013–2014).
lxii
Wolfe, J. (2003). The Tobin’Q As A Company Performance Indicator. Developments is Business Simulation and Experiential Learning 30.
Wu, W., Wu, C., Zhou, C., & Wu, J. (2012). Political Connections, Tax Benefits and Firm Performance: Evidence from China. Journal of Accounting and Public policy, 31(3), 277-300.
Xia, F., and Walker, G. (2015). How Much does Owner Type Matter for Firm Performance? Manufacturing Firms in China 1998–2007. Strategic Management Journal, 36(4), 576-585.
Youndt, M. A., Subramaniam, M., & Snell, S. A. (2004). Intellectual Capital Profiles: An Examination of Investments and Returns. Journal of Management Studies, 41(2), 335–361.
Yenmack, D. (1996. Higher Market Valuation of Companies With a Small Board of Directors. Journal Financial Economics 40:185-211.
Yu, M. (2013). State Ownership and Firm Performance: Empirical Evidence from Chinese Listed Companies. China Journal of Accounting Research, 6(2), 75-87.
Yuniarsih and Wirakusuma (2011), Pengaruh Kinerja Keuangan terhadap Nilai Perusahaan dengan Pengungkapan Corporate Social Responsibility dan Good Corporate Governance sebagai Variabel Pemoderasi. Jurnal Akuntansi. Universitas Udayana, 25 Mei 2011, 1-10
Wang, G.Y. (2010) The Impacts of Free Cash Flows and Agency Costs on Firm Performance. J. Service Science & Management, 2010, 3, 408-418
Watson, E., Kumar, K., and Michaelsen, L. (1993). Cultural Diversity’s Impact on Interaction Process and Performance: Comparing Homogeneity and Diverse Task Groups. Academy of Management Journal, 36, 590-603.
Wernerfelf, B.(1984). A Resources Base-View of Firm. Strategic Management Journal. 5.171-223.
Wibisono, S. (2008) Matematika Diskrit Edisi 2 Graha Ilmu, Yogyakarta,
Wright, P., S. P. Ferris, A. Sarin, and V. Awasthi. (1996). Impact of Corporate Insider, Blockholder, and Institutional Equity Ownership on Firm Risk Taking. Academy of Management fournal 39: 441-464.
lxiii
Zahra, S.A., Oviatt, B. M.. and Hinyard, K. (1993). Effect Ownership Structure, Board Structure, Corporate Social Responsibility dan Financial Performance. Academy of Management Best Papers Proceedings, p.336-340.
Zakaria, Z., Purhanudin, N., and Palanimally, Y. R. (2014). Ownership Structure and Firm Performance: Evidence From Malaysian Trading and Services Sector. European Journal of Business and Social Sciences, 3(2), 32-43.
Zeckhauser, R., and J. Pound. (1990). Are Large Shareholders Effective Monitors? An Investigation of Share Ownership and Corporate Performance, Asymmetric Information, Corporate Finance, and Investment, R.G. Hubbard, ed. Chicago, IL: Univ. of Chicago Press (1990), 149-80.
Zeitun, R., and Tian, G. G. (2007). Capital Structure And Corporate Performance: Evidence from Jordan. Australasian Accounting, Business and Finance Journal. Vol.1(4) p.39-61.
Zhong, K., Gribbin, D. W, and X. Zheng. (2007). The Effect of Monitoring by Oudside Blockholders on Earning Management. Quarterly Journal of Business and Economics 46 (1):37-60.
lxiv
GLOSSARY
AADB : Asian Development Bank ASEAN : The Association of Southeast Asian NationAT : Agency Theory
BBAPEPAM : Badan Pengawas Pasar ModalBEI : Bursa Efek IndonesiaBUMN : Badan Usaha Milik Negara
CCEO : Chief of Executive OfficerCG : Corporate GovernanceCorPerfm : Corporate Performance/ Kinerja PerusahaanCorValue : Corporate Value/ Nilai Perusahaan
EIEHCD : Investment Efectiveness Committed Human Capital
DevelopmentEPS : Earning Per Share/ProfitabilitasEV : Enterprise value
FFCGI : Forum for Corporate Governance in Indonesia Forg_Own : Foreign Ownership/Kepemilikan asing
GGCG : Good Corporate Governance
HHCI : Human Capital InvestmentHRI : Human Resourse Investment
IIDX : Indonesian Stock ExchangeInts_Own : Institutional Ownership/Kepemilikan InstitusiIPMA :Importance–Performance Map Analysis ISE : Istanbul Stock Exchange
JJSX : Jakarta Stock Exchange
lxv
KKLSE : Kuala Lumpur Stock ExchangeKMP : Komposisi Dewan KomisarisKNKCG : Komite Nasional Kebijakan Corporate GovernanceKRP : Karakteristik Perusahaan KFTC : the Fair Trade Commission of the Korean government
LLEV : Leverage
MMBT : Market Based Theory MBR : Market to Book Ratio Mgt_Own : Managerial Ownership/Kepemilikan Manajemen
NNFI : Normal Fit IndexNPV : Net Present Value
OOECD : Organization for Economic Co-operation and Development
PP/E : Price Earning PER : Price Earning Ratio PLS : Partial Least Square
RRBT : Resources Based Theory ROA : Return on AssetsROE : Return on Equity ROI : Return on InvestmentRUPS : Rapat Umum Pemegang SahamR&D : Research and Development
SSDM : Sumber Daya manusia SRMR : Standardize Root Mean Square ResidualST : Signaling Theory
UUSA : United States of AmericaUU : Undang-undang
lxvi
UN : United Nations
VVIF : Variance inflation factor
lxvii
LAMPIRAN
lxviii
DATA DAN NILAI VARIABEL PERUSAHAAN SAMPEL
NO KODE NAMA PERUSAHAAN Mgt_Own Int_Own Forn_Own TOBINQ PBV ROA ROE IECHC
1 ADHI PT. ADHI KARYA 0 38.6 10.3 0.48 4.2 26.4 4.2 0.021
2 ADMFPT ADIRA DINAMIKA MULTI FINANCE TBK 0 95 0 1.58 5.5 28.3 21.2 0.119
3 ADMG PT POLYCHEM INDONESIA TBK 0 25.56 49.5 0.22 0.4 0.6 0.4 0.0044 AKRA PT AKR CORPORINDO TBK 0.51 59.18 0 0.5 4.2 11.5 2.8 0.0445 ANTM PT ANTAM (Persero) Tbk 0 12.6 9.8 0.55 1.9 3.2 3.6 0.064
6 APEXPT APEXINDO PRATAMA DUTA TBK 0 90.4 7.39 1.03 6.2 17.4 19 0.080
7 ASDM PT ASURANSI DAYIN MITRA TBK 0 73.33 0 0.29 3 16.6 19.3 0.0408 KAEF PT KIMIA FARMA TBK 0.166 0 0 3.27 7 10.6 4.3 0.7339 ASGR PT ASTRA GRAPHIA TBK 0 76.87 0 1.37 14.4 28.4 9.2 0.13810 ASSA PT ADI SARANA ARMADA (TBK) 0 0 26 0.5 4.9 10.2 6 0.01911 BACA PT BANK CAPITAL INDONESIA TBK 9.47 39.86 0 0.57 4.2 11.2 9 0.04712 BBKP PT BANK BUKOPIN TBK 28.23 32.94 32.94 0.68 1 7.8 12.3 0.08813 BBNI PT BANK NEGARA INDONESIA TBK 0 44.68 0 0.94 1.3 15 13.9 0.07514 BBRI PT BANK RAKYAT INDONESIA TBK 0 11.78 0 0.94 2.3 19 25.2 0.05315 BCAP PT MNC KAPITAL INDONESIA TBK 0 0 0 1.98 3.4 26.9 40.7 0.09916 BCIP PT BUMI CITRA PERMAI TBK 0 88.5 0 2 0.2 0.7 0.8 0.24817 BDMN PT BANK DANAMON TBK 0 52.43 0 0.36 7.6 14.5 18.2 0.00318 BIPI PT BENAKAT INTEGRA TBK 0.27 73.94 0 1.32 2.3 13.2 15.7 0.099
xxii
NO KODE NAMA PERUSAHAAN Mgt_Own Int_Own Forn_Own TOBINQ PBV ROA ROE IECHC
19 BJBR PT BANK PEMBANGUNAN DAERAH JAWA BARAT DAN BANTEN TBK 0 24.62 16.24 0.68 3.7 11.1 34.8 0.039
20 BJTM PT BANK PEMBANGUNAN DAERAH JAWA TIMUR TBK 0 6.06 1.79 0.51 1.9 20.5 16 0.009
21 BMRI PT BANK MANDIRI (Persero) TBK 0.03 0 8.73 0.24 2.5 14.4 24.3 0.057
22 BNIIPT BANK INTERNASIONAL INDONESIA TBK 68.55 0 30.42 1.48 2.6 21.2 26.4 0.067
23 BRAM PT INDO KORDSA TBK 45.02 33.96 18.31 0.56 1.1 12.7 11.7 0.05924 BSDE PT BUMI SERPONG DAMAI TBK 27.77 5.61 60.31 0.5 1.9 2.8 2.4 0.06625 BSIM PT BANK SINARMAS TBK 0 61.06 0 0.13 12.9 21.7 50.6 0.004
26 BVICPT BANK VICTORIA INTERNASIONAL TBK 0.03 59.94 0 0.85 1.9 12.8 14.4 0.089
27 BWPT PT BW PLANTATION TBK 13.3 53.18 0 0.53 1.7 18.9 17.3 0.040
28 DVLAPT DARYA - VARTA LABORATORIA TBK 0 35.11 36.6 0.37 2.4 8.2 13.7 0.083
29 DLTA PT DELTA DJAKARTA TBK 0 0 92.55 2.53 10.9 14.1 11.2 0.26730 DUTI PT DUTA PERTIWI TBK 0 2.91 58.33 0.24 33.9 42.3 13.6 0.03431 ELSA PT ELNUSA TBK 0 82 7.46 1.35 11.5 14.3 51.5 0.02732 CTRA PT CIPUTRA DEVELOPMENT TBK 0 91.7 8.3 2.57 5.6 10.6 5.9 0.17833 ENRG ENERGI MEGA PERSADA TBK 0 30.63 7.73 0.87 7.3 14.6 26.7 0.00434 FORU PT FORTUNE INDONESIA TBK 0 10.9 31.75 0.41 13 30.8 37.1 0.01935 GIAA PT GARUDA INDONESIA PERSERO TBK 0 75.2 0 1.13 1.5 3 1 0.24036 GJTL PT GAJAH TUNGGAL TBK 0 0 6.12 0.82 0.4 1 0.3 0.04537 GLOB PT GLOBAL TELESHOP TBK 0 49.7 10 0.06 1.9 4.8 2.3 0.019
xxiii
NO KODE NAMA PERUSAHAAN Mgt_Own Int_Own Forn_Own TOBINQ PBV ROA ROE IECHC
38 IGARPT CHAMPION PASIFIC INDOENESIA TBK 0 89.69 0 0.86 9.7 29.5 3.7 0.009
39 JSMR PT JASA MARGA (Persero) TBK 0 5.44 79.42 1.31 11.1 15.5 5.4 0.12140 KKGI PT RESOURCE ALAM INDONESIATBK 0 0 0 0.75 4.4 11.4 12 0.06641 KLBF PT KABLE FARMA TBK 0 4.28 79.83 0.99 21.9 31.9 11.9 0.00242 LEAD PT LOGINDO SAMUDRAMAKMUR TBK 0 57.25 0 3.67 17.9 23.6 12.2 0.18543 LPGI PT LIPPO GENERAL INSURANCE TBK 35 0 48.8 0.64 7 14.7 27.9 0.03644 LPPS PT LIPPO SECURITIES TBK 0 27.6 21.3 0.43 4 5.7 10.6 0.04145 LTLS PT LAUTAN LUAS TBK 0 0 63.49 0.48 31.4 31.5 48 0.00246 MASA PT MULTISTRADA ARAH SARANA TBK 55.03 55.03 0 0.43 2.4 8.3 2 0.07047 MDLN PT MODERNLAND REALTY TBK 0 52.8 52.8 0.66 0.3 0.4 0.5 0.03348 MDRN PT MODERN INTERNASIONAL TBK 0 36.91 29.75 1.9 18.8 32.6 54.1 0.02749 MEDC PT MEDCO ENEGY TBK 0 16.1 28.22 2.5 2.7 4.9 3.9 0.433
50 METAPT NUSANTARA INFRASTURCTURE TBK 0 31 20 0.87 0.7 2 2 0.020
51 MICE PT MULTI INDOCITRA TBK 0 28.68 31.02 1.18 6 8.9 50.7 0.017
52 MREIPT MASKAPAI REASURANSI INDONESIA TBK 0 60.43 0 0.76 7.2 9.9 6.5 0.040
53 MTDL PT METRODATA ELEKTRONIK TBK 0 34.6 45.5 2.96 5.3 14.1 8.3 0.13354 MTLA PT METROPOLITAN LAND TBK 0 25.13 0 0.89 6.9 16.8 2.1 0.098
55 OKASPT ANCORA INDONESIA RESOURCES TBK 3.2 22.69 66.13 0.21 8.3 13.1 27.5 0.015
56 PTSN PT SAT NUSAPERSADA TBK 0 11.04 38.18 0.46 1.3 6.1 1.43 0.05357 RANC PT SUPRA BOGA LESTARI TBK 0 27.2 29.74 0.71 20.5 32.8 29.8 0.067
xxiv
NO KODE NAMA PERUSAHAAN Mgt_Own Int_Own Forn_Own TOBINQ PBV ROA ROE IECHC
58 SGRO PT SAMPOERNA AGRO TBK 0 96.51 0 1.45 4.6 8.9 12.5 0.10659 SIPD PT SIERAD PRODUCE TBK 0 30.34 29.53 1.11 0.8 1.5 2.4 0.01560 SMBR PT SEMEN BATURAJA PERSERO TBK 0 46.04 38.82 0.93 1.7 13.2 18.2 0.02761 SMGR PT SEMEN INDONESIA (PERSERO) TBK 0 56.74 0 0.6 7.5 9.8 31.8 0.01562 SRIL PT SRI REJEKI ISMAN Tbk 0 0 47 2.85 15.9 24.6 16.6 0.13163 SSMS PT SAWIT SUMBERMAS SARANA TBK 0 0 6.88 0.25 1.4 2.3 0.6 0.00664 SUPR PT SOLUSI TUNAS PRATAMA TBK 0 54.06 0 2.82 5.4 9.1 2.8 0.084
65 TMASPT PELAYARAN TEMPURAN EMAS TBK 0 14.8 68 2.26 8.5 12.4 11.1 0.009
66 TMPO PT TEMPO INTI MEDIA TBK 0 0 41.23 0.38 0.3 0.7 0.2 0.08967 TOTL PT TOTAL BANGUN PERSADA TBK 0 10.9 0 1.72 11.5 12.7 26.7 0.05968 TOTO PT SURYA TOTO INDONESIATBK 0 7.05 41.68 1.3 17.4 24.6 21.9 0.07769 TRIO PT TRIKOMSEL OKE TBK 0 56.07 0 1.44 6.1 11.3 6.6 0.095
70 UNSPPT BAKRIE SUMATERA PLANTATIONS TK 26.4 41.1 16.8 2.26 8.5 12.4 11.1 0.115
71 WSKT PT WASKITA KARYA (PERSERO) TBK 0 79 0 2.12 3.1 8.9 24 0.00872 ADHI PT. ADHI KARYA 86.03 0 0 0.86 0.8 4.1 0.9 0.019
73 ADMFPT ADIRA DINAMIKA MULTI FINANCE TBK 45.64 40.56 0 1.12 3 6 2.8 0.405
74 ADMG PT POLYCHEM INDONESIA TBK 0 66.9 0 1.5 9.6 26 9.3 0.15375 AKRA PT AKR CORPORINDO TBK 0 56.7 39.5 1.63 16.5 25.7 16.4 0.08076 ANTM PT ANTAM (Persero) Tbk 1.21 0 90.93 3.06 6.1 24.6 4.8 0.00977 APEX PT APEXINDO PRATAMA DUTA TBK 0 17.4 5.02 3.07 4.2 15.4 3.8 0.08178 ASDM PT ASURANSI DAYIN MITRA TBK 0 24.3 8.7 3.14 3.1 18.6 3.8 0.009
xxv
NO KODE NAMA PERUSAHAAN Mgt_Own Int_Own Forn_Own TOBINQ PBV ROA ROE IECHC
79 KAEF PT KIMIA FARMA TBK 0 75 0 1.55 2.6 19.5 9.6 0.11180 ASGR PT ASTRA GRAPHIA TBK 0 25.56 49.5 0.28 1.4 4.1 1.3 0.01681 ASSA PT ADI SARANA ARMADA (TBK) 0.73 58.78 0 1.36 5.3 13.3 3.5 0.03382 BACA PT BANK CAPITAL INDONESIA TBK 0 12.5 8.4 0.85 1.9 3.2 3.6 0.03983 BBKP PT BANK BUKOPIN TBK 0 81.32 0 0.73 2.8 16.8 5.4 0.09584 BBNI PT BANK NEGARA INDONESIA TBK 0.152 0 0 4.03 8 13.1 5.2 4.00585 BBRI PT BANK RAKYAT INDONESIA TBK 0 76.87 0 3.14 15.9 28.8 11.4 0.30686 BCAP PT MNC KAPITAL INDONESIA TBK 65.11 0 26 3.74 3.3 5.8 2.9 0.00587 BCIP PT BUMI CITRA PERMAI TBK 28.23 0 25.91 1.37 0.8 6.8 8.6 0.06688 BDMN PT BANK DANAMON TBK 9.47 44.12 0 0.67 1.7 5.1 3.8 0.04089 BIPI PT BENAKAT INTEGRA TBK 0 48.09 0 0.96 1.2 13.4 11.4 0.057
90BJBR PT BANK PEMBANGUNAN DAERAH
JAWA BARAT DAN BANTEN TBK 0 10.09 28.72 2.21 2.6 17.7 24.6 0.057
91BJTM PT BANK PEMBANGUNAN DAERAH
JAWA TIMUR TBK 0 0 56.75 3.35 3 24.8 28.7 0.08392 BMRI PT BANK MANDIRI (Persero) TBK 0 82.63 0 1.77 0.1 0.5 2.2 0.026
93 BNIIPT BANK INTERNASIONAL INDONESIA TBK 0 58.02 4.9 3.18 5.5 13.1 16.8 0.644
94 BRAM PT INDO KORDSA TBK 0 28.26 21.49 1.85 2 5.5 9.5 0.04995 BSDE PT BUMI SERPONG DAMAI TBK 0 0 32.63 1.49 1.4 8.1 9.3 0.04096 BSIM PT BANK SINARMAS TBK 0 0.45 27.43 1.37 1.5 15.8 12 0.071
97 BVICPT BANK VICTORIA INTERNASIONAL TBK 0 0 0 1.36 2.5 15.5 21.1 0.554
xxvi
NO KODE NAMA PERUSAHAAN Mgt_Own Int_Own Forn_Own TOBINQ PBV ROA ROE IECHC
98 BWPT PT BW PLANTATION TBK 0 7 32 1.84 2.4 13.1 23.8 0.053
99 DVLAPT DARYA - VARTA LABORATORIA TBK 45.02 33.96 18.31 0.9 0.5 4.9 4.6 0.108
100 DLTA PT DELTA DJAKARTA TBK 0 52.8 0 2.12 14.2 21.6 71.7 0.027101 DUTI PT DUTA PERTIWI TBK 0.03 53.47 0 1.28 0.8 5.7 5.6 0.135102 ELSA PT ELNUSA TBK 12.35 56.5 0 0.48 0.8 8.7 7.2 0.008103 CTRA PT CIPUTRA DEVELOPMENT TBK 0 72.84 67.86 1.85 2 5.5 9.5 0.064104 ENRG ENERGI MEGA PERSADA TBK 0 0 92.66 2.11 8.3 10.8 9.5 0.271105 FORU PT FORTUNE INDONESIA TBK 0 30.63 7.73 2.1 7.1 14.8 28.1 0.003106 GIAA PT GARUDA INDONESIA PERSERO TBK 0 75.6 14.4 1.5 9.8 16.2 9.9 0.396107 GJTL PT GAJAH TUNGGAL TBK 0 6.28 24.7 0.34 2.6 6.5 7.6 0.016108 GLOB PT GLOBAL TELESHOP TBK 0 49.5 10 0.98 0.1 0.3 0.1 0.279
109 IGARPT CHAMPION PASIFIC INDOENESIA TBK 0 26.25 0 5.69 10.2 16.8 8.4 0.055
110 JSMR PT JASA MARGA (Persero) TBK 0.076 0 39.6 0.97 2.4 24.4 3.6 0.142111 KKGI PT RESOURCE ALAM INDONESIATBK 0 88.66 0 1.7 8.7 11.2 45.5 0.004112 KLBF PT KABLE FARMA TBK 0 89.69 0 2.07 7.2 23.2 3.2 0.008113 LEAD PT LOGINDO SAMUDRAMAKMUR TBK 0 5.4 79.42 8.56 15.7 20.8 7.4 0.109114 LPGI PT LIPPO GENERAL INSURANCE TBK 0 0 0 1.06 15.7 20.8 7.4 0.087
115 LPPS PT LIPPO SECURITIES TBK 0 68.67 25.33 1.51 0.093 0.20.08
4 1.103116 LTLS PT LAUTAN LUAS TBK 0 0 0 1.71 15.3 22.3 10.3 0.018117 MASA PT MULTISTRADA ARAH SARANA TBK 0 56.71 0 4.29 3.8 10.6 13.2 0.089118 MDLN PT MODERNLAND REALTY TBK 0 0 0 9.48 16.9 22.1 12 0.036
xxvii
NO KODE NAMA PERUSAHAAN Mgt_Own Int_Own Forn_Own TOBINQ PBV ROA ROE IECHC
119 MDRN PT MODERN INTERNASIONAL TBK 0 41.1 21.3 0.82 75150.
9 285 0.018
120 MEDC PT MEDCO ENEGY TBK 0 2.48 2 3.68 41.6799.
1 17.9 0.065
121 METAPT NUSANTARA INFRASTURCTURE TBK 0 0 63.49 0.52 22 22.1 29 0.033
122 MICE PT MULTI INDOCITRA TBK 2.62 56.05 0 0.71 5.4 15.2 4.1 0.065
123 MREIPT MASKAPAI REASURANSI INDONESIA TBK 0 50.7 0 0.92 0.6 1.9 2.4 0.069
124 MTDL PT METRODATA ELEKTRONIK TBK 15.68 0 43.7 1.78 4.9 10.6 4.9 0.227125 MTLA PT METROPOLITAN LAND TBK 0 35.96 28.8 1.24 7 13.9 24 0.024
126 OKASPT ANCORA INDONESIA RESOURCES TBK 0 14.33 32.94 2.5 2.4 4.9 3.8 0.373
127 PTSN PT SAT NUSAPERSADA TBK 0 21 31.44 1.35 5.1 8.4 35.2 0.010128 RANC PT SUPRA BOGA LESTARI TBK 0 44.81 0 0.41 4.9 6.1 6.2 0.115129 SGRO PT SAMPOERNA AGRO TBK 0 21.19 0 2.52 7.9 18.5 9.6 0.122130 SIPD PT SIERAD PRODUCE TBK 0 25.13 0 1.49 9.7 20.9 2.8 0.089131 SMBR PT SEMEN BATURAJA PERSERO TBK 0.39 74.21 0 1.72 8.1 12.8 25.5 0.013132 SMGR PT SEMEN INDONESIA (PERSERO) TBK 12.07 11.04 0 0.34 0.5 2.6 0.6 0.064133 SRIL PT SRI REJEKI ISMAN Tbk 0 27.2 56.94 3.16 12 25.2 21.9 0.046134 SSMS PT SAWIT SUMBERMAS SARANA TBK 0 18 0 2.92 4.8 8.3 12.5 0.073135 SUPR PT SOLUSI TUNAS PRATAMA TBK 0 59 30 3.9 7.9 15.1 23.5 0.006
136 TMASPT PELAYARAN TEMPURAN EMAS TBK 0 0 0 2.86 13.6 23.3 15.4 0.043
137 TMPO PT TEMPO INTI MEDIA TBK 0.024 68.52 0 1.62 1.5 2.7 0.7 0.065
xxviii
NO KODE NAMA PERUSAHAAN Mgt_Own Int_Own Forn_Own TOBINQ PBV ROA ROE IECHC
138 TOTL PT TOTAL BANGUN PERSADA TBK 0 46.04 38.82 1.48 1.511.1
215.1
8 0.004139 TOTO PT SURYA TOTO INDONESIATBK 0 67.05 0 1.19 8.4 14.3 12.9 0.024140 TRIO PT TRIKOMSEL OKE TBK 0 0 41.23 0.54 0.1 0.3 0.2 0.104
141 UNSPPT BAKRIE SUMATERA PLANTATIONS TK 0 12.28 2.33 1.27 11.2 12.1 27 0.047
142 WSKT PT WASKITA KARYA (PERSERO) TBK 9.93 38.21 0.01 3.24 16.2 22.3 20.7 0.132143 ADHI PT. ADHI KARYA 32.51 9.51 0 0.47 3.5 7.6 4.3 0.002
144 ADMFPT ADIRA DINAMIKA MULTI FINANCE TBK 0 43.41 0 3.31 18.3 24.6 33.8 0.076
145 ADMG PT POLYCHEM INDONESIA TBK 0 56.07 0 0.5 0.082 0.1 0.3 0.712146 AKRA PT AKR CORPORINDO TBK 86.03 0 0 4.36 10.8 38.4 11.5 0.027147 ANTM PT ANTAM (Persero) Tbk 45.64 40.56 0 0.63 1.9 4.3 1.8 0.599148 APEX PT APEXINDO PRATAMA DUTA TBK 0 0 0 4.25 6.4 17.8 6.9 0.075149 ASDM PT ASURANSI DAYIN MITRA TBK 0 0 87.34 3.38 3 12.2 2.5 0.051150 KAEF PT KIMIA FARMA TBK 11.805 7.61 5.54 6.08 4 17.6 4.9 0.004151 ASGR PT ASTRA GRAPHIA TBK 0 55.36 40.37 0.91 0.9 2.1 0.7 0.025152 ASSA PT ADI SARANA ARMADA (TBK) 1.21 0 90.93 3.38 3 12.2 2.5 0.008153 BACA PT BANK CAPITAL INDONESIA TBK 0 56.72 39.48 3.23 16.1 26.7 16.5 0.083154 BBKP PT BANK BUKOPIN TBK 0 27.2 13.1 2.66 2.77 9.01 4.95 0.008
155 BBNI PT BANK NEGARA INDONESIA TBK 0 95 0 4.87 2.415.2
5 8.24 0.175
156 BBRI PT BANK RAKYAT INDONESIA TBK 0 59.17 0 2.55 6.9614.5
3 5.36 0.028157 BCAP PT MNC KAPITAL INDONESIA TBK 0 31.24 11.91 1.44 6.97 78.8 18.9 0.072
xxix
NO KODE NAMA PERUSAHAAN Mgt_Own Int_Own Forn_Own TOBINQ PBV ROA ROE IECHC
2 1
158 BCIP PT BUMI CITRA PERMAI TBK 0 81.32 0 5.44 3.2318.2
5 5.16 0.067
159 BDMN PT BANK DANAMON TBK 0.972 0 0 2.34 7.0212.3
7 4.8 4.019
160 BIPI PT BENAKAT INTEGRA TBK 0 76.87 0 2.74 14.6525.0
1 9.99 0.276
161BJBR PT BANK PEMBANGUNAN DAERAH
JAWA BARAT DAN BANTEN TBK 7.96 45.51 22.03 1.69 0.81 9 7.73 0.050
162BJTM PT BANK PEMBANGUNAN DAERAH
JAWA TIMUR TBK 9.75 44.12 0 7.24 1.86 6.05 3.93 0.034
163 BMRI PT BANK MANDIRI (Persero) TBK 0 48.09 0 5.57 1.02 12.810.1
7 0.055
164 BNIIPT BANK INTERNASIONAL INDONESIA TBK 0 48.09 0 5.57 1.02 12.8
10.17 0.052
165 BRAM PT INDO KORDSA TBK 0.0223 0 0 1.69 1.811.6
518.6
2 0.040
166 BSDE PT BUMI SERPONG DAMAI TBK 0 9.46 33.78 1.99 2.8922.4
625.9
7 0.062167 BSIM PT BANK SINARMAS TBK 0 72.08 0 3.64 0.18 0.75 2.48 0.003
168 BVICPT BANK VICTORIA INTERNASIONAL TBK 0 98.99 0 1.9 0.14 1.31 2.94 0.003
169 BWPT PT BW PLANTATION TBK 0 58.96 7.87 1.14 1.78 4.49 6.41 0.002
170 DVLAPT DARYA - VARTA LABORATORIA TBK 0 28.28 21.47 1.24 0.05 0.16 8.74 0.002
171 DLTA PT DELTA DJAKARTA TBK 0 67.37 6.81 2.07 1.31 7.22 8.74 0.307
xxx
NO KODE NAMA PERUSAHAAN Mgt_Own Int_Own Forn_Own TOBINQ PBV ROA ROE IECHC
172 DUTI PT DUTA PERTIWI TBK 0 7.25 11.5 0.73 1.56 17.812.9
7 0.073
173 ELSA PT ELNUSA TBK 0.04 0 13.86 2 2.0714.0
517.5
4 0.000
174 CTRA PT CIPUTRA DEVELOPMENT TBK 0.09 9.65 30.35 1.7 2.32 17.721.2
6 0.043
175 ENRG ENERGI MEGA PERSADA TBK 45.02 33.96 18.31 2.6 0.73 7.2611.1
5 0.062176 FORU PT FORTUNE INDONESIA TBK 44.77 37.37 0 2.13 2.55 4.19 3.56 0.012
177 GIAA PT GARUDA INDONESIA PERSERO TBK 0.09 95.47 2.85 1.51 6.5310.6
437.8
7 0.025178 GJTL PT GAJAH TUNGGAL TBK 0.04 55.05 0 3.06 0.66 5.05 4.45 0.056179 GLOB PT GLOBAL TELESHOP TBK 12.35 56.5 0 2.35 0.67 6.8 6.5 0.032
180 IGARPT CHAMPION PASIFIC INDOENESIA TBK 0 30.63 7.73 1.05 6.8
13.93
23.88 0.003
181 JSMR PT JASA MARGA (Persero) TBK 0 26.25 58.33 1.01 16.9720.6
411.3
9 0.027
182 KKGI PT RESOURCE ALAM INDONESIATBK 0 90.79 7.58 1.44 7.44 9.8239.7
8 0.022
xxxi
NO KODE NAMA PERUSAHAAN Mgt_Own Int_Own Forn_Own TOBINQ PBV ROA ROE IECHC
183 KLBF PT KABLE FARMA TBK 0 92.66 0 2.82 7.84 11.08 8.26 0.225
184 LEADPT LOGINDO SAMUDRAMAKMUR TBK 0 89.6 10.4 0.47 8.62 14.41 10.06 0.177
185 LPGIPT LIPPO GENERAL INSURANCE TBK 0 5.4 79.42 1.05 13.39 16.56 7.59 0.080
186 LPPS PT LIPPO SECURITIES TBK 0 0 0 1.61 0.43 1.11 0.4 0.049187 LTLS PT LAUTAN LUAS TBK 0 0 0 2.54 3.59 10.67 13.4 0.051
188 MASAPT MULTISTRADA ARAH SARANA TBK 0 0 0 3.8 15.02 18.81 11.5 0.141
189 MDLN PT MODERNLAND REALTY TBK 35 0 34.3 2.4 0.02 0.04 0.1 0.027
190 MDRNPT MODERN INTERNASIONAL TBK 0 19.8 21.33 2 2.68 4.6 4.93 0.030
191 MEDC PT MEDCO ENEGY TBK 0 20.48 0 1.07 45.79 16.99 19.77 0.062
192 METAPT NUSANTARA INFRASTURCTURE TBK 2.62 56.05 0 1.28 1.09 3.57 0.98 0.035
193 MICE PT MULTI INDOCITRA TBK 0 6.42 27.62 2.77 6.8 14.42 29.48 0.010
194 MREIPT MASKAPAI REASURANSI INDONESIA TBK 0 14.32 32.18 3.02 0.62 1.18 1.24 0.188
195 MTDL PT METRODATA ELEKTRONIK TBK 0 21 22.32 1.06 4.95 8.68 41.28 0.010
196 MTLA PT METROPOLITAN LAND TBK 0 44.81 0 1.91 2.77 3.72 3.73 0.028
197 OKASPT ANCORA INDONESIA RESOURCES TBK 0 19.78 34.07 2.91 7.64 17.88 10.43 0.107
198 PTSN PT SAT NUSAPERSADA TBK 1.77 25.28 0 0.43 7.09 17.75 2.77 0.071
xxxii
NO KODE NAMA PERUSAHAAN Mgt_Own Int_Own Forn_Own TOBINQ PBV ROA ROE IECHC
199 RANC PT SUPRA BOGA LESTARI TBK 0 88.9 36.7 1 6.63 10.84 22.03 0.009200 SGRO PT SAMPOERNA AGRO TBK 1.44 0 0 1.45 6.2 13.32 13.12 0.040201 SIPD PT SIERAD PRODUCE TBK 0 18 0 0.73 9.25 16.18 25.58 0.088
202 SMBRPT SEMEN BATURAJA PERSERO TBK 0 87.34 0 3.12 5.99 11.62 17.01 0.013
203 SMGRPT SEMEN INDONESIA (PERSERO) TBK 0 46.04 38.82 1.86 0.86 5.09 0.92 0.023
208 TMPO PT TEMPO INTI MEDIA TBK 9.93 38.21 0.01 3.34 11.86 16.49 16.79 0.062
209 TOTLPT TOTAL BANGUN PERSADA TBK 0 67.41 0 3.21 8.21 17.25 21.23 7.711
210 TOTOPT SURYA TOTO INDONESIATBK 0 56.07 0 0.82 7.11 20.11 8.95 0.030
211 TRIO PT TRIKOMSEL OKE TBK 0 79 0 2.84 1.27 3.65 10.58 0.003
212 UNSPPT BAKRIE SUMATERA PLANTATIONS TK 0.44 0 0 2.03 16.82 45.59 19.47 0.016
213 WSKTPT WASKITA KARYA (PERSERO) TBK 45.64 40.56 0 0.47 0.71 1.66 1.05 0.298
xxxiii
Final Results
Path Coefficients
Mean, STDEV, T-Values, P-Values
Original Sample (O)
T Statistics (|O/STDEV|) P Values
CorPerfm -> CorValue 0,197 4,531 0,000Forg_Own -> CorValue 0,260 3,254 0,001Forg_Own -> IEHCD 0,379 7,353 0,000IEHCD -> CorPerfm 0,271 3,399 0,000IEHCD -> CorValue 0,160 2,325 0,010Ints_Own -> CorValue 0,399 5,193 0,000Ints_Own -> IEHCD 0,266 4,276 0,000Mgt_Own -> CorValue 0,016 0,466 0,321Mgt_Own -> IEHCD 0,061 1,306 0,096
Confidence Intervals
Original Sample (O) 95.0%CorPerfm -> CorValue 0,197 0,277Forn_Own -> CorValue 0,260 0,391Forn_Own -> IEHCD 0,379 0,466IEHCD -> CorPerfm 0,271 0,406IEHCD -> CorValue 0,160 0,270Int_Own -> CorValue 0,399 0,526Int_Own -> IEHCD 0,266 0,367Mgt_Own -> CorValue 0,016 0,112Mgt_Own -> IEHCD 0,061 0,155
Confidence Intervals Bias Corrected
Original Sample (O) 5.0% 95.0%CorPerfm -> CorValue 0,197 0,122 0,267Forn_Own -> CorValue 0,260 0,139 0,407Forn_Own -> IEHCD 0,379 0,291 0,458IEHCD -> CorPerfm 0,271 0,140 0,401IEHCD -> CorValue 0,160 0,032 0,262Int_Own -> CorValue 0,399 0,249 0,507Int_Own -> IEHCD 0,266 0,158 0,362
xxii
Mgt_Own -> CorValue 0,016 0,000 0,042Mgt_Own -> IEHCD 0,061 0,007 0,166
INDIRECT EFFECTS
Mean, STDEV, T-Values, P-Values
Original Sample (O)
T Statistics (|O/STDEV|) P Values
CorPerfm -> CorValue Forn_Own -> CorPerfm 0,102 2,915 0,002Forn_Own -> CorValue 0,081 2,755 0,003Forn_Own -> IEHCD IEHCD -> CorPerfm IEHCD -> CorValue 0,053 2,637 0,004Int_Own -> CorPerfm 0,072 2,905 0,002Int_Own -> CorValue 0,057 2,388 0,009Int_Own -> IEHCD Mgt_Own -> CorPerfm 0,017 1,493 0,068Mgt_Own -> CorValue 0,013 1,138 0,128Mgt_Own -> IEHCD
Confidence Intervals
Original Sample (O) 95.0%
CorPerfm -> CorValue Forn_Own -> CorPerfm 0,102 0,165Forn_Own -> CorValue 0,081 0,132Forn_Own -> IEHCD IEHCD -> CorPerfm IEHCD -> CorValue 0,053 0,092Int_Own -> CorPerfm 0,072 0,114Int_Own -> CorValue 0,057 0,099Int_Own -> IEHCD Mgt_Own -> CorPerfm 0,017 0,037Mgt_Own -> CorValue 0,013 0,037Mgt_Own -> IEHCD
xxiii
Confidence Intervals Bias Corrected
Original Sample (O) 5.0% 95.0%
CorPerfm -> CorValue Forn_Own -> CorPerfm 0,102 0,050 0,163Forn_Own -> CorValue 0,081 0,030 0,125Forn_Own -> IEHCD IEHCD -> CorPerfm IEHCD -> CorValue 0,053 0,026 0,091Int_Own -> CorPerfm 0,072 0,036 0,117Int_Own -> CorValue 0,057 0,022 0,099Int_Own -> IEHCD Mgt_Own -> CorPerfm 0,017 0,003 0,042Mgt_Own -> CorValue 0,013 0,001 0,042Mgt_Own -> IEHCD
TOTAL EFFECTS
Mean, STDEV, T-Values, P-Values
Original Sample (O)
T Statistics (|O/STDEV|) P Values
CorPerfm-> CorValue 0,197 4,531 0,000
Forn_Own-> CorPerfm 0,102 2,915 0,002
Forn_Own-> CorValue 0,341 4,696 0,000
Forn_Own-> IEHCD 0,379 7,353 0,000
IEHCD -> CorPerfm 0,271 3,399 0,000
IEHCD -> CorValue 0,213 3,045 0,001
Int_Own-> CorPerfm 0,072 2,905 0,002
Int_Own -> CorValue 0,455 5,903 0,000
xxiv
Int_Own -> IEHCD 0,266 4,276 0,000
Mgt_Own-> CorPerfm 0,017 1,493 0,068
Mgt_Own-> CorValue 0,029 0,771 0,220
Mgt_Own -> IEHCD 0,061 1,306 0,096
Int_Own -> IEHCD 0,266 0,158 0,362
Mgt_Own-> CorPerfm 0,017 0,003 0,042
Mgt_Own-> CorValue 0,029 0,001 0,084
Mgt_Own -> IEHCD 0,061 0,007 0,166
Confidence Intervals
Original Sample (O) 95.0%
CorPerfm -> CorValue 0,197 0,277
Forn_Own-> CorPerfm 0,102 0,165
Forn_Own -> CorValue 0,341 0,462
Forn_Own -> IEHCD 0,379 0,466
IEHCD -> CorPerfm 0,271 0,406
IEHCD -> CorValue 0,213 0,329
Int_Own -> CorPerfm 0,072 0,114
Int_Own -> CorValue 0,455 0,585
Int_Own -> IEHCD 0,266 0,367
Mgt_Own -> CorPerfm 0,017 0,037
Mgt_Own -> CorValue 0,029 0,124
Mgt_Own -> IEHCD 0,061 0,155
xxv
Confidence Intervals Bias Corrected
Original Sample (O) 5.0% 95.0%
CorPerfm -> CorValue 0,197 0,122 0,267Forn_Own -> CorPerfm 0,102 0,050 0,163Forn_Own -> CorValue 0,341 0,229 0,471Forn_Own -> IEHCD 0,379 0,291 0,458
OUTER LOADINGS
Original Sample (O)
T Statistics (|O/STDEV|) P Values
Forn_Own<-Forn_Own 1,000 IECHC <- IEHCD 1,000 Int_Own <- Int_Own 1,000 Mgt_Own<- Mgt_Own 1,000 PBV -> CorValue 0,959 35,459 0,000ROA -> CorPerfm 0,975 29,011 0,000ROE -> CorPerfm 0,394 2,779 0,003TOBINQ -> CorValue 0,753 10,270 0,000
xxvi
Confidence Intervals
Original Sample (O) 95.0%
Forn_Own<- Forn_Own 1,000 1,000
IECHC <- IEHCD 1,000 1,000
Int_Own <- Int_Own 1,000 1,000
Mgt_Own <- Mgt_Own 1,000 1,000
PBV -> CorValue 0,959 0,991
ROA -> CorPerfm 0,975 1,000
ROE -> CorPerfm 0,394 0,629
TOBINQ -> CorValue 0,753 0,862
Confidence Intervals Bias Corrected
Original Sample (O) 5.0% 95.0%
Forn_Own<-Forn_Own 1,000 1,000 1,000
IECHC <- IEHCD 1,000 1,000 1,000
Int_Own <- Int_Own 1,000 1,000 1,000
Mgt_Own<- Mgt_Own 1,000 1,000 1,000
PBV -> CorValue 0,959 0,900 0,990
ROA -> CorPerfm 0,975 0,906 1,000
xxvii
ROE -> CorPerfm 0,394 0,151 0,627
TOBINQ -> CorValue 0,753 0,621 0,860
OUTER WEIGHTS
Mean, STDEV, T-Values, P-Values
Original Sample (O)
T Statistics (|O/STDEV|) P Values
Forn_Own<-Forn_Own 1,000
IECHC <- IEHCD 1,000
Int_Own <- Int_Own 1,000
Mgt_Own <- Mgt_Own 1,000
PBV -> CorValue 0,779 9,098 0,000
ROA -> CorPerfm 1,137 14,544 0,000
ROE -> CorPerfm -0,276 1,788 0,037
TOBINQ -> CorValue 0,336 3,214 0,001
Confidence Intervals
Original Sample (O) 95.0%Forn_Own <- Forn_Own 1,000 1,000IECHC <- IEHCD 1,000 1,000Int_Own <- Int_Own 1,000 1,000Mgt_Own <- Mgt_Own 1,000 1,000PBV -> CorValue 0,779 0,903ROA -> CorPerfm 1,137 1,243ROE -> CorPerfm -0,276 -0,037TOBINQ -> CorValue 0,336 0,507
Confidence Intervals Bias Corrected
xxviii
Original Sample (O) 5.0% 95.0%Forn_Own <- Forn_Own 1,000 1,000 1,000IECHC <- IEHCD 1,000 1,000 1,000Ints_ Own <- Int_ Own 1,000 1,000 1,000Mgt_Own <- Mgt_Own 1,000 1,000 1,000PBV -> CorValue 0,779 0,620 0,899ROA -> CorPerfm 1,137 1,006 1,251ROE -> CorPerfm -0,276 -0,531 -0,032TOBINQ -> CorValue 0,336 0,167 0,508
QUALITY CRITERIA
R Square
Mean, STDEV, T-Values, P-Values
Original Sample (O) T Statistics (|O/STDEV|) P Values
CorPerfm 0,073 1,638 0,051CorValue 0,608 10,847 0,000IEHCD 0,347 7,828 0,000
Confidence Intervals
Original Sample (O) 95.0%CorPerfm 0,073 0,165CorValue 0,608 0,718IEHCD 0,347 0,429
Confidence Intervals Bias Corrected
Original Sample (O) 5.0% 95.0%CorPerfm 0,073 0,019 0,160CorValue 0,608 0,485 0,677IEHCD 0,347 0,269 0,414
R Square Adjusted
Mean, STDEV, T-Values, P-Values
Original Sample (O) T Statistics P Values
xxix
(|O/STDEV|)CorPerfm 0,069 1,532 0,063CorValue 0,599 10,426 0,000IEHCD 0,338 7,509 0,000
Confidence Intervals
Original Sample (O) 95.0%CorPerfm 0,069 0,161CorValue 0,599 0,711IEHCD 0,338 0,421
Confidence Intervals Bias Corrected
Original Sample (O) 5.0% 95.0%CorPerfm 0,069 0,015 0,156CorValue 0,599 0,472 0,669IEHCD 0,338 0,259 0,405
f Square
Mean, STDEV, T-Values, P-Values
Original Sample (O) TStatistics (|O/STDEV|) P Values
CorPerfm -> CorValue 0,087 1,995 0,023Forn_Own -> CorValue 0,084 1,551 0,061Forn_Own -> IEHCD 0,122 3,254 0,001IEHCD -> CorPerfm 0,079 1,414 0,079IEHCD -> CorValue 0,041 0,914 0,180Int_ Own -> CorValue 0,209 1,985 0,024Int_ Own -> IEHCD 0,059 1,882 0,030Mgt_Own -> CorValue 0,001 0,052 0,479Mgt_Own -> IEHCD 0,006 0,399 0,345
xxx
Confidence Intervals
Original Sample (O) 95.0%
CorPerfm -> CorValue 0,087 0,180
Forn_Own -> CorValue 0,084 0,201
Forn_Own -> IEHCD 0,122 0,194
IEHCD -> CorPerfm 0,079 0,197
IEHCD -> CorValue 0,041 0,141
Int_ Own -> CorValue 0,209 0,430
Int_ Own -> IEHCD 0,059 0,120
Mgt_Own -> CorValue 0,001 0,032
Mgt_Own -> IEHCD 0,006 0,038
Confidence Intervals Bias Corrected
Original Sample (O) 5.0% 95.0%CorPerfm -> CorValue 0,087 0,049 0,049Forn_Own -> CorValue 0,084 0,029 0,041Forn_Own -> IEHCD 0,122 0,181 0,181IEHCD -> CorPerfm 0,079 0,021 0,021IEHCD -> CorValue 0,041 0,002 0,036Int_ Own -> CorValue 0,209 0,127 0,152Int_ Own -> IEHCD 0,059 0,043 0,043Mgt_Own -> CorValue 0,001 0,000 0,000Mgt_Own -> IEHCD 0,006 0,000 0,006
xxxi
Average Variance Extracted (AVE)
Mean, STDEV, T-Values, P-Values
Original Sample (O) T Statistics (|O/STDEV|)
P Values
CorPerfm CorValue Forn_Own 1,000 IEHCD 1,000 Int_ Own 1,000 Mgt_Own 1,000
Confidence Intervals
Original Sample (O) 95.0%CorPerfm CorValue Forg_Own 1,000 1,000IEHCD 1,000 1,000Ints_ Own 1,000 1,000Mgt_Own 1,000 1,000
Confidence Intervals Bias Corrected
Original Sample (O) 5.0% 95.0%CorPerfm CorValue Forn_Own 1,000 1,000 1,000IEHCD 1,000 1,000 1,000Int_ Own 1,000 1,000 1,000Mgt_Own 1,000 1,000 1,000
xxxii
Composite Reliability
Mean, STDEV, T-Values, P-Values
Original Sample (O) T Statistics (|O/STDEV|)
P Values
CorPerfm CorValue Forn_Own 1,000 IEHCD 1,000 Int_ Own 1,000 Mgt_Own 1,000
Confidence Intervals
Original Sample (O) 95.0%CorPerfm CorValue Forn_Own 1,000 1,000IEHCD 1,000 1,000Int_ Own 1,000 1,000Mgt_Own 1,000 1,000
Confidence Intervals Bias Corrected
Original Sample (O) 5.0% 95.0%CorPerfm CorValue Forn_Own 1,000 1,000 1,000IEHCD 1,000 1,000 1,000Int_ Own 1,000 1,000 1,000Mgt_Own 1,000 1,000 1,000
xxxiii
rho_A
Mean, STDEV, T-Values, P-Values
Original Sample (O) T Statistics (|O/STDEV|)
P Values
CorPerfm 1,000 CorValue 1,000 Forn_Own 1,000 IEHCD 1,000 Int_ Own 1,000 Mgt_Own 1,000
Confidence Intervals
Original Sample (O) 95.0%CorPerfm 1,000 1,000CorValue 1,000 1,000Forn_Own 1,000 1,000IEHCD 1,000 1,000Int_ Own 1,000 1,000Mgt_Own 1,000 1,000
Confidence Intervals Bias Corrected
Original Sample (O) 5.0% 95.0%CorPerfm 1,000 1,000 1,000CorValue 1,000 1,000 1,000Forn_Own 1,000 1,000 1,000IEHCD 1,000 1,000 1,000Int_ Own 1,000 1,000 1,000Mgt_Own 1,000 1,000 1,000
xxxiv
Cronbach's Alpha
Mean, STDEV, T-Values, P-Values
Original Sample (O) T Statistics (|O/STDEV|)
P Values
CorPerfm CorValue Forn_Own 1,000 IEHCD 1,000 Int_ Own 1,000 Mgt_Own 1,000
Confidence Intervals
Original Sample (O) 95.0%CorPerfm CorValue Forn_Own 1,000 1,000IEHCD 1,000 1,000Int_ Own 1,000 1,000Mgt_Own 1,000 1,000
Confidence Intervals Bias Corrected
Original Sample (O) 5.0% 95.0%CorPerfm CorValue Forn_Own 1,000 1,000 1,000IEHCD 1,000 1,000 1,000Int_ Own 1,000 1,000 1,000Mgt_Own 1,000 1,000 1,000
xxxv
Heterotrait-Monotrait Ratio (HTMT)
Mean, STDEV, T-Values, P-Values
Original Sample (O) T Statistics (|O/STDEV|) P Values
IEHCD -> Forn_Own 0,554 15,318 0,000Int_ Own -> Forn_Own 0,667 15,450 0,000Int_ Own -> IEHCD 0,512 11,734 0,000Mgt_Own-> Forn_Own 0,036 0,885 0,188Mgt_Own -> IEHCD 0,017 0,346 0,365Mgt_Own -> Int_Own 0,116 1,985 0,024
Confidence Intervals
Original Sample (O) 95.0%IEHCD -> Forn_Own 0,554 0,614Int_ Own -> Forn _Own 0,667 0,733Int_ Own -> IEHCD 0,512 0,583Mgt_Own -> Forn_Own 0,036 0,133Mgt_Own -> IEHCD 0,017 0,157Mgt_Own -> Int_Com 0,116 0,209
Confidence Intervals Bias Corrected
Original Sample (O) 5.0% 95.0%
IEHCD -> Forn_Own 0,554 0,485 0,606Int_ Own -> Forn_Own 0,667 0,591 0,730Int_ Own -> IEHCD 0,512 0,431 0,573Mgt_Own -> Forn_Own 0,036 0,001 0,099Mgt_Own -> IEHCD 0,017 0,000 0,040Mgt_Own -> Int_ Own 0,116 0,021 0,212
SRMR
Mean, STDEV, T-Values, P-Values
Original Sample (O) T Statistics (|O/STDEV|)
P Values
Saturated Model 0,023 3,656 0,000Estimated Model 0,051 5,249 0,000
xxxvi
Confidence Intervals
Original Sample (O) 95.0%Saturated Model 0,023 0,034Estimated Model 0,051 0,049
d_ULS
Mean, STDEV, T-Values, P-Values
Original Sample (O) T Statistics (|O/STDEV|) P Values
Saturated Model 0,019 1,706 0,044Estimated Model 0,094 3,685 0,000
Confidence Intervals
Original Sample (O) 95.0%Saturated Model 0,019 0,041Estimated Model 0,094 0,085
d_G
Mean, STDEV, T-Values, P-Values
Original Sample (O) T Statistics (|O/STDEV|)
P Values
Saturated Model 0,011 1,808 0,035Estimated Model 0,024 3,236 0,001
Confidence Intervals
Original Sample (O) 95.0%Saturated Model 0,011 0,022Estimated Model 0,024 0,029
xxxvii
Cronbach's Alpha
Mean, STDEV, T-Values, P-Values
Original Sample (O) T Statistics (|O/STDEV|)
P Values
CorPerfm CorValue Forn_Own 1,000 IEHCD 1,000 Int_ Own 1,000 Mgt_Own 1,000
Confidence Intervals
Original Sample (O) 95.0%CorPerfm CorValue Forn_Own 1,000 1,000IEHCD 1,000 1,000Int_ Own 1,000 1,000Mgt_Own 1,000 1,000
Confidence Intervals Bias Corrected
Original Sample (O) 5.0% 95.0%CorPerfm CorValue Forn_Own 1,000 1,000 1,000IEHCD 1,000 1,000 1,000Int_ Own 1,000 1,000 1,000Mgt_Own 1,000 1,000 1,000
xxxviii
Heterotrait-Monotrait Ratio (HTMT)
Mean, STDEV, T-Values, P-Values
Original Sample (O) T Statistics (|O/STDEV|) P Values
IEHCD -> Forn_Own 0,554 15,318 0,000Int_Own -> Forn_Own 0,667 15,450 0,000Int_ Own -> IEHCD 0,512 11,734 0,000Mgt_Own -> Forn_Own 0,036 0,885 0,188Mgt_Own -> IEHCD 0,017 0,346 0,365Mgt_Own -> Int_Own 0,116 1,985 0,024
Confidence Intervals
Original Sample (O) 95.0%IEHCD -> Forn_Own 0,554 0,614Int_ Own -> Forn _Own 0,667 0,733Int_ Own -> IEHCD 0,512 0,583Mgt_Own-> Forn_Own 0,036 0,133Mgt_Own -> IEHCD 0,017 0,157Mgt_Own -> Int_Own 0,116 0,209
Confidence Intervals Bias Corrected
Original Sample (O) 5.0% 95.0%IEHCD -> Forn_Own 0,554 0,485 0,606Int_Own -> Forn_Own 0,667 0,591 0,730Int_Own -> IEHCD 0,512 0,431 0,573Mgt_Own -> Forn_Own 0,036 0,001 0,099Mgt_Own -> IEHCD 0,017 0,000 0,040Mgt_Own -> Int_Own 0,116 0,021 0,212
SRMR
Mean, STDEV, T-Values, P-Values
Original Sample (O) T Statistics (|O/STDEV|)
P Values
Saturated Model 0,023 3,656 0,000Estimated Model 0,051 5,249 0,000
xxxix
Confidence Intervals
Original Sample (O) 95.0%Saturated Model 0,023 0,034Estimated Model 0,051 0,049
d_ULS
Mean, STDEV, T-Values, P-Values
Original Sample (O) T Statistics (|O/STDEV|)
P Values
Saturated Model 0,019 1,706 0,044Estimated Model 0,094 3,685 0,000
Confidence Intervals
Original Sample (O) 95.0%Saturated Model 0,019 0,041Estimated Model 0,094 0,085
d_G
Mean, STDEV, T-Values, P-Values
Original Sample (O) T Statistics (|O/STDEV|)
P Values
Saturated Model 0,011 1,808 0,035Estimated Model 0,024 3,236 0,001
Confidence Intervals
Original Sample (O) 95.0%Saturated Model 0,011 0,022Estimated Model 0,024 0,029
xl
xli
xlii
DATA PERUSAHAAN YANG NILAI EIBHC TERTINGGI
NO NAMA PERUSAHAAN Mgt_Own Int_Own Forn_Own TOBINQ PBV ROA ROE IECHC
1. PT TOTAL BANGUN PERSADA TBK 0 67,41 0 3,21 8,21 17,25 21,23 7,711
2. PT BANK DANAMON TBK 0,972 0 0 2,34 7,02 12,37 4,8 4,019
3. PT BANK NEGARA INDONESIA TBK 0,152 0 0 4,03 8 13,1 5,2 4,005
4. PT KIMIA FARMA TBK 0,166 0 0 3,27 7 10,6 4,3 3,733
5. PT LIPPO SECURITIES TBK 0 68,67 25,33 1,51 0,093 0,2 0,084 1,103
6. PT POLYCHEM INDONESIA TBK 0 56,07 0 0,5 0,082 0,1 0,3 0,712
7.PT BANK INTERNASIONAL INDONESIA TBK 0 58,02 4,9 3,18 5,5 13,1 16,8 0,644
8. PT ANTAM (Persero) Tbk 45,64 40,56 0 0,63 1,9 4,3 1,8 0,599
9.PT BANK VICTORIA INTERNASIONAL TBK 0 0 0 1,36 2,5 15,5 21,1 0,554
10. PT GAJAH TUNGGAL TBK 0 0 6,12 0,82 0,4 1 0,3 0,448
11. PT MEDCO ENEGY TBK 0 16,1 28,22 2,5 2,7 4,9 3,9 0,433
12.PT ADIRA DINAMIKA MULTI FINANCE TBK 45,64 40,56 0 1,12 3 6 2,8 0,405
xxii
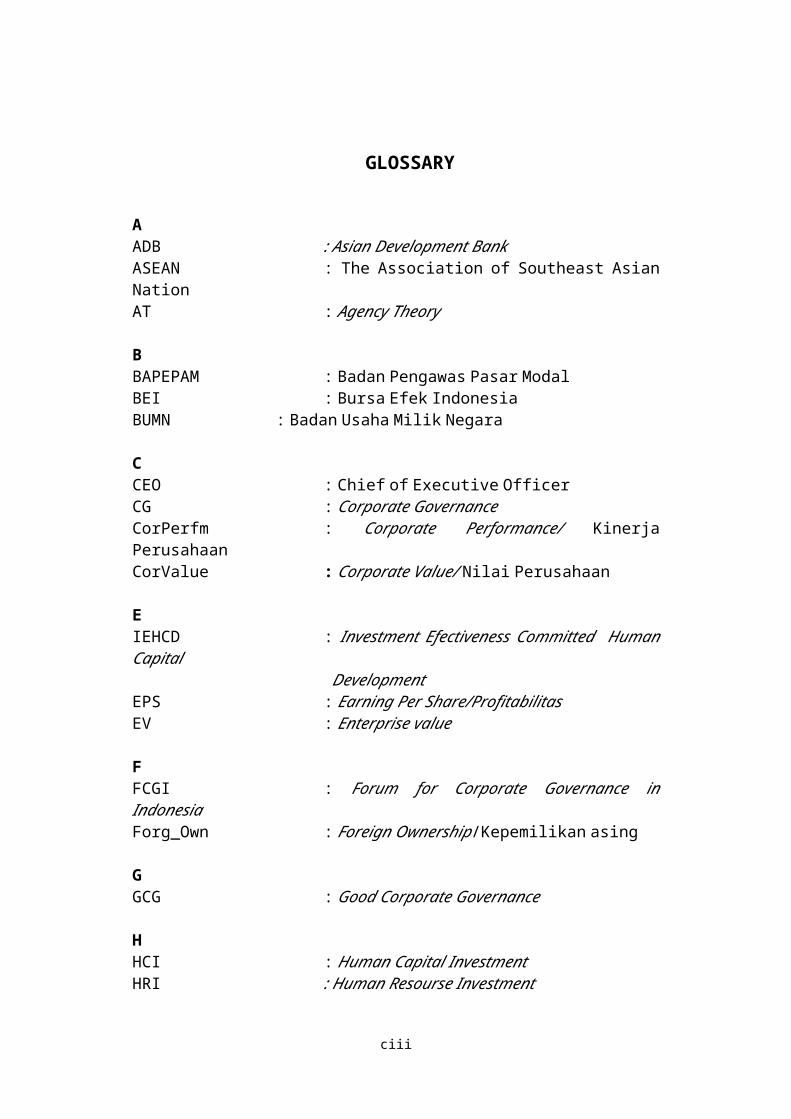
13.PT GARUDA INDONESIA PERSERO TBK 0 75,6 14,4 1,5 9,8 16,2 9,9 0,396
14.PT ANCORA INDONESIA RESOURCES TBK 0 14,33 32,94 2,5 2,4 4,9 3,8 0,373
15. PT DELTA DJAKARTA TBK 0 67,37 6,81 2,07 1,31 7,22 8,74 0,307
DATA PERUSAHAAN YANG NILAI PBV TERTINGGI
NO NAMA PERUSAHAAN Mgt_Own Int_Own Forn_Own TOBINQ PBV ROA ROE IECHC
1.PT MODERN INTERNASIONAL TBK 0 41,1 21,3 0,82 75 150,9 285 0,018
2. PT MEDCO ENEGY TBK 0 20,48 0 1,07 45,79 16,99 19,77 0,0623 PT MEDCO ENEGY TBK 0 2,48 2 3,68 41,6 799,1 17,9 0,0654 PT DUTA PERTIWI TBK 0 2,91 58,33 0,24 33,9 42,3 13,6 0,0345 PT LAUTAN LUAS TBK 0 0 63,49 0,48 31,4 31,5 48 0,002
6PT NUSANTARA INFRASTURCTURE TBK 0 0 63,49 0,52 22 22,1 29 0,033
7 PT KABLE FARMA TBK 0 4,28 79,83 0,99 21,9 31,9 11,9 0,0028 PT SUPRA BOGA LESTARI TBK 0 27,2 29,74 0,71 20,5 32,8 29,8 0,067
9PT MODERN INTERNASIONAL TBK 0 36,91 29,75 1,9 18,8 32,6 54,1 0,027
10 PT ADIRA DINAMIKA MULTI 0 43,41 0 3,31 18,3 24,6 33,8 0,076
xxiii
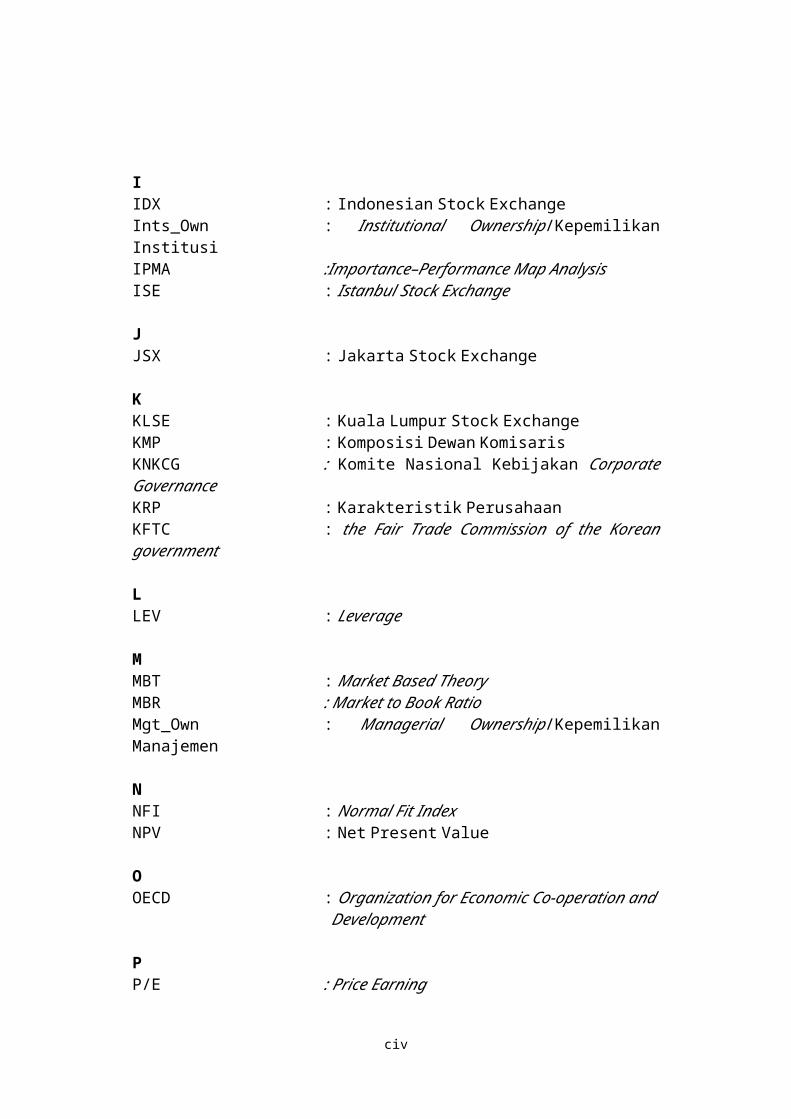
FINANCE TBK
11PT LOGINDO SAMUDRAMAKMUR TBK 0 57,25 0 3,67 17,9 23,6 12,2 0,185
12 PT SURYA TOTO INDONESIATBK 0 7,05 41,68 1,3 17,4 24,6 21,9 0,07713 PT JASA MARGA (Persero) TBK 0 26,25 58,33 1,01 16,97 20,64 11,39 0,02714 PT MODERNLAND REALTY TBK 0 0 0 9,48 16,9 22,1 12 0,036
15PT BAKRIE SUMATERA PLANTATIONS TK 0,44 0 0 2,03 16,82 45,59 19,47 0,016
16 PT AKR CORPORINDO TBK 0 56,7 39,5 1,63 16,5 25,7 16,4 0,080
DATA PERUSAHAAN YANG NILAI ROA TERTINGGI
NO NAMA PERUSAHAAN Mgt_Own Int_Own Forn_Own TOBINQ PBV ROA ROE IECHC1. PT MEDCO ENEGY TBK 0 2,48 2 3,68 41,6 799,1 17,9 0,0652. PT MODERN INTERNASIONAL TBK 0 41,1 21,3 0,82 75 150,9 285 0,0183 PT MNC KAPITAL INDONESIA TBK 0 31,24 11,91 1,44 6,97 78,82 18,91 0,072
4PT BAKRIE SUMATERA PLANTATIONS TK 0,44 0 0 2,03 16,82 45,59 19,47 0,016
5 PT DUTA PERTIWI TBK 0 2,91 58,33 0,24 33,9 42,3 13,6 0,0346 PT AKR CORPORINDO TBK 86,03 0 0 4,36 10,8 38,4 11,5 0,0277 PT SUPRA BOGA LESTARI TBK 0 27,2 29,74 0,71 20,5 32,8 29,8 0,0678 PT MODERN INTERNASIONAL TBK 0 36,91 29,75 1,9 18,8 32,6 54,1 0,0279 PT KABLE FARMA TBK 0 4,28 79,83 0,99 21,9 31,9 11,9 0,00210 PT LAUTAN LUAS TBK 0 0 63,49 0,48 31,4 31,5 48 0,002
xxiv
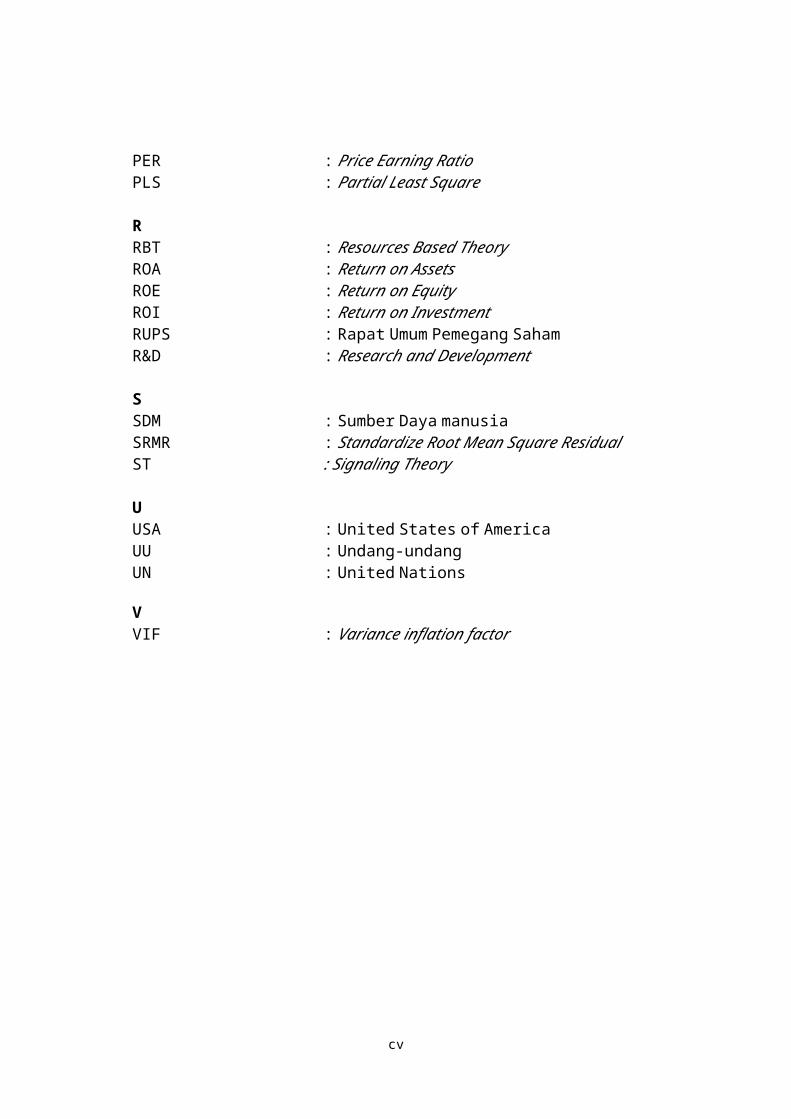
11 PT FORTUNE INDONESIA TBK 0 10,9 31,75 0,41 13 30,8 37,1 0,019
12PT CHAMPION PASIFIC INDOENESIA TBK 0 89,69 0 0,86 9,7 29,5 3,7 0,009
13PT BANK RAKYAT INDONESIA TBK 0 76,87 0 3,14 15,9 28,8 11,4 0,306
14 PT ASTRA GRAPHIA TBK 0 76,87 0 1,37 14,4 28,4 9,2 0,138
15PT ADIRA DINAMIKA MULTI FINANCE TBK 0 95 0 1,58 5,5 28,3 21,2 0,119
16 PT MNC KAPITAL INDONESIA TBK 0 0 0 1,98 3,4 26,9 40,7 0,09917 PT BANK CAPITAL INDONESIA
TBK 0 56,72 39,48 3,23 16,1 26,7 16,5 0,08320 PT. ADHI KARYA 0 38,6 10,3 0,48 4,2 26,4 4,2 0,021
DATA PERUSAHAAN YANG NILAI TOBINQ TERTINGGI
NO NAMA PERUSAHAAN Mgt_Own Int_Own Forn_Own TOBINQ PBV ROA ROE IECHC1. PT MODERNLAND REALTY TBK 0 0 0 9,48 16,9 22,1 12 0,036
2. PT LOGINDO SAMUDRAMAKMUR TBK 0 5,4 79,42 8,56 15,7 20,8 7,4 0,109
3.PT BANK PEMBANGUNAN DAERAH JAWA TIMUR TBK 9,75 44,12 0 7,24 1,86 6,05 3,93 0,034
4. PT KIMIA FARMA TBK 11,805 7,61 5,54 6,08 4 17,6 4,9 0,004
5.PT CHAMPION PASIFIC INDOENESIA TBK 0 26,25 0 5,69 10,2 16,8 8,4 0,055
6. PT BANK MANDIRI (Persero) TBK 0 48,09 0 5,57 1,02 12,8 10,17 0,055
7.PT BANK INTERNASIONAL INDONESIA TBK 0 48,09 0 5,57 1,02 12,8 10,17 0,052
xxv

8. PT BUMI CITRA PERMAI TBK 0 81,32 0 5,44 3,23 18,25 5,16 0,0679. PT BANK NEGARA INDONESIA TBK 0 95 0 4,87 2,4 15,25 8,24 0,175
10. PT AKR CORPORINDO TBK 86,03 0 0 4,36 10,8 38,4 11,5 0,027
11.PT MULTISTRADA ARAH SARANA TBK 0 56,71 0 4,29 3,8 10,6 13,2 0,089
12. PT APEXINDO PRATAMA DUTA TBK 0 0 0 4,25 6,4 17,8 6,9 0,07513. PT BANK NEGARA INDONESIA TBK 0,152 0 0 4,03 8 13,1 5,2 4,00514. PT SOLUSI TUNAS PRATAMA TBK 0 59 30 3,9 7,9 15,1 23,5 0,006
15.PT MULTISTRADA ARAH SARANA TBK 0 0 0 3,8 15,02 18,81 11,5 0,141
16. PT MNC KAPITAL INDONESIA TBK 65,11 0 26 3,74 3,3 5,8 2,9 0,00517. PT MEDCO ENEGY TBK 0 2,48 2 3,68 41,6 799,1 17,9 0,065
xxvi

27
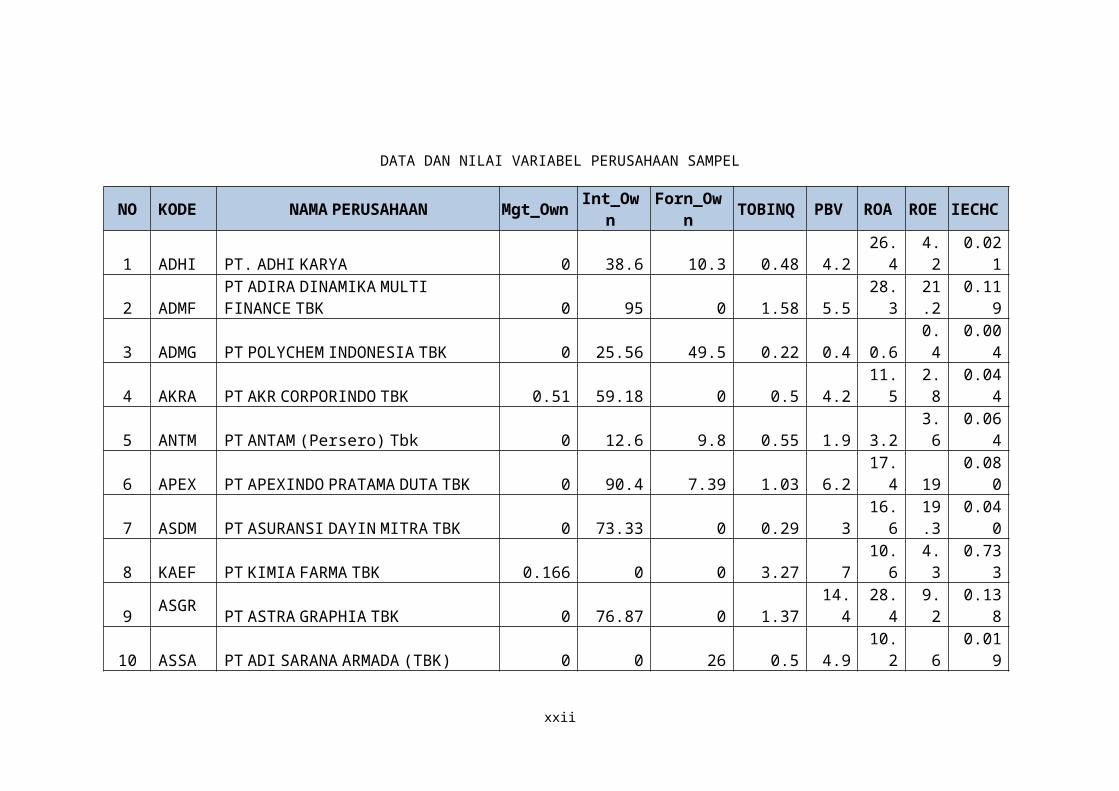
28
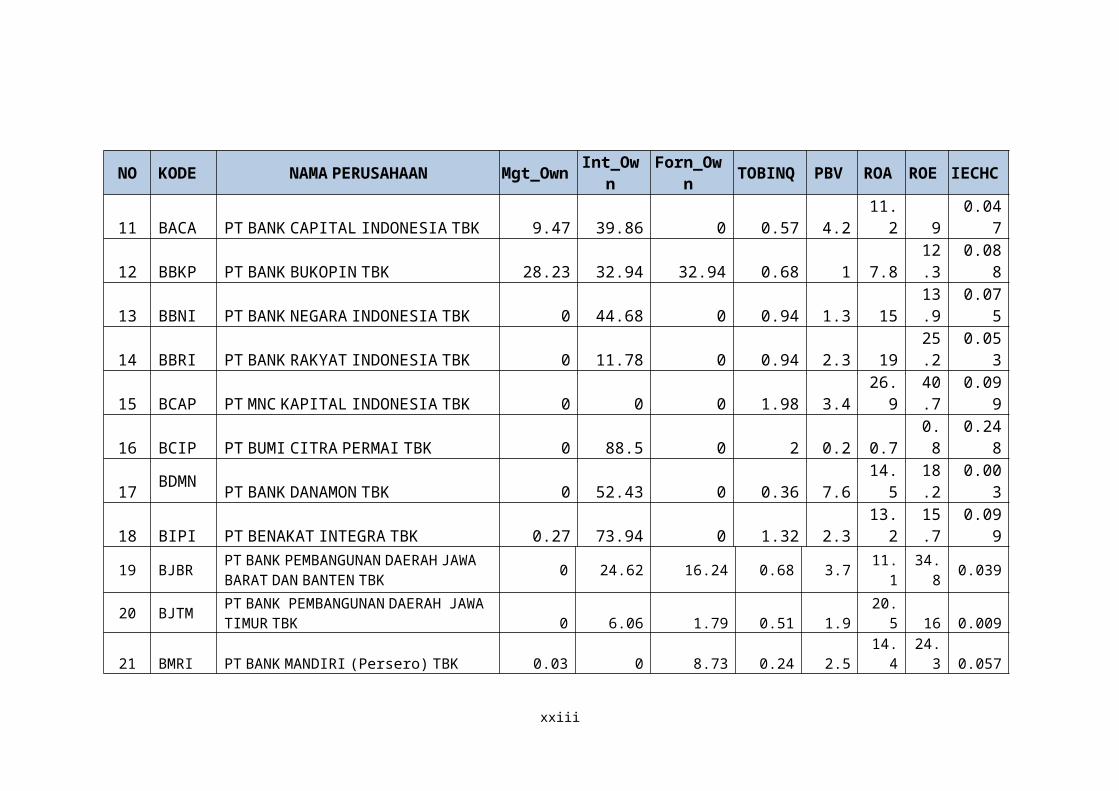
NO KODE NAMA PERUSAHAAN1 ADHI PT. ADHI KARYA2 ADMF PT ADIRA DINAMIKA MULTI FINANCE TBK3 ADMG PT POLYCHEM INDONESIA TBK4 AKRA PT AKR CORPORINDO TBK5 ANTM PT ANTAM (Persero) Tbk6 APEX PT APEXINDO PRATAMA DUTA TBK7 ASDM PT ASURANSI DAYIN MITRA TBK8 KAEF PT KIMIA FARMA TBK9 ASGR PT ASTRA GRAPHIA TBK10 ASSA PT ADI SARANA ARMADA (TBK) 11 BACA PT BANK CAPITAL INDONESIA TBK12 BBKP PT BANK BUKOPIN TBK13 BBNI PT BANK NEGARA INDONESIA TBK14 BBRI PT BANK RAKYAT INDONESIA TBK15 BCAP PT MNC KAPITAL INDONESIA TBK16 BCIP PT BUMI CITRA PERMAI TBK17 BDMN PT BANK DANAMON TBK18 BIPI PT BENAKAT INTEGRA TBK19 BJBR PT BPD JAWA BARAT DAN BANTEN TBK20 BJTM PT BANK PEMBANGUNAN DAERAH JAWA TIMUR TBK21 BMRI PT BANK MANDIRI (Persero) TBK22 BNII PT BANK INTERNASIONAL INDONESIA TBK23 BRAM PT INDO KORDSA TBK24 BSDE PT BUMI SERPONG DAMAI TBK25 BSIM PT BANK SINARMAS TBK26 BVIC PT BANK VICTORIA INTERNASIONAL TBK27 BWPT PT BW PLANTATION TBK28 DVLA PT DARYA - VARTA LABORATORIA TBK29 DLTA PT DELTA DJAKARTA TBK30 DUTI PT DUTA PERTIWI TBK 31 ELSA PT ELNUSA TBK32 CTRA PT CIPUTRA DEVELOPMENT TBK33 ENRG ENERGI MEGA PERSADA TBK34 FORU PT FORTUNE INDONESIA TBK 35 GIAA PT GARUDA INDONESIA PERSERO TBK
29
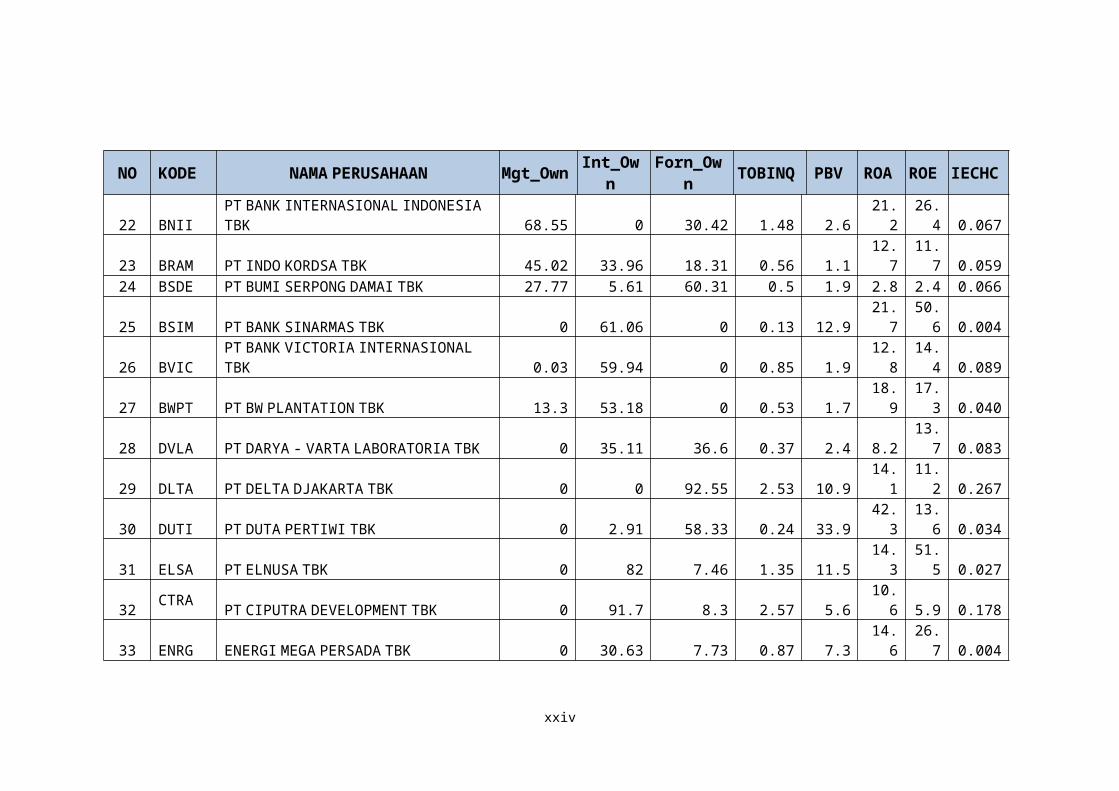
36 GJTL PT GAJAH TUNGGAL TBK
30
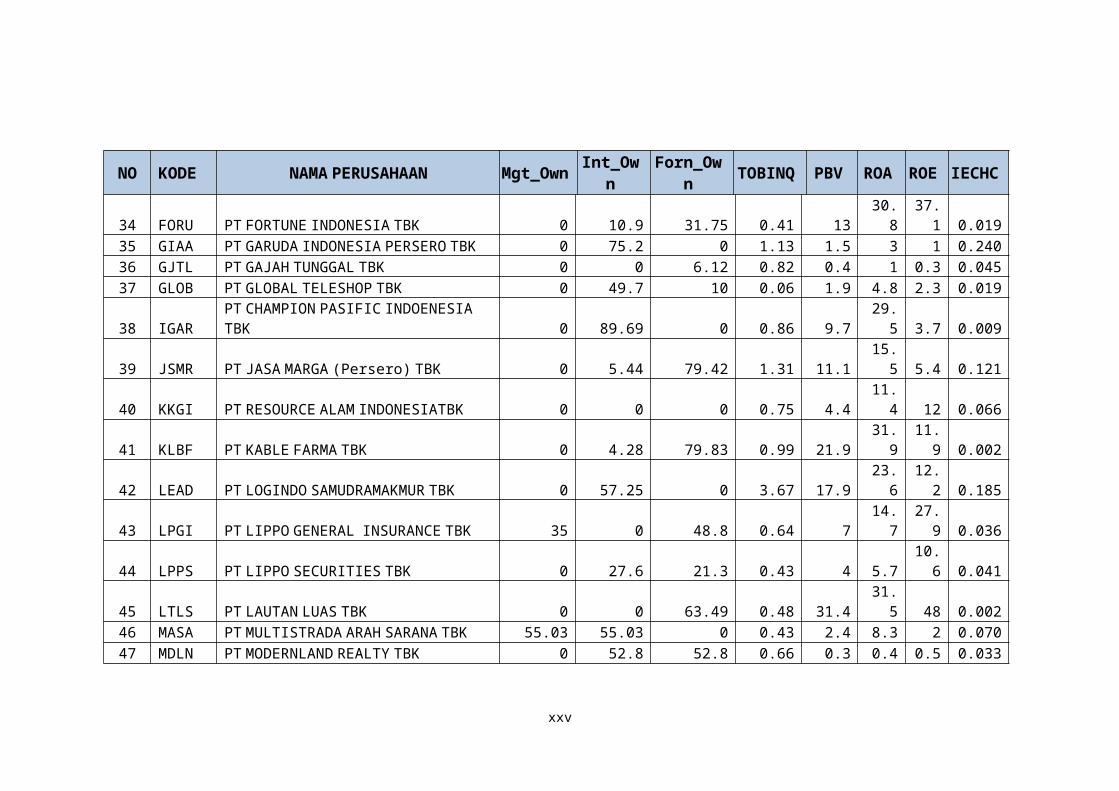
37 GLOB PT GLOBAL TELESHOP TBK38 IGAR PT CHAMPION PASIFIC INDOENESIA TBK39 JSMR PT JASA MARGA (Persero) TBK40 KKGI PT RESOURCE ALAM INDONESIATBK41 KLBF PT KABLE FARMA TBK 42 LEAD PT LOGINDO SAMUDRAMAKMUR TBK43 LPGI PT LIPPO GENERAL INSURANCE TBK44 LPPS PT LIPPO SECURITIES TBK45 LTLS PT LAUTAN LUAS TBK46 MASA PT MULTISTRADA ARAH SARANA TBK47 MDLN PT MODERNLAND REALTY TBK48 MDRN PT MODERN INTERNASIONAL TBK49 MEDC PT MEDCO ENEGY TBK50 META PT NUSANTARA INFRASTURCTURE TBK51 MICE PT MULTI INDOCITRA TBK52 MREI PT MASKAPAI REASURANSI INDONESIA TBK53 MTDL PT METRODATA ELEKTRONIK TBK54 MTLA PT METROPOLITAN LAND TBK55 OKAS PT ANCORA INDONESIA RESOURCES TBK56 PTSN PT SAT NUSAPERSADA TBK57 RANC PT SUPRA BOGA LESTARI TBK58 SGRO PT SAMPOERNA AGRO TBK59 SIPD PT SIERAD PRODUCE TBK60 SMBR PT SEMEN BATURAJA PERSERO TBK61 SMGR PT SEMEN INDONESIA (PERSERO) TBK62 SRIL PT SRI REJEKI ISMAN Tbk 63 SSMS PT SAWIT SUMBERMAS SARANA TBK64 SUPR PT SOLUSI TUNAS PRATAMA TBK65 TMAS PT PELAYARAN TEMPURAN EMAS TBK66 TMPO PT TEMPO INTI MEDIA TBK67 TOTL PT TOTAL BANGUN PERSADA TBK68 TOTO PT SURYA TOTO INDONESIATBK69 TRIO PT TRIKOMSEL OKE TBK70 UNSP PT BAKRIE SUMATERA PLANTATIONS TK
31